1. Introduction
The seismic fault zones in China are highly developed. With the rapid advancement of transportation infrastructure in the western regions, an increasing number of tunnels are being constructed to traverse active fault zones. It has become a consensus within the industry that fault dislocation and seismic ground motion are the primary causes of damage to tunnels crossing active fault areas [
1,
2,
3]. In recent years, to mitigate the damage caused by fault dislocation and seismic ground motion to tunnels, various preventive measures have been studied. These include reinforcing the surrounding rock, implementing over-excavation designs, employing hinged designs, installing shock-absorbing layers and seismic joints, utilizing flexible joints, and strengthening the lining [
4,
5,
6,
7,
8,
9,
10,
11,
12,
13]. In current tunnel support structures designed to traverse active fault zones, flexible isolation is often incorporated in the cross-sectional design, forming a three-layer support system composed of “initial support, shock-absorbing layer, and secondary lining”. This system serves as a defensive mechanism against dislocation and seismic impacts [
10,
14,
15,
16].
Shock-absorbing layers primarily utilize materials such as rubber and foamed concrete. Studies by Hostetter et al. [
17,
18,
19,
20,
21] have found that rubber and foamed concrete, due to their lightweight, high-strength, and energy-absorbing properties, can enhance the deformation capacity of tunnel structures and reduce their vibrational response, thereby ensuring structural safety. Some scholars [
22,
23,
24] have carried out related studies; for example, Eltayeb et al. investigated the effect of using lightweight foam rubber concrete as a filling material for double-layer profiled composite panels under pure shear loads through experimental and analytical modeling. To further improve the mechanical performance and adaptability of lining structures to dislocation deformation, some scholars [
25,
26,
27] have introduced high-toughness fiber-reinforced cementitious composites (Engineered Fiber Reinforced Cementitious Composites, ECCs) as secondary lining materials for tunnels. ECC is a type of engineered cementitious composite [
28,
29] known for its high ductility and tensile strength. Research by An et al. [
30] demonstrated that, compared to traditional plain concrete lining structures, the use of fiber-reinforced concrete as a secondary lining can reduce vertical displacement by more than 0.9%, decrease lateral displacement by more than 0.39%, and increase the minimum safety factor by over 32%. Ding et al. [
26] conducted model tests showing that the load-bearing capacity and ductility ratio of ECC as a secondary lining are 33.6% and 16.4% higher, respectively, than those of conventional linings.
Regarding the interfacial mechanical behavior between the shock-absorbing layer and the lining concrete, Zhao Kun et al. [
31] conducted direct shear tests on specimens to investigate the failure characteristics of the shock-absorbing layer–lining interface under compression-shear conditions. Their findings revealed that the density of foamed concrete and the normal stress have a mutual influence on the peak shear strength and shear stiffness. Cui et al. [
32] conducted experimental studies on the placement of shock-absorbing layers between the initial support and secondary lining, as well as between the surrounding rock and the initial support. Their research demonstrated that the crack resistance of the lining is optimal when shock-absorbing layers are placed between the surrounding rock and the initial support, as well as between the initial support and the secondary lining.
The aforementioned research indicates that there is currently a lack of studies on the interlayer mechanical behavior of multi-layer supporting structures, resulting in unclear interfacial mechanical behavior and characteristics between C30 concrete and foam concrete, as well as ECC and foam concrete. Based on this, this paper conducted shear tests on PC specimens and PE specimens, which can provide a reference for the study of multi-layer supporting structures in tunnels.
Firstly, uniaxial compressive tests on foam concrete, ECC, and C30 concrete were carried out, and on this basis, two composite samples were designed to carry out the interfacial shear tests of PC specimens and PE specimens. Based on the parameters of strength, modulus, energy, and displacement, the shear mechanical behavior and failure characteristics of the PC interface and the PE interface were analyzed. Finally, the formulas of the maximum shear strength of PC specimens and PE specimens were established.
2. Experimental Scheme
2.1. Specimen Design
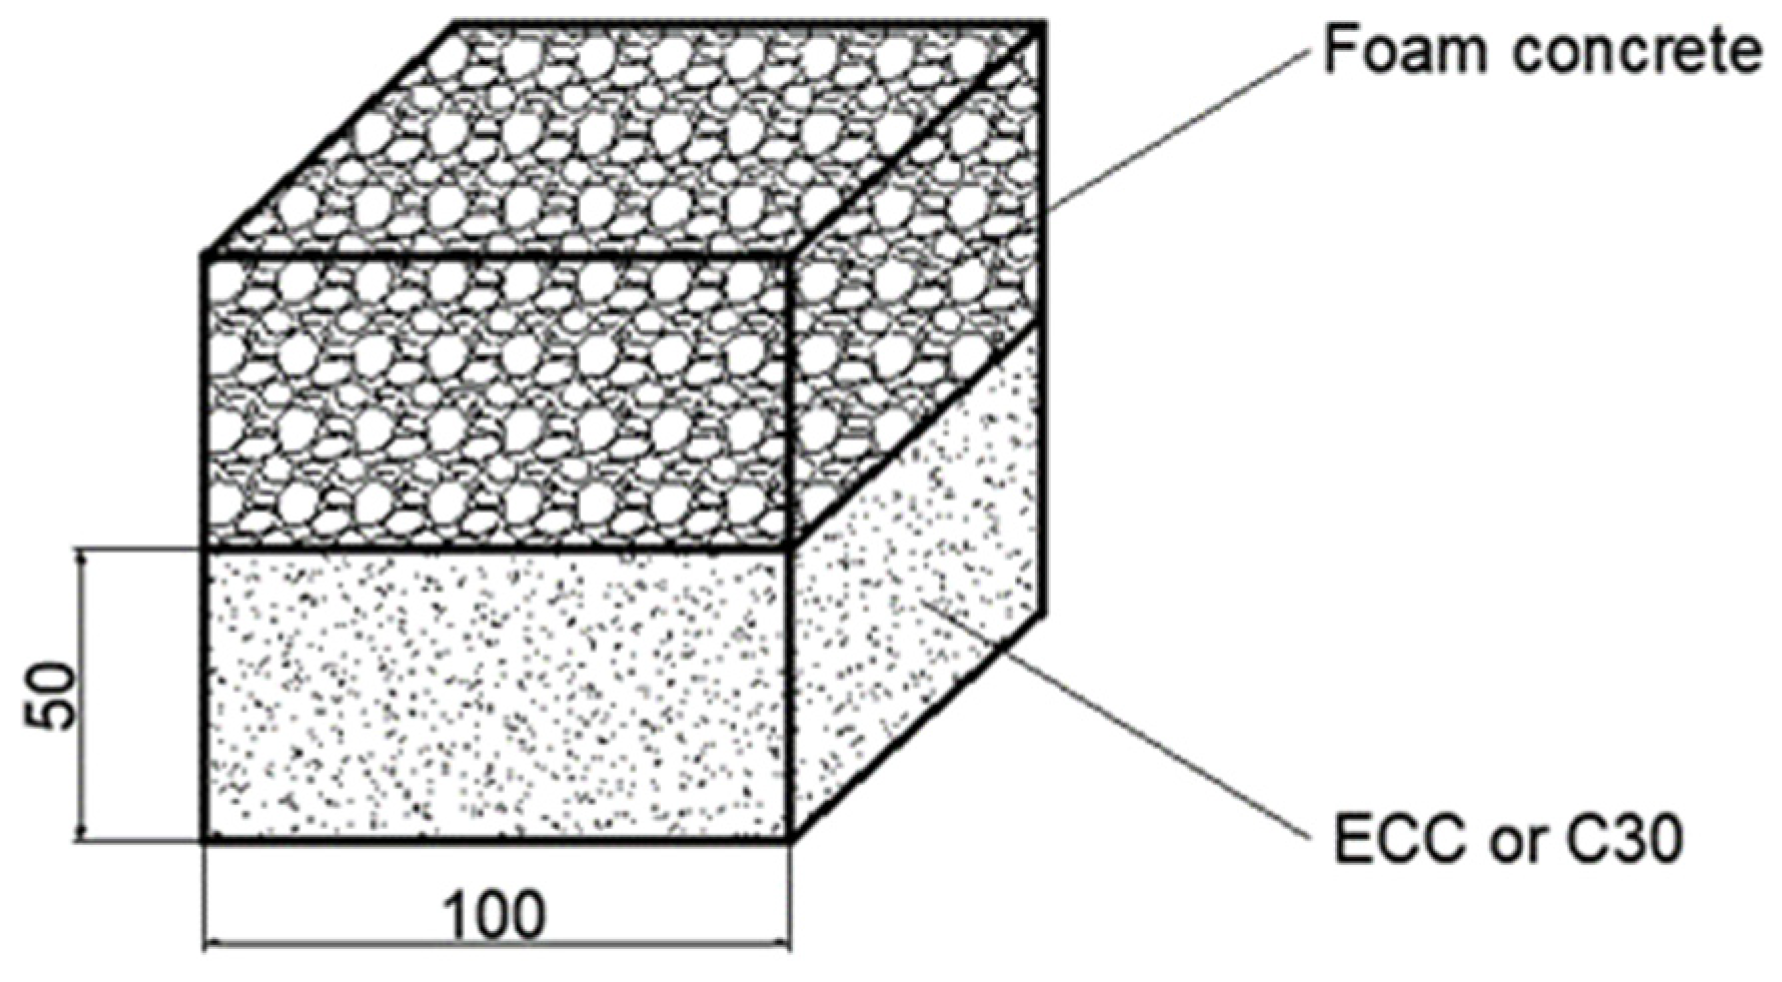
For the interfacial shear tests, two types of composite specimens were designed: foamed concrete with C30 ordinary concrete (referred to as PC specimens) and foamed concrete with ECC (referred to as PE specimens). Each specimen type was tested under seven normal stress conditions (0 MPa, 0.1 MPa, 0.2 MPa, 0.5 MPa, 0.8 MPa, 1.0 MPa, and 2.0 MPa), resulting in a total of 14 test conditions. For each normal stress condition, three parallel specimens were prepared, leading to a total of 42 composite specimens tested for interfacial shear behavior. The dimensions and interface configuration of the composite specimens are shown in
Figure 1. The specimens were designed as 100 mm × 100 mm × 100 mm cubes, consisting of two layers: the upper layer was made of foamed concrete as the shock-absorbing layer, and the lower layer was made of either C30 concrete or ECC.
For the uniaxial compression tests, 100 mm × 100 mm × 100 mm cubic specimens were used. Uniaxial compression tests were conducted on three types of materials: C30 ordinary concrete, foamed concrete, and ECC. For each material, three parallel specimens were prepared.
2.2. Test Materials and Mix Ratios
For the interfacial shear tests, the existing concrete used was C30 ordinary concrete. The C30 ordinary concrete was prepared using P.O 42.5 grade ordinary Portland cement, Grade I fly ash, and a water–cement ratio of 0.66. The fine aggregate consisted of 80% machine-made sand mixed with 20% mountain sand, with a fineness modulus of 2.9. The coarse aggregate was composed of 90% crushed stone and 10% melon seed stone, with a maximum particle size of 31.5 mm. A polycarboxylate-based high-performance water reducer was used as the admixture.
The ECCs (Engineered Cementitious Composites) were prepared using P.O 42.5 grade ordinary Portland cement, Grade I fly ash, and silica fume (SF) produced by Yunnan Jianbiao New Materials Technology Co., Ltd., with a SiO2 content of 94%. The fine aggregate was standard quartz sand with a particle size ranging from 0.2 to 0.4 mm and a fineness modulus of approximately 2.9. Polyvinyl alcohol (PVA) fibers, type K-II, produced by Kuraray Co., Ltd., Japan, were used as the reinforcing fibers. A polycarboxylate-based high-performance water reducer was also added.
The foamed concrete was prepared using P.O 42.5 grade ordinary Portland cement, expanded perlite for thermal insulation with a particle size of 1–3 mm, an organic silicone waterproofing agent, Angudun concrete antifreeze and early-strength agent, a polycarboxylate-based high-performance water reducer, and FSA-AF liquid accelerator (alkali-free type). The same K-II type PVA fibers from Kuraray Co., Ltd., Japan, were used as reinforcement.
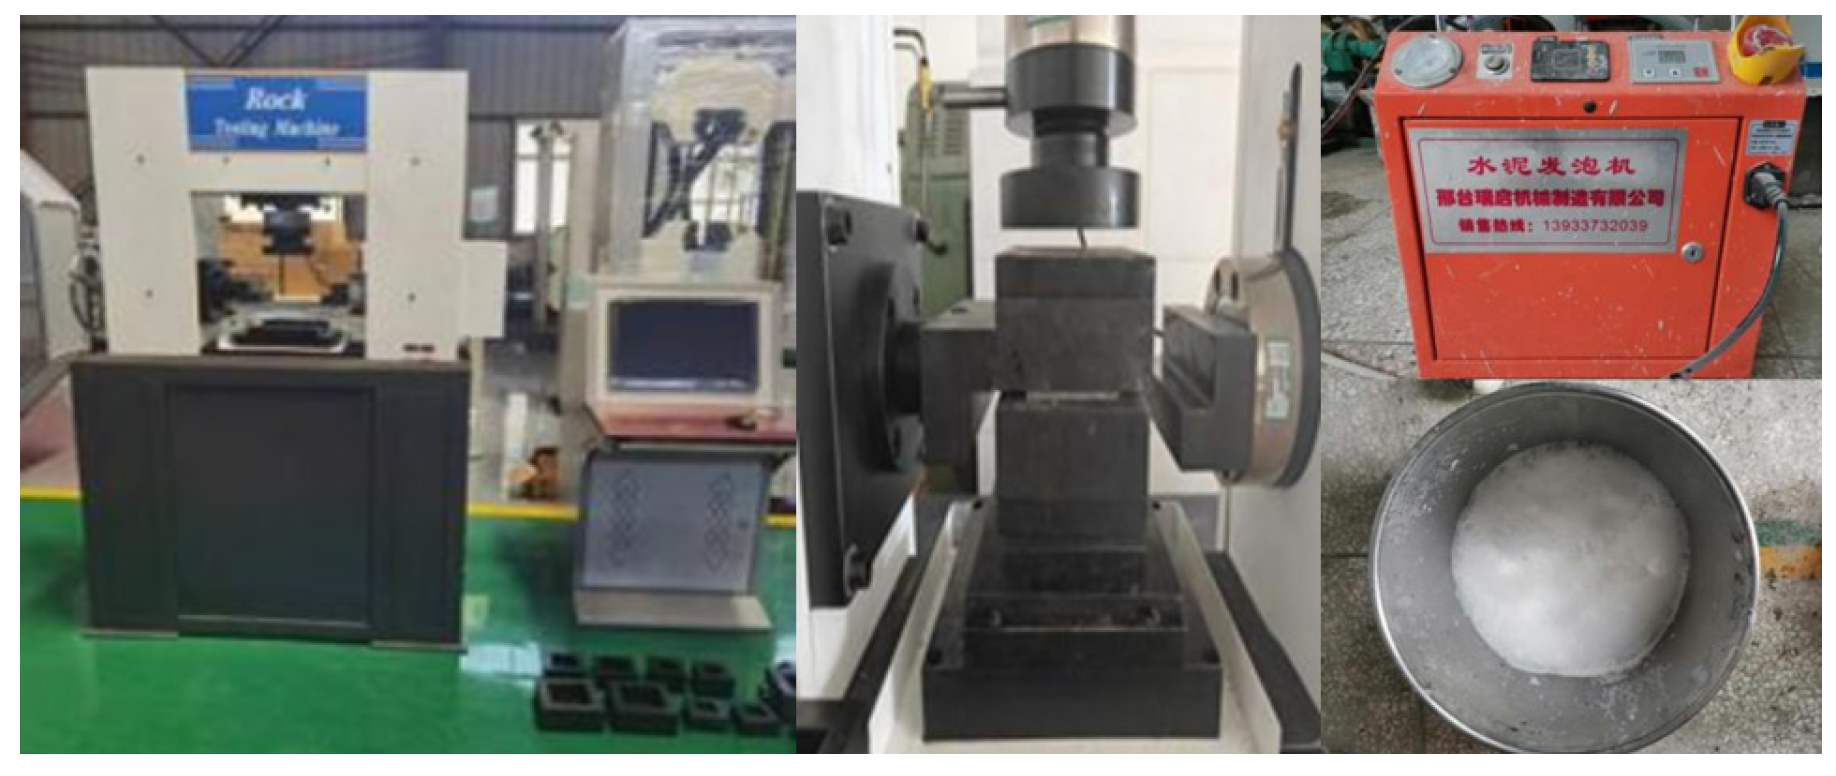
For the interfacial shear tests, an YSW-600Y microcomputer-controlled electro-hydraulic servo testing machine was used to perform direct shear tests on the cast concrete specimens, as shown in
Figure 2. During the test, the data collected involved covered three areas: shear force, horizontal preparation pressure, and shear displacement. The measurement of the shear force relies on a 10 kN high-precision force sensor connected to the right indenter, and the display error of the test force is kept within the range of ±0.50%; The shear displacement is equivalent to the distance of the right indenter, and the relative error of the displacement reading does not exceed ±0.50%; the vertical preparation pressure is obtained by a high-precision force transducer of 10 kN.
The C30 concrete mix is shown in
Table 1; the foam concrete mix is shown in
Table 2 and the ECC mix is shown in
Table 3.
2.3. Specimen Preparation
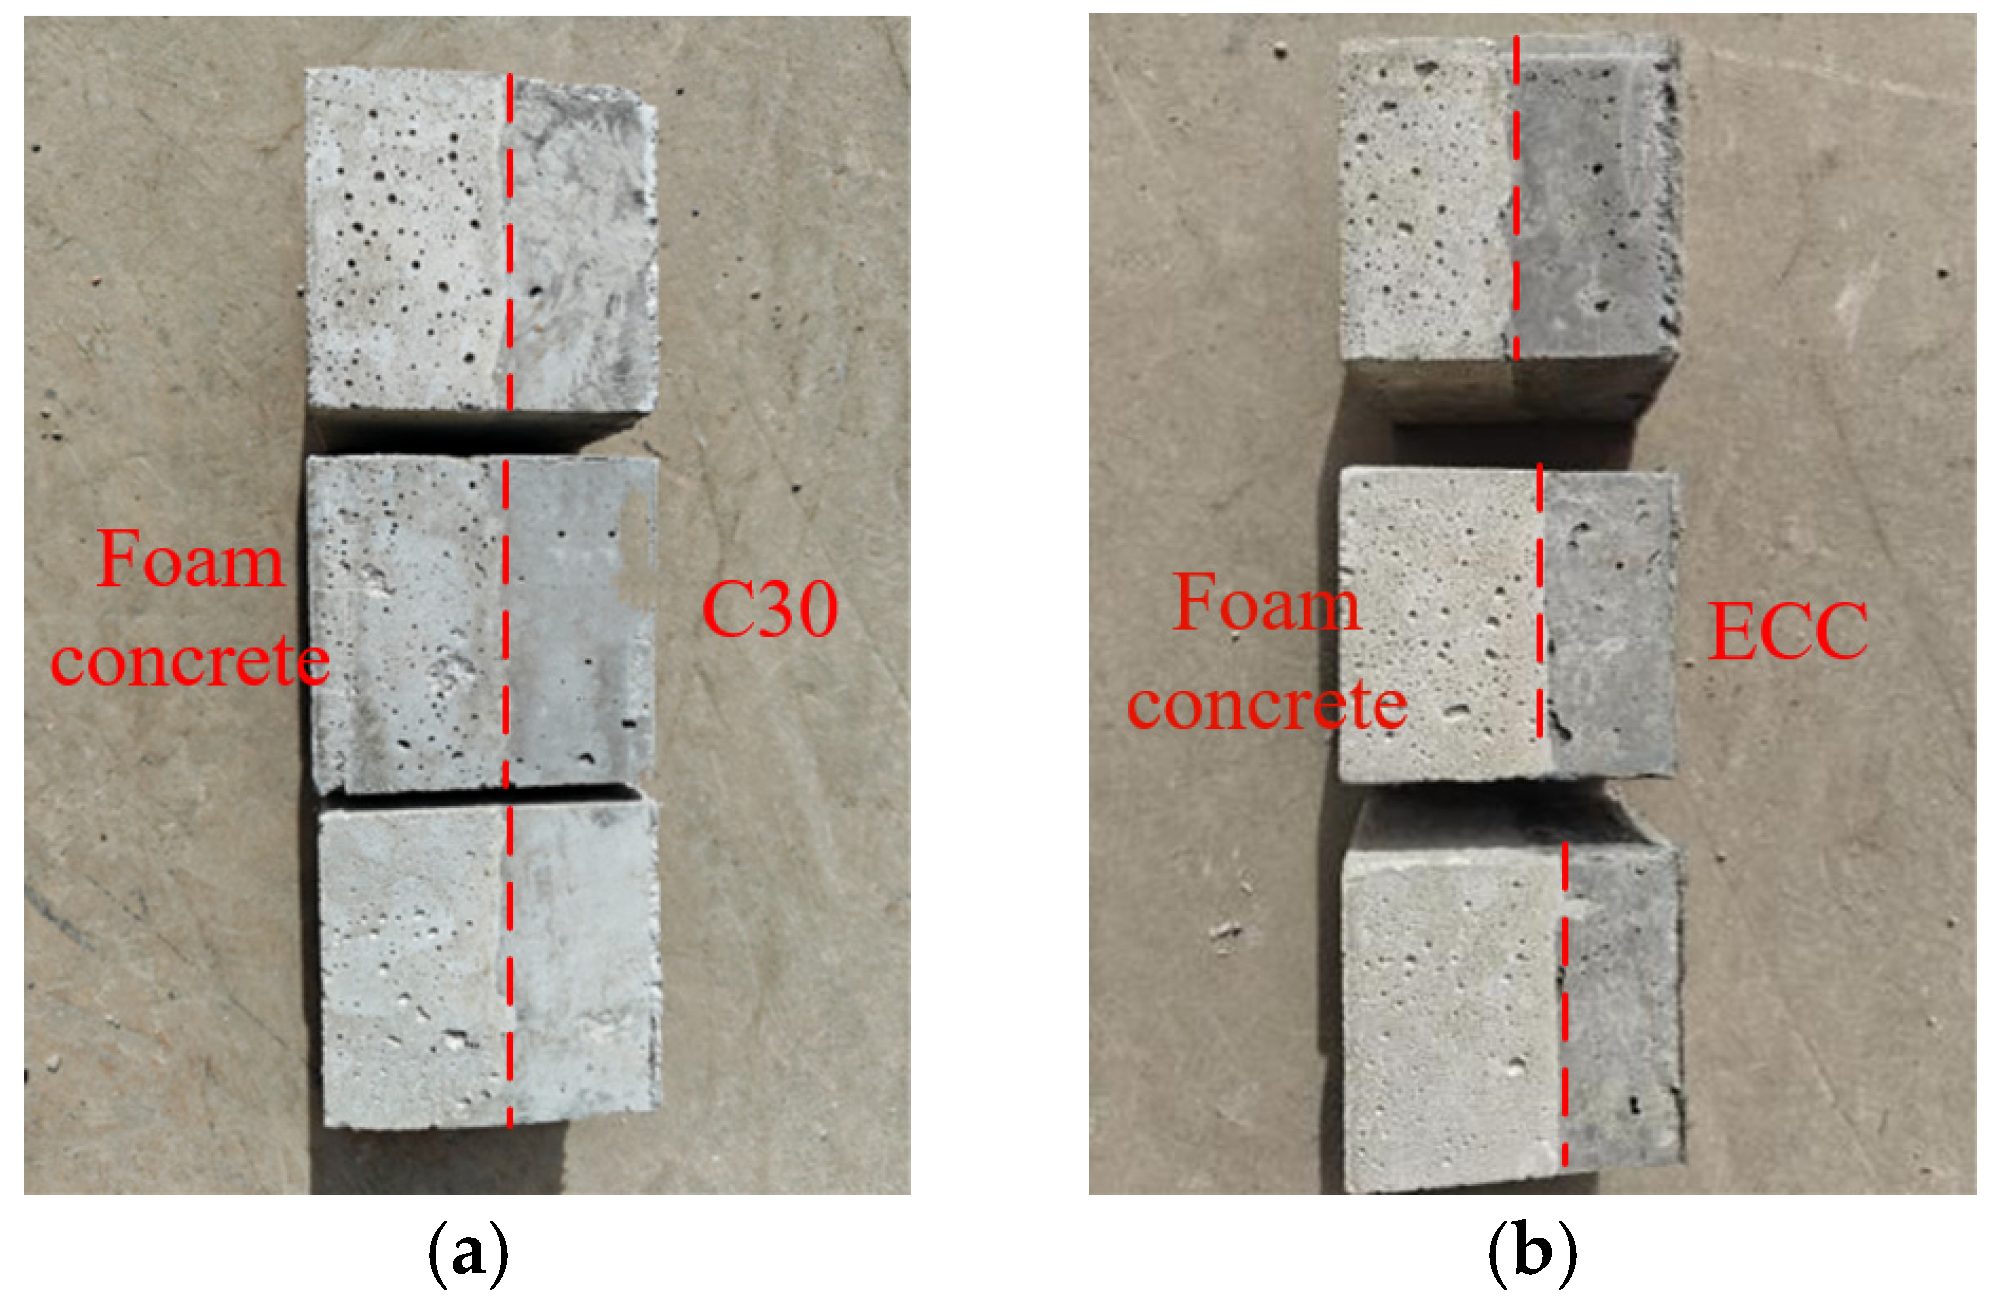
The partially poured specimen is shown in
Figure 3. The preparation and testing process for PC specimens and PE specimens were as follows:
(1) The foaming agent was mixed with water at a ratio of 1:40 to prepare an aqueous solution. Using a cement foaming machine, the solution was transformed into foam, which was then mixed into a slurry composed of cement, expanded perlite, water, and various admixtures. The mixture was poured into molds up to the halfway mark, compacted by vibration, and cured under standard conditions for 28 days before use.
(2) The prepared specimens were immersed in water until the interface was fully saturated. ECC and C30 concrete, mixed using a gravity mixer, were poured into the molds to fill them completely. The specimens were compacted by vibration, and the surfaces were smoothed. After being left at room temperature for 48 h, the specimens were demolded and cured under standard conditions for 28 days to produce PE specimens and PC specimens.
(3) During the testing process, the surfaces of the existing concrete in all specimens were not treated.
Figure 4 shows some of the cast test specimens.
3. Analysis of Interfacial Shear Test Results
3.1. Uniaxial Test Analysis
The concrete test blocks were cast in accordance with the mix ratio, and compressive tests were conducted on the test blocks. It can be seen from the compressive tests that the maximum compressive strength of foam concrete is 3.5 MPa, that of C30 concrete is 35.9 MPa, and that of ECC is 31.8 MPa. When the C30 concrete reaches the maximum compressive strength, brittle splitting failure occurs, and the final fragments are conical. When the foam concrete reaches the maximum compressive strength, vertical cracks appear in the test blocks. When ECC reaches the maximum compressive strength, the test block shows slight oblique cracks but no collapse failure occurs. Compared with C30 concrete, when the ECC test block reaches the maximum compressive strength, the form of the test block is more complete.
3.2. Failure Characteristics of Composite Specimens
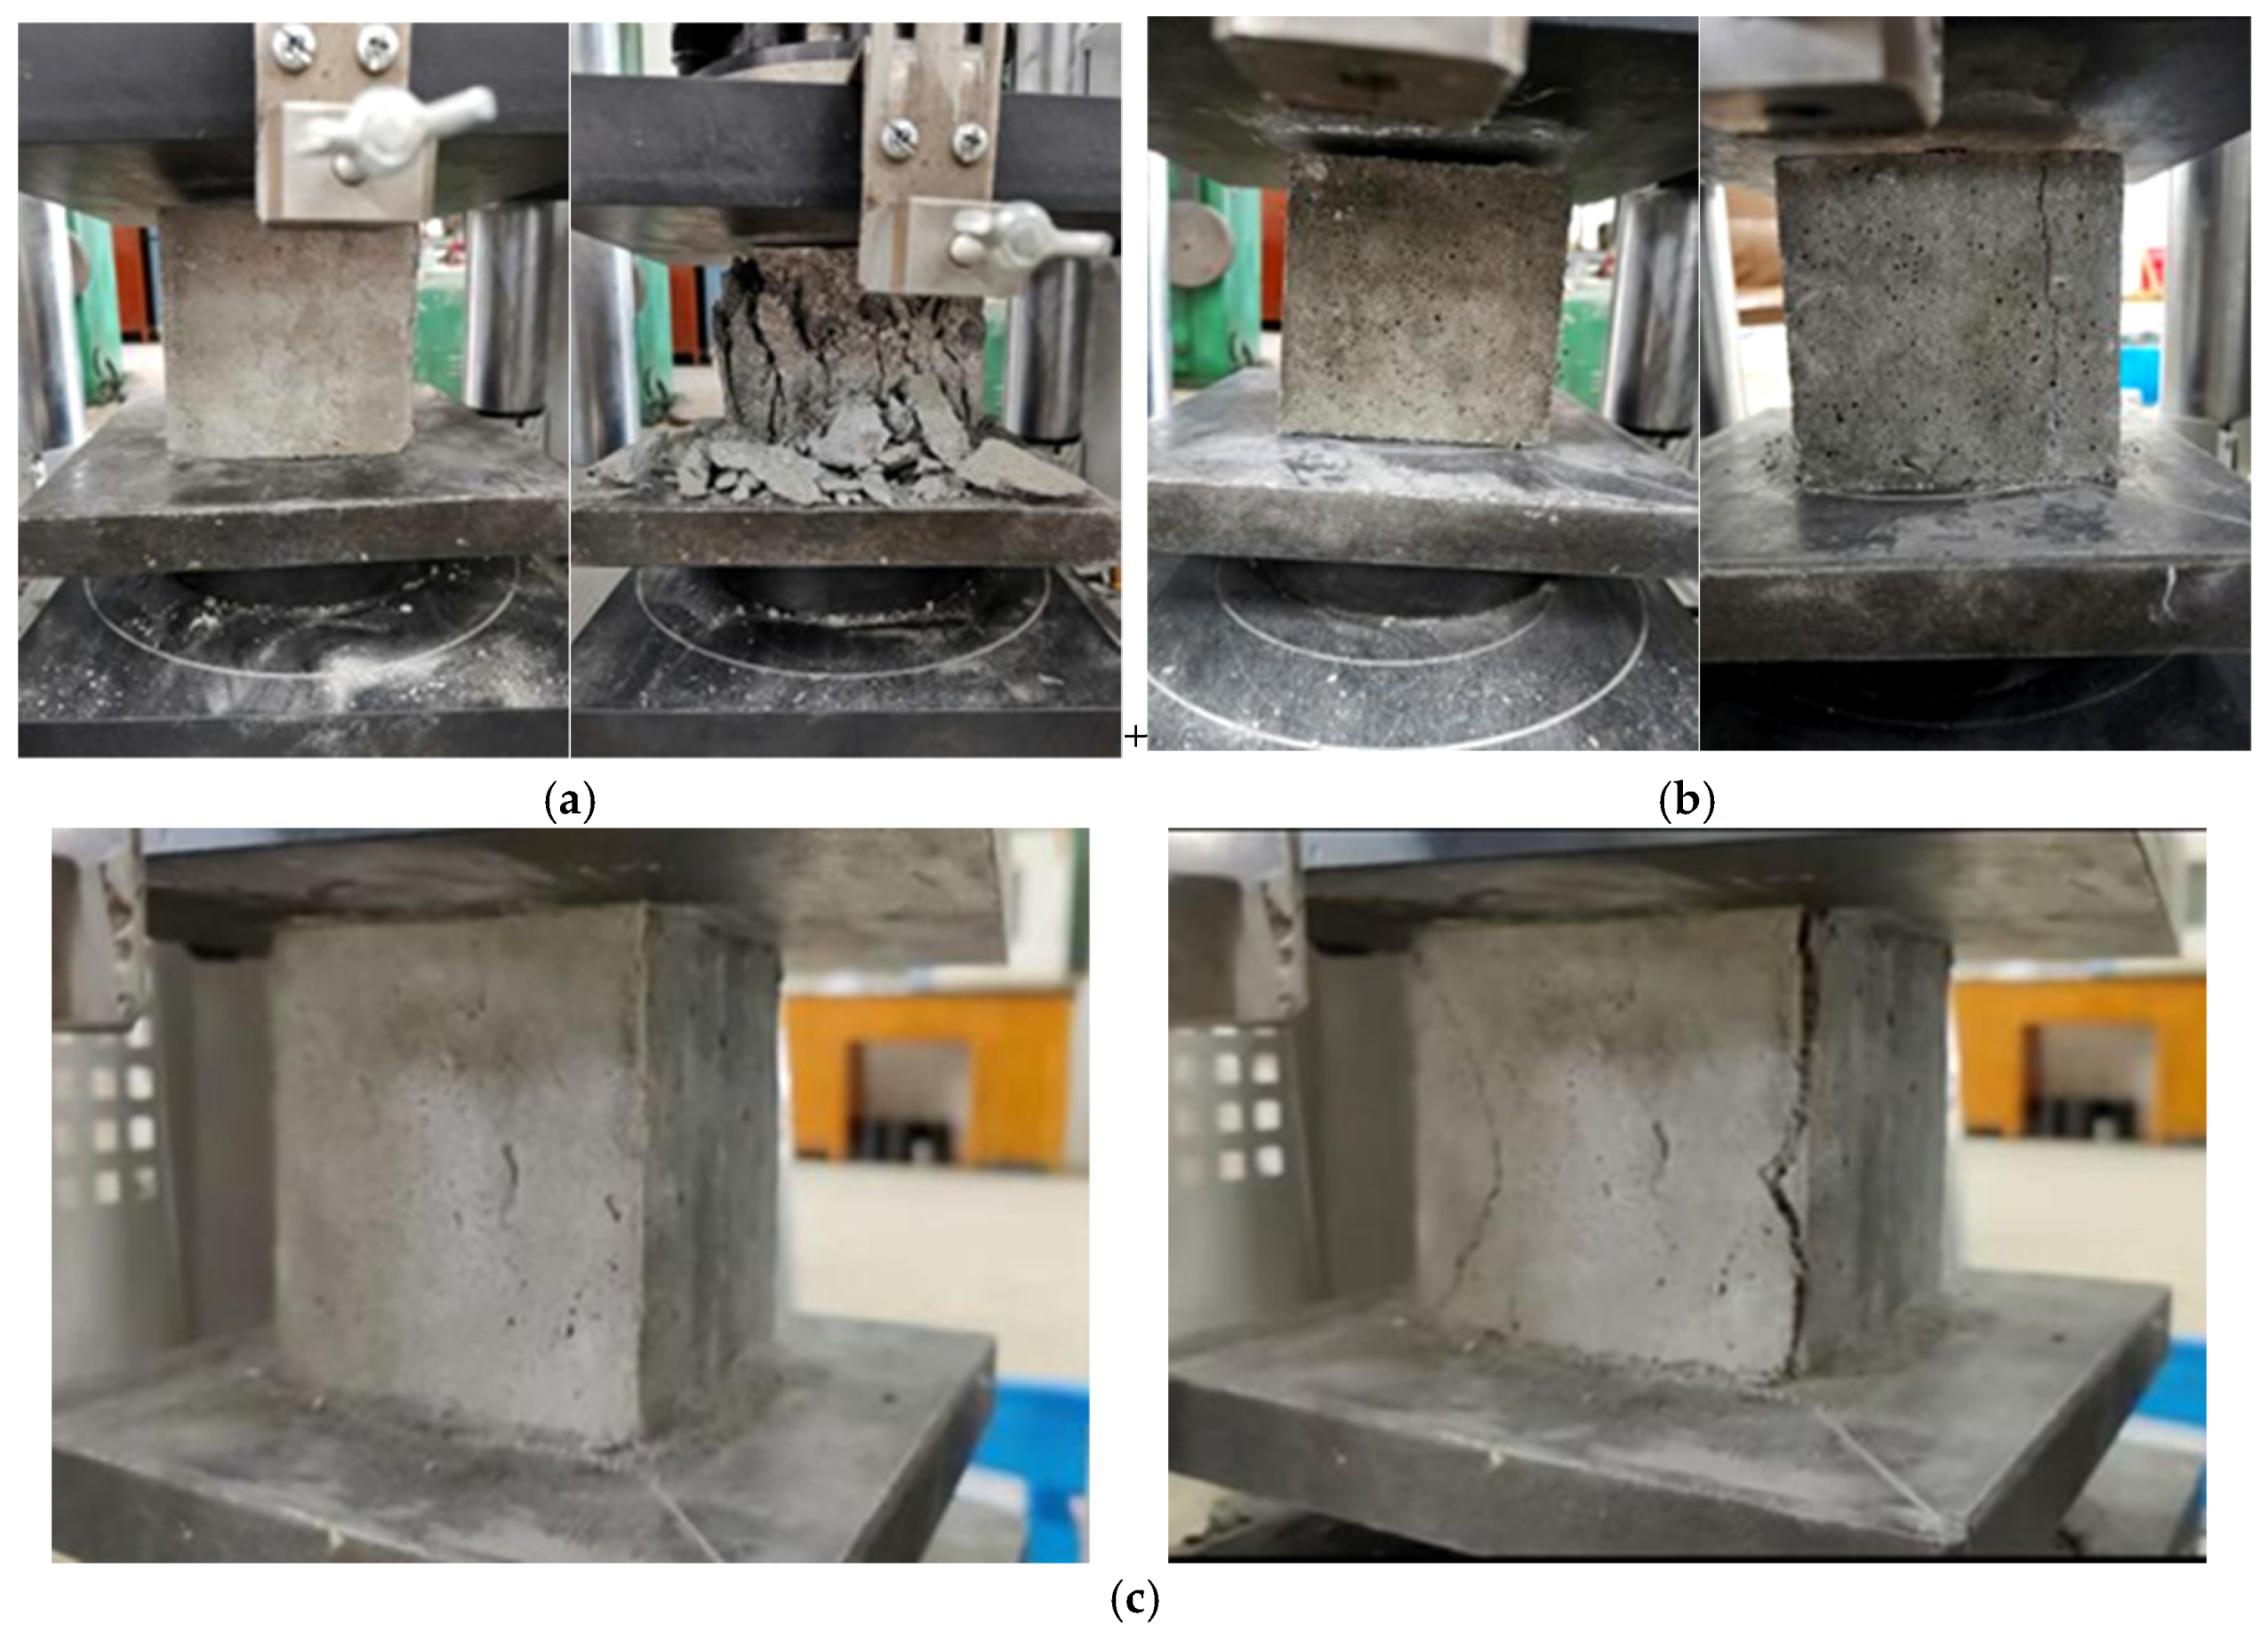
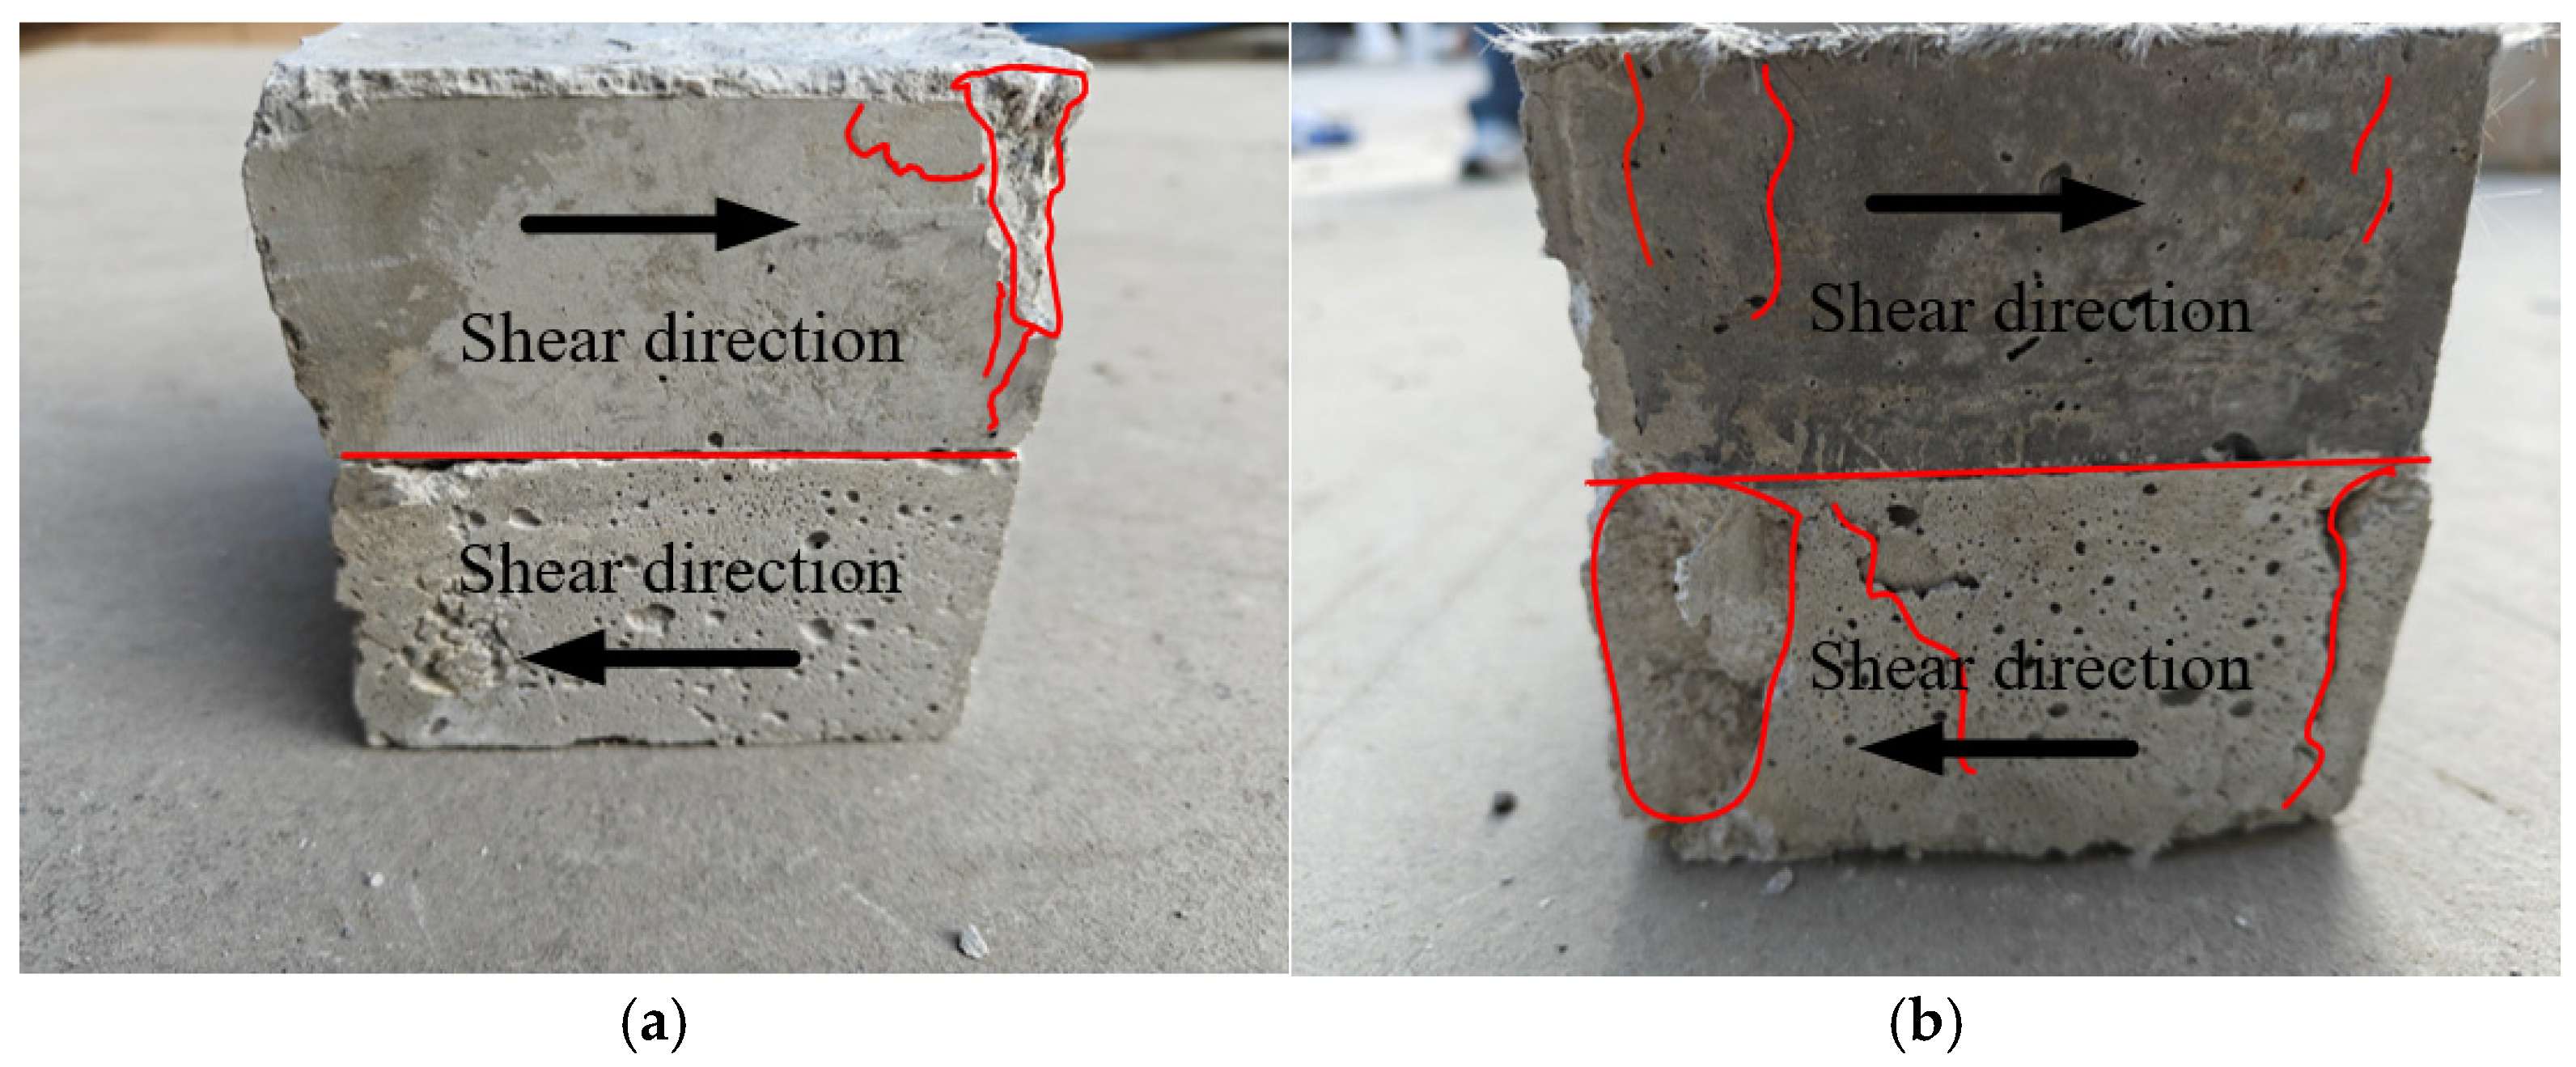
Figure 5 shows the failure characteristics of the composite specimens under compression-shear testing. At the beginning of the test, due to the low compressive strength and uneven pore distribution of the foamed concrete, stress concentration occurred in the specimens under shear stress, leading to partial spalling of the foamed concrete. As the shear stress continued to increase, the effect of stress concentration gradually diminished. At this stage, vertical cracks appeared on the right side of the foamed concrete, accompanied by slight cracking sounds, and the cracks further propagated. Due to the significant difference in compressive strength between the shock-absorbing layer and the secondary lining materials, noticeable cracks and spalling were observed in the foamed concrete at the end of the shear test.
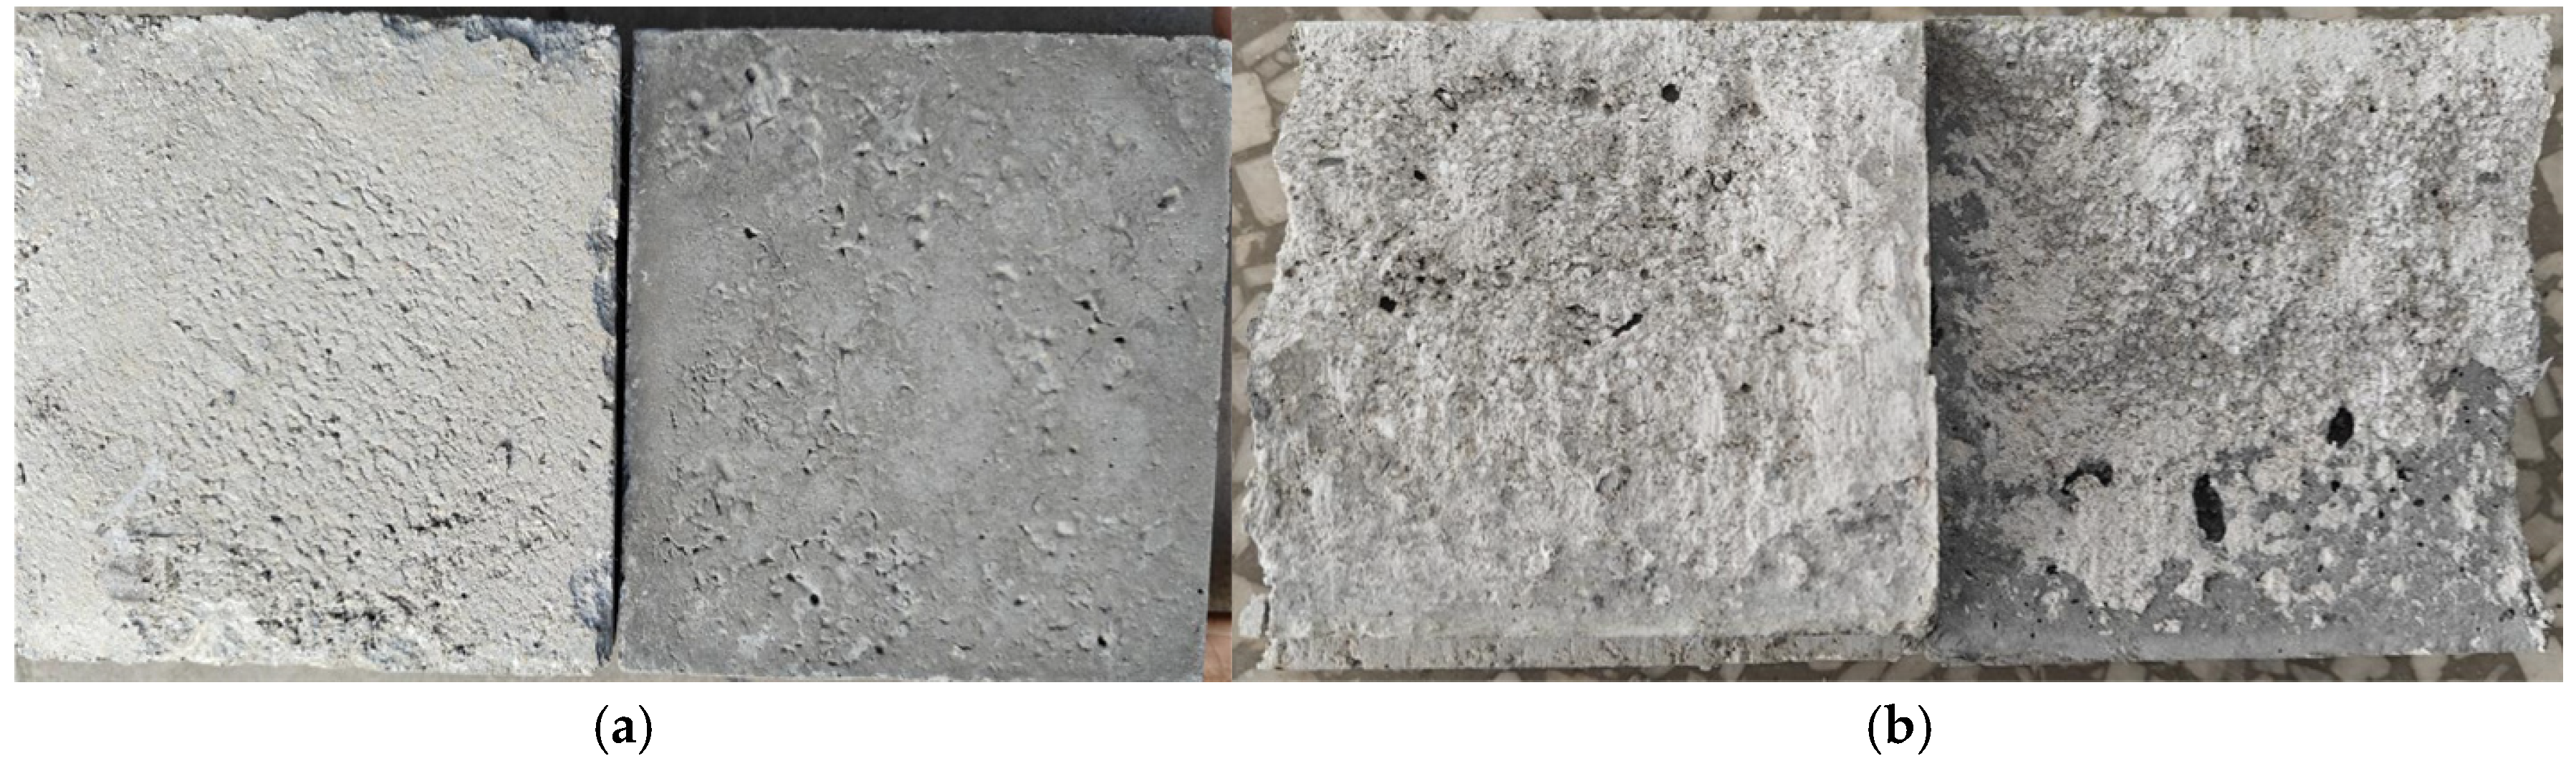
Further analysis of the shear failure modes of the composite specimens revealed two primary failure modes, as illustrated in
Figure 6. The first failure mode is interfacial shear failure, where the interface between the foamed concrete and C30 concrete or ECC is damaged during the compression-shear process. This failure mode is caused by insufficient bonding strength at the interface or uneven distribution of shear stress. When external forces act on the specimen, the bonding strength at the interface fails to resist the shear forces, resulting in delamination or shear fracture between the foamed concrete and the contacting material. This phenomenon not only reduces the overall strength and durability of the material but may also lead to structural instability.
The second failure mode is the failure of the foamed concrete itself, primarily due to its brittleness and porous structure. While the low density and high porosity of foamed concrete provide advantages in certain applications, they also make it more vulnerable under compression-shear loading. During the loading process, structural fractures and pore collapse occur within the foamed concrete. These failures are mainly attributed to the complexity of the internal pore structure, which prevents effective dispersion or absorption of external load energy, leading to localized or overall performance degradation of the specimen.
3.3. Load-Slip Curves
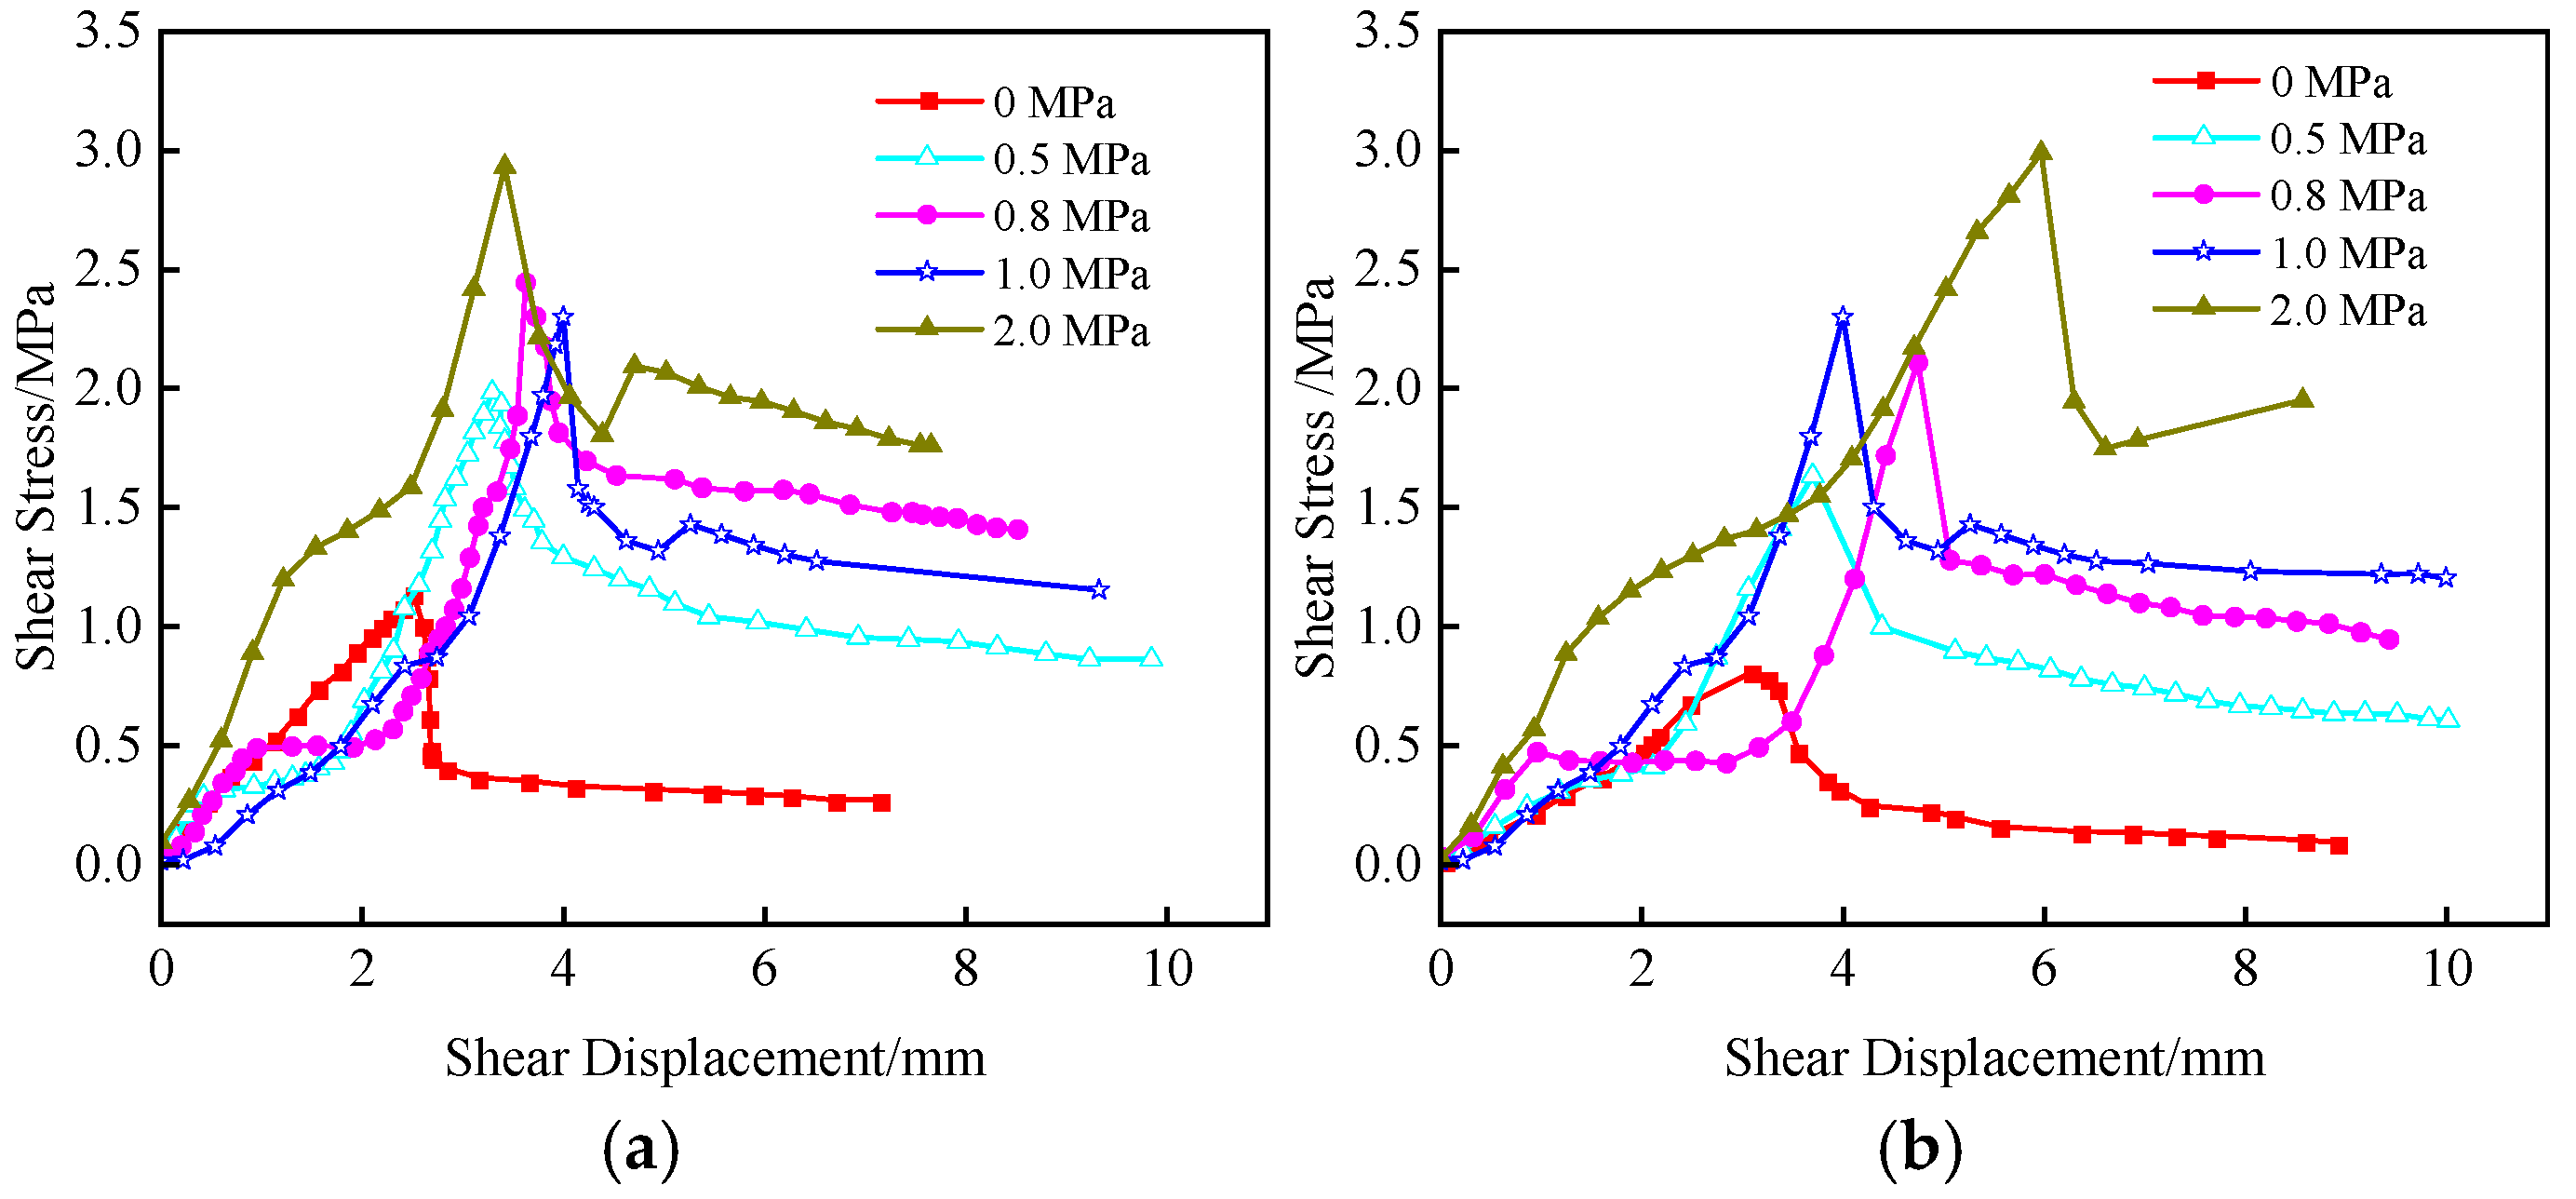
Based on the shear test results, load-slip curves for PC and PE specimens under five typical conditions (0 MPa, 0.5 MPa, 0.8 MPa, 1.0 MPa, and 2.0 MPa) are plotted. This is shown in
Figure 7.
As shown in
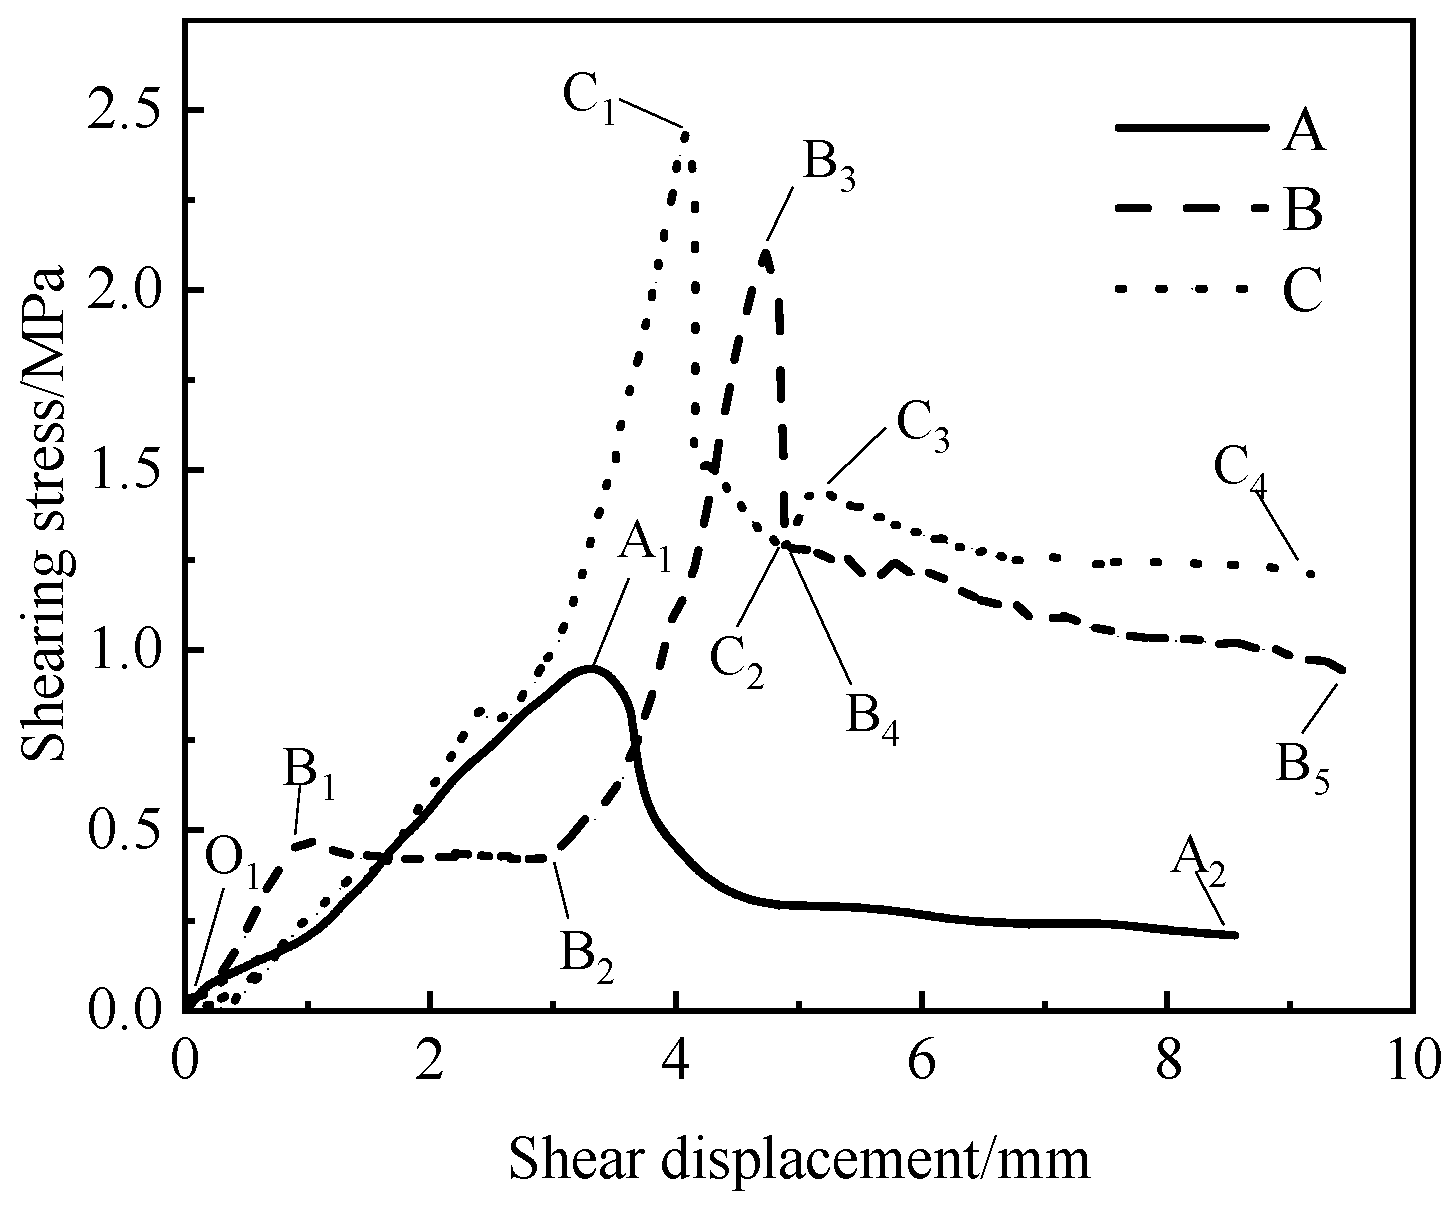
Figure 8, the shapes of the shear stress-shear displacement curves under different working conditions exhibit significant differences. Overall, three typical interfacial shear-slip patterns can be observed, as detailed in
Figure 9.
Type A: The O1A2 segment represents the elastic stage, where the specimen becomes more compact under normal stress, and damage initiates at the interface. The relationship between stress and displacement is linear. After reaching the peak stress at point A2, damage at the interface causes a sharp drop in shear stress, followed by a gradual stabilization, indicating that interfacial slip has occurred.
Type B: In the O1B3 segment, due to the presence of numerous voids in the foamed concrete, the specimen undergoes a compaction process, resulting in a brief plateau in the B1B2 segment. At point B2, the foamed concrete reaches a densified state, and the shear stress gradually increases. In the B3B5 segment, interfacial spalling causes a sharp drop in shear stress in the B3B4 segment, followed by a slow decline in the B5B6 segment.
Type C: In the O1C1 segment, the shear stress initially increases slowly and then rises sharply. In the C1C3 segment, the shear stress first decreases sharply, then increases slightly, and finally decreases slowly. This behavior is attributed to partial interfacial spalling after reaching the peak stress, causing a sudden drop in shear stress. Under the influence of normal stress, the specimen is further compacted, increasing the contact area at the interface, which leads to a temporary increase in shear stress in the C2C3 segment.
3.4. Interfacial Shear Mechanical Analysis
Studying the characteristics of interfacial shear mechanical behavior can provide valuable references for structural optimization and interface layer design. Based on the interfacial shear-slip patterns and experimental observations of the tunnel shock-absorbing layer and secondary lining, five evaluation metrics were employed for a comparative analysis of PC and PE specimens under the same normal stress: interfacial shear strength, interfacial residual shear strength, interfacial shear modulus, shear-slip energy, and interfacial shear failure displacement. Additionally, the influence of different normal stresses on interfacial properties was investigated.
3.4.1. Interfacial Shear Strength and Residual Shear Strength
The interfacial shear strength is defined as the maximum shear force that can be sustained per unit area. By extracting the shear strength values corresponding to points A1, B3, and C1 in
Figure 8, the relationship between shear strength and normal stress is plotted, as shown in
Figure 9. From
Figure 9, it can be observed that as the normal stress increases, the shear strength of both PC and PE specimens also increases. For PC specimens, the shear strength increases from 1.19 MPa to 3.2 MPa, a rise of 2.01 MPa, representing an approximately 1.7-fold increase. For PE specimens, the shear strength increases from 0.79 MPa to 2.99 MPa, a rise of 2.2 MPa, representing an approximately 2.8-fold increase. When the normal stress increases from 0 M Pa to 1.0 MPa, the shear strength of PC specimens increases by 1.27 MPa, while that of PE specimens increases by 1.65 MPa. When the normal stress increases from 1.0 MPa to 2.0 MPa, the shear strength of PC specimens increases by 0.74 MPa, while that of PE specimens increases by 0.55 MPa. The rate of increase in shear strength for both types of specimens gradually decreases as the normal stress increases. Under the same normal stress conditions, the shear strength of PC specimens is greater than that of PE specimens. Specifically, at 0 MPa normal stress, the shear strength of PC specimens is 0.4 MPa higher than that of PE specimens, while at 2 MPa normal stress, the difference reduces to 0.21 MPa.
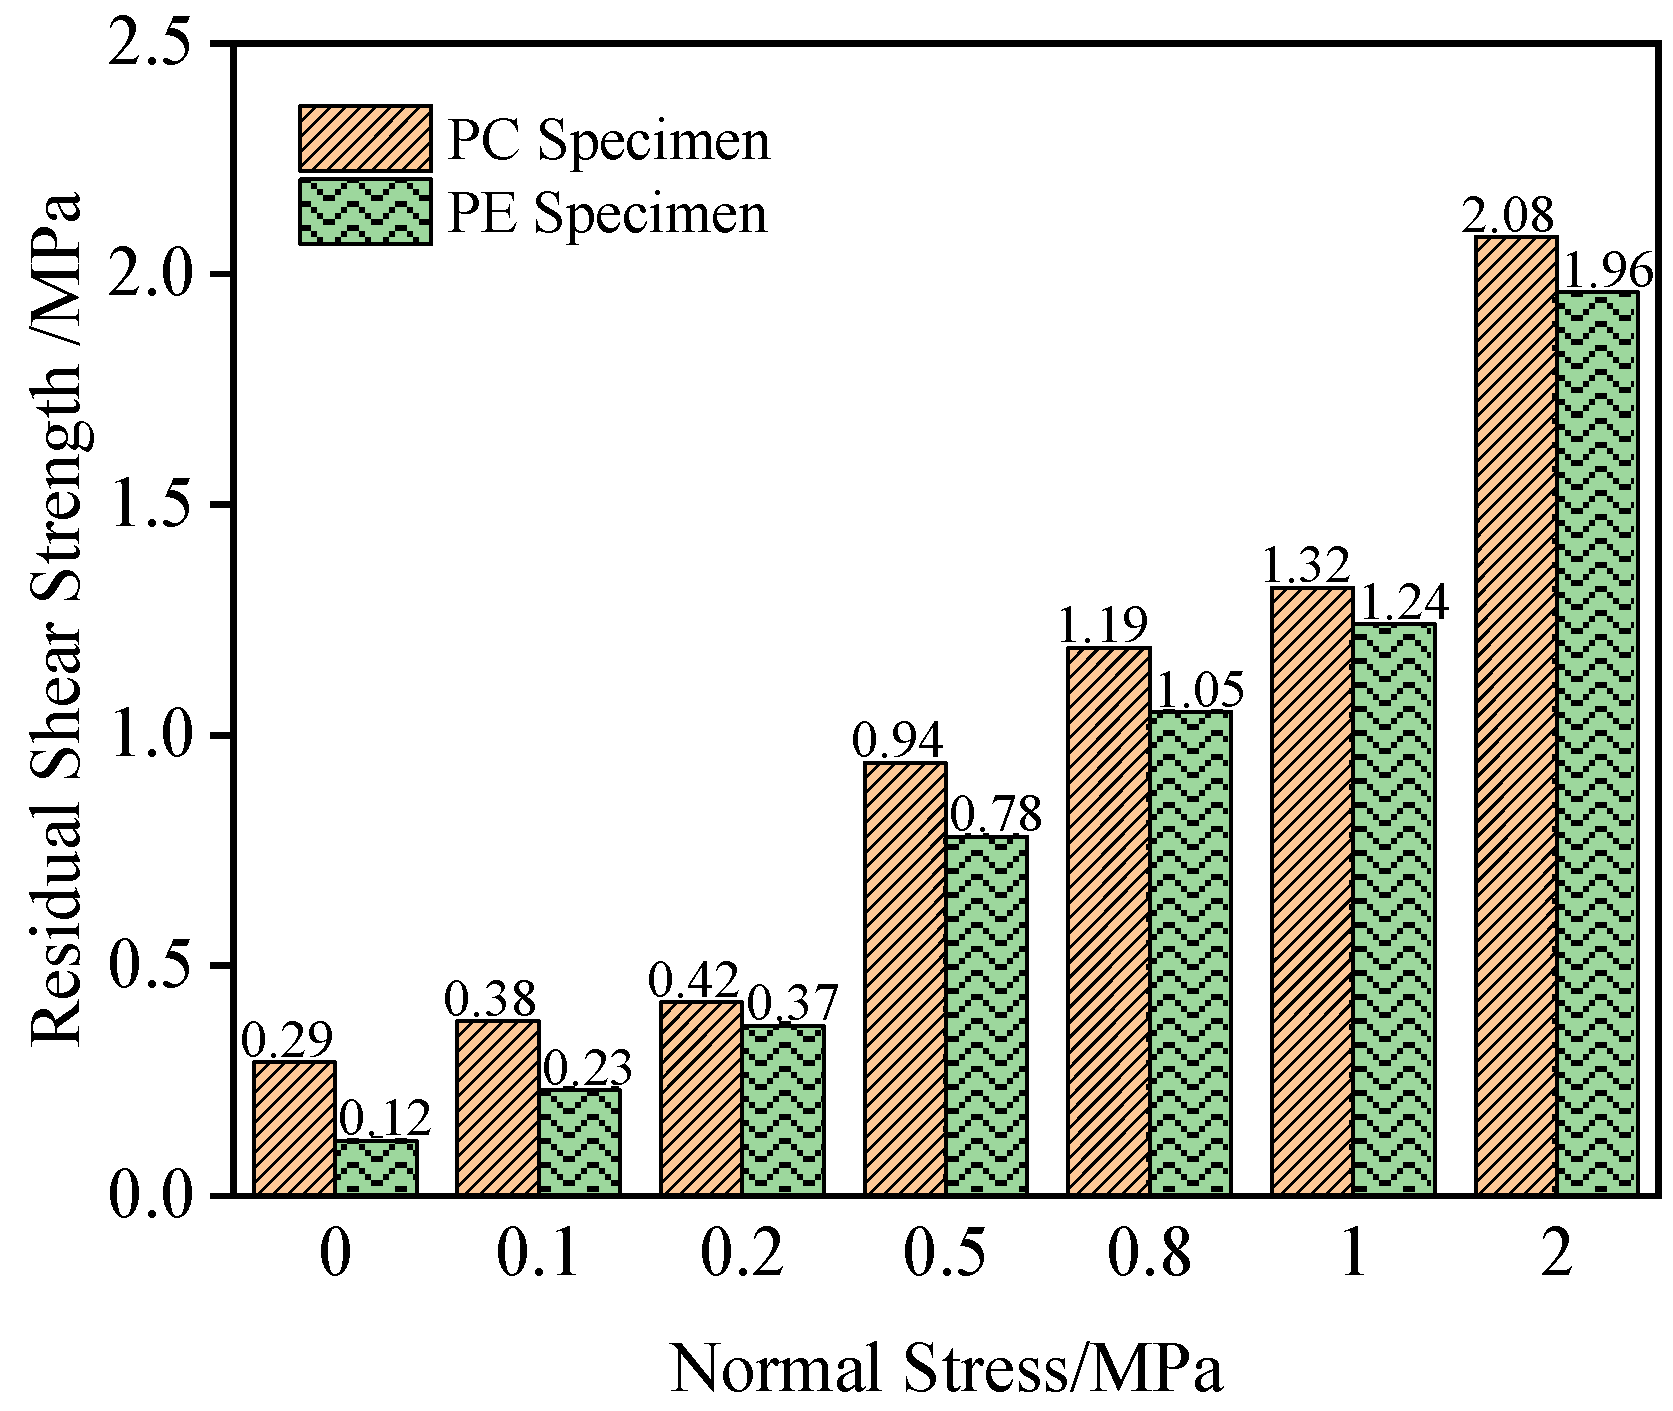
From the load-slip curves, it is evident that both PC and PE specimens retain some residual shear stress after shear failure. As the shear displacement increases, the shear stress tends to stabilize. The shear stress value at this stage is defined as the interfacial residual shear strength, as indicated by points A2, B5, and C4 in
Figure 8. After data processing, the residual shear strengths of PC and PE specimens under different normal stresses are plotted, as shown in
Figure 10. As the normal stress increases from 0 MPa to 2 MPa, the interfacial residual shear strength of both PC and PE specimens increases. For PC specimens, the residual shear strength increases by 1.79 MPa, representing an approximately 6.1-fold increase, while for PE specimens, it increases by 1.84 MPa, representing an approximately 15.3-fold increase. Under the same normal stress, the residual shear strength of PC specimens is greater than that of PE specimens, although the difference between the two decreases slightly as the normal stress increases. At 0 MPa normal stress, the residual shear strength of PC specimens is 0.17 MPa higher than that of PE specimens, while at 2 MPa normal stress, the difference reduces to 0.12 MPa.
3.4.2. Interfacial Shear Modulus and Shear-Slip Energy
The interfacial shear modulus is defined as the slope of the approximately linear portion in the initial stage of the load-slip curve. The interfacial shear modulus reflects the shear stiffness or deformation characteristics of the contact area between the shock-absorbing layer and the secondary lining. It is an indicator of the interface’s ability to respond to shear forces. A higher interfacial shear modulus indicates a stronger ability of the composite structure to undergo coordinated deformation, while a lower modulus suggests a greater likelihood of interlayer slip failure. Based on the experimental results, the variation in interfacial shear modulus for PC and PE specimens under different normal stresses is shown in
Figure 11.
From
Figure 11 it can be observed that under the same normal stress, the interfacial shear modulus of PC specimens is greater than that of PE specimens. Specifically, at 0 MPa normal stress, the interfacial shear modulus of PC specimens is 0.189 MPa/mm higher than that of PE specimens, while at 2 MPa normal stress, the difference reduces to 0.08 MPa/mm. As the normal stress increases, the interfacial shear modulus of both PC and PE specimens initially increases and then decreases, reaching its maximum value at 0.8 MPa normal stress. At this point, the interfacial shear modulus of PC specimens is 1.217 MPa/mm, representing an approximately 1.8-fold increase, while that of PE specimens is 1.012 MPa/mm, representing an approximately 3-fold increase. When the normal stress of the PC specimen and PE specimens is 0.8 MPa, the maximum values are 1.012 MPa/mm and 1.217 MPa/mm, respectively. When the normal stress exceeds 0.8 MPa and continues to increase, internal failure of the foamed concrete occurs, resulting in a decrease in the shear modulus with the increase in the normal stress. When the normal stress reaches 0.8 MPa, damage or direct cracking occurs at the interface, leading to a reduction in interfacial strength. This results in a decrease in interfacial bonding strength and, consequently, a reduction in the interfacial shear modulus.
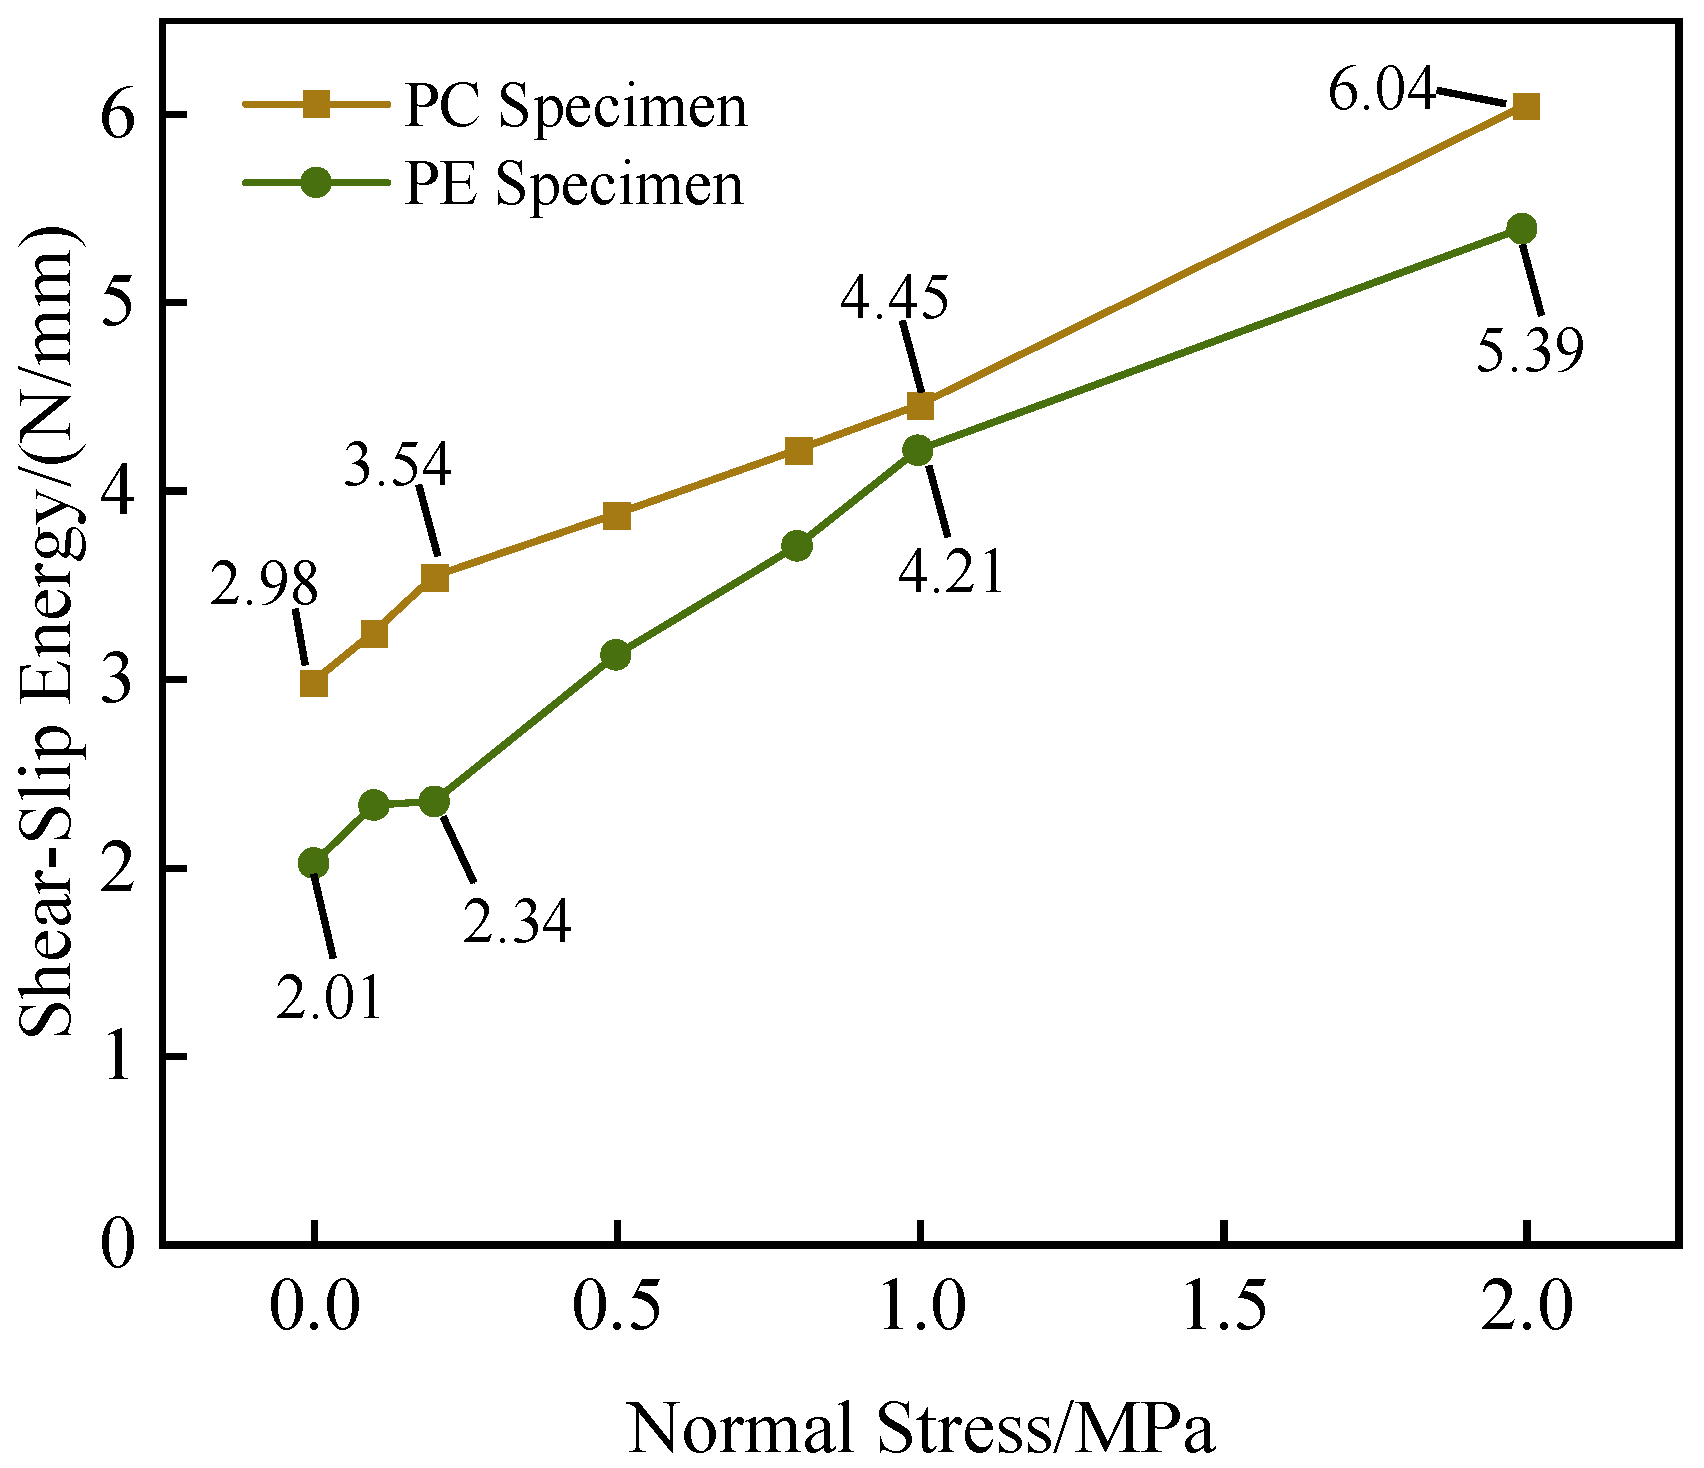
The shear-slip energy reflects the amount of energy required to transition a material from its initial state to shear failure. A higher shear-slip energy indicates that the interface is less prone to brittle failure. The shear-slip energy is calculated as the area under the shear stress-shear displacement curve. The shear-slip energy of PC and PE specimens under different normal stresses is shown in
Figure 12.
From
Figure 12, it can be observed that at 0 MPa normal stress, the shear-slip energy of PC specimens is 2.98 N/mm, while that of PE specimens is 2.01 N/mm. At 2 MPa normal stress, the shear-slip energy of PC specimens increases to 6.04 N/mm, and that of PE specimens increases to 5.39 N/mm. As the normal stress increases, the interfacial shear-slip energy of both PC and PE specimens gradually increases. When the normal stress increases from 0 MPa to 2.0 MPa, the shear-slip energy of PC specimens increases by 3.06 N/mm, representing an approximately 1-fold increase, while that of PE specimens increases by 3.38 N/mm, representing an approximately 1.7-fold increase. Under the same normal stress, the interfacial shear-slip energy of PC specimens is greater than that of PE specimens. When the normal stress increases from 0 MPa to 1 MPa, the difference in shear-slip energy between PC and PE specimens gradually decreases, reaching its minimum at 1 MPa. When the normal stress increases from 1 MPa to 2 MPa, the difference in shear-slip energy between PC and PE specimens gradually increases.
3.4.3. Interfacial Shear Failure Displacement
The interfacial shear failure displacement is defined as the shear displacement from the initial shear stage to the shear-slip stage. During the interface failure stage, the shear stress varies significantly due to the influence of normal stress. To accurately describe the changes in shear characteristics at different stages of the interface, the interfacial shear failure displacement is introduced as an evaluation metric for the mechanical performance of the specimens. The interfacial shear failure displacement of PC and PE specimens under different normal stresses is shown in
Figure 13.
From
Figure 13, it can be observed that as the normal stress increases, the interfacial shear failure displacement of both types of specimens gradually increases. At 0 MPa normal stress, the shear failure displacement of PC specimens is 2.67 mm, while that of PE specimens is 4.37 mm. When the normal stress increases to 2 MPa, the shear failure displacement of PC specimens increases to 4.87 mm, and that of PE specimens increases to 7.25 mm. This represents an increase of approximately 0.6 times for PC specimens and 0.8 times for PE specimens. For PE specimens, when the normal stress increases from 0 MPa to 1 MPa, the interfacial shear failure displacement increases by 1.36 mm, and when the normal stress increases from 1 MPa to 2 MPa, it increases by 1.52 mm, showing a clear upward trend. For PC specimens, when the normal stress increases from 0 MPa to 1 MPa, the interfacial shear failure displacement increases by 2.12 mm, and when the normal stress increases from 1 MPa to 2 MPa, it increases by only 0.08 mm, indicating that the interfacial shear failure displacement of PC specimens fluctuates within a small range and tends to stabilize. Under the same normal stress, the interfacial shear failure displacement of PC specimens is consistently smaller than that of PE specimens, and the difference between the two increases as the normal stress increases from 0 MPa to 2.0 MPa. Based on the above analysis, PE specimens exhibit better composite deformation capability compared to PC specimens.
5. Conclusions
(1) Under identical normal stress conditions, the interface shear strength and residual interface shear strength of PC-type specimens were 6.64–50.63% and 6.12–141.67% higher, respectively, than those of PE-type specimens. Conversely, the interface shear failure displacement of PE-type specimens was 16.94–63.67% greater than that of PC-type specimens.
(2) Under combined compression-shear loading, both PC-type and PE-type specimens exhibited two failure modes: interface shear failure and foam concrete failure.
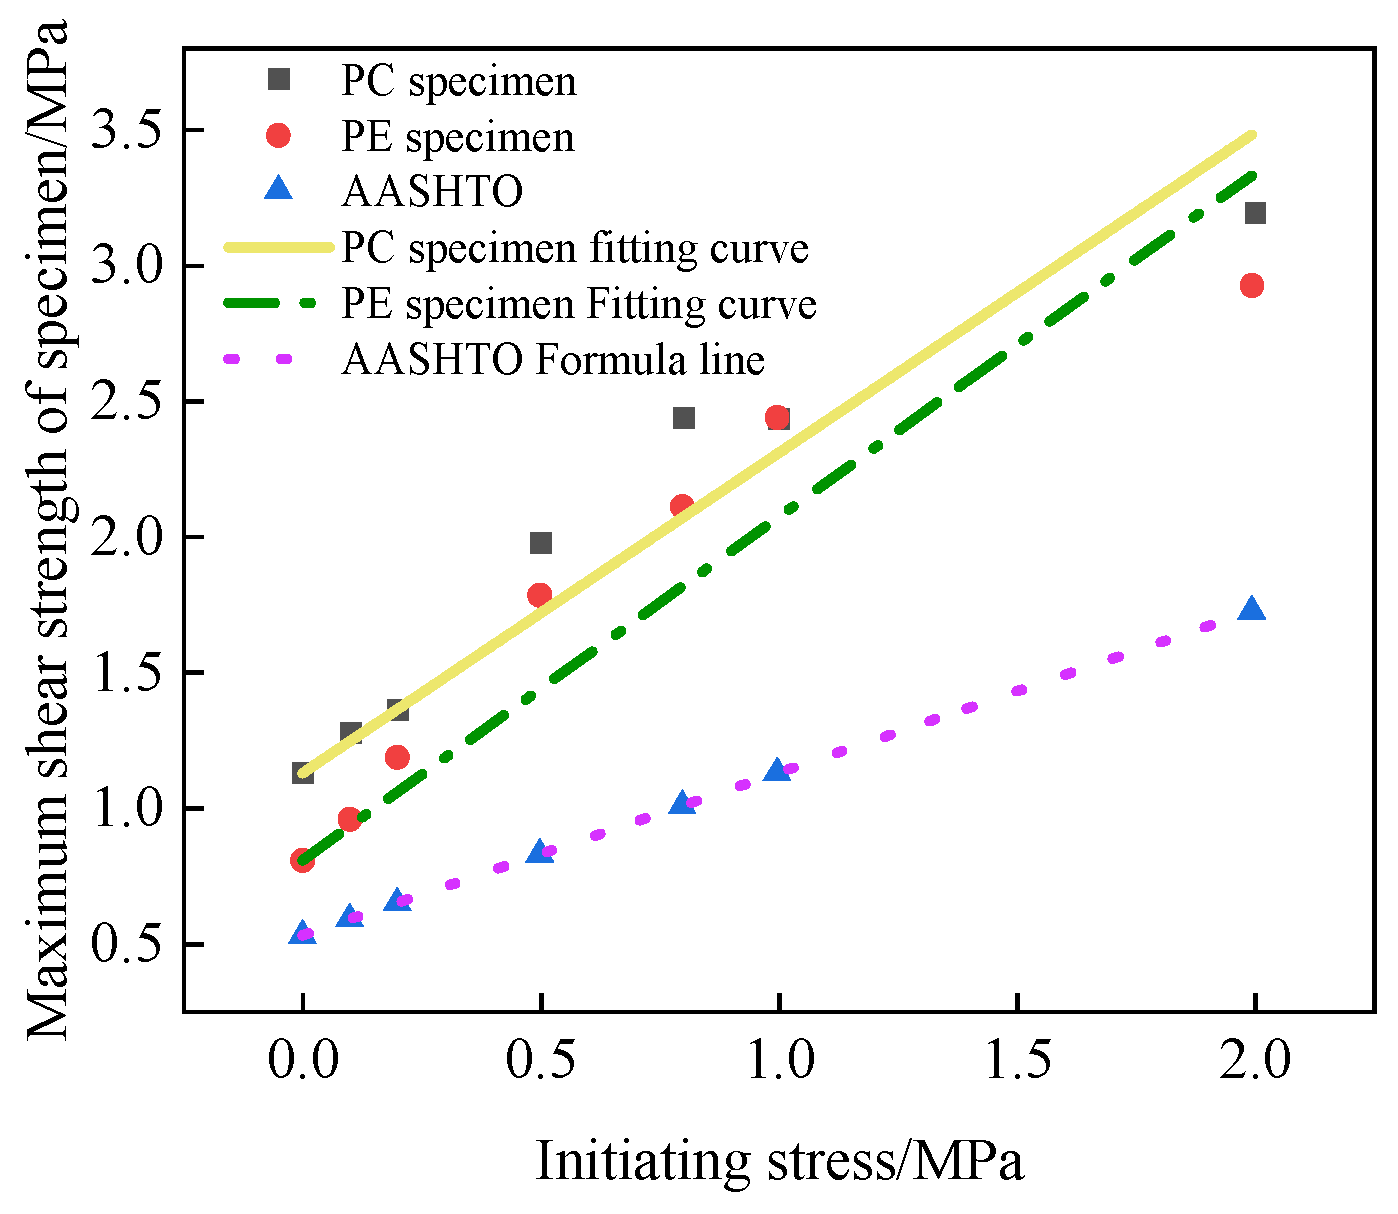
(3) The interface shear modulus of both specimen types initially increased and then decreased with rising normal stress, peaking at a normal stress of 0.8 MPa. Additionally, the shear strength at the interface between foam concrete and conventional concrete (or ECC) followed a linear relationship with normal stress, increasing proportionally with higher normal stress.
(4) Based on shear test data fitting, a predictive equation for the interfacial shear strength of PC and PE specimens was established, providing a reference for selecting mechanical parameters at foam concrete–conventional concrete and foam concrete–ECC interfaces.


