Article

Experimental Study on Seismic Performance of Vertical Connection Nodes of Prefabricated Concrete Channel

1
School of Civil Engineering and Transportation, North China University of Water Resources and Electric Power, Zhengzhou 450045, China
2
Henan Provincial Water Conservancy Technology Application Centre, Zhengzhou 450003, China
3
Yellow River Engineering Consulting Co., Ltd., Zhengzhou 450003, China
*
Author to whom correspondence should be addressed.
Buildings 2025, 15(10), 1581; https://doi.org/10.3390/buildings15101581
Submission received: 9 April 2025 / Revised: 1 May 2025 / Accepted: 5 May 2025 / Published: 8 May 2025
(This article belongs to the Section Building Structures)

Abstract

The prefabricated concrete channel, constructed by integrating factory-based prefabrication with on-site assembly, offers enhanced quality, reduced construction time, and minimized environmental impact. To promote its application in water conservancy projects, an innovative concrete joint combining semi-grouting sleeves and shear-resistant steel plates was proposed. Its seismic performance was assessed through a 1:3 scale low-cycle reversed loading test, focusing on failure mode, hysteretic behavior, skeleton curves, stiffness degradation, ductility, and energy dissipation. Results show that the joint primarily exhibits bending–shear failure, with cracks initiating at the sidewall–base slab interface. Also, the sidewall and base slab are interconnected through semi-grouting sleeves, while the concrete bonding is achieved via grouting and surface chiseling at the joint interface. The results indicated that the innovative concrete joint connection exhibits satisfied seismic performance. The shear-resistant steel plate significantly improves shear strength and enhances water sealing. Compared with cast-in-place specimens, the prefabricated joint shows a 16.04% lower equivalent viscous damping coefficient during failure due to reinforcement slippage, while achieving 16.34% greater cumulative energy dissipation and 52.00% higher ductility. These findings provide theoretical and experimental support for the broader adoption of prefabricated channels in water conservancy engineering.

1. Introduction

At the end of the 19th century, Europe and the United States began to experiment with the use of prefabricated concrete components for the construction of drainage systems, but most of the early drains and troughs were cast on site, with a low degree of prefabrication. At the beginning of the 20th century, the United States, Germany, and other countries began to use prefabricated concrete drainage channels in railway and highway construction to improve construction efficiency. For example, in the 1930s, the United States widely employed prefabricated concrete drainage components in highway construction projects to improve efficiency and quality. However, research in this area in China stagnated until 1993, when the National Science and Technology Commission incorporated “prefabricated construction technology for farmland water conservancy” into its national key scientific and technological promotion program. This marked a resurgence in research and application of prefabricated concrete products in water conservancy engineering of this country, although studies on large-scale water conservancy hub projects remain limited. Despite renewed emphasis on the research and application of prefabricated concrete products in water conservancy engineering, there is still a notable lack of exploration and implementation in the context of large-scale water conservancy hub projects [1,2]. Over the past two decades, although significant academic efforts have been devoted to the research and promotion of prefabricated concrete component technology for water conservancy projects, practical applications have seen limited progress. The connection techniques for large-scale prefabricated hydraulic reinforced concrete structures remain inadequately studied [3]. Prefabricated components can establish a comprehensive industrial chain through factory-based production, achieving energy efficiency, emission reduction, and resource conservation. This approach optimizes current operational models and provides an effective pathway for the sustainable development of water conservancy projects and the advancement of ecological water conservancy [4]. Large-scale hydraulic projects demand high durability and reliability, necessitating the implementation of measures that are both efficient and cost-effective. In this context, the adoption of prefabricated and partially prefabricated steel–concrete components offers significant technical and economic advantages [5].
In reinforced concrete structures, prefabricated components are predominantly connected using reinforcing bar grouting sleeves and bolted connections [6]. Liu et al. [7] proposed an innovative combined concrete beam–column joint based on bolted connections. Experimental and numerical analyses demonstrated that this joint exhibits superior seismic performance and energy dissipation characteristics. Zhao et al. [8] introduced a simplified tensile and shear bolted steel plate connection method for low-rise wall structures in seismically active regions, providing a straightforward and reliable installation process for construction sites. The results indicate that both bolted connection types satisfy the seismic safety requirements for low-rise buildings. Huang et al. [9] developed a bolted connection method for horizontally connected composite prefabricated walls, demonstrating the feasibility of the connection and the specimen’s excellent deformation capacity. Ding et al. [10] proposed a novel fully bolted concrete shear wall, which exhibited good seismic performance under an axial compression ratio of 0.05. Tullini et al. [11] conducted full-scale tests on grouted sleeve connections for prefabricated reinforced concrete columns, revealing that this connection type exhibits ductile and stable hysteretic behavior. Wang et al. [12] employed prefabricated concrete frame joints connected by fully grouted sleeves and disc spring devices. The disc spring devices functioned as damping elements during loading, and the results indicated that the energy dissipation and seismic performance of these joints surpassed those of conventional prefabricated concrete joints connected with standard grouted sleeves. Belleri and Riva [13] proposed the use of grouted steel sleeve connections as a novel column-to-foundation connection form and experimentally investigated their seismic performance and postearthquake repairability. The results indicated that the grouted sleeve connections exhibited hysteretic stability and energy dissipation capacity comparable to, or even better than, those of traditional connections. Moreover, the seismic damage was localized near the grout layer at the column base, with minimal damage to the main structural components, thereby facilitating rapid postearthquake repair. Xu et al. [14] revealed the fundamental differences in deformation mechanisms and energy dissipation between precast RC columns with grouted sleeve connections and cast-in-place RC columns through finite element simulations. Their study demonstrated that the plastic hinge development and seismic performance of precast RC columns can be effectively improved by optimizing material properties, adjusting the axial compression ratio, enhancing bond strength, and reasonably relocating the grouted sleeves. Lu et al. [15,16] proposed a prefabricated beam–column joint connected with double grouting sleeves and investigated its seismic performance. The results demonstrated that the double grouting sleeve connection performed effectively. Furthermore, a numerical study using finite element modeling examined the influence of various factors, such as protruding beam length and grout thickness, on the structural performance of the joint. Numerous researchers have experimentally and analytically investigated the seismic performance of prefabricated members with various grouting sleeve forms [17,18,19,20,21,22,23,24,25,26]. The findings indicate that components connected with grouting sleeves exhibit mechanical properties comparable to those of cast-in-place components. However, the ductility of these components is constrained due to the large connection joints inherent in grouting sleeve systems.
Extensive research has demonstrated that grouting sleeve technology offers significant advantages, including operational simplicity and reliable joint performance, leading to its widespread adoption in prefabricated concrete structures [27]. However, in the field of water conservancy engineering, the application of prefabricated grouting sleeve connections remains underdeveloped due to the limited availability of systematic theoretical and experimental studies. Therefore, this study proposes a novel composite connection method combining semi-grouting sleeves and shear-resistant steel plates for prefabricated channels. The grouting sleeve connection method is adapted for hydraulic structures to evaluate the seismic performance of prefabricated channels utilizing this connection. Through quasi-static tests, the hysteretic behavior, stiffness degradation, ductility, and energy dissipation capacity of the connection specimen were systematically analyzed and compared with those of cast-in-place specimen. This study provides valuable insights and a theoretical foundation for the seismic design of prefabricated channels in water conservancy engineering.

2. Materials and Methods

2.1. Scale Model Design

The design of the scale model in this study is based on the channel project of the Xixiayuan Water Conservancy. 
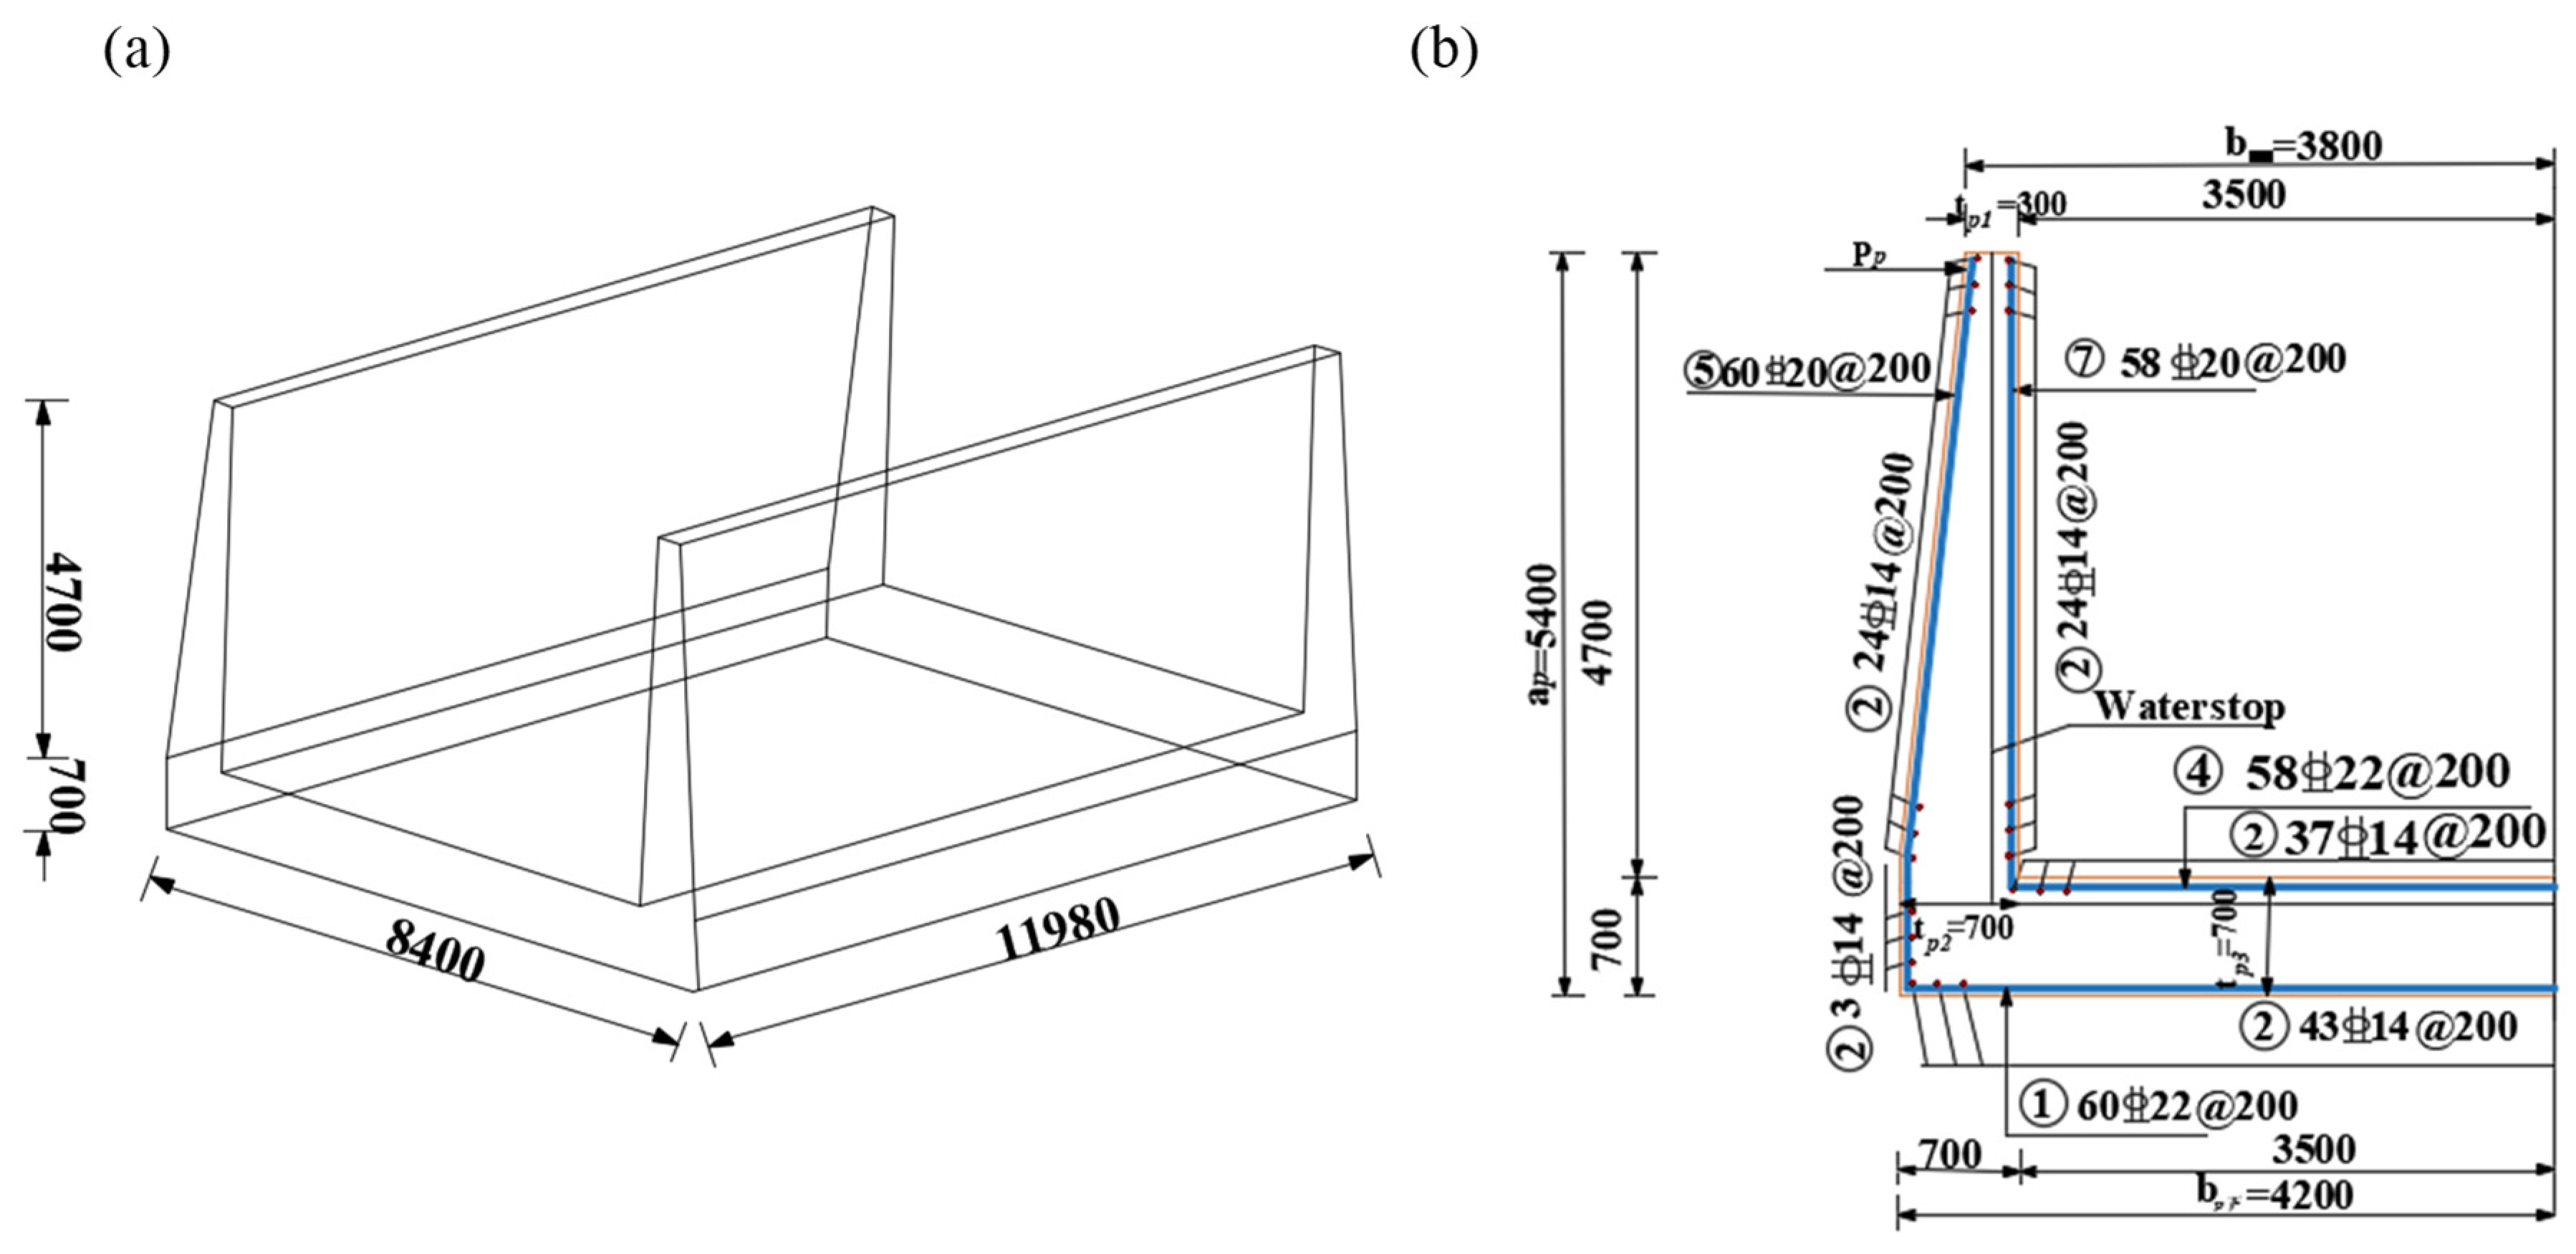
Figure 1 shows the three-dimensional dimensions and reinforcement details of the prototype structure. Given the symmetrical nature of the channel, one-twelfth of the sidewall (1996 mm) was selected as the research object. A length similarity ratio of 1:3 was selected based on the principles of similitude theory. The design satisfies the requirements for geometric, load, stiffness, time, and boundary condition similarity. This ratio ensures that the mechanical behavior of the prototype structure is reasonably represented while allowing the model to be tested under the constraints of the available experimental conditions. The materials used for the model, including steel and concrete, were identical to those in the prototype structure. Two specimens were fabricated for this experiment: a cast-in-place channel specimen (QC1) and a prefabricated channel specimen (QC2).
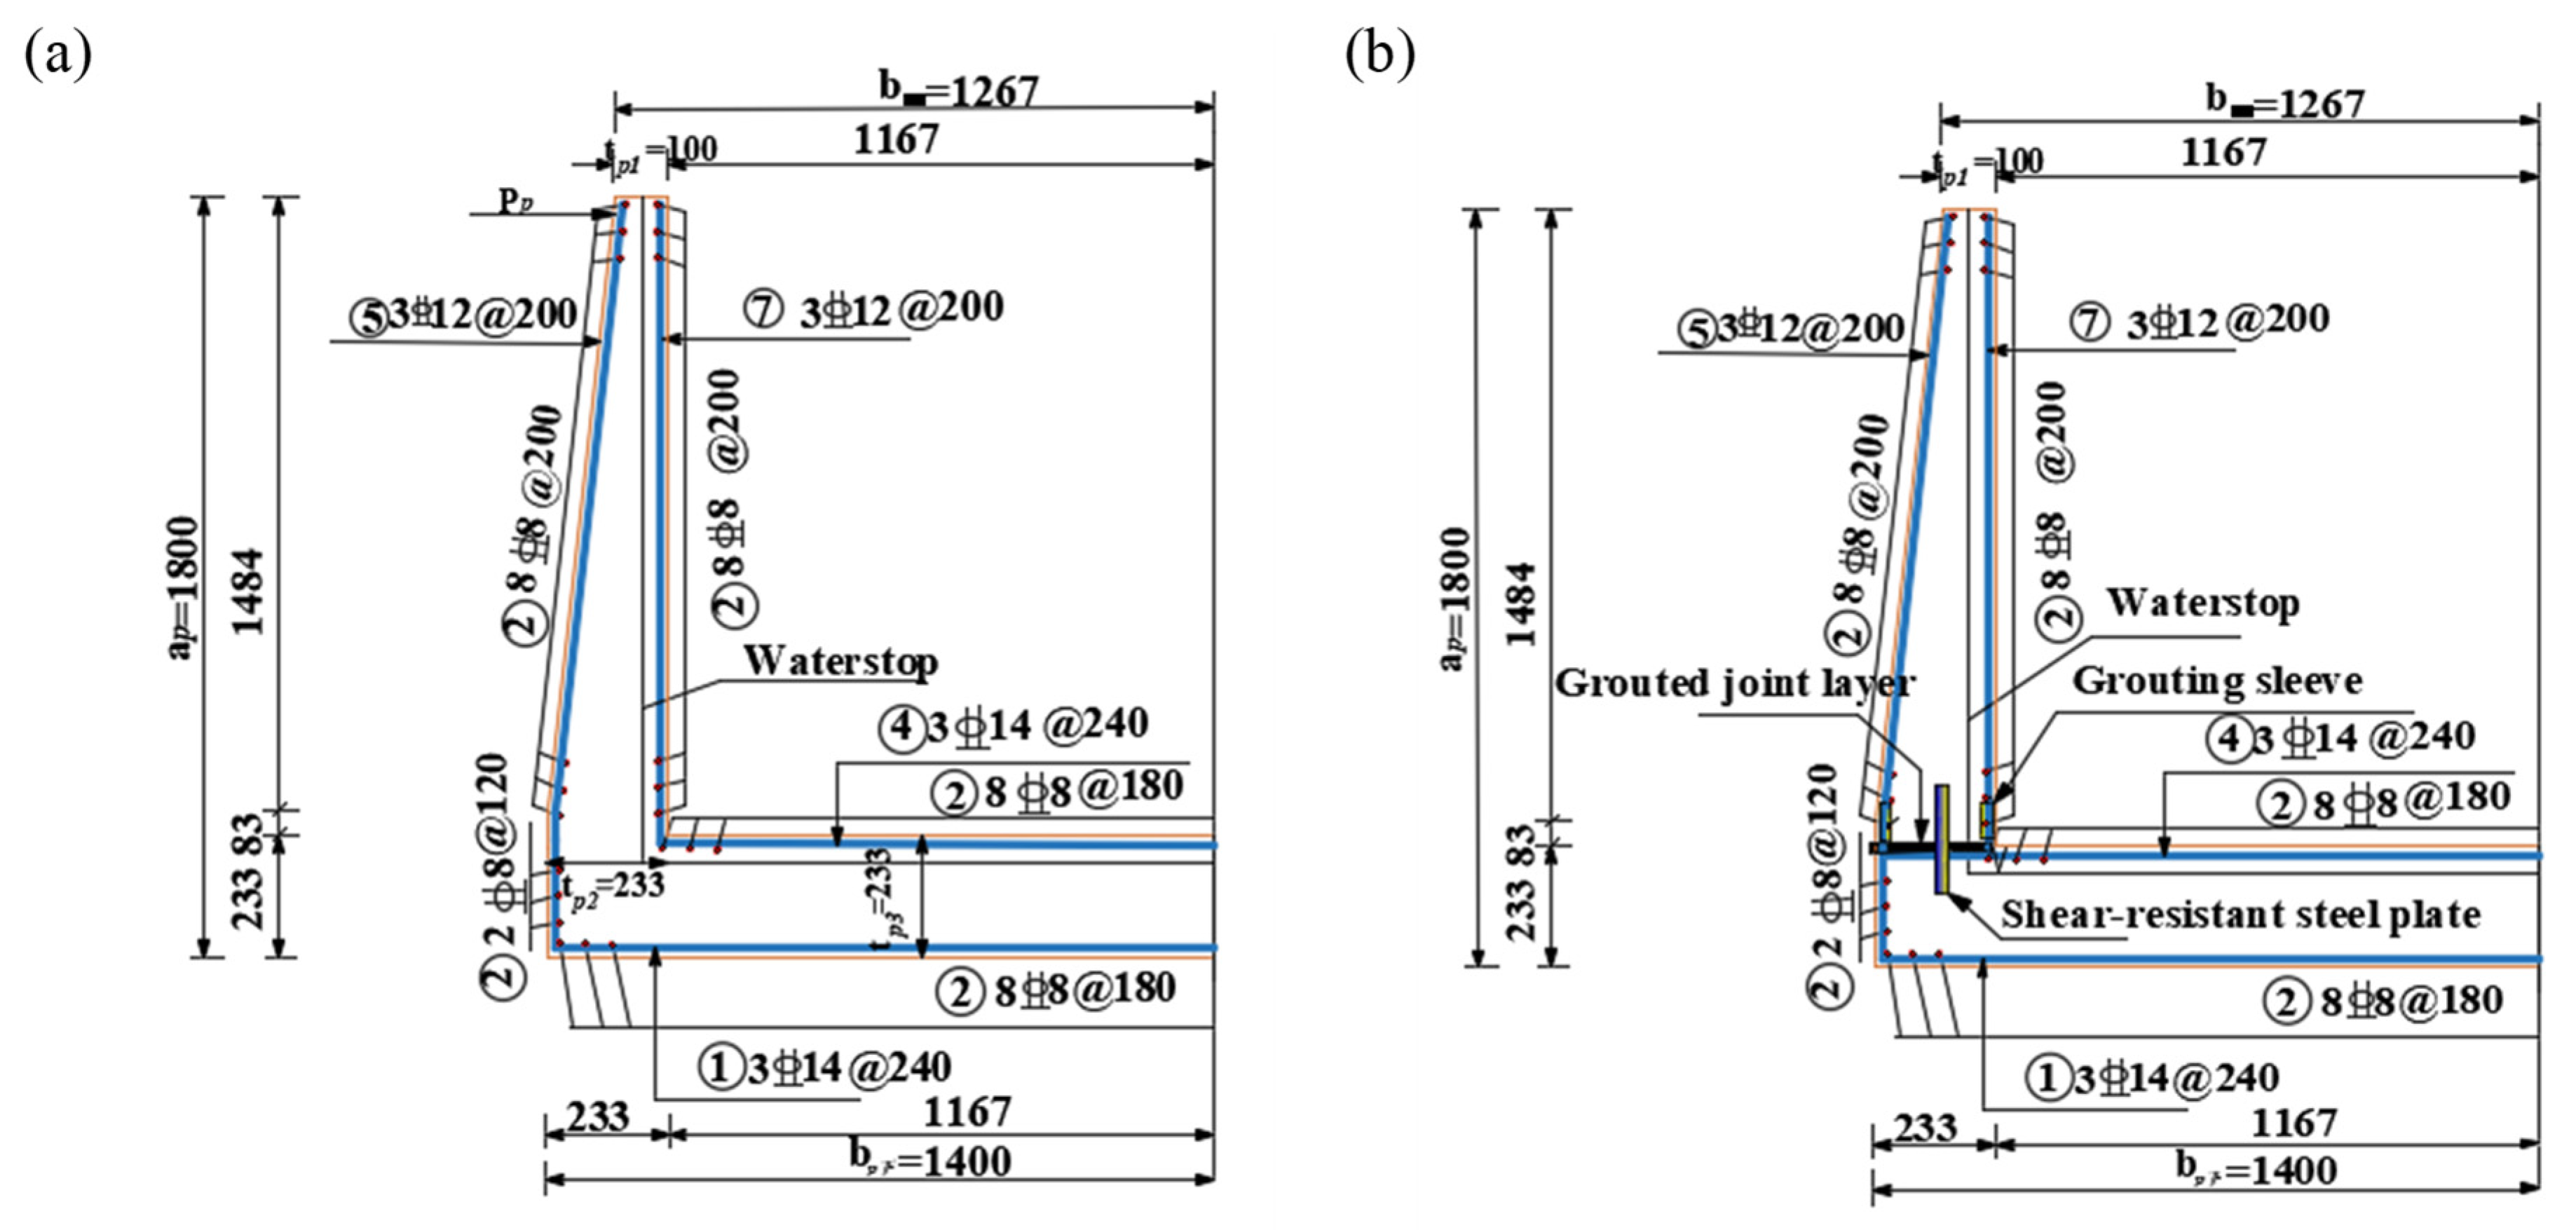
The reinforcement for the sidewall and base slab of the QC2 was constructed using HRB400 steel. The connection between the sidewall and base slab was achieved through a combination of semi-grouting sleeves and shear-resistant steel plates. The shear steel plate serves dual purposes: enhancing the shear capacity of the prefabricated specimen and providing a water-sealing function for the assembled channel. To evaluate the impact of the connection on the seismic performance of the joint, the geometric dimensions and reinforcement layout of the QC1 cast-in-place specimen were designed to be identical to those of the QC2, enabling a direct comparison between the two. The key parameters, dimensions, and reinforcement configurations of the specimens are detailed in Table 1 and Figure 2.
The design methodology for the shear-resistant steel plate is as follows:
(A) Direct shear-bearing capacity. The American code ACI318 [28] specifies the following formula for calculating the direct shear capacity of a cross-section:
ϕ V n = min 1.4 ϕ A v f f y k , 0.2 ϕ A c f c , 5.5 ϕ A c f c
ϕ is the coefficient 0.85; A v f represents the effective cross-sectional area of the vertical reinforcement embedded in the base slab to resist shear forces. A v f = 6 × πr2 = 378.6 mm2; A v f = ρ v f A c represents the reinforcement ratio of the plate; f y k is the standard yield strength of the steel bar; f c is the standard compressive strength of the concrete cylinder; A c is the effective cross-sectional area. The concrete strength grade of the slab is C30, and HRB400 longitudinal reinforcement is used. So, f y k / f t = 279.7 , f c , / f t = 17 , A c = b h 0 , ρ v f = A v f / A c . Substituting these into Equation (1) yields:
V n min 1.60   f t b h 0 , 2.89   f t b h 0 , 79.48   f t b h 0
f t is the design value of axial tensile strength of concrete, b is the section length, h 0 is the effective width of the section.
Based on Formula (2) above, the shear-bearing capacity of the steel plate and steel bar is calculated as V n = 324.084 kN which is equivalent to the direct shear-bearing capacity of V = 324,083.76 N. Combined with the “Technical Specification for prefabricated Concrete Structures” JGJ1-2014 [29], the shear-bearing capacity can be calculated by the following formula:
V = 1.65   A s d f c f y
f c is the design axial compressive strength of prefabricated concrete; f y is the design tensile strength of the steel bar steel; A s d is the required reinforcement area, including longitudinal reinforcement. The thickness of the steel plate can be determined by:
d = A s b b
According to Equation (3), the total required reinforcement area Asd was calculated, which includes the contribution of the six vertical rebars embedded in the base slab. To determine the area carried by the shear-resisting steel plate, denoted as Asb, the total cross-sectional area of the six vertical rebars was subtracted from Asd. The calculation is expressed as: Asb = AsdArebars = 2737.48 mm2 − 678.6 mm2 = 2058.88 mm2. b represents the section length, and the shear-resistant steel plate thickness is d = 3.10 mm.
(B) Anchorage length. The formula for calculating the anchorage length is:
l a b = a × f y ÷ f t × d
The shape coefficient of the steel bar is a = 0.16 for smooth steel bars; f t is the design value of concrete (1.43 N/mm2); and f y is the design tensile strength of the steel bar (215 N/mm2). The thickness of the steel plate is 3.10 mm. Based on Formula (5), the anchorage length of the steel plate is calculated as: lab = 74.57 mm.
The final dimensions of the shear-resisting steel plate were determined based on the required shear-resisting area Asb. The width b of the plate was set equal to the width of the base slab, that is, b = 665 mm. The plate thickness d was calculated by dividing Asb by the plate width, resulting in: d = Asb  ÷  b = 2058.88 ÷ 665 = 3.10 mm. Subsequently, the anchorage length of the steel plate was determined using Equation (5), yielding 74.57 mm. Since the anchorage length is set equal to the embedded length in the base slab, the final effective dimensions of the steel plate were established as 149.14 mm × 665 mm × 3.10 mm.
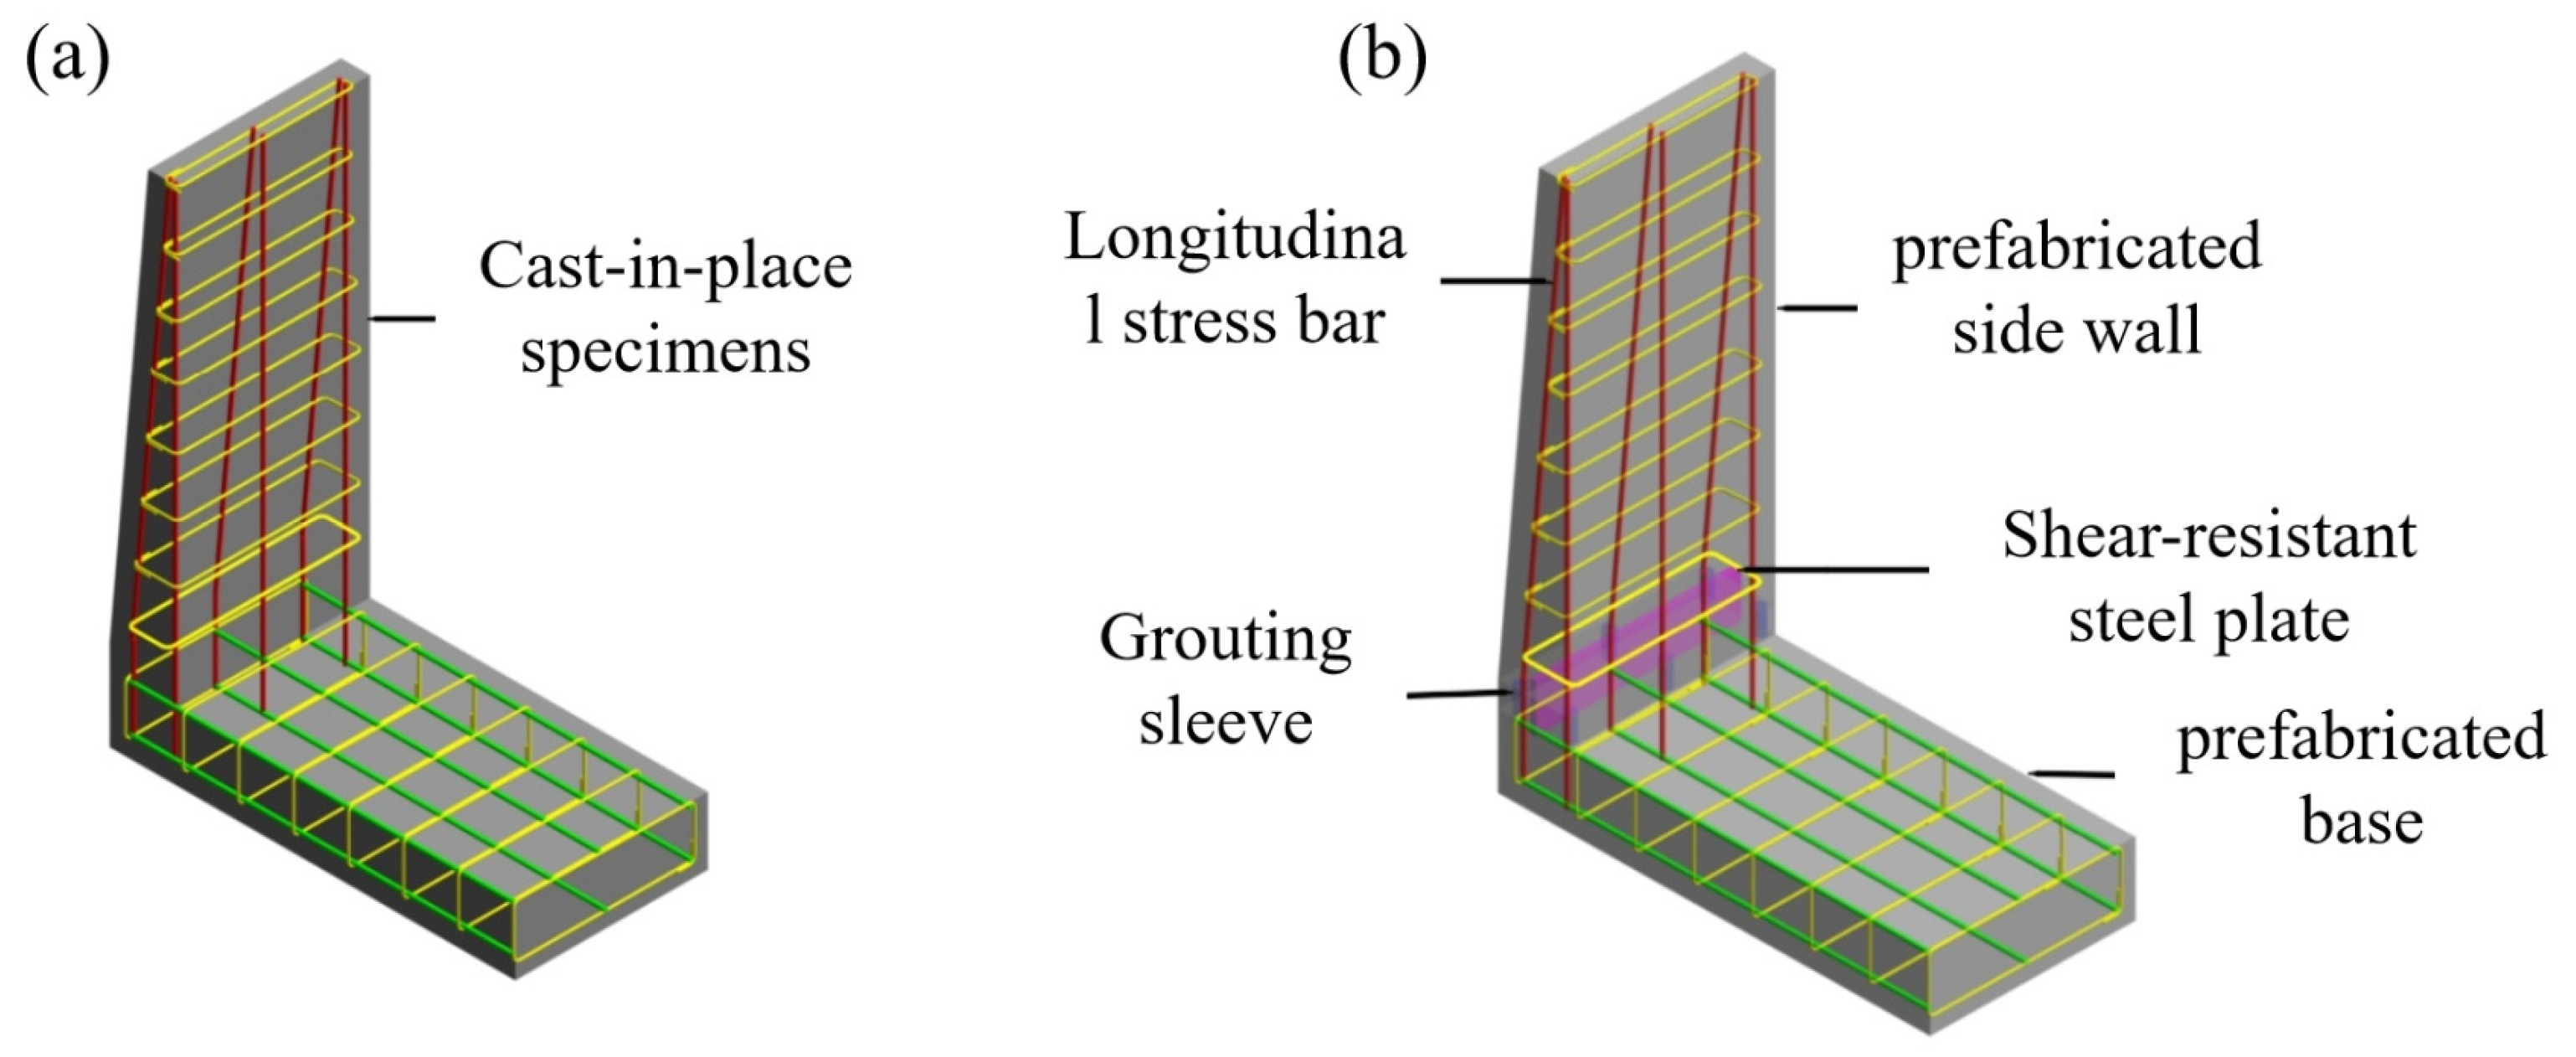
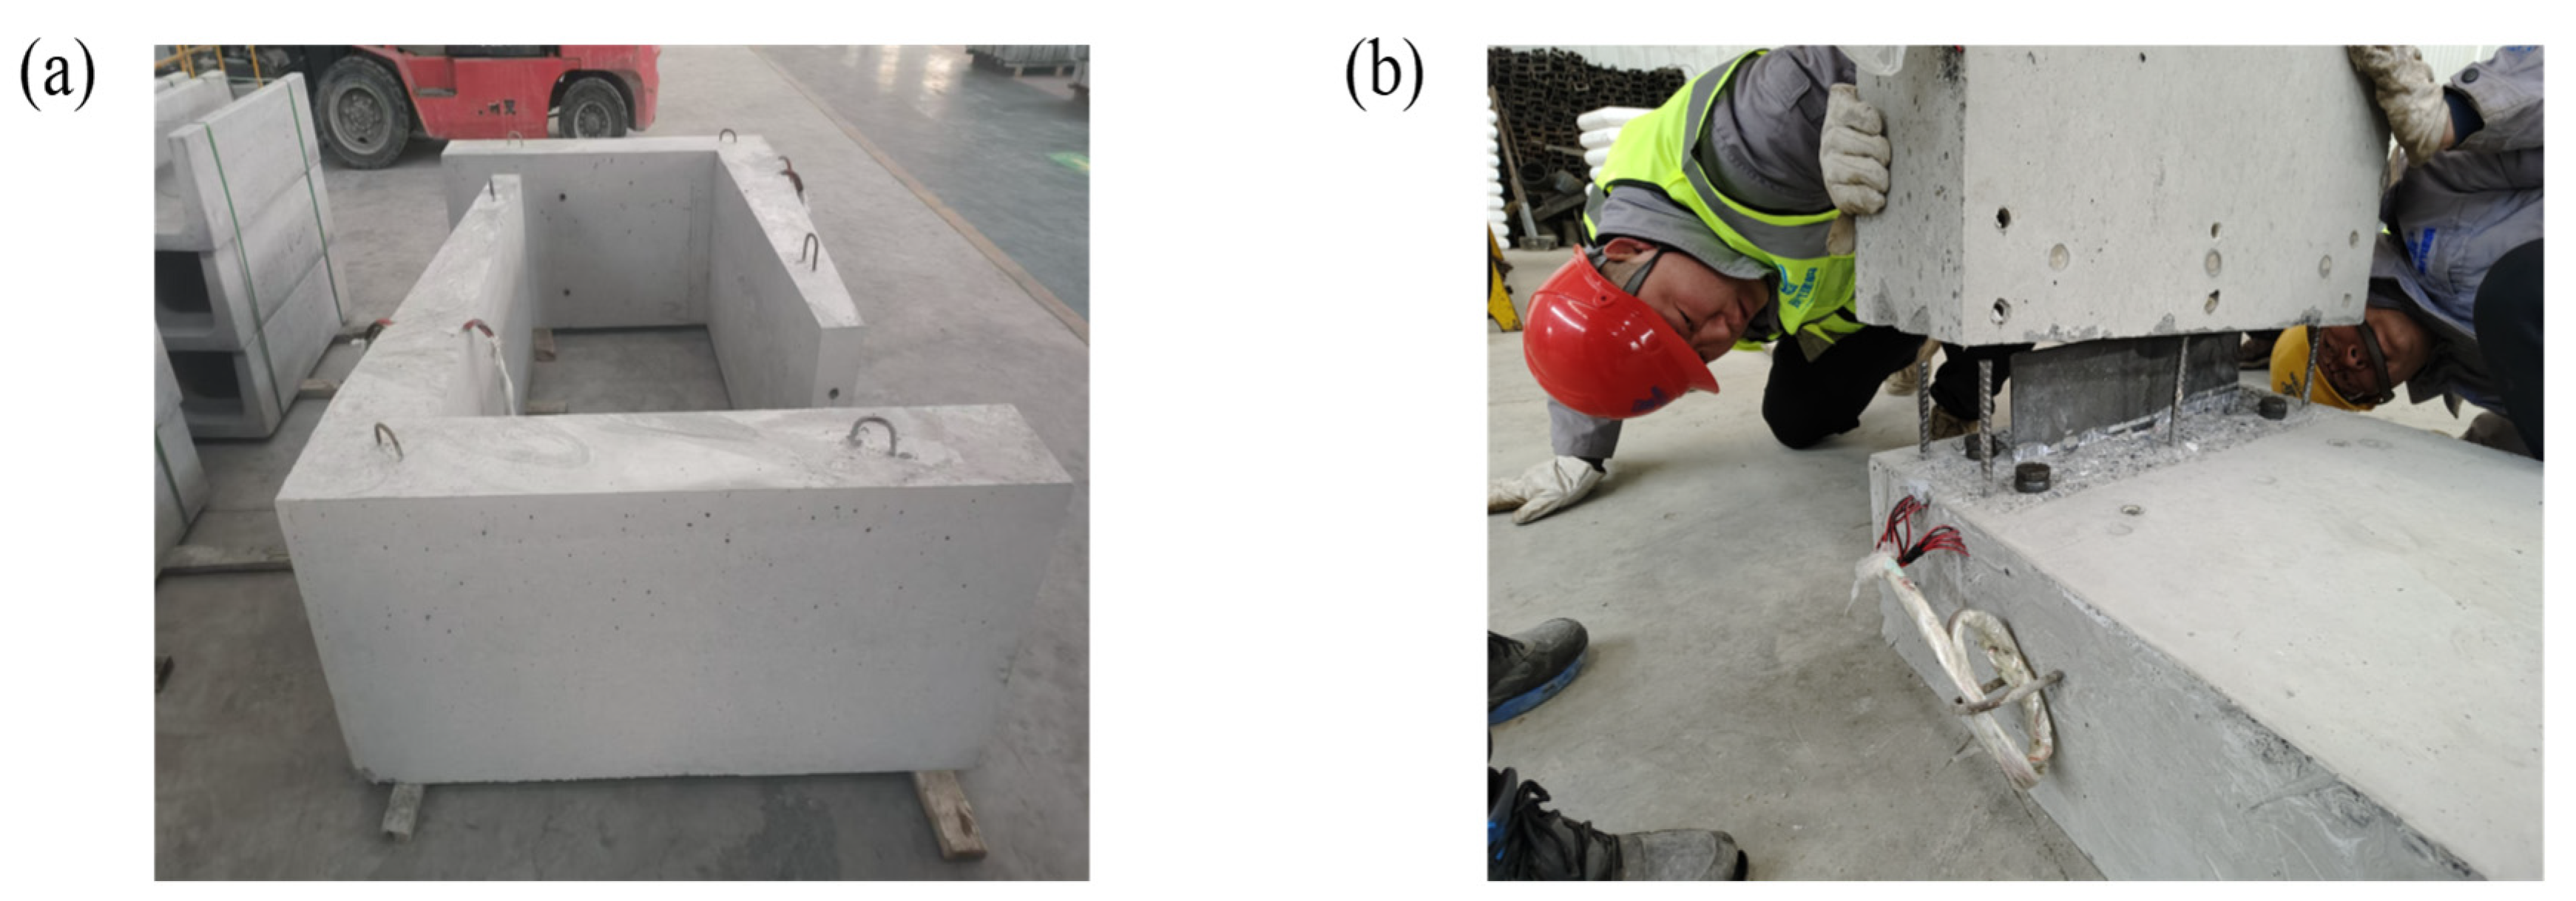
The sidewall of the QC1 cast-in-place specimen has dimensions of 1567 mm × 665 mm × 100 mm, reinforced with 6 × 12 mm HRB400 longitudinal tensile steel bars. The reinforcing bars are symmetrically distributed on both sides with a spacing of 220 mm. The dimensions of the base slab are 1400 mm × 665 mm × 233 mm. The QC2 is designed to be identical to the QC1 in terms of geometry and reinforcement. In the QC2, the six longitudinal stressed reinforcement bars in the sidewall are connected to the base slab reinforcement bars using ductile iron semi-grouting sleeves (GTB4Z-12). The shear-resistant steel plate is anchored with an embedment depth of approximately 75 mm in the upper portion of the base slab and 75 mm in the lower portion of the sidewall. Detailed configurations of the specimen joints are presented in Figure 3.

2.2. Prefabricated Specimen Preparation

The cast-in-place specimen QC1 and the prefabricated channel specimen QC2 were fabricated in cooperation with Henan Modern Construction Technology Co., Ltd., Xinxiang, China, in accordance with standardized industrial procedures. For the QC1 specimen, the concrete was cast in a single pour. In contrast, the QC2 specimen was prepared through a multi-step process: first, the sidewall and base slab reinforcement were fabricated, and the shear steel plate was embedded. Subsequently, the concrete for the sidewall and base slab was poured and cured separately. The formwork was removed after the concrete strength reached 70% of the design strength. Following formwork removal, the sidewall and base slab were connected using semi-grouting sleeves. The joint construction process is shown in Figure 4, the attaching method of the strain gauge is shown in Figure 5, and the specimen fabrication is shown in Figure 6.

2.3. Testing Methods

The test measurements encompassed the horizontal load and displacement of the sidewall, crack development at the junction between the sidewall and base slab, reinforcement strain in the sidewall, and the load and displacement of the actuator. The displacement of the sidewall was measured using a displacement transducer with a range of 100 mm, installed directly on the sidewall. The force and displacement of the actuator were automatically recorded by the MTS integrated load–displacement sensor. Prior to testing, a white coating was applied to both surfaces of the sidewall, and a grid pattern was drawn to facilitate crack observation. During loading, a magnifying glass was employed to detect crack initiation and propagation, with each crack numbered for documentation. The arrangement of displacement transducers is illustrated in Figure 7.

2.3.1. Mechanical Properties of Concrete

Both the QC1 and the QC2 were constructed using concrete with a nominal strength grade of C30. During the specimen preparation, three standard concrete cubes (100 mm × 100 mm × 100 mm), made from the same batch, were prepared for every group to ensure repeatability. One group of specimens was subjected to standard curing conditions: the specimens were subjected to standard curing for 28 days in a curing chamber maintained at 20 °C and a relative humidity greater than 95% and their compressive strength was tested at 28 days on a pressure testing machine, shown in Figure 8. The remaining two groups were cured under the same conditions as the model specimens and tested for compressive strength at the beginning of the test. Additionally, during each concrete pouring operation, two groups of concrete specimens (150 mm × 150 mm × 300 mm) were prepared, with three specimens in each group. These specimens were cured under the same conditions as above, and both their compressive strength and elastic modulus were tested based on the “Concrete Physical and Mechanical Properties Test Method Standard” (GB/T 50081-2019) [30]. The measured mechanical properties of specimens are presented in Table 2.

2.3.2. Mechanical Properties of Steel Reinforcement

The mechanical properties of the reserved steel bars in the model specimens were tested according to the “Metallic Materials Tensile Test Method at Room Temperature” (GBT228.1-2021) [31]. The drawing specimens consisted of HRB400 12 mm steel bars. Three sets of HRB400 12 mm steel bar specimens were reserved. After marking, the tensile tests at room temperature were conducted on the steel bars. The yield strength, ultimate strength, and other mechanical properties of the steel bars were obtained from the pull-out test results. The mechanical properties of the steel bars are presented in Table 3, and the mechanical testing setup for the steel bars is shown in Figure 9.

2.3.3. Mechanical Properties of Grouting Material

The grouting material (40 mm × 40 mm × 160 mm) was prepared and tested in accordance with the “ISO Method for Light Inspection of Cement Mortar” (GB/T 17671-2021) [32]. The fluidity was measured before grouting, as in Figure 10a, and the compressive strength was measured after 28 days of standard curing using and TYE-300C type pressure tester, as in Figure 10b. The results of fluidity and compressive strength of grouting material are presented in Table 4.

2.3.4. Seismic Performance Test

The seismic performance tests of the specimens were conducted on a self-constructed experimental platform, as illustrated in Figure 11a. A high-capacity hydraulic power unit (Model 505.90) from MTS Systems Corporation was used to provide the required hydraulic pressure and flow for the loading system. The loading point was positioned at one-third of the sidewall height from the base plate, precisely at a distance of 522 mm, to facilitate low-cycle repeated loading. The upper one-third section of the sidewall was connected to a hydraulic servo actuator with a maximum capacity of 500 kN. A specialized loading head was employed to ensure a secure connection between the hydraulic servo actuator and the specimen. Due to the non-verticality of the outer side of the sidewall, the contact position between the sidewall and the loading head was filled with inclined iron during equipment installation, ensuring that the horizontal load was uniformly applied to the designated loading point on the sidewall. The lower part of the test specimen was cushioned with approximately 30 mm of fine sand to closely simulate the actual stress conditions. The upper part of the base slab of the specimen was fixed by a steel beam, primarily to simulate the external gravity load in actual working conditions. A wooden support was placed on the side of the base slab near the horizontal loading point, allowing the specimen to rotate and tilt during the loading process. The base slab of the specimen was directly constrained by the hydraulic jack on the side opposite to the horizontal loading point to prevent significant horizontal lateral displacement during the loading process.
The loading program for seismic performance tests of the specimens was according to the “Code for Seismic Test Methods of Buildings” (JGJ/T101-2015) [33]. A dual-control loading system, regulating both load and deformation, was utilized throughout the experiment. The testing procedure commenced with a preliminary load application of 5 kN to verify the integrity and functionality of the testing apparatus. Subsequently, low-cycle repeated loading was administered through a hydraulic servo actuator to the upper one-third section of the sidewall. During the initial stage of testing, load-controlled cyclic loading was implemented, and each loading cycle is repeated once. Following the yielding of the internal reinforcement within the sidewall, displacement-controlled loading was implemented. The load-controlled stage employed a cyclic loading increment of 5 kN. Upon specimen yielding, displacement-controlled loading was initiated. In this stage, each displacement loading cycle was applied three times until the load decreased to 85% of the peak load. The yield displacement is defined as the displacement at which the sidewall first reaches yield. At this point, the ductility coefficient μ = 1, which represents the ratio of current displacement of the sidewall to the yield displacement. The experimental loading protocol is shown in Figure 12.

3. Results and Discussion

3.1. Failure Modes of Concrete Joint Connection

The final failure modes of QC1 and QC2 are shown in Figure 13a and Figure 13b, respectively. For specimen QC1, the loading process commences with an initial load of 5 kN. Upon reaching a load of 25 kN, a minor crack appears at the junction between the sidewall and the base slab. As the load increases to 30 kN, the internal steel reinforcement within the sidewall yields, accompanied by the formation of cracks on both the internal and external surfaces at the junction between the sidewall and the base slab. At this stage, the loading protocol changes from load control to displacement control. When the loading displacement is 1 Δ y ~ 2 Δ y ( Δ y = 4.55 mm), the horizontal cracks at the junction between the sidewall and the base slab exhibit significant widening, with cracks on both the inner and outer surfaces extending further upward. As the loading displacement increases to 4 Δ y , the inclined cracks on both sides of the specimen begin to propagate upward, and the existing cracks continue to develop. Upon reaching a loading displacement of 5.5 Δ y , no additional cracks are observed; however, the existing cracks widen further, and the specimen’s load-bearing capacity declines to 80% of its peak load.
For specimen QC2, the loading process commences with an initial load of 5 kN. When the load reaches −15 kN, a slight crack appears on the inner side of the junction between the sidewall and the base slab. As the load increases to −20 kN, the crack on the inner side developed into a fully penetrating horizontal crack. Upon reaching a load of 35 kN, horizontal penetrating cracks are observed on both the inner and outer sides of the joint, accompanied by the formation of non-penetrating horizontal cracks on both sides. Concurrently, the steel reinforcement on the inner side of the sidewall yields, prompting a change from load control to displacement control. When the loading displacement is 1 Δ y ~ 3 Δ y ( Δ y = 4.55   mm ), multiple inclined cracks emerge on both sides of the joint, and non-penetrating horizontal cracks appear on the base slab. As the loading displacement increases to 4.5 Δ y , the existing cracks progressively widen, and concrete at the outer corner begins to spall. As the loading displacement reaches 6.5 Δ y , the cracks on both sides continue to propagate vertically, the concrete at the joint experiences spalling, and the grouting sleeve becomes exposed. At this stage, the specimen exhibited severe damage, with its load-bearing capacity declining to 74% of the peak load, leading to the termination of the loading process.
The failure mode of the concrete joint connection in this study can be concluded as follows. Despite the difference in construction methods—one being prefabricated and the other cast-in-place—both specimens exhibited similar behavioral stages: the initial cracking stage, the crack propagation stage, and the final failure stage. Cracks predominantly develop at the junction between the sidewall and the base slab. The primary cause of the specimen’s loss of bearing capacity is the yielding of the longitudinal reinforcement in the sidewall and the crushing of the concrete. During the initial loading stage, the longitudinal reinforcement in the sidewall transmits forces via the bond between the steel bars and the concrete. As the load increases, the strain in the steel bars increases, causing further elongation of the longitudinal reinforcement in the sidewall. Consequently, the bond stress between the steel bars and the concrete is gradually diminished. The yield zone begins to shift to the junction between the sidewall and the base slab, where cross-inclined and horizontal cracks progressively formed. For the QC1, horizontal cracks initially appear on the inner side of the junction between the sidewall and the base slab. As loading progressed, horizontal cracks developed on both sides, followed by the formation and extension of cross-inclined cracks on both surfaces. For the QC2, it exhibits minor cracks on the inner side during the early stage of loading. With further loading, horizontal penetrating cracks and oblique cracks emerge on both the inner and outer sides. Ultimately, concrete spalling occurs, exposing the grouting sleeve. Both the QC1 and the QC2 ultimately failed in a bending–shear failure mode. In addition to the primary cracks concentrated at the junction between the base slab and the sidewall, secondary cracks were observed in the central region of the base slab in both QC1 and QC2 specimens. These cracks are mainly attributed to the incomplete idealization of the boundary constraints at the base slab supports, which allowed uplift deformation during cyclic loading. The upward bending deformation induced tensile stresses at the bottom surface of the base slab, resulting in the initiation of cracks in the central region. Although these cracks were relatively minor compared to the slab–wall junction cracks, they reveal the influence of non-ideal boundary conditions and complex stress redistributions under cyclic lateral actions.

3.2. Hysteresis Performance

The load–displacement hysteresis curves of QC1 and QC2 are shown in Figure 14, where force and displacement are measured in the loading direction of the actuator. From Figure 14a, it is observed that the hysteresis curve of the QC1 exhibits predominantly linear behavior during the initial loading stage, indicating primarily elastic deformation, with no visible cracks on the specimen’s surface. As the load increases, residual plastic deformation escalates, and the hysteresis loop begins to form a bow shape. Upon yielding, the shape of the hysteresis loop transitions from a bow shape to an anti-S shape, with plastic deformation intensifying and the enclosed area gradually expanding. This behavior results from the repeated tension and compression of the longitudinal reinforcement in the sidewall. Slip occurs in the core region, concrete cracks propagate, specimen damage accumulates, and stiffness degrades significantly. Upon reaching the peak load, the cracking of the concrete at the joint causes the curve’s slope to decrease further, residual deformation to increase, and the hysteresis loop area to expand until the specimen fails. From Figure 14b, it is evident that the hysteresis curve of the QC2 differs significantly from that of the QC1. In the initial loading stage, the behavior is similar to that of the QC1. As the load increases, the shape of the hysteresis loop shifts from a bow shape to a reverse S shape, cracks in the specimen increase, steel bar slip occurs, and residual plastic deformation intensifies. At peak load, concrete at the junction between the sidewall and the base slab spalls off, steel bar slip becomes pronounced, and the hysteresis curve adopts a clear Z shape. As the cycle count increases, the hysteresis curve experiences significant pinching, and steel bar slip intensifies until the specimen fails.
A comparison of the hysteresis curves of the two specimens reveals that both specimens undergo a typical failure progression, characterized by an initial ascending stage to the maximum load, followed by a gradual decline. During the initial loading stage, the specimen remains in the elastic stage, exhibiting an increasing bearing capacity and a relatively small hysteresis loop area. As loading progresses, surface cracks initiate on the specimen, followed by pinching of the hysteresis loops, which is primarily attributed to the relative slip between the reinforcing steel bars and the surrounding concrete. The hysteresis curve adopts an inverted S shape, with the area of each loop progressively expanding, indicating an enhancement in the specimen’s energy dissipation capacity. Specifically, the hysteresis curve of the QC1 evolves from a bow shape into an anti-S shape. In contrast, the hysteresis loop of the QC2 predominantly exhibits an anti-S shape and a Z shape. The hysteresis curve of the cast-in-place specimen demonstrates greater completeness compared to that of the prefabricated specimen.

3.3. Skeleton Curve

The load–displacement skeleton curve of the specimen is obtained by connecting the maximum load points of the first loading cycle at each stage of the hysteresis curve. The skeleton curves for specimens are illustrated in Figure 15. It is shown that the loading behavior of the specimens can be divided into three stages. In the elastic stage, both load and displacement exhibit an approximately linear relationship, with the bearing capacity increasing continuously. During this stage, no cracks are observed in the QC1, whereas the QC2 begins to develop cracks after being loaded to 15 kN. In the elastic–plastic stage, as displacement increases, the bearing capacity gradually attains its maximum value, and the curve begins to decline after reaching the peak load. Although the bearing capacity decreases, it has not yet reached the limit, and the specimen continues to function normally. In the plastic stage, the concrete members can no longer perform normally, and the bearing capacity drops to 85% of its peak value, marking the onset of complete specimen failure.
The skeleton curve analysis reveals different trends of the QC1 specimen. The bearing capacity demonstrates a gradual degradation pattern during forward loading cycles, maintaining over 85% of its peak load until test termination. Conversely, reverse loading induces significant capacity reduction, reaching precisely 85% of peak load magnitude. The reason is that the base slab is positioned to the right of the sidewall, providing a reinforcing effect on the bearing capacity, thereby leading to a slower decrease during forward loading. This also explains why the forward maximum bearing capacity of the QC2 prefabricated specimen is higher than the reverse maximum bearing capacity.
In this study, the toughness ratio is defined as the ratio of the maximum strength to the yield strength. This parameter is analogous to the concept of the moment overstrength factor proposed by Paulay and Priestley [34], both serving as indicators to evaluate the strength reserve and ductility capacity of structural members under seismic actions. By controlling and utilizing this ratio, designers can guide the development of desired plastic mechanisms during earthquakes and thus enhance the overall seismic performance of structures. As presented in Table 5, the positive and negative yield loads, as well as the peak loads of QC2, are lower than those of QC1 cast-in-place specimens. The strength-to-yield ratios of the QC1 and QC2 are 1.79 and 1.94, respectively. Comparison of the two specimens reveals that the reverse yield load of the QC1 cast-in-place specimens is 22.70% higher than that of the QC2 prefabricated specimens. The ultimate load increases by 7.76%, the positive yield load by 11.71%, and the ultimate load by 9.13%, indicating that the bearing capacity of the cast-in-place specimens is higher than that of the prefabricated specimens. This is attributed to the better structural integrity of the cast-in-place specimens, however, joints formed during the fabrication and installation of prefabricated specimens create potential weak links, thereby affecting the overall bearing capacity.

3.4. Rigidity Degeneration

Stiffness degradation represents a critical parameter for evaluating the seismic performance of structural components. The stiffness can be calculated as the ratio of the sum of the absolute values of the peak loads in both directions to the sum of the absolute values of the corresponding peak displacements during each loading cycle [35]. The stiffness calculation is given by:
K n = + F n + F n + X n + X n
where Fi represents the peak load in the positive direction during the N-stage loading process; −Fi is the peak load in the negative direction during the N-stage loading process; Xi is the positive peak displacement in the N-th cycle; −Xi is the peak displacement in the negative direction during the N-th cycle.
The stiffness corresponding to each stage of each specimen can be calculated using Formula (6), and a stiffness degradation curve can be generated. As shown in Figure 16, stiffness degradation is most pronounced at the initial loading stage, with a sharp decrease in stiffness. After yielding, stiffness degradation slows down, and the stiffness becomes stable at the final failure stage. Comparing the QC1 with the QC2, the initial stiffness of the cast-in-place specimen is the highest due to the absence of joints in the cast-in-place specimen, providing greater structural integrity. However, there is no significant difference in stiffness between the yield and failure stages, mainly because the addition of shear steel plates to the prefabricated specimen serves to increase its stiffness, making it comparable to the cast-in-place specimen.

3.5. Energy Dissipation Capacity

Energy dissipation capacity serves as a fundamental parameter for evaluating the seismic performance of structural components. The energy absorption capacity is represented by the area enclosed within the hysteresis loop. During the elastoplastic stage, the energy dissipation characteristics significantly influence the overall seismic behavior. Three primary metrics are conventionally employed to assess energy dissipation capacity: cumulative energy dissipation, one-cycle energy dissipation, and the equivalent viscous damping coefficient. The area enclosed by a single cycle in the hysteresis curve corresponds to the amount of hysteretic energy dissipation per loading cycle, known as one-cycle energy dissipation. By accumulating the one-cycle energy dissipation, cumulative energy dissipation is obtained. According to the following equation:
h e = U U E = S A B D + B C D S A O F + C O E × 1 2 π
S A B D + B C D is the unrecoverable energy absorbed by the specimen during primary loading; S A O F + C O E is the total deformation energy of the specimen in one level of loading.
In the calculation of the equivalent viscous damping coefficient, the unrecoverable energy U refers to the energy dissipated through hysteretic behavior during a complete loading–unloading cycle, represented by the area enclosed by the hysteresis loop. The total deformation energy UE corresponds to the ideal elastic energy stored at the maximum displacement, obtained as the area under the secant line to the peak load points. The equivalent viscous damping coefficient is illustrated in Figure 17. The energy dissipation characteristics for the QC1 and the QC2 are presented in Figure 18 and Figure 19, respectively.
As illustrated in Figure 18 and Figure 19, both prefabricated and cast-in-place specimens exhibit similar trends in cumulative and single-cycle energy consumption. As the number of cycles increases, the one-cycle energy consumption gradually rises. In the force control stage, single-cycle energy consumption increases gradually, while in the displacement control stage, it rises more rapidly. Simultaneously, single-cycle energy consumption decreases locally as the number of cycles increases in the displacement control stage. This is primarily due to the peak strength being lower during the third cycle of a constant displacement, leading to a reduction in single-cycle energy consumption. Quantitative analysis reveals performance differences between specimen types, as presented in Table 6. The QC2 exhibits 28.65% higher cumulative energy dissipation at yield load compared to the QC1. Furthermore, the total cumulative energy dissipation of QC2 with steel plate reinforcement exceeds that of QC1 specimens by 16.34%, attributable to the increased reinforcement area provided by the shear steel plates in the novel assembled connection system.
The equivalent viscous damping coefficients calculated in this test are presented in Table 7, corresponding to the cracking load, yield point, peak point, and limit point during negative loading. As shown in Table 7, before yielding, the equivalent viscous damping coefficient of the QC2 is 16.19% higher than that of the QC1, indicating the reinforcing role of the shear steel plate in the specimen connection. From the yield to the peak stage, the equivalent viscous damping coefficient of the QC2 is 25.45% lower than that of the QC1, with a further reduction of 16.04% from peak to failure. This suggests that, after the yield load, the concrete at the sidewall–base slab connection is damaged, and reinforcement slip becomes significant. The equivalent viscous damping coefficient of the prefabricated specimen is lower than that of the cast-in-place specimen.

3.6. Ductility Analysis

Ductility, a fundamental mechanical property of concrete structural members, is typically expressed through the ductility coefficient. The ultimate displacement is defined as the displacement corresponding to the degradation of the specimen’s maximum bearing capacity in both positive and negative loading directions to 85% of its peak value. The yield point cannot be determined by merely observing the skeleton curve. Due to the positive and negative bearing capacities of the prefabricated channel specimen differ under positive and negative loadings, these loads must be calculated separately. Yield displacement is determined using the energy equivalent method, while the ultimate displacement corresponds to the point where the maximum bearing capacity in both the positive and negative directions reduces to 85%. Table 8 presents the calculated characteristic parameters for both specimen types. The analysis reveals that the QC2 exhibits a 52.00% higher ductility coefficient compared to the QC1. This enhanced performance occurs despite the QC2 specimen’s smaller yield and ultimate displacements, which can be attributed to the mechanical contribution of the shear steel plate connection. The steel plate reinforcement system improves bond strength at the connection interface and effectively mitigates longitudinal reinforcement slippage, thereby enhancing both ductility performance and seismic resistance capacity. Similar findings were reported by Guo et al. [36], where composite shear walls with embedded steel plates exhibited generally higher ductility coefficients (maximum displacement/yield displacement) and improved seismic deformation capacity under cyclic loading.

4. Conclusions

This study conducts comprehensive seismic performance on scaled-down models of both cast-in-place and prefabricated concrete channels. The experimental investigation examines multiple structural performance indicators, including failure modes, hysteresis behavior, skeleton curves, stiffness degradation, ductility, and energy dissipation capacity of the joints. The results are as follows:
(1) Both cast-in-place and prefabricated specimens exhibit bending–shear failure as their ultimate failure mode. The primary failure zones in both specimen types are located at the connection between the sidewall and base slab, where cross and horizontal cracks develop in the core area, and the joint area experiences significant stress.
(2) The cast-in-place specimen exhibits the highest initial stiffness, due to the absence of joints in comparison to the prefabricated specimen. However, the addition of shear steel plates to the prefabricated specimen effectively increases its stiffness by enhancing the reinforcement, resulting in similar stiffness between the prefabricated and cast-in-place specimens during both the yield and failure stages.
(3) The equivalent viscous damping coefficient of the prefabricated specimen is 16.04% lower than that of the cast-in-place specimen from peak to failure. However, the shear steel plate enhances the energy dissipation capacity of the prefabricated specimen, as evidenced by a 16.34% higher total energy consumption compared to the cast-in-place specimen.
(4) Although the yield and ultimate displacements of the prefabricated specimen are smaller than those of the cast-in-place specimen, the shear steel plate connection enhances bond strength and reduces longitudinal reinforcement slip. Consequently, the ductility coefficient of the prefabricated specimen is 52.00% higher, indicating superior seismic capacity.
Although the experimental results demonstrate the promising seismic performance of the proposed innovative connection system, it is important to note that the findings are derived from a single specimen test. Therefore, further investigations involving multiple specimens and varied test conditions are necessary to fully validate the structural reliability, durability, and practical applicability of the connection system in prefabricated concrete channels.

Author Contributions

Conceptualization, G.Z. and Y.S.; methodology, Z.W. (Zhihao Wang); Software, G.Z. and Z.W. (Zhiqi Wang); validation, W.M. and Y.S.; formal analysis, Z.W. (Zhiqi Wang); investigation, L.L.; resources, L.L. and Y.L.; data curation, W.M.; writing—original draft preparation, Z.W. (Zhiqi Wang); writing—review and editing, G.Z. and Y.S.; visualization, Y.L.; supervision, Z.W. (Zhihao Wang); project administration, Y.Z.; funding acquisition, L.L. and Y.Z. All authors have read and agreed to the published version of the manuscript.

Funding

This research was funded by the Key Science and Technology Foundation of Henan Province (No. 252102231073 and No. 252102321148).

Data Availability Statement

The original contributions presented in this study are included in the article. Further inquiries can be directed to the corresponding author.

Acknowledgments

The authors would like to acknowledge Henan Modern Construction Technology Co., Ltd. in terms of prefabricated specimen preparation.

Conflicts of Interest

Author Yibo Li was employed by the company Yellow River Engineering Consulting Co., Ltd. Author Luming Li and Yanping Zhou were employed by the company Henan Provincial Water Conservancy Technology Application Centre. The remaining authors declare that the research was conducted in the absence of any commercial or financial relationships that could be construed as a potential conflict of interest.

References

  1. Liu, Z.J. Application of new prefabricated channel in farmland water conservancy project. South. Agric. 2021, 15, 210–211. [Google Scholar]
  2. Liu, C.S.; Zhang, J.K.; Zheng, J.; Wu, C. Application of new prefabricated channel in farmland water conservancy project. Anhui Agric. Sci. 2021, 49, 194–197+229. [Google Scholar]
  3. Li, W.T.; Yang, Q.G. Analysis of the application advantages of prefabricated channel structures. Water Conserv. Tech. Superv. 2021, 5, 122–124. [Google Scholar]
  4. Li, C.Y.; Wang, H.Y.; Wang, X.D.; Li, X.F. Design concept and practicality of prefabricated aqueduct-type agricultural channels. China Rural Water Hydropower 2015, 7, 131–133+136. [Google Scholar]
  5. Lühr, S.; Stephan, C.; Westendarp, A.; Kunz, C. Use of precast reinforced concrete elements in massive hydraulic engineering. Bautechnik 2020, 97, 404–414. [Google Scholar] [CrossRef]
  6. Guo, X.; Nie, L.; Ji, J.; Chen, W.; Li, Y.; Liu, X. Effect of connection methods on hygrothermal performance of prefabricated concrete building walls. J. Build. Eng. 2024, 90, 109518. [Google Scholar] [CrossRef]
  7. Liu, J.; Liu, Y.; Yu, D. Experimental and numerical studies on the seismic performance of new assembled concrete frame beam–column joints. Buildings 2023, 13, 329. [Google Scholar] [CrossRef]
  8. Zhao, F.; Xiong, F.; Cai, G.; Ge, Q.; Larbi, A.S. Seismic behavior and simplified hysteretic model of precast concrete wall panels with bolted connections under cyclic loading. Eng. Struct. 2023, 292, 116562. [Google Scholar] [CrossRef]
  9. Huang, W.; Miao, X.; Hu, G.; Fan, Z.; Zhang, J.; Ling, K. Experimental and shear bearing capacity studies of the assembled composite wall with bolted connections. Struct. Des. Tall Spec. Build. 2020, 29, 1722. [Google Scholar] [CrossRef]
  10. Ding, T.; Shen, K.; Tan, D.; Zhao, Y. Experimental study on seismic behaviour of fully bolted concrete shear walls. Arch. Civ. Mech. Eng. 2023, 23, 142. [Google Scholar] [CrossRef]
  11. Tullini, N.; Minghini, F. Grouted sleeve connections used in precast reinforced concrete construction–Experimental investigation of a column-to-column joint. Eng. Struct. 2016, 127, 784–803. [Google Scholar] [CrossRef]
  12. Wang, Z.; Xing, G.; Huang, J.; Chang, Z.; Luo, D. Seismic Performance of Precast Concrete Exterior Beam-Column Joint with Disc Spring Devices. J. Earthq. Eng. 2024, 28, 4408–4435. [Google Scholar] [CrossRef]
  13. Belleri, A.; Riva, P. Seismic performance and retrofit of precast concrete grouted sleeve connections. PCI J. 2012, 57, 97–109. [Google Scholar] [CrossRef]
  14. Xu, L.; Pan, J.; Guo, L. Mechanical performance of precast RC columns with grouted sleeve connections. Eng. Struct. 2022, 252, 113654. [Google Scholar] [CrossRef]
  15. Lu, Z.; Huang, J.; Dai, S.; Liu, J.; Zhang, M. Experimental study on a precast beam-column joint with double grouted splice sleeves. Eng. Struct. 2019, 199, 109589. [Google Scholar] [CrossRef]
  16. Lu, Z.; Wu, B.; Sakata, H.; Huang, J.; Zhang, M. Mechanical performance of prefabricated concrete beam-column joints with double-grouted sleeve connectors: A numerical and theoretical study. Structures 2023, 56, 104870. [Google Scholar] [CrossRef]
  17. Lei, S.; Liu, L.; Wu, F.; Lin, W.; Peng, K.; Cao, J. Seismic performance of short precast columns with UHPC grouted sleeve connections: An experimental and numerical study. Structures 2023, 55, 427–440. [Google Scholar] [CrossRef]
  18. Li, F.; Abruzzese, D.; Milani, G.; Li, S. Influence of internal defects of semi grouted sleeve connections on the seismic performance of precast monolithic concrete columns. J. Build. Eng. 2022, 49, 104009. [Google Scholar] [CrossRef]
  19. Wang, Y.; Wan, K.; Xiang, H.; Wang, J. Analysis and experimental study on mechanical properties of large-diameter grouted sleeve connections. Int. J. Geomech. 2023, 23, 04023066. [Google Scholar] [CrossRef]
  20. Lu, Z.; Wang, Z.; Li, J.; Huang, B. Studies on seismic performance of precast concrete columns with grouted splice sleeve. Appl. Sci. 2017, 7, 571. [Google Scholar] [CrossRef]
  21. Wang, G.J.; Jiang, S.Y.; Wang, G.T.; Ingham, J.M. Numerical investigation of precast concrete frames with grouted sleeves and intermediate connections. Structures 2023, 51, 1474–1496. [Google Scholar] [CrossRef]
  22. Yu, Q.; Zhang, L.; Bai, S.; Fan, B.; Chen, Z.; Li, L.-Z. Experimental study on seismic behavior of precast frame columns with vertical reinforcement spliced with grouted sleeve lapping connectors. Adv. Civ. Eng. 2021, 2021, 1549303. [Google Scholar] [CrossRef]
  23. Liu, C.; Pan, L.; Liu, H.; Tong, H.; Yang, Y.; Chen, W. Experimental and numerical investigation on mechanical properties of grouted-sleeve splices. Constr. Build. Mater. 2020, 260, 120441. [Google Scholar] [CrossRef]
  24. Li, J.; Wang, W.; Chen, P.; Chen, J.; Ma, J. Post-fire seismic performance of precast concrete columns with grouted sleeve connections: An experimental study. Structures 2024, 66, 15. [Google Scholar] [CrossRef]
  25. Ding, M.; Xu, W.; Wang, J.; Chen, Y.; Du, X.; Fang, R. Seismic performance of prefabricated concrete columns with grouted sleeve connections, and a deformation-capacity estimation method. J. Build. Eng. 2022, 55, 104722. [Google Scholar] [CrossRef]
  26. Zhi, Q.; Yuan, Z.; Zheng, Y.; Jia, L.; Guo, Z. Experimental research on seismic performance of precast concrete shear walls with a novel grouted sleeve used in the connection. J. Earthq. Eng. 2024, 28, 1379–1403. [Google Scholar] [CrossRef]
  27. Guo, X.M. Design, Fabrication, and Construction of Prefabricated Concrete Structures; China Machine Press: Beijing, China, 2017. [Google Scholar]
  28. ACI 318-14; Building Code Requirements for Structural Concrete and Commentary. American Concrete Institute: Farmington Hills, MI, USA, 2014.
  29. JGJ 1-2014; Technical Specification for Prefabricated Concrete Structures. Architecture & Building Press: Beijing, China, 2014.
  30. GB/T 50081-2016; Standard for Test Methods of Mechanical Properties of Ordinary Concrete. Architecture & Building Press: Beijing, China, 2016.
  31. GB/T 228.1-2021; Metallic Materials Tensile Testing Part 1: Method of Test at Room Temperature. Standards Press: Beijing, China, 2022.
  32. GB/T 17671-2021; Test Method for Strength of Cement Mortar (ISO Method). Standards Press: Beijing, China, 2021.
  33. JGJ/T 101-2015; Standard for Seismic Test Methods of Buildings. Architecture & Building Press: Beijing, China, 2015.
  34. Paulay, T.; Priestley, M.J.N. Seismic Design of Reinforced Concrete and Masonry Buildings; Wiley: New York, NY, USA, 1992. [Google Scholar]
  35. ATC Applied Technology Council. Improvement of Nonlinear Static Seismic Analysis Procedures; Applied Technology Council: Redwood City, CA, USA, 2005. [Google Scholar]
  36. Guo, Z.; Yuan, Y. Experimental study of steel plate composite shear wall units under cyclic load. Int. J. Steel Struct. 2015, 15, 515–525. [Google Scholar] [CrossRef]
Figure 1. Prototype 3D dimension (a) and reinforcement Detailing Drawing (b). (Unit: mm).
Buildings 15 01581 g001
Figure 2. Detailed drawing of specimen reinforcement: (a) QC1 cast-in-place specimen reinforcement plan; (b) QC2 prefabricated specimen reinforcement. (Unit: mm).
Buildings 15 01581 g002
Figure 3. Nodal detail of test piece: (a) QC1 cast-in-place specimens; (b) QC2 prefabricated specimens.
Buildings 15 01581 g003
Figure 4. Joint construction process: (a) prefabricated base plate incorporating shear-resistant steel plate; (b) Grout connection between base plate and sidewall; (c) prefabricated specimen.
Buildings 15 01581 g004
Figure 5. Strain gauge attaching method.
Buildings 15 01581 g005
Figure 6. Specimen preparation: (a) QC1 cast-in-place specimens; (b) QC2 prefabricated specimens.
Buildings 15 01581 g006
Figure 7. Displacement meter arrangement schematic.
Buildings 15 01581 g007
Figure 8. Basic performance test of concrete materials: (a) Measurement of fc test; (b) Measurement of fcu test.
Buildings 15 01581 g008
Figure 9. Mechanical properties test of reinforcing steel: (a) Universal testing; (b) Tensile test procedure machines.
Buildings 15 01581 g009
Figure 10. Mechanical properties tests of grouting material: (a) Pressure testing machines; (b) Fluidity testing.
Buildings 15 01581 g010
Figure 11. Diagram of test loading device: (a) The experimental platform for seismic performance test; (b) Front view; (c) Rear view; (d) External sidewall mounting fixing plan; (e) Side view.
Buildings 15 01581 g011
Figure 12. Experimental loading protocol applied in this study.
Buildings 15 01581 g012
Figure 13. Specimen damage pattern: (a) Damage pattern of QC1 cast-in-place specimens; (b) Damage pattern of QC2 prefabricated specimens.
Buildings 15 01581 g013
Figure 14. Hysteresis curves of cast-in-place and prefabricated specimens: (a) Specimen QC1 hysteresis curve; (b) Specimen QC2 hysteresis curve.
Buildings 15 01581 g014
Figure 15. Skeleton curves of cast-in-place and prefabricated specimens: (a) Specimen QC1 skeleton curve; (b) Specimen QC2 skeleton curve; (c) Skeleton curve comparison.
Buildings 15 01581 g015
Figure 16. Stiffness degradation curve.
Buildings 15 01581 g016
Figure 17. Schematic diagram of equivalent viscous damping coefficients.
Buildings 15 01581 g017
Figure 18. QC1 energy consumption diagram for cast-in-place specimens: (a) Energy consumption per cycle for specimen QC1; (b) Cumulative energy consumption of specimen QC1.
Buildings 15 01581 g018
Figure 19. QC2 energy consumption diagram for prefabricated specimens: (a) Energy consumption per cycle for specimen QC2; (b) Cumulative energy consumption of specimen QC2.
Buildings 15 01581 g019
Table 1. Main design parameters of the specimens.
Specimen NumberSidewall ReinforcementBase Plate ReinforcementSidewall and Base Plate Connection MethodArea of Vertical Reinforcement Inside and Outside of Sidewalls (mm2)
QC1HRB400HRB400Cast-in-placeOuter side 339.3
Inner side 339.3
QC2HRB400HRB400Semi-grouted sleeve and shear-resistant steel plate combination connectionOuter side 339.3
Inner side 339.3
Table 2. Properties of concrete materials.
Pouring PartStrength Class f c u / MPa f c / MPa E / MPa
QC1 cast-in-place specimenC3034.529.63.12 × 104
QC2 sidewall prefabricated sectionC3036.731.43.18 × 104
QC2 base plate prefabrication sectionC3033.428.63.09 × 104
Note: f c u is the concrete cubic compressive strength; f c is the concrete prismatic compressive strength; E is the concrete elastic modulus.
Table 3. Properties of rebar materials.
Reinforcing Steel Grade d / mm f y / MPa f u / MPa
HRB40012437.9616.1
HRB40012435.1612.3
HRB40012439.6618.4
Note: d is the diameter of the reinforcement; f y is the yield strength of the reinforcement; f u is the ultimate strength of the reinforcement.
Table 4. Compressive strength and fluidity of grouting material.
Typology f 28 d Average Value (MPa) m 30 / mm
10887.387.4345
10888.4
10886.5
Note: m 30 is the 30 min flow of grouting material; f 28 d is the 28d compressive strength of grouting material.
Table 5. Characteristic values of bearing capacity.
Specimen NameOrientationYield Load (kN)Peak Load (kN)Toughness RatioAverage Value
QC1Forward47.4077.701.641.79
Reverse−33.13−63.901.93
QC2Forward42.4371.201.671.94
Reverse−27.00−59.302.20
Table 6. Statistics of cumulative energy consumption of specimens.
Specimen NumberConnection MethodArea of Longitudinal Reinforcement in Sidewalls (mm2)Cumulative Energy Consumption Before Yielding (J)Total Energy Consumption (J)
QC1Cast-in-place678.6216.417,062.4
QC2Semi-grouted sleeves and shear-resistant steel plates678.6278.419,851.0
Table 7. Equivalent viscous damping coefficients.
Specimen NumberMean Value of Equivalent Viscous Damping Coefficient at Each Stage
Prior to Yielding of the SpecimenYield to PeakPeak to Destruction
QC10.1050.1100.106
QC20.1220.0820.089
Table 8. Parameters of feature points of the specimen.
Specimen NumberLoad DirectionYield PointPeak PointDisruption Point μ μ ¯
P Y / kN Δ Y / mm P m / kN Δ M / mm P u / kN Δ u / mm
QC1Forward57.4016.9477.722.9473.624.751.462.25
Reverse−33.13−8.29−63.9−15.98−47.1−25.213.04
QC2Forward41.437.9571.213.6752.428.983.653.42
Reverse−27.00−9.32−59.3−20.47−48.7−29.613.18
Note: P y is the yield load; Δ y is the yield displacement; P m is the peak load; Δ m is the peak displacement; P u is the damage load; Δ u is the damage displacement; μ = Δ u / Δ y is the ductility coefficient; μ ¯ is the positive and negative mean values of the ductility coefficient.
Disclaimer/Publisher’s Note: The statements, opinions and data contained in all publications are solely those of the individual author(s) and contributor(s) and not of MDPI and/or the editor(s). MDPI and/or the editor(s) disclaim responsibility for any injury to people or property resulting from any ideas, methods, instructions or products referred to in the content.

