
Experimental Study on Reinforcement Properties of Tension-Resistant Reinforced Soil Retaining Wall


Abstract
1. Introduction
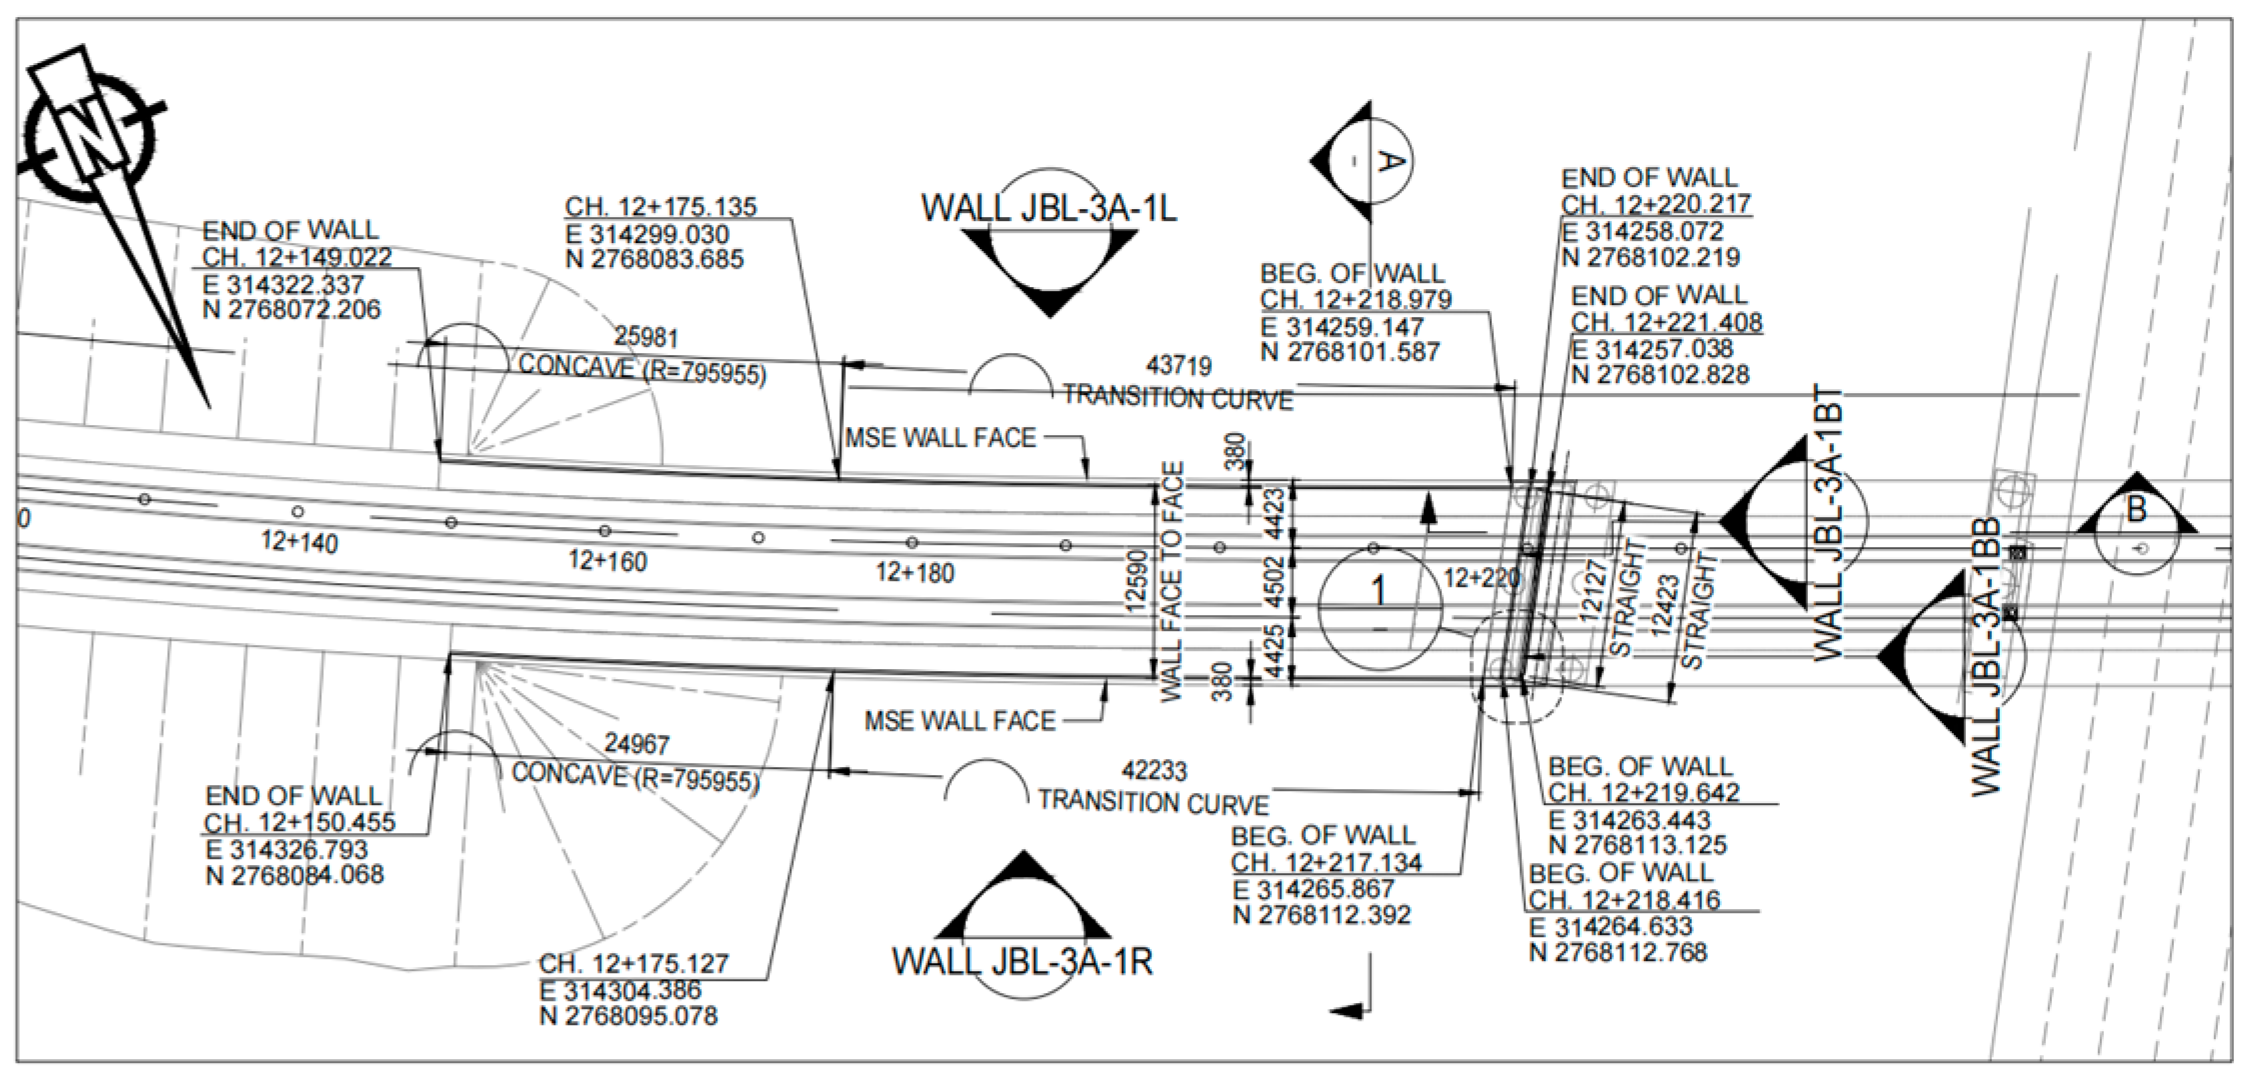
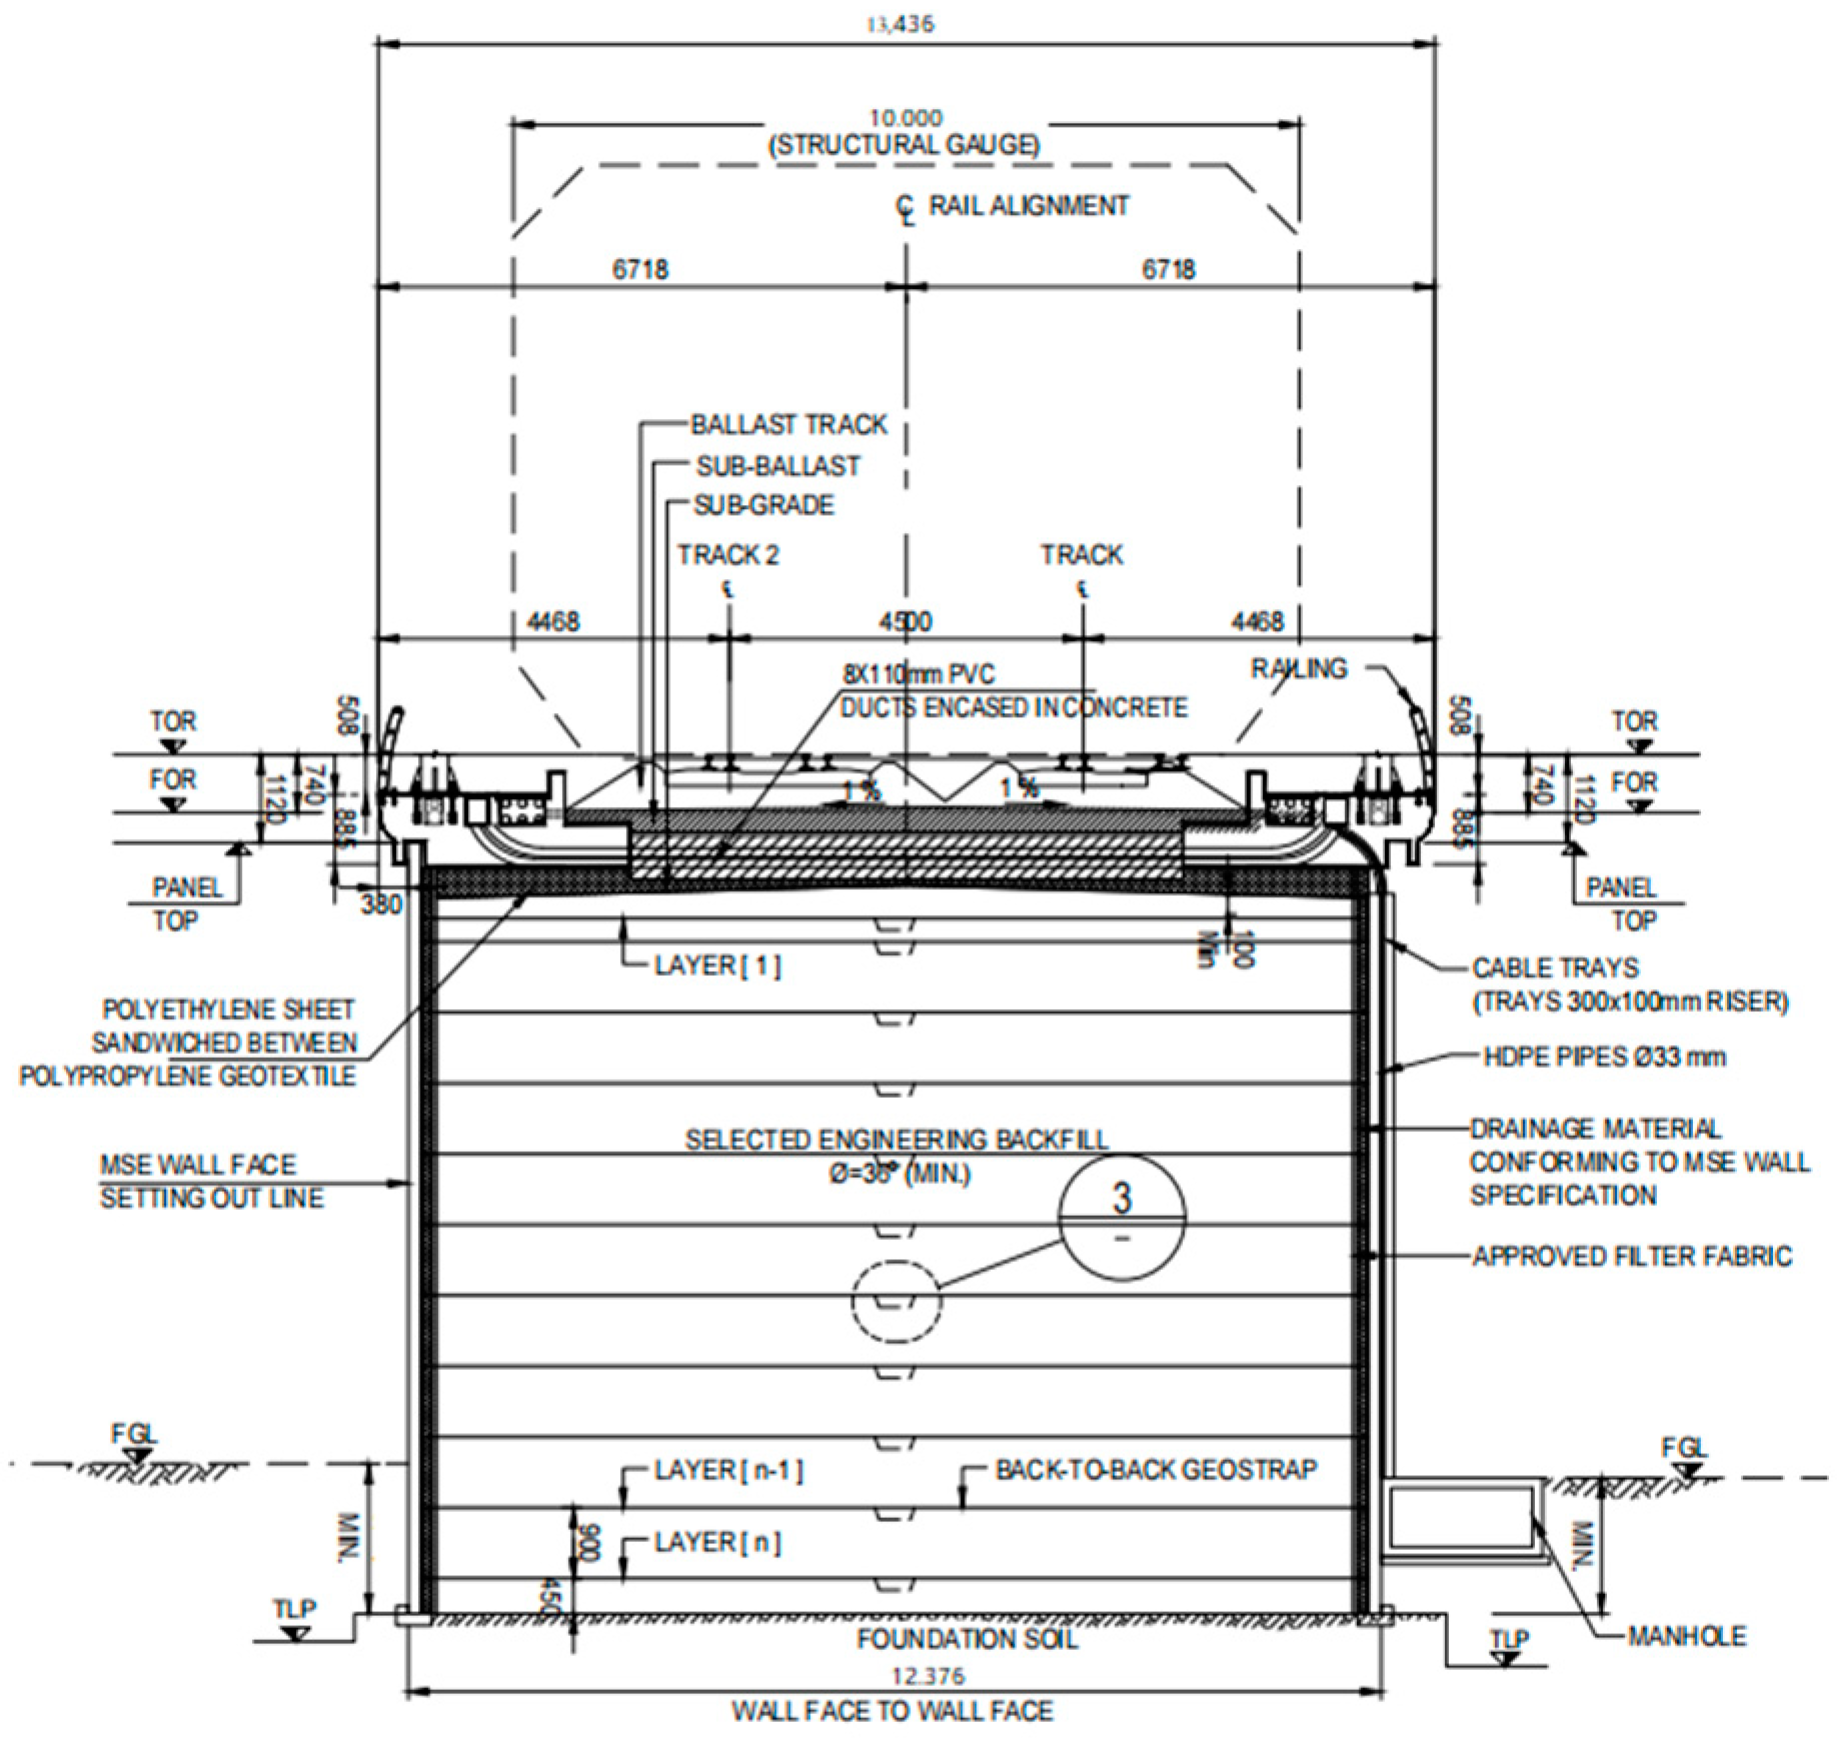
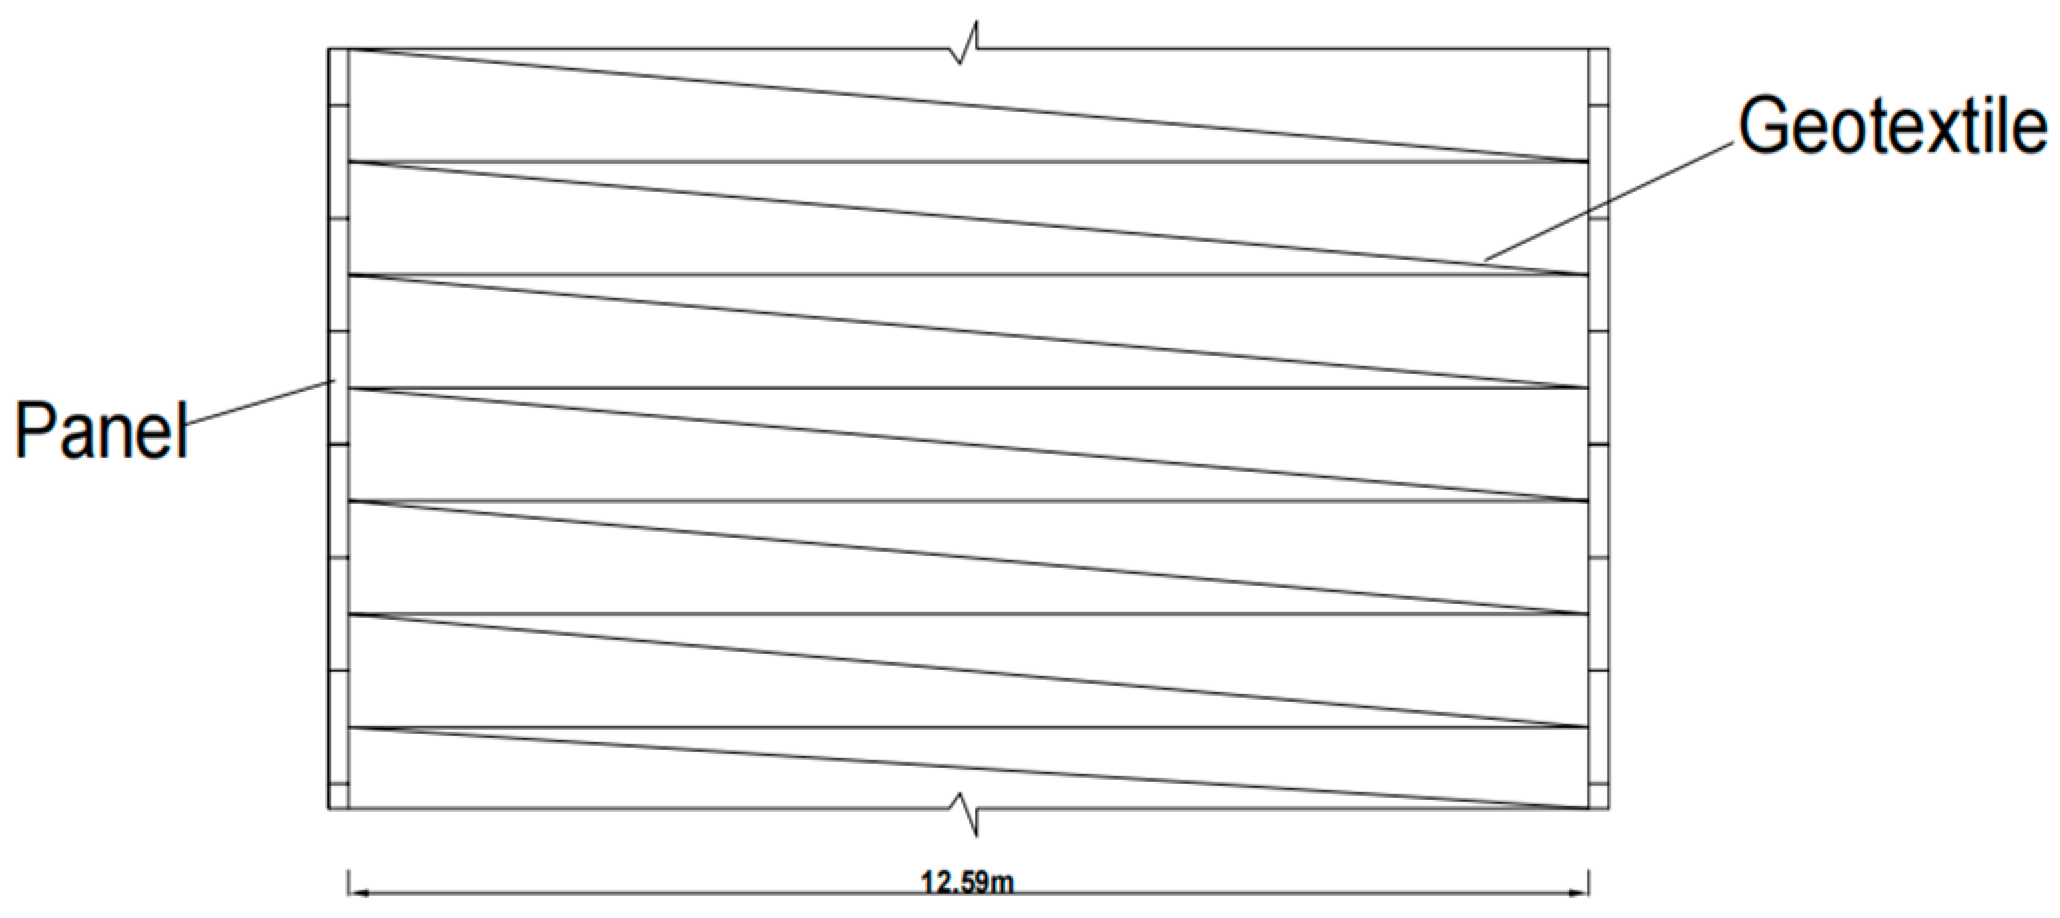
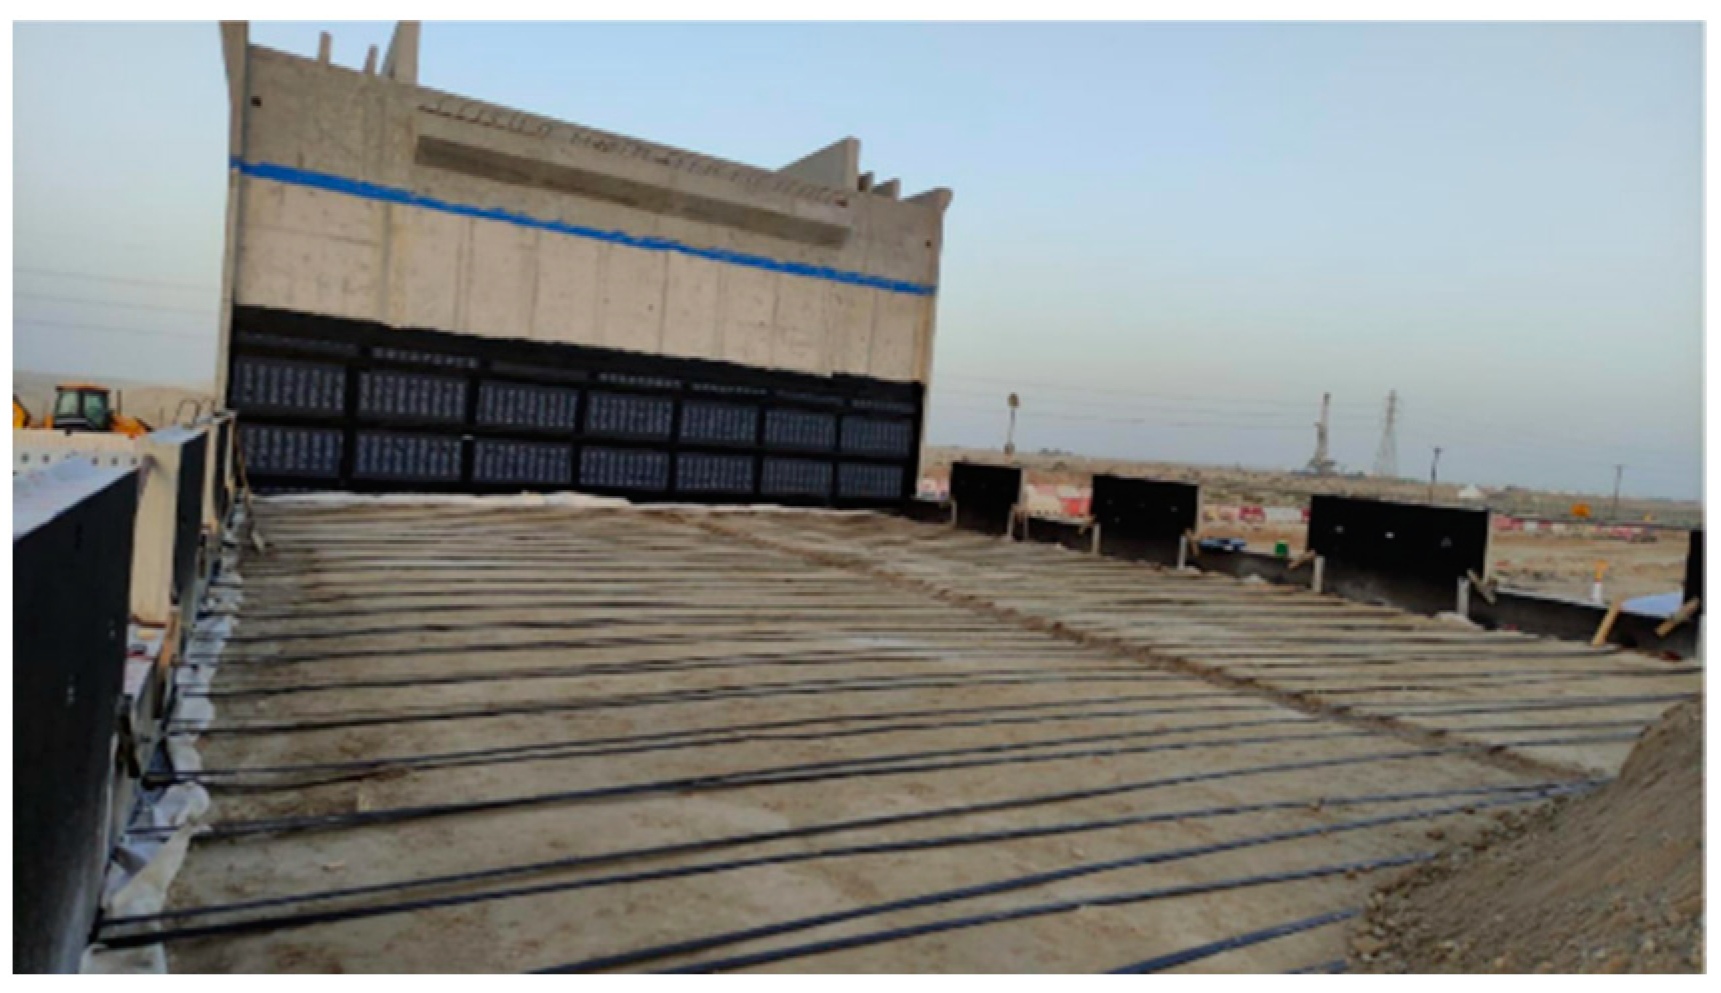
2. Project Overview
3. Experimental Study on Tensile Strength of Reinforcement Materials
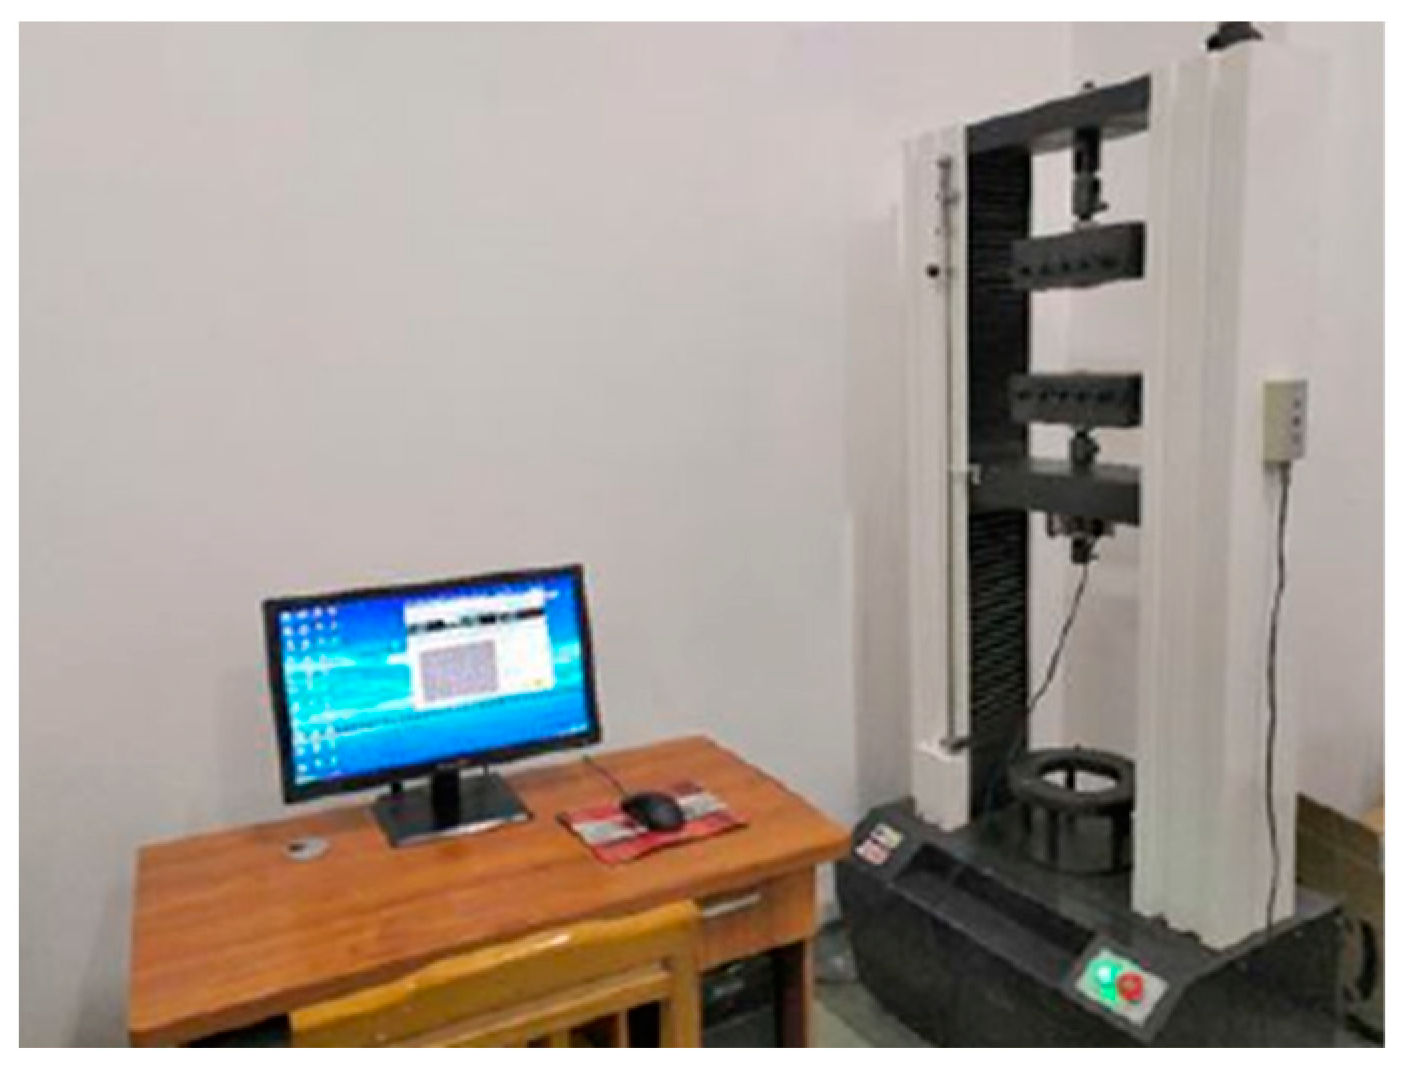
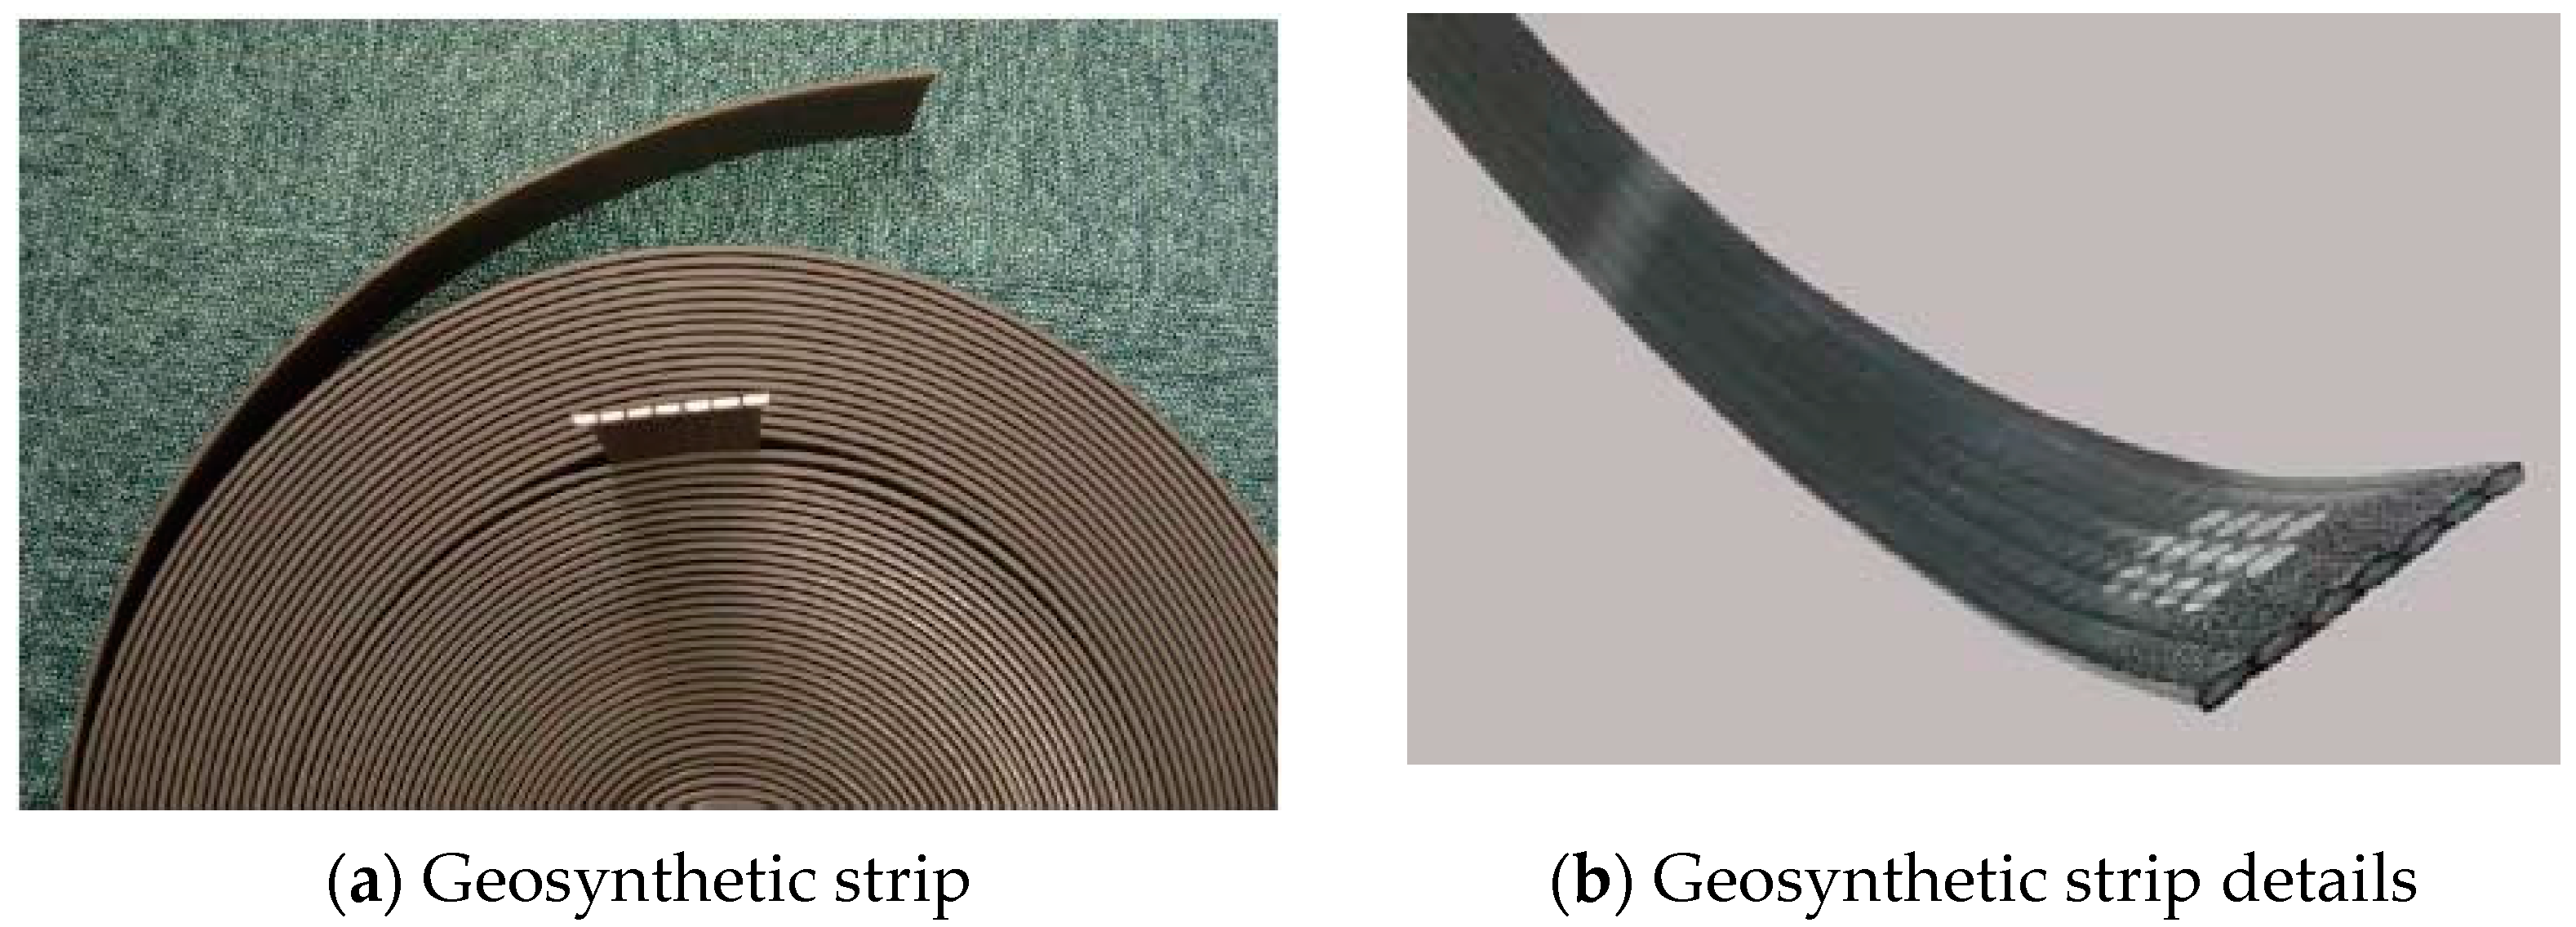
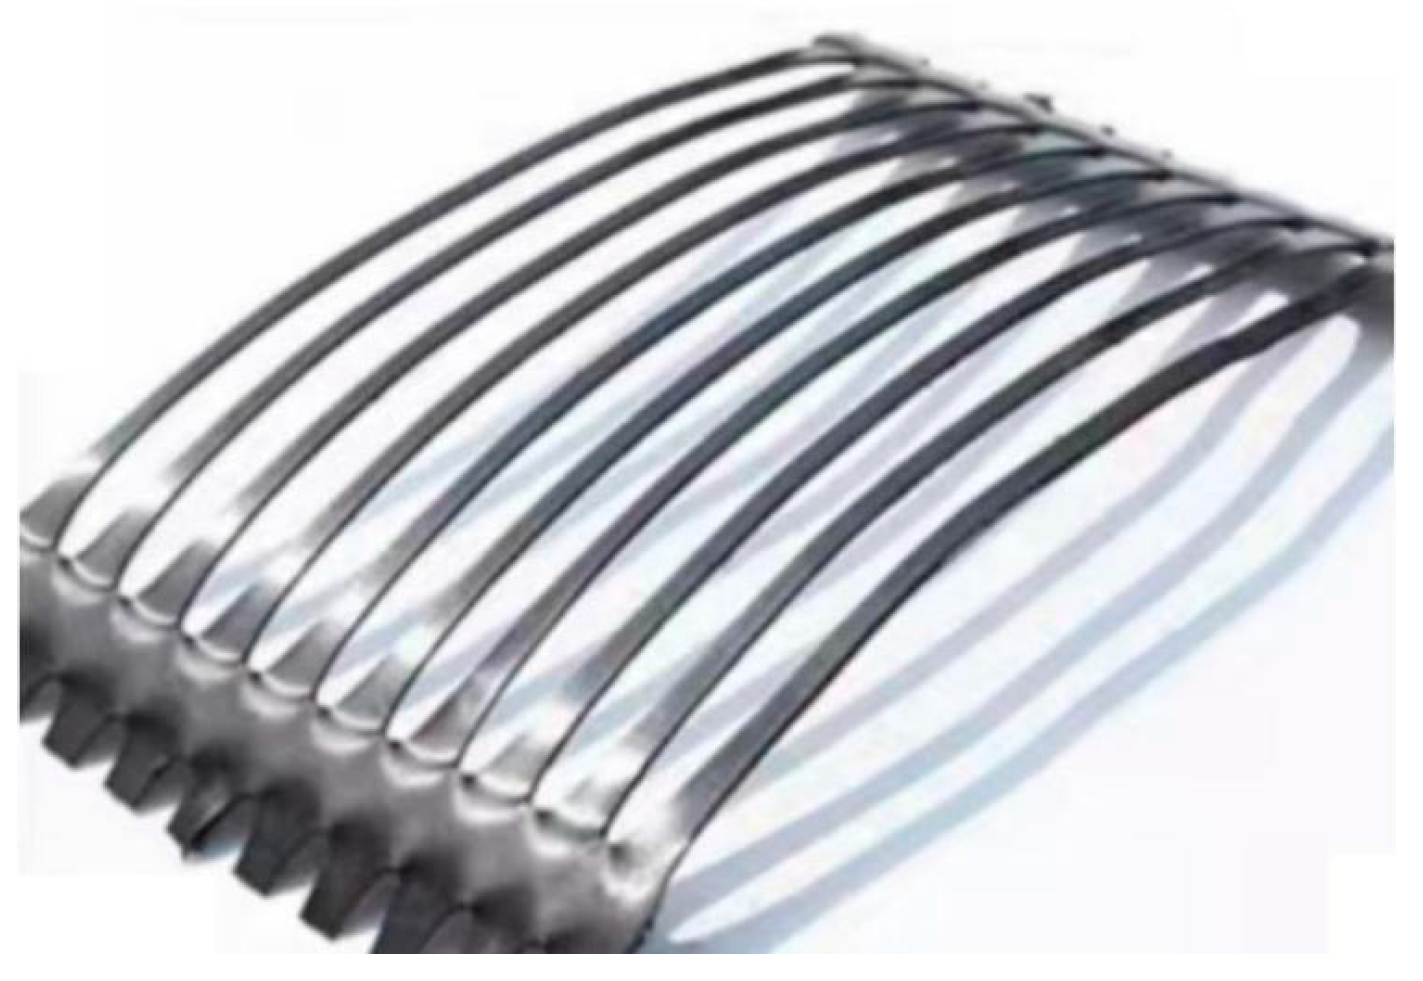
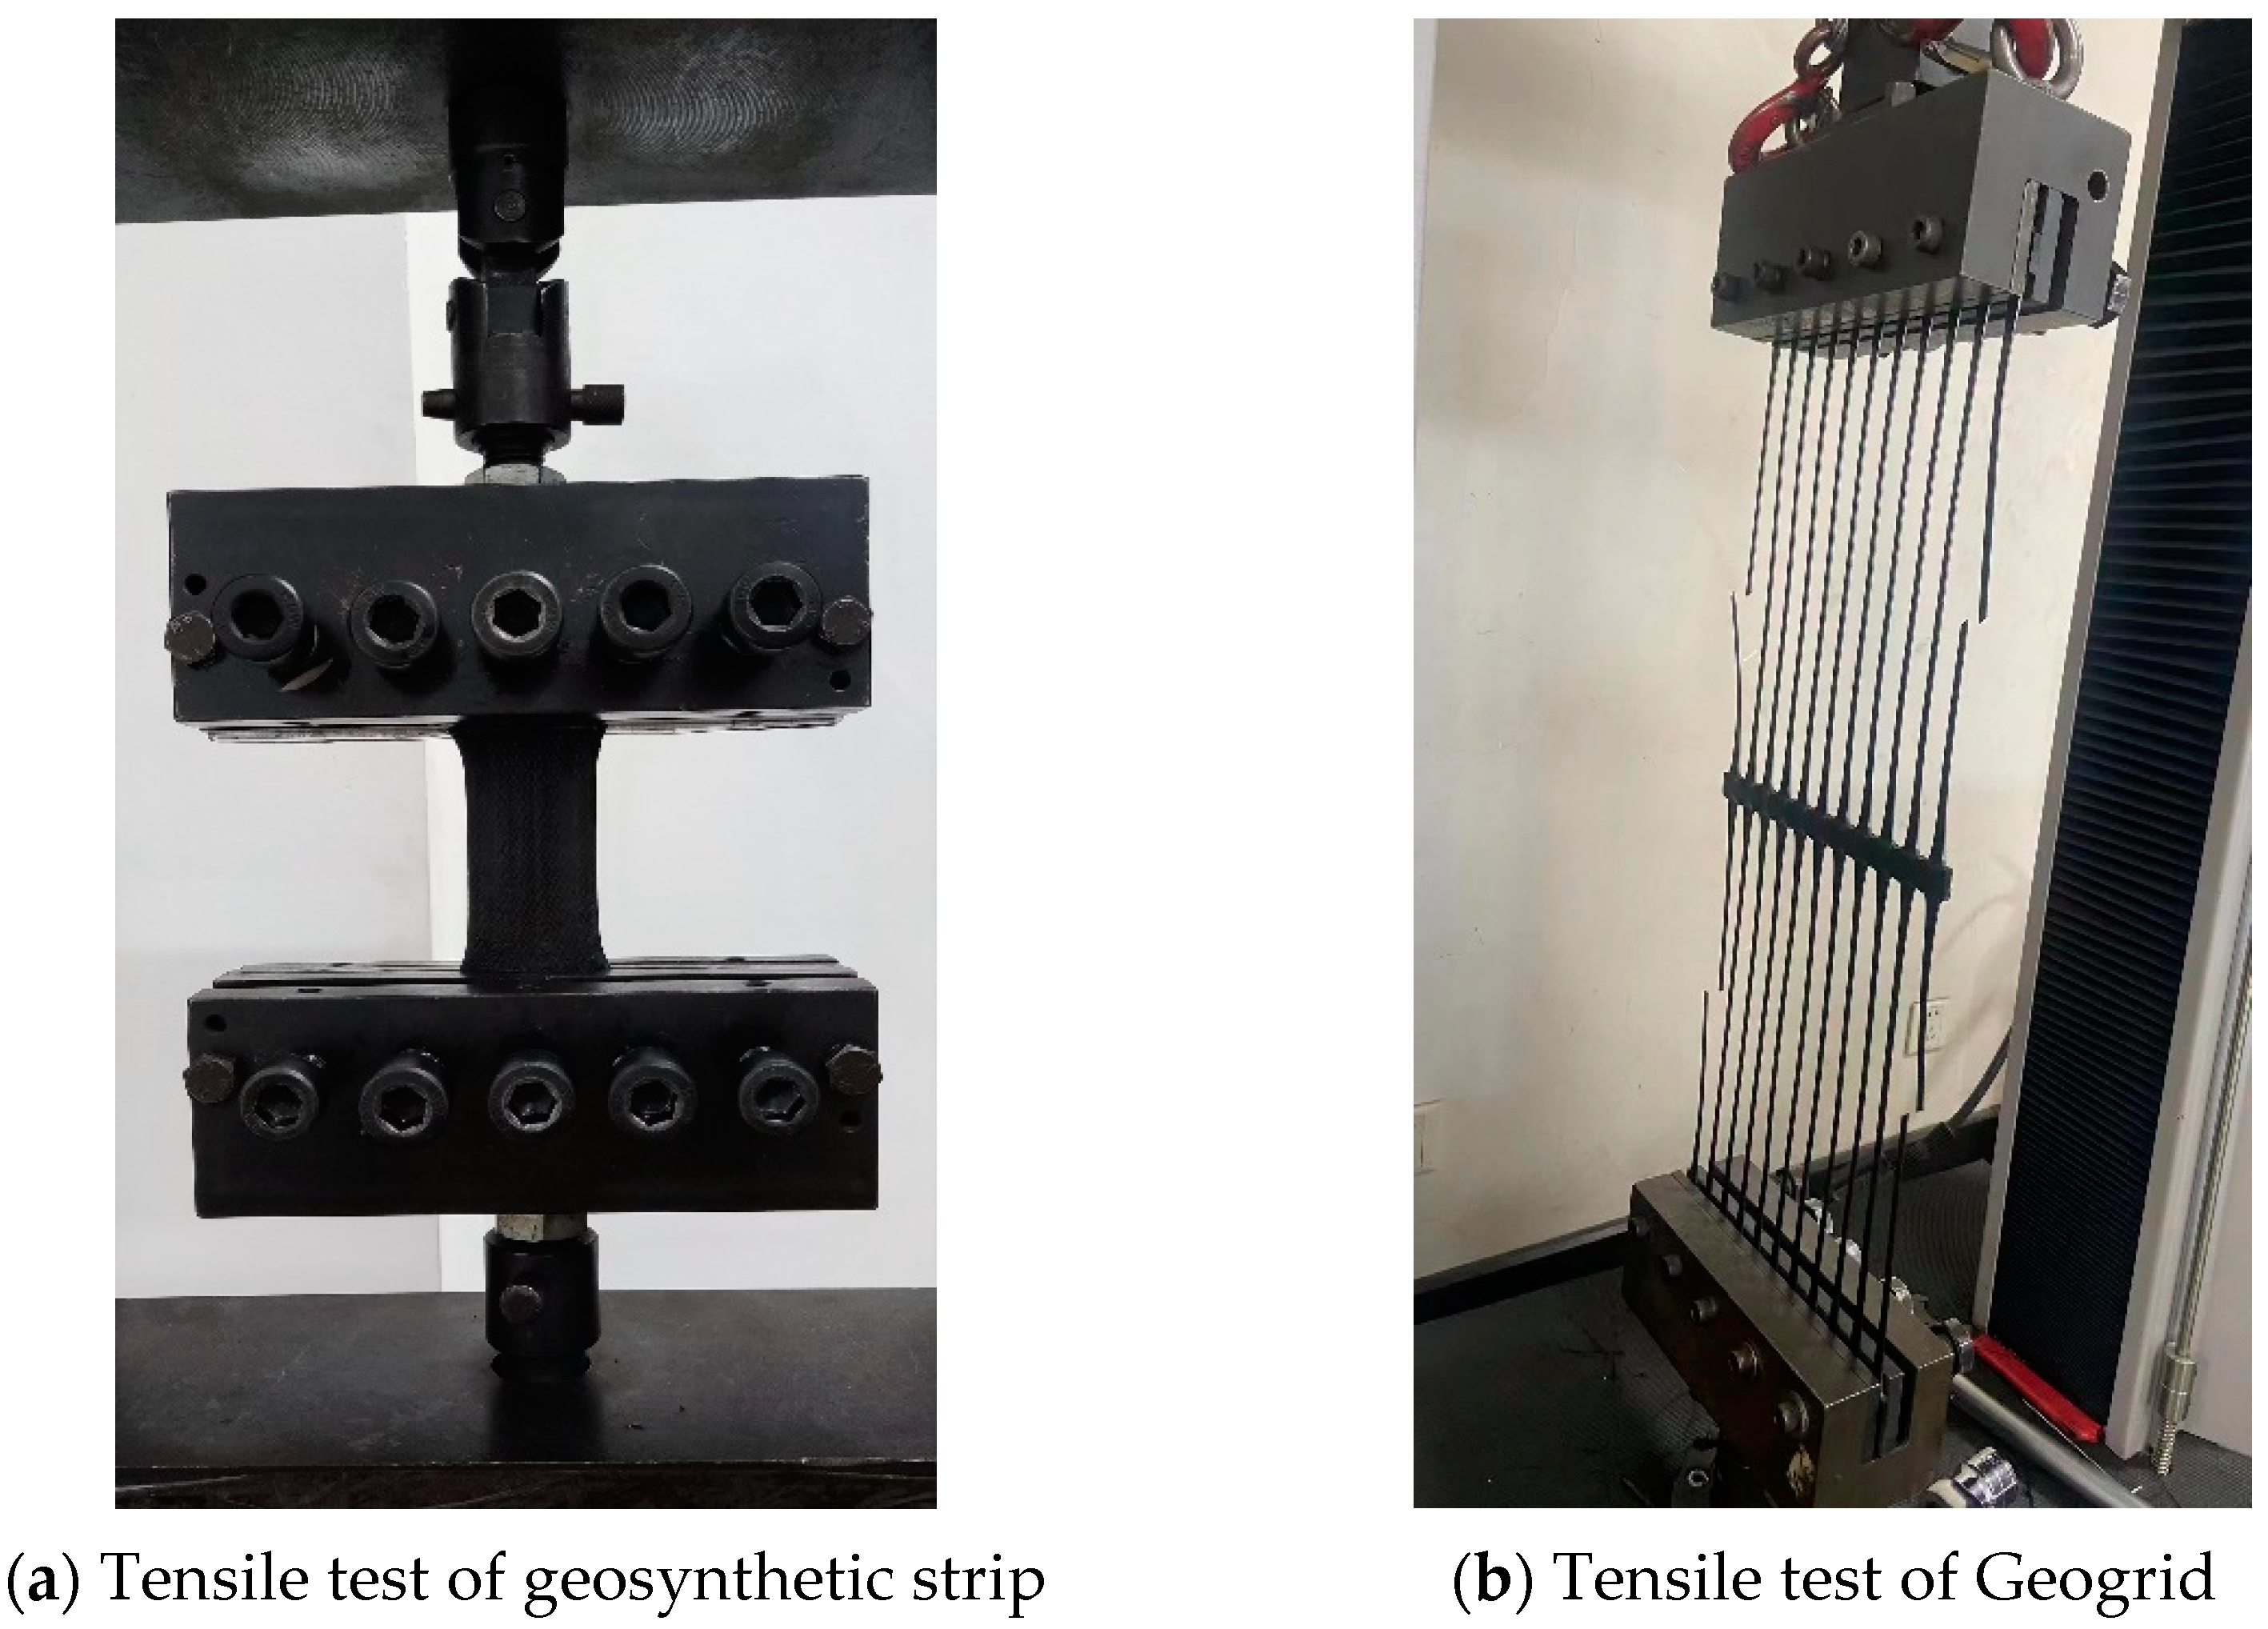
3.1. Test Equipment and Materials
3.2. Processing and Analysis of Test Results
4. Direct Shear Test Study of Reinforcement–Soil Interface
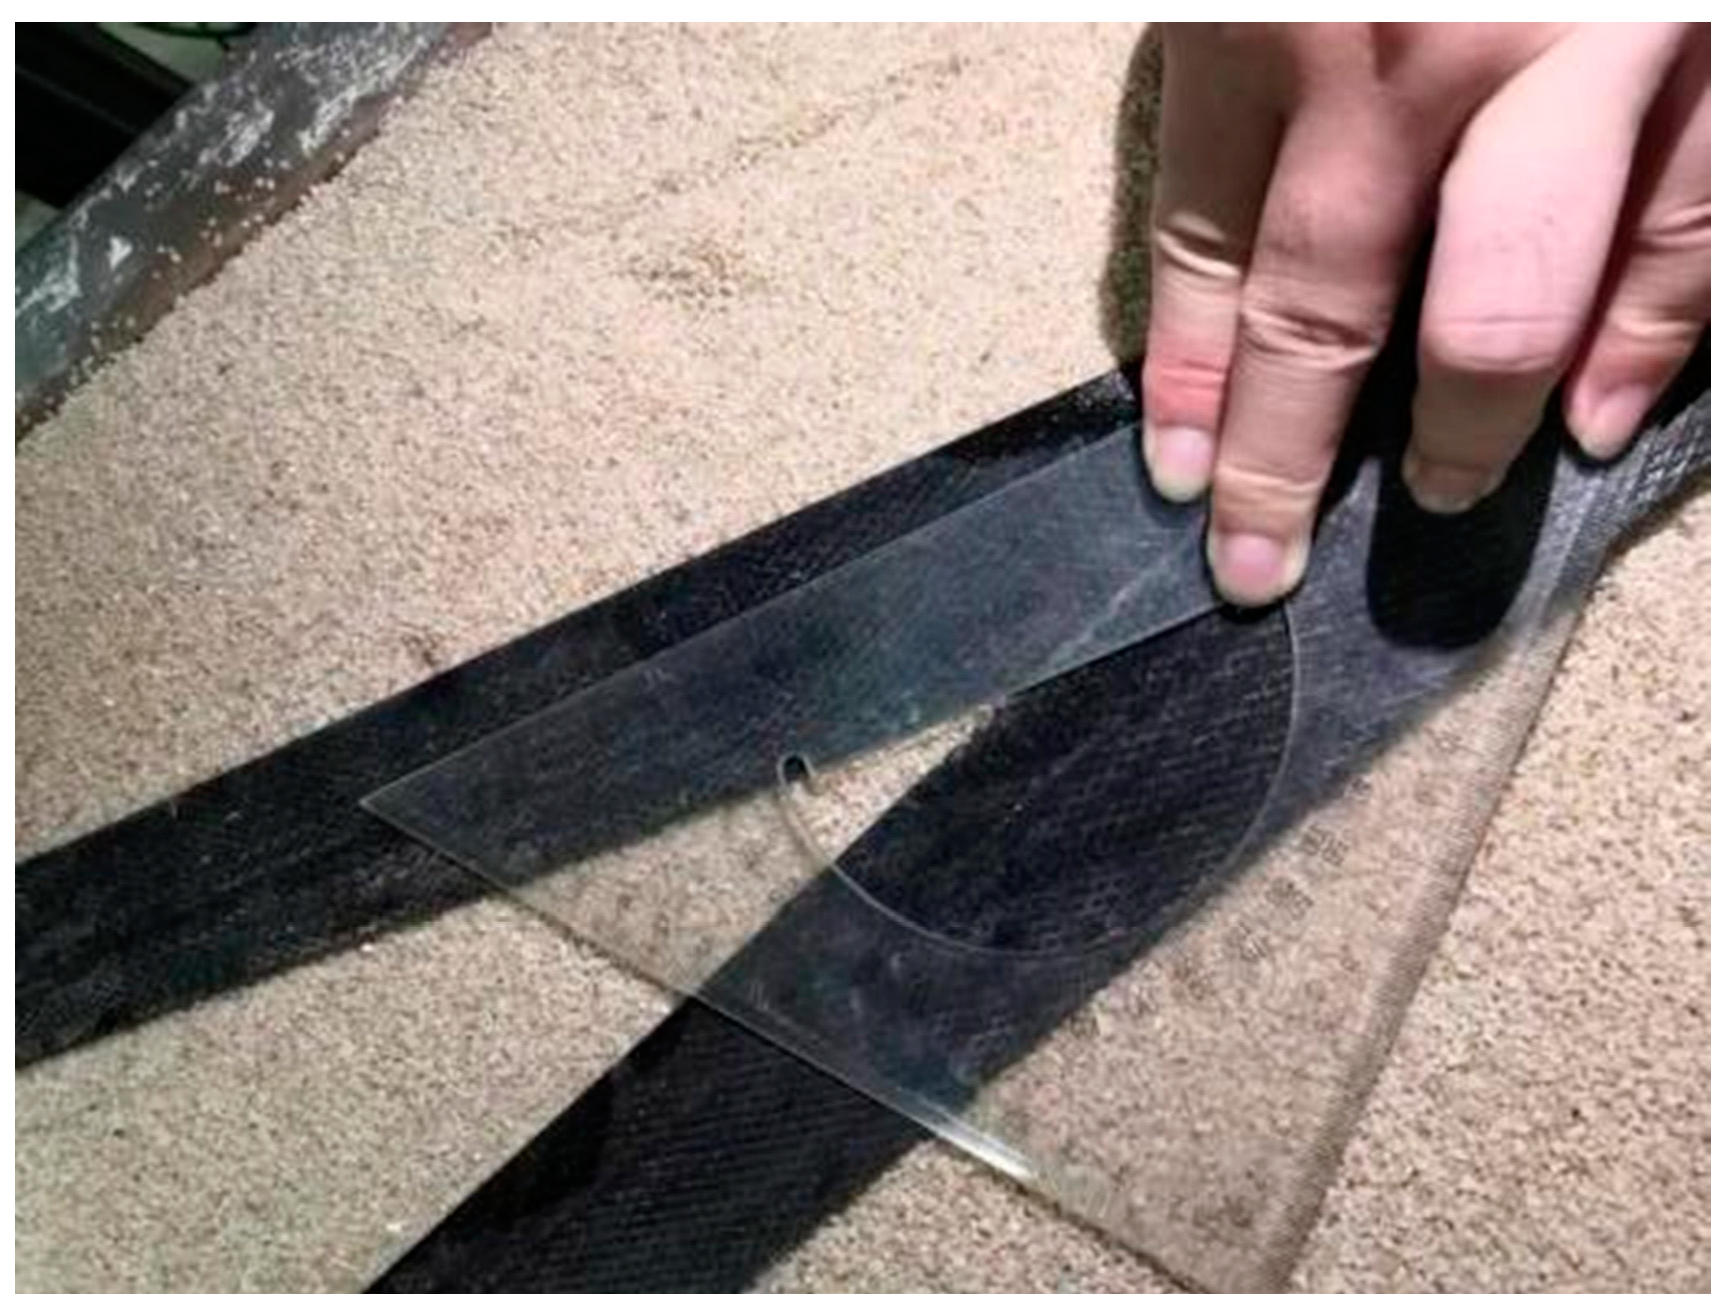
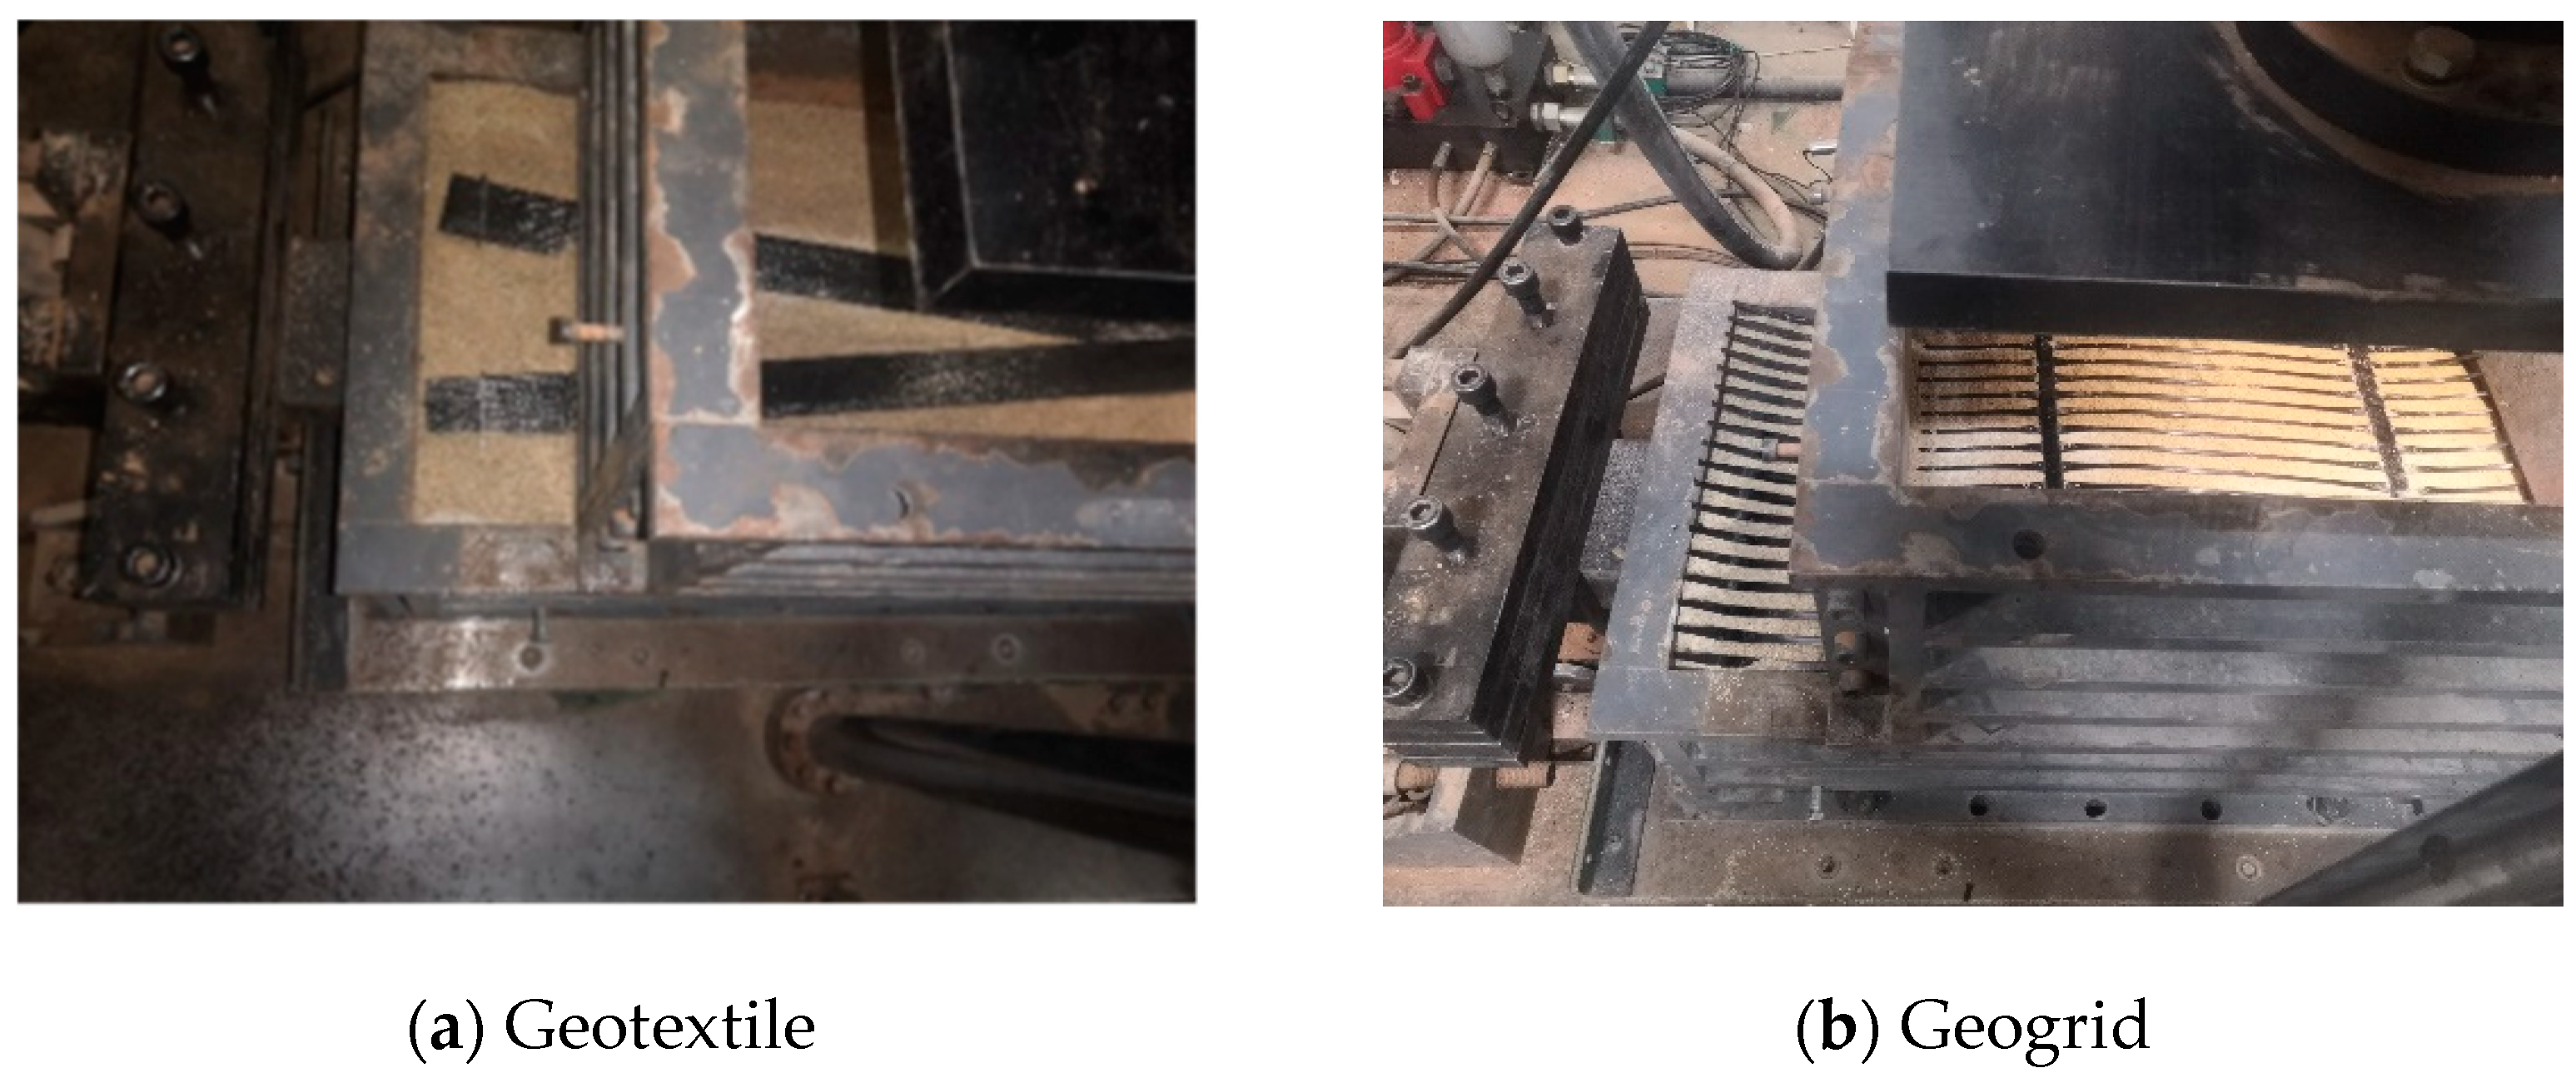
4.1. Test Equipment and Materials
4.2. Test Protocol
4.3. Processing and Analysis of Experimental Results
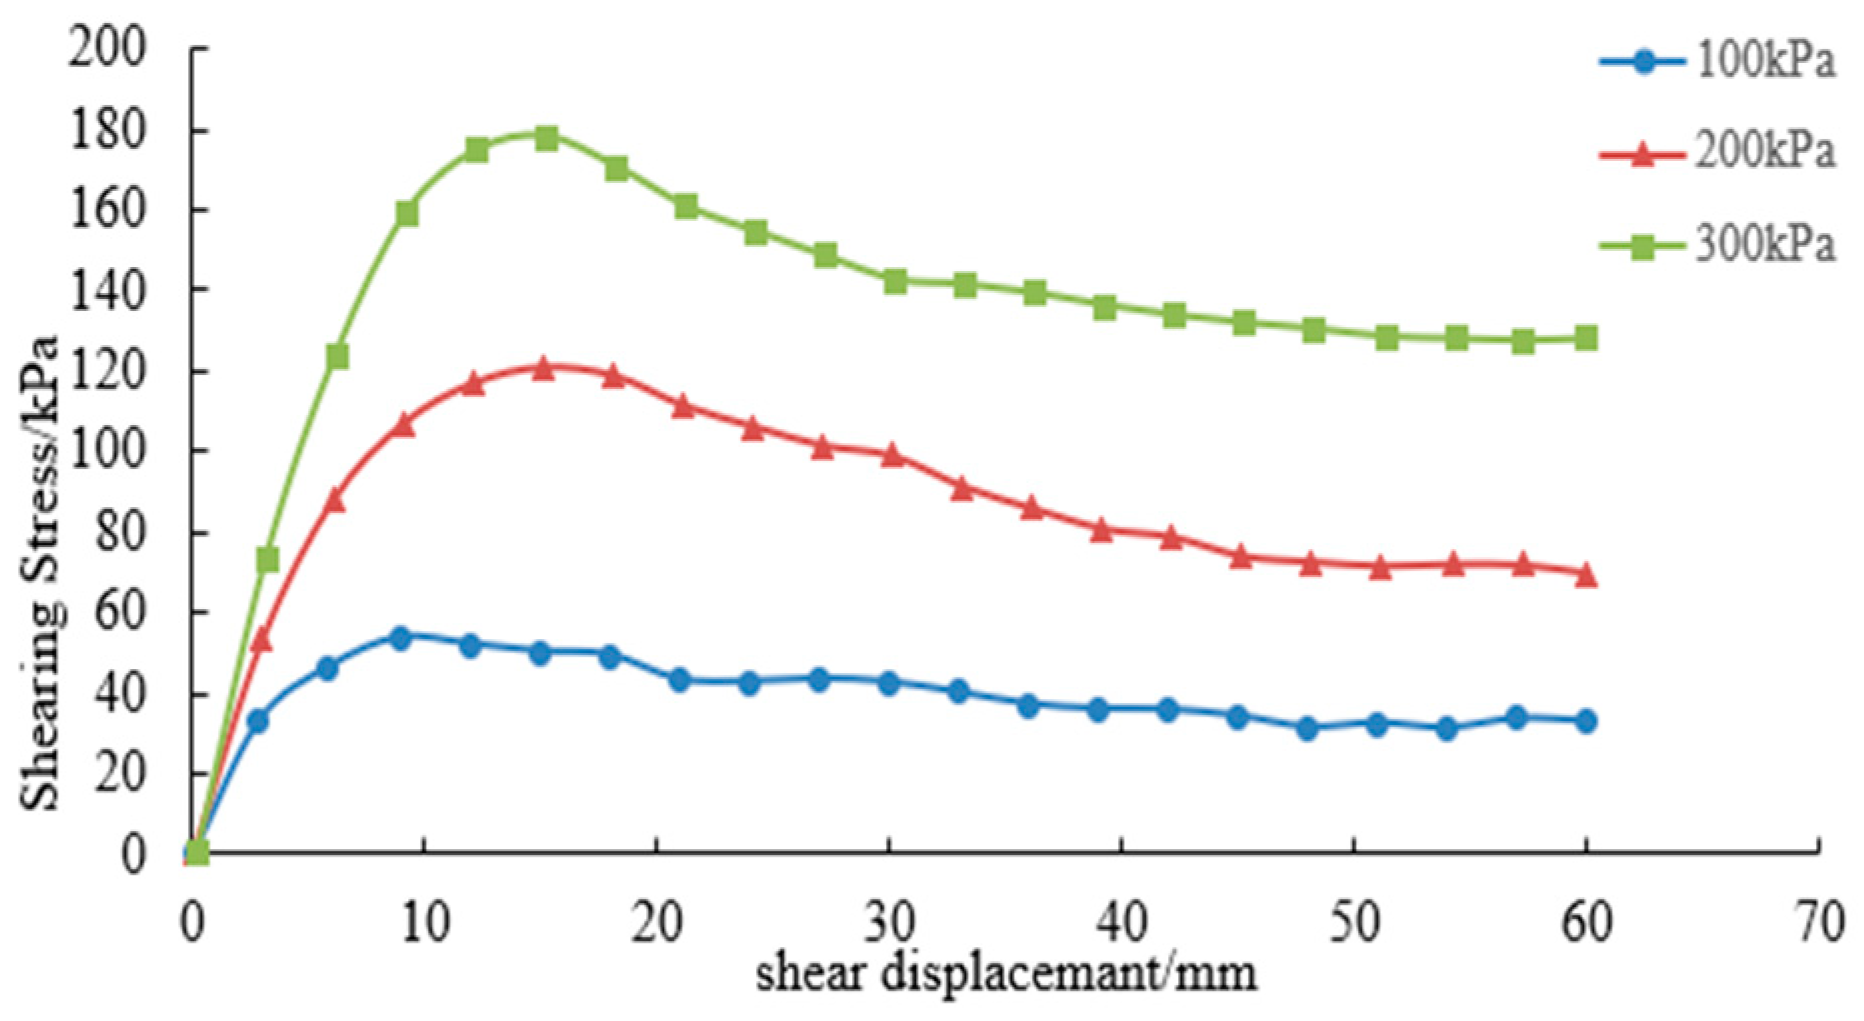
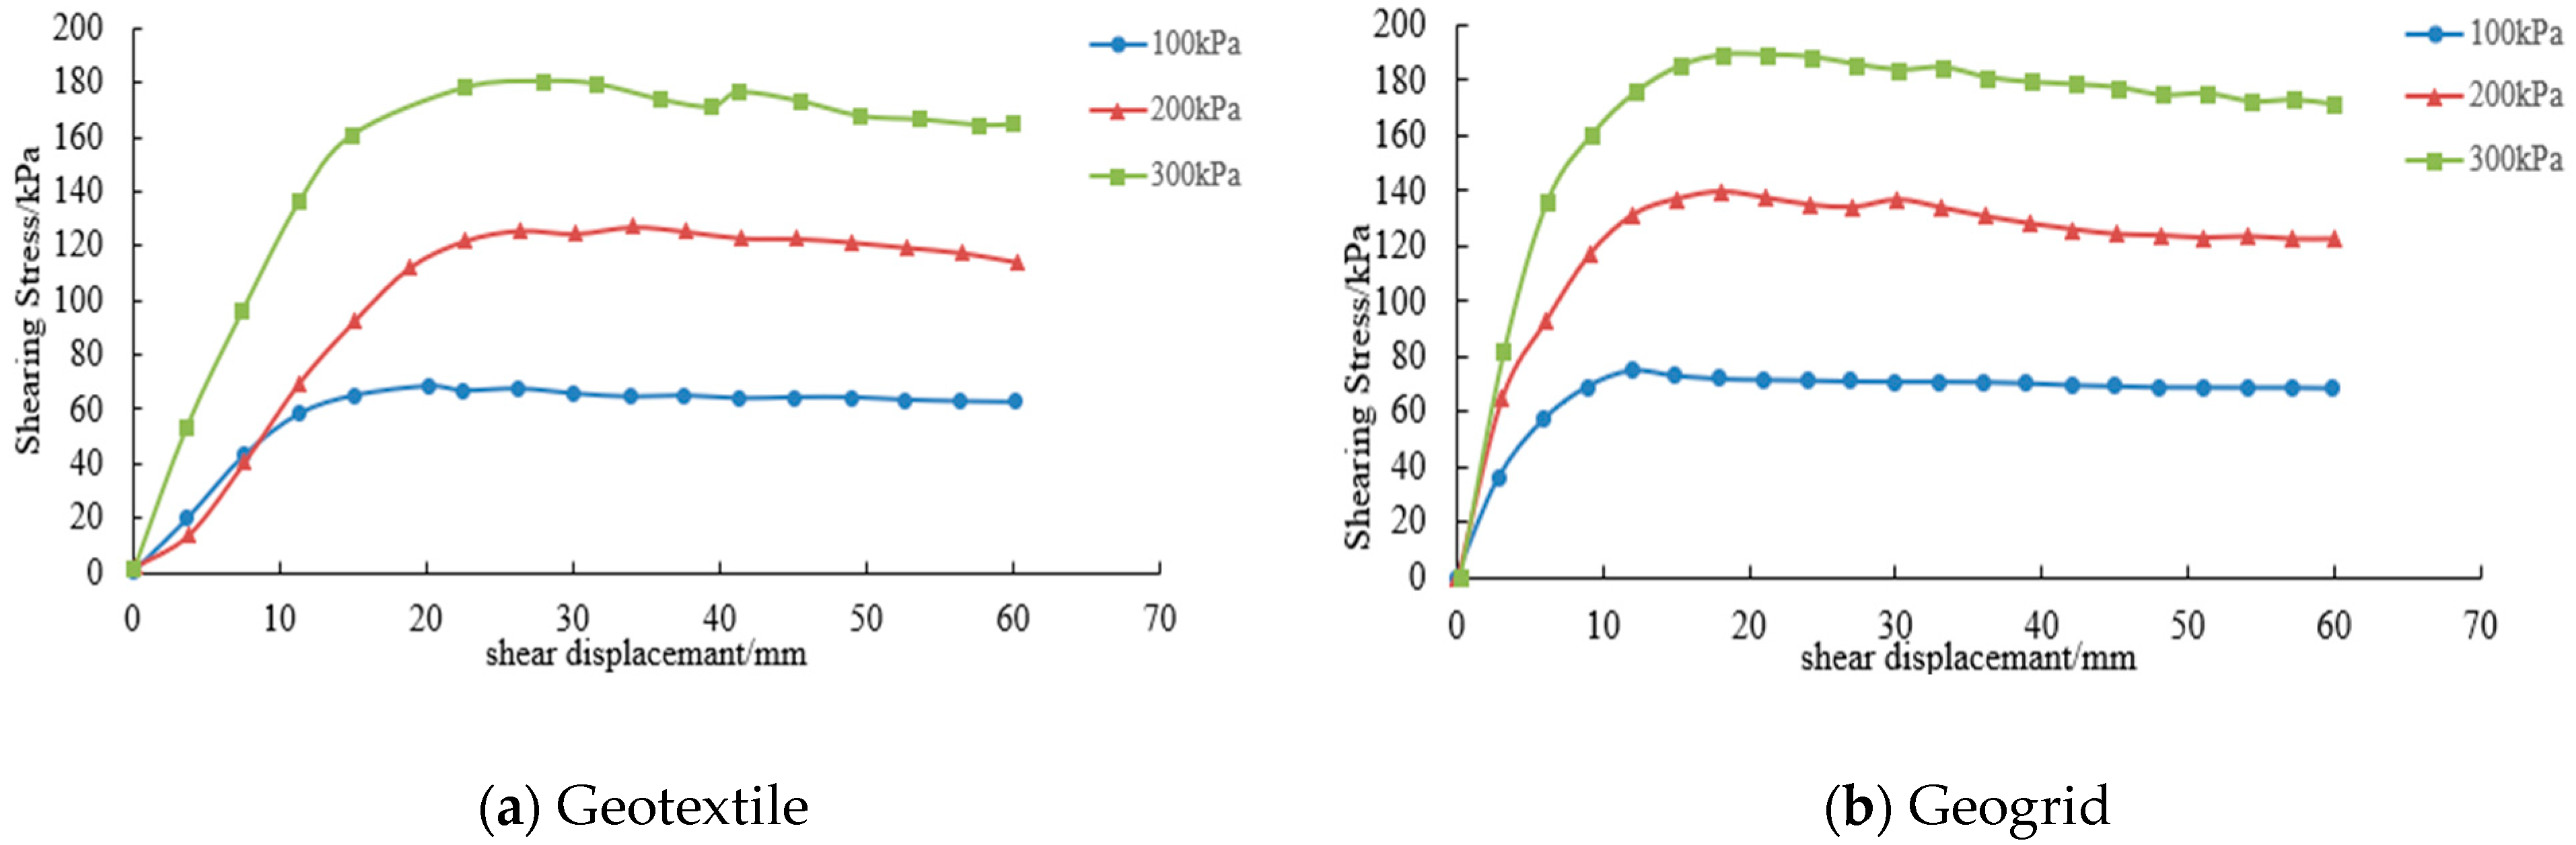
4.3.1. Analysis of the Shear Stress–Displacement Relationship
4.3.2. Analysis of Shear Strength Parameters
4.3.3. Interfacial Friction-like Coefficient
5. Experimental Study on the Pullout Friction Characteristics of the Reinforcement–Soil Interface
5.1. Experimental Protocol
5.2. Experimental Results Processing and Analysis
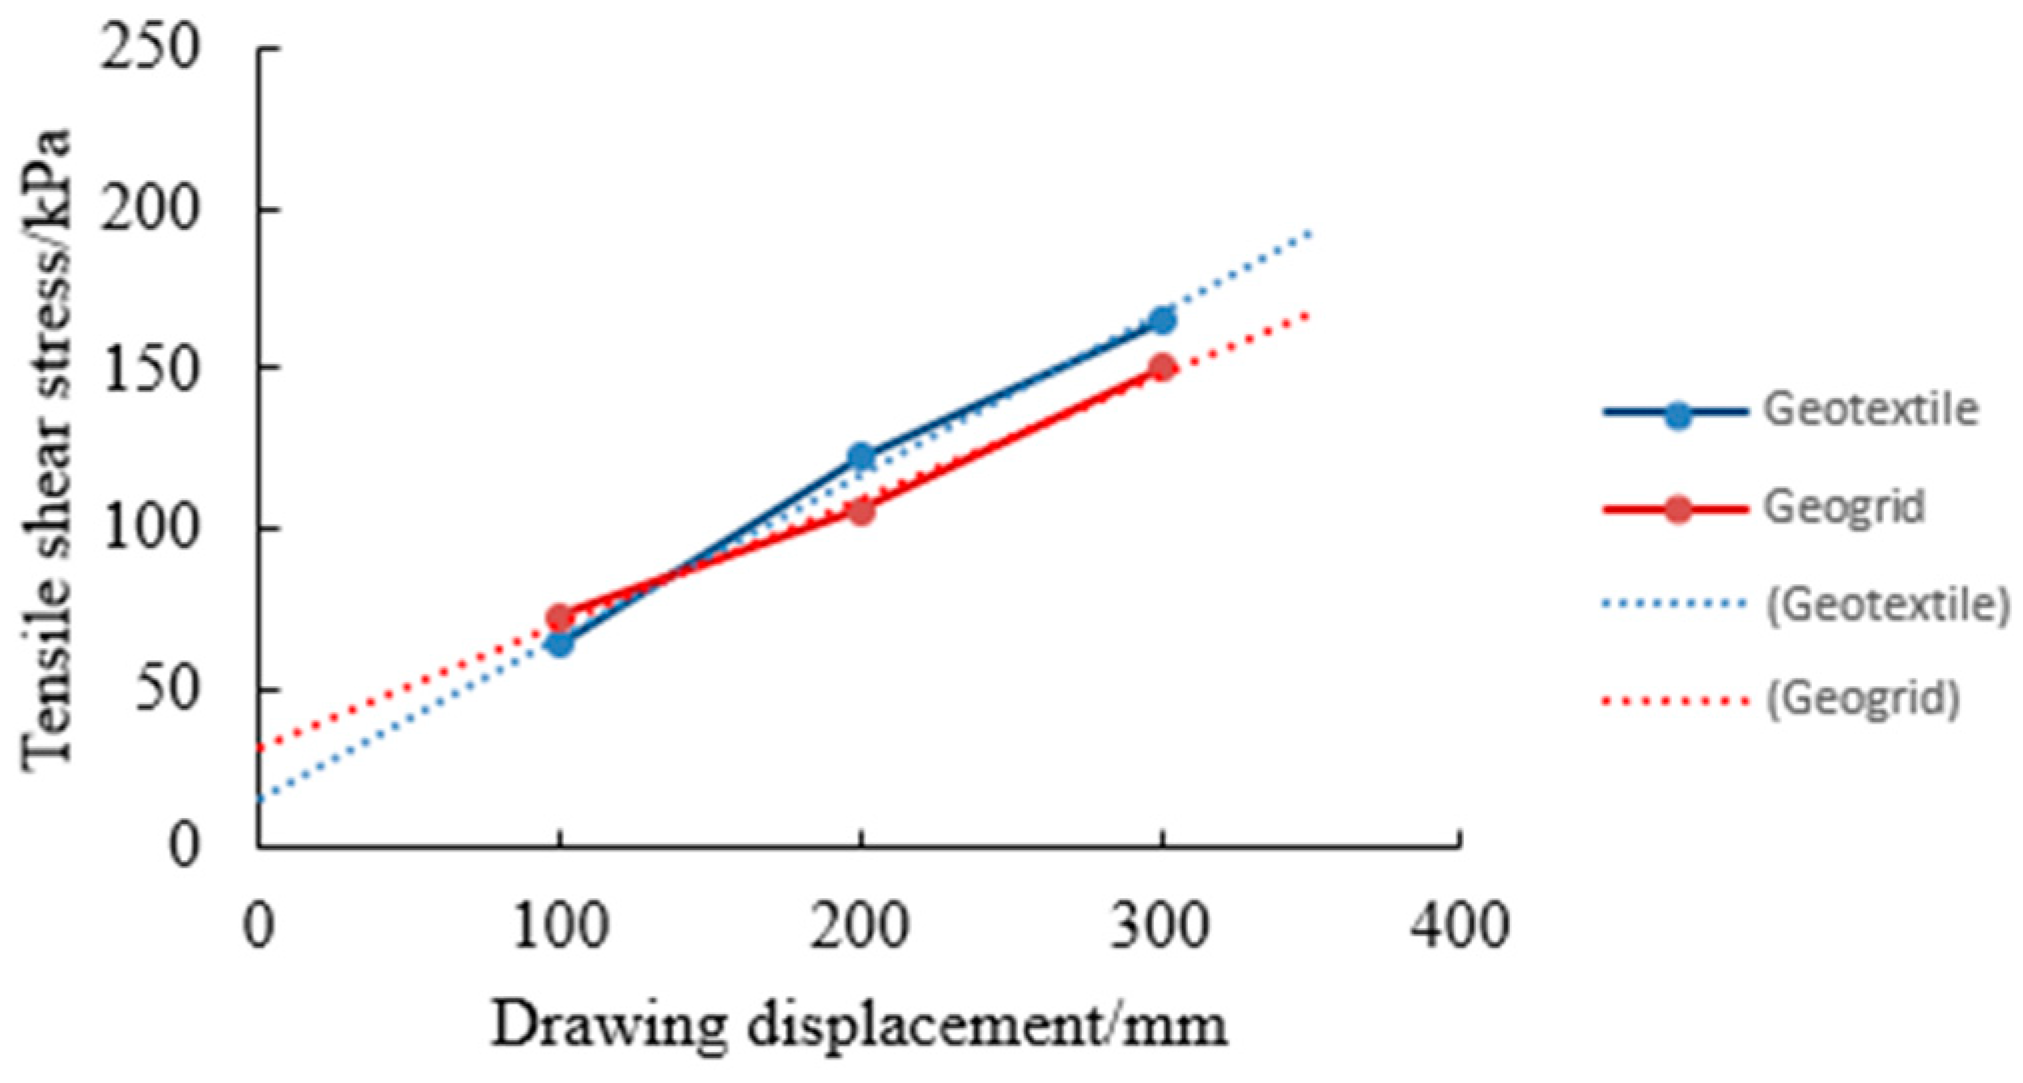
5.2.1. Analysis of Shear Stress and Shear Displacement Relationship
5.2.2. Analysis of Shear Strength Parameters
5.2.3. Interfacial Friction-like Coefficient
5.2.4. Comparison with Direct Shear Test Results
6. Results Analysis
- (1)
- The ultimate tensile strengths of the Geostrap@5-50 geobelt and the TGDG130HDPE geogrid, as determined through tensile tests, are 52.5 kN/strip and 141.6 kN/m, respectively. From a force-bearing perspective, the ultimate tensile strength of the geogrid significantly exceeds that of the geobelt. Considering both the tensile elongation and material usage, the ultimate tensile strength of the Geostrap@5-50 geobelt is approximately 37.1% of the TGDG130HDPE geogrid’s, yet its reinforcing material width comprises merely 5% of the geogrid’s width. This implies that, within a unit width, less than three Geostrap@5-50 geobelts are sufficient to meet the tensile requirements of a fully laid geogrid. Upon analyzing the tensile elongation properties of these reinforcing materials, it is deemed that the Geostrap@5-50 geobelt exhibits superior tensile performance, offering favorable mechanical characteristics and economic value for applications to reinforced soil retaining walls.
- (2)
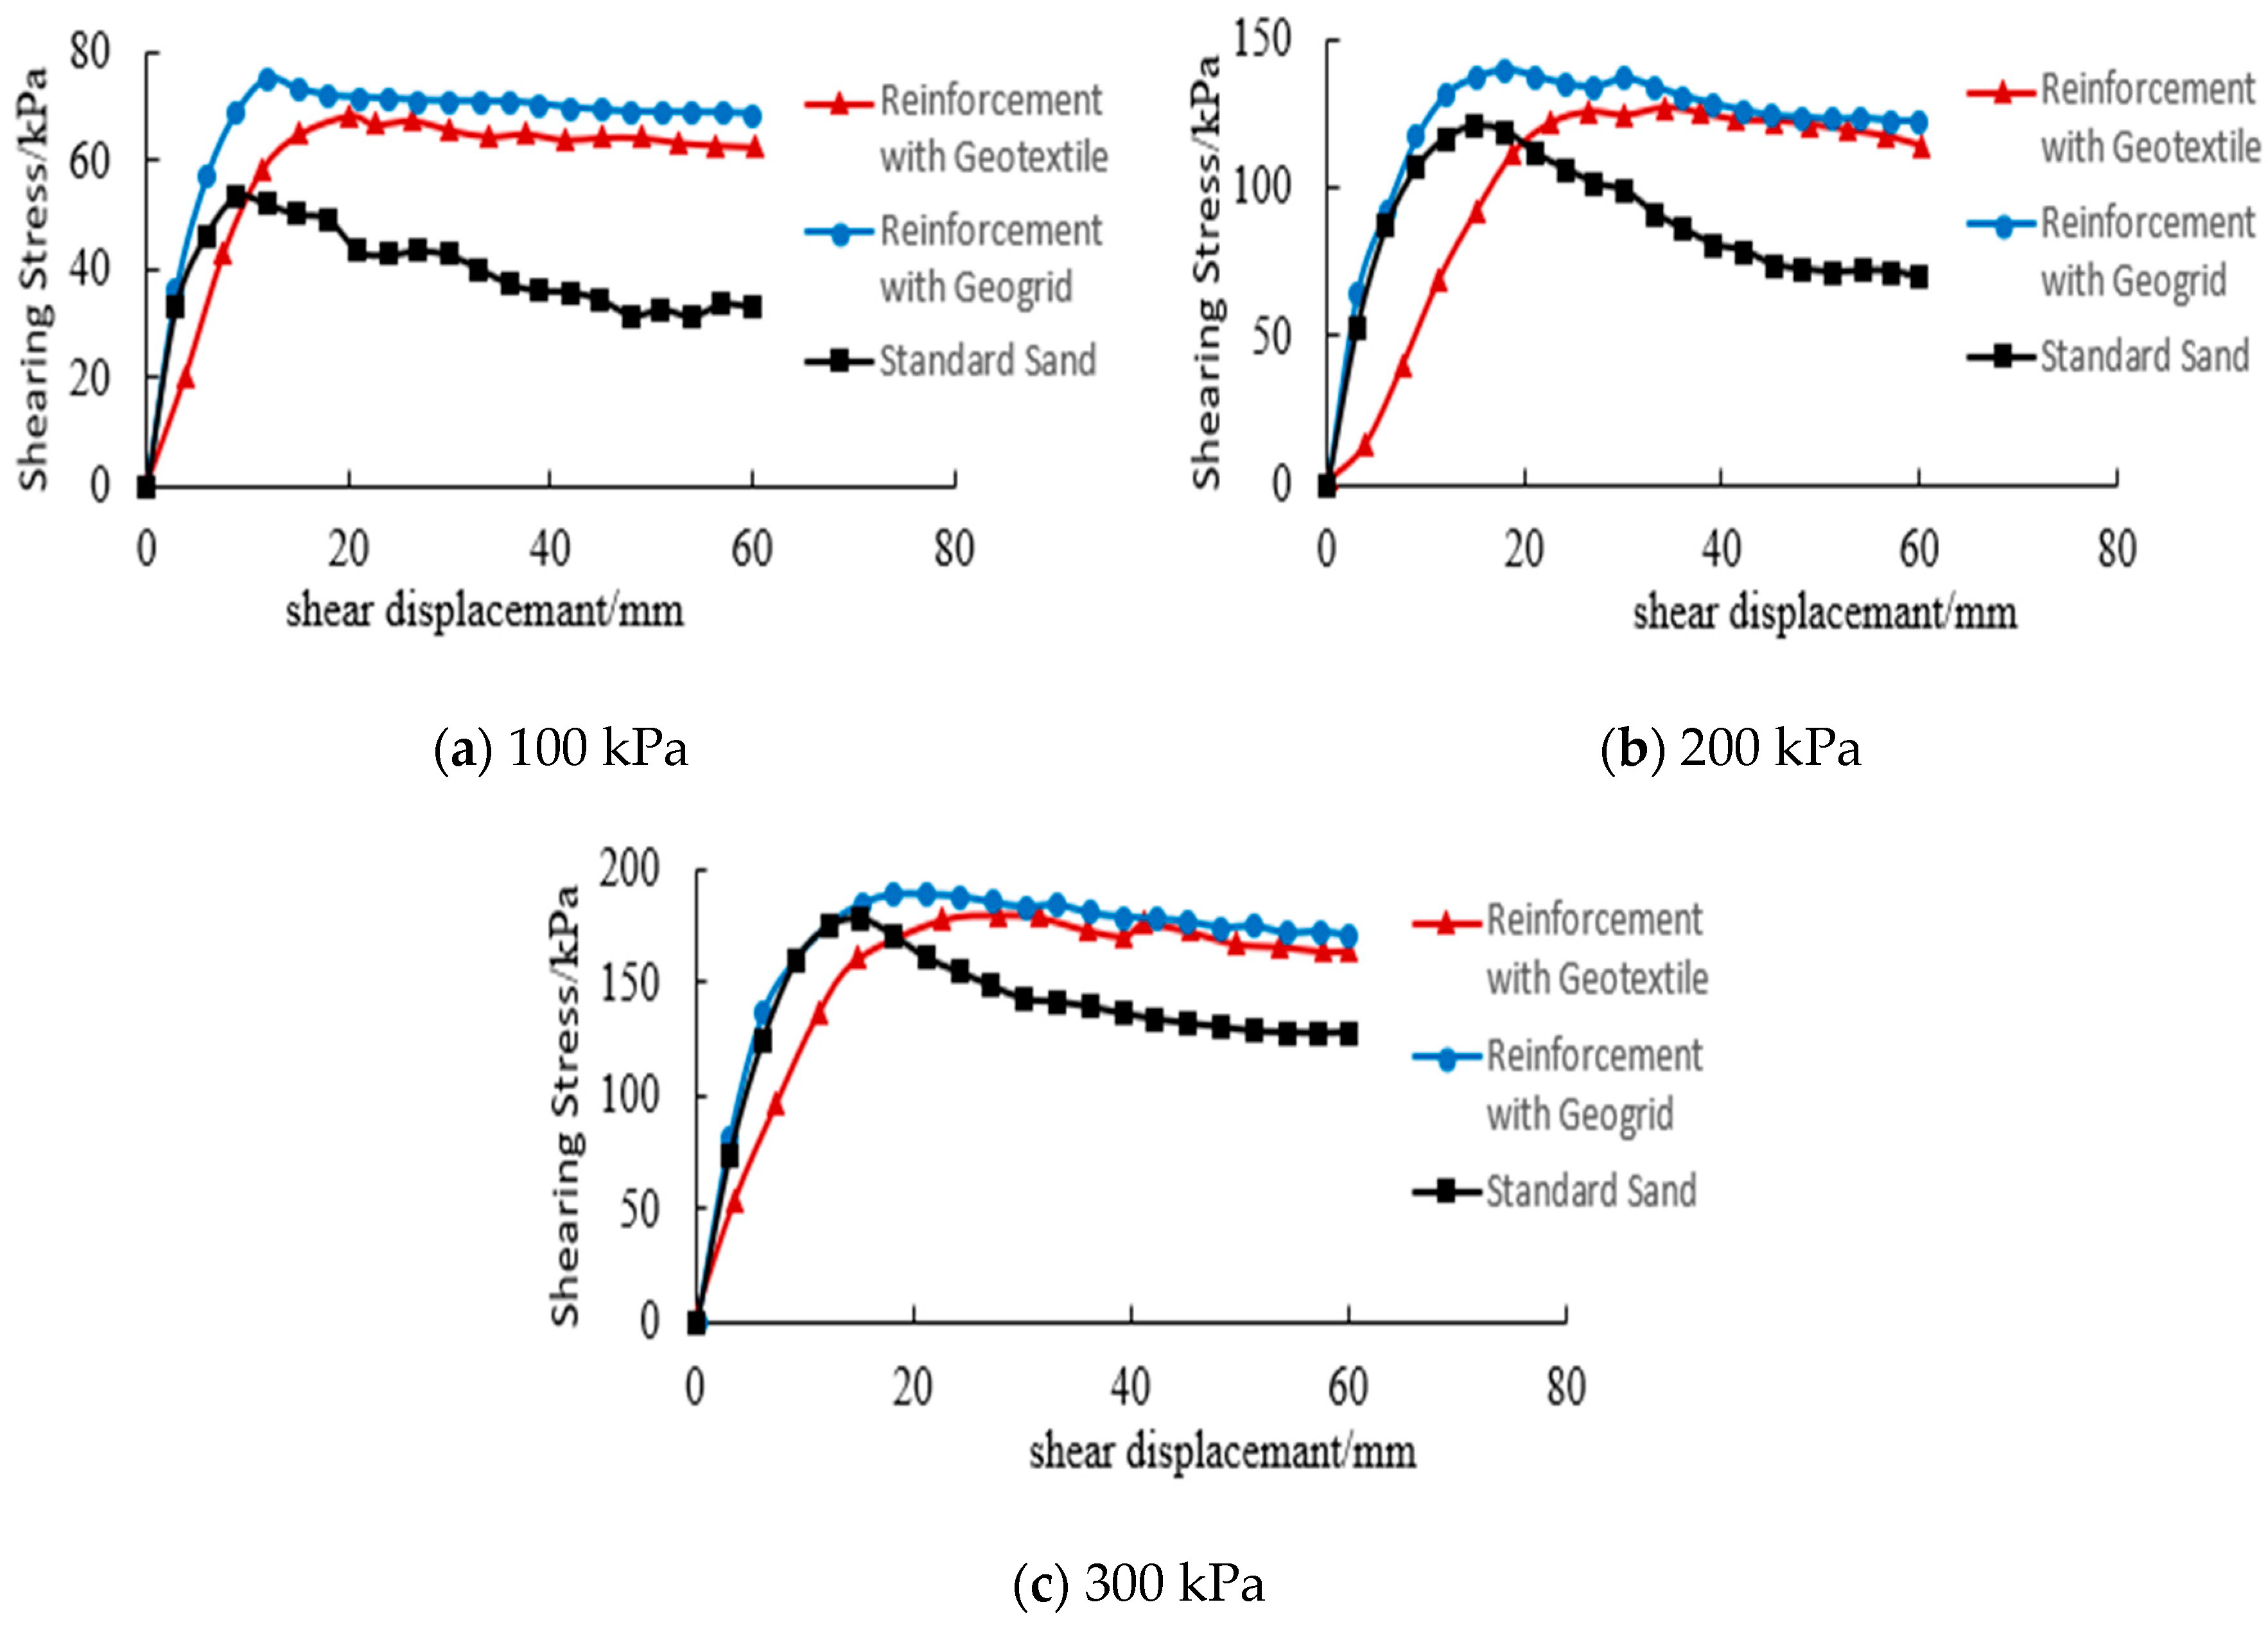
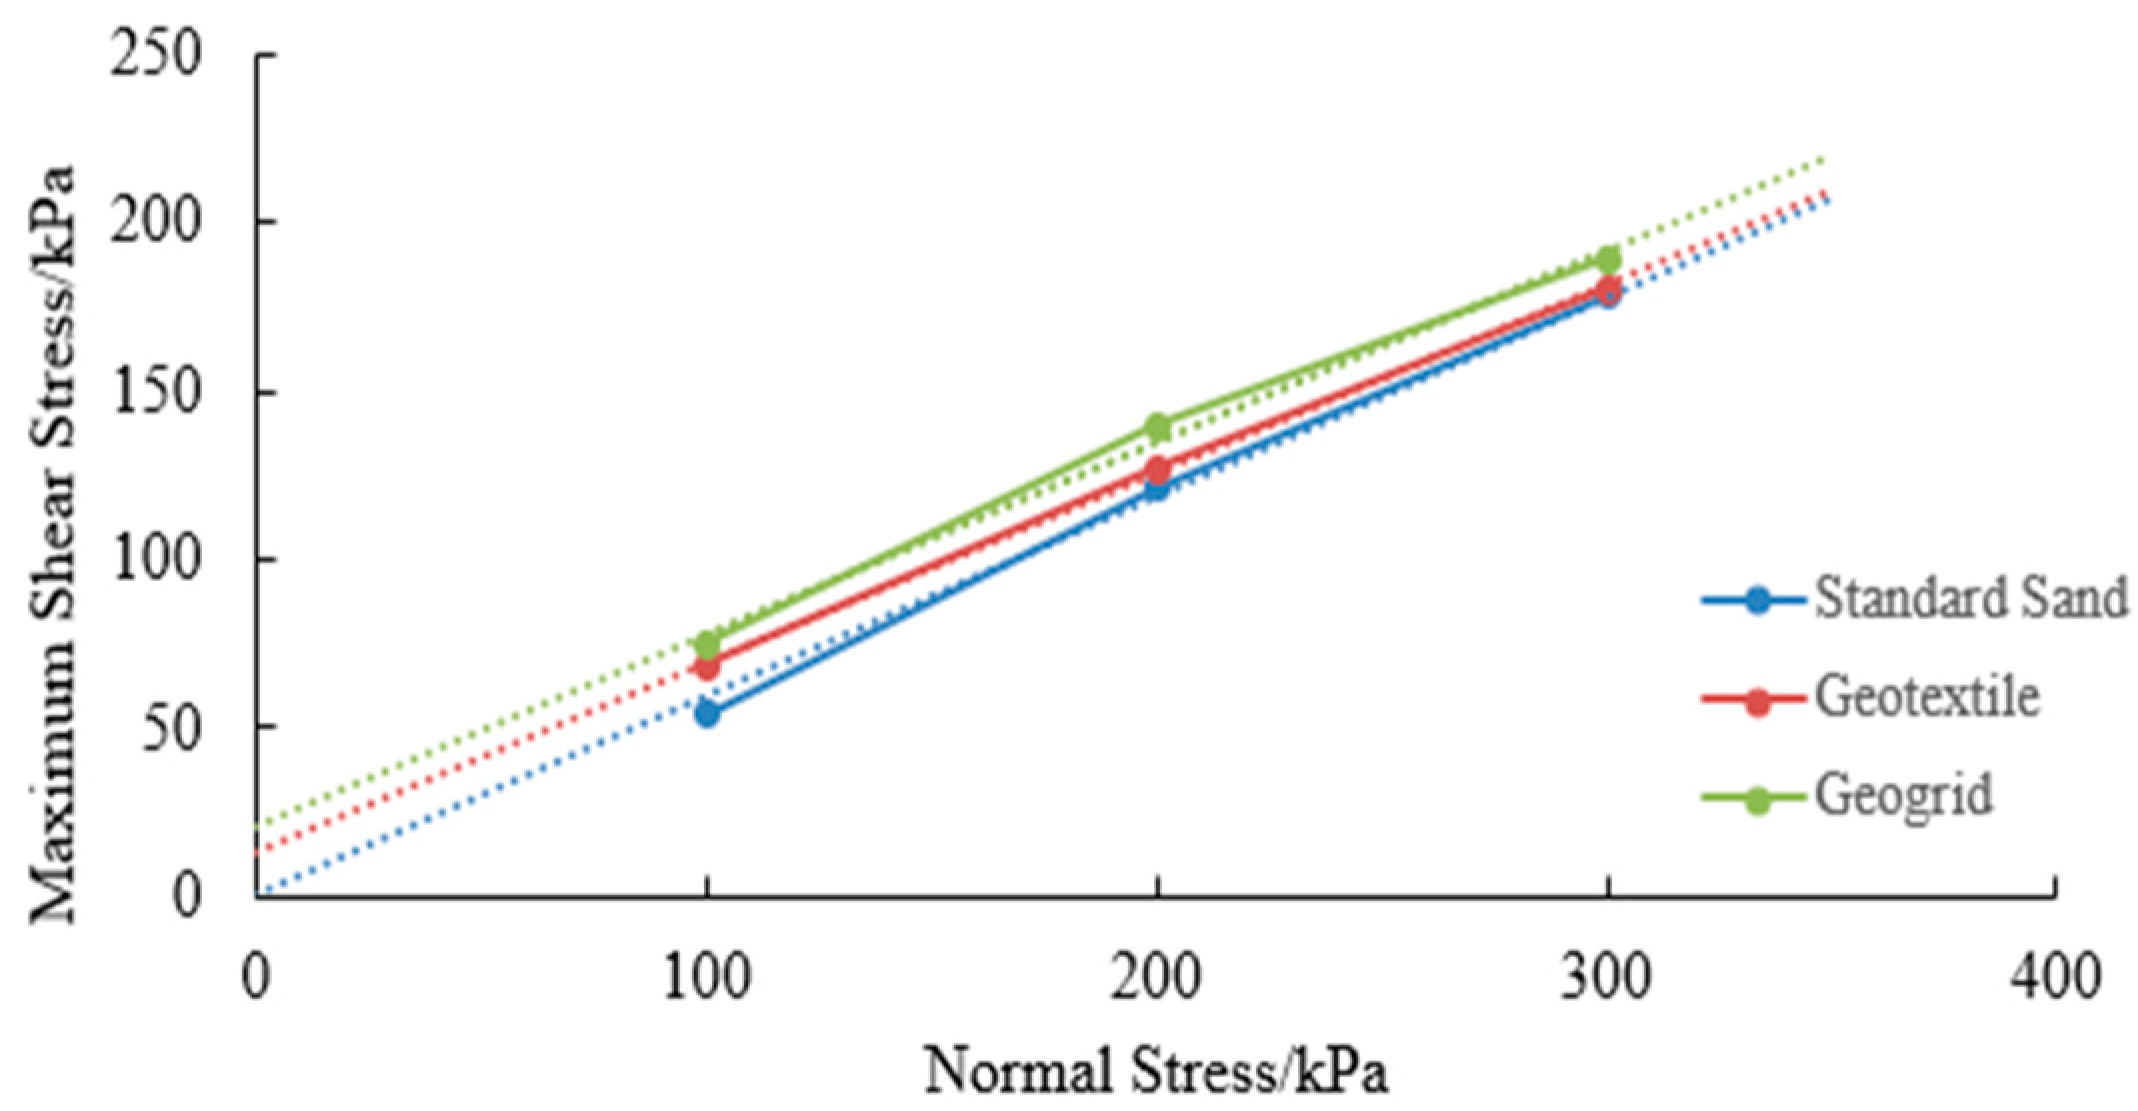
- The direct shear tests reveal that both the geotextile and geogrid reinforcements enhance the shear strength of the soil and mitigate strain softening. An analysis of the soil’s shear strength parameters indicates that while the internal friction angle decreases compared to that of standard sand, the cohesion increases significantly. This is attributed to the tensile resistance generated by the geotextile during shearing, which opposes the soil movement. As the shear displacement increases and the soil enters the residual deformation stage, the reinforcement effect of the geotextile becomes dominant, reducing the post-peak decline in strength. In contrast, the geogrid reinforcement initially relies on the friction between the reinforcement and the soil. Once a certain shear displacement is achieved, the interlocking effect of the ribs comes into play, requiring a greater shear force for the same displacement, thus minimizing strain softening. The improvement in the strength of the reinforced soil by the geotextile and geogrid is primarily achieved through the enhancement of cohesion strength.
- (3)
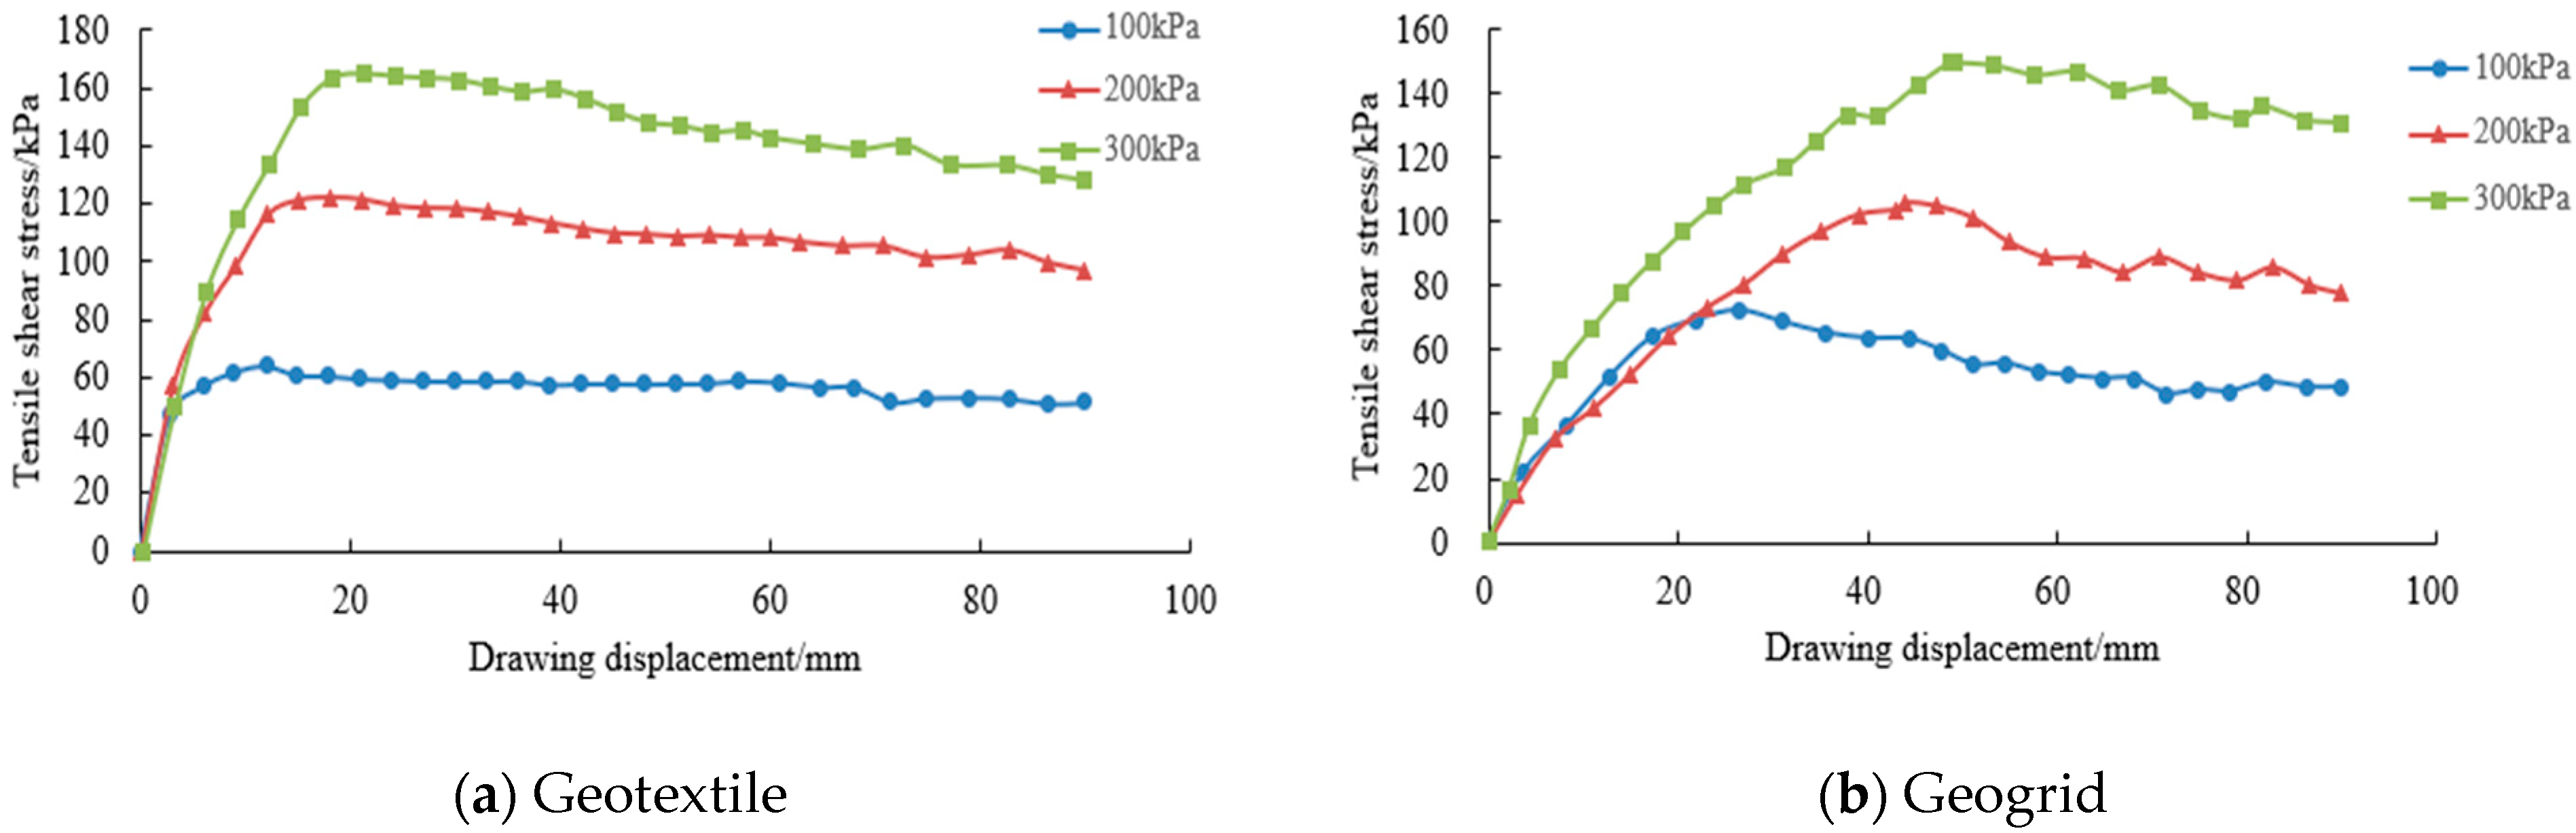
- The pullout tests show that reinforcement with the geotextile and geogrid increases the cohesion of standard sand, while reducing the internal friction angle. The decrease in the internal friction angle of the soil after reinforcement with the geogrid is more significant than that with the geotextile, while the increase in the cohesion is approximately twice that of the geotextile. This suggests that the interaction mechanisms between the geogrid and the geotextile and the soil differ. This observation is contrary to the results of the direct shear tests, as the pullout test involves a gradual transfer of the pullout force to the reinforcement, unlike the overall shear in the direct shear tests.
- (4)
- A comparison of the results from the direct shear and pullout tests reveal that the friction strength obtained from the direct shear tests is slightly higher than that from the pullout tests. This discrepancy is attributed to the different interfacial stress modes, where the shear stress distribution at the reinforcement–soil interface in the direct shear tests is more uniform. Not only does the interfacial friction strength differ, but the displacement required to reach the friction strength in the direct shear tests is significantly smaller than that in the pullout tests. Therefore, in practical engineering applications, direct shear tests are more suitable for scenarios involving unilateral displacement and small displacements, while pullout tests are applicable to scenarios with bilateral displacement and larger displacements.
7. Conclusions
8. Recommendations
Author Contributions
Funding
Data Availability Statement
Conflicts of Interest
References
- Yi, F.; Du, C.; Zhang, L. Experimental Study on the Friction Characteristics of the Interface between Gold Tailings and Geogrid. J. Saf. Environ. 2017, 17, 2217–2221. [Google Scholar]
- Cheng, H.; Wang, X.; Zhang, J. Study on Shear Characteristics and Statistical Damage Softening Model of Reinforced Coarse-Grained Soil-Reinforcement Interface. J. Railw. Sci. Eng. 2018, 15, 2780–2787. [Google Scholar]
- Ren, F.; Liu, Q. Research Progress on the Characteristics of the Reinforcement-Soil Interface in Reinforced Soil Structures. West. China Commun. Sci. Technol. 2020, 24, 5–10+28. [Google Scholar]
- Hou, L.; Jin, J.; Lu, H. Study on the Influencing Factors of Geogrid Reinforcement on the Stability of High-Filled Embankments. J. Highw. Transp. Res. Dev. (Appl. Technol. Ed.) 2020, 16, 62–66+82. [Google Scholar]
- Su, J.; Yu, T. Study on the Stress and Deformation of Double-Sided Upright Anchor-Type Retaining Wall. Geotech. Eng. Tech. 2005, 46–49. [Google Scholar]
- Gao, X.; Shi, M.; Liu, S. Experimental Study on the Shear Characteristics of the Reinforcement-Soil Interface in Reinforced Clayey Soil. J. Highw. Transp. Res. Dev. 2002, 16, 8–10. [Google Scholar]
- Fleming, I.R.; Sharma, J.S.; Jogi, M.B. Shear strength of geomembrane–soil interface under unsaturated conditions. Geotext. Geomembr. 2006, 24, 274–284. [Google Scholar] [CrossRef]
- Shi, D.; Liu, W.; Shui, W. Comparative Experimental Study on the Interaction Characteristics of Uniaxial and Biaxial Plastic Geogrids with Different Fill Materials. Rock Soil Mech. 2009, 30, 2237–2244. [Google Scholar]
- Basudhar, P.K. Modeling of soil-woven geo-textile interface behavior from direct shear test results. Geotext. Geomembr. 2010, 28, 406–408. [Google Scholar]
- Yang, G.; Sui, C. Experimental Study on the Interfacial Friction Characteristics of Geogrids. J. Shijiazhuang Tiedao Univ. (Nat. Sci. Ed.) 2010, 23, 46–52. [Google Scholar]
- Vieira, C.S.; Lopes, M.L.; Caldeira, L.M. Sand-geotextile interface characterisation through monotonic and cyclic direct shear tests. Geosynth. Int. 2013, 20, 26–38. [Google Scholar] [CrossRef]
- Esmaili, D.; Hatami, K.; Miller, G.A. Influence of matric suction on geotextile reinforcement-marginal soil interface strength. Geotext. Geomembr. 2014, 42, 139–153. [Google Scholar] [CrossRef]
- Zhao, C.; Dou, Y.; Geng, M. Experimental Study on the Interfacial Friction Characteristics of Geogrids. J. Hebei Univ. Technol. 2014, 43, 88–91. [Google Scholar]
- Xiong, T.; Liao, H.; Yang, B. Experimental Study on the Influencing Factors of Shear Strength at the Interface between Reinforcement and Soil in Reinforced Soil. Chin. J. Undergr. Space Eng. 2018, 14, 629–634. [Google Scholar]
- Ma, L. Study on the Mechanical Properties of Sisal Fiber Reinforced Soil. Master’s Thesis, Xi’an University of Technology, Xi’an, China, 2018. [Google Scholar]


| References | Reinforcement Type | Fill Soil Type | Study Factors |
|---|---|---|---|
| Gao et al. [6] (2002) | Steel–plastic composite reinforcement strip | Clayey soil | Shear rate, physical and mechanical properties of the fill soil, and reinforcement properties. |
| Fleming et al. [7] (2006) | Geomembrane | Sandy soil, sand–bentonite mixture, and silt mixture | Soil moisture content and shear rate. |
| Shi et al. [8] (2009) | Uniaxial and biaxial plastic geogrids | Clayey soil and sandy soi | Soil moisture content. |
| Basudhar et al. [9] (2010) | Geotextile | Sandy soil | Void ratio of reinforcement ribs. |
| Yang et al. [10] (2010) | Geogrid | Sandy gravel and clayey soil | Shear rate, lateral wall boundary effect and size effect of the test box, fill thickness, compaction degree, and reinforcement clamping condition. |
| Vieira et al. [11] (2013) | Geotextile | Silica sand | Number of cyclic direct shear tests and confining pressure. |
| Hatami et al. [12] (2014) | Geotextile | Clay | Soil moisture content. |
| Zhao et al. [13] (2014) | Uniaxial and biaxial geogrids | Uniaxial and biaxial geogrids | Type of geogrid. |
| Xiong et al. [14] (2018) | Geogrid | Standard sand and silty clay | Shear velocity, void ratio of reinforcement, and soil moisture content. |
| Interface Type | Cohesion c/kPa | Friction Angle φ/° |
|---|---|---|
| Standard Sand | 0 | 30.66 |
| Geotextile–Standard Sand | 13.26 | 29.25 |
| Geogrid–Standard Sand | 20.47 | 29.70 |
| Reinforcement Type | Friction Coefficient under Different Normal Stresses (kPa) | ||
|---|---|---|---|
| 100 | 200 | 300 | |
| Geostrap@5-50 Geotextile | 0.68 | 0.64 | 0.60 |
| TGDG130HDPE Geogrid | 0.75 | 0.70 | 0.63 |
| Interface Type | Pullout Rate (mm/min) | Normal Stress/kPa | Test Results |
|---|---|---|---|
| Geotextile–Standard Sand | 1.0 | 100/200/300 | Curve representing the relationship between pullout force and displacement. |
| Geogrid–Standard Sand |
| Interface Type | Cohesion c /kPa | Friction Angle φ/° |
|---|---|---|
| Geotextile–Standard Sand | 16.04 | 26.77 |
| Geogrid–Standard Sand | 31.84 | 21.18 |
| Reinforcement Type | Friction Coefficient under Different Normal Stresses (kPa) | ||
|---|---|---|---|
| 100 | 200 | 300 | |
| Geostrap@5-50 Geotextile | 0.64 | 0.61 | 0.55 |
| TGDG130HDPE Geogrid | 0.72 | 0.53 | 0.50 |
Disclaimer/Publisher’s Note: The statements, opinions and data contained in all publications are solely those of the individual author(s) and contributor(s) and not of MDPI and/or the editor(s). MDPI and/or the editor(s) disclaim responsibility for any injury to people or property resulting from any ideas, methods, instructions or products referred to in the content. |
© 2024 by the authors. Licensee MDPI, Basel, Switzerland. This article is an open access article distributed under the terms and conditions of the Creative Commons Attribution (CC BY) license (https://creativecommons.org/licenses/by/4.0/).
Share and Cite
Wang, Y.; Yang, G.; Wang, L.; Li, X.; Jiao, G. Experimental Study on Reinforcement Properties of Tension-Resistant Reinforced Soil Retaining Wall. Buildings 2024, 14, 2951. https://doi.org/10.3390/buildings14092951
Wang Y, Yang G, Wang L, Li X, Jiao G. Experimental Study on Reinforcement Properties of Tension-Resistant Reinforced Soil Retaining Wall. Buildings. 2024; 14(9):2951. https://doi.org/10.3390/buildings14092951
Chicago/Turabian StyleWang, Yantao, Guangqing Yang, Lei Wang, Xujia Li, and Guomu Jiao. 2024. "Experimental Study on Reinforcement Properties of Tension-Resistant Reinforced Soil Retaining Wall" Buildings 14, no. 9: 2951. https://doi.org/10.3390/buildings14092951
APA StyleWang, Y., Yang, G., Wang, L., Li, X., & Jiao, G. (2024). Experimental Study on Reinforcement Properties of Tension-Resistant Reinforced Soil Retaining Wall. Buildings, 14(9), 2951. https://doi.org/10.3390/buildings14092951