1. Introduction
1.1. Industry Context and the Need for Innovation
The construction industry is integral to global infrastructure growth but continues to battle significant challenges, such as project delays and cost overruns. While sectors such as manufacturing have dramatically transformed through digital technologies, construction remains notably lagging, especially in adopting technologies that could significantly enhance real-time project management. Building Information Modeling (BIM), though revolutionary in design and planning phases, is markedly underutilized during construction phases for real-time management [
1,
2].
1.2. Understanding Digital Twin and Agent-Based Modeling (ABM)
Digital Twin technology creates a real-time, virtual replica of physical assets. This digital representation integrates real-time data from various sources, enabling continuous monitoring, simulation, and analysis of the physical counterpart. In construction, Digital Twins provide a dynamic model that reflects the current state of the construction site, allowing for better decision-making, predictive analytics, and real-time feedback for safety and quality control [
3].
Agent-Based Modeling (ABM) involves simulating the actions and interactions of autonomous agents (e.g., workers, machinery) to assess their effects on the system as a whole. In the context of construction, ABM can model the behavior of individual workers and equipment, helping to optimize resource allocation and workflow efficiency [
4].
1.3. Defining the Research Problem
Despite the advancements in BIM technology, its application in the active phases of construction management is limited. Traditional BIM models are primarily static, focusing on pre-defined scenarios without the flexibility to adapt to real-time changes and on-site conditions. This limitation results in a disconnect between BIM’s theoretical benefits and its practical application in day-to-day construction management [
5].
Research indicates that integrating real-time data and advanced simulation techniques can enhance BIM’s effectiveness in managing construction projects. However, there is a notable gap in the literature regarding the integration of BIM with real-time tracking technologies and dynamic simulation models, such as ABM and Digital Twins [
6,
7].
Digital Twins, by providing a continuously updated virtual representation of the physical construction environment, enable predictive analytics, proactive management, and real-time feedback for safety and quality control. ABM, on the other hand, simulates the interactions and behaviors of individual agents to provide a micro-level understanding of site dynamics. These technologies, when integrated with BIM, can significantly enhance decision-making processes, optimize resource management, and improve overall project outcomes. Additionally, long-term feedback from these integrated systems can inform better design and planning practices for future projects [
8,
9].
1.4. Proposed Solution: Integrative Technological Framework
To address these gaps, this research proposes an innovative integrative framework that combines BIM with ABM and Bluetooth Low Energy (BLE). This framework is designed to enhance BIM’s static capabilities by incorporating ABM’s dynamic simulation of complex interactions and BLE’s precision in real-time tracking. The aim is to create a proactive and adaptive construction management system that improves decision-making, optimizes resource management, enhances overall project outcomes, and provides real-time feedback for safety and quality control, as well as long-term feedback for design and planning [
10,
11].
1.5. Objectives and Anticipated Contributions
The objectives of this research are to develop, validate, and implement this methodology to enable enhanced real-time management capabilities within construction projects. Anticipated outcomes include increased operational efficiency, reduced project delays, improved project management effectiveness, and enhanced safety and quality control through real-time feedback mechanisms. Empirical validation will be performed through a case study at Helwan University’s College of Engineering to demonstrate the practical implications and scalability of the framework [
12].
1.6. Significance and Broader Impact
The potential of this research to shift construction management paradigms towards a more data-driven and responsive approach is significant. By filling current technological gaps, this study contributes to academic discourse and offers actionable insights that could lead to industry-wide adoption of advanced digital solutions. The successful implementation of this framework could redefine the norms for technology use in construction, promoting more sustainable and efficient practices. Additionally, the integration of real-time and long-term feedback mechanisms will enhance safety, quality control, and future project planning [
13].
2. Literature Review
2.1. Building Information Modeling (BIM) and Labor Productivity
Building Information Modeling (BIM) has revolutionized the construction industry, particularly impacting design and planning stages with its ability to provide detailed, data-rich models. BIM enhances communication and coordination among stakeholders, leading to better-planned projects with fewer unforeseen complications. Its capabilities extend into the heart of construction operations, particularly in enhancing labor productivity [
14,
15].
While BIM is pivotal in pre-construction planning, its utilization in real-time construction management, especially concerning labor productivity, reveals significant limitations. BIM often provides a macro-level view that focuses extensively on material resources, scheduling, and structural details but lacks adaptability to the dynamic changes frequently encountered on construction sites. This limitation hampers its effectiveness in tracking individual worker productivity and making real-time adjustments to workflows, essential for maximizing productivity and minimizing downtime. Recent advancements in BIM incorporate dynamic elements that manage labor metrics within the model. Integration with IoT devices and real-time data collection methods has enabled the monitoring of worker movements and activities, linking these to specific tasks within the BIM model, thus allowing for granular management of labor resources. These enhancements facilitate rapid responses to productivity lags and help optimize workflows [
16,
17,
18,
19].
2.2. Agent-Based Modeling (ABM) and Enhanced Labor Productivity
Agent-Based Modeling (ABM) introduces a micro-level, dynamic layer of simulation that enhances understanding of the interactions among workers, tools, and materials within a project. ABM addresses BIM’s limitations by providing detailed simulations of individual behaviors and interactions, offering insights into the complexities of onsite dynamics and enabling more responsive management practices. ABM’s ability to simulate various operational scenarios helps project managers explore different strategies to optimize productivity and preempt potential problems. This capacity is particularly valuable for complex logistic scenarios where human factors significantly influence outcomes [
19,
20,
21,
22].
Integrating ABM with BIM transforms labor productivity management from a traditionally reactive to a proactive endeavor. This integration allows for a seamless flow of data between macro-scale structural elements and micro-scale agent interactions, significantly enhancing efficiency and reducing project overruns [
23,
24].
2.3. Digital Twin Technology Integration in Construction
Digital Twin technology, representing a convergence of BIM and ABM capabilities, extends these by providing a real-time, continuously updated virtual model of the construction site. This integration not only allows for advanced real-time data use within the BIM framework but also enhances predictive analytics capabilities, crucial for proactive management and adjustment of operations [
25].
Digital Twins utilize real-time data from IoT sensors and onsite inputs to update the digital model continuously, enabling managers to forecast potential issues and make informed adjustments promptly. This capability significantly impacts project management effectiveness by aligning project objectives with actual performance. Digital Twins support more informed decision-making by providing detailed insights into project dynamics, thus reducing the risk of costly errors and enhancing project efficiency. They also improve safety, reduce waste, and ensure more efficient use of resources, contributing to more sustainable construction practices [
26,
27,
28,
29,
30,
31,
32,
33,
34].
3. Research Methodology
The methodology of this research was meticulously developed to ensure a robust and repeatable study, focusing on optimizing construction resource management through the innovative use of integrated digital technologies. At the core of our approach lies the seamless integration of Agent-Based Modeling (ABM), Building Information Modeling (BIM), and Bluetooth Low Energy (BLE) technologies, each selected for its ability to contribute to a holistic view of project management and execution
The ABM was operationalized using a state-of-the-art software suite that allowed for the detailed simulation of autonomous agents, reflecting the actions and interactions of workers and resources within the construction environment. BIM was implemented via a leading industry-standard platform, providing a rich, three-dimensional representation of the construction project, which was continuously updated in real-time to reflect on-site conditions. BLE technologies were integrated to facilitate precise and energy-efficient tracking of construction resources, leveraging advanced sensors known for their reliability and accuracy.
For system configuration, a Client Early Warning System (CEWS) was established, utilizing sophisticated algorithms to process data and trigger early alerts for potential project deviations. This was complemented by a Decision Support System (DSS), which employed a real-time analytics engine to synthesize the data into actionable insights, allowing project managers to make informed decisions swiftly. The DSS was intricately woven into the BIM framework, ensuring that all decision-making was grounded in the most current project data.
The data collection process was rigorous and methodical, with BLE sensors placed strategically across the construction site to capture a wide array of operational data. The frequency and parameters of data collection were set to capture a comprehensive dataset, while calibration and preprocessing protocols were established to ensure the integrity and reliability of the data collected.
A detailed case study at Helwan University’s College of Engineering served as the empirical ground for testing our integrated methodology. The implementation steps were carefully documented, from the initial setup of the technological systems to the continuous monitoring and troubleshooting throughout the project duration. Ethical considerations, especially concerning participant privacy and data security, were paramount throughout the study. All data collection methods were approved by an institutional review board, with clear protocols for anonymization and consent in place.
Despite the successful application of our methodology in the case study, we have identified limitations that provide fruitful directions for future research. The scalability of BLE technology in larger or more complex construction environments presents a challenge that future studies might address. Furthermore, the integration of additional data sources and the potential for machine learning to enhance predictive analytics in construction management are areas we recommend for exploration.
4. Interoperability and Data Integration
At the core of CEWS’s efficacy is the seamless interoperability between various construction management applications, including DSS-V.3.2020 systems, Excel.V.2021, and Primavera- P6.V.21.12 Interoperability in this context refers to the ability of different software systems and applications to communicate, exchange data, and utilize the information that has been exchanged efficiently.
To manage the complexities of data interoperability, the DSS Excel sheet is structured to support the main dashboard, providing a clear inventory and tracking system for ongoing construction activities. Each parameter listed in the DSS is meticulously defined with units, data sources, and a detailed methodology for creating integration links, ensuring data consistency and reliability.
4.1. Data Mapping and API Integration
A critical component of our data strategy is outlined in
Table 1, which presents a detailed mapping of data models and demonstrates the interoperability between the DSS, Primavera, and BLE (Bluetooth Low Energy) devices. These devices serve as primary data sources, with information flow being managed through an Application Programming Interface (API). The API facilitates real-time data exchange, allowing for immediate updates within the DSS via Excel equations or direct data entries as necessary. Furthermore, integration techniques, such as direct API calls, Excel macros, and manual entries, are employed to ensure that data from Primavera and BLE devices are synchronized with the DSS, maintaining data integrity across systems.
4.2. Visualization and Real-Time Tracking
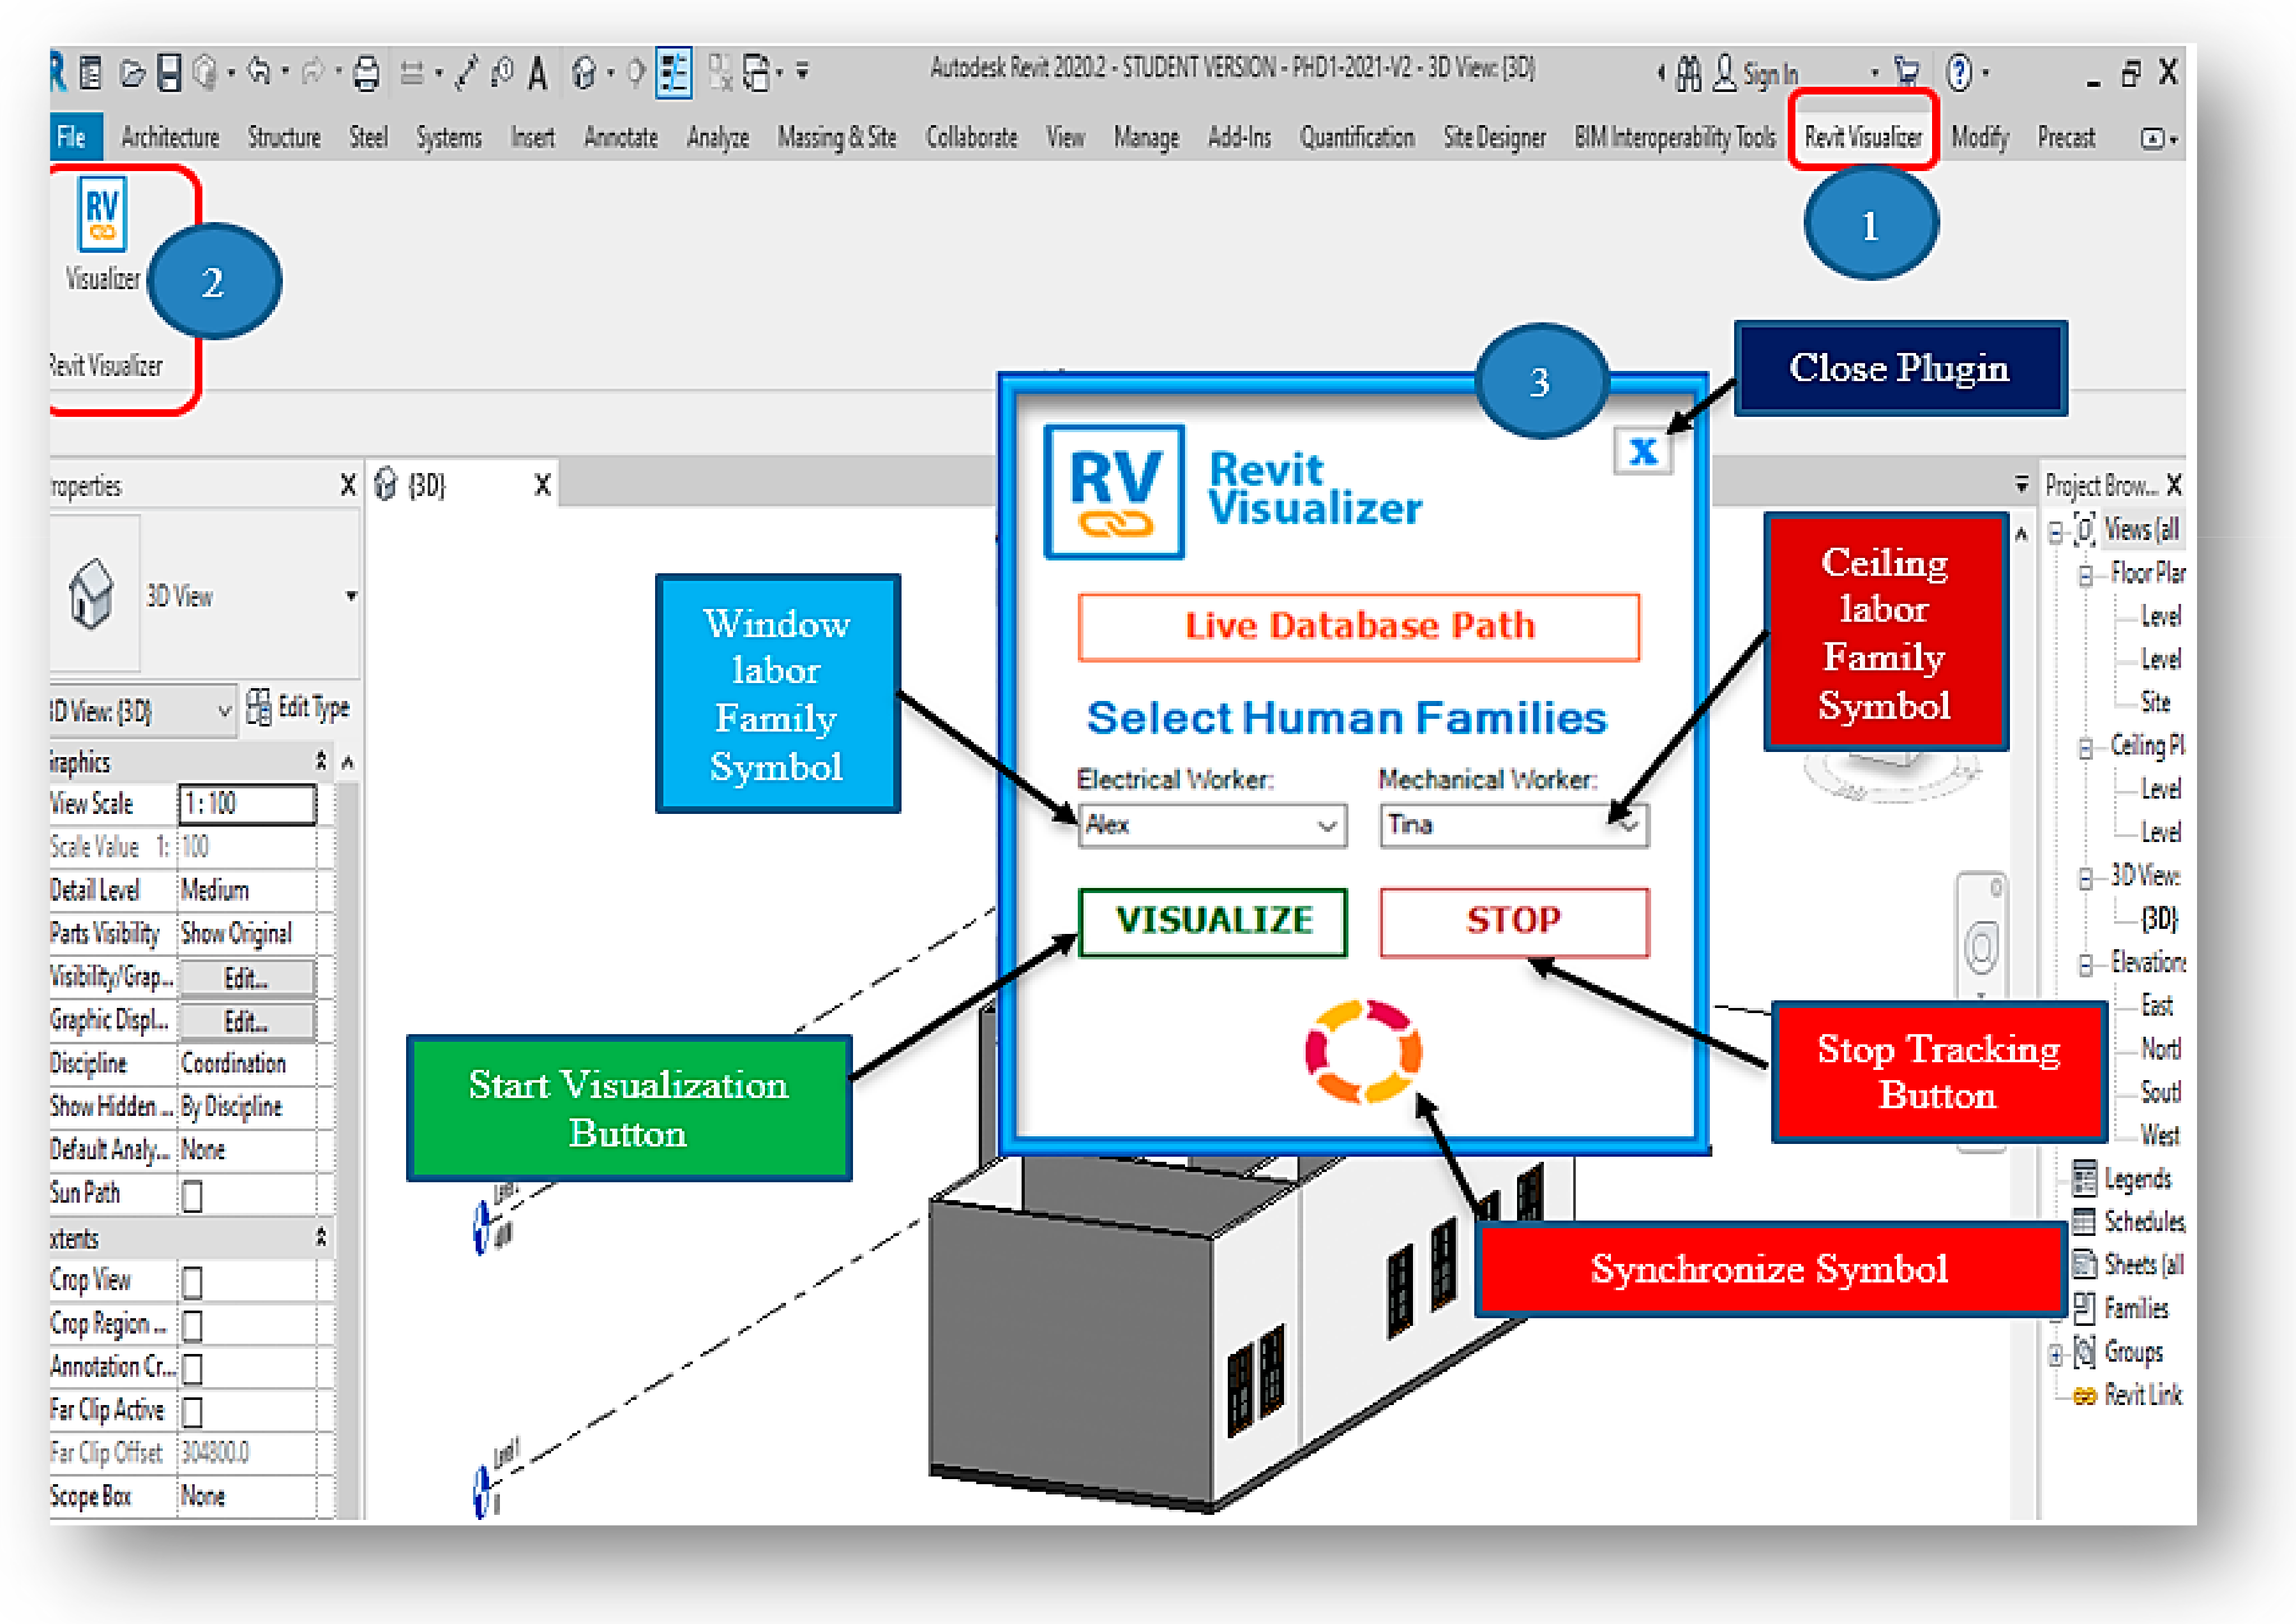
To enhance data visualization and real-time tracking capabilities, a Revit Visualizer plugin was developed using C-Sharp and the Dot-Net Framework. This tool integrates real-time worker status directly into the BIM model, as depicted in
Figure 1. It serves as a dynamic visualization tool that not only provides updates on worker activities but also assists in managing and visualizing tracking data effectively.
Moreover, the database generator, part of the CEWS, has been designed to handle, store, and visualize tracking data, ensuring that all project data are accurate and accessible. This integration is supported by three key modules.
4.3. Consideration of Interoperability Parameters
Addressing interoperability between DSS, Excel, and Primavera involved careful consideration of various parameters essential for effective data exchange. These include data format compatibility, real-time data update capability, and system security protocols, ensuring that all data transfers are secure and efficient. Our approach is informed by best practices in software interoperability, as detailed in the essential reference on interoperability [
31].
4.4. Tools and Technologies
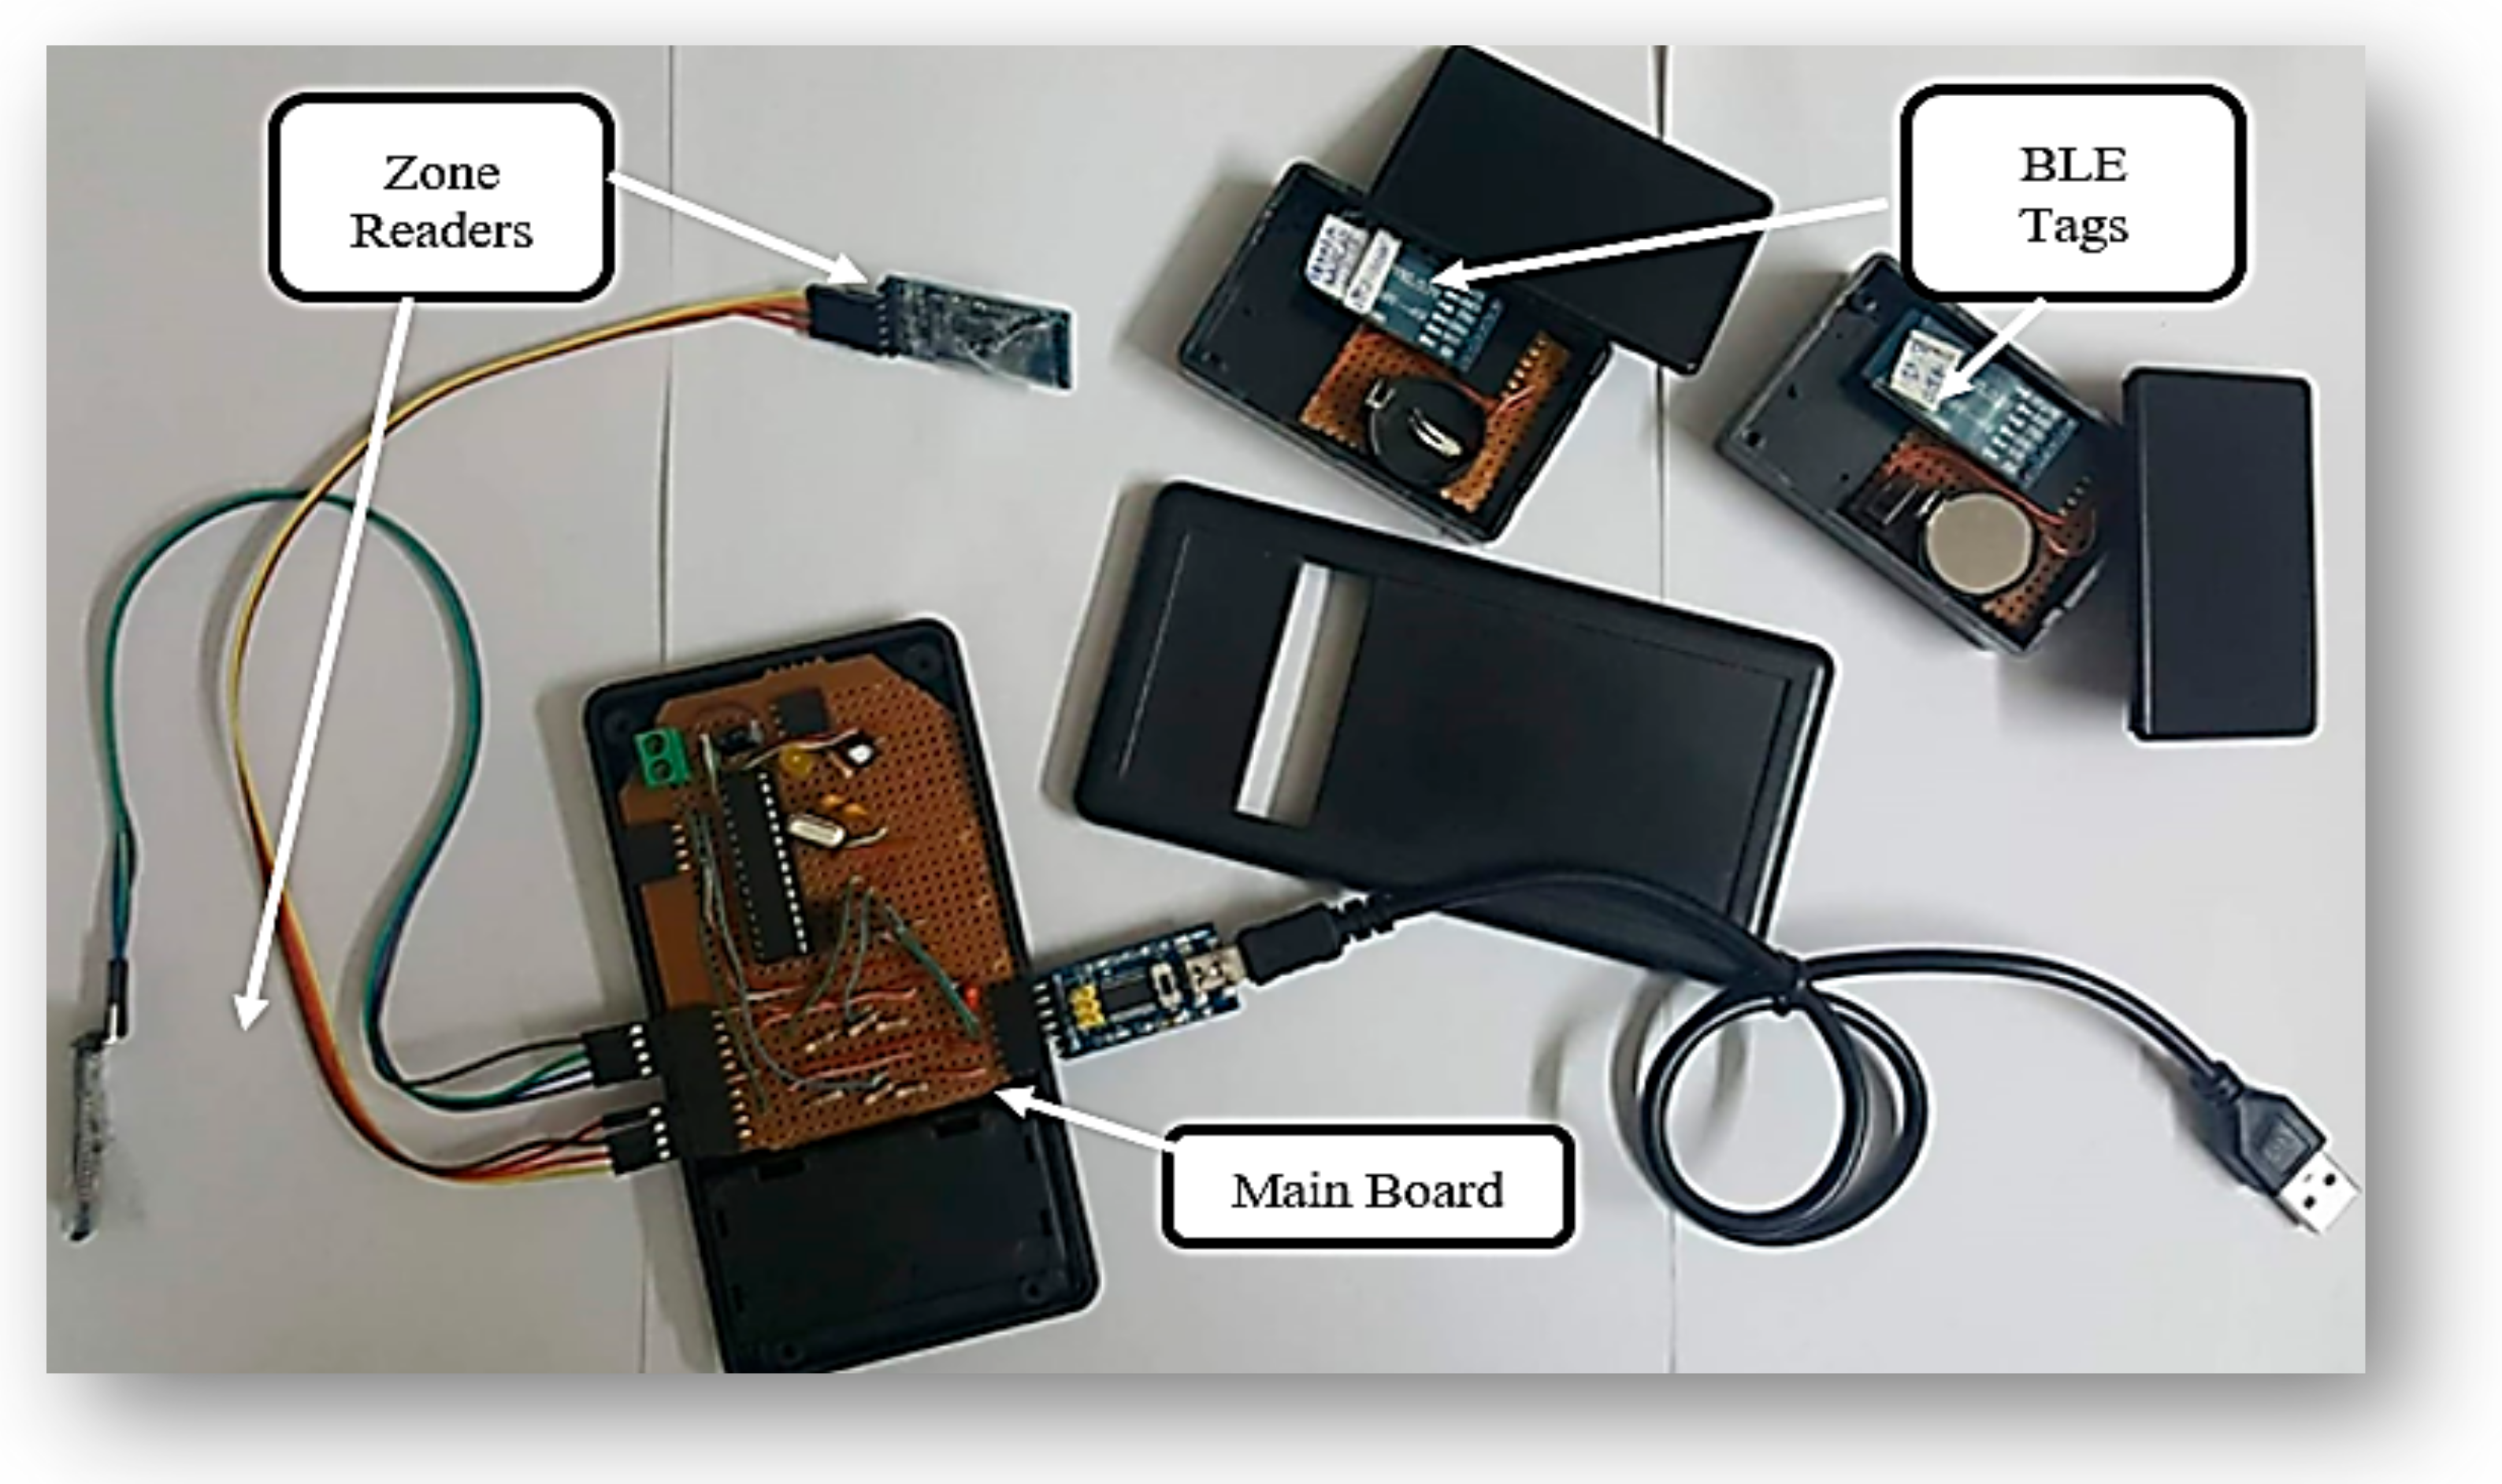
To implement the proposed technique, BLE devices were adapted and configured to enable accurate indoor tracking, taking into account the specific availability and market considerations as shown in
Figure 2.
5. Development and Application of Advanced Tracking, Visualization, and Early Warning Systems
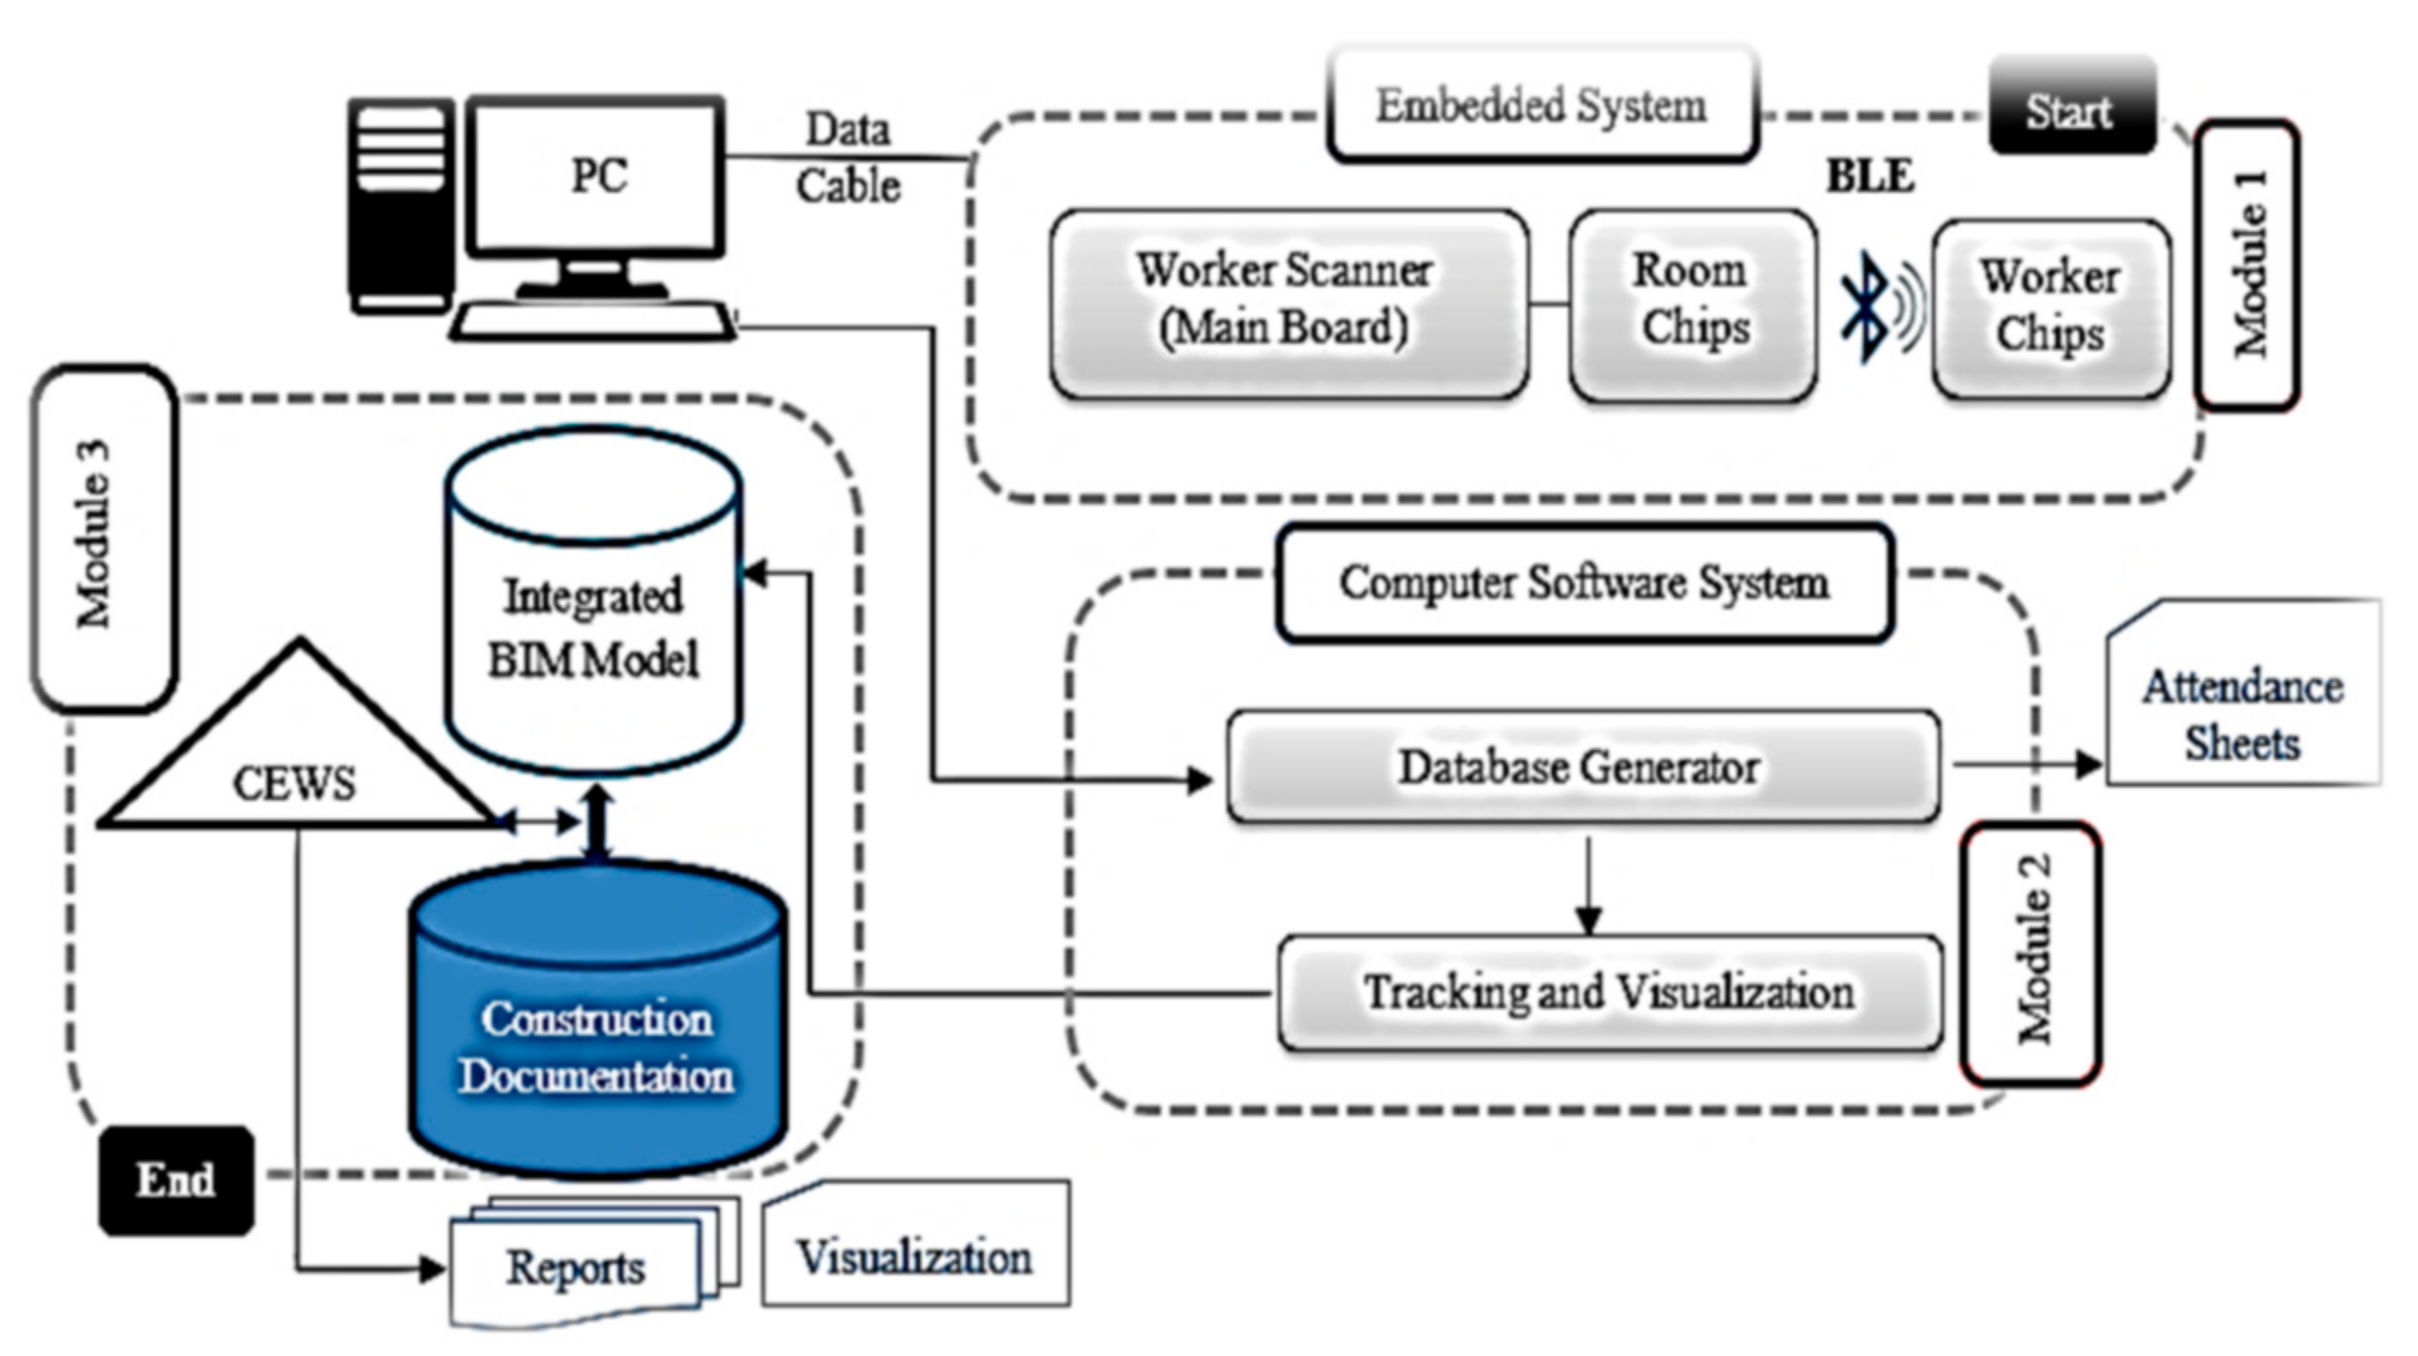
In the ever-evolving landscape of construction management, the integration of advanced technologies has become pivotal in addressing the complex challenges of project delays, labor inefficiency, and safety concerns. Traditional methods often fall short in providing the dynamic and real-time data necessary for effective decision-making and resource allocation. Recognizing this gap, our research focuses on the development and implementation of three innovative modules: an advanced embedded system for indoor tracking, a dynamic database with real-time visualization capabilities, and an enhanced client early warning system. A s shown in
Figure 3, each module is designed to leverage cutting-edge software and hardware to significantly improve the accuracy, efficiency, and responsiveness of construction project management.
5.1. Module One: Advanced Embedded System for Indoor Tracking
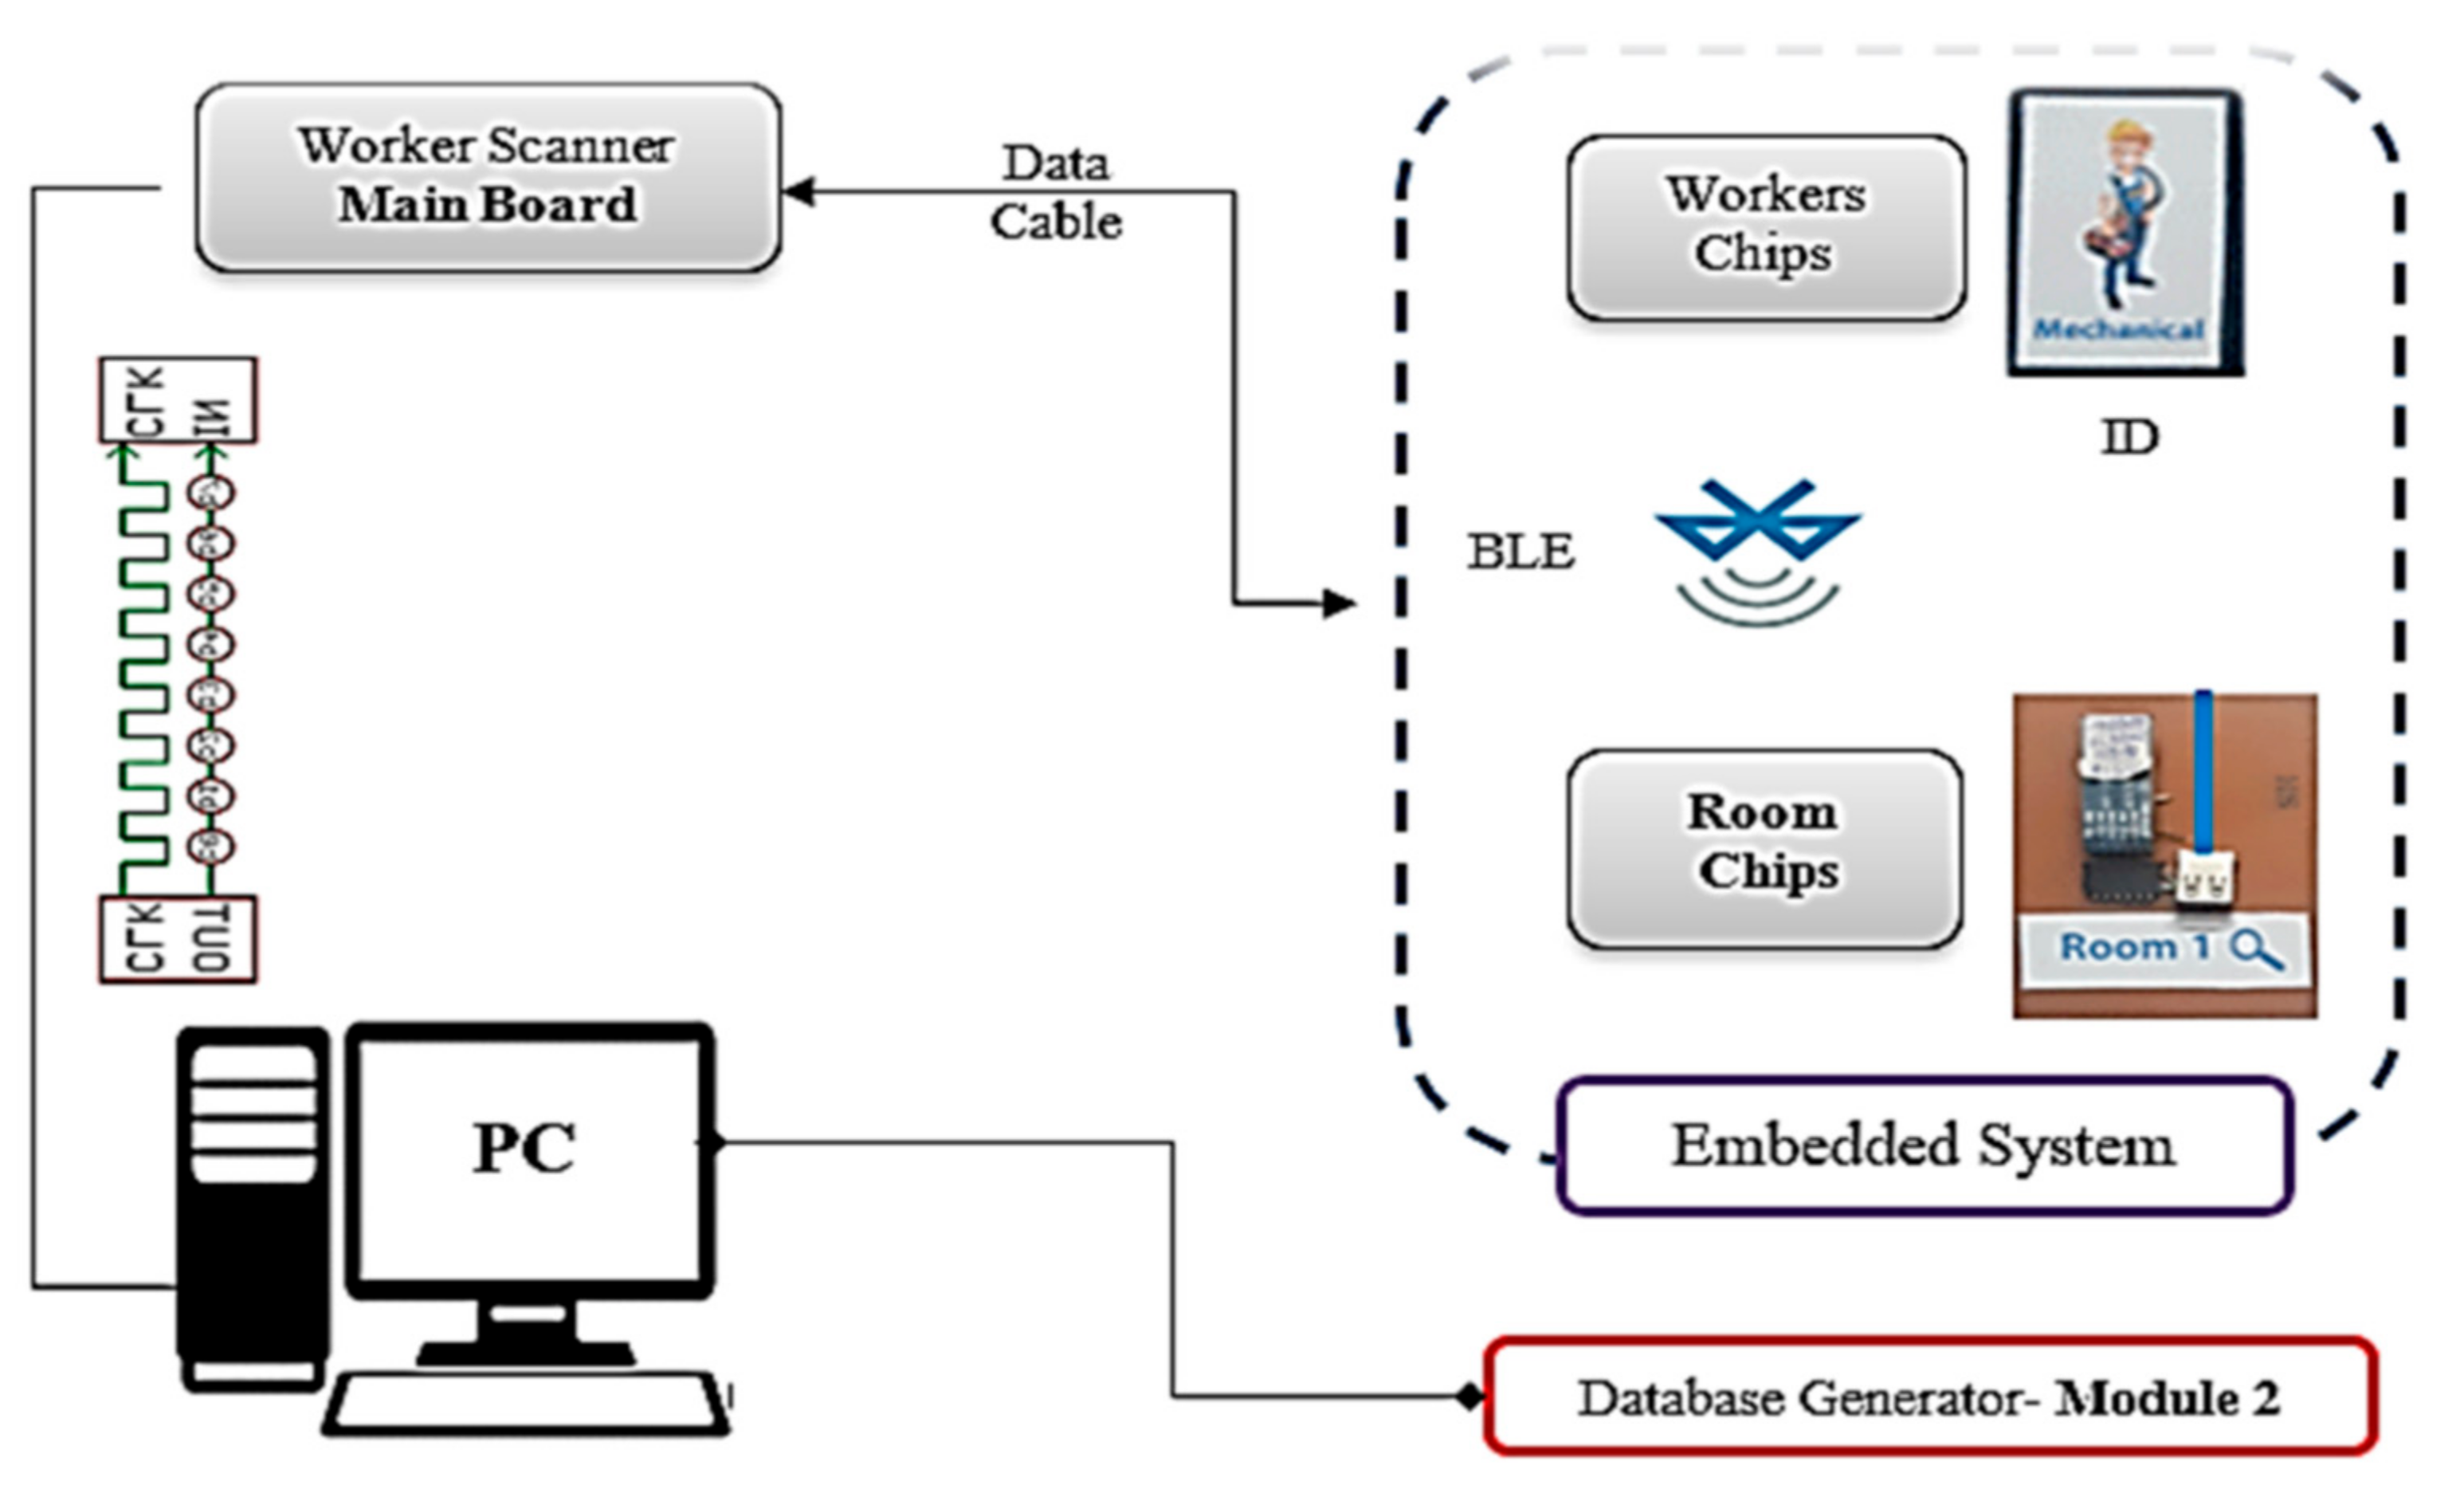
Module One is centered around the development of an advanced embedded system specifically tailored for indoor tracking in construction environments. Leveraging the Arduino software—an open-source Integrated Development Environment (IDE)—this module enhances traditional tracking systems by enabling the continuous broadcasting of worker tags that include both identification and location information. The system’s mainboard is engineered to facilitate robust communication with zone ship readers, collecting and processing data to provide real-time insights into worker movements and allocations. This integration allows for enhanced monitoring and management of labor resources, ensuring that personnel are efficiently deployed across the construction site (see
Figure 4).
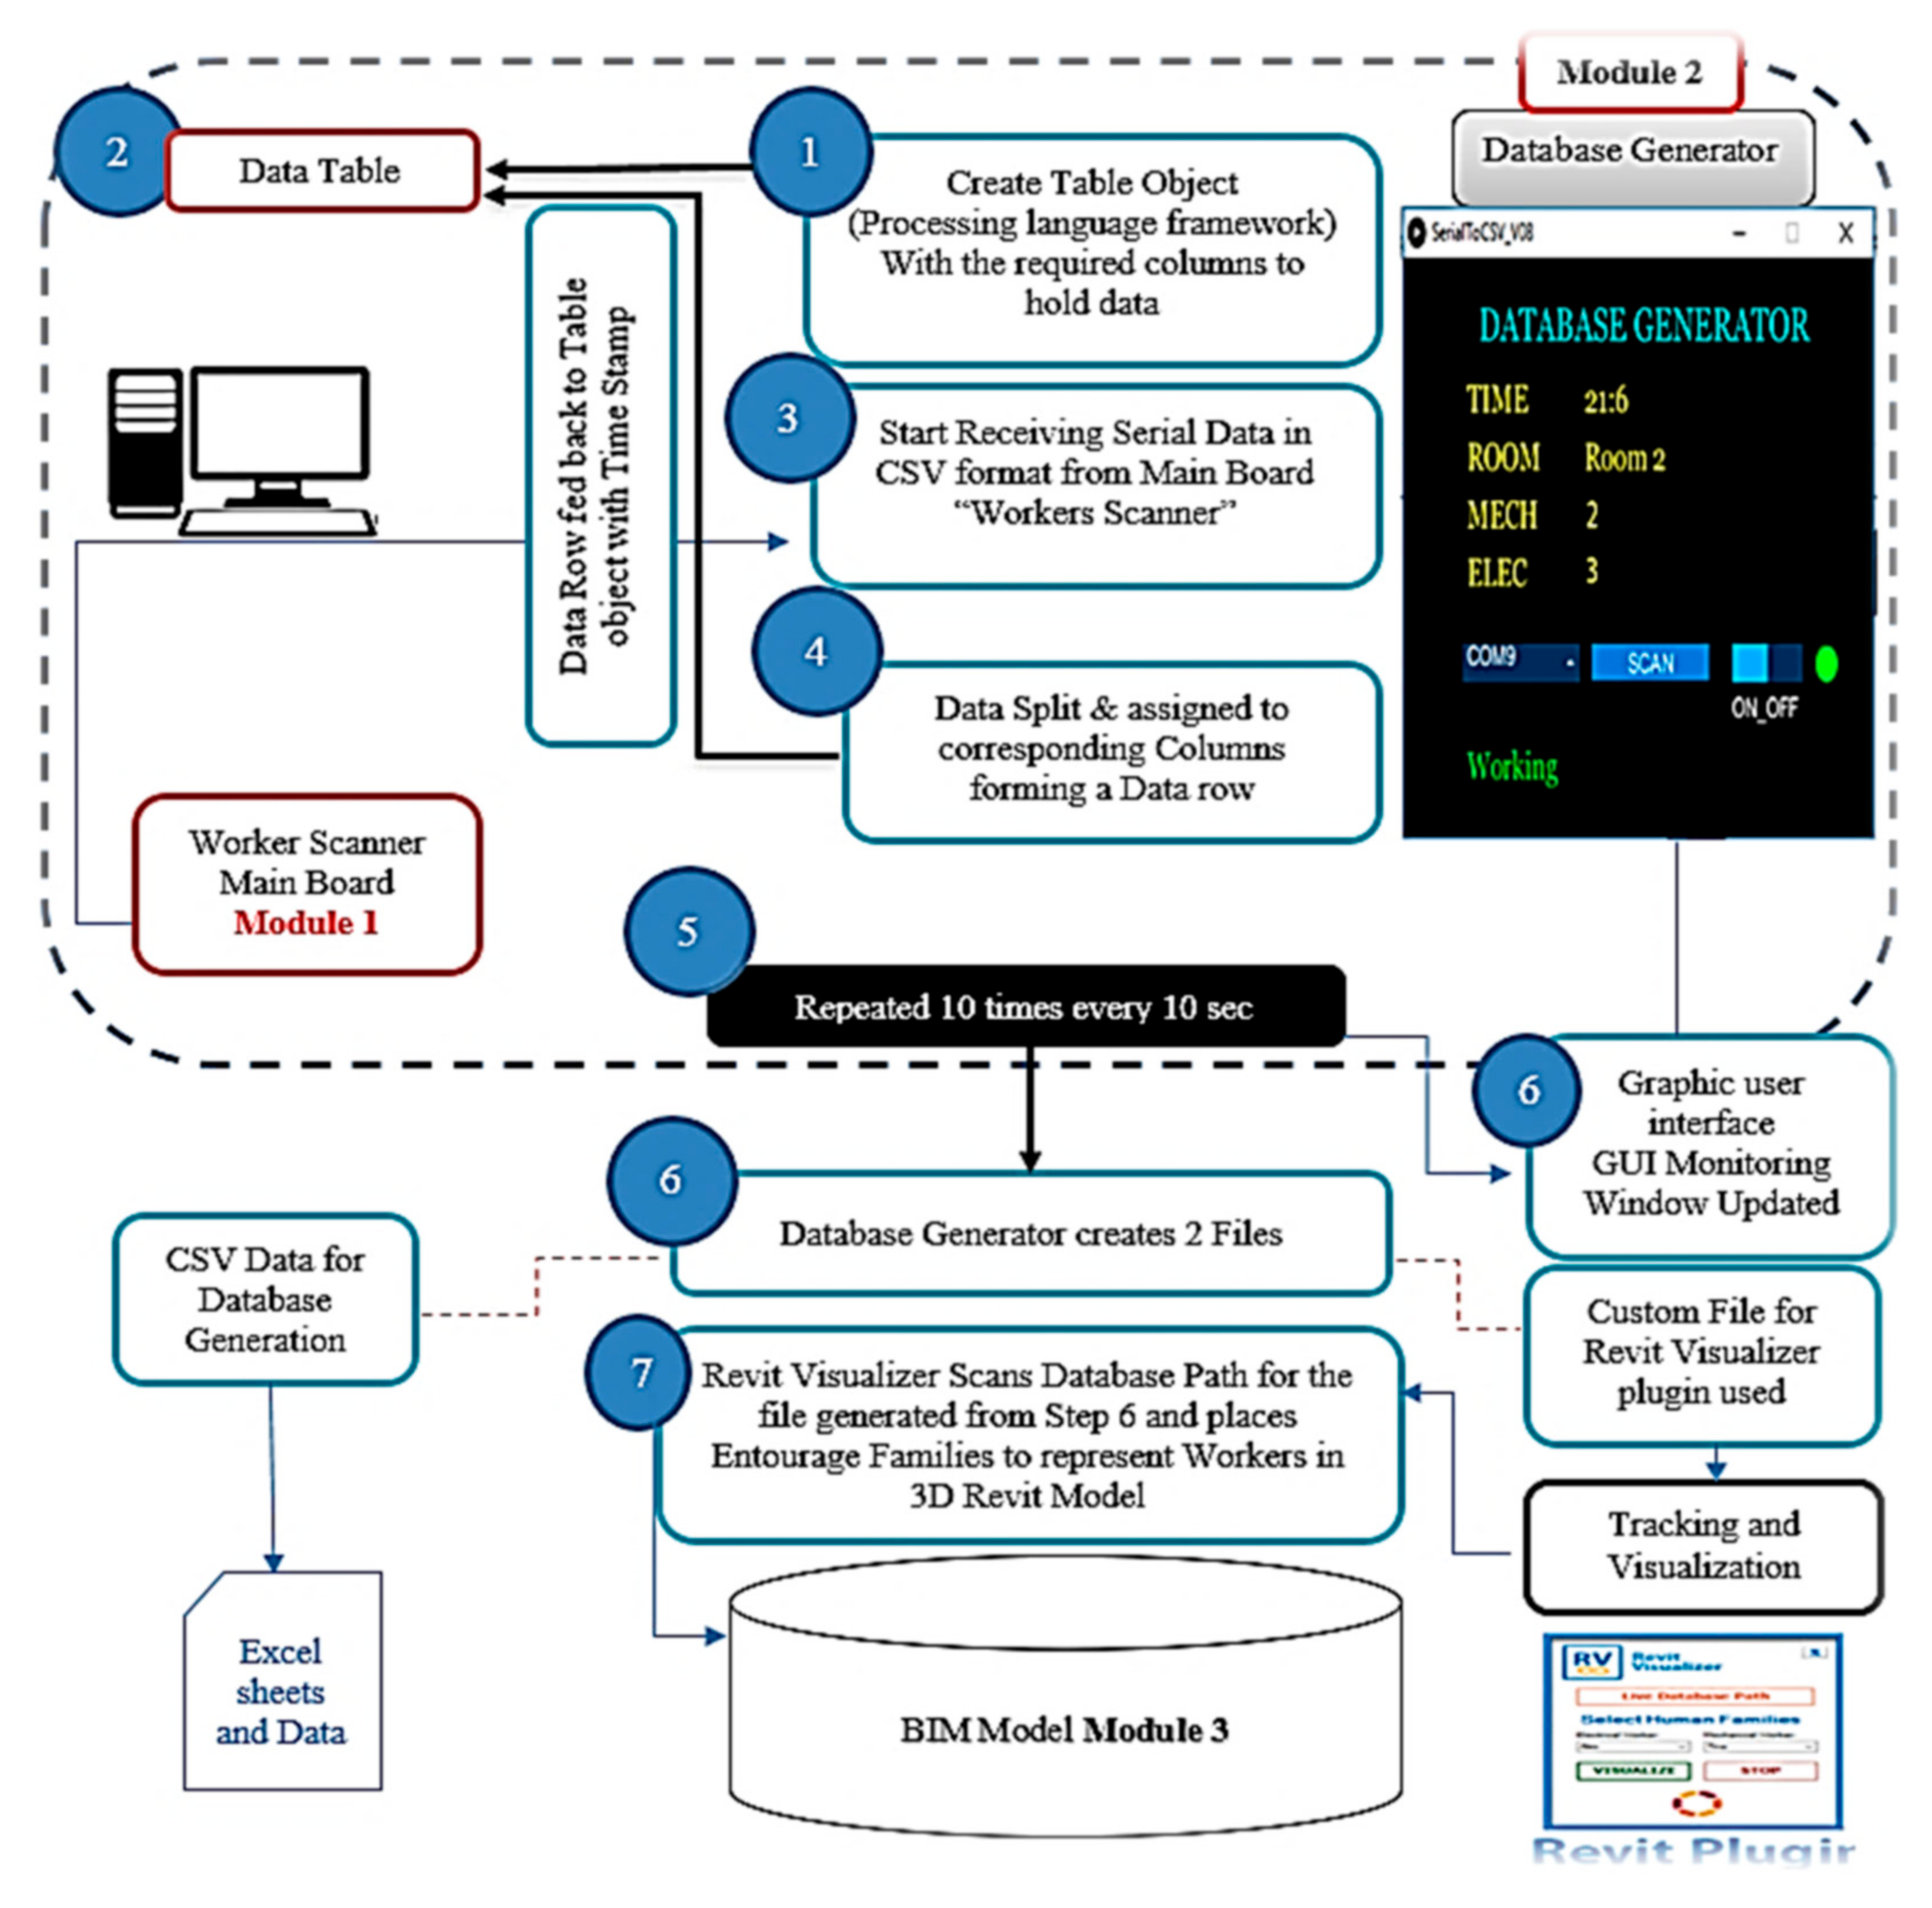
5.2. Module Two: Dynamic Database Generation and Real-Time Visualization
Module Two involves the creation of a sophisticated database generator and a real-time visualization tool that together form the core of our enhanced tracking system. The database generator acts as middleware, adeptly handling data received in CSV format from the worker scanner. It meticulously processes this data, organizing it into structured databases with precise timestamps for accurate, real-time attendance and location tracking. The accompanying visualization tool is integrated seamlessly with the BIM model, enabling dynamic visualization of worker positions and statuses. This system not only enhances the granularity and accuracy of data representation but also supports immediate decision-making by providing up-to-date visual insights into workforce distribution (see
Figure 5).
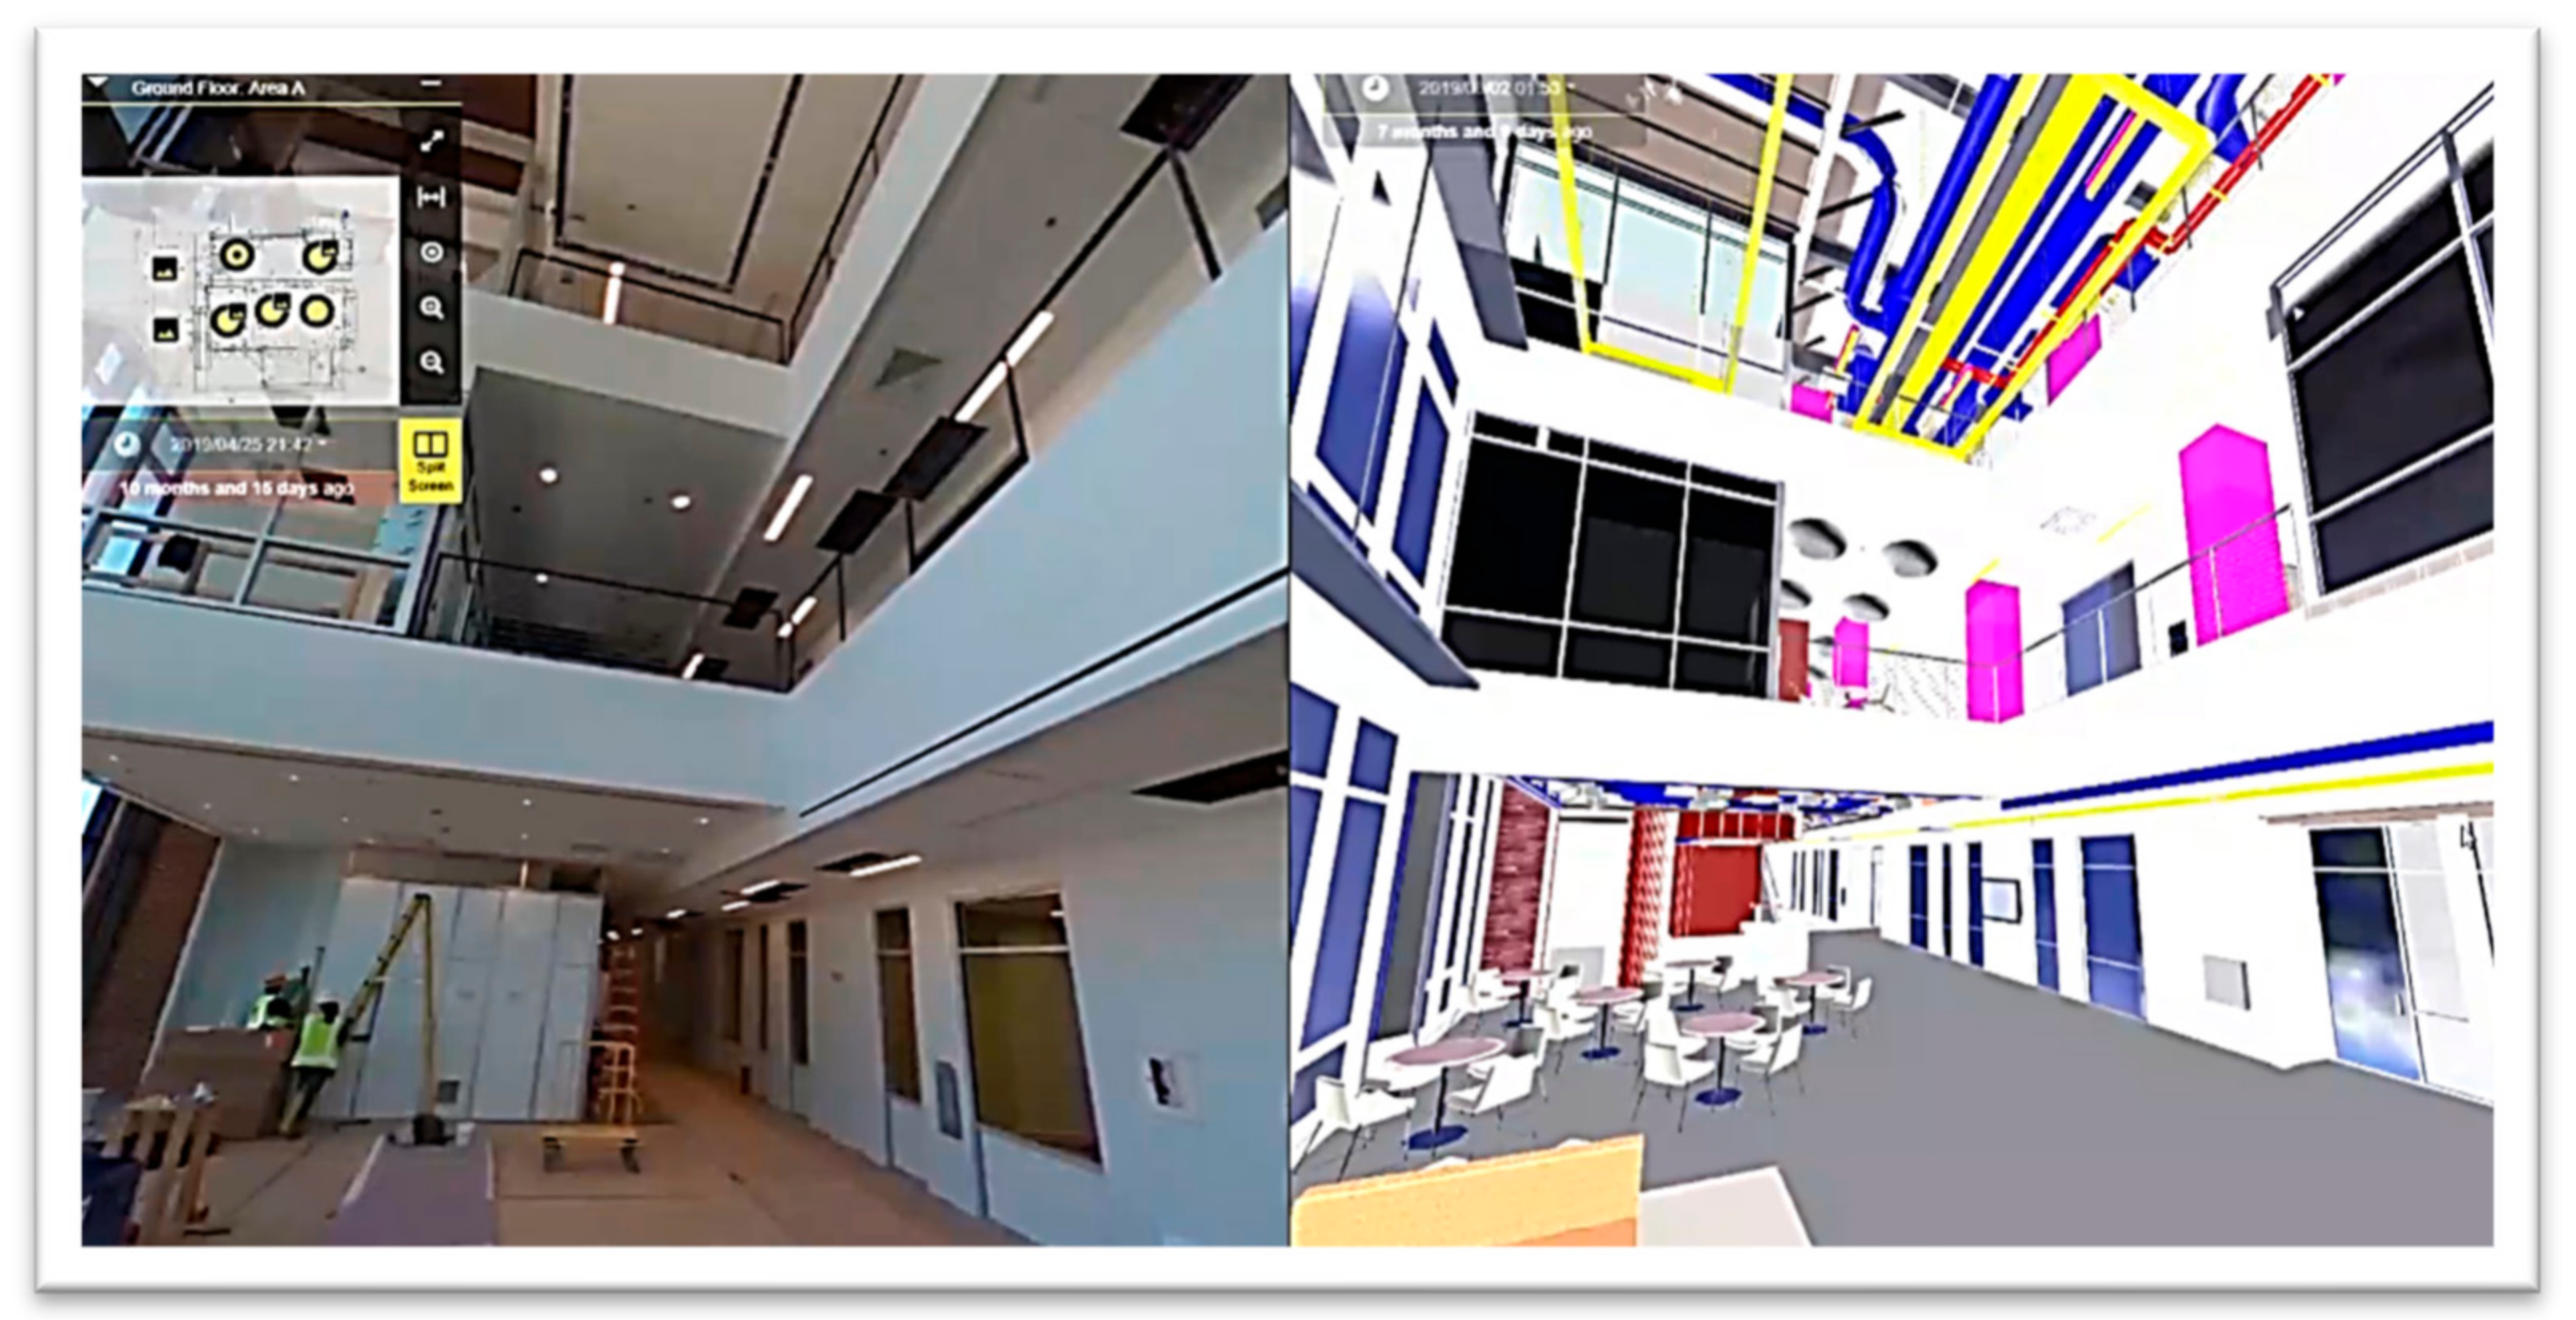
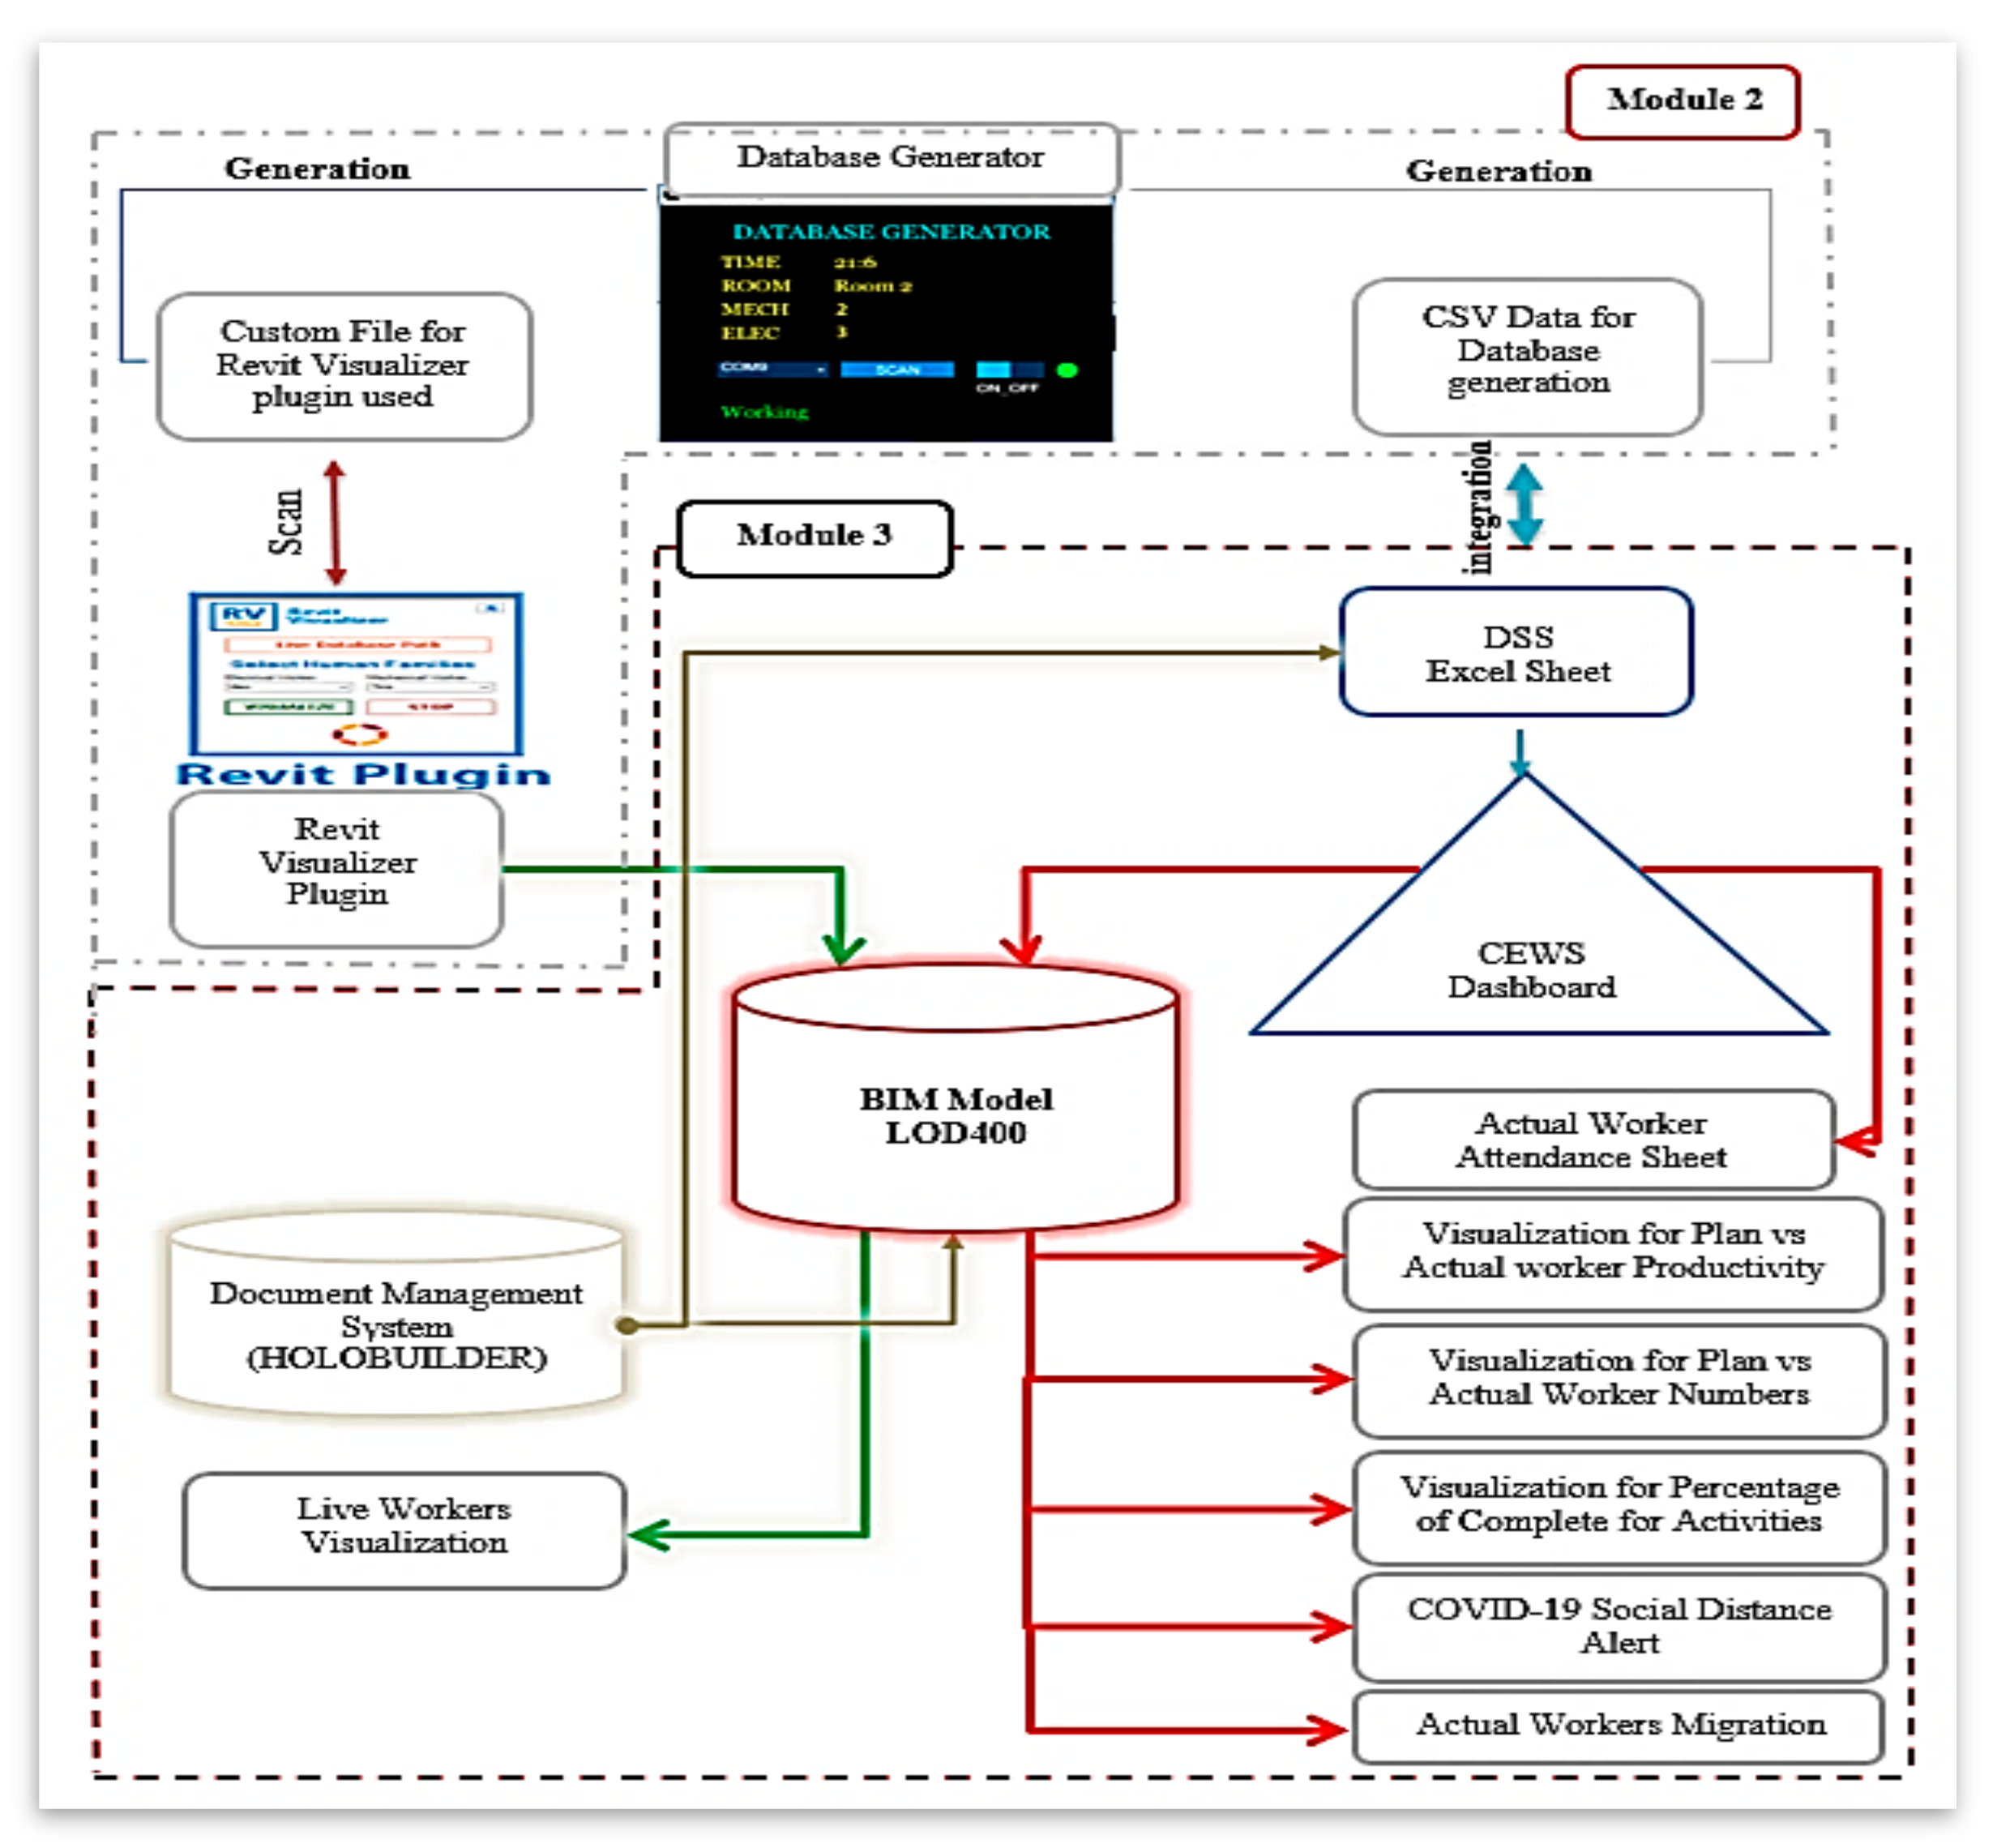
5.3. Module Three: Construction Documentation and Enhanced Client Early Warning System (CEWS)
Module Three focuses on revolutionizing construction documentation and proactive project management through the implementation of the Client Early Warning System (CEWS). Utilizing a 360-degree camera, this module captures comprehensive visual data of the construction progress, which is then integrated into a platform called HOLOBUILDER for effective progress tracking and management. The integration extends into the BIM environment, providing a panoramic, interactive view of the site, which is crucial for detailed documentation and progress assessment (see
Figure 6 and
Figure 7). Additionally, CEWS is tightly coupled with project planning tools, like Primavera, enhancing traditional project management by enabling the system to visualize worker productivity directly within the BIM model. Productivity metrics are displayed through intuitive visual symbols that correlate with planning data, allowing clients and project managers to quickly assess project status and make informed, timely interventions. The CEWS’s functionality is enriched by its integration with an Excel dashboard, which further refines the system’s ability to present data-driven visualizations tailored to specific project needs.
6. Verification of the Proposed Technique
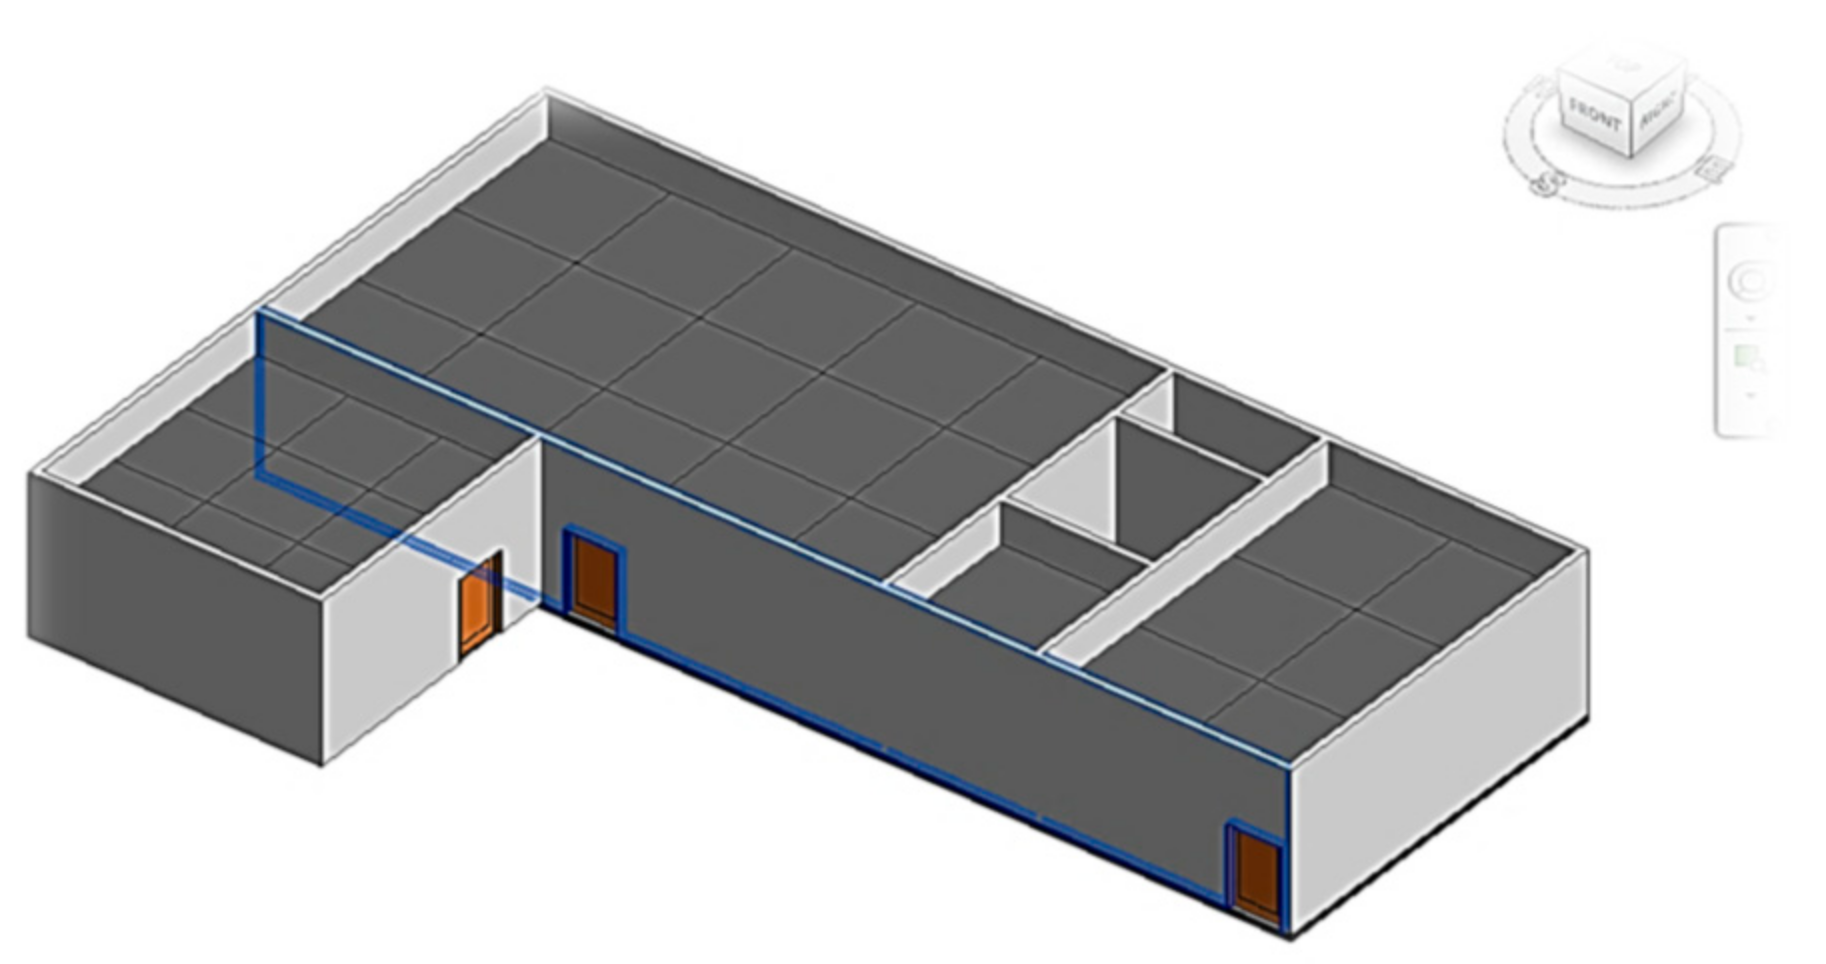
A critical element of our research involved rigorously testing the validity and reliability of the proposed integrated technological modules. The field test for the developed methodology was conducted at a designated section of the College of Engineering at Mataria, Helwan University, as illustrated in
Figure 8. This location was selected due to its representative characteristics, which provided an ideal environment for initial testing and observation of the implemented systems under real-world conditions.
6.1. Controlled Environment and Monitoring
To mitigate these limitations and enhance the robustness of our findings, the field test was designed to be tightly controlled and meticulously monitored. This approach allowed for precise data collection and the ability to observe the direct impacts of the integrated systems on construction management processes. However, the inherent costs associated with equipping a large number of laborers with the necessary technology to track various tasks and activities in a broader study presented a significant challenge.
6.2. Future Research and Broader Validation
Given the constraints of a single-site study, further research involving multiple diverse construction sites is recommended to validate the effectiveness and applicability of the methodology across different contexts. Such studies would help ascertain the scalability of the proposed solutions and provide a more comprehensive understanding of their potential impact in various settings. Expanding the scope of testing would also allow for the refinement of the systems based on a wider range of operational challenges and user feedback, thereby enhancing the overall utility and adaptability of the technological solutions we have developed.
This section of the study is crucial for identifying the boundaries and potential scalability issues of our proposed systems. By addressing these aspects, we aim to provide a clear, honest assessment of our methodology’s capabilities and limitations, setting the stage for future enhancements and wider application in the field of construction management.
7. Applying the Proposed Technique on a Case Study
To validate the practicality and benefits of the proposed technique, a detailed case study was conducted at Helwan University, College of Engineering, as illustrated in
Figure 8. This study focused on employing agent-based modeling combined with digital twin development for optimal construction resource positioning. The project involved constructing a commercial building with a single floor, situated in a complex area, under strict timelines that demanded highly efficient resource management. Two critical construction activities were selected for this study: the installation of aluminum windows and ceiling construction.
7.1. Implementation of the Proposed Methodology
The proposed methodology was strategically implemented in the Project to enhance resource positioning and streamline construction management processes. The following key steps were undertaken as described in sequence.
7.2. Model Development
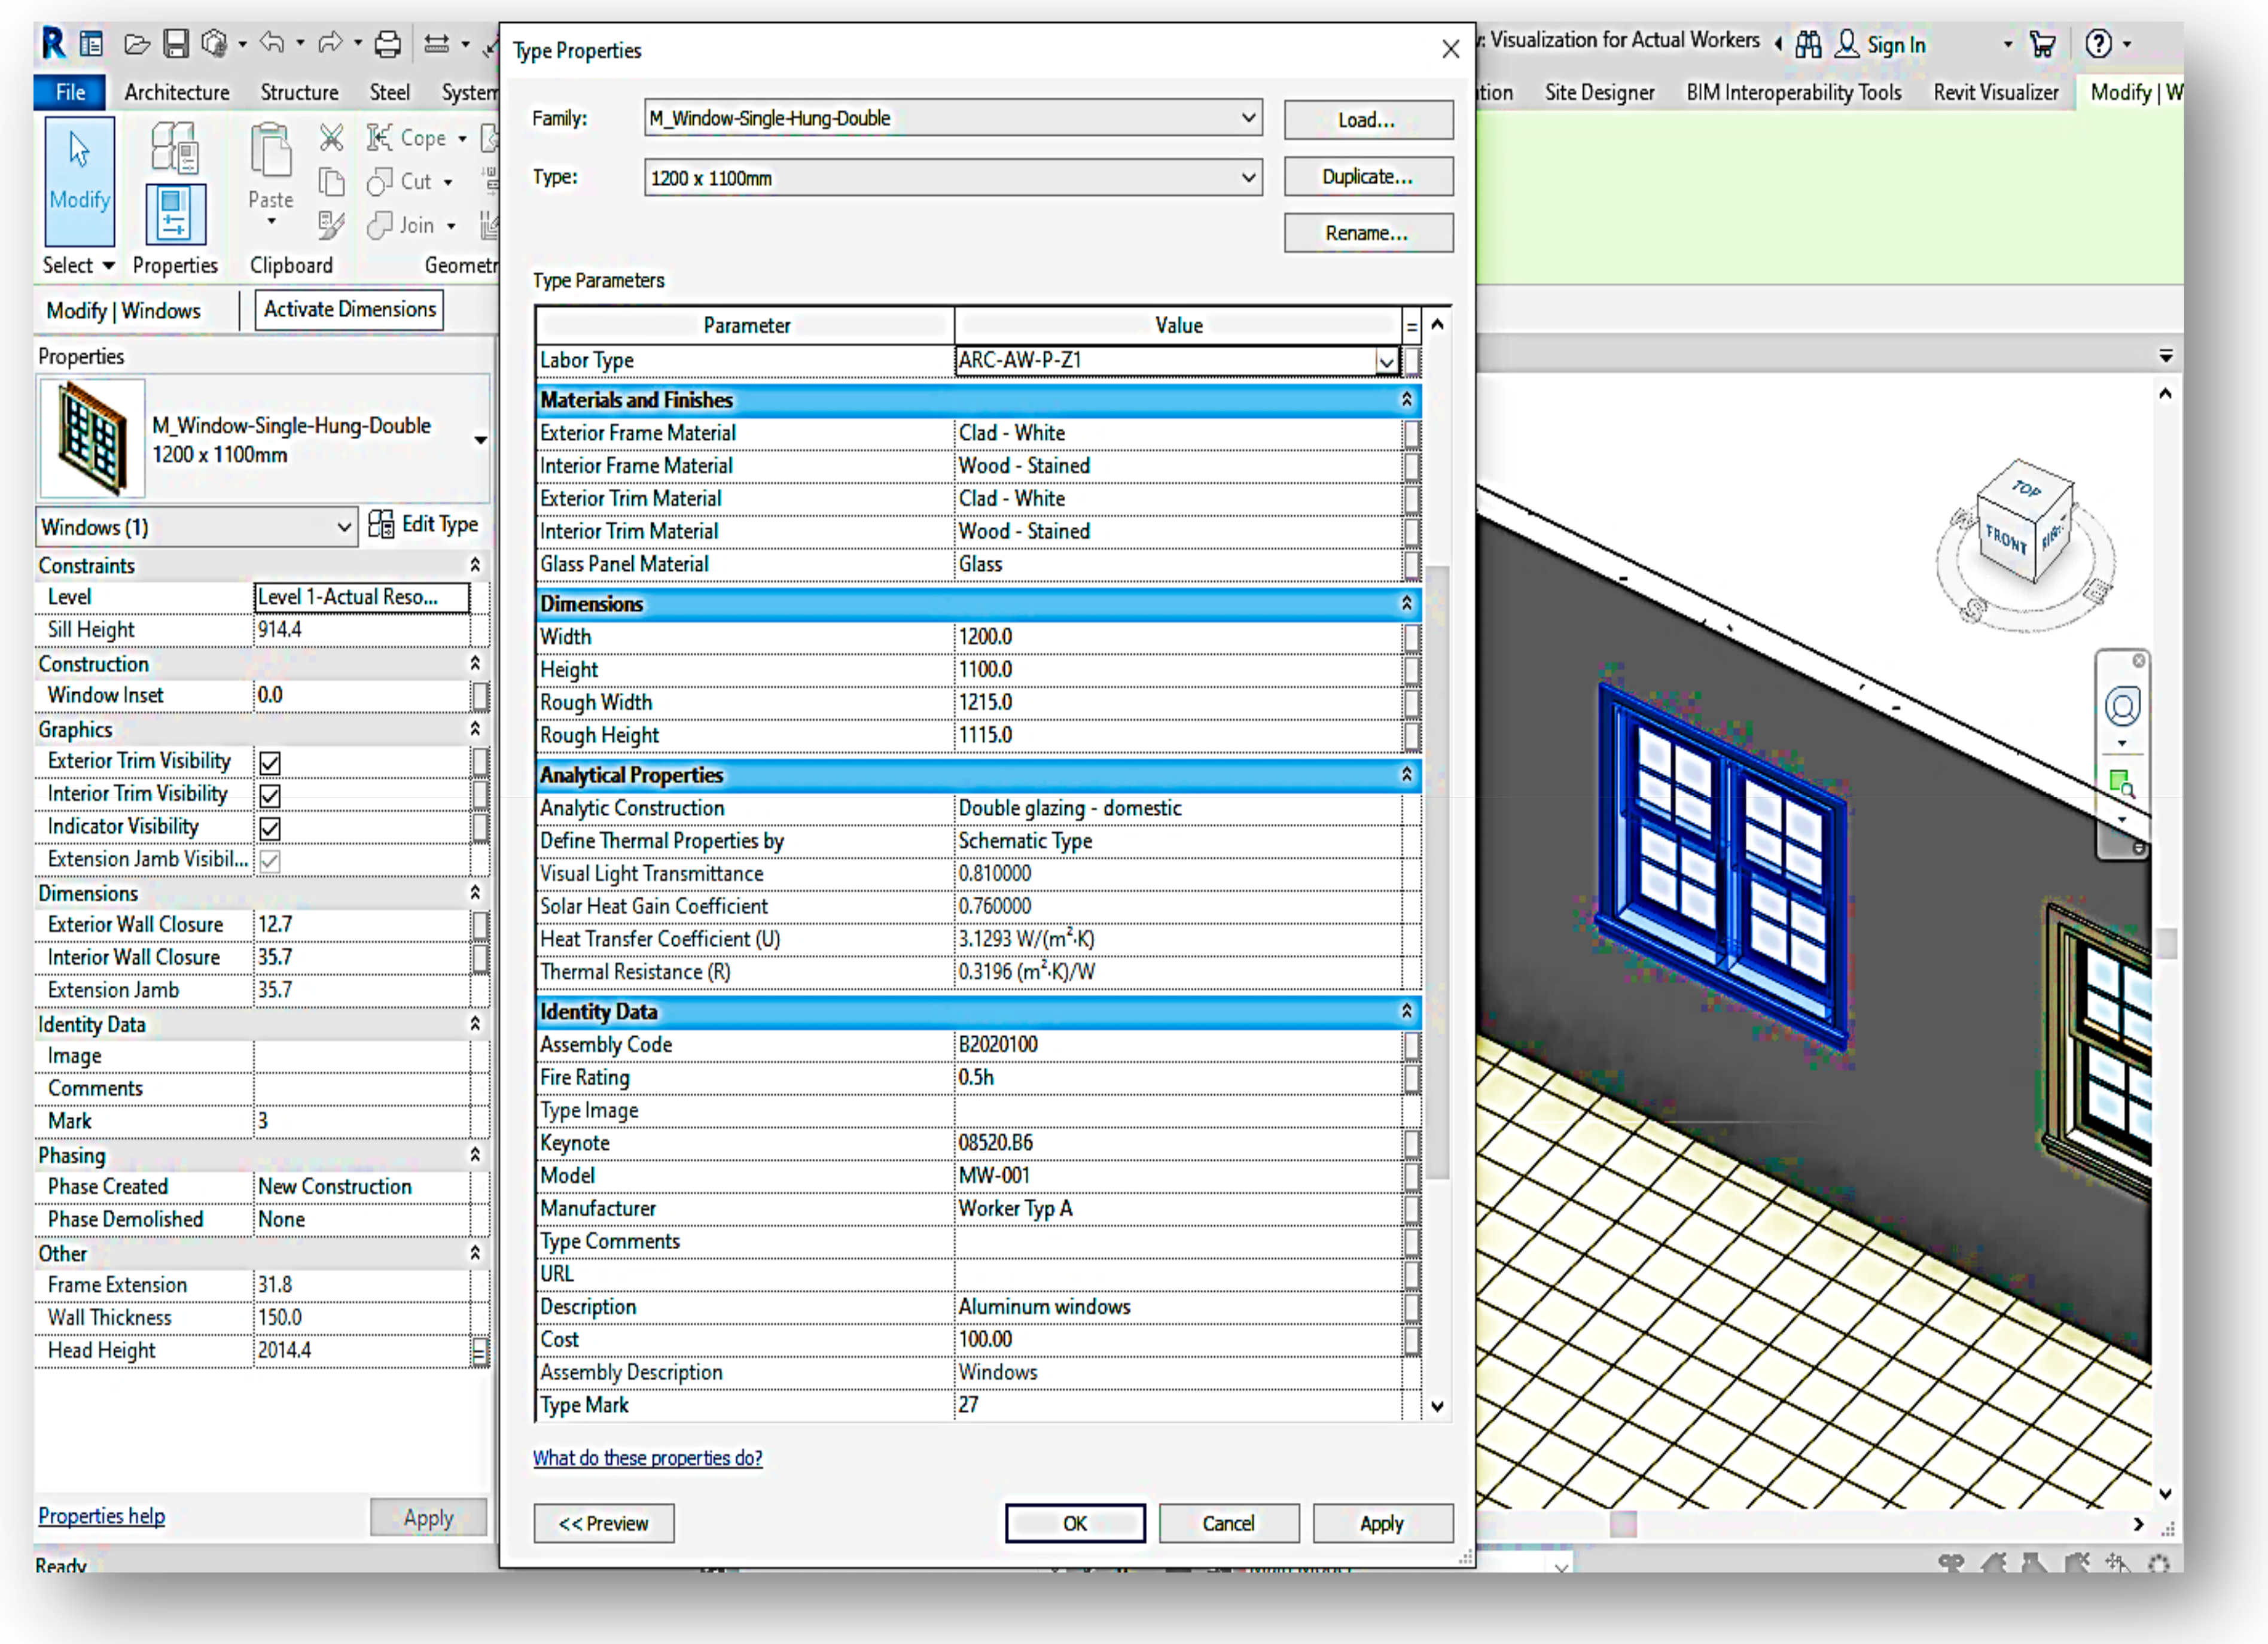
BIM models were intricately developed to a Level of Development (LOD) 400, adhering to the standards set forth by BIMFORUM 2024. The models were enriched with comprehensive details, including Omni Class, Keynotes, Dimensions, Physical Information, Type Mark, and Worker Type, enhancing their utility and accuracy (
Figure 9). Additionally, Revit families were customized to meet the specific requirements of the project, with detailed parameters for windows and ceiling operations showcased in
Figure 10.
7.3. Framework Development and Tool Selection
A robust framework for indoor tracking was established using Bluetooth Low Energy (BLE) technology within the BIM environment. This setup involved selecting appropriate tools that matched the project’s requirements, including BLE devices, the Revit Visualizer plugin, and the HOLOBUILDER platform, ensuring seamless compatibility and integration.
7.4. Implementing Module One: Embedded System Development
An advanced embedded system was meticulously developed and deployed within the project. BLE tags were assigned to each worker and integrated into their safety jackets. This system utilized the Autodesk Revit V.2023.1.3 and an integrated development environment (IDE) to configure the worker scanner mainboard. This configuration facilitated the continuous broadcasting of worker tags, enabling accurate and real-time collection of identification and location information.
7.5. Implementing Module Two: Database Generation and Visualization
The database generator and visualization tool were implemented to efficiently manage and synthesize the tracking data with the BIM model. Data received from the worker scanner in CSV format was processed and organized into a structured database, enhancing data accuracy and accessibility (
Figure 11 and
Figure 12). The visualization tool then enabled real-time visualization of worker positions and statuses within the BIM model, providing critical insights for immediate decision-making.
7.6. Implementing Module Three: Construction Documentation and (CEWS)
To further augment project monitoring and enhance decision-making capabilities, construction documentation and the Client Early Warning System (CEWS) were integrated. A 360-degree camera captured detailed progress at various stages, with HOLOBUILDER efficiently managing and integrating these images into the BIM environment. The CEWS, connected with Primavera, gathered planning data and computed productivity metrics using an activity-oriented model, offering a comprehensive and dynamic dashboard for client review (
Figure 13).
8. Results of Application and Benefits
The implementation of the proposed technique in the Project resulted in significant benefits. The Decision Support System (DSS) and CEWS provided valuable insights and facilitated data-driven decision-making.
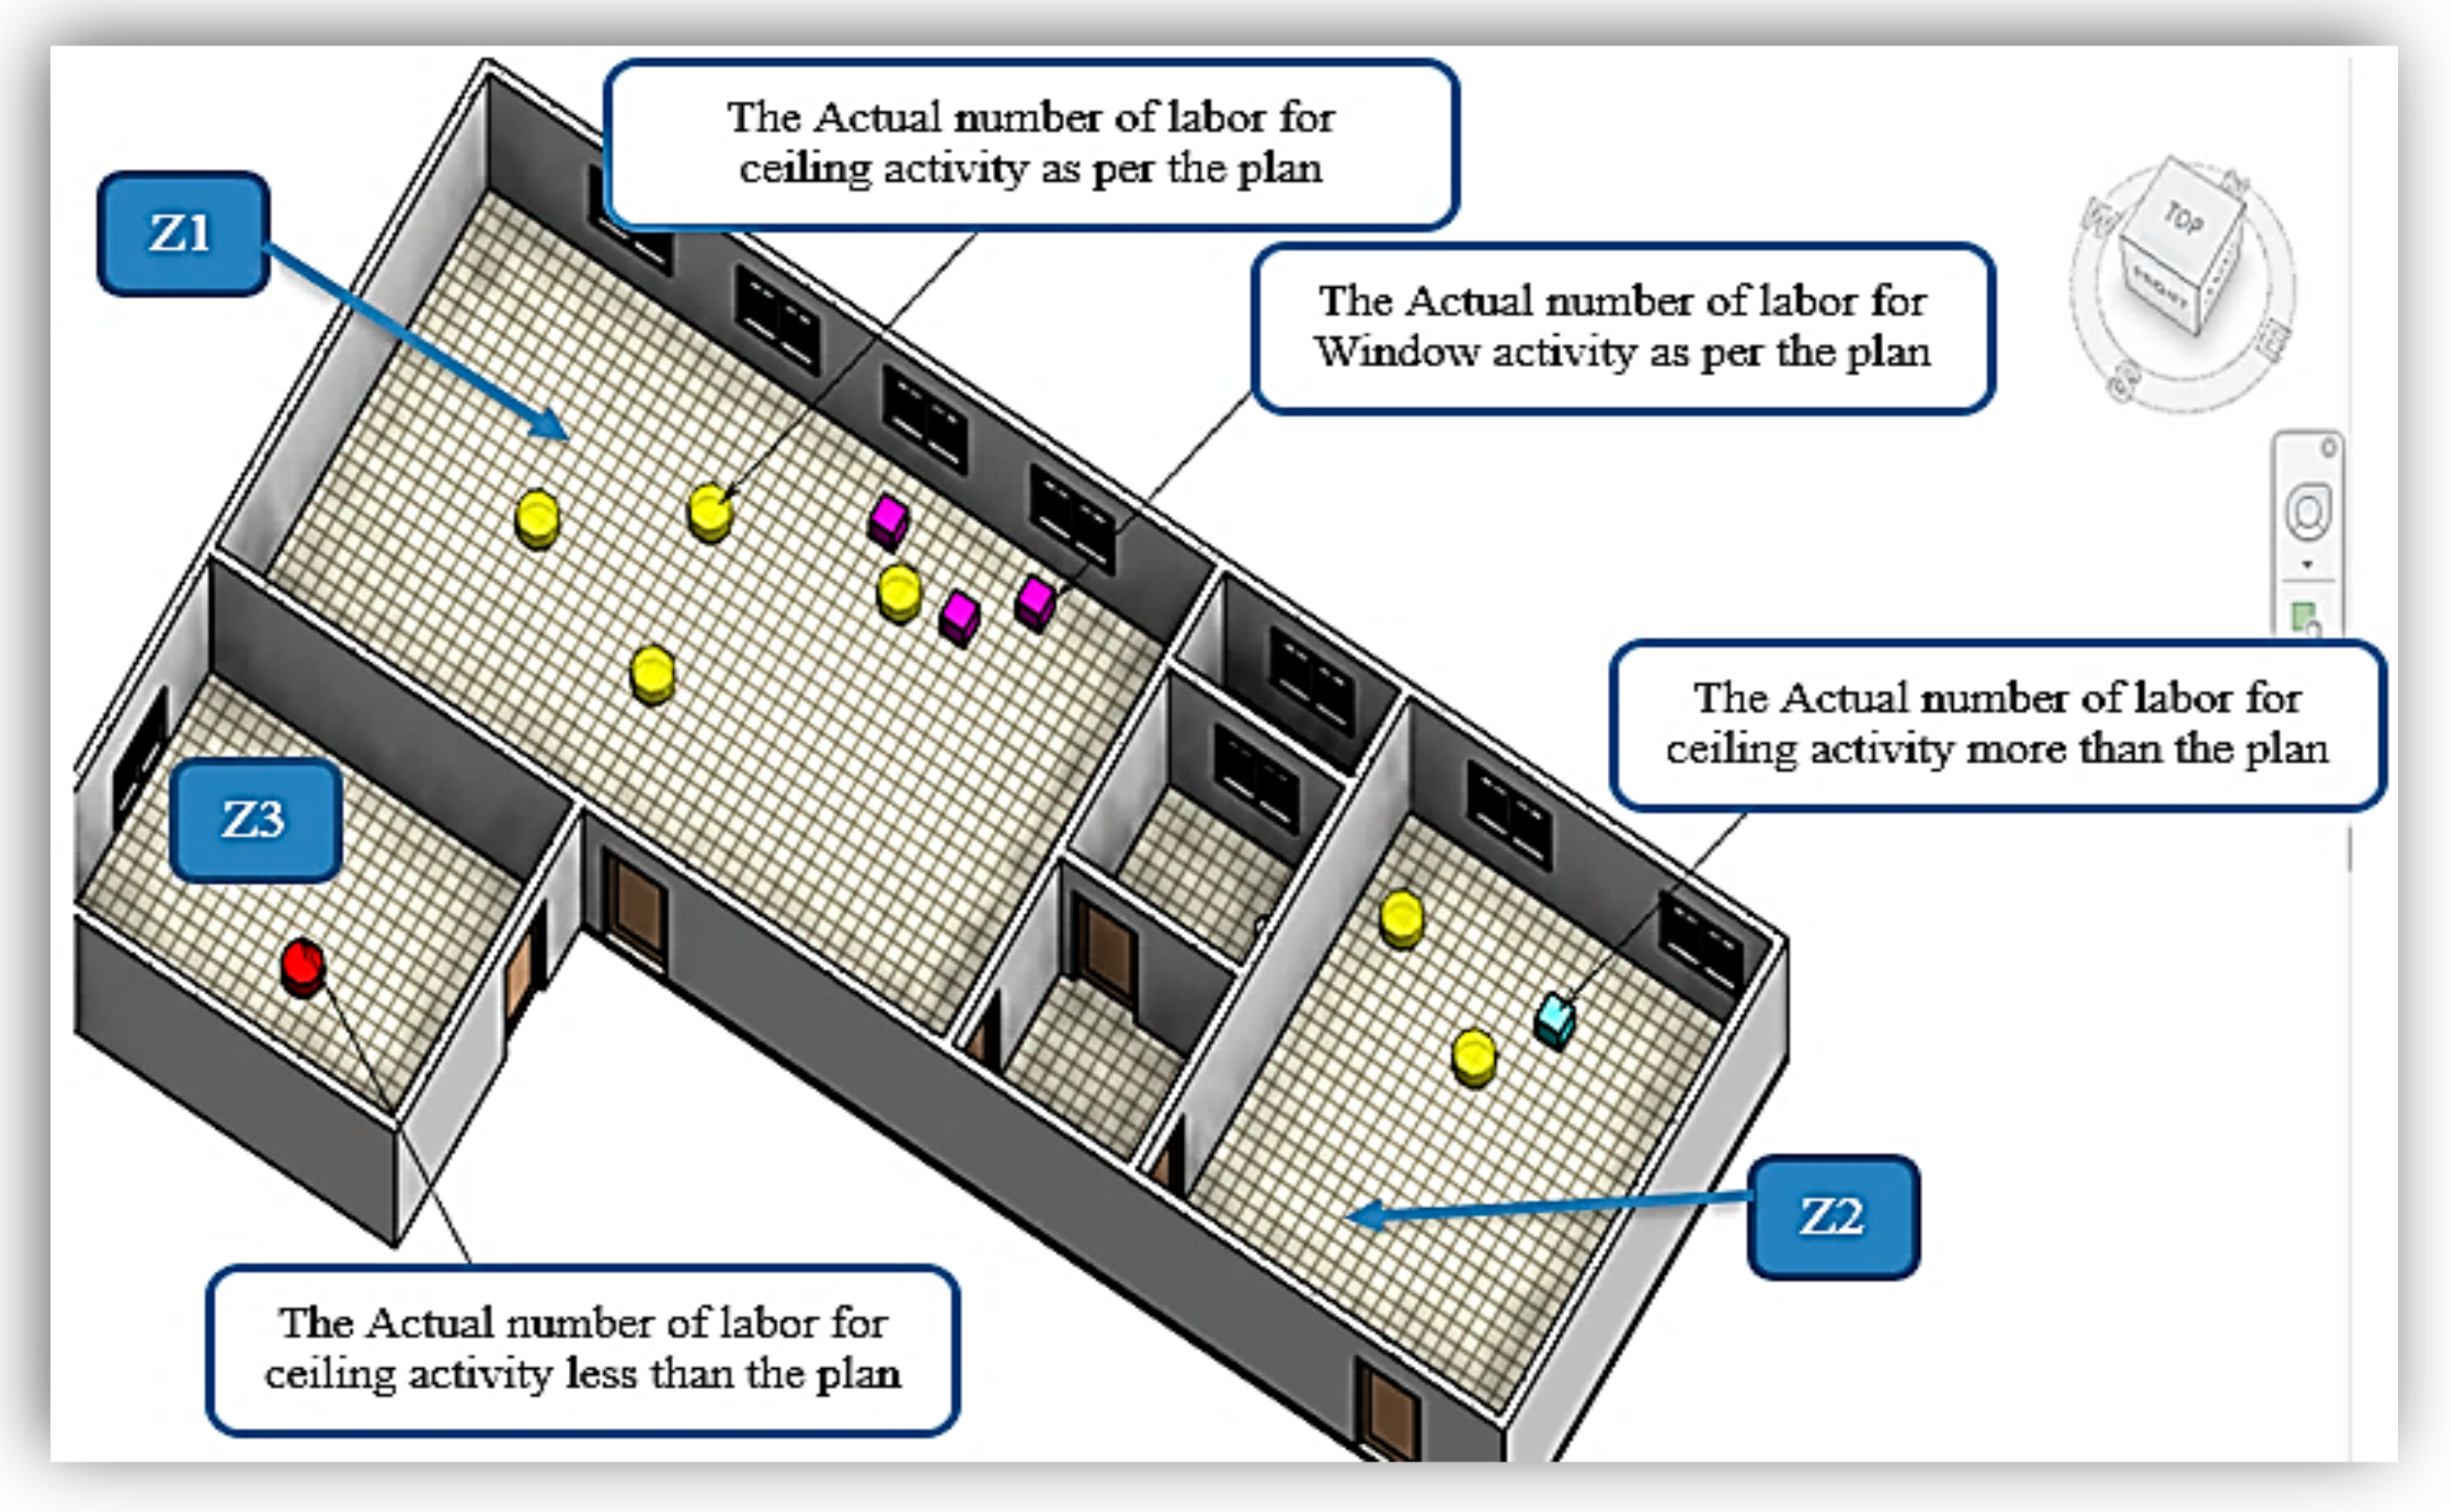
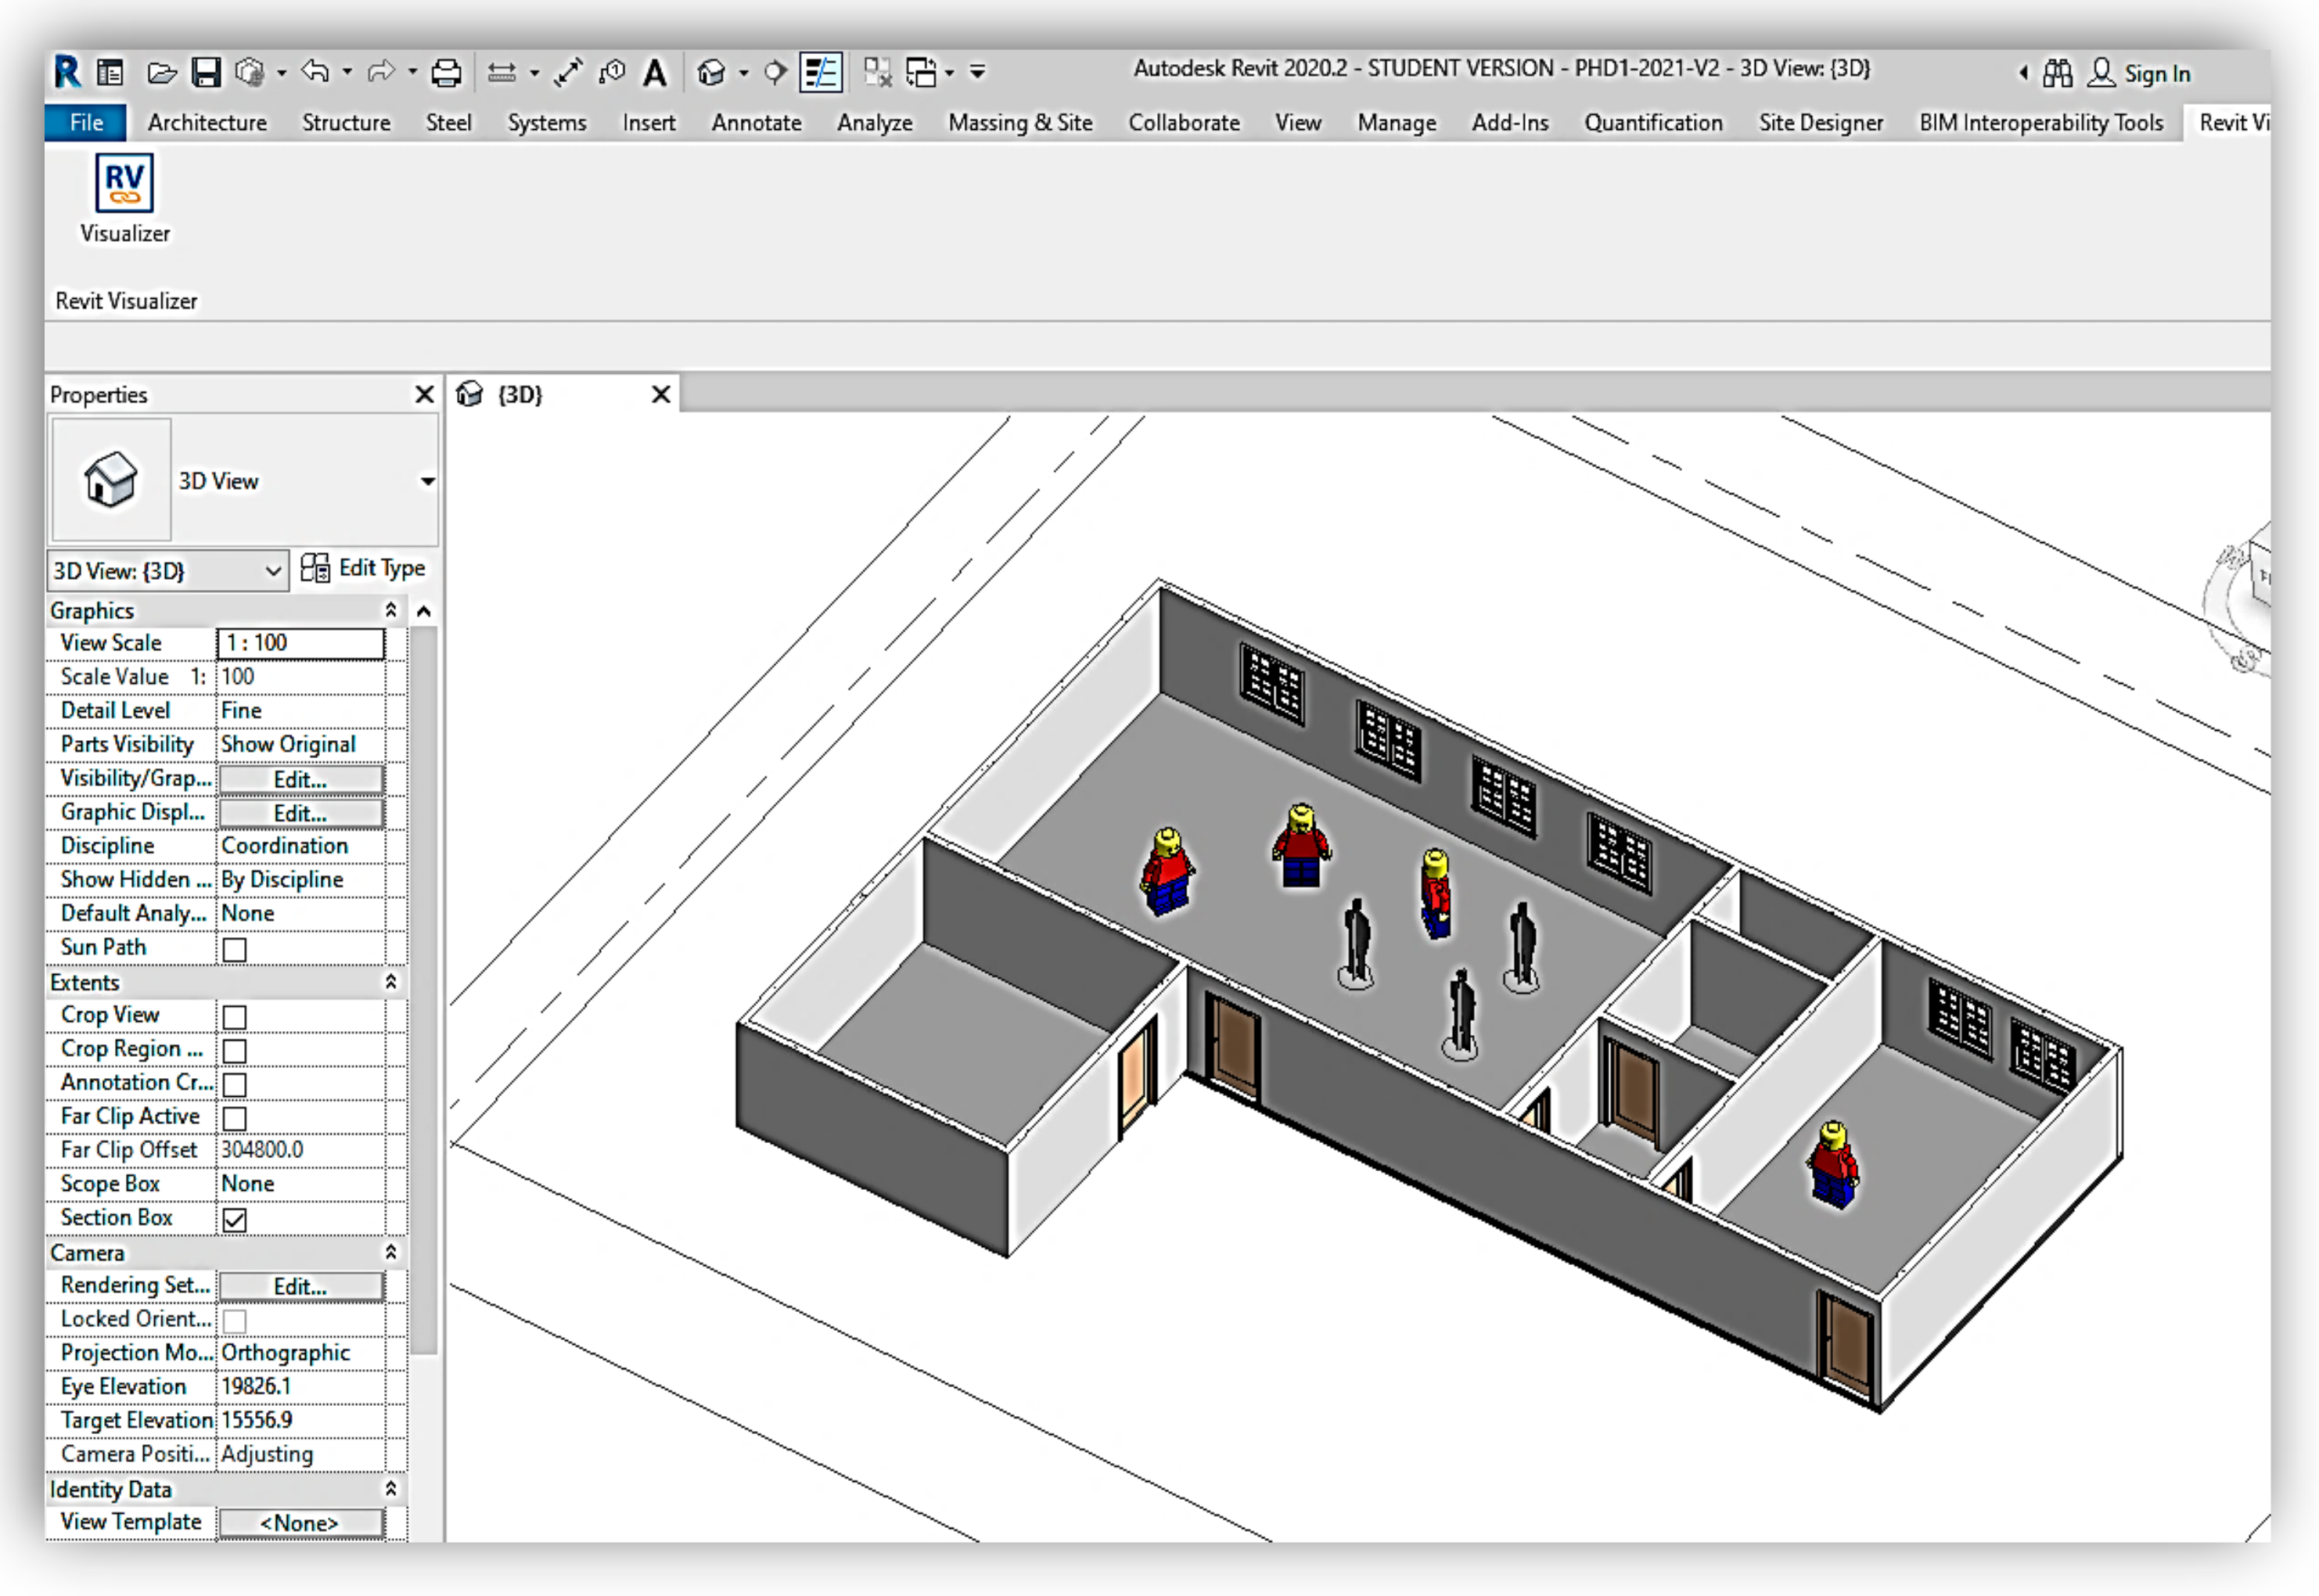
Figure 14 shows a live tracking feature for all activities of workers in the BIM model with friendly visualization symbols. The user can easily know, once he/she opens the models, what happens in the site through the visualization tool.
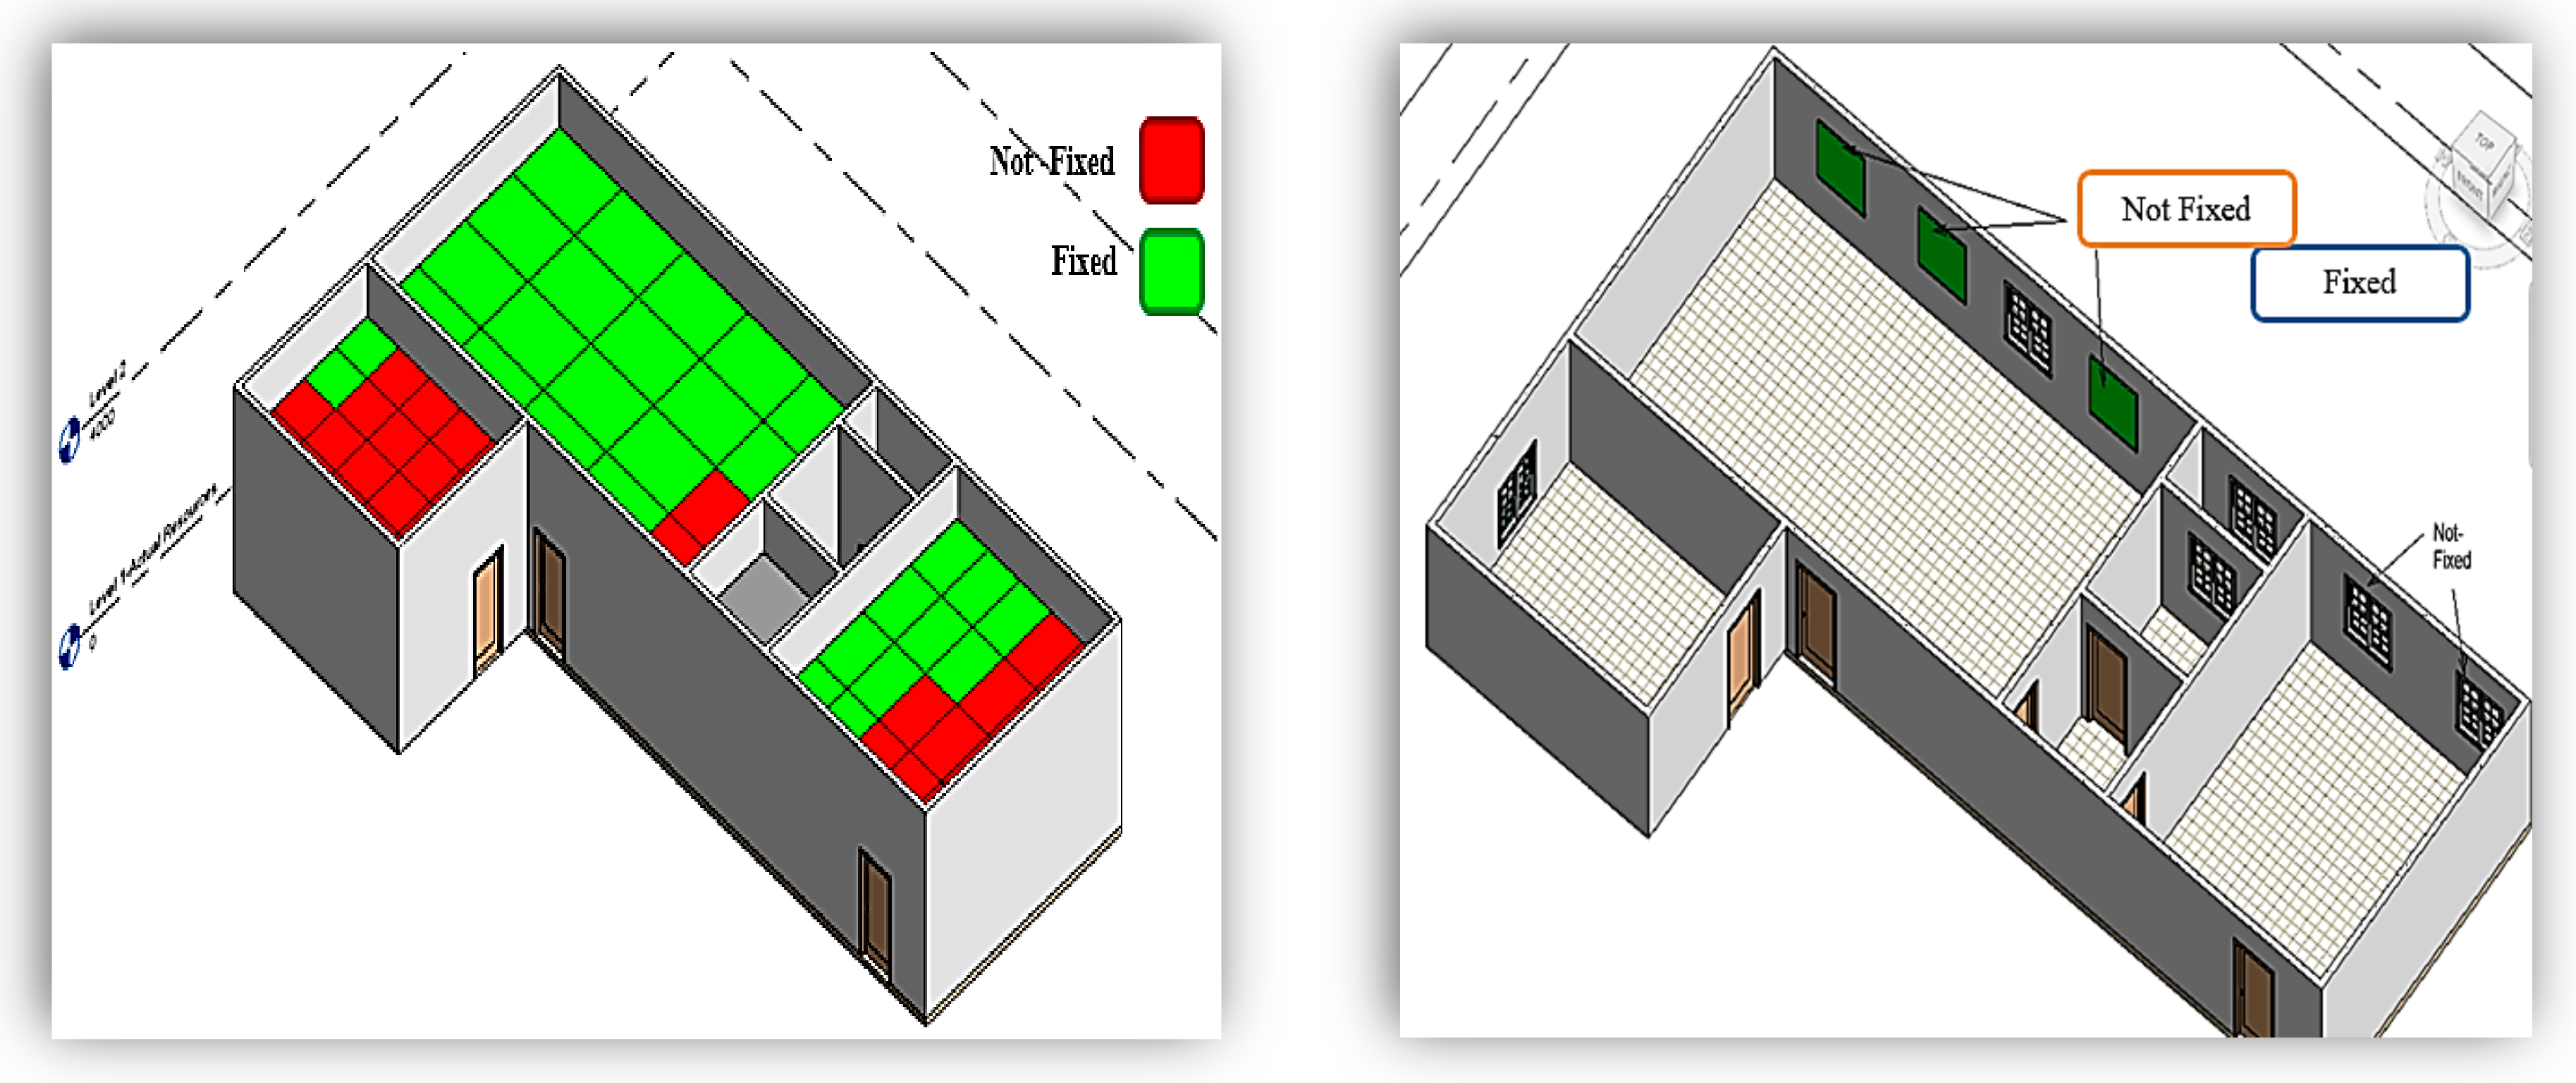
Figure 15 demonstrates the helpful output of the CEWS, including visualization of the progress of work for the selected activities (ceiling and windows).
The user can also have access to the model to obtain any information about the resources based on customized time frequent updates, as shown in
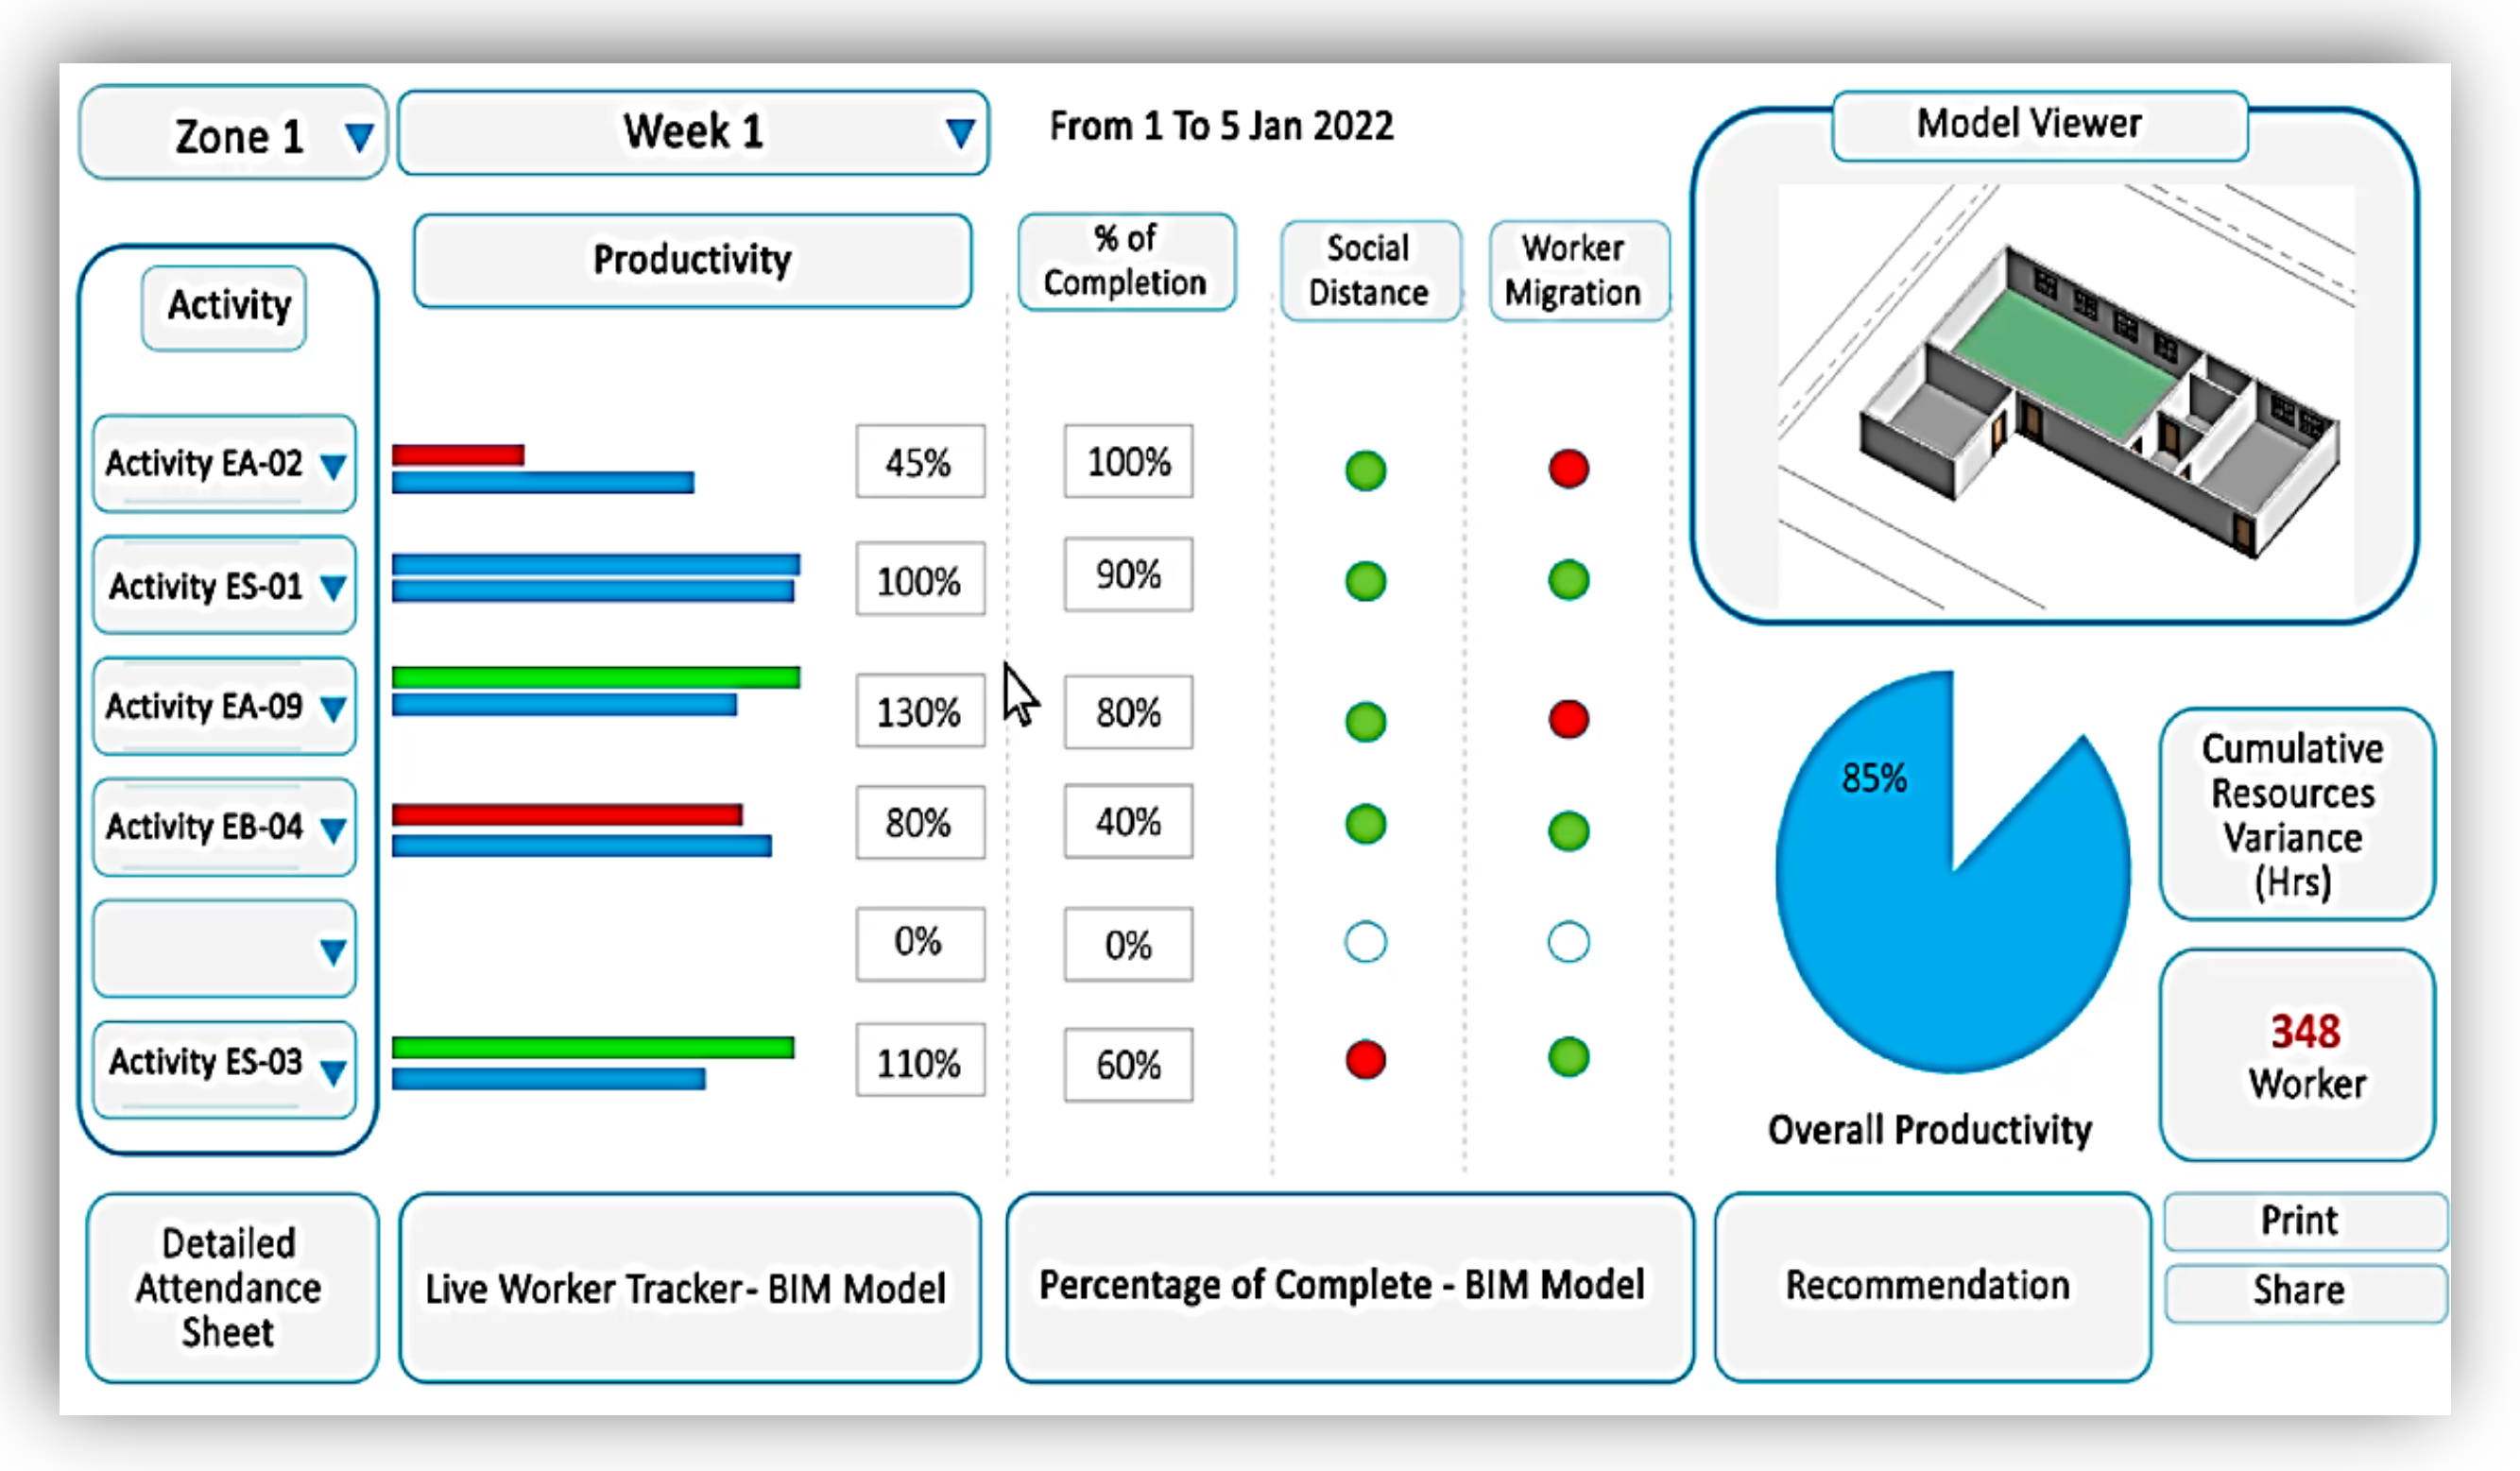
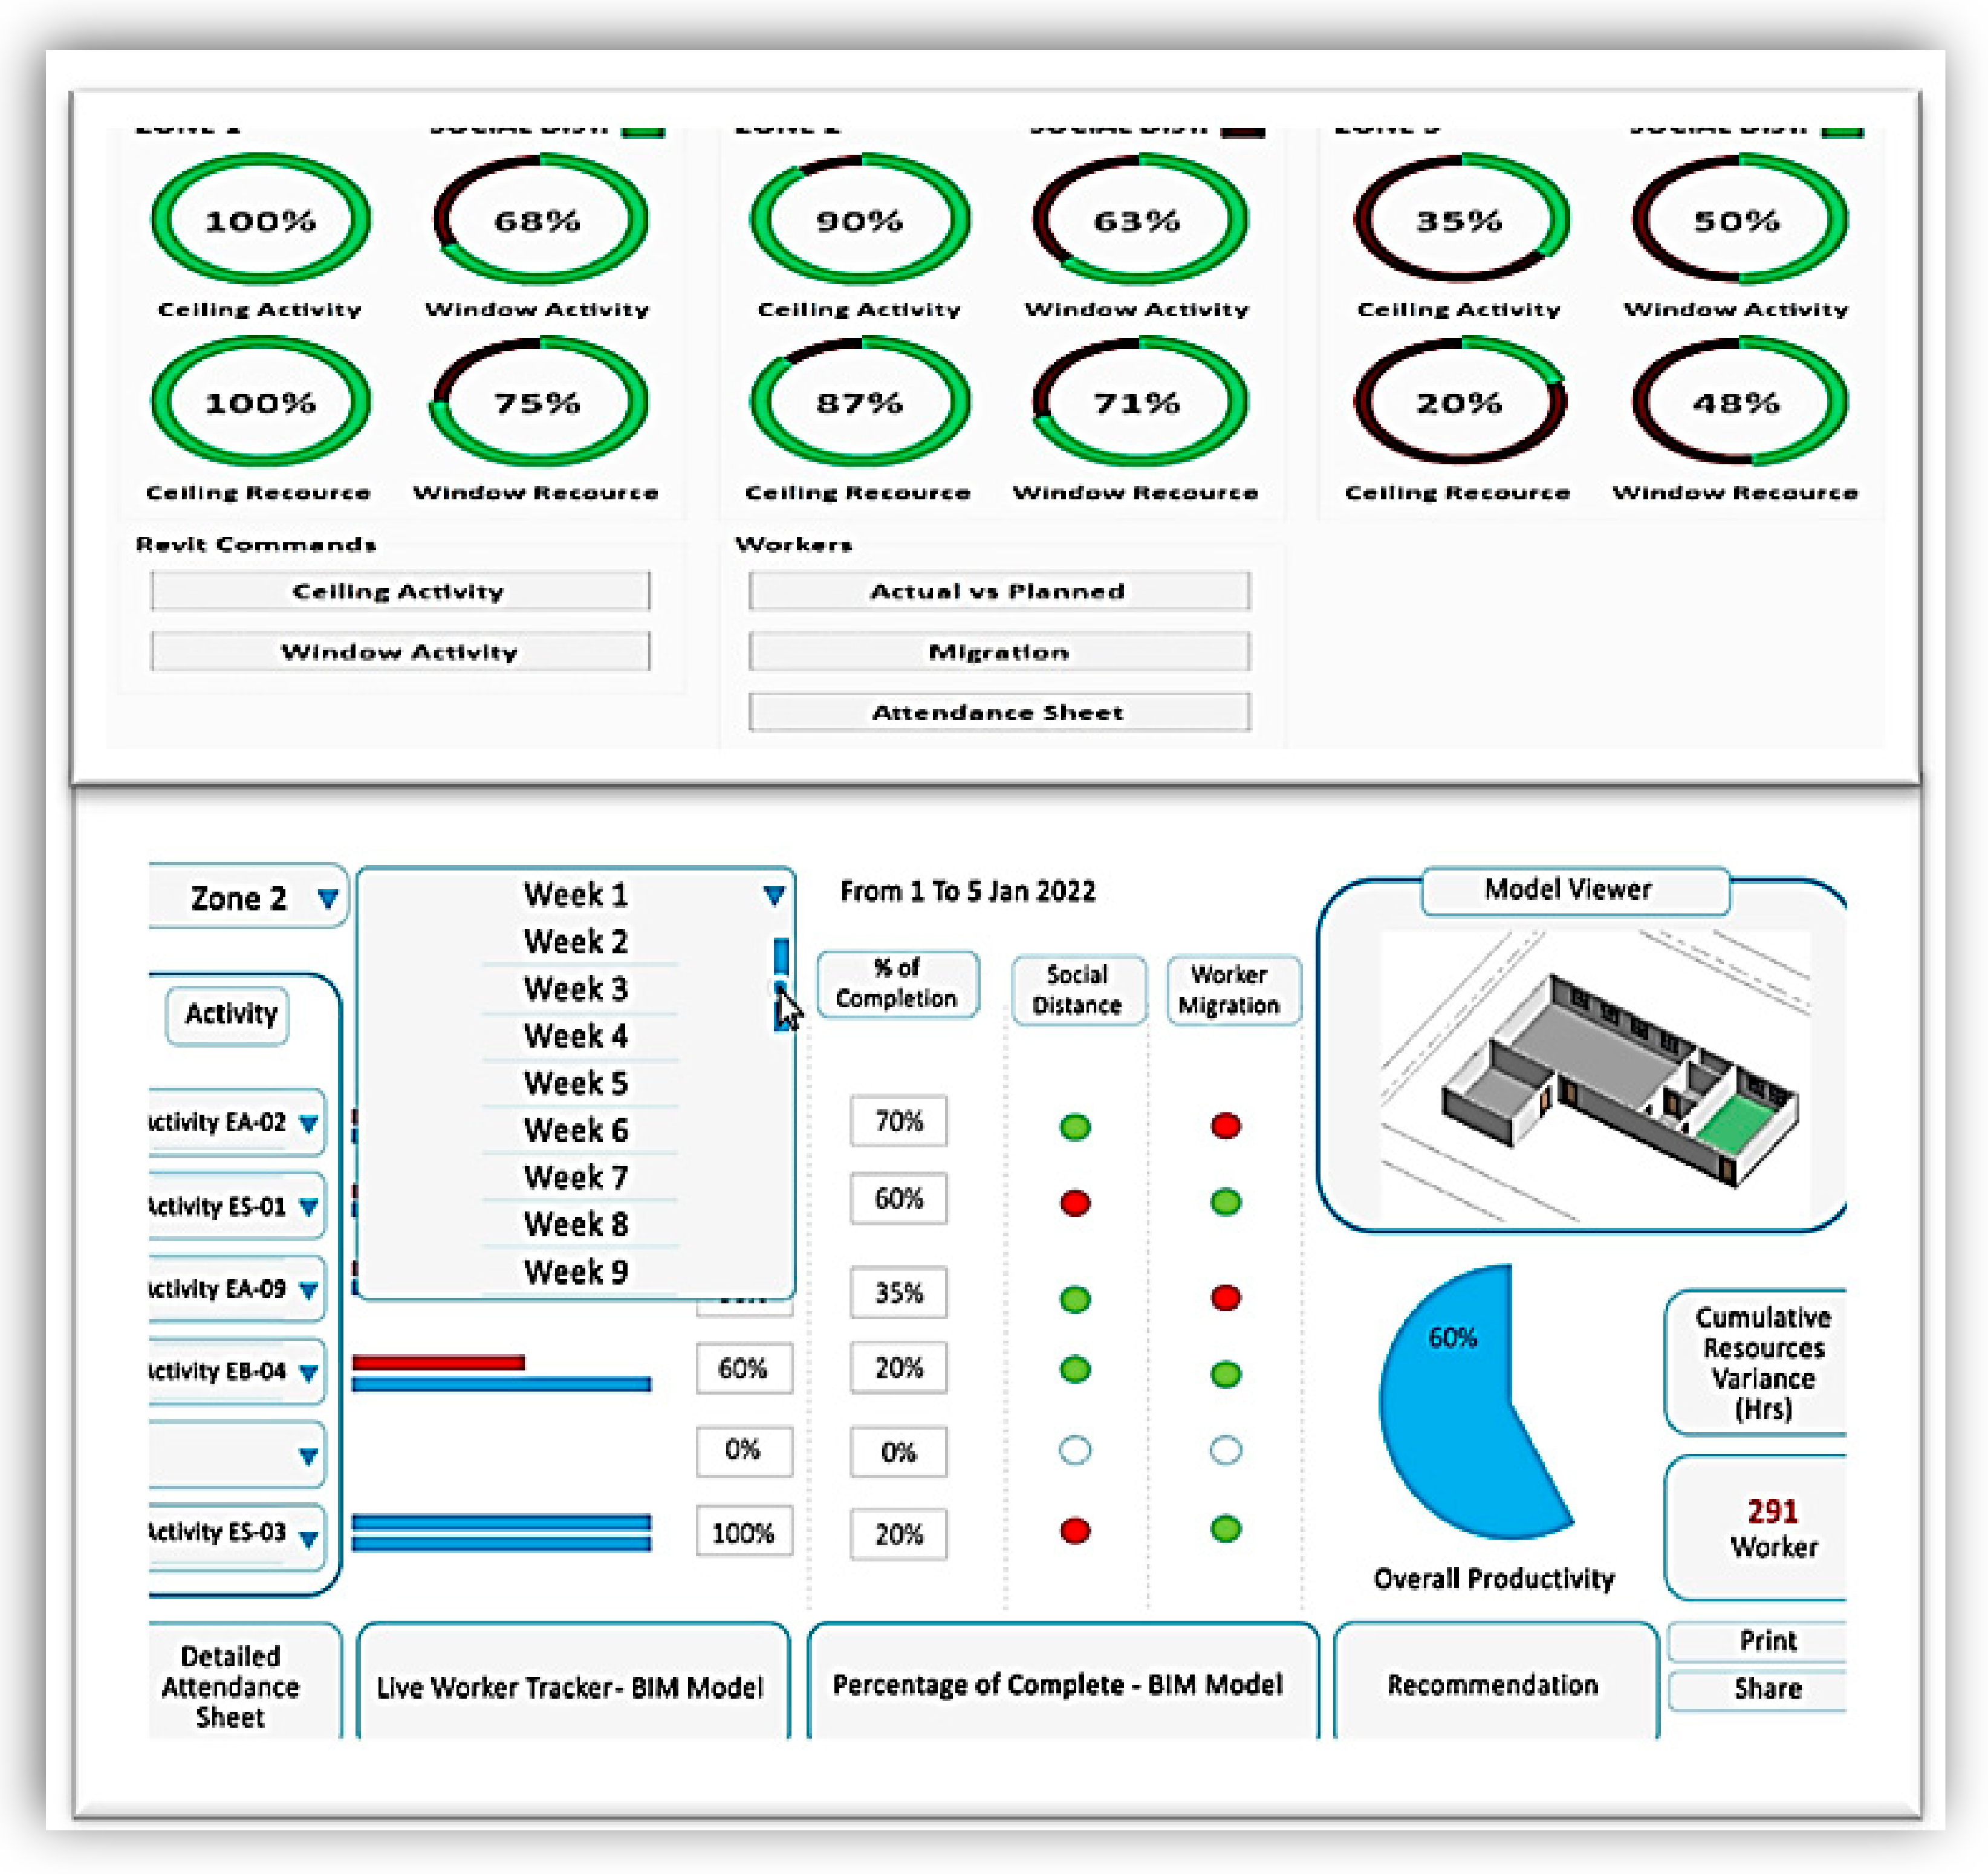
Figure 16. The CEWS master dashboard, shown in
Figure 17, provided a comprehensive view of the project’s status. The dashboard was divided into many zones, each zone highlighting different options to indicate activity completion percentages, actual resources, and adherence to social distancing regulations, which become an essential part of exceptional events like COVID-19. Hyperlinks within the CEWS dashboard facilitated visualization of specific activities, World Health Organization guidelines, recommendations, live number of workers, and worker migration across zones (
Figure 17).
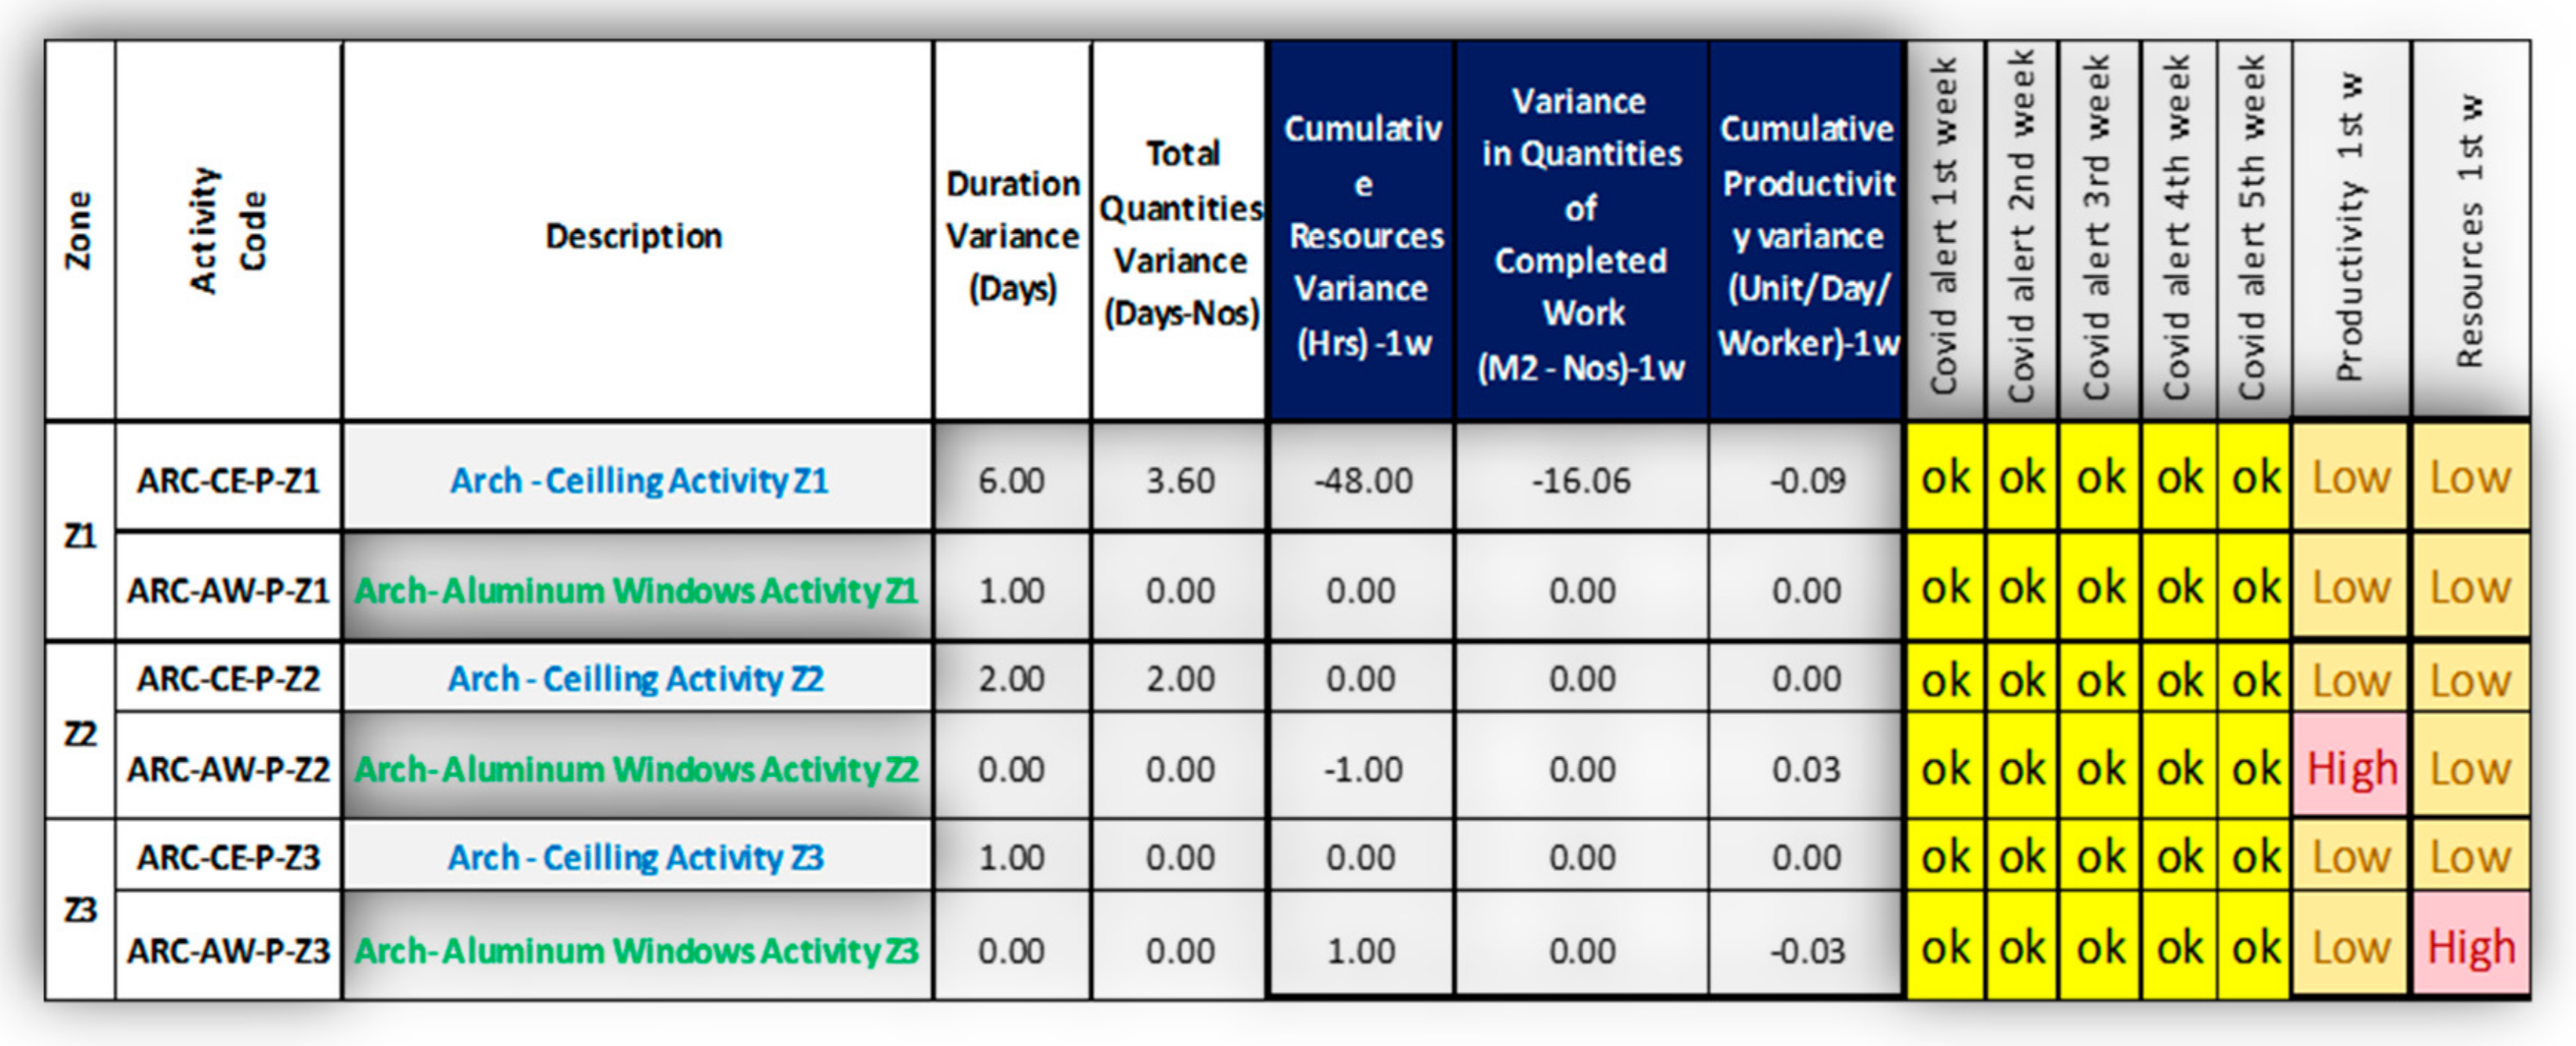
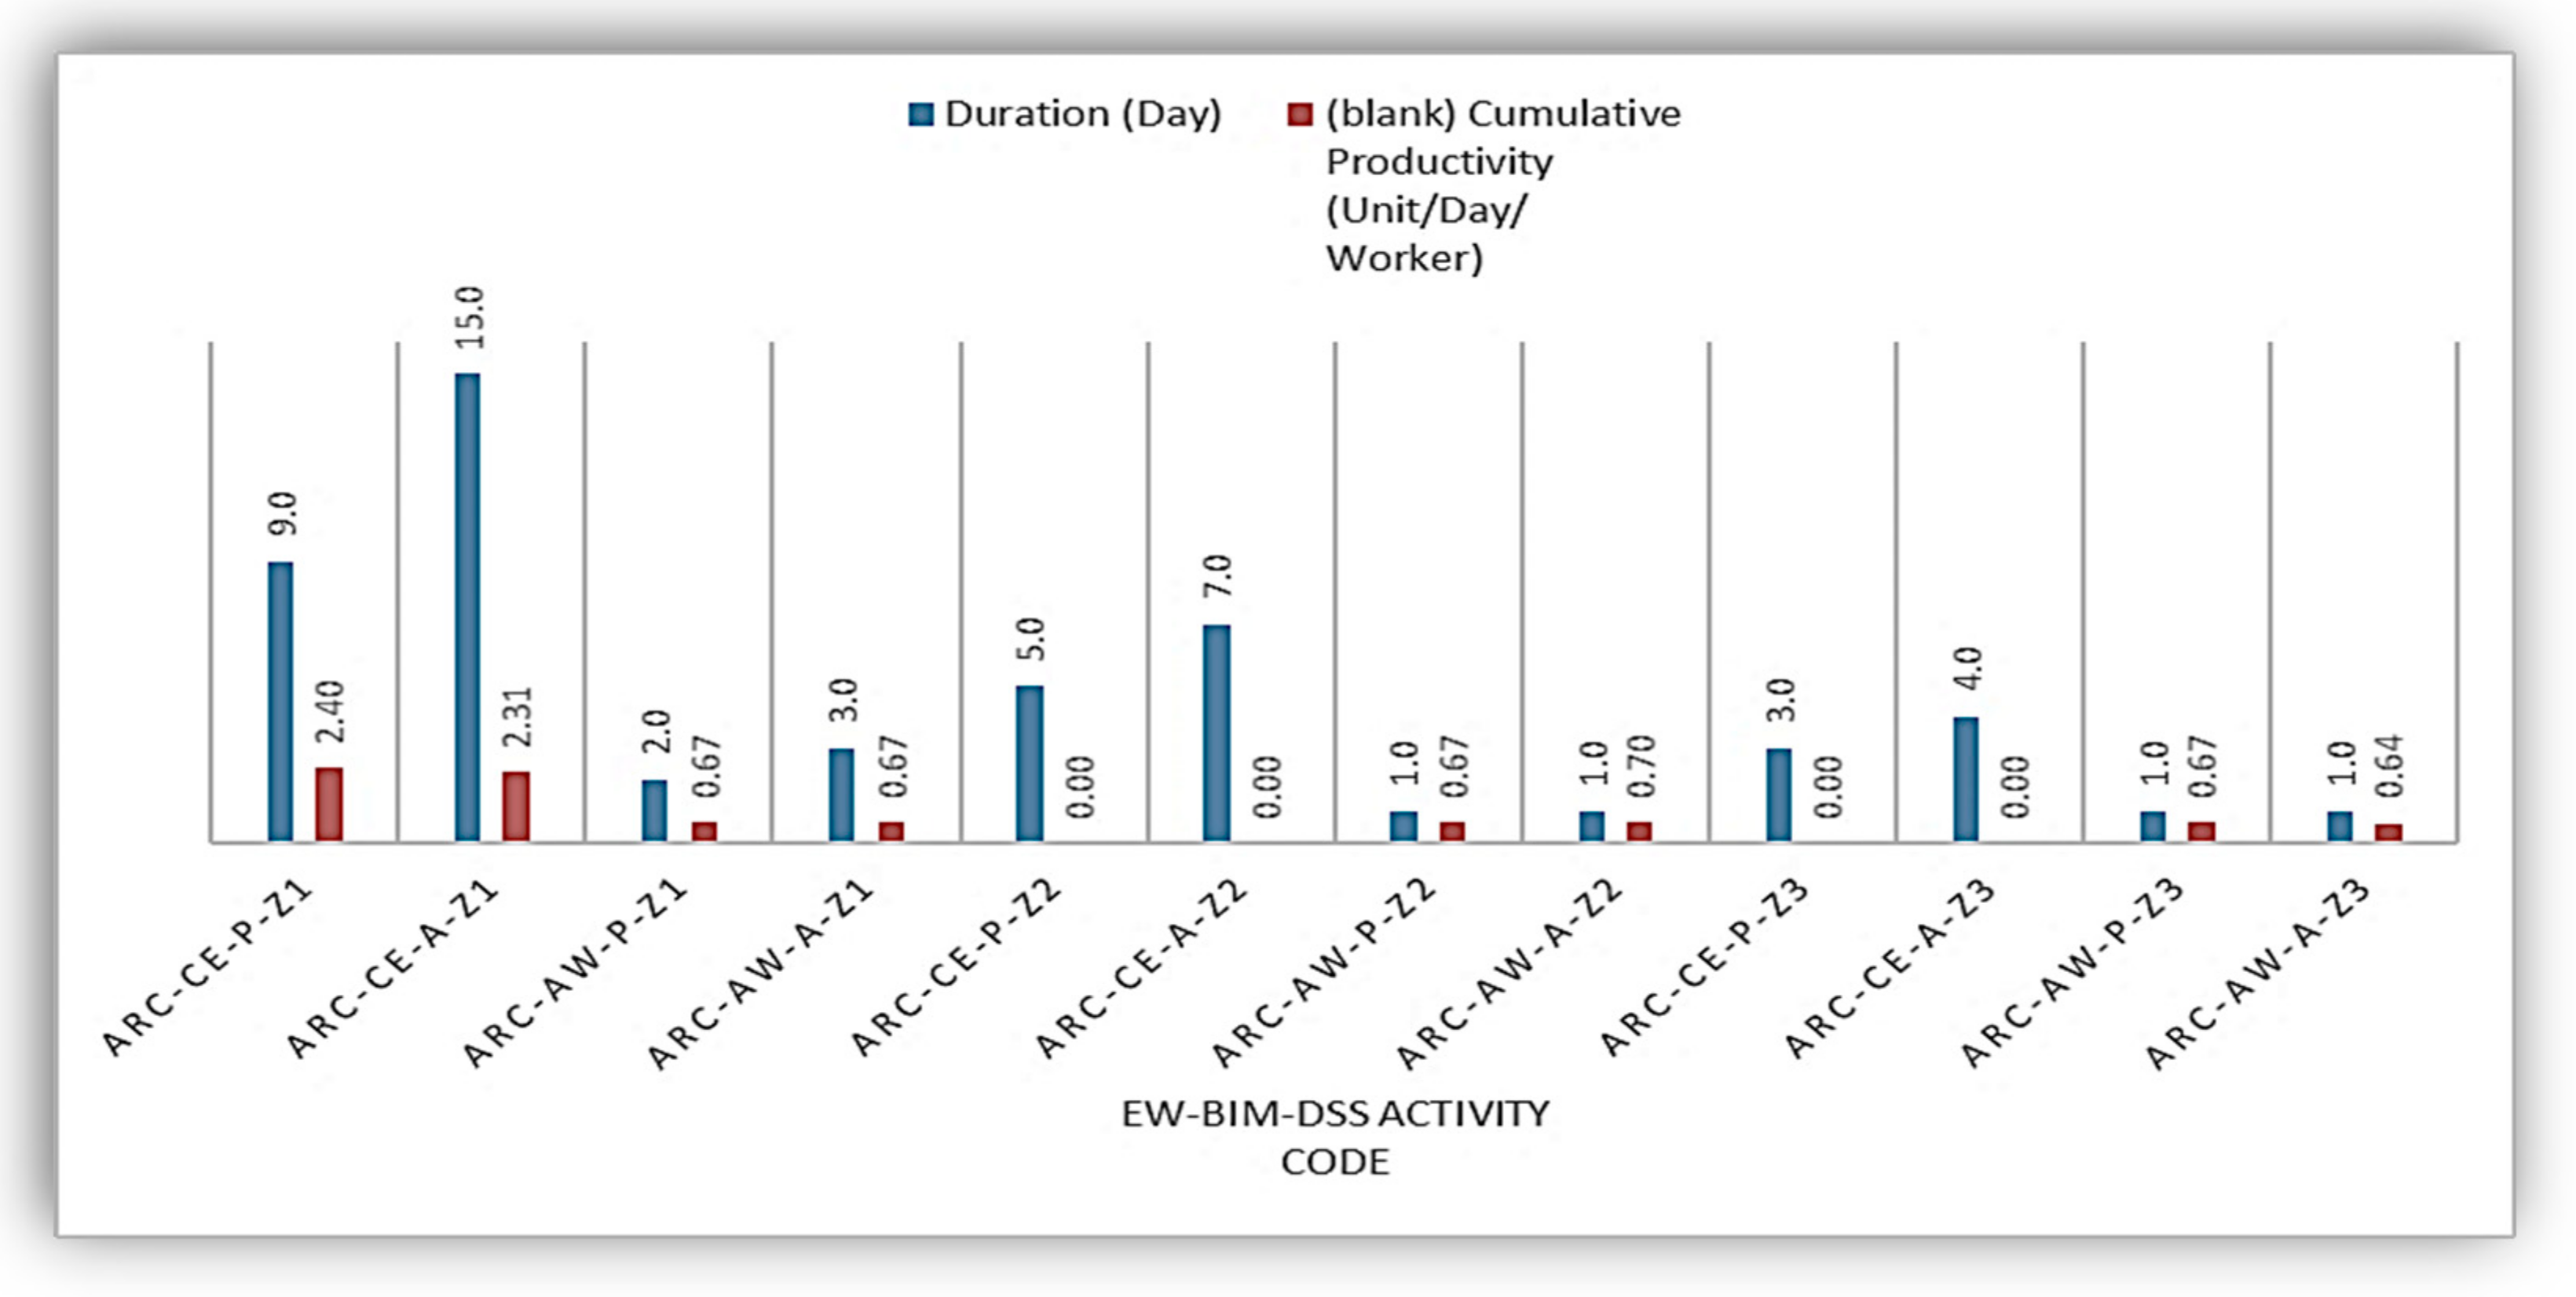
Figure 18 indicates the certain output from the CEWS, which is the activity duration in days and its related Cumulative Productivity (Unit/Day/Worker) in the first week which is extracted from the recommendation report [
35,
36,
37,
38,
39,
40,
41].
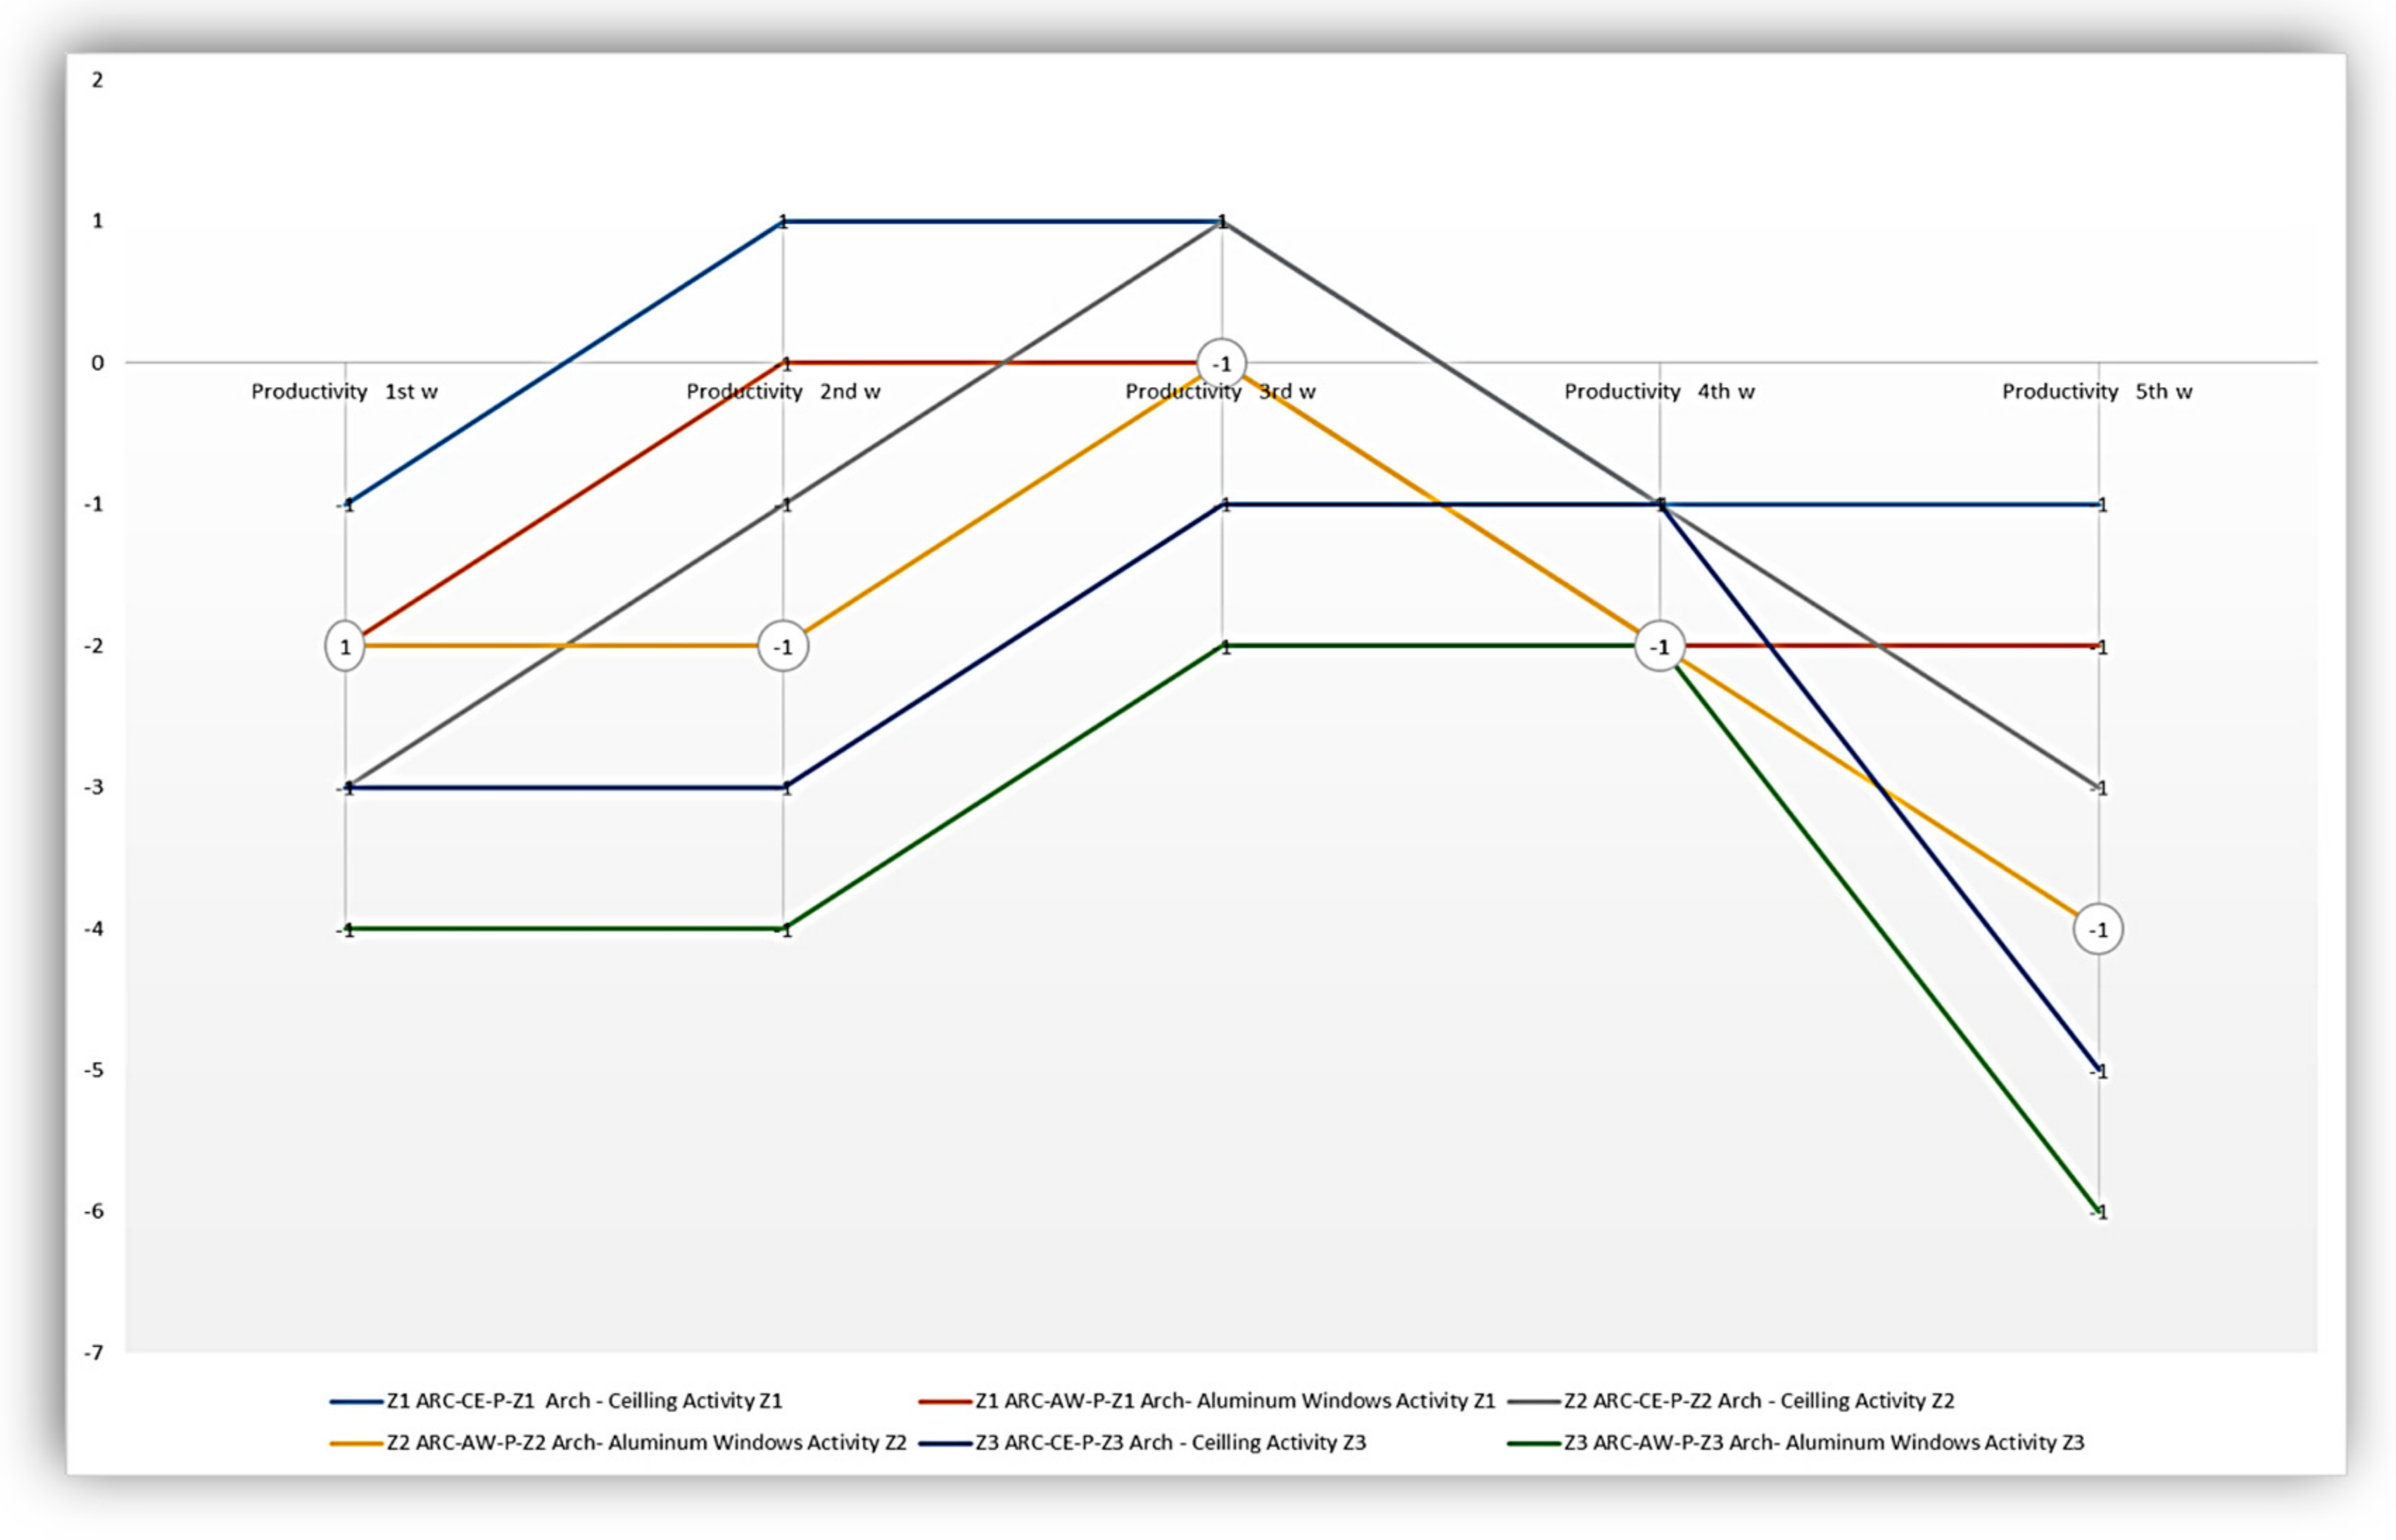
The study did not focus on productivity only, due to the complexity of this matter and to give the project manager the ability to analyze the issue. A positive or negative productivity variance is shown in
Figure 19 over the project’s lifecycle. The presence of a positive figure indicates that the contractor has increased the production rate and vice versa. The figure implies that the ceiling and window contractor has underperformed in assigned duties.
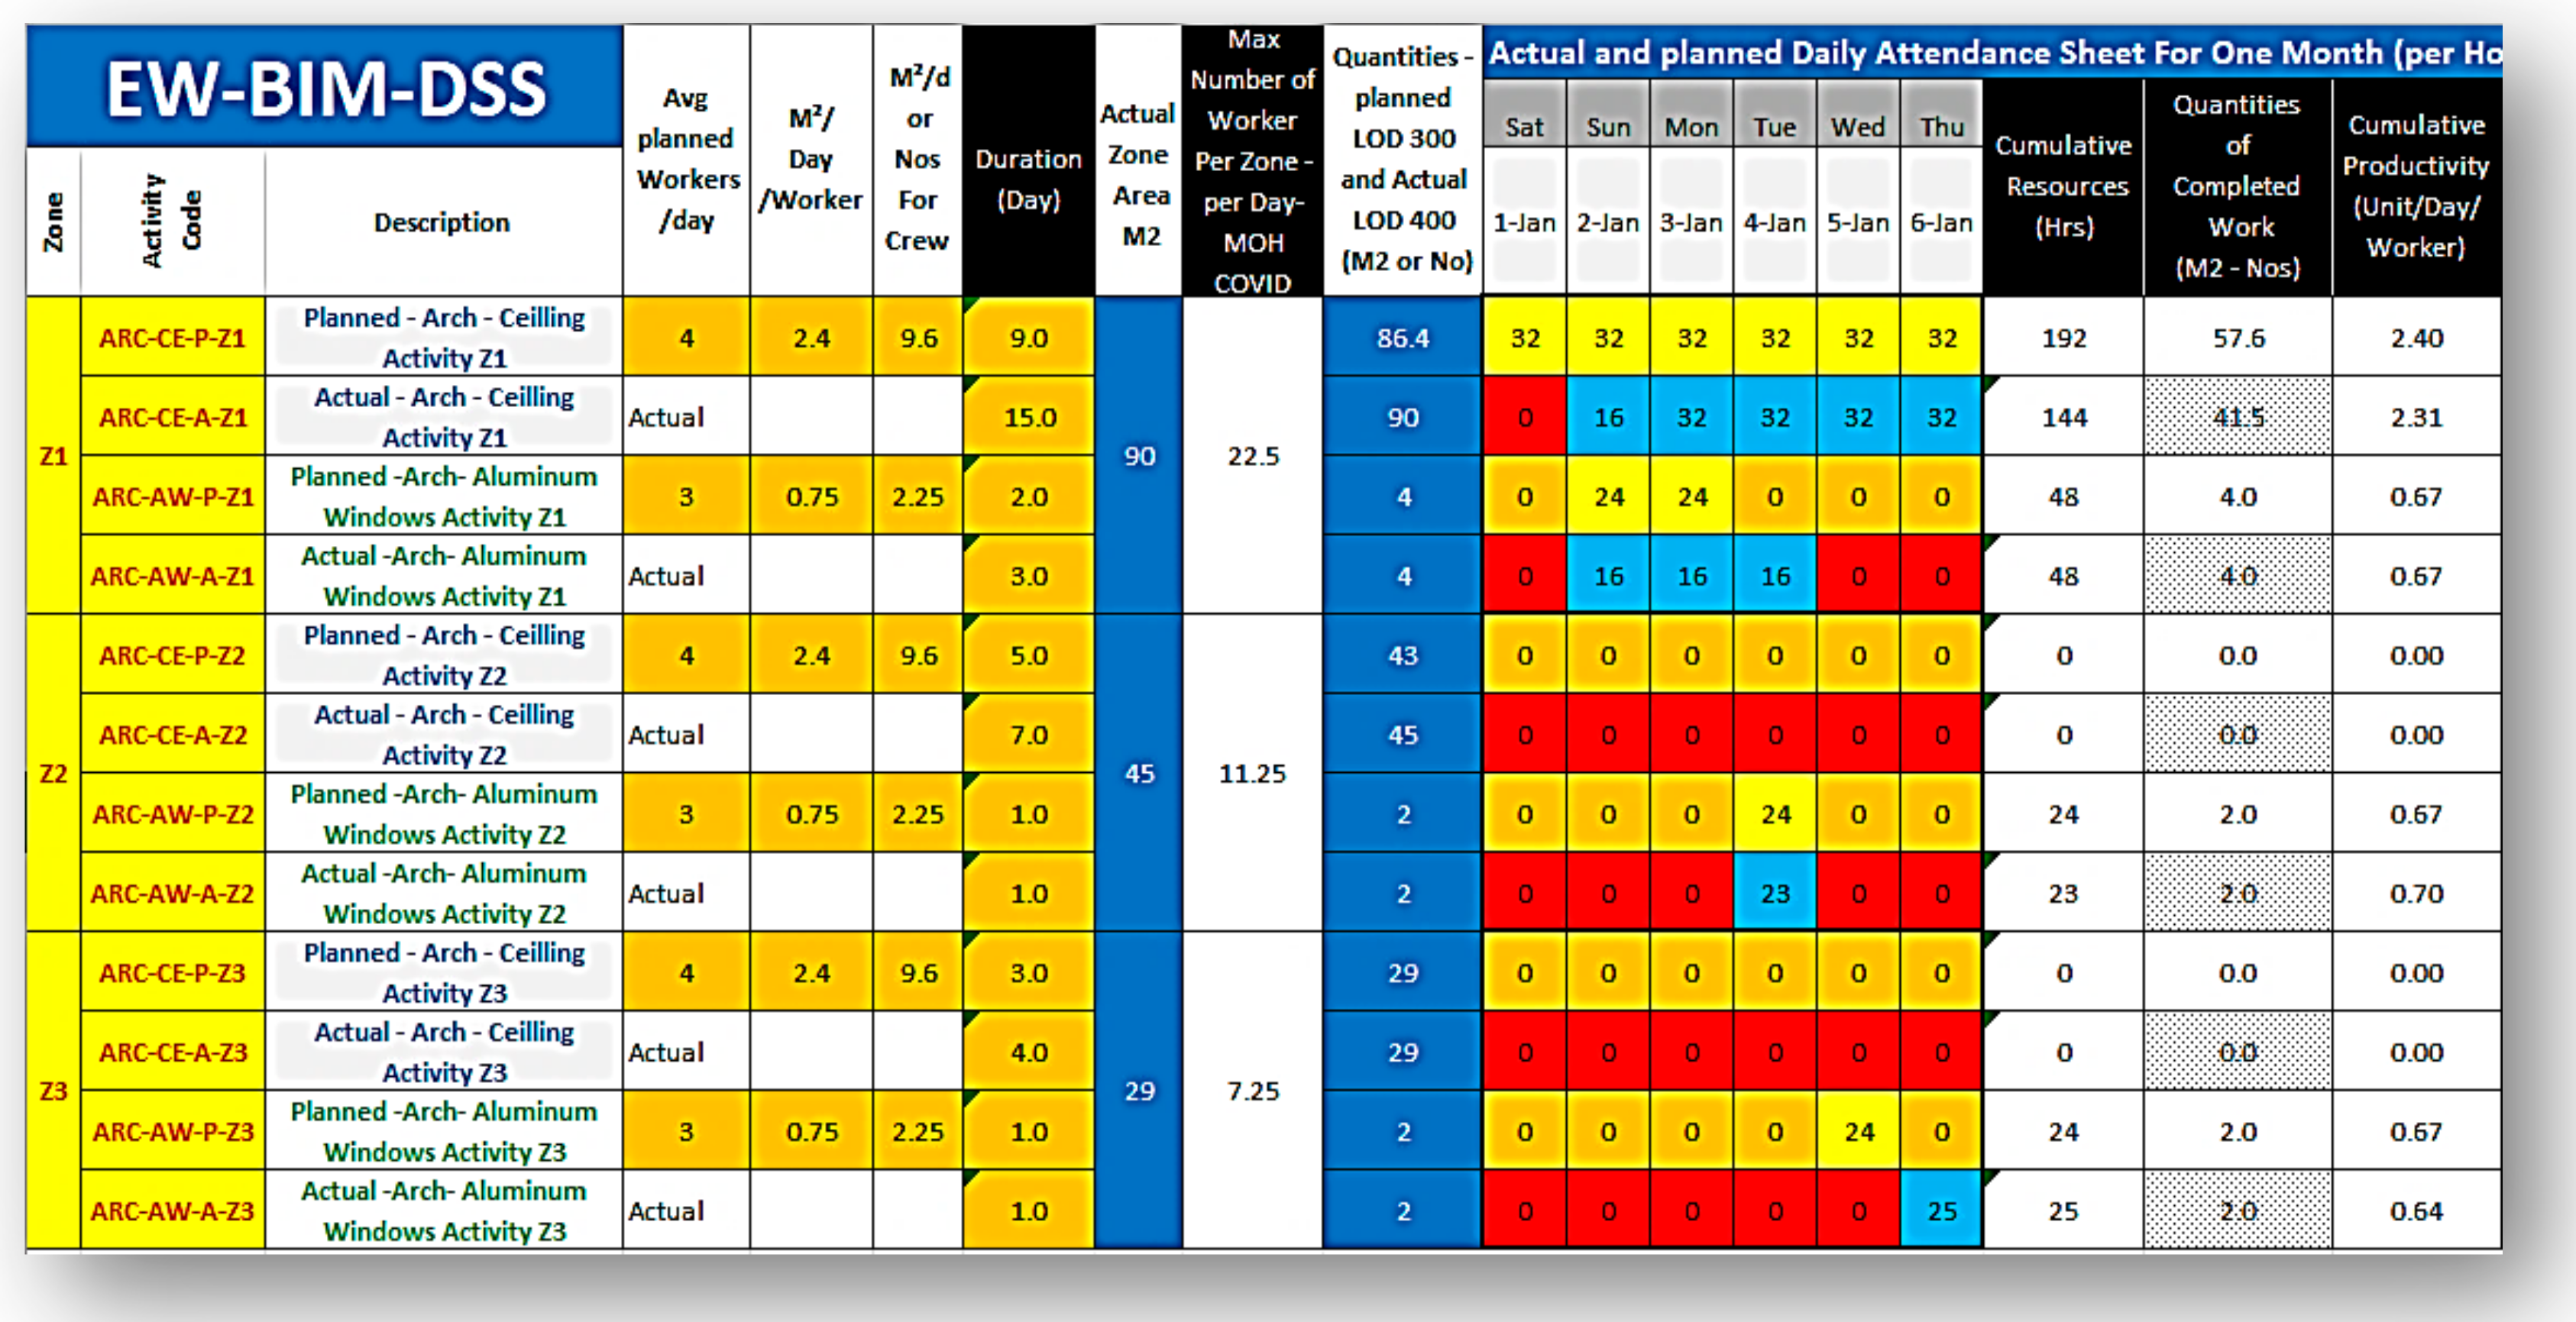
Additionally, the embedded system facilitated the extraction of a detailed daily attendance sheet, eliminating the need for traditional manual attendance records (
Table 2).
9. Case Study Limitations of Research
The case study revealed key constraints, notably signal interference that compromised the Bluetooth Low Energy (BLE) tracking system in specific construction zones. Rigorous signal analysis and system calibration were essential for optimal performance. The initialization of BLE tags necessitated specialized training to ensure data integrity. Privacy and data security measures were implemented to safeguard worker confidentiality.
The study validates the proposed methodology for optimizing construction resource positioning via digital twin technology. It integrates Agent-Based Modeling (ABM), BLE tracking, Building Information Modeling (BIM) visualization, and the Construction Early Warning System (CEWS) to enhance real-time monitoring and project management. These findings augment existing literature on construction resource optimization and offer guidance for future methodological applications.
The research also notes the variable availability and suitability of BLE devices across different markets. Therefore, customization based on regional tools, technologies, and market conditions is advised for practitioners and researchers.
10. Discussion of Results
The case study at Project HU–CED has provided invaluable insights into the optimization of construction resource allocation via digital twin technology. The incorporation of Agent-Based Modeling (ABM), Bluetooth Low Energy (BLE) tracking, Building Information Modeling (BIM) visualization, and the Construction Early Warning System (CEWS) has facilitated real-time resource allocation intelligence. Stakeholders have derived considerable advantages from the CEWS dashboard and BIM model, which have enabled the real-time monitoring of activities, resource allocation, and labor productivity. Moreover, the BLE system has automated the attendance recording process, thereby obviating the need for manual data collection.
The Decision Support System (DSS) and CEWS have been pivotal in facilitating data-driven decision-making. The DSS has accurately managed project data, while the CEWS has supplied indispensable data concerning variances in resources, quantities, and productivity.
In comparison to conventional resource allocation methodologies, the proposed framework exhibits marked benefits. The real-time visibility, afforded by BLE tracking and BIM visualization, enables the expeditious identification of issues. Conventional methods, which are dependent on manual data collection, are often subject to delays. Additionally, the application of agent-based modeling has optimized resource allocation by considering variables, such as workers’ location and task prerequisites, thereby enhancing resource utilization and minimizing idle time. The CEWS has further augmented data-driven decision-making, contributing to superior resource allocation efficacy.
The deployment of the proposed framework has multiple far-reaching implications. Primarily, it elevates resource management by offering enhanced visibility and governance over resource allocation. Secondly, it augments decision-making through the real-time availability of data via the CEWS and DSS, thereby enabling anticipatory adjustments and resource allocation optimization. Lastly, it boosts efficiency by curtailing idle time, thereby enhancing the overall efficacy of the project.
Nevertheless, certain limitations warrant consideration. The scope and intricacy of the case study are relatively confined, necessitating additional research to assess the framework’s scalability for more expansive and complex projects. The framework’s effectiveness is contingent upon technological compatibility and the availability of BLE devices, BIM V.2023, and the HOLOBUILDER platform. Moreover, the success of the framework is influenced by project-specific variables, such as site layout, worker collaboration, and the proficiency of the project team, which must be customized to each project’s unique circumstances. The incorporation of ABM and digital twin technology in construction projects offers manifold benefits for project managers and stakeholders. These benefits encompass enhanced decision-making facilitated by real-time data and visualization capabilities, improved resource utilization, proactive issue detection, and augmented collaboration among project stakeholders, thereby fostering transparency and efficacious communication. While the merits of ABM and digital twin technology are considerable, certain challenges are likely to be encountered. These challenges encompass technological integration, data veracity, change management, cost considerations, and privacy and security concerns. Effectively addressing these challenges necessitates the engagement of seasoned technology providers for seamless integration, the implementation of data validation protocols, the articulation of the advantages of technology adoption to project teams, the execution of cost–benefit analyses, and adherence to data privacy regulations while implementing security protocols to safeguard sensitive project data.
11. Tracking Client Early Warning System Evaluation Survey
A survey was carried out to examine, test, and validate the construction project’s tracking method. For this survey, the factors contributing to the success of the proposed method and procedures for tracking workers’ productivity using a hybrid system consisting of Bluetooth Low Energy (BLE) and Building Information Modelling (BIM) technology through the user-friendly CEWS dashboard were evaluated and reported [
40]. Experts representing a diverse range of contemporary business disciplines participated in the survey (Client, PMCM, Consultant, and Contractor). Most surveys were conducted using a self-administered interview, emphasizing the weightings and rankings of project management processes in the construction industry from the perspectives of the various stakeholders. Four parts were included in the questionnaire as follows:
Part I: The background of the participant, and preliminary descriptive analysis of respondents’ profile.
Part II: BIM Adoption in the Project.
Part III: Current Project Information.
Part IV: Autodesk Visualizer Plugin & CEWS tool primary evaluation.
11.1. Part I: The Background of the Participants, and Descriptive Analysis of Respondents’ Profile
The survey encompassed a broad range of engineering roles with diverse backgrounds. Based on the data that were collected via the questionnaire forms, a diverse type of organization was evidenced, where the majority of the participants were Management Consultants, Contractors, and Consultants (see
Figure 20).
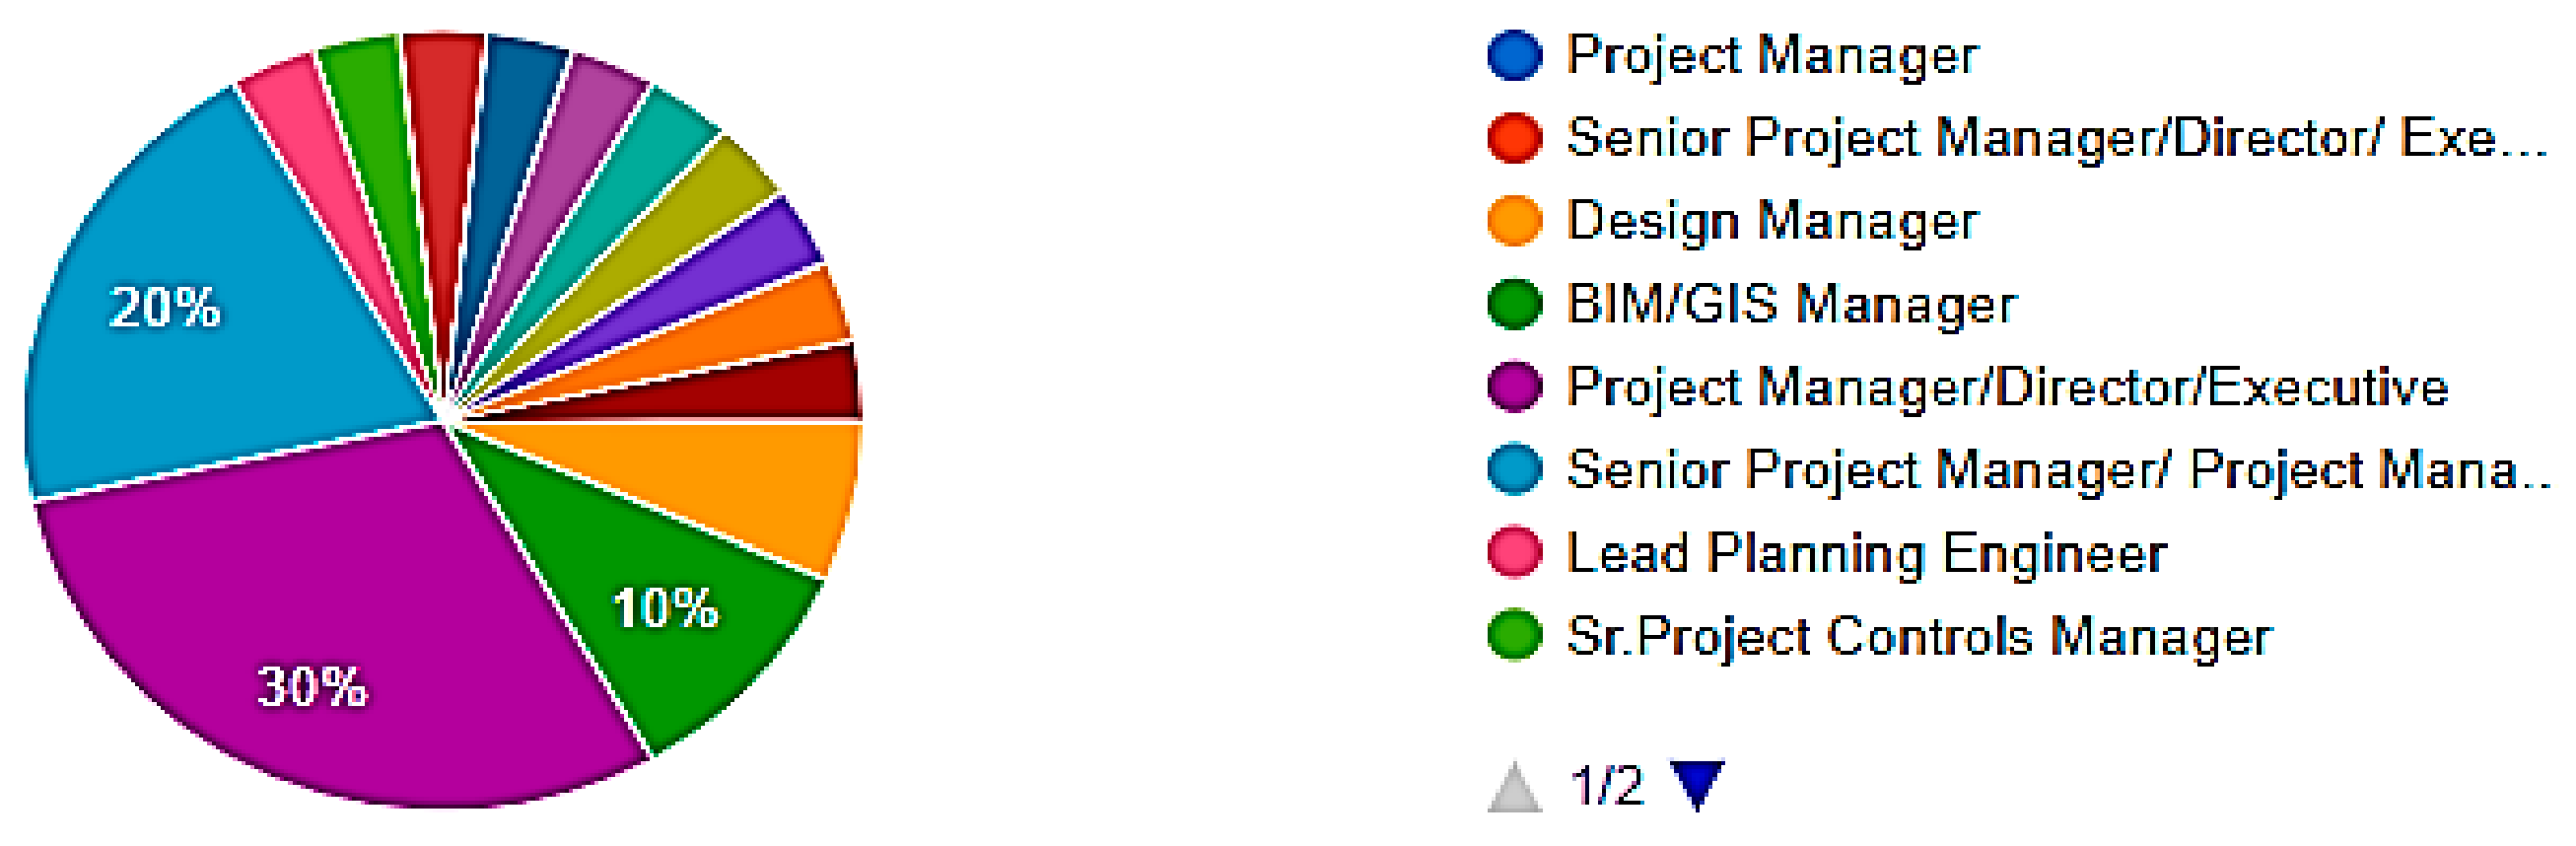
As previously stated, the majority of the participants held positions such as Senior/Project Managers, Planning Managers, Design Managers, and BIM/GIS Managers, among others. As shown in
Figure 21, most participants had a combined experience of approximately 20 years.
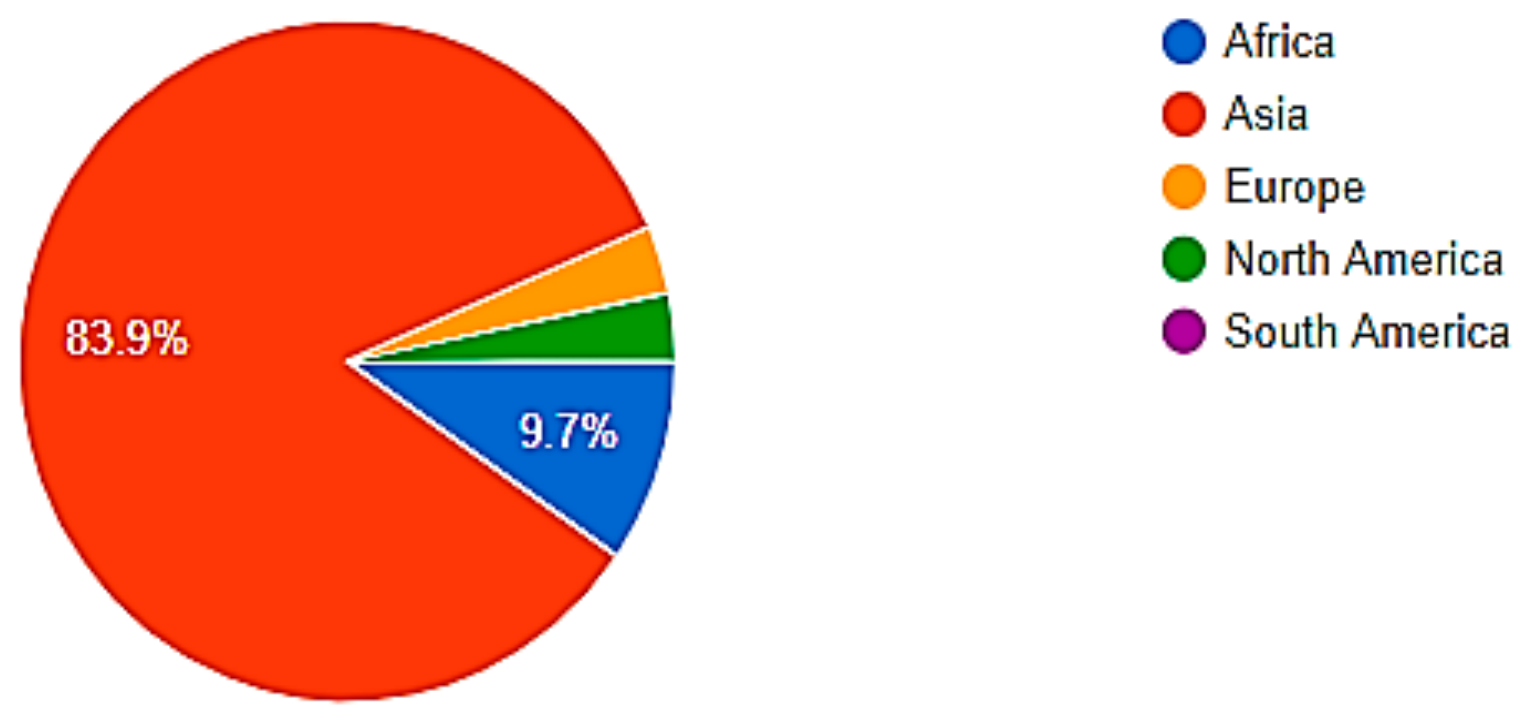
As seen in
Figure 22, most participants came from Asia and Africa, with only a handful coming from North America and Europe. However, more than 80% of those who took part were from Africa and Asia.
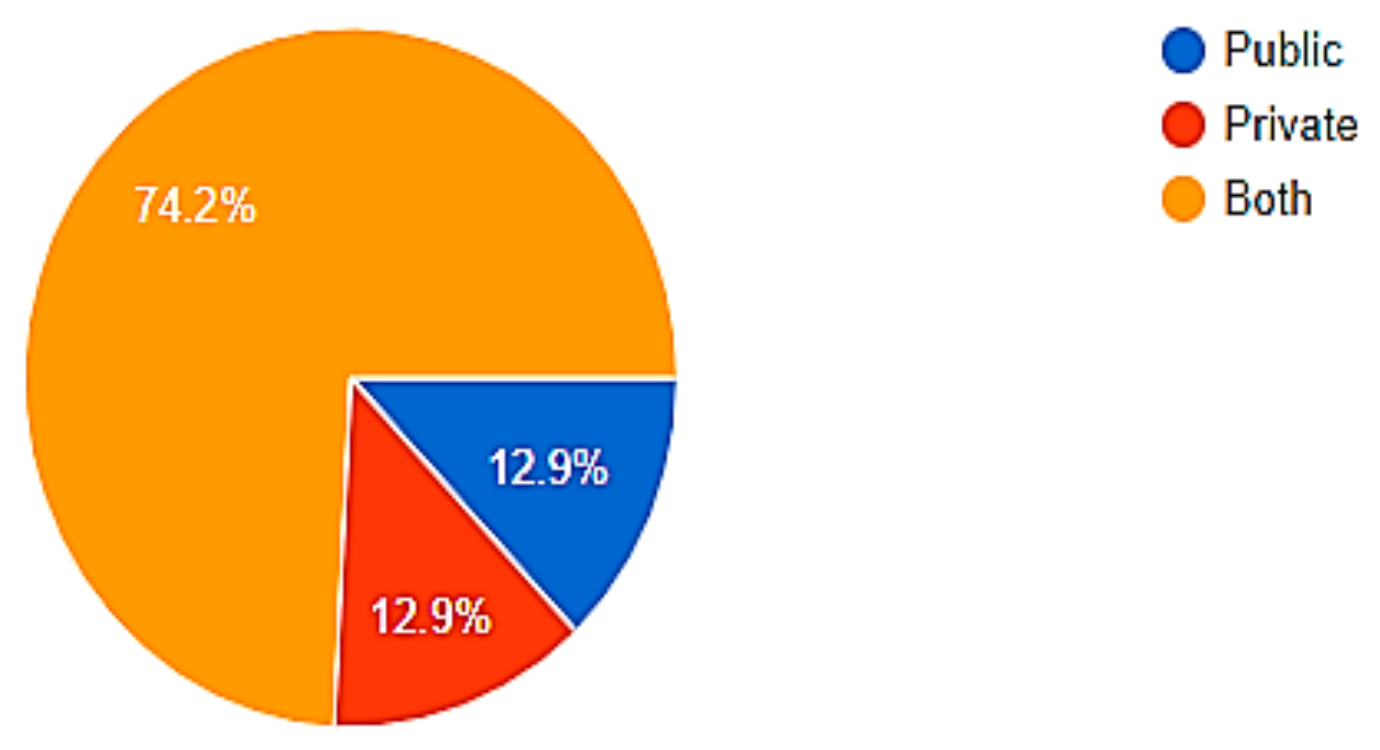
There was a diverse group of project types, with some private and others public, in the project’s make-up. However, as illustrated in
Figure 23, most of the completed projects were hybrid private–public initiatives.
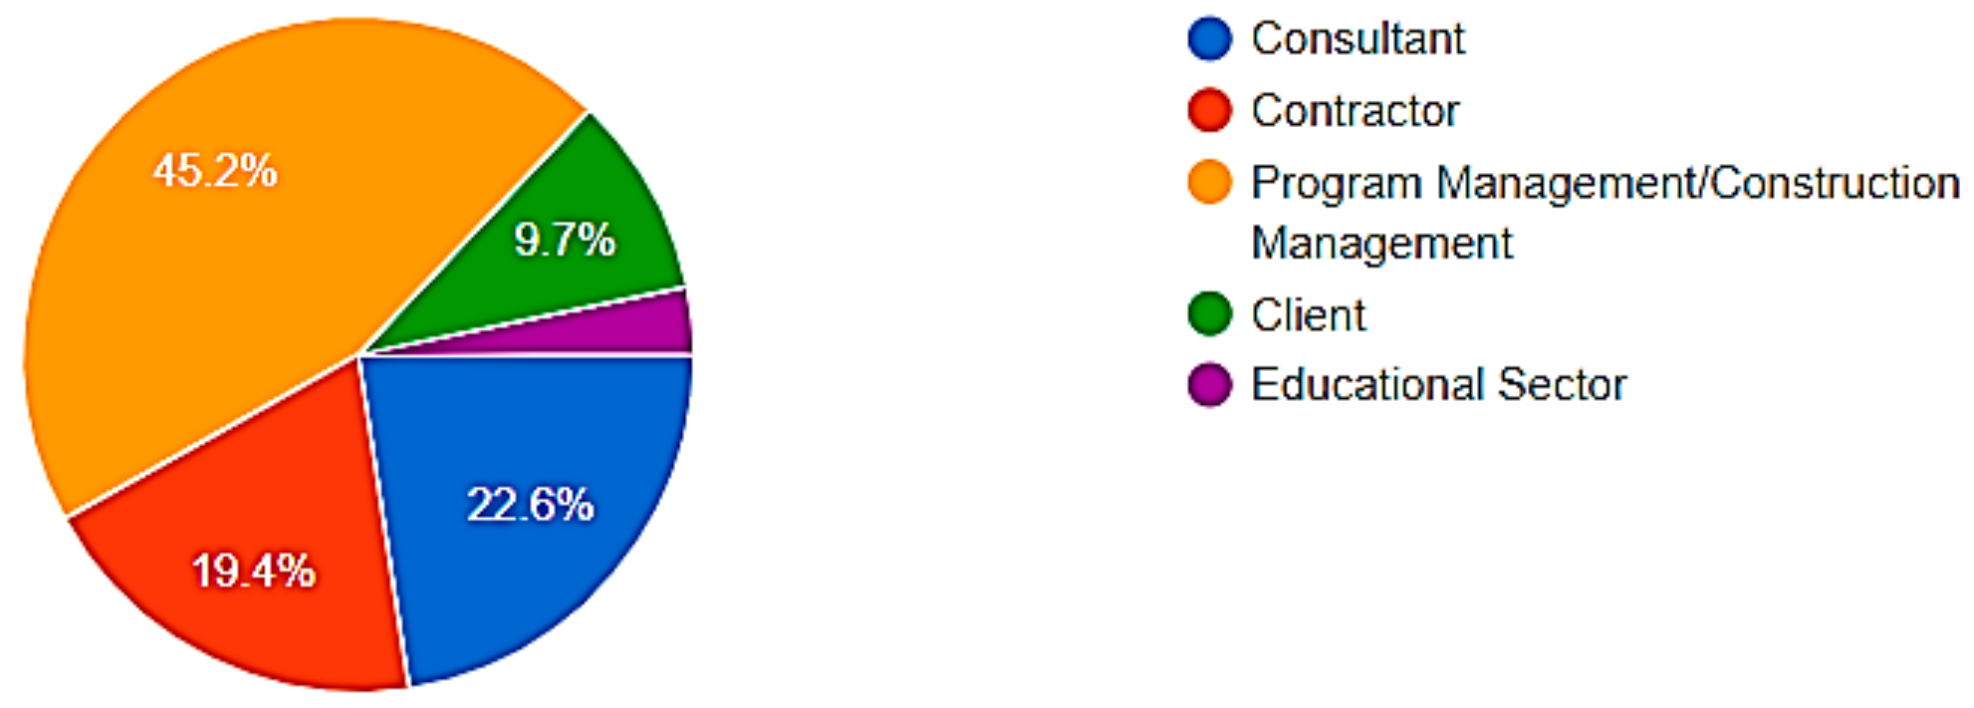
In addition, as illustrated in
Figure 24, the majority of the participants are from the project management industry; however, the evaluation also includes participants from other industries, such as contractors and consultants, among others.
11.2. Part II: BIM Adoption in the Project
This part of the survey collected additional information regarding the BIM adoption in the current projects of the participants. The following items can be derived;
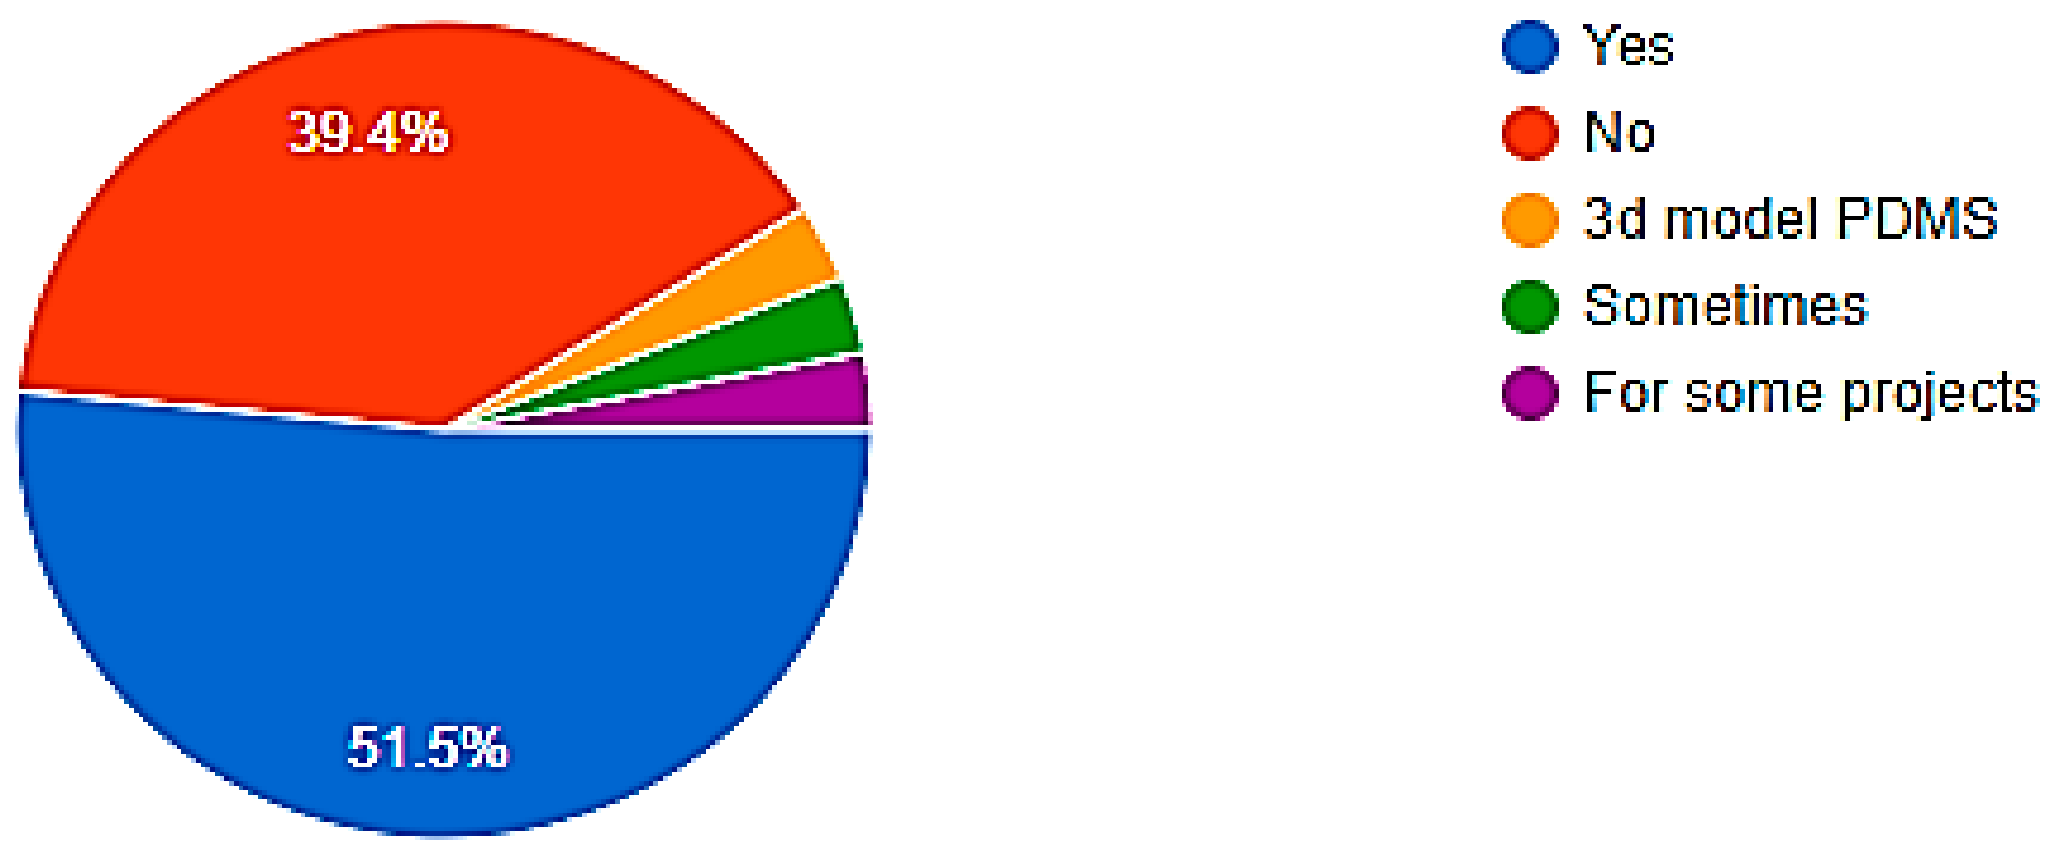
As indicated in
Figure 25, most of the participants used BIM or similar software in their projects.
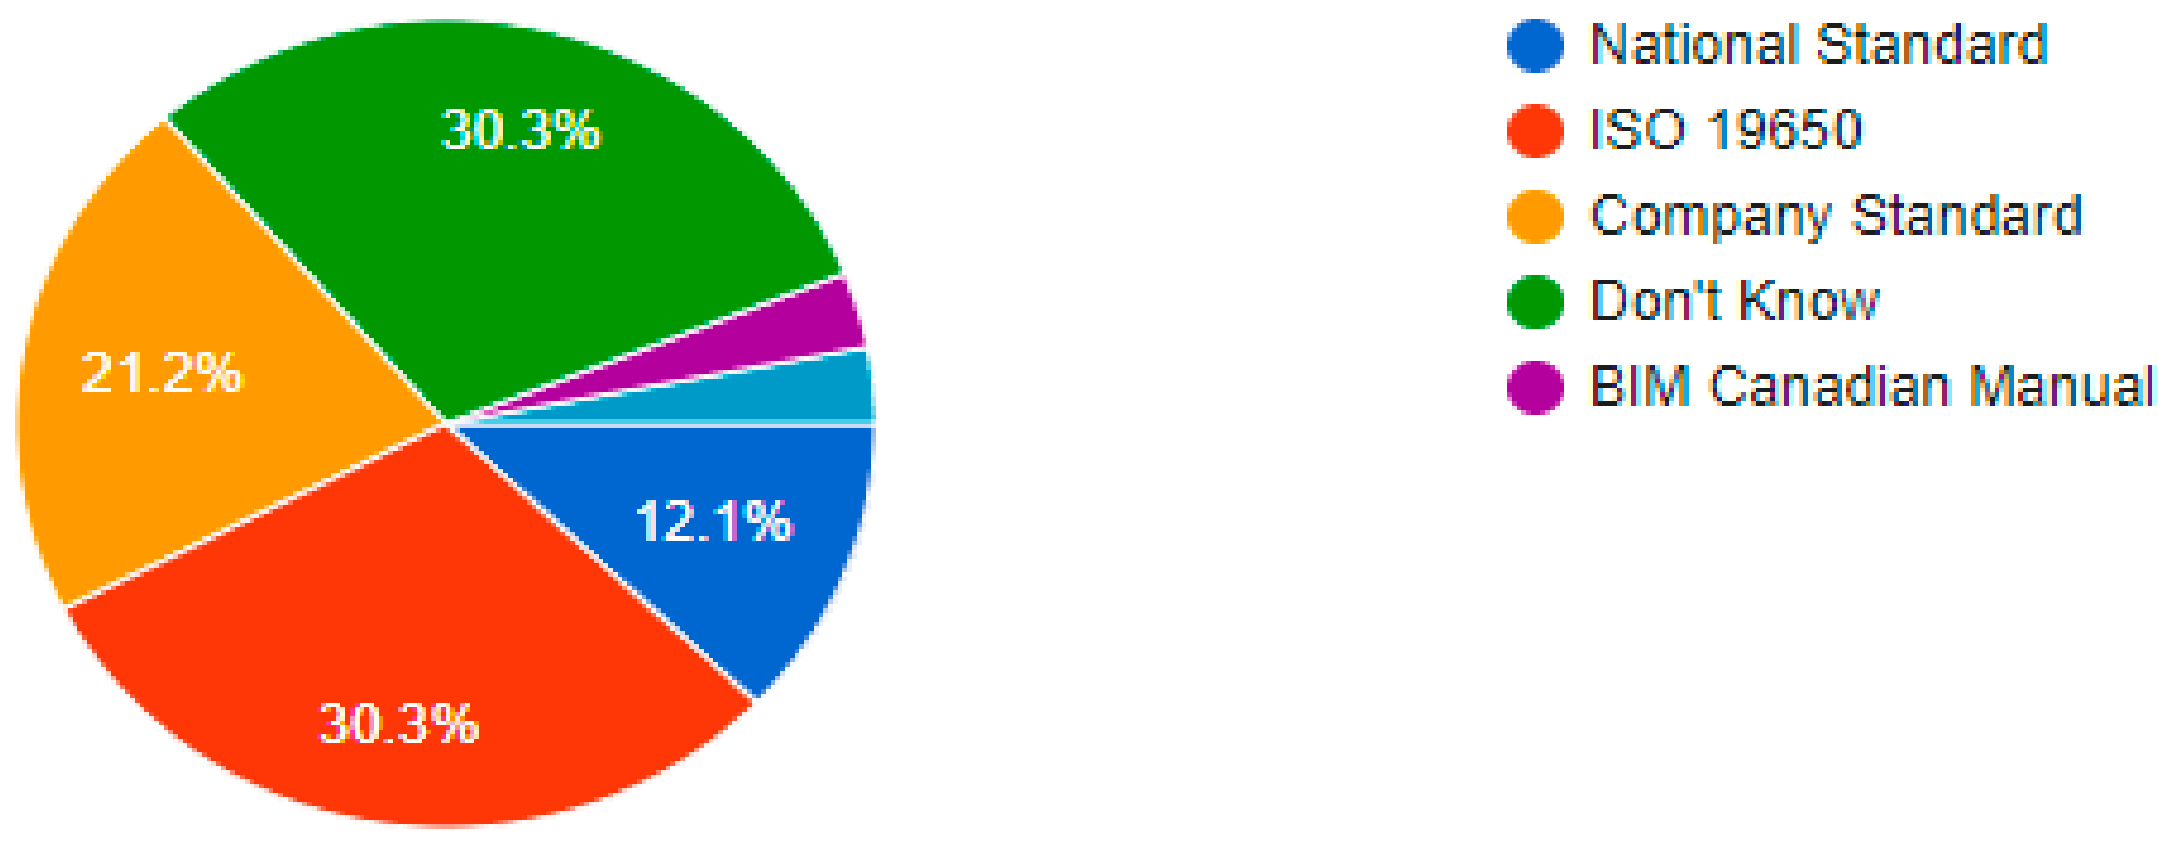
Figure 26 illustrates a clear distinction in the types of BIM standards used to manage the BIM process in construction projects. Some participants in the survey utilize the ISO19650-1 and ISO19650-2 while others still use their national BIM standard or do not use it.
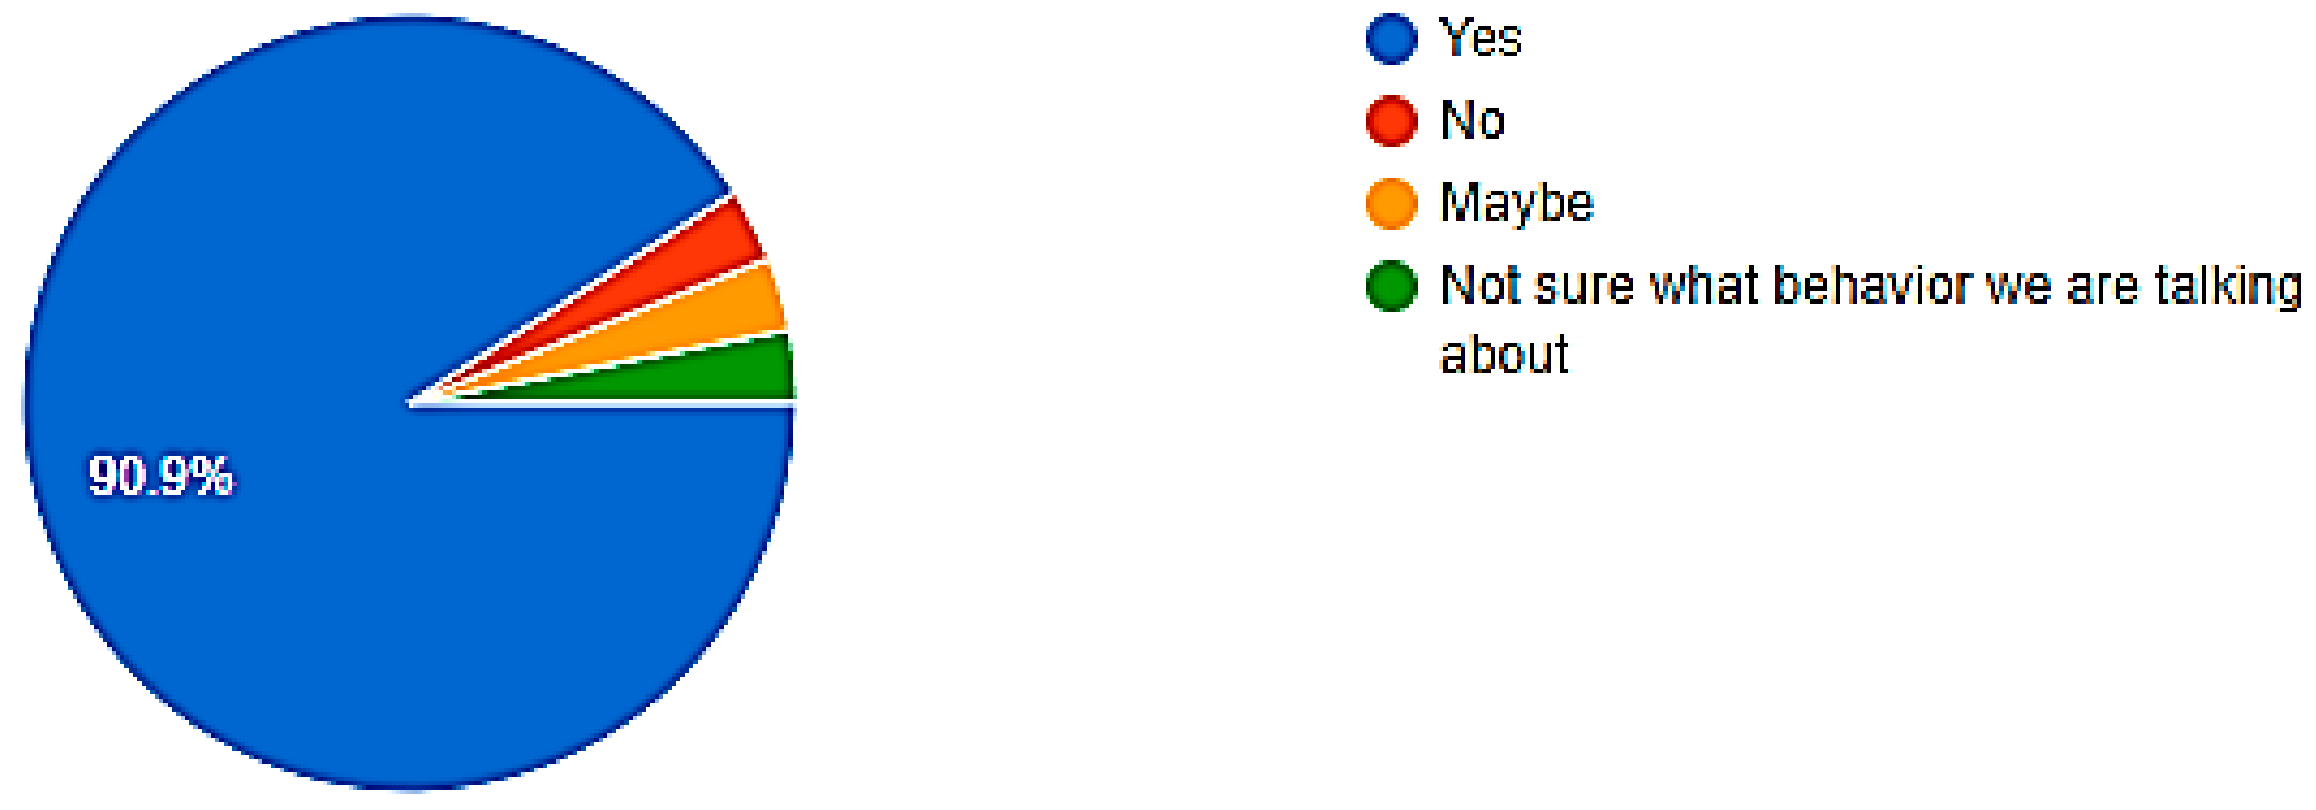
As shown in
Figure 27, most participants agree that using BIM as a platform for gathering and displaying worker behavior and completion percentage will add value to the tracking approach described in the previous section.
11.3. Part III: Current Project Information
This section is designed to gather feedback on the current project of the participants.
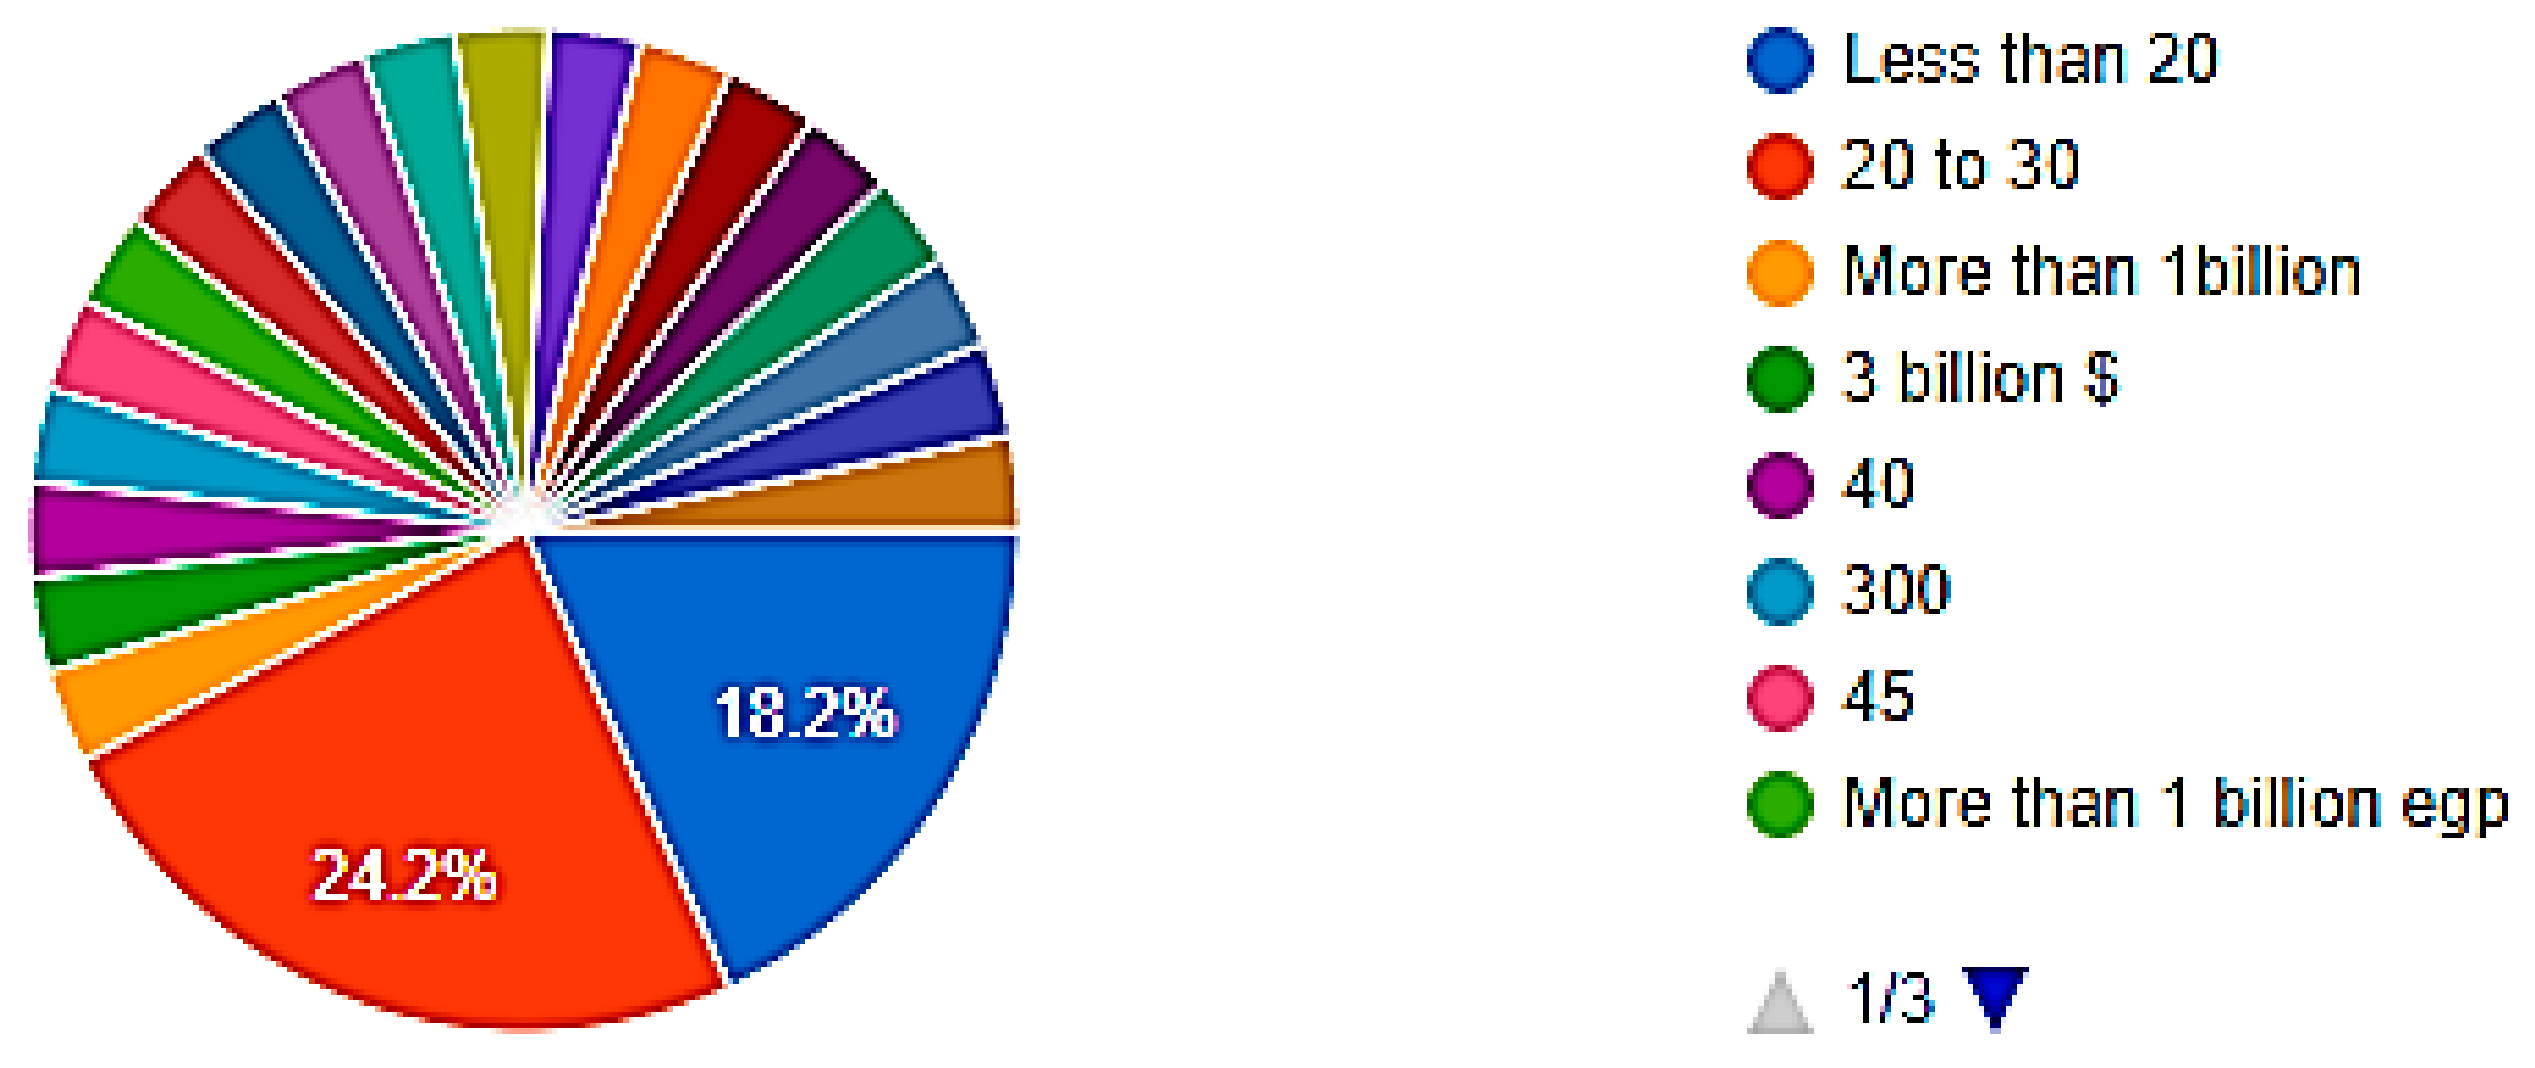
As shown in
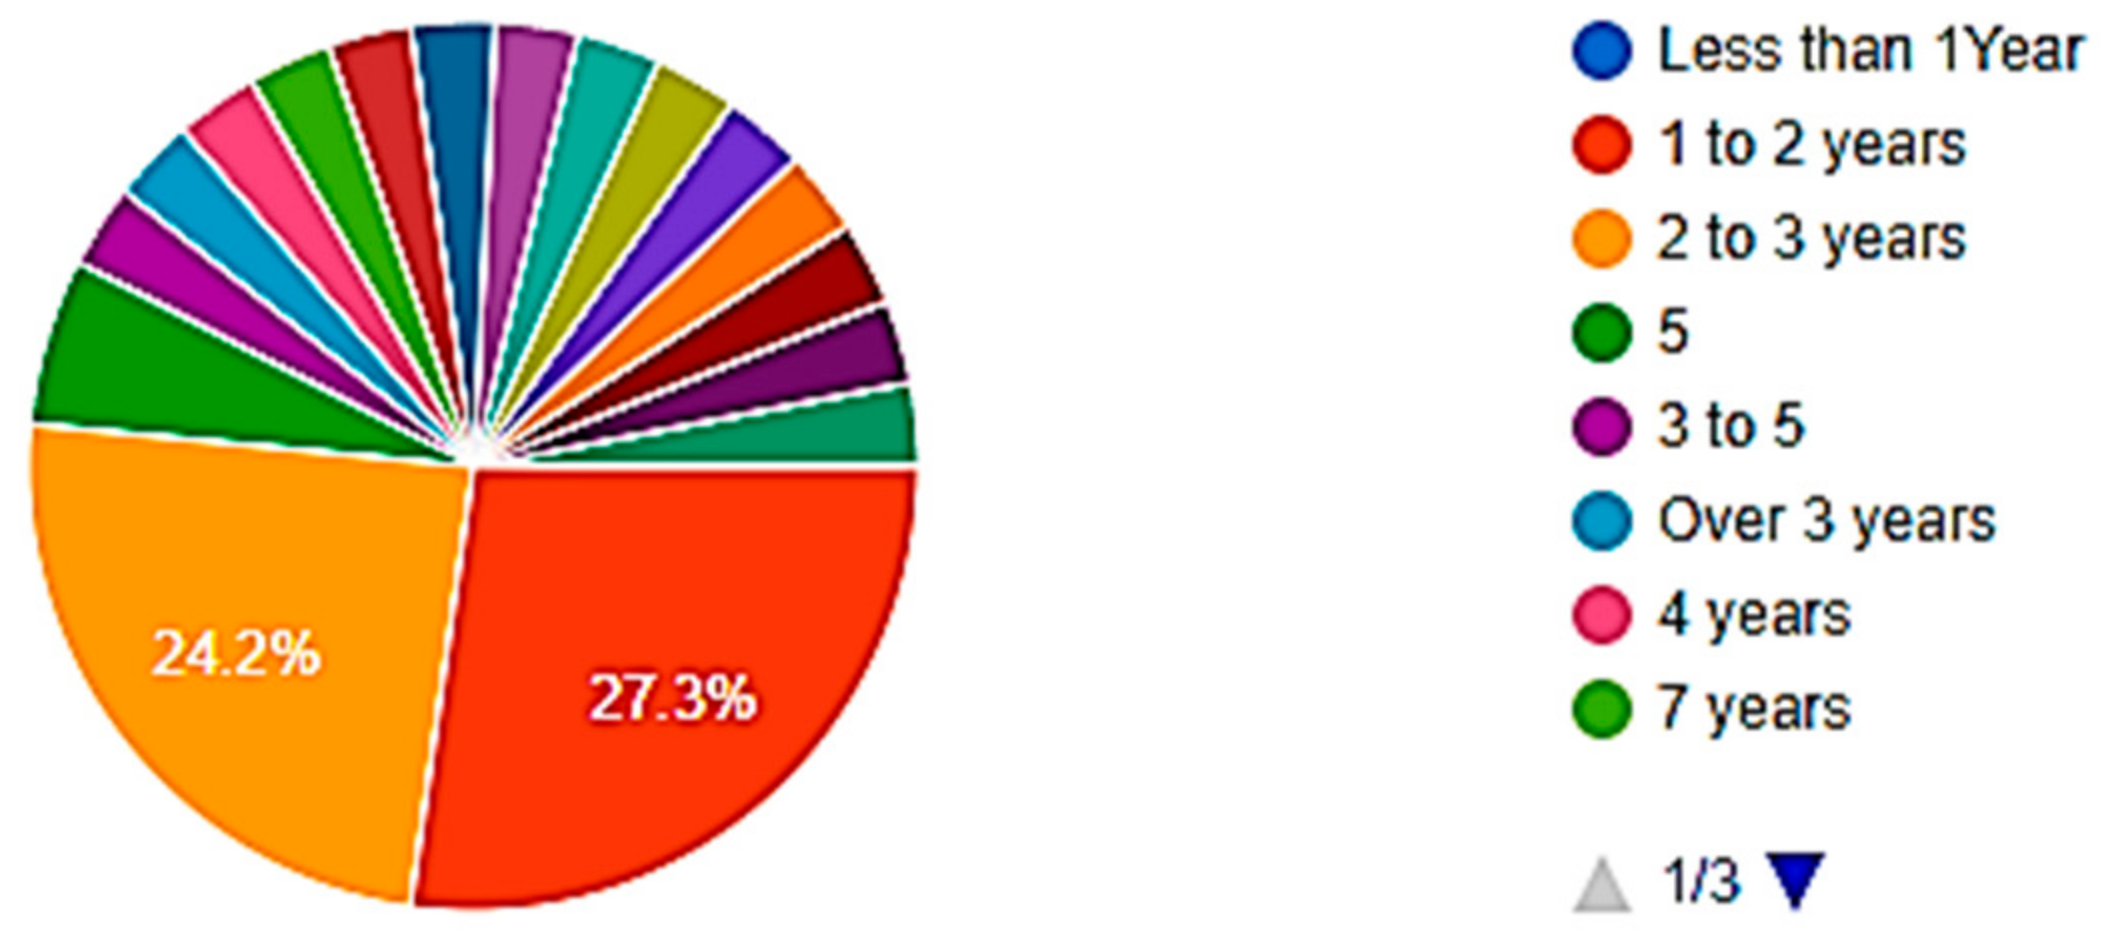
Figure 28 (in million US dollars), a typical project with typical values has been managed or worked on by the participant. The majority were in charge of projects with a value of 20 to 30 million US dollars. Furthermore, most of the data were gathered throughout the project, which lasted between one and three years, as indicated in
Figure 29.
The maximum daily number of workers required to complete the work for the majority of participants was between 30 and 50 workers per hour during rush hour, as indicated in
Figure 30. Each participant stated the magnitude of the problem before providing solutions for managing and monitoring those particular numbers of workers.
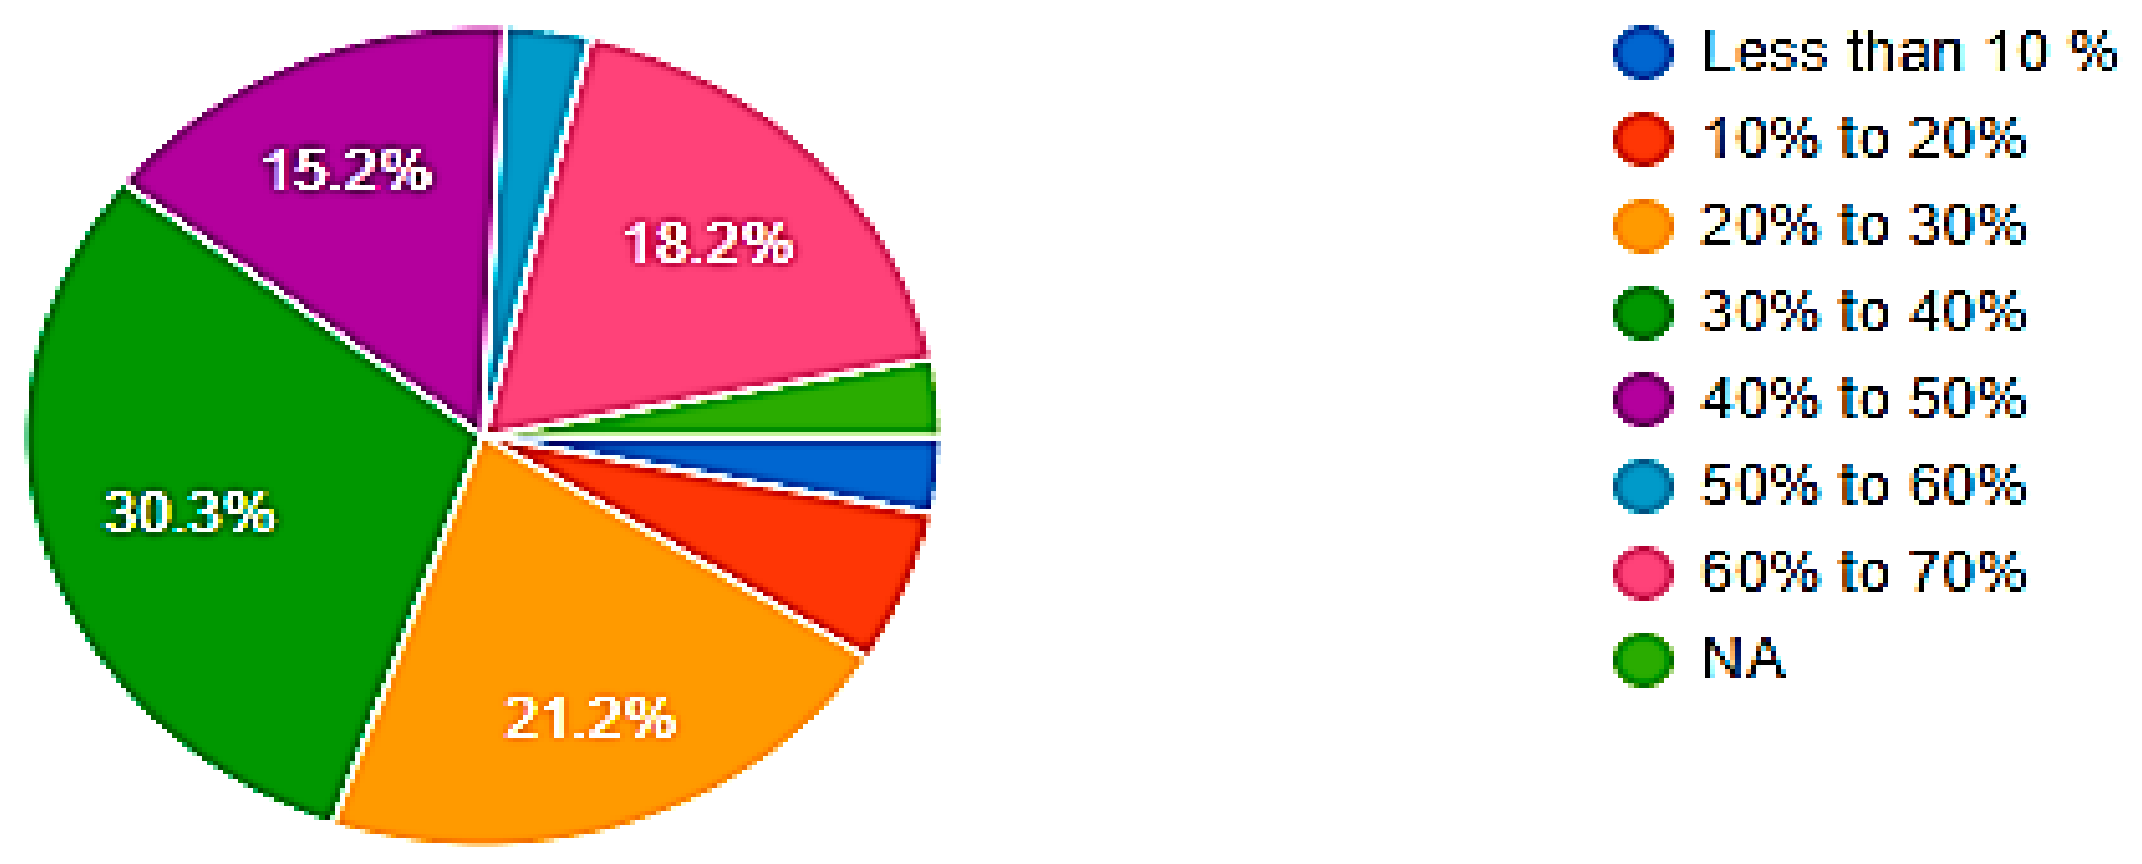
At the same time, the participants believe that worker productivity can contribute to project delays by 10 to 30%, as depicted in
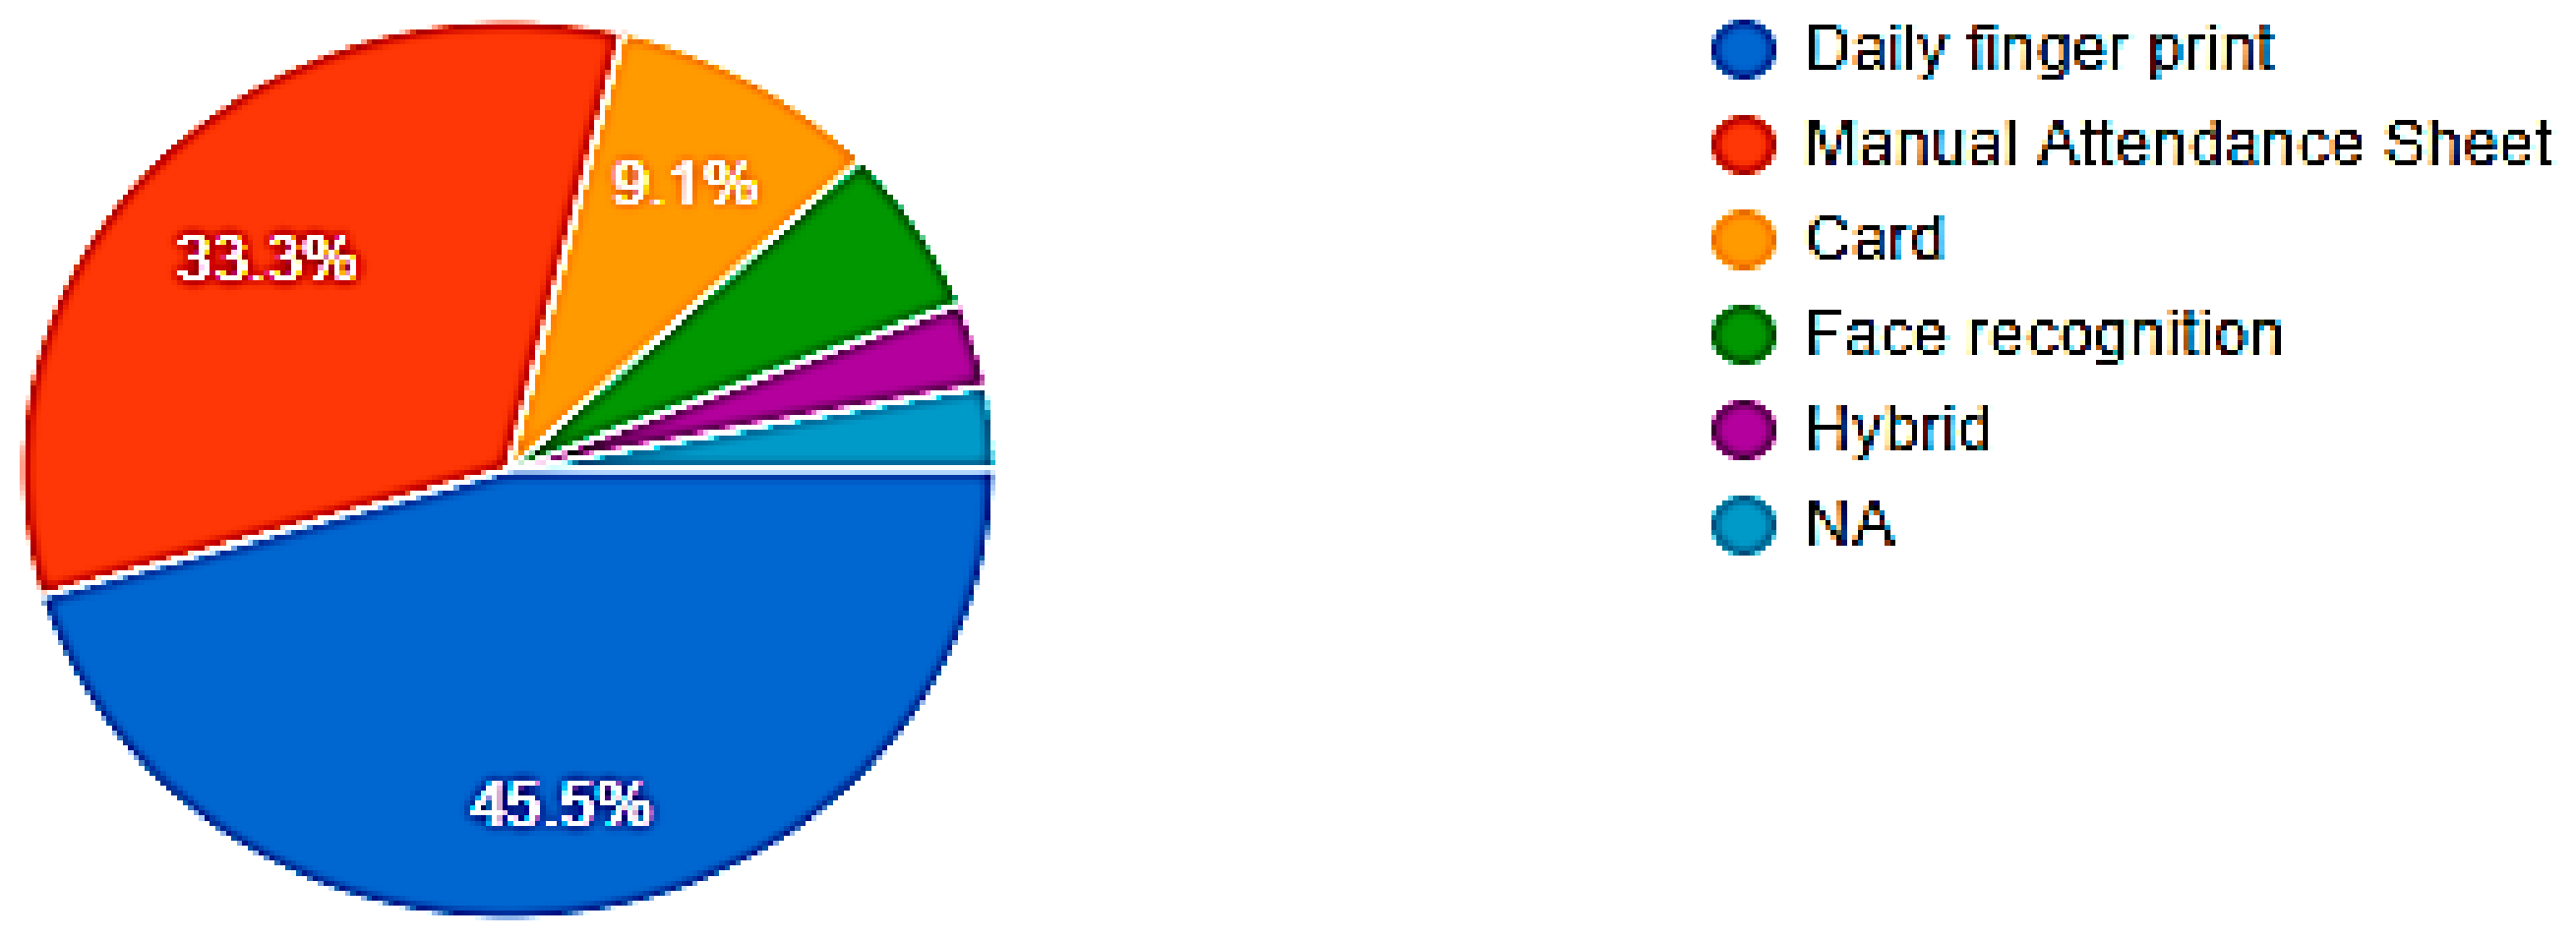
Figure 31. The methods used for tracking workers were Fingerprints or an RFID card. Face recognition was employed by only a small number of participants, as indicated in
Figure 32.
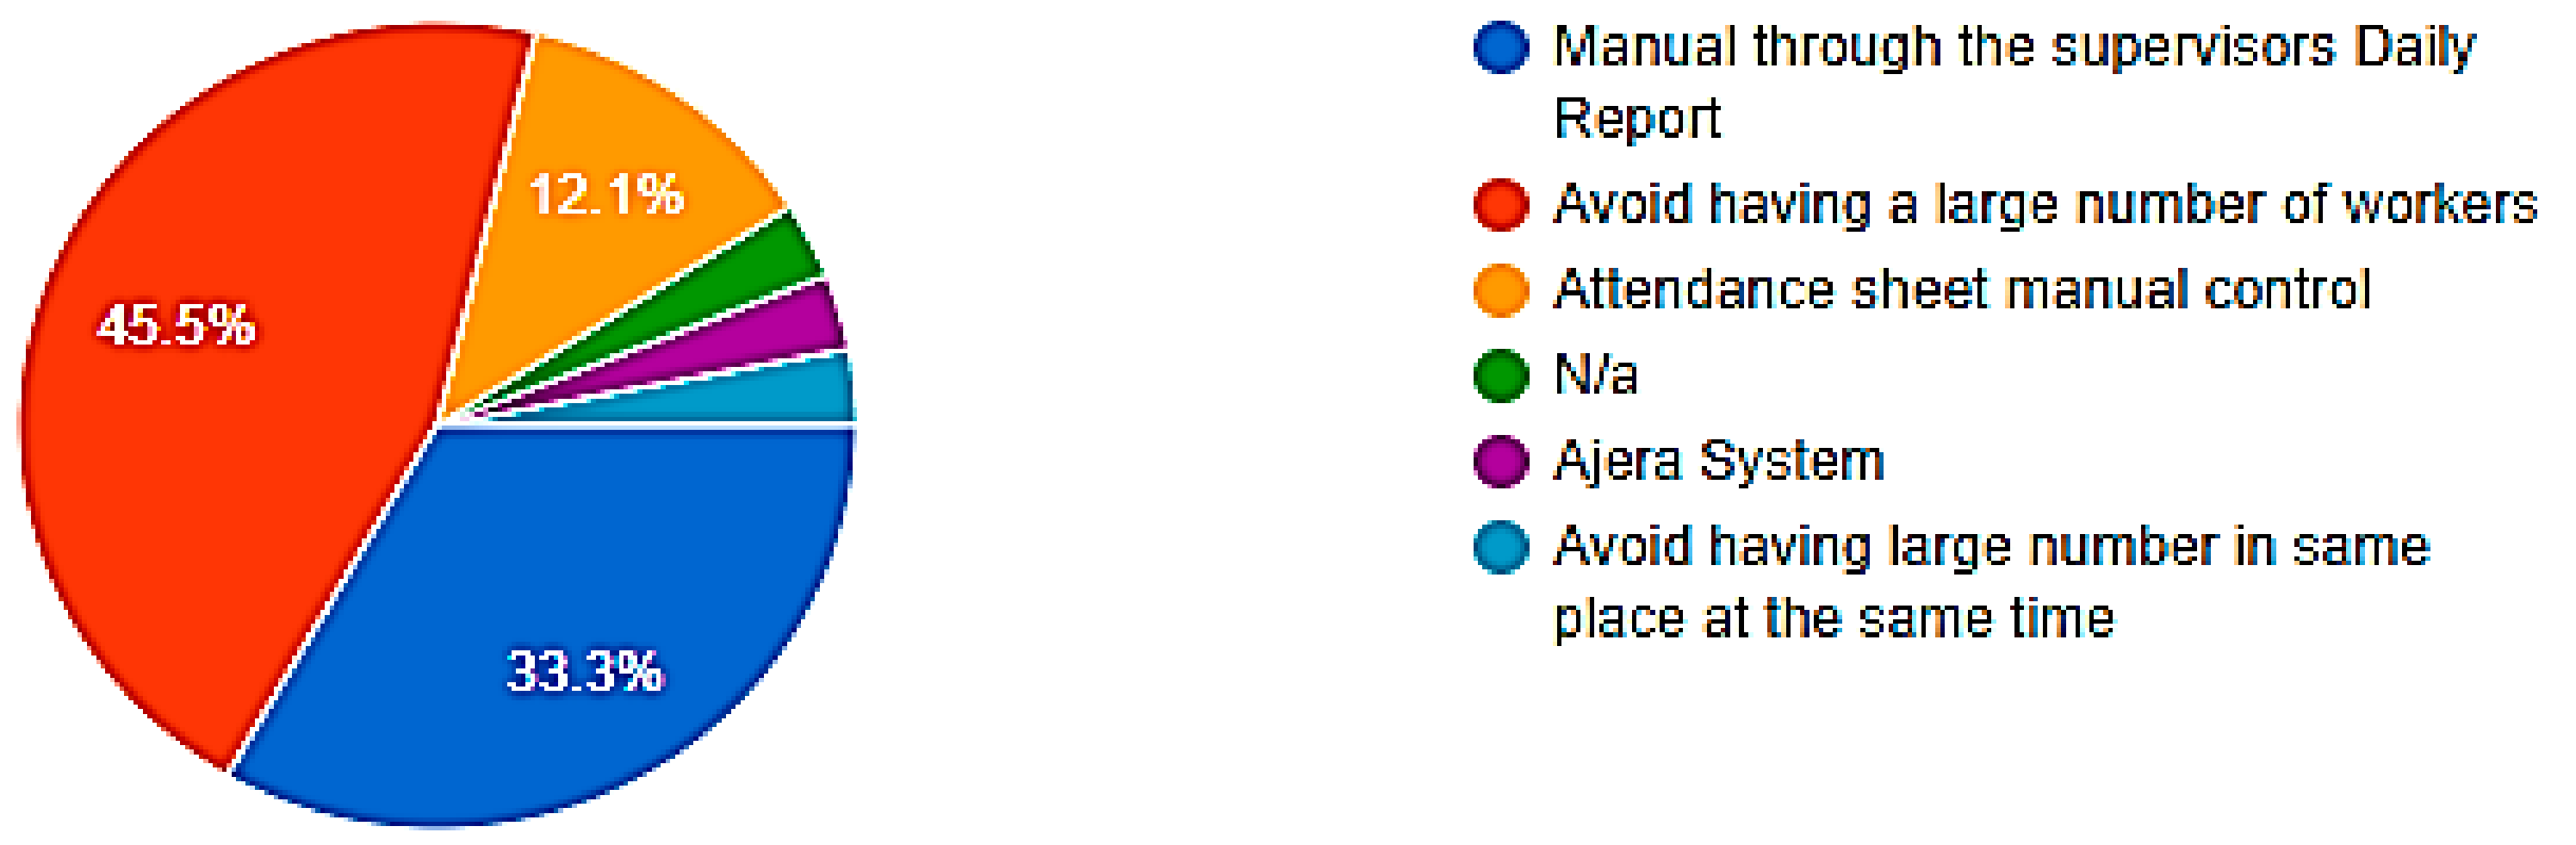
According to the survey results highlighted in
Figure 33, there is a discrepancy in tracking workers’ migration from one zone to another. Based on the supervisor’s presence on site, approximately 70% of the workers recognize the migration manual. Others argue that tracking workers’ migration in construction projects is complicated.
The crisis of the COVID-19 pandemic, and the WHO rules to preserve social distance between workers, have been discussed in the survey’s outcomes. As depicted in
Figure 34, most participants advocated some workers not attending, and then tracking them to maintain a social distance between groups.
11.4. Part IV: Autodesk Visualizer Plugin and CEWS Tool Primary Evaluation
This section of the survey is the most crucial because it covers the participants’ thoughts and recommendations on the proposed hybrid tracking solution after trying it. The Autodesk Visualizer Plugin, as well as the CEWS tool, have been assessed, and the level of satisfaction has been graded on a scale from one to five. “One” indicates that users are highly dissatisfied, whereas “five” indicates that they are highly satisfied. Most of the users show their consistency with the interface of the CEWS, as indicated in
Figure 35A. According to the illustration, no one found it hard to deal with the user interface. Only 20% of surveyed participants expressed dissatisfaction with the user interface. In order to make the application easier to use for users, the participants’ opinions will be taken into consideration.
The following notices can be summarized:
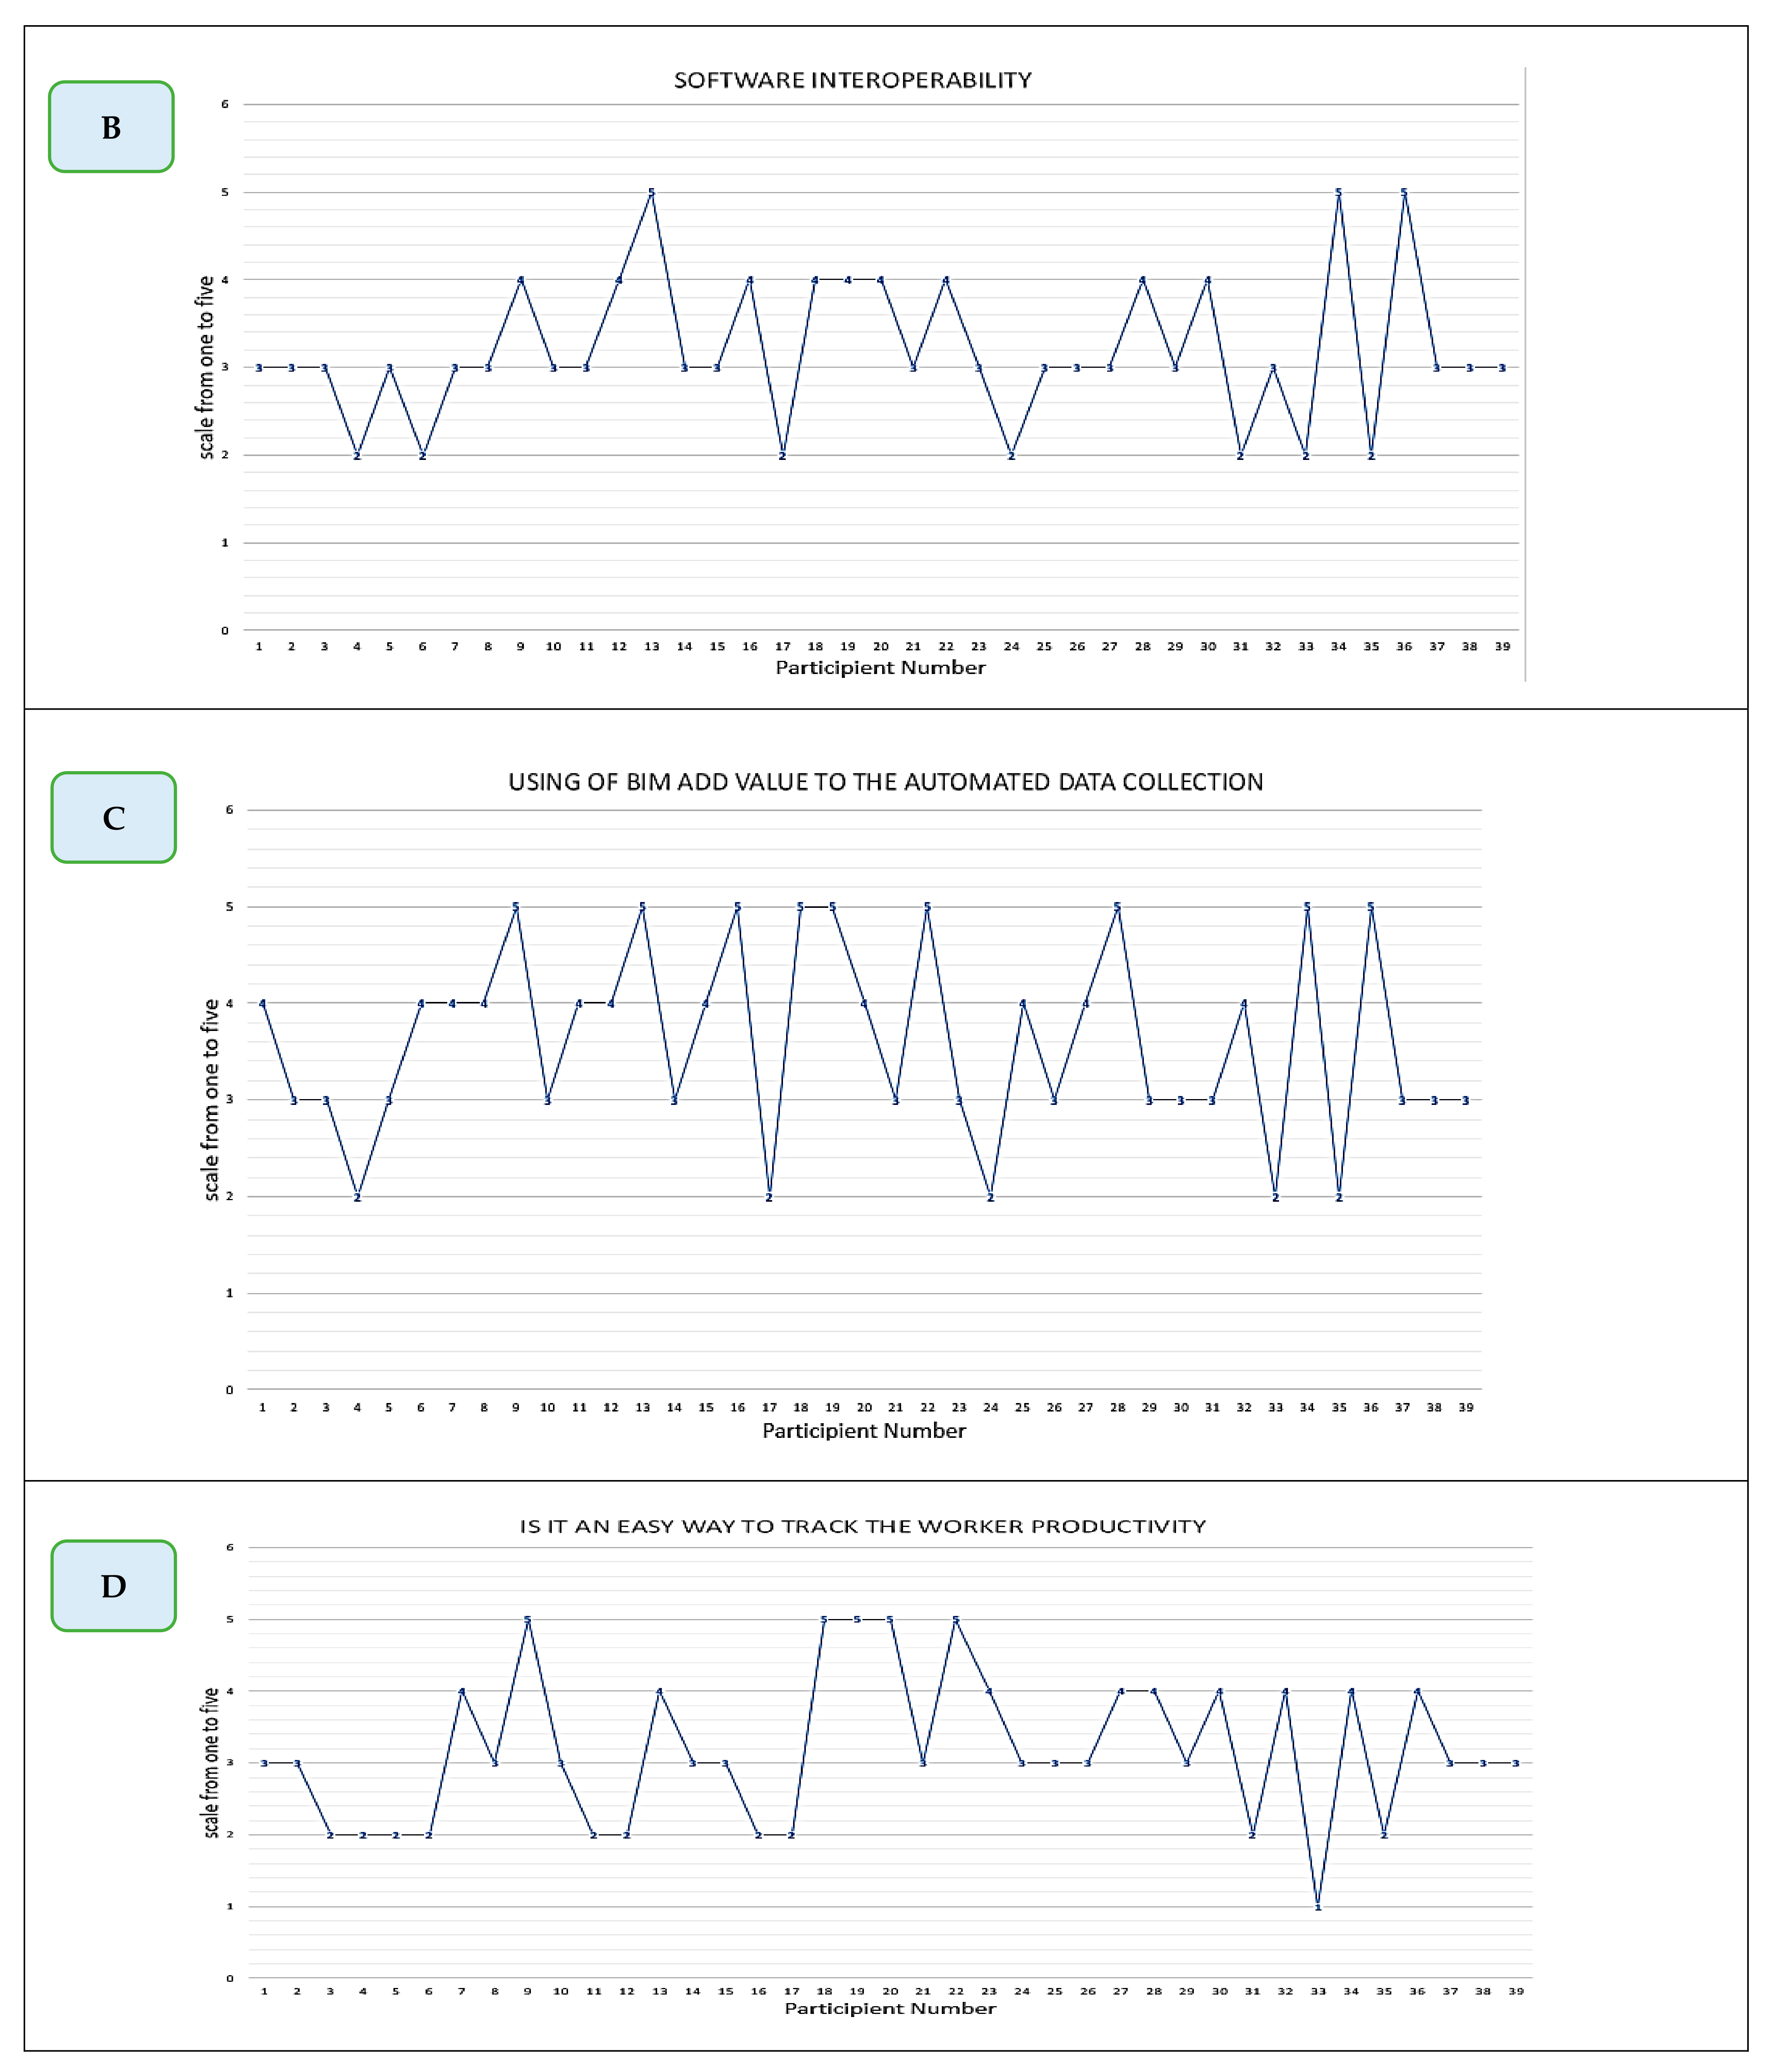
While the interoperability across software while using the hybrid tracking system has been demonstrated, some participants declared that it needs further enhancement to be compatible with the wide variety of other software being utilized. It was reported by 27 percent of the participants that it was difficult to utilize the tool for productivity tracking, while the majority (70 percent) claimed that they had no difficulty in estimating productivity using the tracking tool, as indicated in
Figure 35B.
Eighty-seven percent of those who took part in the survey believe that BIM will be beneficial in the automation of data collection from the construction site, as indicated in
Figure 35C.
The majority (70 percent) were highly evaluating the estimation of productivity by the tracking tool (
Figure 35D).
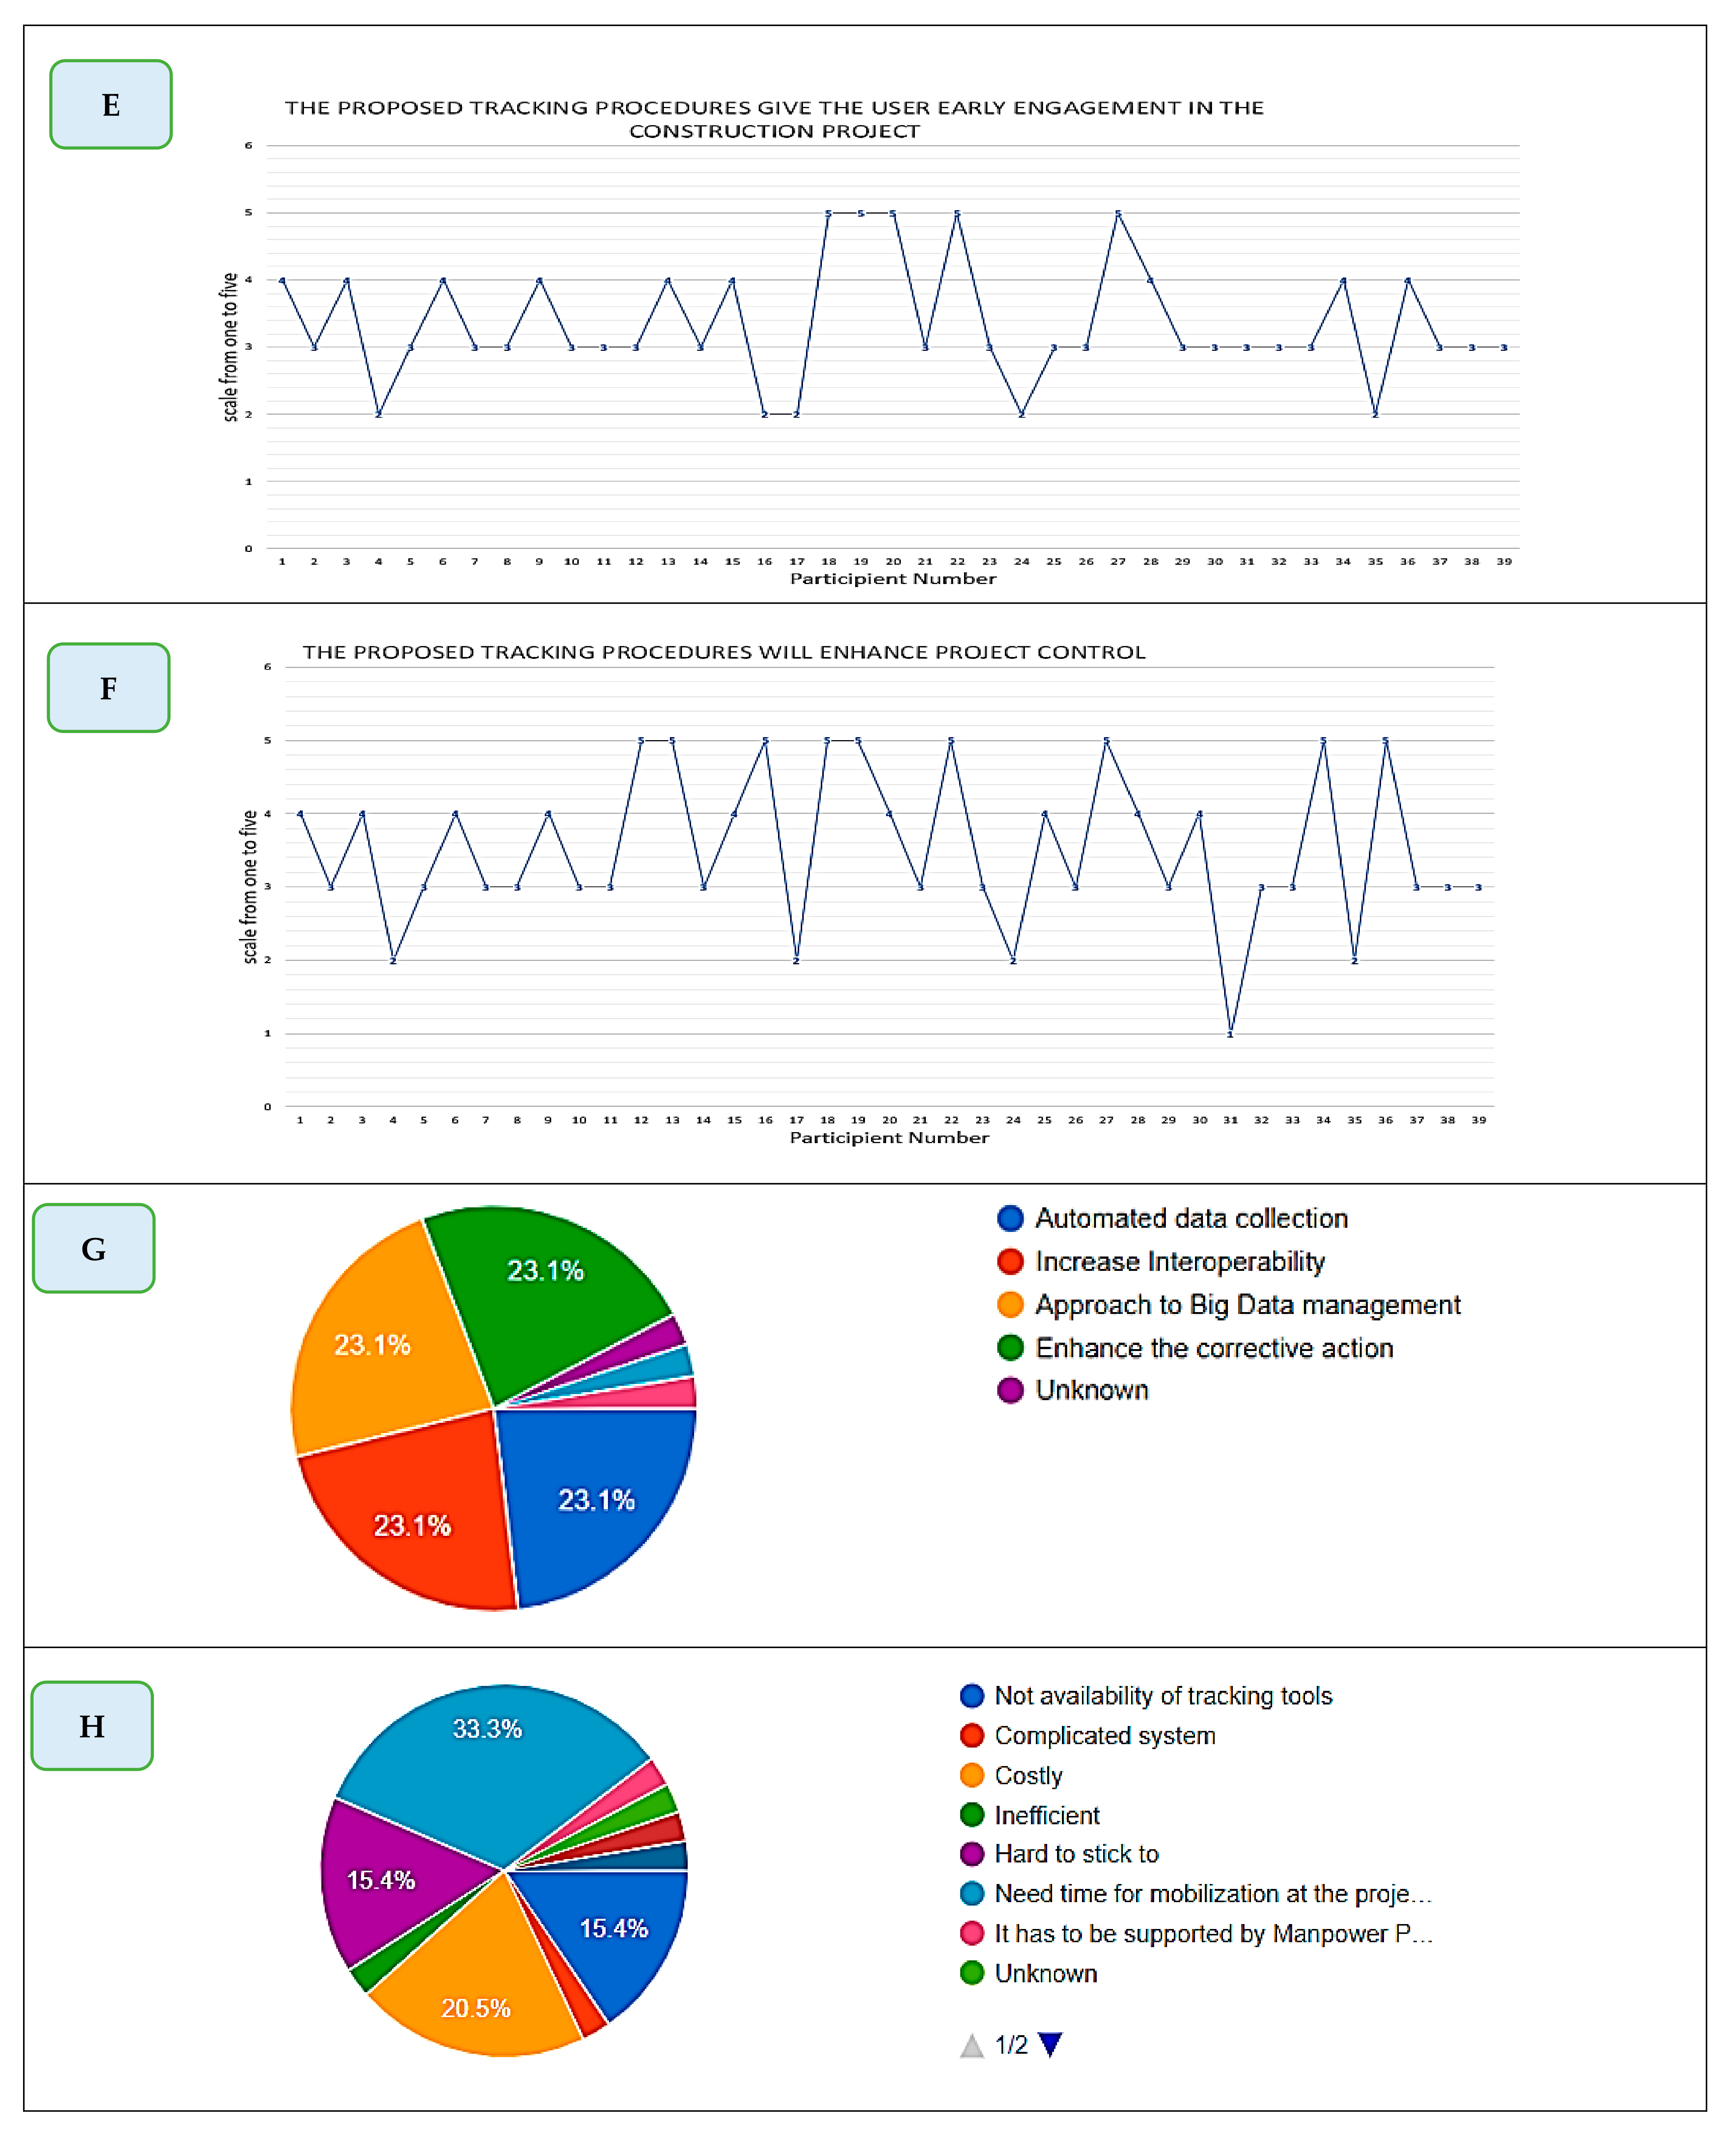
Ninety percent of the participants agreed that the proposed tracking processes allow users to become involved in the construction project early, which will add value to the project, as illustrated in
Figure 35E. The same percentage stated that using BIM in the study enhances project control, Finally, most of the participants (90 percent) agreed that making an early estimate of the production rate and re-planning based on new productivity through a tracking tool will improve the project’s overall progress, as indicated in
Figure 35F.
The participants agreed that there are numerous advantages of utilizing the hybrid solution. The majority of respondents agreed that the benefits could be summarized as follows: automated data gathering, increased interoperability, and the development of an approach to extensive data management. As depicted in
Figure 35G, only a small number of people believed that software and hardware add no value to the construction industry.
Regarding the disadvantages, 33% of the participants stated that the tools are still not available in the market, and 20% stated that the tool may be costly, as indicated in
Figure 35H.
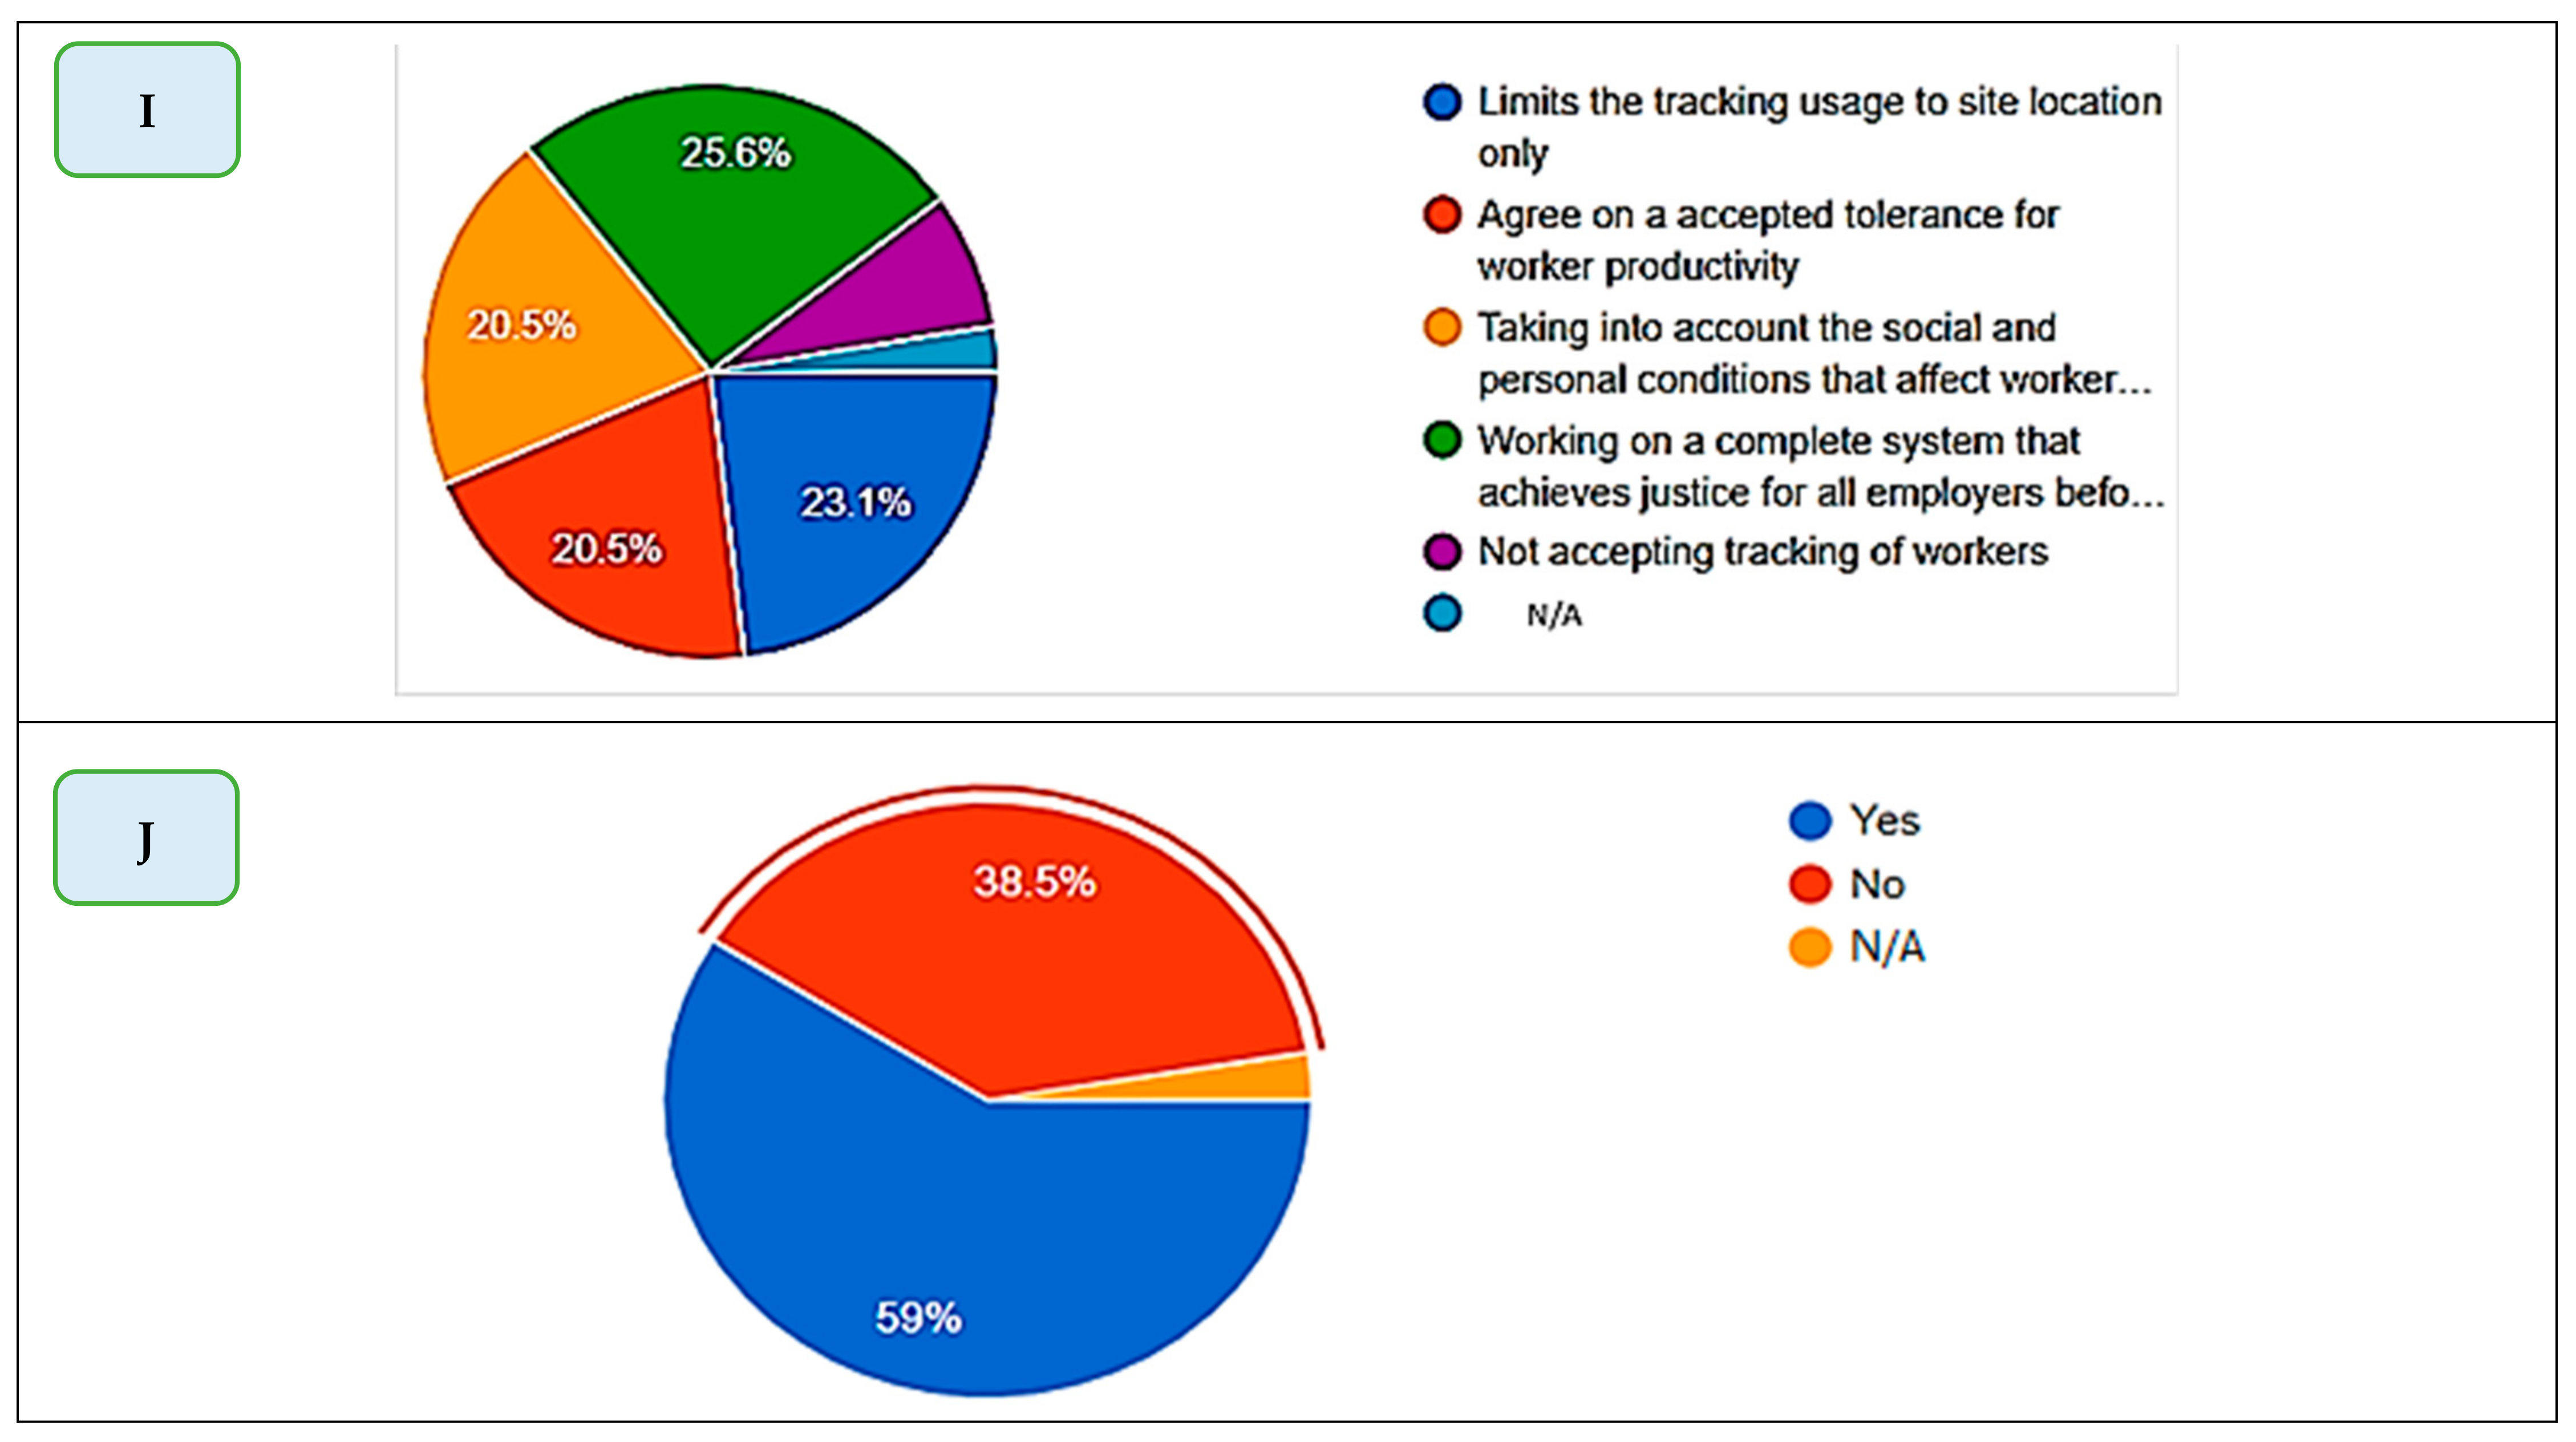
Workplace tracking has been the focus of some criticisms from the perspective of human rights advocates. Some participants expressed their desire to see tracking technology improved to respect employees’ privacy rights. Some stated that it is better to limit the tracking usage to site locations only. Others agreed on an acceptable tolerance for worker productivity. On the other hand, some participants stated that personal conditions might affect operational productivity, which shall be considered. In addition, some participants did not agree with tracking workers at all, as seen in
Figure 35I. Finally, nearly 60 percent of those who took part in the survey stated that the implementation of tracking technology in the construction business would take some time (
Figure 35J).
12. Conclusions
This research marks a significant advancement in the field of construction engineering and management by developing and validating a comprehensive methodology for the real-time optimization of construction resources. By seamlessly integrating Agent-Based Modeling (ABM), Building Information Modeling (BIM), and Bluetooth Low Energy (BLE) technologies, complemented by innovative use of the Client Early Warning System (CEWS) and Decision Support System (DSS), this study shifts the paradigm of monitoring and optimizing construction human resources. The methodological strength of this research lies in its sophisticated combination of real-time tracking, dynamic visualization, and predictive analytics, which collectively set a new industry benchmark.
The practical implications of this research are substantial, offering actionable insights and recommendations for practitioners. It demonstrates how the integrated approach can be pragmatically adopted in day-to-day construction management practices to enhance project efficiency and decision-making. The study not only provides a template for future technological integration in construction but also encourages the adoption of these practices across the industry. While the research outcomes are promising, we acknowledge inherent limitations that must be addressed. Challenges, such as signal interference in BLE technology and potential privacy concerns regarding the tracking of workers, were noted. These issues underline the need for careful implementation and further refinement of the technologies involved.
Looking forward, this research paves the way for future investigations aimed at extending these methodologies to additional resources. Such studies will explore ways to mitigate identified challenges and expand the utility of our integrated systems. By fostering more efficient and effective resource allocation, our work contributes to a broader vision of a more connected, data-driven, and efficient future in construction management globally. This endeavor not only enhances operational efficiencies but also aligns with sustainable practices by optimizing resource utilization and reducing waste on construction sites.
Author Contributions
Conceptualization, A.M.A. and A.E.; Data curation, A.M.A., S.O.S., A.A.A. and M.T.; Formal analysis, A.M.A. and S.O.S.; Funding acquisition, A.M.A. and A.A.A.; Investigation, A.M.A., S.O.S., A.A.A. and M.T.; Methodology, A.M.A. and S.O.S.; Project administration, A.M.A. and A.E.; Resources, A.M.A. and S.O.S.; Software, A.M.A. and S.O.S.; Supervision, A.M.A.; Validation, A.M.A., S.O.S., A.A.A. and A.S.; Visualization, A.M.A., S.O.S., A.A.A., A.S., D.-P.N.K. and M.T.; Writing—original draft, A.M.A. and S.O.S.; Writing—review and editing, A.M.A., A.A.A., D.-P.N.K. and M.T. All authors have read and agreed to the published version of the manuscript.
Funding
The authors extend their appreciation to the Researchers Supporting Project number (RSPD2024R590), King Saud University, Riyadh, Saudi Arabia.
Data Availability Statement
The data presented in this study are available on request from the corresponding author.
Conflicts of Interest
Author Ahmed Sharaf was employed by the company BYLOR (Bouygues and Laing’roke) JV. The remaining authors declare that the research was conducted in the absence of any commercial or financial relationships that could be construed as a potential conflict of interest.
Correction Statement
This article has been republished with a minor correction to the correspondence contact information. This change does not affect the scientific content of the article.
References
- Patel, S.; Kumar, V. Real-time Data Integration and BIM: Transforming Construction Management. Constr. Econ. Build. J. 2022, 22, 34–52. [Google Scholar]
- Thompson, R.; Lee, M. BIM’s Limitations in Real-Time Labor Productivity Enhancement. J. Build. Inf. Model. 2023, 149, 203–219. [Google Scholar]
- Lee, G.; Kim, H. Digital Twins in Construction: A Real-Time Approach. J. Constr. Innov. 2020, 22, 475–492. [Google Scholar]
- Wang, Y.; Zhang, Y. Agent-Based Modeling for Optimized Construction Management. Autom. Constr. 2021, 122, 103517. [Google Scholar]
- Zhao, L.; Zhou, Q. Integrating ABM with BIM for Dynamic Project Management. Smart Constr. Res. 2019, 3, 45–59. [Google Scholar]
- Smith, J.; Thompson, R. Enhancing Construction Efficiency through Digital Twins and ABM. J. Adv. Constr. Technol. 2022, 5, 112–130. [Google Scholar]
- Gupta, R.; Singh, A. Digital Twins: The Next Frontier in Construction Project Management. Sustain. Constr. 2024, 6, 158–177. [Google Scholar]
- Patel, S. Scenario Planning in Construction with Digital Twin Technology. J. Constr. Innov. 2022, 23, 334–350. [Google Scholar]
- Thompson, R.; Lee, M. Real-Time Project Management with Digital Twins in Construction. J. Build. Inf. Model. 2023, 150, 407–425. [Google Scholar]
- Wang, Y.; Zhang, Y. Integrating IoT with Digital Twins for Dynamic Construction Management. Autom. Constr. 2021, 121, 103344. [Google Scholar]
- Zhao, L.; Zhou, Q. Predictive Analytics and Real-Time Data in Construction: A Digital Twin Approach. Smart Constr. Res. 2019, 4, 30–45. [Google Scholar]
- Kim, P.; Park, J. Case Studies on Real-Time Management in Construction. J. Pract. Constr. Manag. 2023, 24, 95–112. [Google Scholar]
- Thompson, R.; Lee, M. Sustainability and Efficiency in Modern Construction: The Impact of Advanced Technologies. Environ. Build. News 2024, 30, 89–104. [Google Scholar]
- Smith, J.; Thompson, R. Challenges in Real-Time Construction Management with BIM. J. Constr. Effic. 2023, 15, 245–262. [Google Scholar]
- Lee, G.; Kim, H. Innovations in BIM for Enhancing Labor Productivity. J. Constr. Innov. 2024, 16, 30–48. [Google Scholar]
- Patel, S.; Kumar, V. Predictive Analytics in BIM: Enhancing Construction Project Management. Constr. Manag. Rev. 2022, 18, 112–129. [Google Scholar]
- Sepasgozar, S.M.E.; Khan, A.A.; Smith, K.; Romero, J.G.; Shen, X.; Shirowzhan, S.; Li, H.; Tahmasebinia, F. BIM and Digital Twin for Developing Convergence Technologies as Future of Digital Construction. Buildings 2023, 13, 441. [Google Scholar] [CrossRef]
- Zhao, L.; Zhou, Q. BIM and Its Implications for Improving Construction Management Practices. Int. J. Build. Pathol. Constr. Manag. 2021, 29, 158–175. [Google Scholar]
- Martinez, R.; Fernandez, E. Utilizing IoT with BIM for Real-Time Labor Management. Autom. Build. Constr. 2023, 122, 103517. [Google Scholar]
- Radzi, A.R.; Azmi, N.F.; Kamaruzzaman, S.N.; Rahman, R.A.; Papadonikolaki, E. Relationship between digital twin and building information modeling: A systematic review and future directions. Constr. Innov. 2024, 24, 811–829. [Google Scholar] [CrossRef]
- Wang, Y.; Zhang, Y. Dynamic Simulation in Construction Projects: Integrating ABM with BIM. J. Comput. Civ. Eng. 2021, 19, 65–81. [Google Scholar]
- Smith, J.; Thompson, R. Enhancing ABM Capabilities for Construction Project Efficiency. J. Mod. Proj. Manag. 2022, 20, 134–150. [Google Scholar]
- Lee, G. Advanced Agent-Based Modeling Techniques in the Construction Industry. Constr. Process Innov. J. 2023, 24, 11–29. [Google Scholar]
- Patel, S. Synergistic Effects of ABM and BIM on Construction Site Efficiency. J. Constr. Eng. Manag. 2022, 148, 03520001. [Google Scholar]
- Zhao, L.; Zhou, Q. Improving Construction Project Management through Integration of ABM and BIM. Smart Constr. Res. 2022, 5, 22–37. [Google Scholar]
- Afzal, M.; Li, R.Y.M.; Shoaib, M.; Ayyub, M.F.; Tagliabue, L.C.; Bilal, M.; Ghafoor, H.; Manta, O. Delving into the Digital Twin Developments and Applications in the Construction Industry: A PRISMA Approach. Sustainability 2023, 15, 16436. [Google Scholar] [CrossRef]
- Martinez, R.; Fernandez, E. Real-Time Data Integration in Digital Twins for Efficient Construction Management. J. Digit. Constr. 2024, 7, 42–59. [Google Scholar]
- Lee, G.; Kim, H. Predictive Analytics and Its Role in Digital Twin Deployment in Construction. J. Build. Inf. Manag. 2025, 31, 77–92. [Google Scholar]
- Alvarenga, C.D.B.C.S.; de Aguilar, M.T.P.; Sales, R.D.B.C.; Caldas, R.B. Digital twins a digital transformation for management of the construction industry. Contrib. A Las Cienc. Soc. 2024, 17, e4250. [Google Scholar] [CrossRef]
- Afzal, M.; Li, R.Y.M.; Ayyub, M.F.; Shoaib, M.; Bilal, M. Towards BIM-Based Sustainable Structural Design Optimization: A Systematic Review and Industry Perspective. Sustainability 2023, 15, 15117. [Google Scholar] [CrossRef]
- Interoperability for Software in Construction. In Proceedings of the 14th European Conference on Product and Process Modelling (ECPPM 2022), Trondheim, Norway, 14–16 September 2022. [CrossRef]
- Yousri, E.; Sayed, A.E.B.; Farag, M.A.M.; Abdelalim, A.M. Risk Identification of Building Construction Projects in Egypt. Buildings 2023, 13, 1084. [Google Scholar] [CrossRef]
- Abdelalim, A.M. Risks Affecting the Delivery of Construction Projects in Egypt: Identifying, Assessing and Response. In Project Management and BIM for Sustainable Modern Cities; Shehata, M., Rodrigues, F., Eds.; Springer International Publishing: Cham, Switzerland, 2019; pp. 125–154. [Google Scholar] [CrossRef]
- Younis, R.E.A.; Abdelkhalek, H.; Abdelalim, A.M. Project Risk Management During Construction Stage According to International Contract (FIDIC). Int. J. Civ. Struct. Eng. Res. 2023, 10, 76–93. [Google Scholar] [CrossRef]
- Khedr, R.; Abdelalim, A.M. Predictors for the Success and Survival of Construction Firms in Egypt. Int. J. Manag. Commer. Innov. 2021, 9, 192–201. [Google Scholar]
- Khedr, R.; Abdelalim, A.M. The Impact of Strategic Management on Projects Performance of Construction Firms in Egypt. Int. J. Manag. Commer. Innov. 2021, 9, 202–211. [Google Scholar]
- Abd El-Hamid, S.M.; Farag, S.; Abdelalim, A.M. Construction Contracts’ Pricing According to Contractual Provisions and Risk Allocation. Int. J. Civ. Struct. Eng. Res. 2023, 11, 11–38. [Google Scholar] [CrossRef]
- Sherif, A.; Abdelalim, A.M. Delay Analysis Techniques and Claim Assessment in Construction Projects. Int. J. Eng. Manag. Humanit. 2023, 10, 316–325. [Google Scholar] [CrossRef]
- Abd El-Karim, M.S.B.A.; Mosa El Nawawy, O.A.; Abdelalim, A.M. Identification and Assessment of Risk Factors Affecting Construction Projects. HBRC J. 2017, 13, 202–216. [Google Scholar] [CrossRef]
- Abdelalim, A.M.; El Nawawy, O.A.; Bassiony, M.S. Decision Supporting System for Risk Assessment in Construction Projects: AHP-Simulation Based. IPASJ Int. J. Comput. Sci. 2016, 4, 22–36. [Google Scholar] [CrossRef]
- Abdelalim, A.M.; Elbeltagi, E.; Mekky, A.A. Factors Affecting Productivity and Improvement in Building Construction Sites. Int. J. Prod. Qual. Manag. 2019, 27, 464. [Google Scholar] [CrossRef]
Figure 1.
Revit Visualizer plugin (after integration with Autodesk Revit V.2023.1.3).
Figure 1.
Revit Visualizer plugin (after integration with Autodesk Revit V.2023.1.3).
Figure 2.
BLE developed tags, zones’ reader, and the worker’s scanner.
Figure 2.
BLE developed tags, zones’ reader, and the worker’s scanner.
Figure 3.
Modules of Research Framework.
Figure 3.
Modules of Research Framework.
Figure 4.
Module one: Tag–zone reader’s configuration, embedded system, and worker scanner.
Figure 4.
Module one: Tag–zone reader’s configuration, embedded system, and worker scanner.
Figure 5.
Module Two: The Database Generator.
Figure 5.
Module Two: The Database Generator.
Figure 6.
Construction Documentation Using HOLOBUILDER Platform. The left image is captured using 360° cameras. The right side indicates the same scene in the BIM model.
Figure 6.
Construction Documentation Using HOLOBUILDER Platform. The left image is captured using 360° cameras. The right side indicates the same scene in the BIM model.
Figure 7.
Module Three: Construction Documentation and Client Early Warning System.
Figure 7.
Module Three: Construction Documentation and Client Early Warning System.
Figure 8.
Field test plan with the location of the BLE zone.
Figure 8.
Field test plan with the location of the BLE zone.
Figure 9.
BIM model for the case study using Revit file.
Figure 9.
BIM model for the case study using Revit file.
Figure 10.
Type of Parameters for Windows Activity.
Figure 10.
Type of Parameters for Windows Activity.
Figure 11.
Section of the comprehensive Decision Support System Excel spreadsheet.
Figure 11.
Section of the comprehensive Decision Support System Excel spreadsheet.
Figure 12.
Client Early Warning System Output sheet (only for one week).
Figure 12.
Client Early Warning System Output sheet (only for one week).
Figure 13.
Client Early Warning System Main Dashboard.
Figure 13.
Client Early Warning System Main Dashboard.
Figure 14.
Indoor tracking of workers using the BIM technique.
Figure 14.
Indoor tracking of workers using the BIM technique.
Figure 15.
Visualization output based on the developed plugin of the selected activities.
Figure 15.
Visualization output based on the developed plugin of the selected activities.
Figure 16.
Indoor Live tracking for workers using the developed Revit Visualization Tool.
Figure 16.
Indoor Live tracking for workers using the developed Revit Visualization Tool.
Figure 17.
Client Early Warning System Main Dashboard indicates project insights.
Figure 17.
Client Early Warning System Main Dashboard indicates project insights.
Figure 18.
CEWS output sheets; indicates the Duration (Day) vs. Cumulative Productivity (Unit/Day/Worker) for all Activities in the first week.
Figure 18.
CEWS output sheets; indicates the Duration (Day) vs. Cumulative Productivity (Unit/Day/Worker) for all Activities in the first week.
Figure 19.
CEWS output sheets; indicates the status of zone two for ceiling and windows activity for the second week.
Figure 19.
CEWS output sheets; indicates the status of zone two for ceiling and windows activity for the second week.
Figure 20.
The participant’s position and role in the survey.
Figure 20.
The participant’s position and role in the survey.
Figure 21.
The participant’s years of experience.
Figure 21.
The participant’s years of experience.
Figure 22.
The participant’s geographical locations for the executed survey.
Figure 22.
The participant’s geographical locations for the executed survey.
Figure 23.
The participant’s projects sector.
Figure 23.
The participant’s projects sector.
Figure 24.
Participant’s Organization Type.
Figure 24.
Participant’s Organization Type.
Figure 25.
Using BIM in the project.
Figure 25.
Using BIM in the project.
Figure 26.
The used BIM standard for each participant.
Figure 26.
The used BIM standard for each participant.
Figure 27.
Participant opinions regarding the use of BIM to collect and present the worker behavior and percentage of completion.
Figure 27.
Participant opinions regarding the use of BIM to collect and present the worker behavior and percentage of completion.
Figure 28.
Typical values (Million US $) of the project.
Figure 28.
Typical values (Million US $) of the project.
Figure 29.
Typical duration of the current project(s).
Figure 29.
Typical duration of the current project(s).
Figure 30.
Maximum daily number of workers at the rush hour required to carry out the work.
Figure 30.
Maximum daily number of workers at the rush hour required to carry out the work.
Figure 31.
Worker productivity can participate in project delay.
Figure 31.
Worker productivity can participate in project delay.
Figure 32.
The current worker’s tracking tool.
Figure 32.
The current worker’s tracking tool.
Figure 33.
Track worker’s migration method in a construction project.
Figure 33.
Track worker’s migration method in a construction project.
Figure 34.
The tracking tool to maintain social distance between workers.
Figure 34.
The tracking tool to maintain social distance between workers.
Figure 35.
(A–J) Participants’ Evaluation of the tracking hybrid proposed approach.
Figure 35.
(A–J) Participants’ Evaluation of the tracking hybrid proposed approach.
Table 1.
Data Mapping and interoperability between different software.
Table 1.
Data Mapping and interoperability between different software.
| Decision Support System Parameters | Unit | Data Source | Integrated with DSS through |
|---|
| Activity zone names | Text | Autodesk Revit V.2023 | API and Excel.V.2020 |
| Activity Code | Text | Autodesk Revit | API and Excel |
| Activity Description | Text | Autodesk Revit | API and Excel |
| Avg. planned number of workers/days | Worker/day | DSS Equation | Equation |
| Planned productivity per worker per activity | M2/day
or Number/day | Primavera | Excel |
| Planned productivity per worker per crew | M2/day or Number/days | DSS Equation | Equation |
| Planned duration | days | Primavera | Excel |
| Actual zone area | M2 | Autodesk Revit | API and Excel |
| Maximum number of workers (Social distance) | Number | Ministry of health regulation | Input data |
| Planned quantities | M2 or Number | Autodesk Revit | API and Excel |
| Planned Schedule | days | Primavera | Excel sheet integration |
| Actual working hours | Hour | BLE Devices | BLE and Excel |
| Actual Quantities | M2 or Number | HOLOBUILDER | HOLOBUILDER and Excel |
| Actual productivity | M2/day or Number/days | DSS Equation | Equation |
Table 2.
CEWS output sheets; indicates the embedded system daily attendance sheet from 8.00 a.m. to 10:15 p.m.
Table 2.
CEWS output sheets; indicates the embedded system daily attendance sheet from 8.00 a.m. to 10:15 p.m.
| Date | Time | Zone Name | Ceiling Worker ID # 01 | Ceiling Worker ID # 02 | Window Worker ID # 01 | Window Worker ID # 02 |
|---|
| 30 August 2020 | 8:00 | Zone 1 | Found | Not found | Not found | Found |
| 30 August 2020 | 8:15 | Zone 2 | Found | Not found | Not found | Found |
| 30 August 2020 | 8:30 | Zone 3 | Found | Not found | Not found | Found |
| 30 August 2020 | 8:45 | Zone 1 | Found | Not found | Not found | Found |
| 30 August 2020 | 9:00 | Zone 2 | Found | Not found | Not found | Found |
| 30 August 2020 | 9:15 | Zone 3 | Found | Not found | Not found | Found |
| 30 August 2020 | 9:30 | Room 1 | Found | Not found | Not found | Found |
| 30 August 2020 | 9:45 | Room 2 | Found | Not found | Not found | Found |
| 30 August 2020 | 10:00 | Room 1 | Found | Not found | Not found | Found |
| 30 August 2020 | 10:15 | Room 2 | Found | Not found | Not found | Found |
| Disclaimer/Publisher’s Note: The statements, opinions and data contained in all publications are solely those of the individual author(s) and contributor(s) and not of MDPI and/or the editor(s). MDPI and/or the editor(s) disclaim responsibility for any injury to people or property resulting from any ideas, methods, instructions or products referred to in the content. |
© 2024 by the authors. Licensee MDPI, Basel, Switzerland. This article is an open access article distributed under the terms and conditions of the Creative Commons Attribution (CC BY) license (https://creativecommons.org/licenses/by/4.0/).

 ,
, 


