Article

Study of Wind Load Influencing Factors of Flexibly Supported Photovoltaic Panels

School of Shipbuilding and Ocean Engineering, Jiangsu University of Science and Technology, Zhenjiang 212100, China
*
Author to whom correspondence should be addressed.
Buildings 2024, 14(6), 1677; https://doi.org/10.3390/buildings14061677
Submission received: 19 May 2024 / Revised: 30 May 2024 / Accepted: 3 June 2024 / Published: 5 June 2024
(This article belongs to the Special Issue Wind Load Effects on High-Rise and Long-Span Structures)

Abstract

Flexible photovoltaic (PV) support structures are limited by the structural system, their tilt angle is generally small, and the effect of various factors on the wind load of flexibly supported PV panels remains unclear. In order to investigate the shape coefficients of the flexibly supported PV panel arrays, the grid-independent validation is carried out first, and then the case study validation is carried out to ensure the accuracy of the method in this paper. The CFD numerical simulation method is used to obtain the wind load variation of the PV panel array with different tilt angles, different spacing ratios, different wind angles, different heights above ground, different regions, and mountainous conditions. The distribution of wind pressure coefficients on the surface of PV panels with different inclination angles at different spacing ratios was investigated. The results show that the wind load shape coefficients with the increase in tilt angle and height above ground are basically a linear growth; the maximum value of PV shape coefficients appears in the wind angle at 30°, and 150° near the different tilt angles of the flexible PV array group shape coefficients distribution law is inconsistent. Different tilt angles of PV modules with the change rule of the spacing ratio of the wind load are inconsistent and have a greater impact on the wind load, so the PV panel array in all wind direction angles under the regional shape coefficients has a recommended value. The proposed value of the regional shape coefficients at all wind angles and the wind load calculation formula introducing height coefficients and spacing ratio coefficients are given.

1. Introduction

The PV power generation system converts solar radiation energy into electrical energy by utilizing the PV effect of semiconductor materials. To investigate wind loads on solar PV panels, researchers have conducted experiments and numerical simulations [1,2,3,4,5,6]. Over two-thirds of China has more than 2000 h of sunshine per year [7]. China has made significant efforts to achieve peak carbon and carbon neutrality. By 2020, the cumulative installed capacity of PV power plants in China will reach 204.3 million kW [8].
Conventional PV bracket design is typically calculated based on specifications using a uniform shape coefficient. However, this shape coefficient is designed based on the most unfavorable wind load value, resulting in the unnecessary waste of bracket materials and increased project costs. A flexible stent is a support system made up of flexible cables (steel wire rope or steel strand), steel columns, steel beams, and diagonal cables or steel inclined columns. Its characteristic large span, flexibility, and light weight mean that wind load is the primary consideration in stent design. Currently, research on wind load for solar PV systems, both domestic and foreign, primarily focuses on traditional fixed brackets. There is limited research on the wind load of flexibly supported PV modules, and the wind load distribution law of flexible PV array groups is still incomplete. Current research on the wind load of PV modules primarily focuses on the impact of various mounting parameters on wind load and the wind load values of PV modules in different application scenarios, such as arrays and roofs.
According to the available studies, PV panels can be classified according to their mounting location, such as roof-mounted [9], or, in another classification, form a separate cluster of PV arrays [10,11]. For the stand-alone case, localised pressures are most affected by oblique winds, while the overall wind pressure generated is most affected by winds along the wind direction [12]. Hatem Alrawashdeh et al. [13] studied the wind loads on eight PV panels on a roof parallel to the roof. Dai, S.F et al. [14] studied the effect of building shape and size on wind loads on tilted PV panels on roofs; other studies have investigated the effect of tilt angle, height from the roof, and size of the PV panels on wind loads for PV panels on the roof [15,16]. Tarek Ghazal et al. [17,18] conducted wind tunnel tests with different angles of attack on three common Canadian storm shelter shapes. The maximum design forces and moment coefficients resulting from all wind angles were, thus, determined.
Since long and thin rotating shafts are used to build single-axis PV trackers, these structures are very sensitive to wind loads, and wind damage often occurs under strong wind [19]. Eva Martínez-García et al. [20] showed the influence of inertia and aspect ratio on the onset of aerodynamic instability in single-axis solar trackers is analyzed, combining experimental measurements and analytical models. U. Winkelmann et al. [21] conducted wind tunnel tests on single-row curved modules and curved module arrays. The wind load on a single row of PV modules exceeds that of a group of PV arrays. The maximum wind pressure occurs in the first row, while the maximum wind suction occurs in the second row. Browne et al. [22] investigated the average and pulsating winds to which PV modules are subjected through wind tunnel tests. The results indicate that the peak torque at high wind speeds exceeded the torque values predicted from the pressure data. A novel wind load assessment method for such PV arrays was proposed. The spacing between PV panels has a significant effect on wind loads, whereas the height of PV panels above the ground has a small effect on wind loads, and increasing the spacing between PV modules significantly reduces the blocking effect of the front row of PV panels on the rear row of PV panels [23]. Onur Yemenici et al.’s [24] results show that the overturning moments are greatest at wind angles of 30° and 150°, while the uplift and drag are greatest at wind angles of 180° and 0°.
Unlike the large tilt angles of ground-fixed PV supports, flexible PV supports are limited by their structural systems, and their tilt angles are generally smaller. There are certain gaps between PV components, leading to three-dimensional flow effects. Therefore, the effects of various situations on the wind loads of flexible PV components are still unclear. Since PV components themselves are rigid, and this paper only studies their shape coefficients, a rigid model is adopted. Furthermore, the impact of the support structure on the wind-loaded shape coefficient is not considered. Considering the characteristics of flexible support PV components mentioned above, this paper uses CFD numerical simulation methods to simulate PV array groups under different influencing factors.

2. Materials and Methods

2.1. Analysis Method
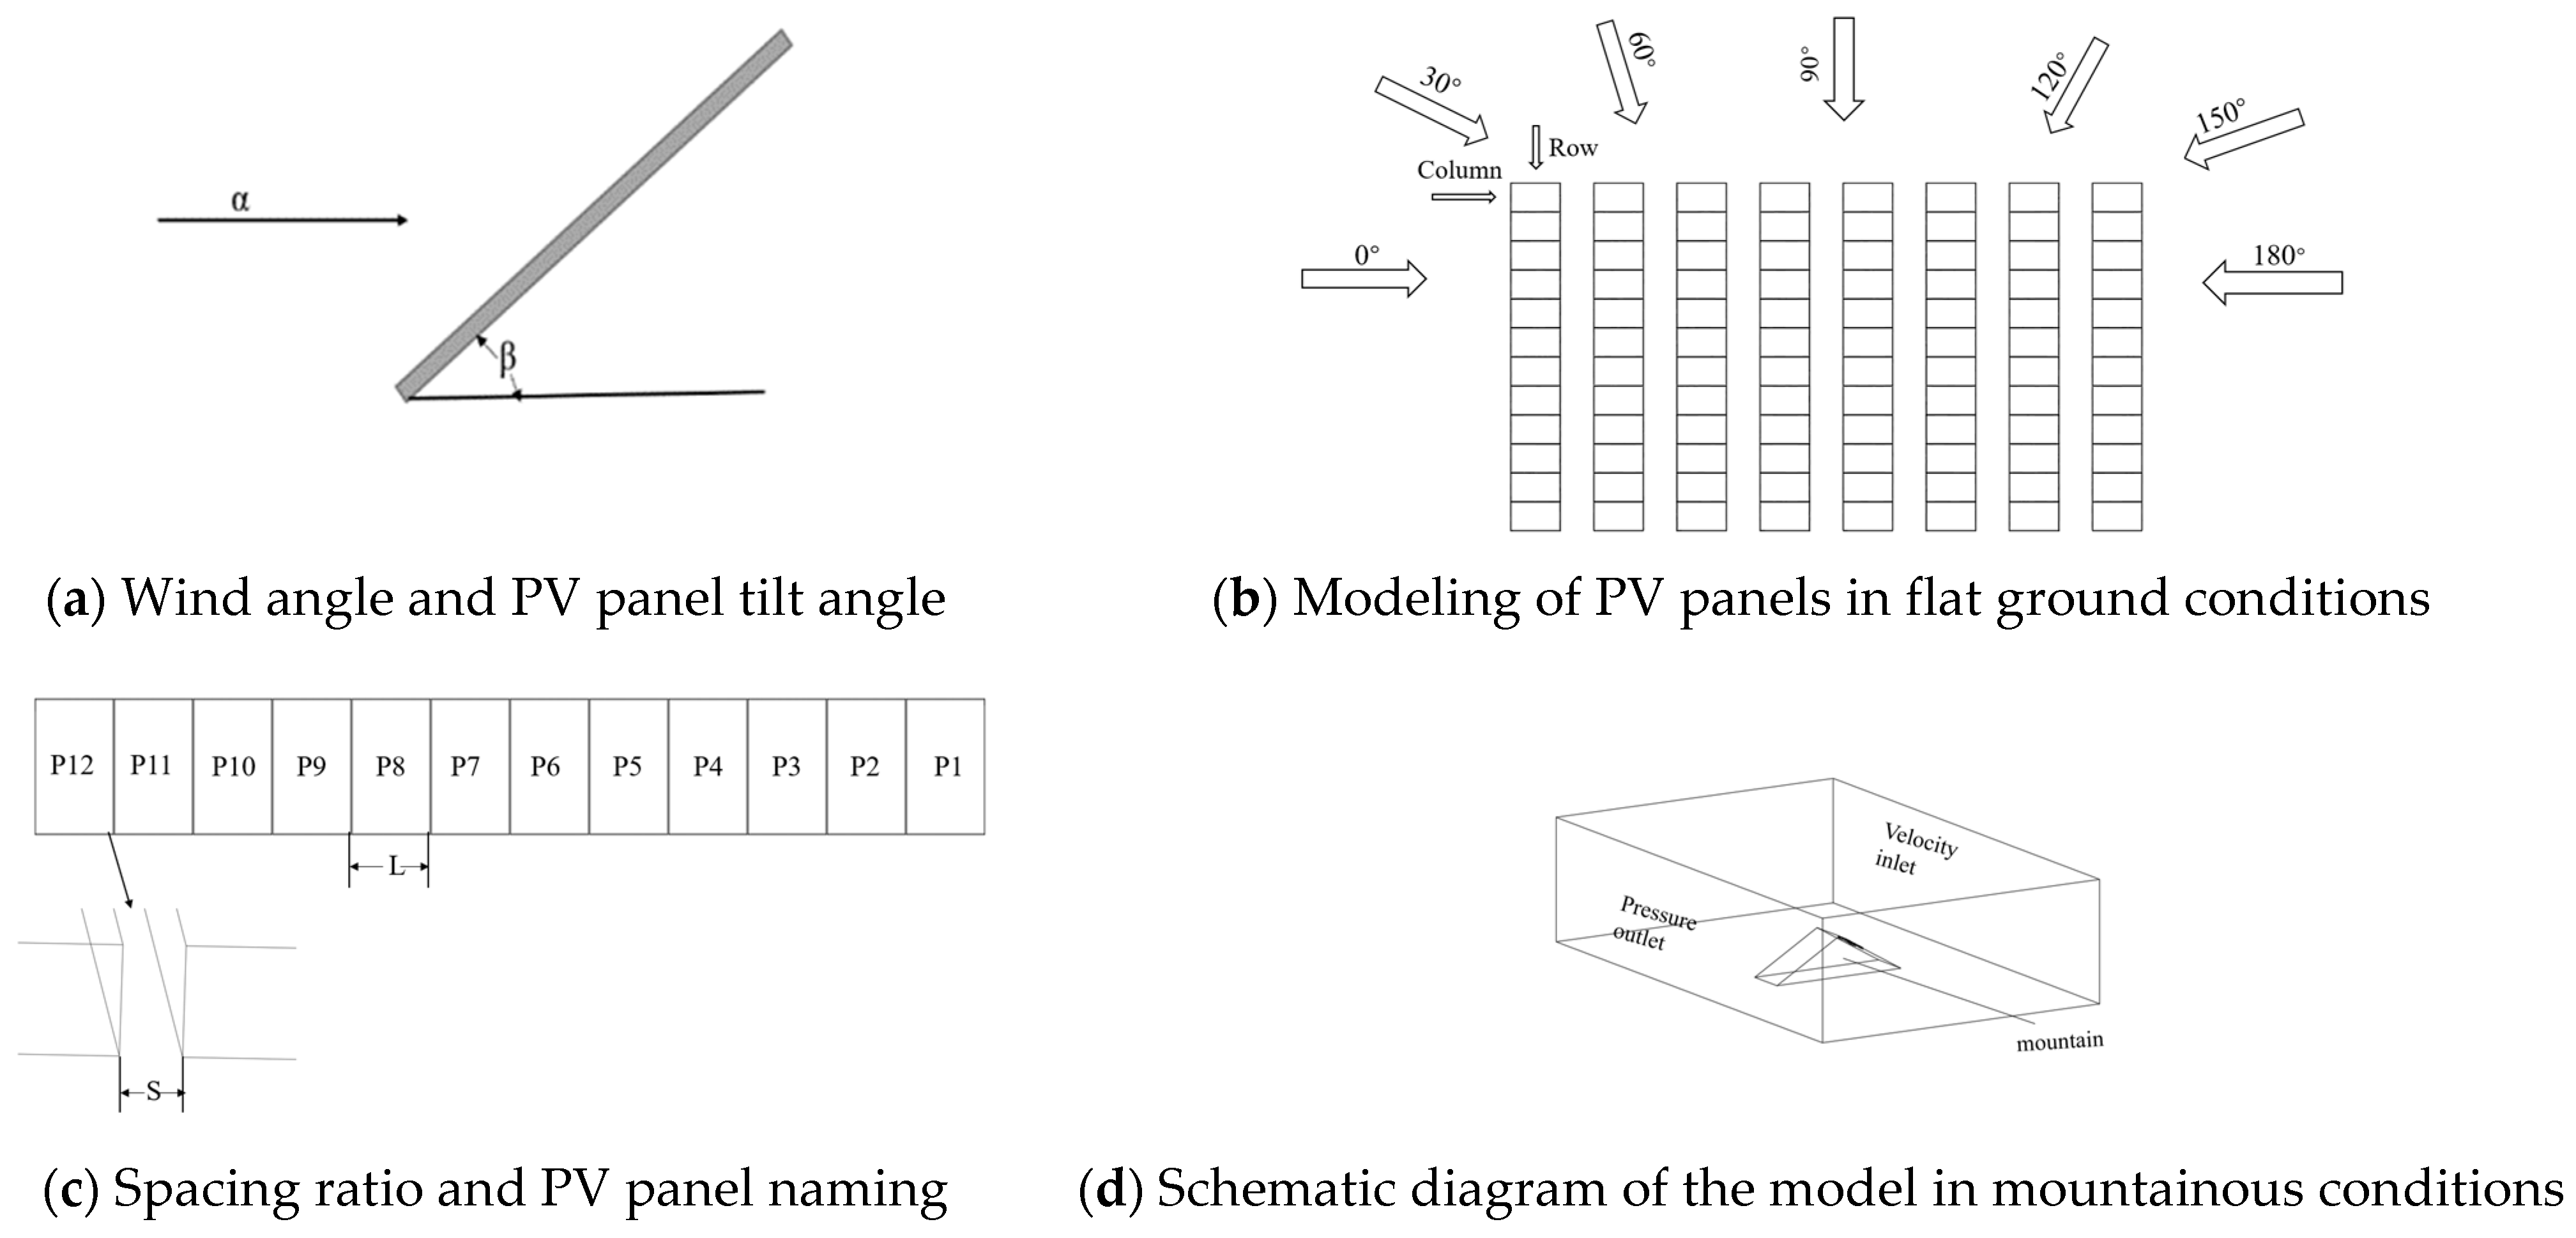
The core of numerical wind tunnel lies in Computational Fluid Dynamics, solving the governing equations that describe fluid flow in space to obtain relevant properties of the flow field. In this study, PV panel array cluster modeling in CAD. The mesh was generated in ICEM, and the analysis and calculation were performed in FLUENT. The Standard k-ε turbulent model [25] and Reynolds-averaged method built into FLUENT were used to calculate and analyze the shape coefficient on the structure surface.

2.2. Model Overview

In this study, the flexible support PV panel arrays under flat and mountainous conditions consist of 8 rows and 12 columns, totaling 96 PV panels. The dimensions of each PV panel are 1200 mm × 2400 mm × 360 mm, with a longitudinal spacing between panels of 1100 mm and a lateral spacing of 20 mm. The total length of the array group is 26,405 mm, and the total width is 17,020 mm. In the flat condition, the height of the PV panels above the ground is 3100 mm. In the mountainous condition, the PV panels are parallel to the slope surface, with a height above the slope surface of 1930 mm. For the first type of PV panel array group in flat conditions, the computational domain size is 400 m × 240 m × 18 m, with a maximum blockage rate of approximately 0.89%. For the second type of flexible PV panel array group in mountainous conditions, the computational domain size is 380 m × 600 m × 150 m, and its maximum blockage rate is approximately 2.74%. The computational domain sizes for both conditions satisfy the requirement of blockage rate <3%. The mountainous condition, wind direction angle, PV panel tilt angle, spacing ratio, and PV panel positions are shown in Figure 1 below.
(1) Estimate the wall friction coefficients. The equation can be expressed as follows:
C f = 0.058 R e 0.2
(2) Calculate wall shear stress. The equation can be expressed as follows:
τ w = 1 2 C f ρ U 2
(3) The estimated velocity of wall shear stress, . The equation can be expressed as follows:
U τ = τ W ρ
(4) Calculate the height of the first layer of the grid with the following formula:
y = y + μ U τ ρ
Calculation y = 1.8 × 10 3   m gives the flat ground conditions. y = 1.4 × 10 3   m gives the mountainous conditions. The near-wall region is divided into a five-layer grid along the direction of the PV panel surface, with a transition ratio of 1.0:1.2.

2.3. Boundary Conditions and Calculation Methods

The current national standard for the structural loading of buildings (GB5009-2012) [26] divides sites into four ground roughness categories labeled A, B, C, and D. The average wind profile is determined using an exponential expression. For the flatland examined in this study, as well as the cluster of flexible PV arrays in mountainous conditions, category B with α = 0.15 is suitable. The distribution of wind speed along the vertical height is then calculated.
v z = v 10 z 10 α
where α represents the ground roughness index.
Inlet boundary conditions: The inlet is the velocity inlet, and the inlet boundary uses the exponential formula of the wind profile. Programming is performed with the help of FLUENT’s UDF (User-defined functions) implementation. In the setting of inlet turbulence intensity, select the method of turbulence intensity and hydraulic diameter. The selection of turbulence intensity is based on the empirical formula:
I = u u ¯ = 0.16 ( R e D H ) 1 8
By the Reynolds number formula:
R e = ρ v d μ
where ρ, ν, μ represent the flow rate, density, and viscosity coefficients of the fluid, respectively, with d as the characteristic length. The calculation yields a result of I = 2.68% in this study.
The length scale of turbulence is determined by
l = 0.07 L
where L represents the hydraulic diameter of the pipe and l represents the length scale of turbulence. Calculation gives l 1 = 2.34   m for flat ground conditions. l 2 = 16.8   m in mountainous conditions. When using the k-ε model for calculation in FLUENT, it is necessary to provide estimates of the turbulent kinetic energy k and turbulent dissipation rate ε on the inlet boundary. The calculation formula is as follows:
k = 3 2 ( ν I ) 2 ε = C μ 4 3 k 3 2 l
where ≈0.09. Calculation gives ε 1 = 6.12 × 10 4 ( m 2 / s 3 ) , k 1 = 0.108 ( m 2 / s 2 ) for flat ground condition. It also gives ε 2 = 8.52 × 10 5 ( m 2 / s 3 ) , k 2 = 0.0655 ( m 2 / s 2 ) in mountainous conditions.
According to the commonly used methods in domestic and foreign wind engineering at present, we define the wind pressure coefficient and the shape coefficient as
C p i = p u i t p d i t 0.5 ρ U 2 C p = i = 1 n C p i t A i A
In the equation, Cpi(t) is wind pressure coefficient at monitoring point i; pui(t) and pdi(t) are the wind pressures on the upper and lower surfaces of monitoring point i, respectively; Ai is area represented by monitoring point i; Cp is average wind pressure coefficient of PV panels. The wind pressure coefficient obtained by numerical simulation is divided by the wind pressure height change coefficient to obtain the wind load shape coefficient.

2.4. Parameter Settings

The simulation utilises the k-ε model and solves the coupled pressure–velocity equations through the couple algorithm. Second Order Upwind is applied for momentum, turbulent kinetic energy, and turbulent dissipation rate. The control equations’ residual margin is set at 10−3, and the computational step size is 1000. The average wind pressure on the PV array cluster surface remains fairly constant during monitoring.
As the PV panel tilt angle is symmetrical with the tilt angle from 0° to 90° when the PV panel tilt angle is from 90° to 180°, wind load can only be investigated for PV panel tilt angles less than 90°. This will allow for the wind load to be obtained from the symmetric relationship for all PV panels’ tilted angles ranging from 0° to 180°. At latitudes of 37.6°, 32°, and 21.2°, the tilt angles for optimal power generation of PV panels are 35°, 25°, and 15°, respectively, within the tilt angle range of 0° to 90°. Due to deviation from the maximum power generation angle, power generation can be lost by up to 40% [27]. Therefore, this paper considers three cases for PV panel tilt angles, 0°, 10°, and 30°, after comprehensive analysis of actual conditions and calculations.

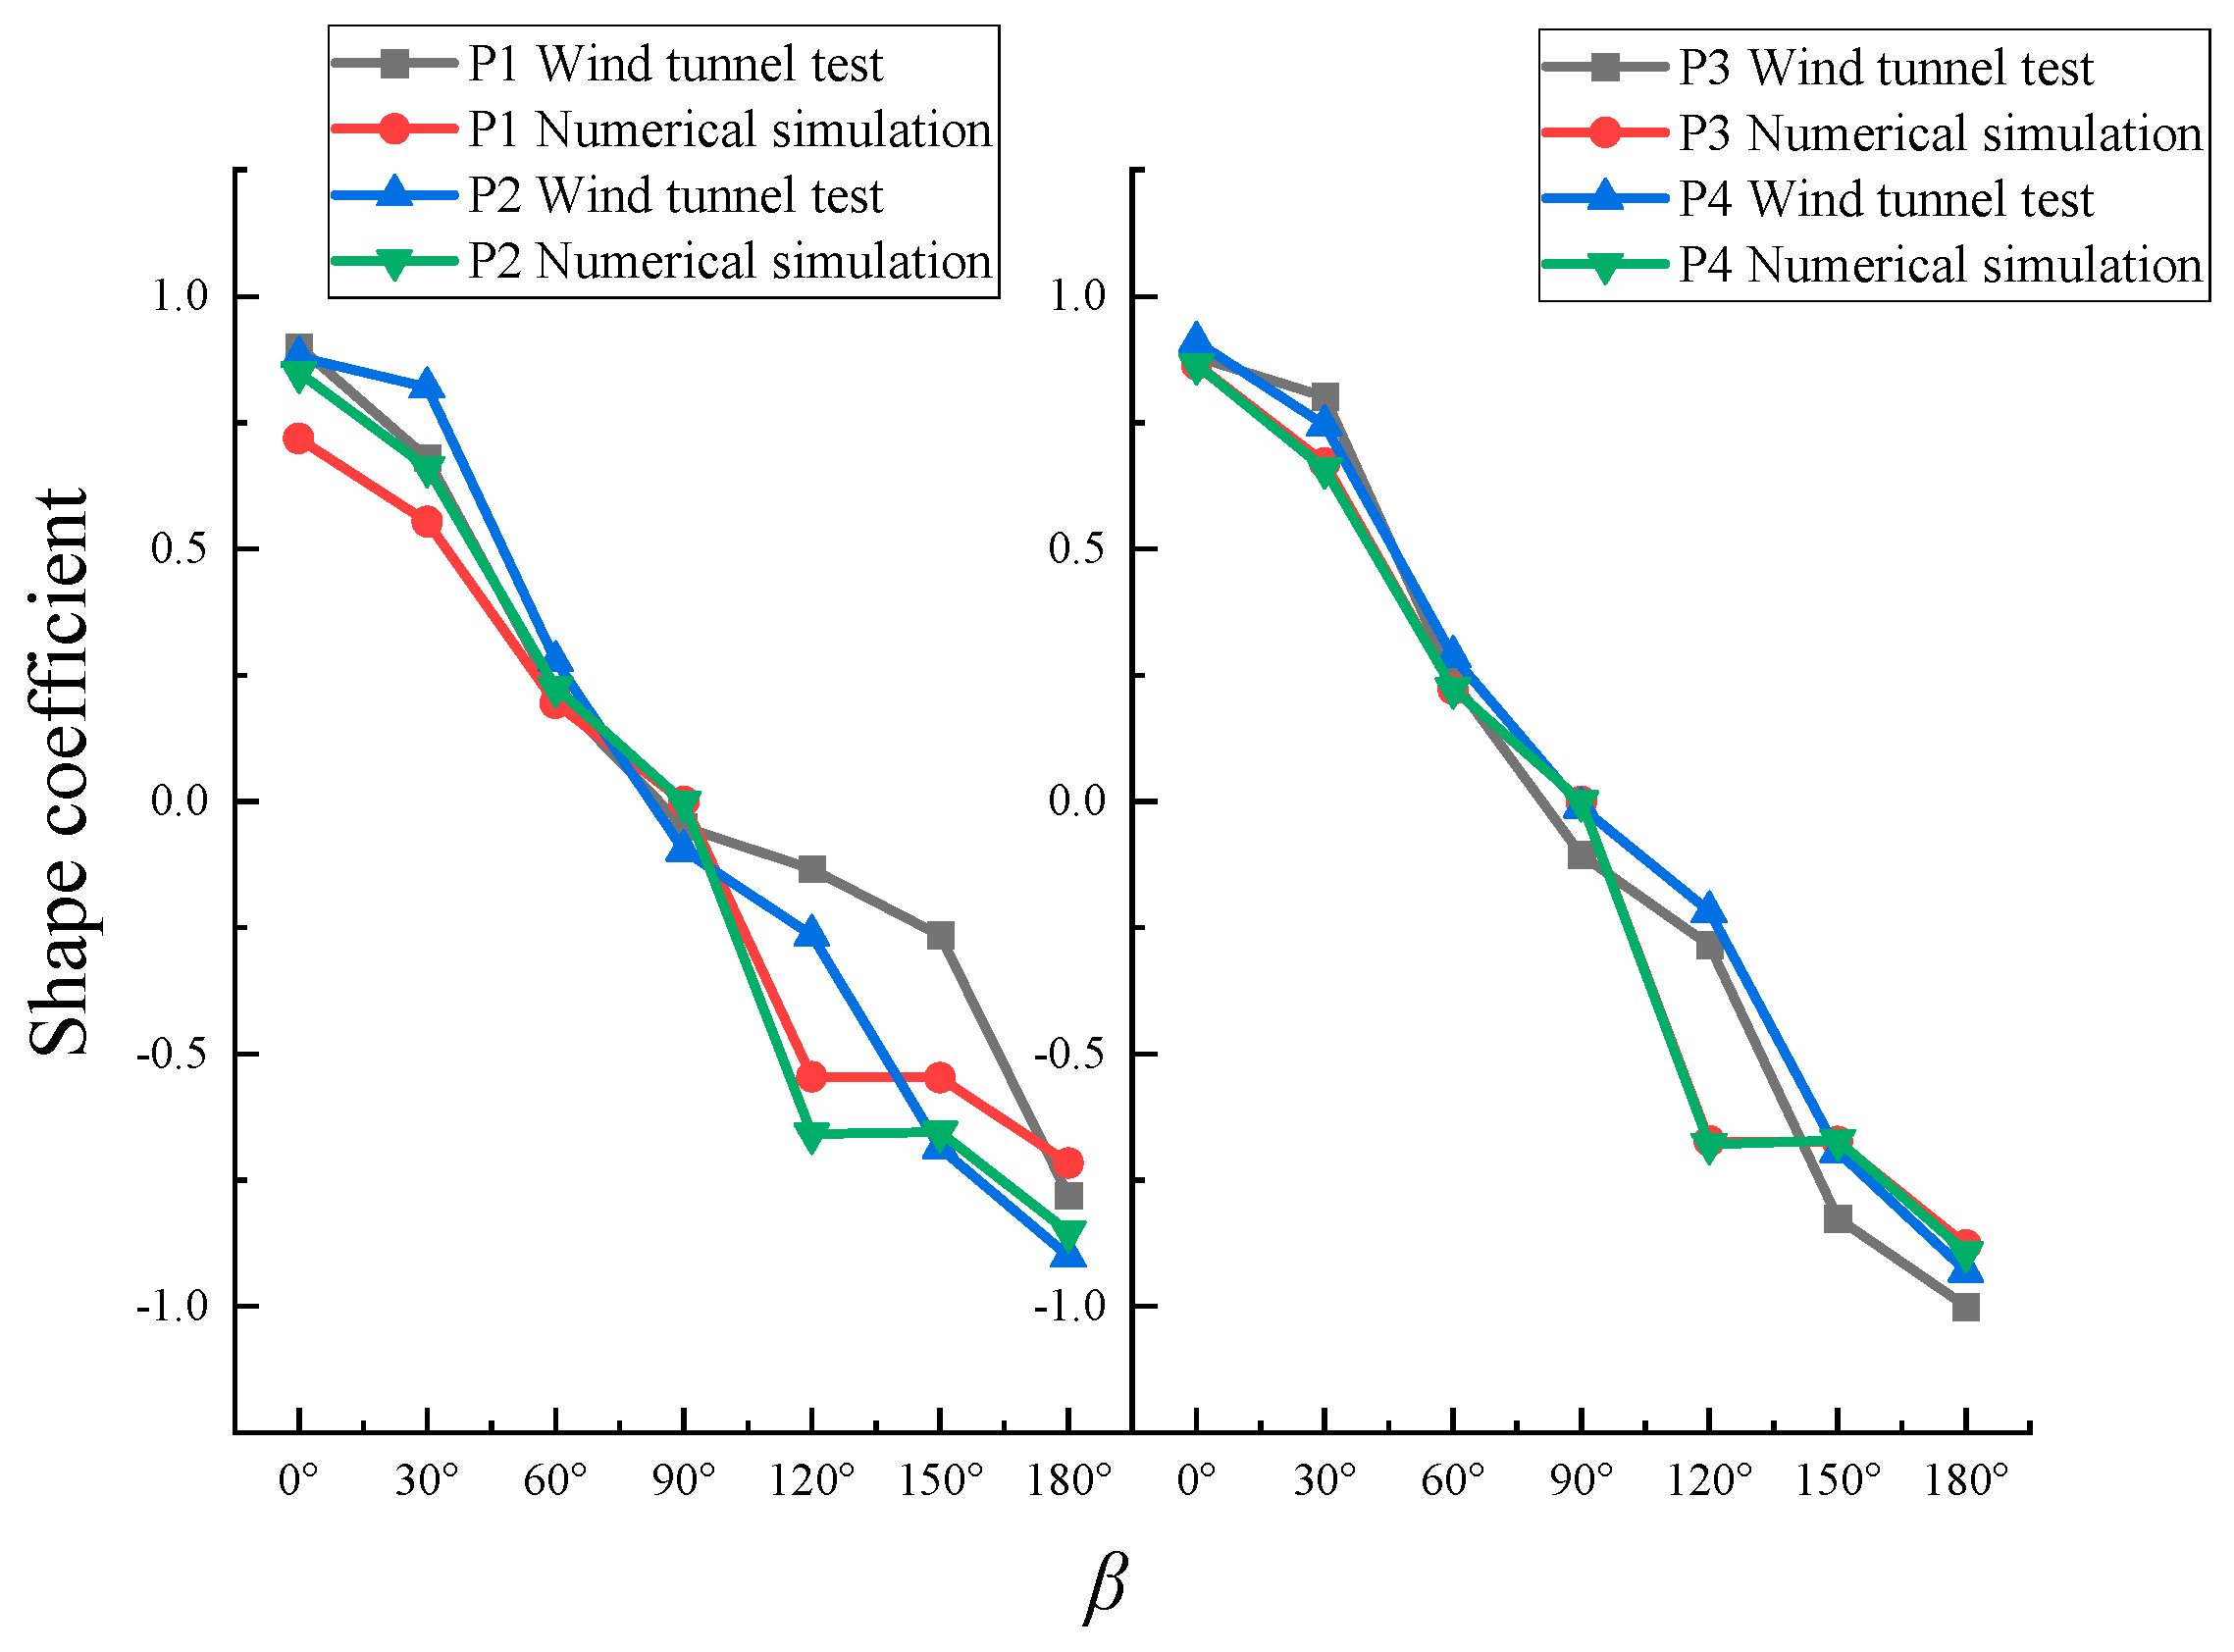
2.5. Verification of Mesh-Independence and Numerical Wind Tunnel Case Validation

In finite element simulation, the choice of mesh size can significantly affect the shape coefficients of flexible PV mounts, resulting in substantial simulation errors. To reduce such errors, independent analyses were conducted using mesh sizes of 0.42 million, 0.86 million, 1.7 million, 3.4 million, and 6.6 million, respectively, to assess the influence of mesh size on the shape coefficients. For the purpose of comparison, we have chosen the shape coefficients of the first row of P1-P12 PV panels from the flexible PV array cluster. This is displayed in Figure 2 to ensure clear understanding and logical progression of information.
Taking the number of 6.6 million grids as the standard, the difference between the shape coefficient of 3.4 million, 1.7 million, and 0.86 million grid numbers and the shape coefficient of 6.6 million grid numbers accounted for 0.12%, 3.3%, 5.41%, and 15.4% of the shape coefficient of the number of 6.6 million grids, respectively. In order to optimize computational efficiency while ensuring accuracy, the 3.4 million meshes are selected for numerical simulation. To confirm the precision of the numerical wind tunnel simulation method proposed in this paper, we conduct a simulation to verify results reported in the wind tunnel test described in the literature [28] (Figure 3).
As shown in Figure 3, upon comparison with the wind tunnel test, the results show that the most significant discrepancy is in relation to the wind angle of the P1 PV plate, which is at 150°. However, despite an overall disparity of approximately 10% with the wind tunnel test, the graphs evince substantial similarity, indicating that the numerical simulation method described in this paper more precisely simulates the wind load shape coefficients.

3. Numerical Wind Tunnel Simulation Results Analysis

The wind load shape coefficients are determined by dividing the wind pressure coefficients acquired through numerical simulation by the wind pressure height change coefficients. For flat land conditions discussed in this paper, the Code for Structural Load of Buildings (GB5009-2012) [26] specifies that the height coefficient for class B landforms below 5 m is 1. For the mountainous conditions discussed in this paper, the average height coefficient of Class B landforms below 40 m and above 30 m is 1.455. Therefore, the height coefficient of Class B landform is 1.455 for the mountainous conditions discussed in this paper, which represents the average value of the two.

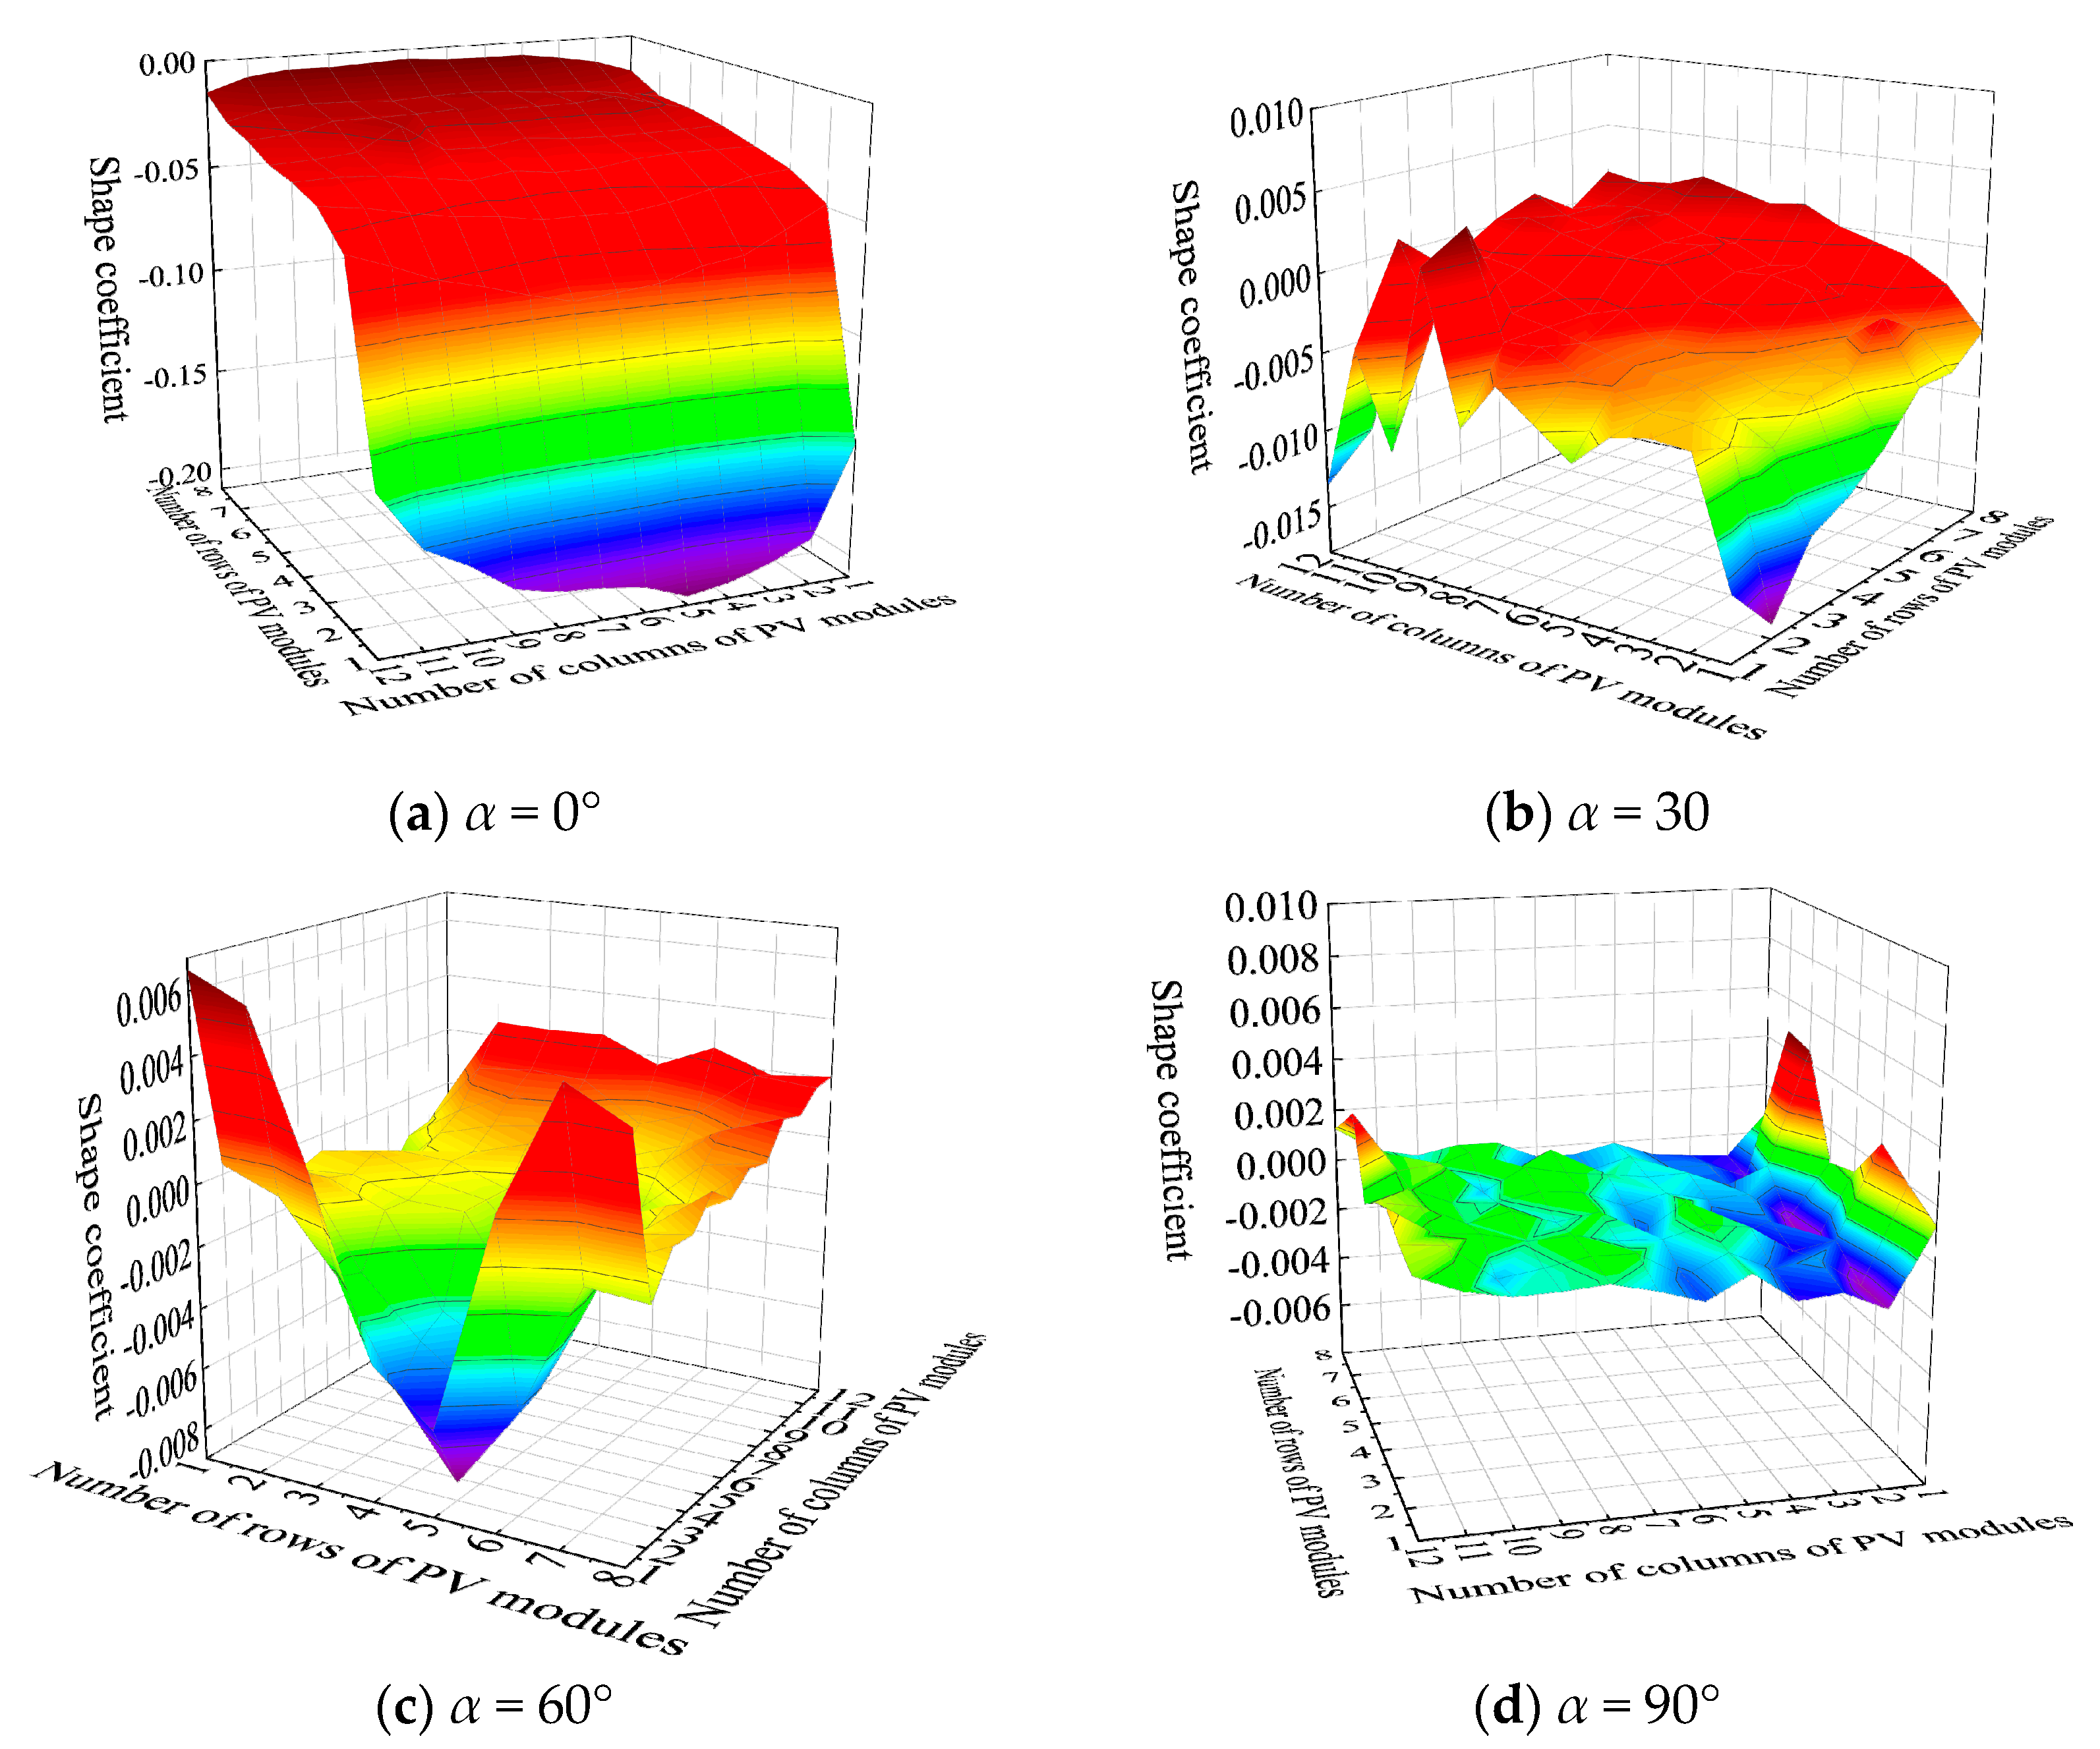
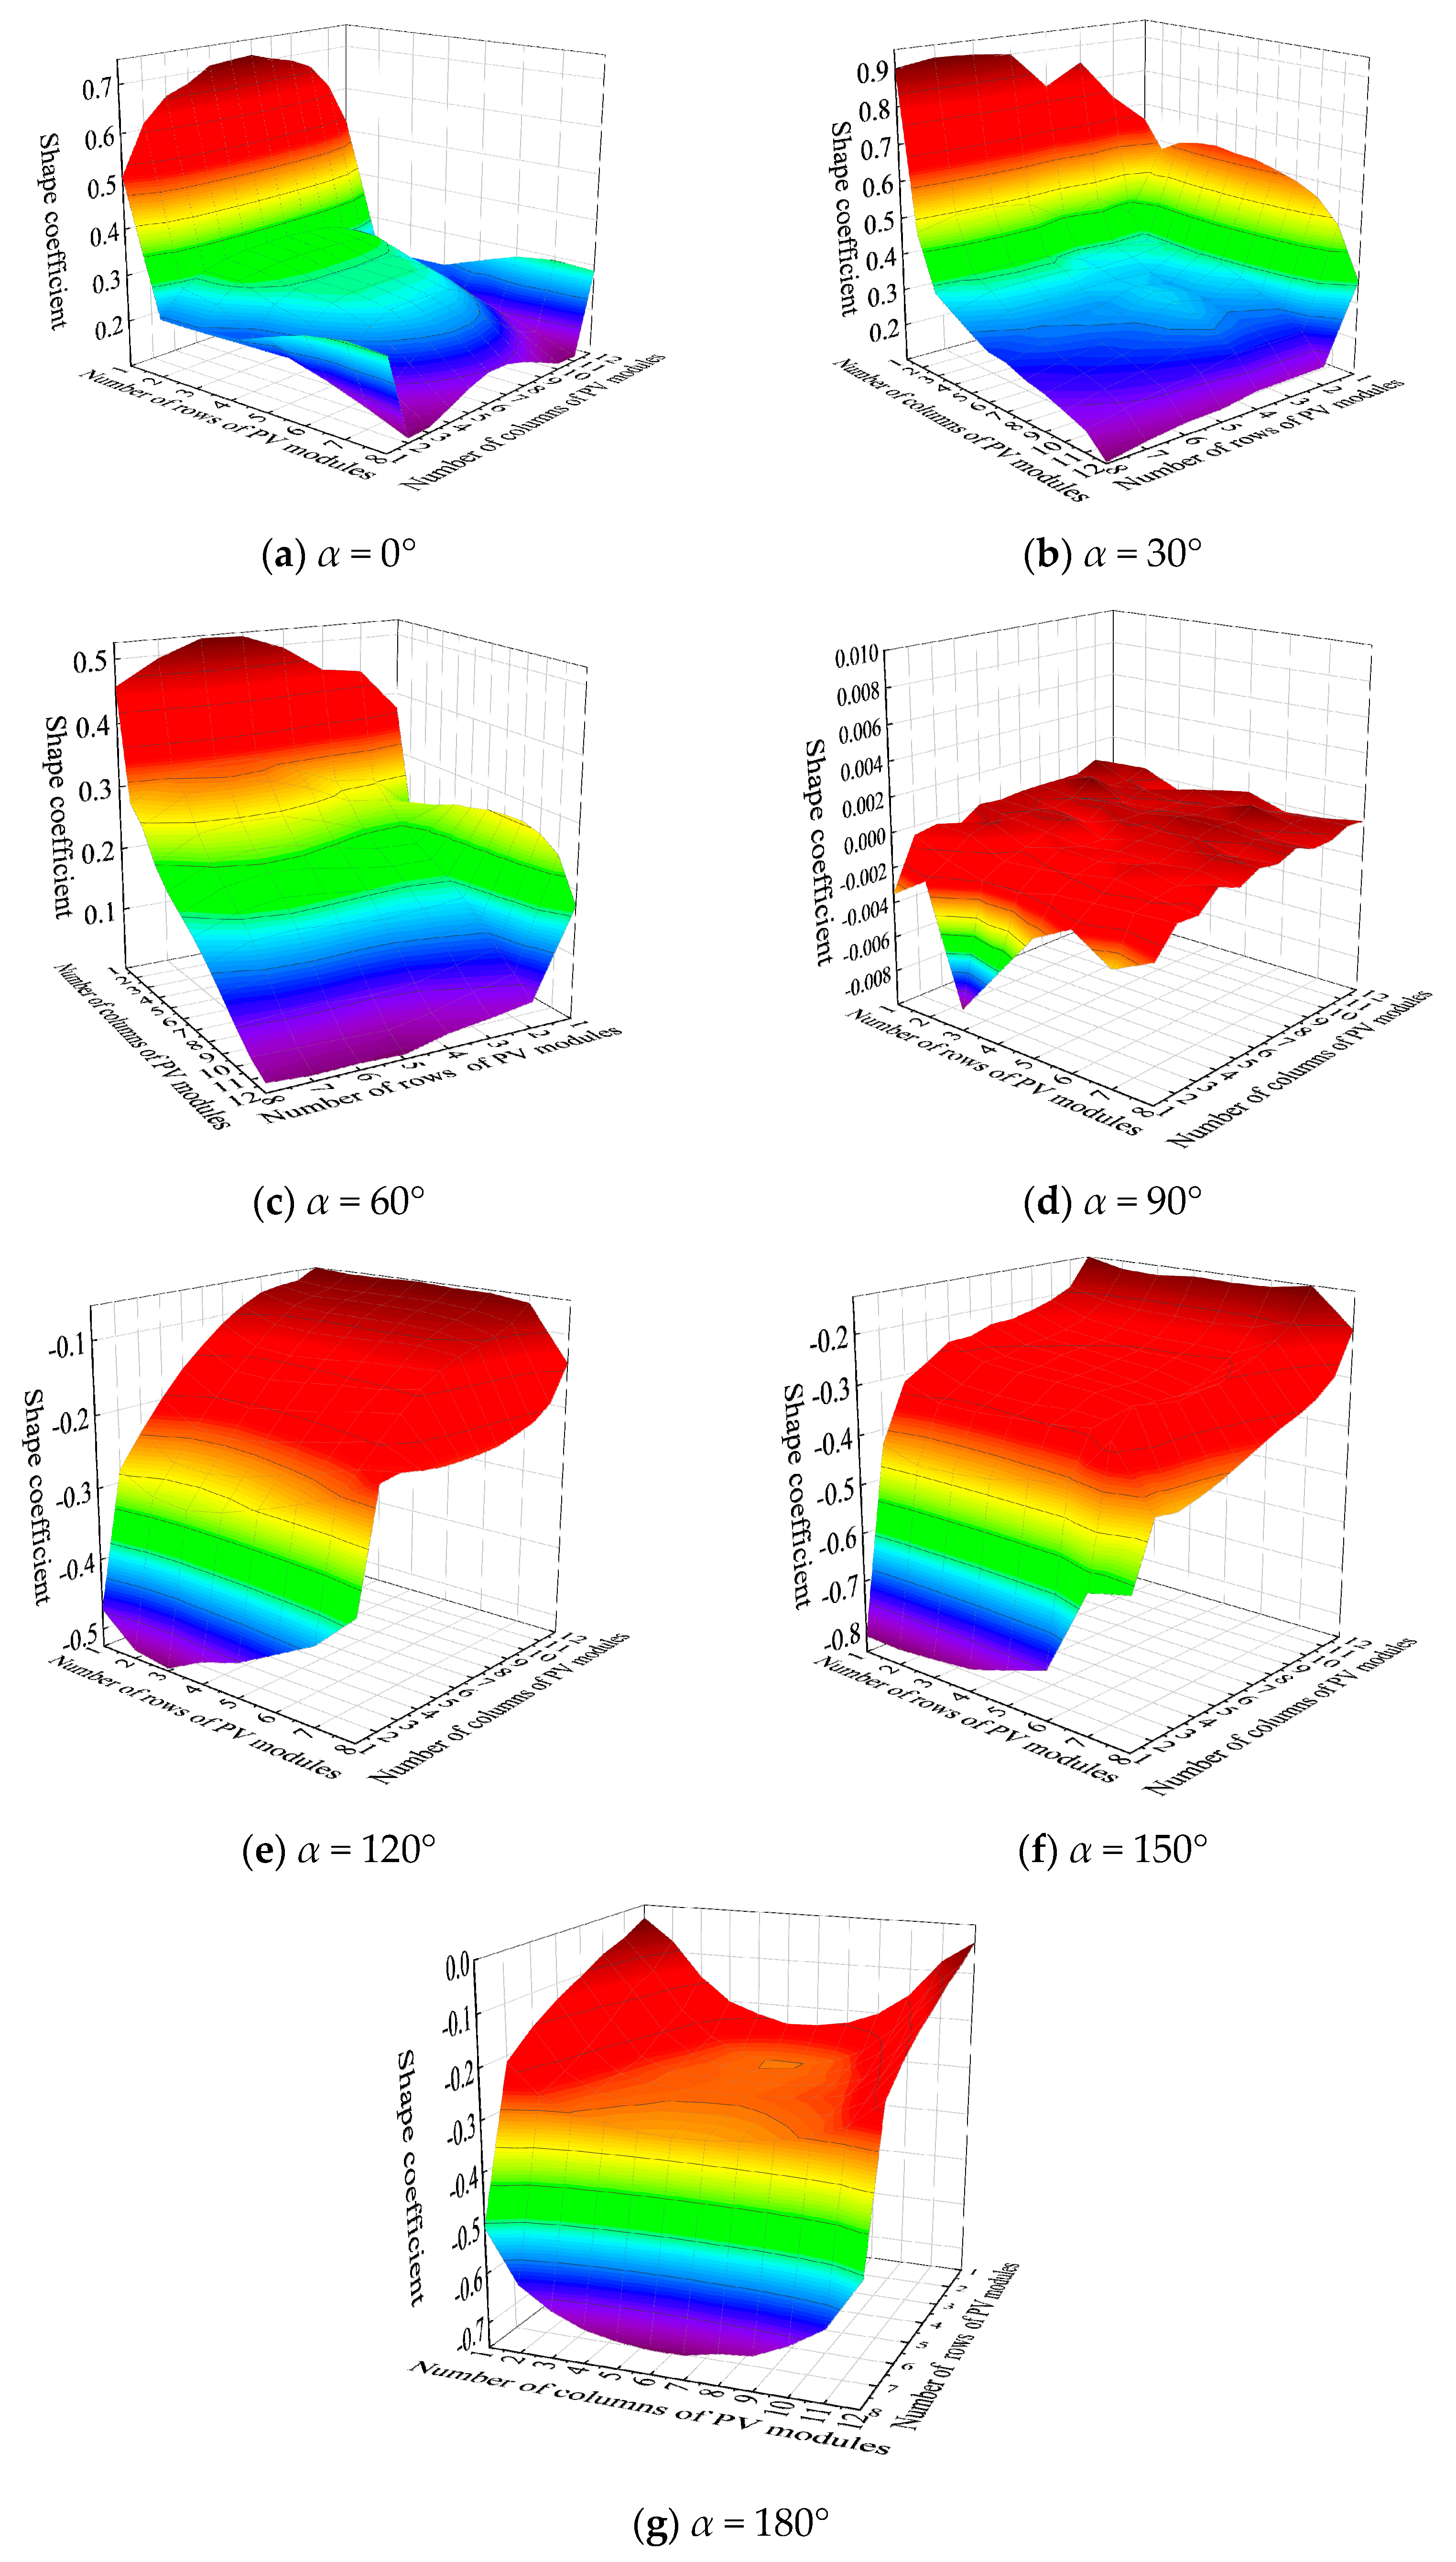
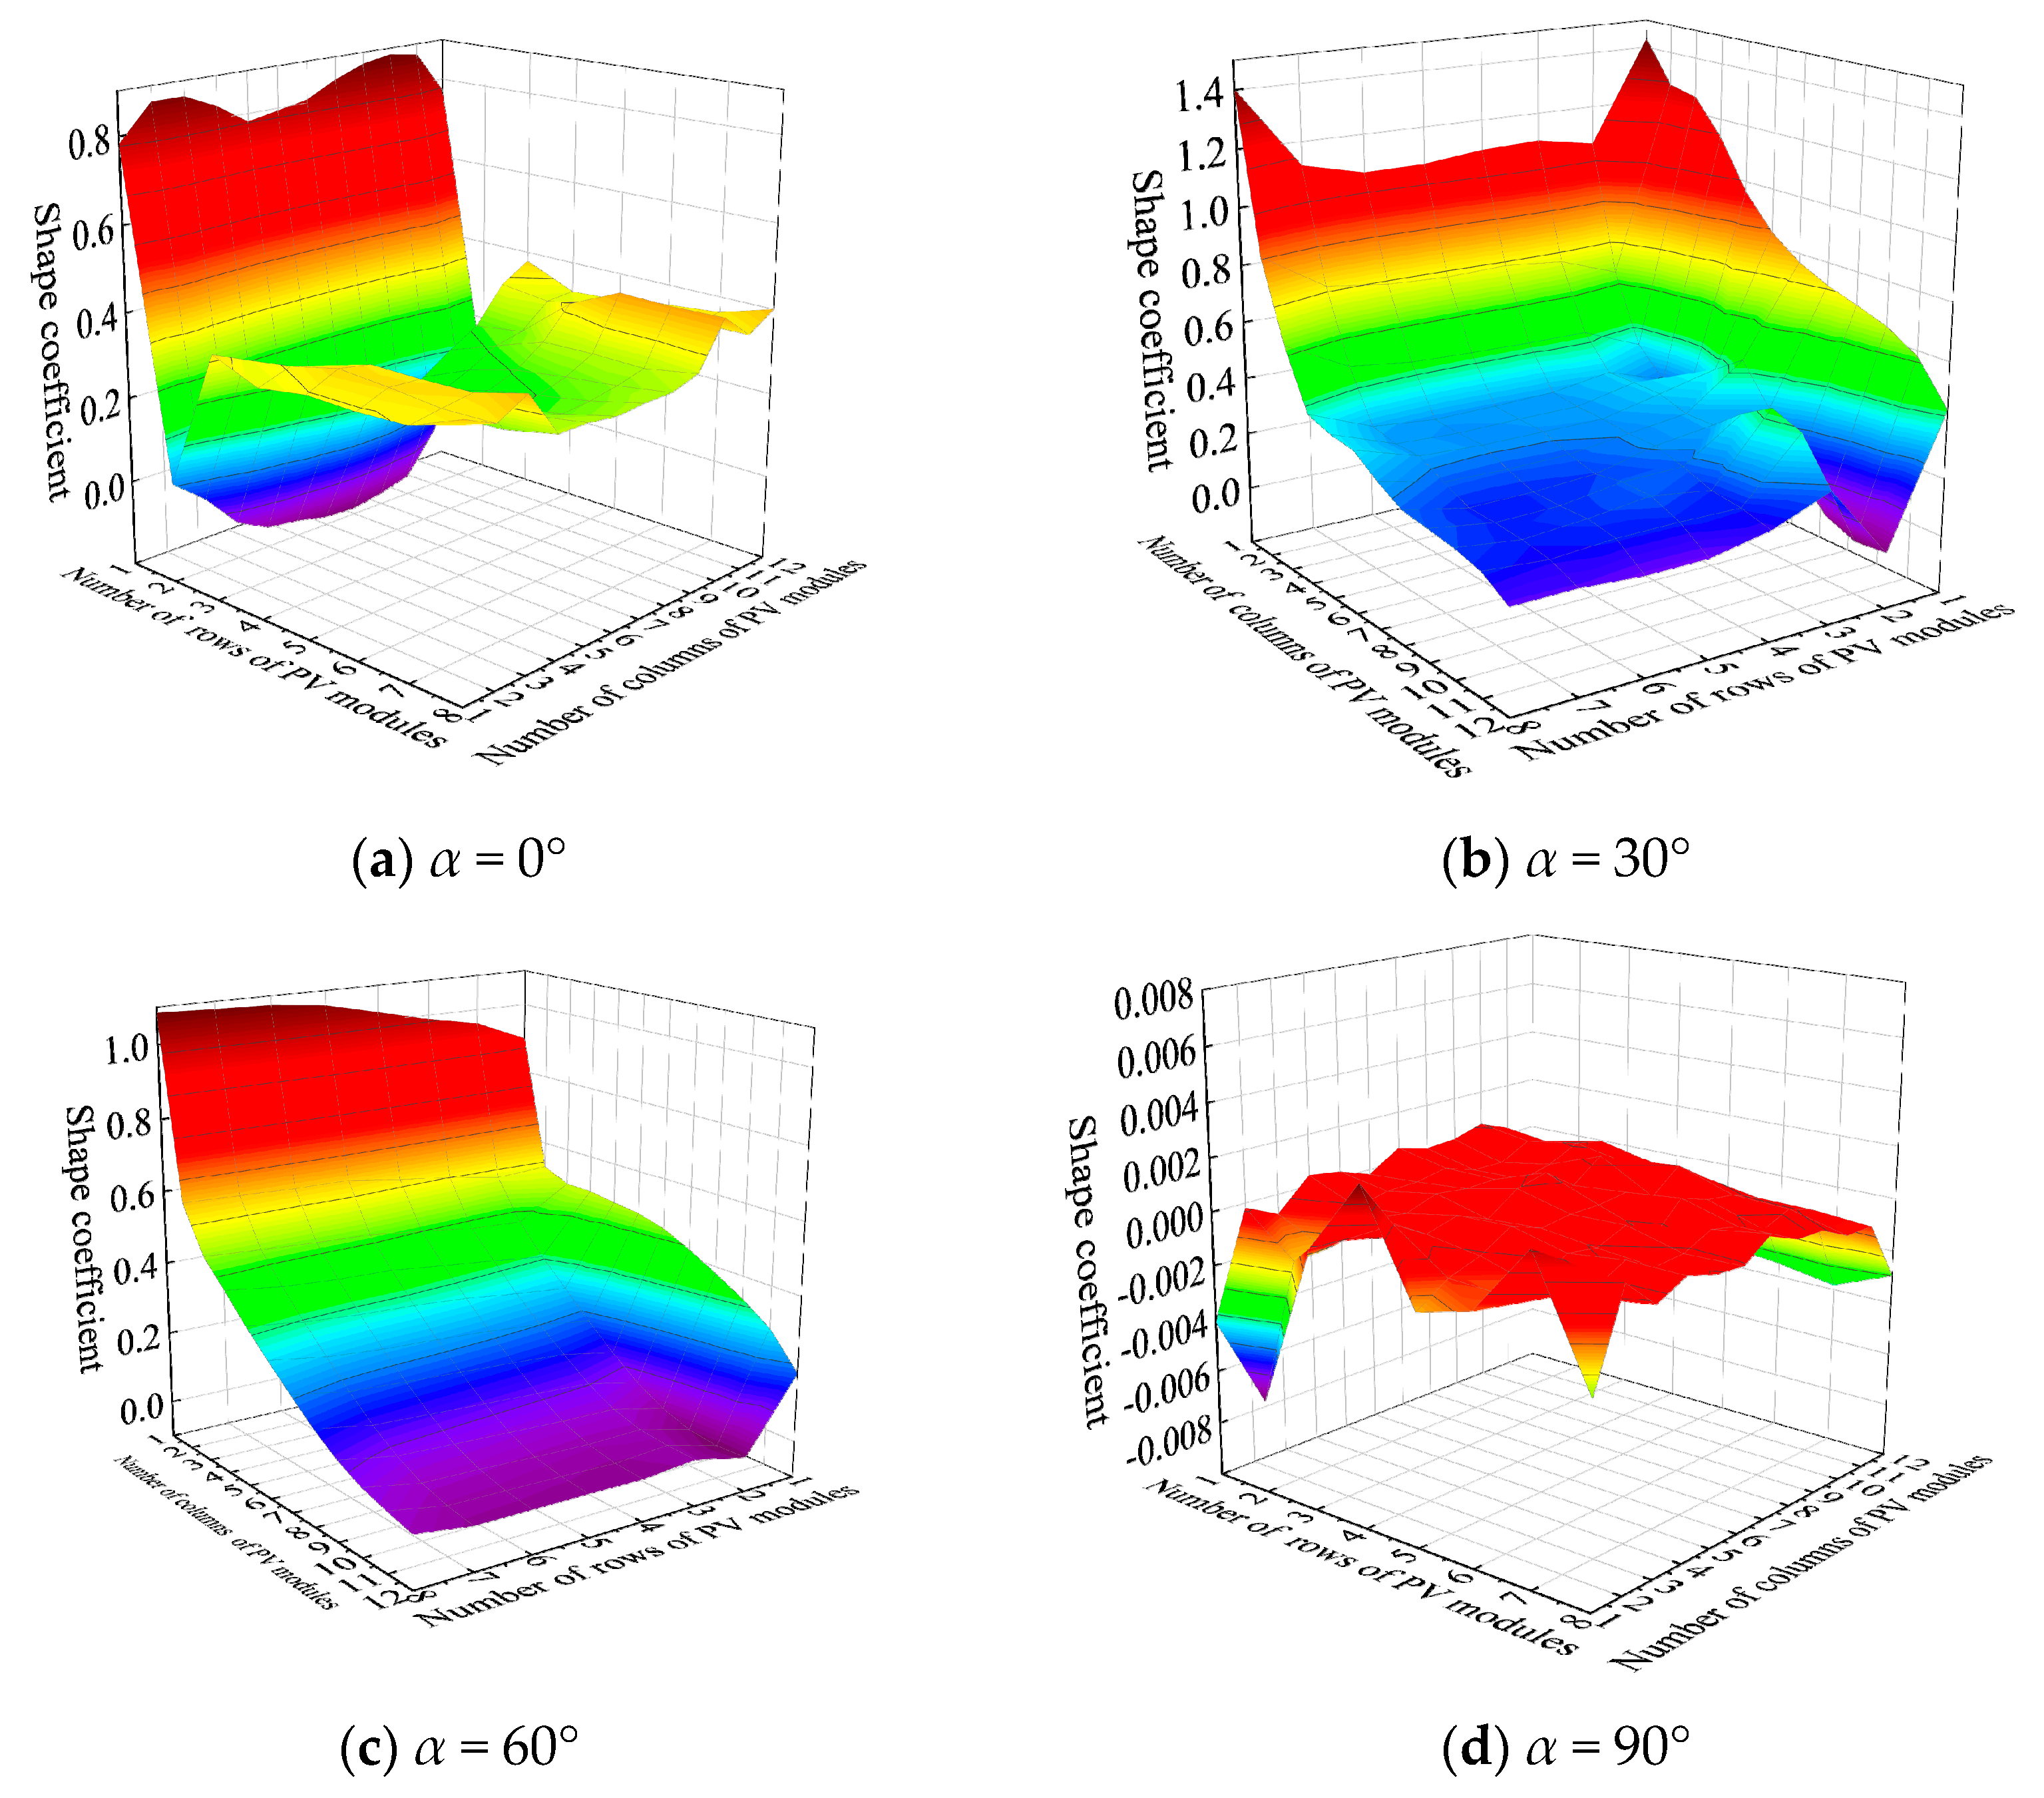
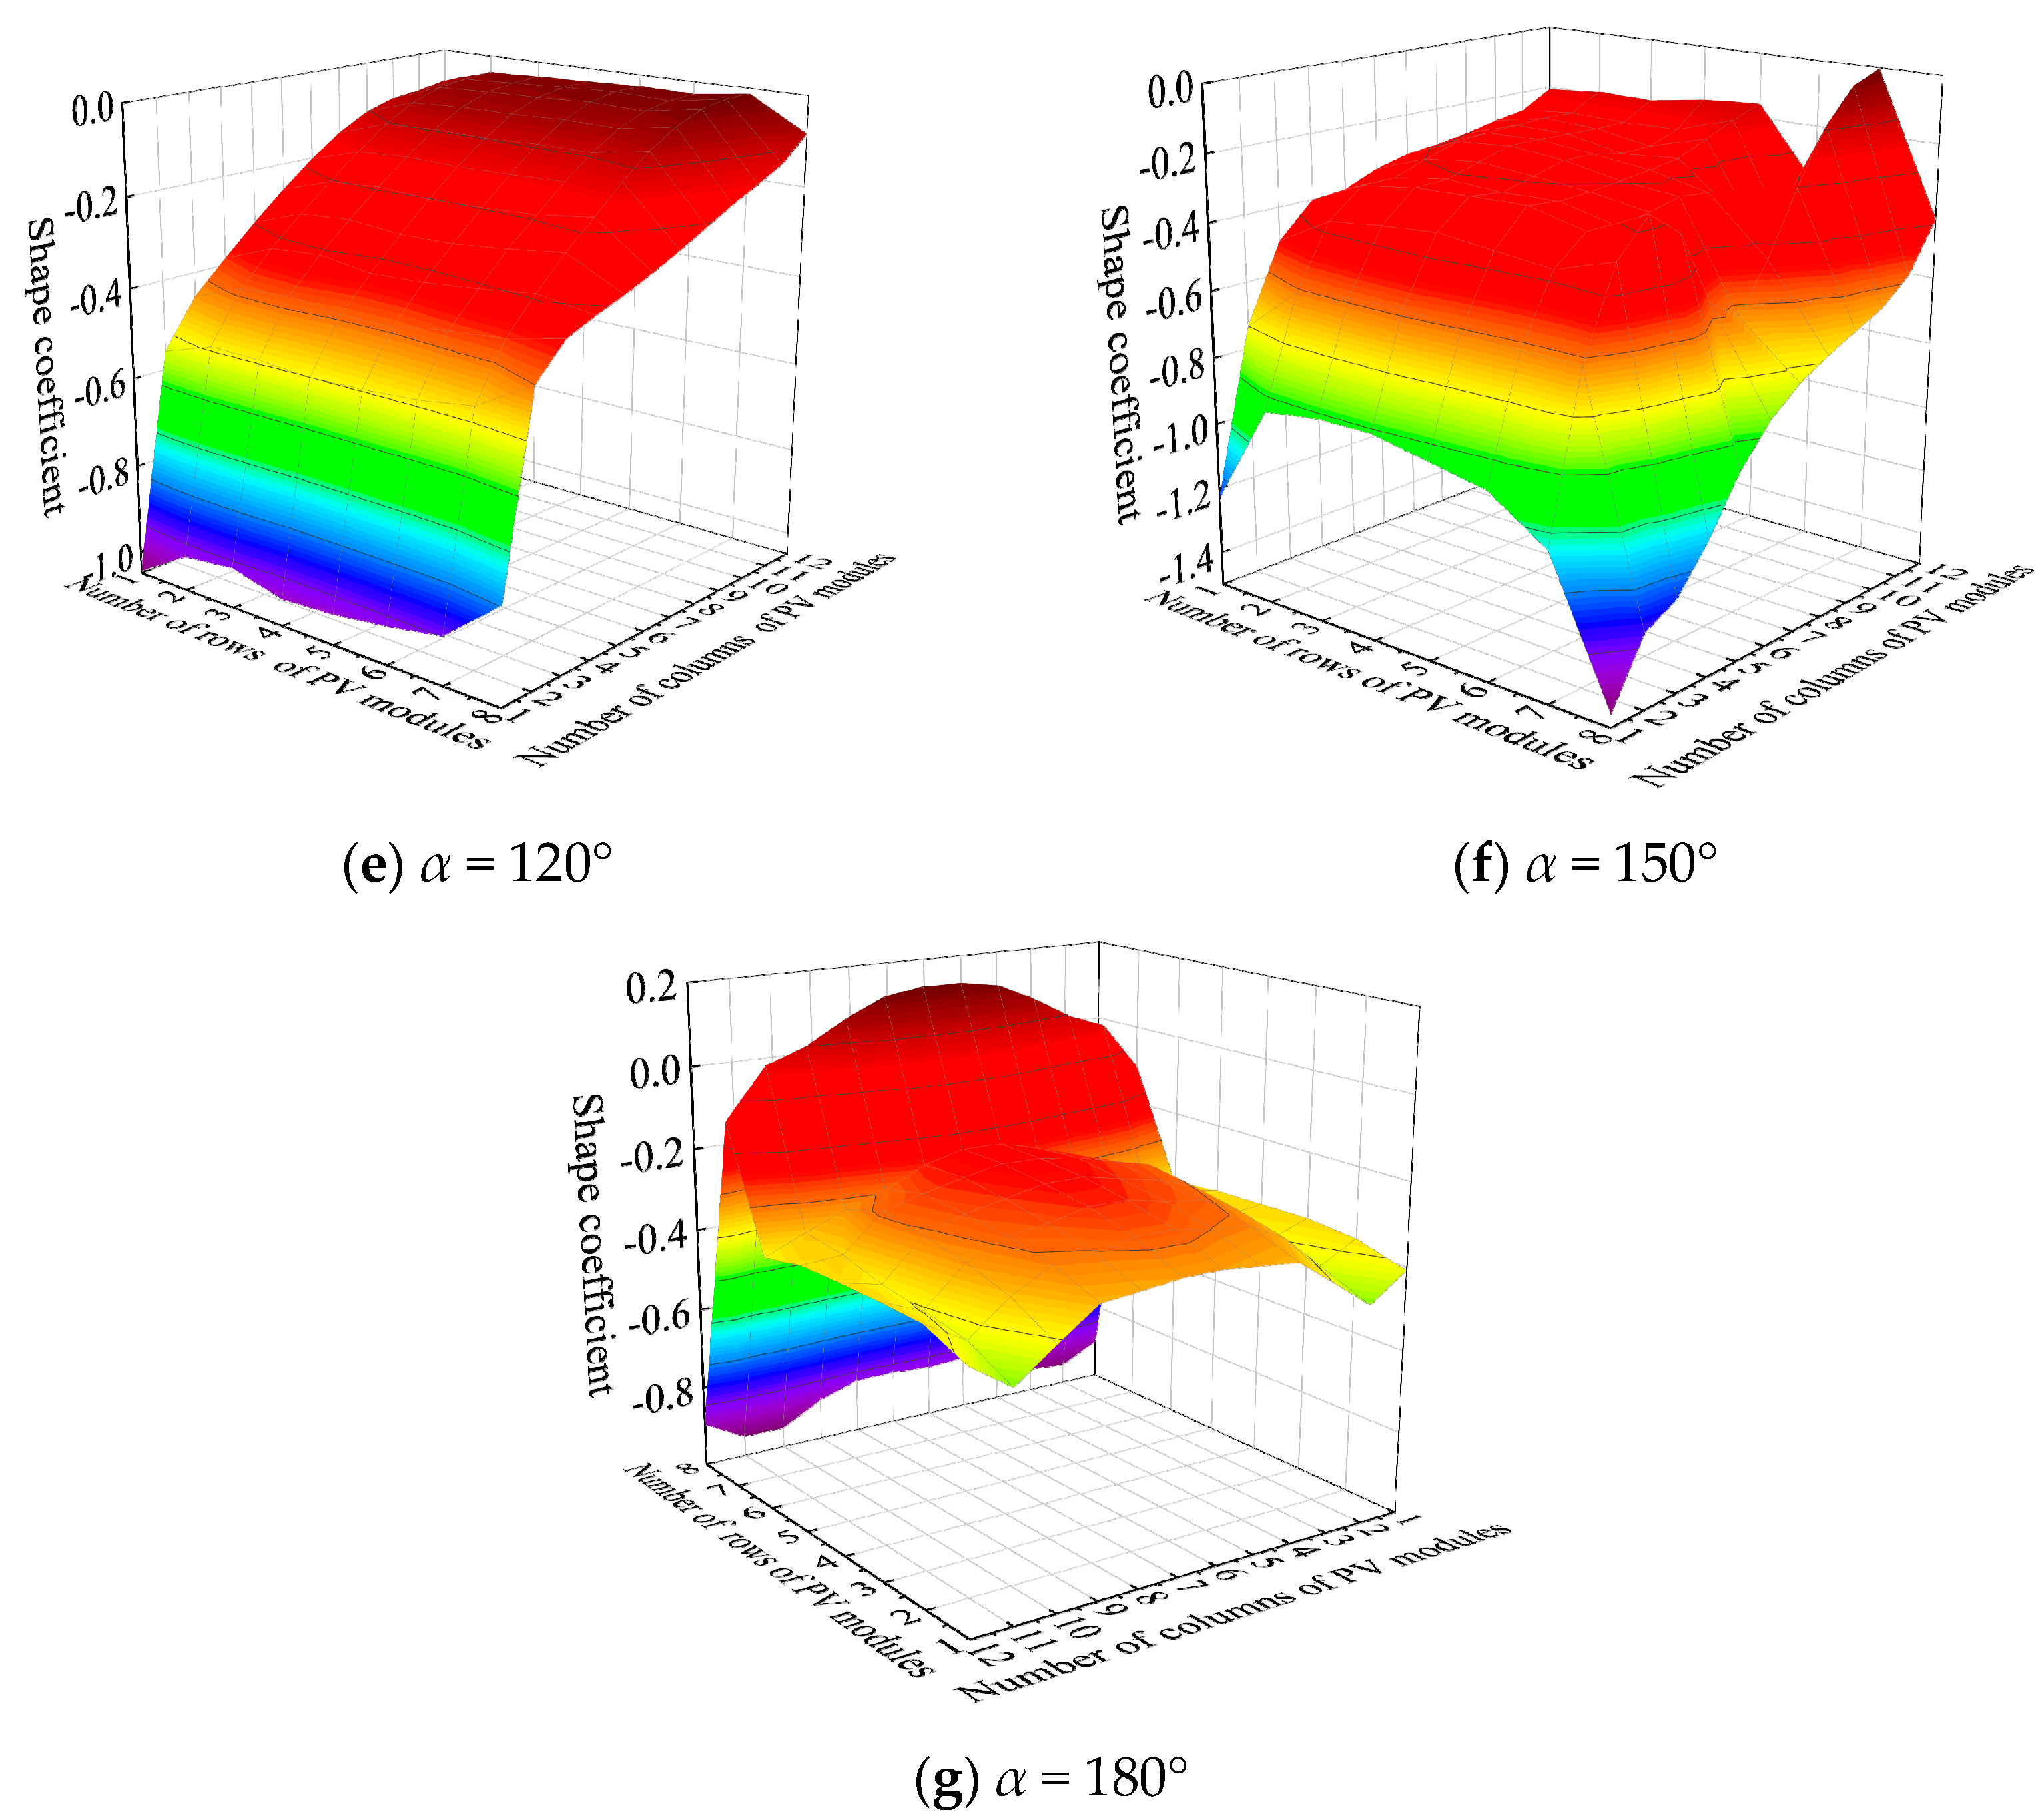
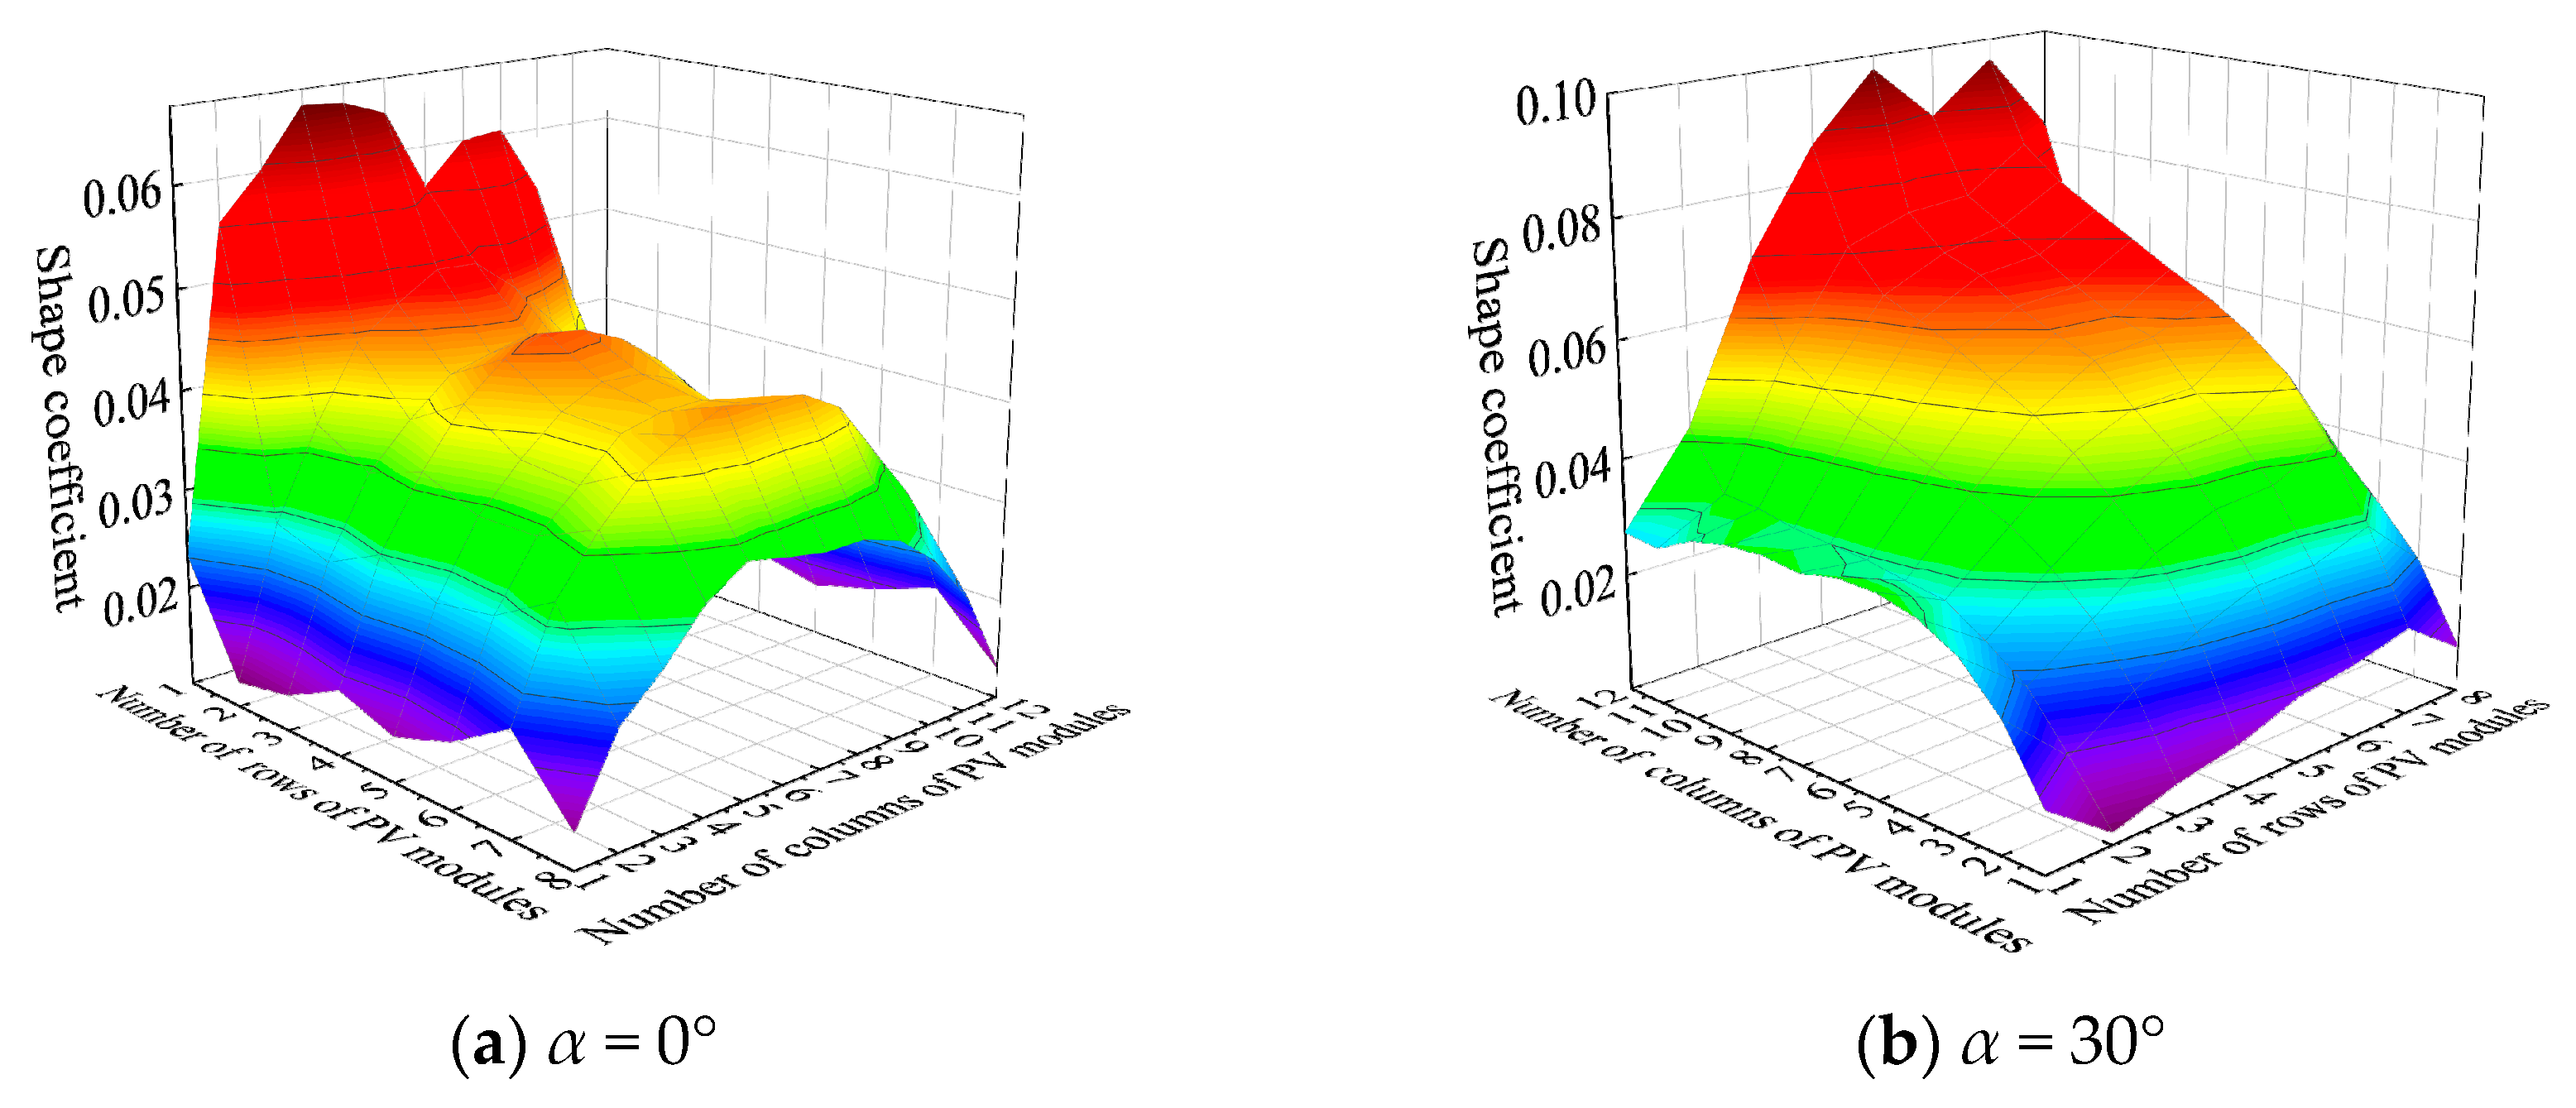
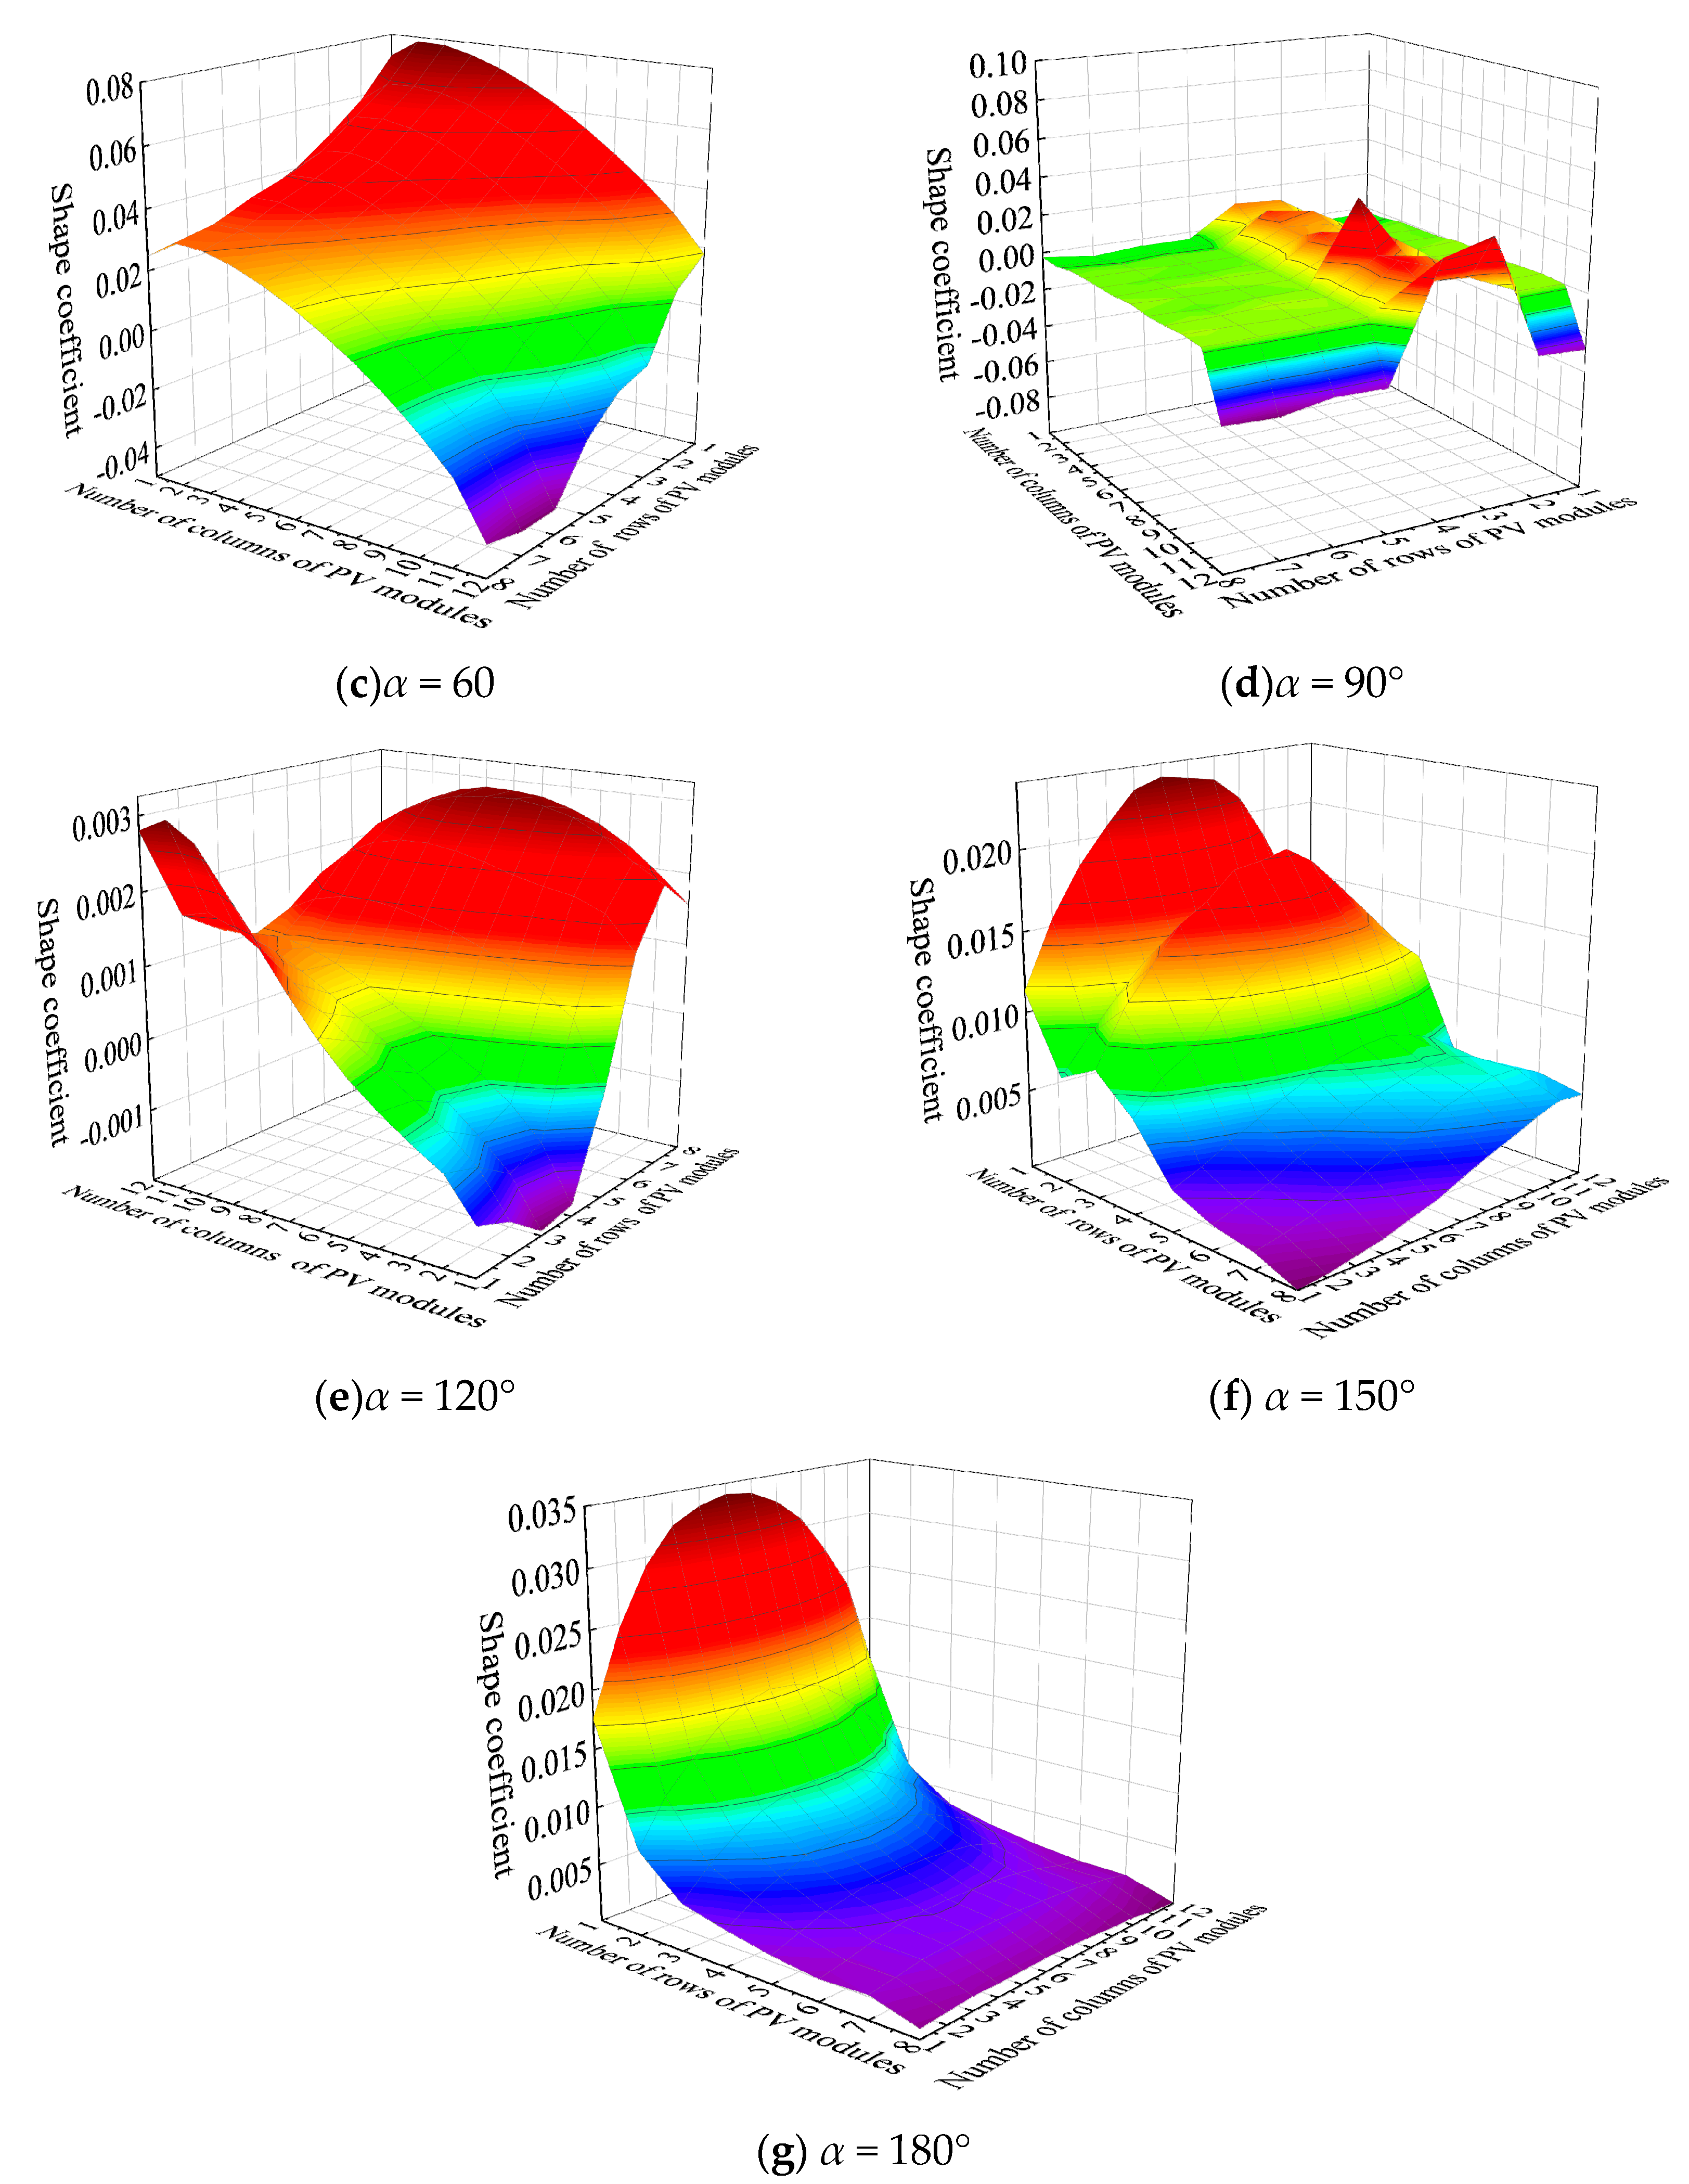
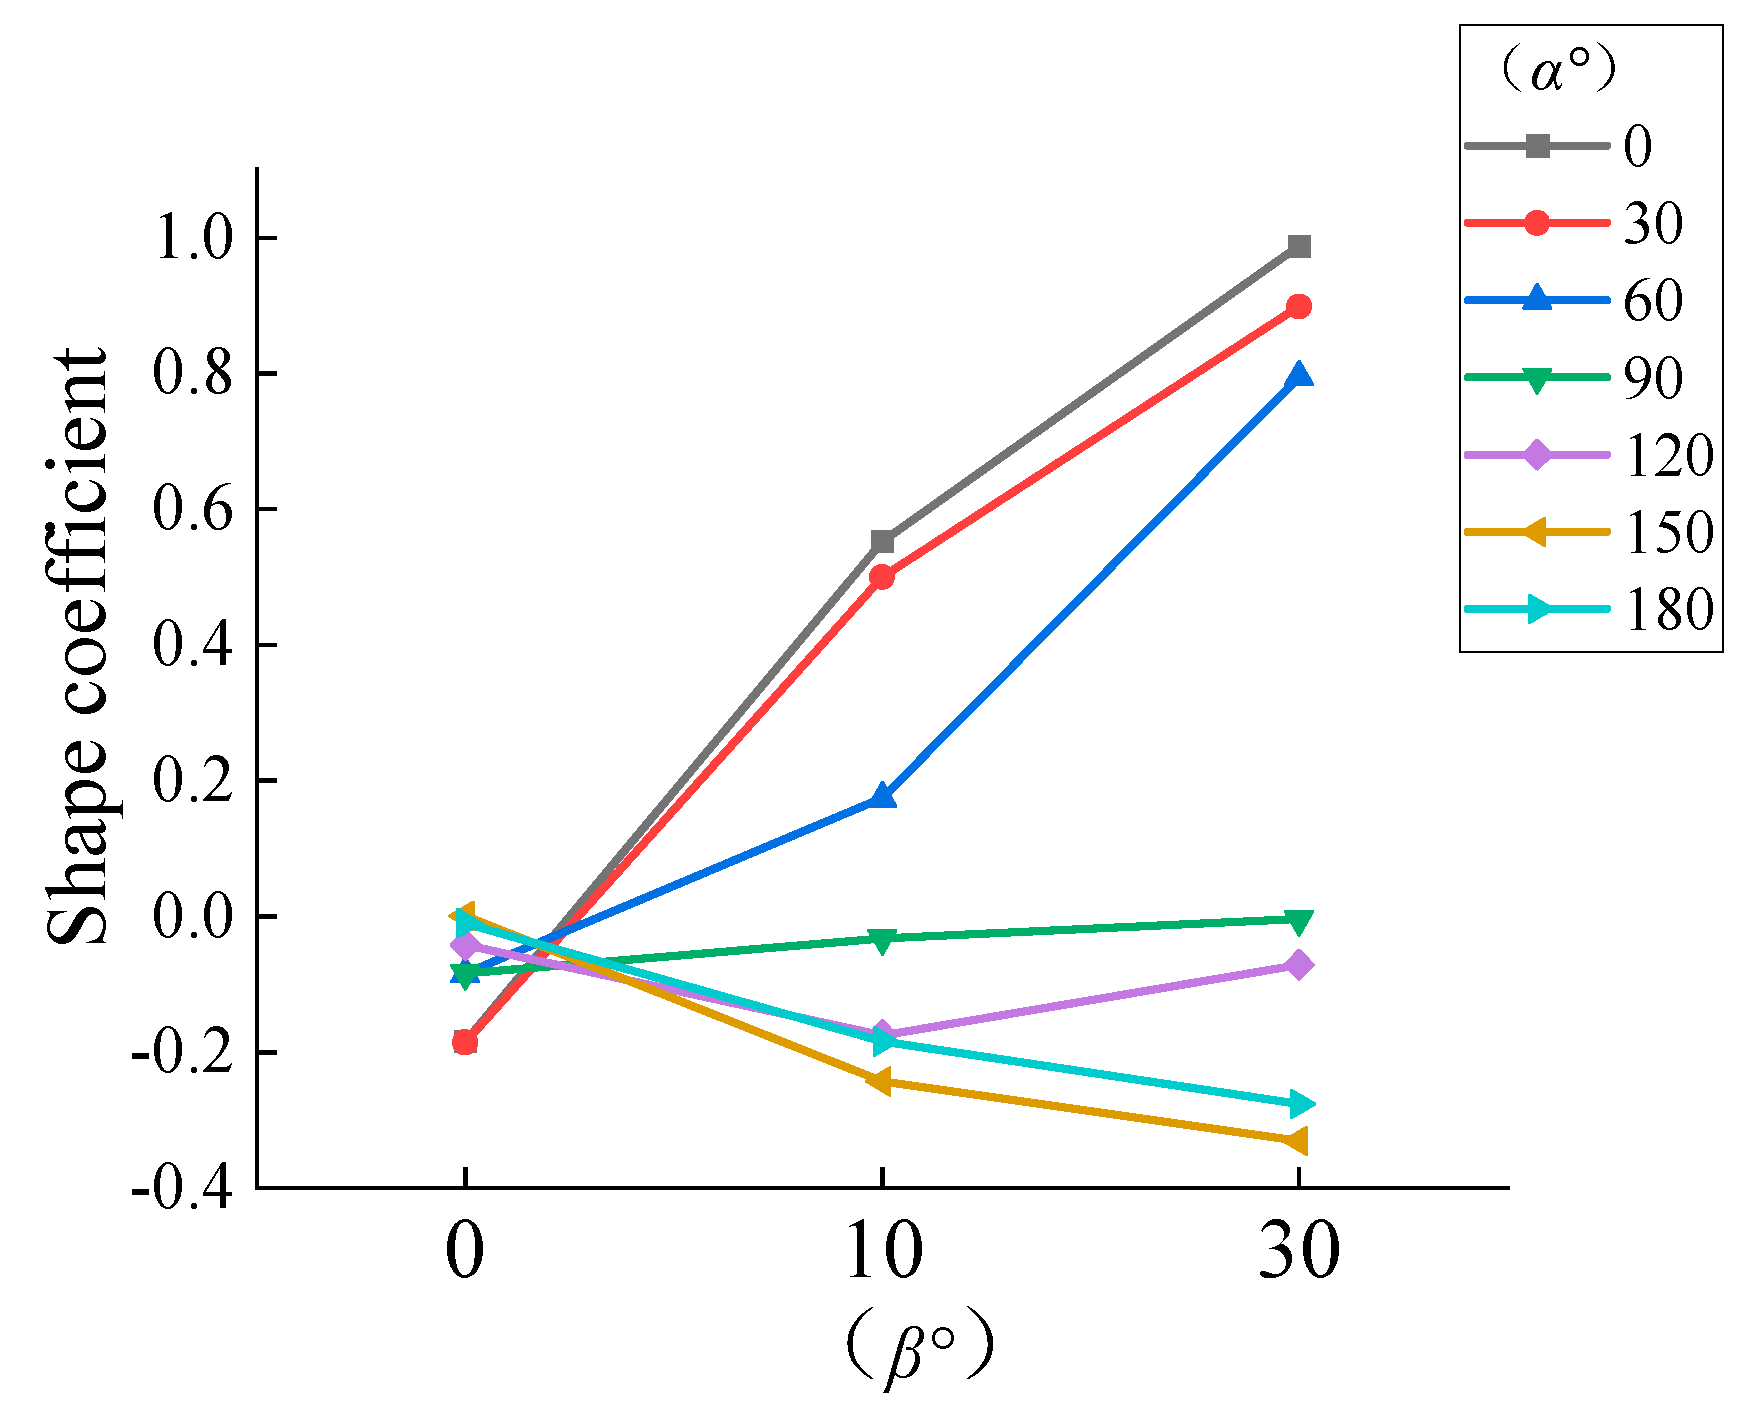
3.1. The Impact of Wind Direction on the Wind Pressure Exerted on a Pliable Group of PV Panels

In order to ensure the safety of flexible mounts and PV modules, it is essential to consider the effect of wind angle on the wind load of the module. It has been established that a positive shape coefficient indicates that the upper surface is subject to wind pressure, while a negative one indicates that the upper surface is subject to wind suction. As the shape coefficients of the PV panel array groups with wind angles of 0° to 90° and 90° to 180° at β = 0° are symmetric, only the PV panel array group shape coefficients of 0° to 90° at β = 0° are provided. The shape coefficients for β = 10° and β = 30° at wind angles of 0° to 180° are provided. The overall bulk coefficients of the PV panels are presented in Figure 4. It can be observed from this figure that the wind load shape coefficients of the first row and backward decrease significantly due to the blocking of the first row of PV panels at α = 0°. α = 30° has the largest wind load shape coefficient of the first row and the shape coefficients of the PV panels. In windy rows, the wind load shape coefficients of the PV array group decrease with the increase in the number of columns. The coefficients for α = 60° and α = 90° are given for the first row and backward. For α = 60° and α = 90°, the coefficients for the PV array group from the first row to the fourth row decrease gradually and then increase gradually from the fifth row to the eighth row.
As illustrated in Figure 5, for the PV array cluster with β = 10°, it can be observed that the wind load shape coefficient of the first row of middle PV panels is greater than that of the two sides when α = 0°. This phenomenon can be attributed to the fact that when airflow passes through the first row of PV panels, the airflow bypassing on both sides of the middle PV panels is impeded, thereby strengthening the bypassing of wind from the top and bottom of the PV panels. Additionally, the accelerated perturbation results in more airflow entering the shear layer due to wake entrainment. Consequently, the backpressure is reduced. The wind load on the PV module in the middle region is significantly larger than the wind load on the modules on both sides. Additionally, Ma [29] observed that the wind pressure on the two edges of the PV module is weaker than that in the central region. The wind load shape coefficient is presented in the first column for α = 30°, α = 60°, α = 120°, and α = 150°. In the eighth column, α = 180°, and the wind load shape coefficient is the largest. Furthermore, the wind load shape coefficient in the middle part is larger than that in the side part. The wind load shape coefficient is greater in the central region than in the lateral region.
As illustrated in Figure 6, in contrast to the PV array cluster with β = 10°, the shape coefficient of the second row of PV panels in the β = 30° cluster exhibits a pronounced decline due to the substantial blocking effect of the first row of PV panels. However, the shape coefficient of the third row increases and the back column tends to remain stable due to the reduction in the blocking effect of the first row after the third row. When α = 30°, the shape coefficient of a significant value is observed in the first column of the first row or the eighth row. When α = 60° or α = 90°, the shape coefficient of a significant value is observed in the eighth row. When α = 120° or α = 150°, the shape coefficient of a significant value is observed in the first column of the first row and the first row of the first column of the eighth row.
Figure 4, Figure 5 and Figure 6 demonstrate that the greatest values of shape coefficient for wind loads of β = 10° and β = 30° occur near α = 30° or α = 150°, while the greatest values of shape coefficients for wind loads of β = 0° occur at α = 0° and α = 180°.
A cluster of flexible PV arrays in mountainous conditions is shown in Figure 7. When α < 90°, the windward and leeward sides of the PV are subjected to wind pressure, and when 90° < α < 180°, the windward and leeward sides of the PV are subjected to wind suction. α = 0° when the maximum value of the shape coefficient occurs in the middle of the first row, and α = 30° due to the blocking effect of the mountain; the first column of the PV panels is subjected to the minimum wind load, and the maximum value of the shape coefficient occurs in the middle of the row of the last column. When α = 60°, due to the change of wind angle, the blocking effect of the mountain for the first column of PV panels becomes smaller, so the largest value of the shape coefficient appears in the first column of the first row. When α = 90°, the largest value of the shape coefficient of the PV panel appears in the middle column of the middle row, the shape coefficient of the PV panel is larger compared to that of the side panels, and the back row has a larger shape coefficient than the front row. When α = 120°, the shape coefficient is distributed in such a way that it is high on both sides and low in the middle according to the direction of the column. When α = 120°, the shape coefficient is distributed in the direction of the column in such a way that the two sides are high and the middle is low. When α = 150° and α = 180°, the great values of the shape coefficient appear in the middle of the first row.
In summary, when the maximum value of the shape coefficient occurs at α = 30°, the wind load on the middle and rear rows of PV panels should be emphasized in the wind-resistant design of PV panels in mountainous conditions.
Table 1 shows a comparison of wind load shape coefficient values and test results in the most recent version of the “Structural Design Regulations for PV Racking” (NB/T 10115-2018) [30]. For PV modules with a tilt angle of less than 15°, the wind load shape coefficients are all determined using the value of 15°. It is apparent from Table 1 that the wind load shape coefficient value of the “Structural Design Regulations for PV Racking” is more cautiously taken. Table 1 illustrates that the wind load coefficients of design regulations for PV rack structures are conservative. Nonetheless, the largest PV panel in the group of PV arrays has a coefficient of −1.46, placed in the first windward position of the first row when β = 150°. Its value surpasses that of the specification; hence, it is pertinent to consider it in the design.

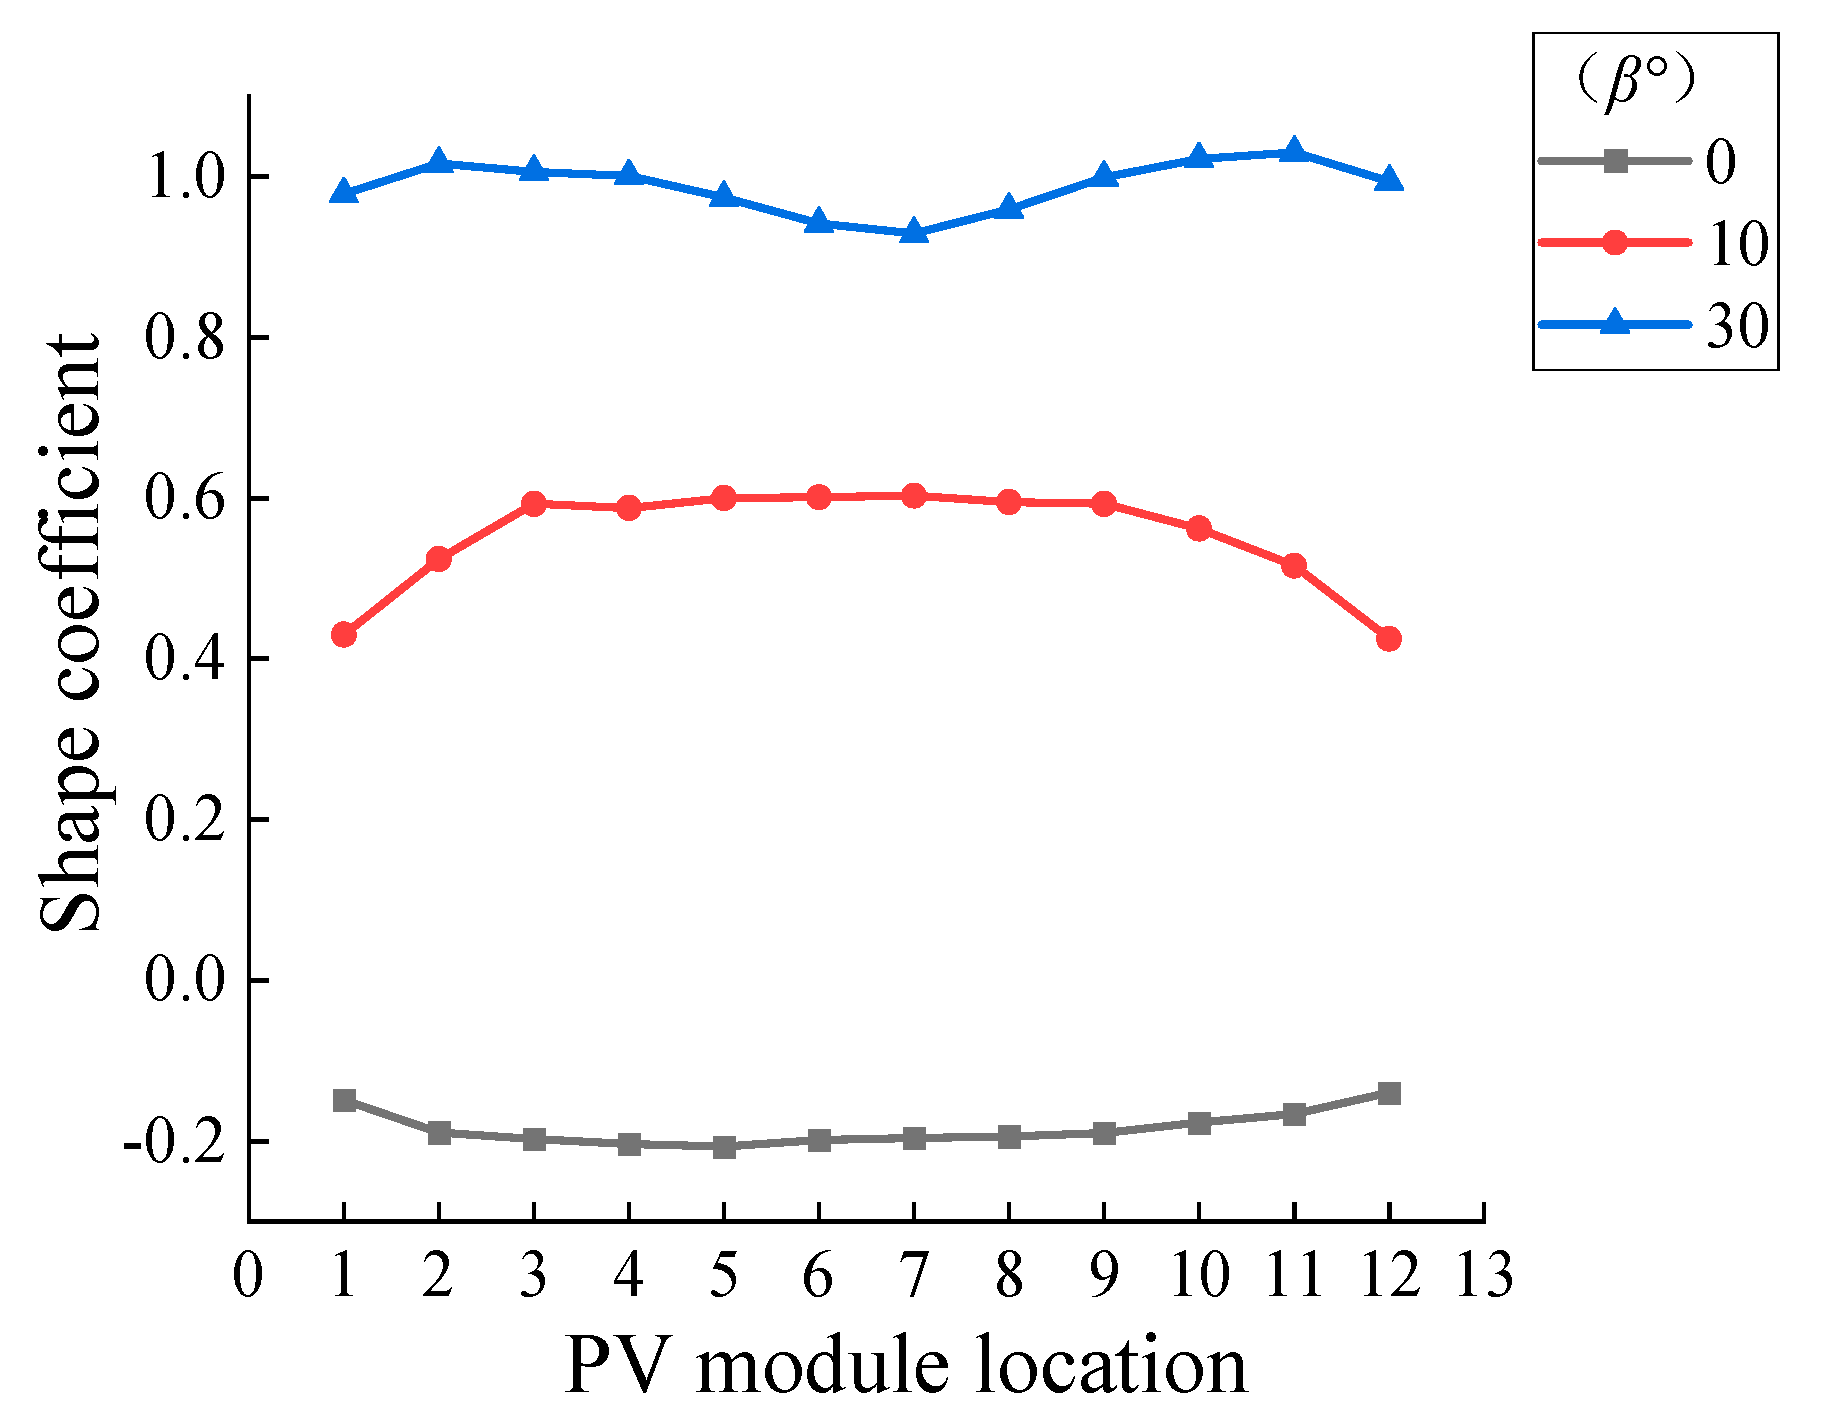
3.2. Effect of Tilt Angle of Flexible PV Panels on Wind Loads

Figure 8 shows the variation of the average value of the shape coefficients of the first row of PV panels with the tilt angle for different wind angles. Figure 9 shows the variation of the shape coefficients of the PV panels with the position of the PV panels for different tilt angles. From Figure 8, it can be seen that the shape coefficients increase with the increase in the tilt angle of the PV panels, and the absolute value of the shape coefficients of the PV module is the smallest at this time due to the wind flow from the windward and leeward sides of the PV panels when α = 90°. When the wind angle is greater than 90° and when the first row of PV panels is due to the blocking effect of the back row of PV panels, the PV panel shape coefficients with the tilt angle of change are smaller. From Figure 9, it can be seen that the shape coefficient increases with the increase in the tilt angle of the PV panel, and the increase in the shape coefficients from 0° to 10° is larger than the increase in the shape coefficients from 10° to 30°.

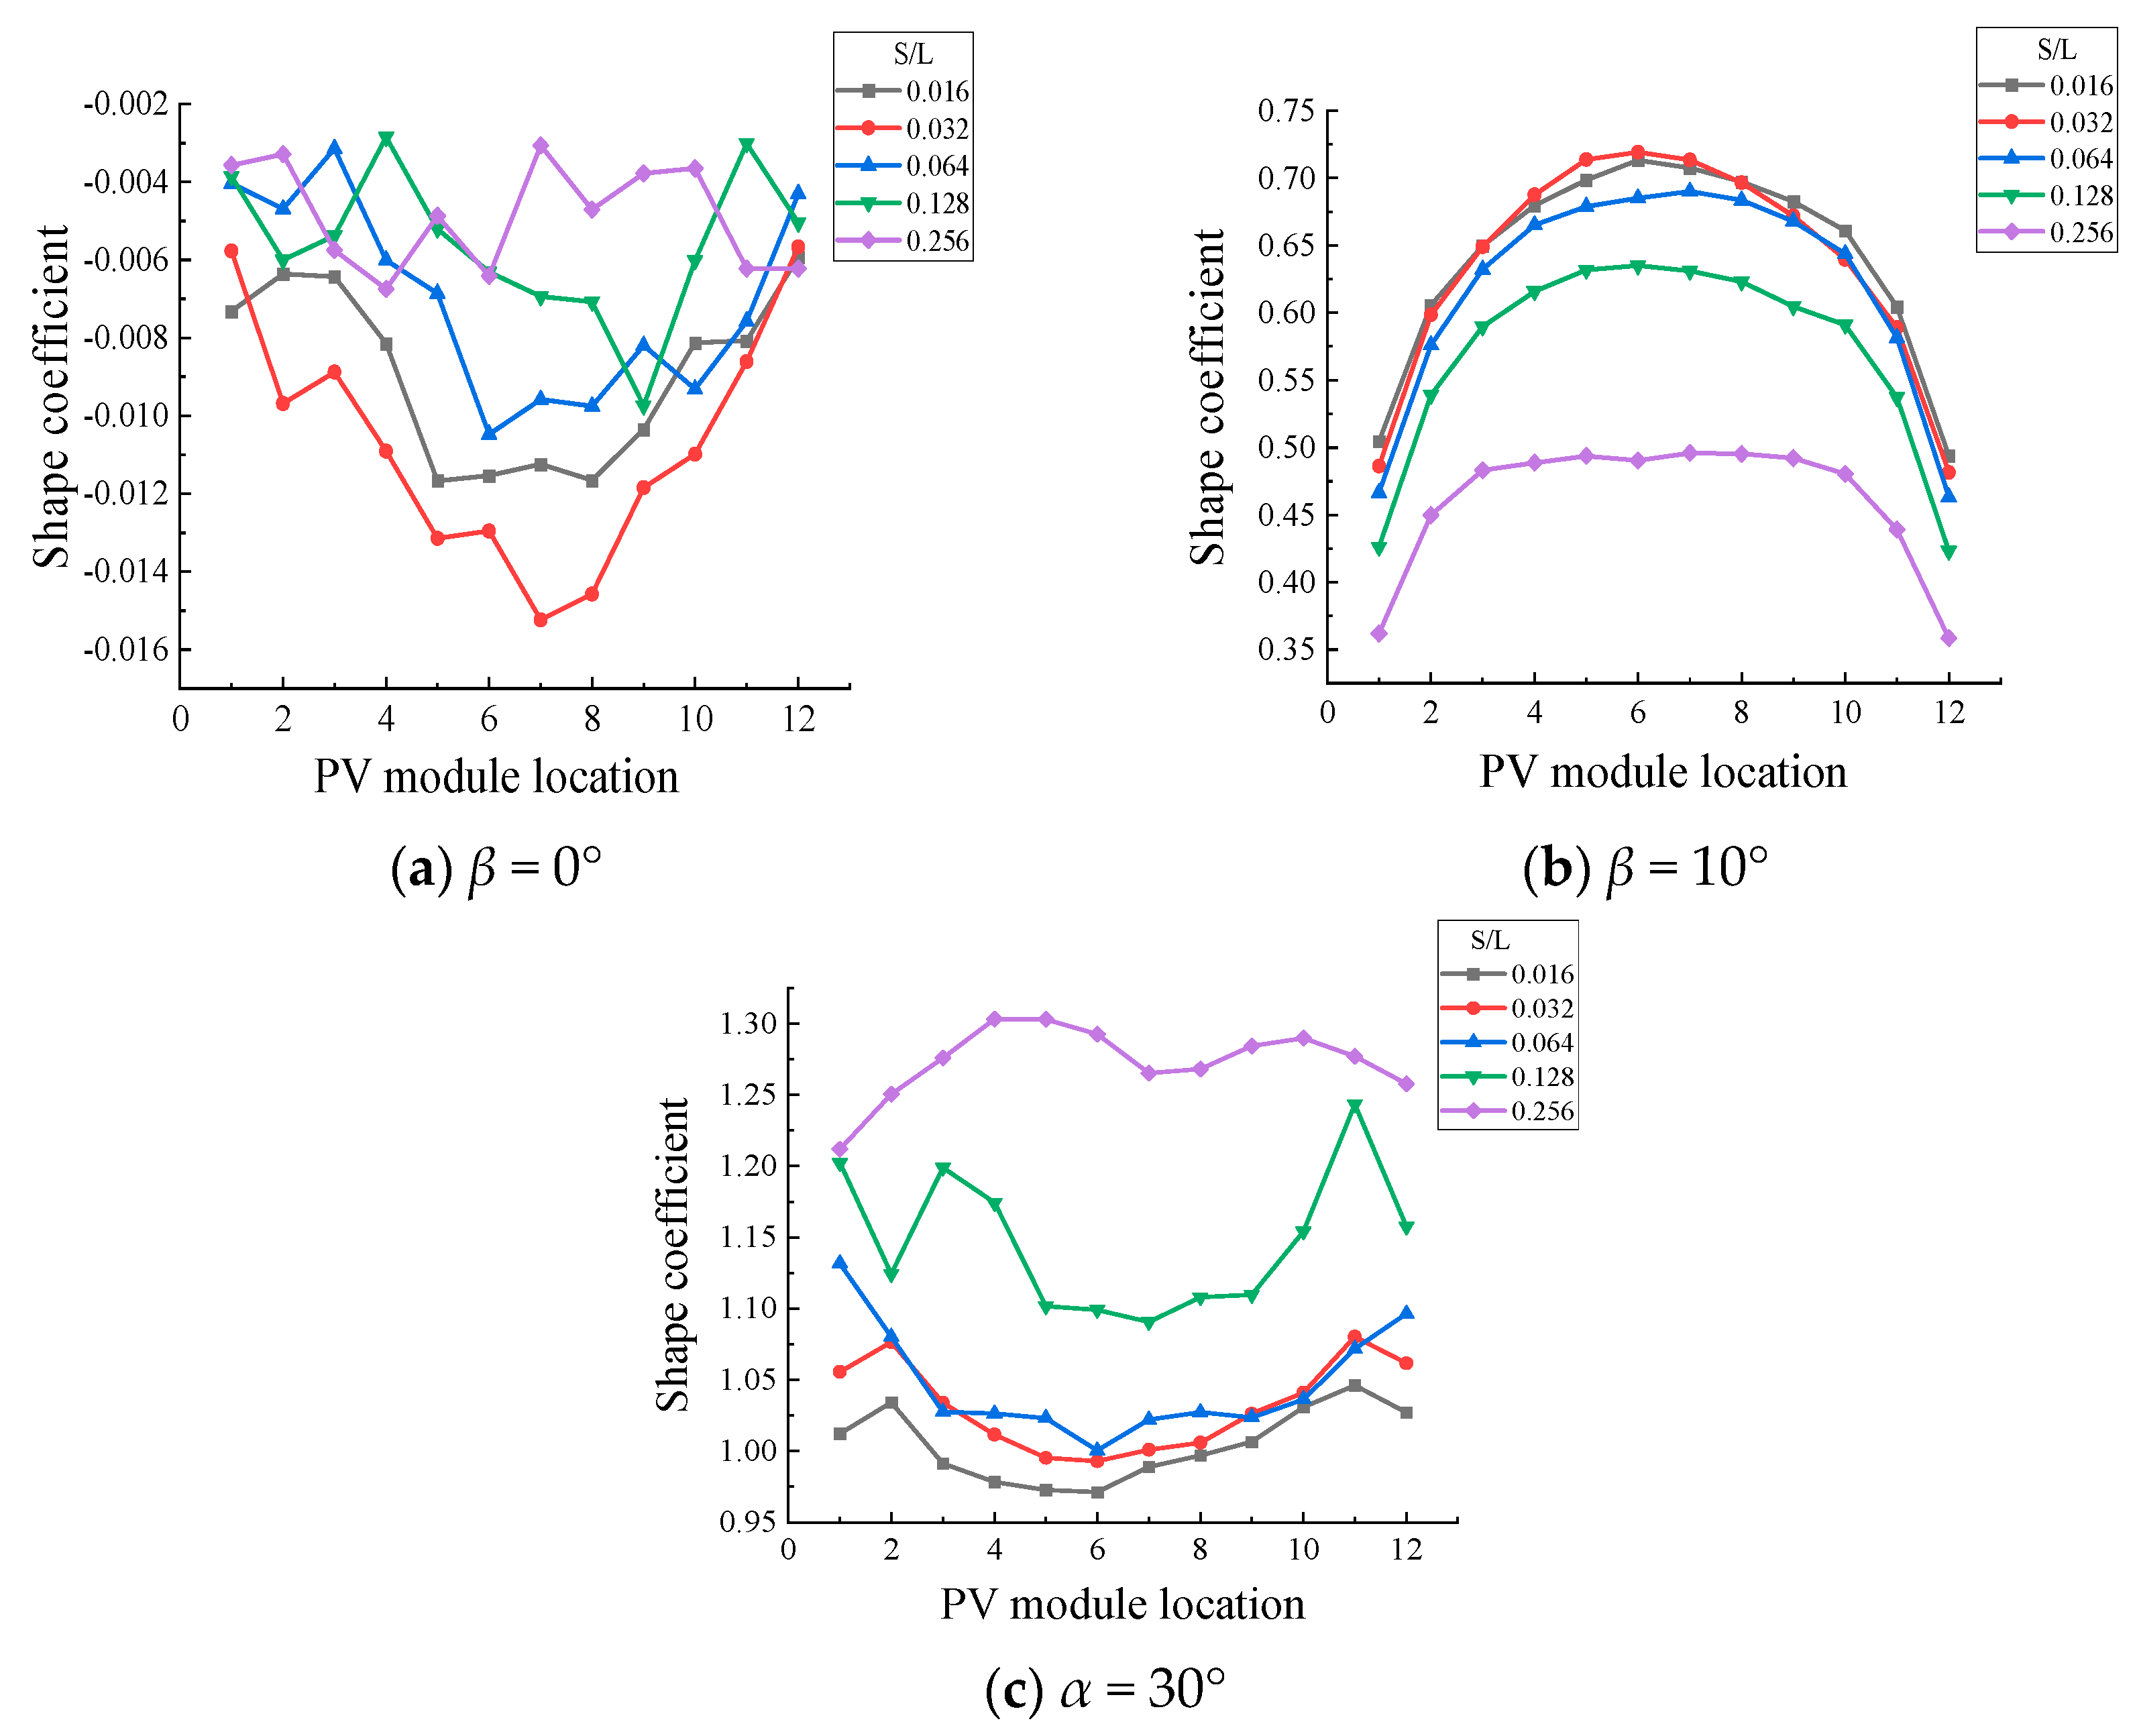
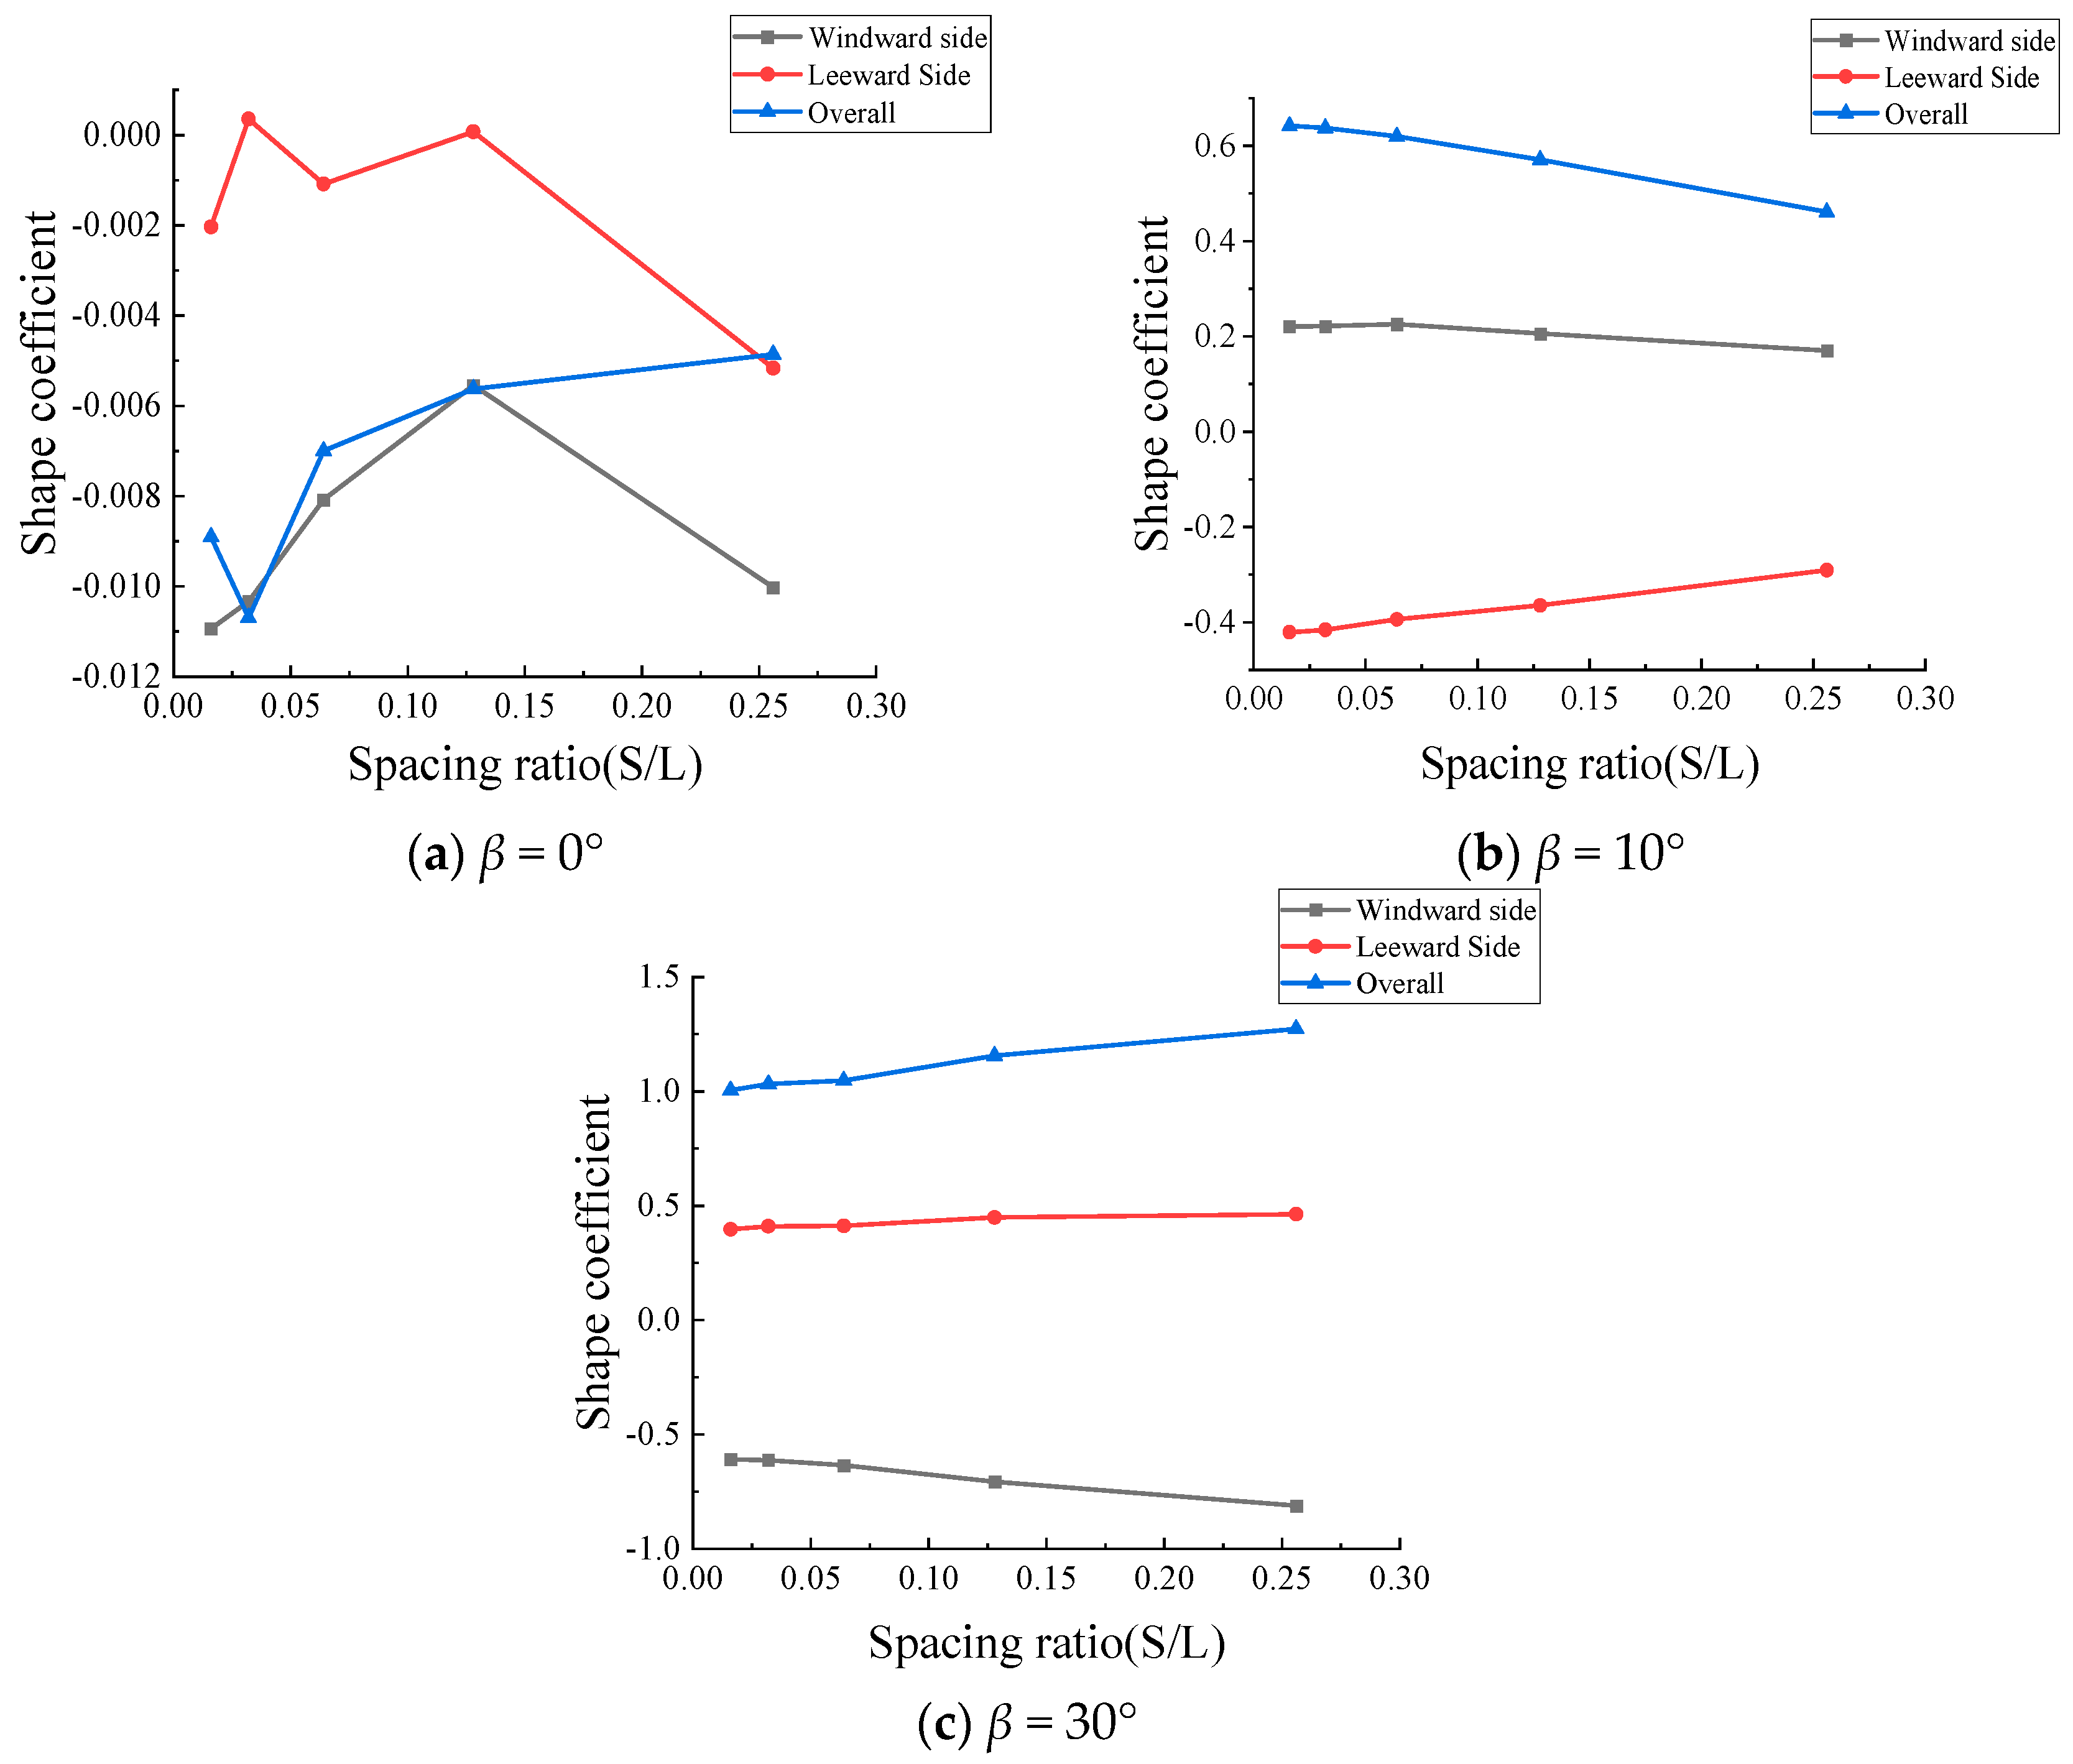
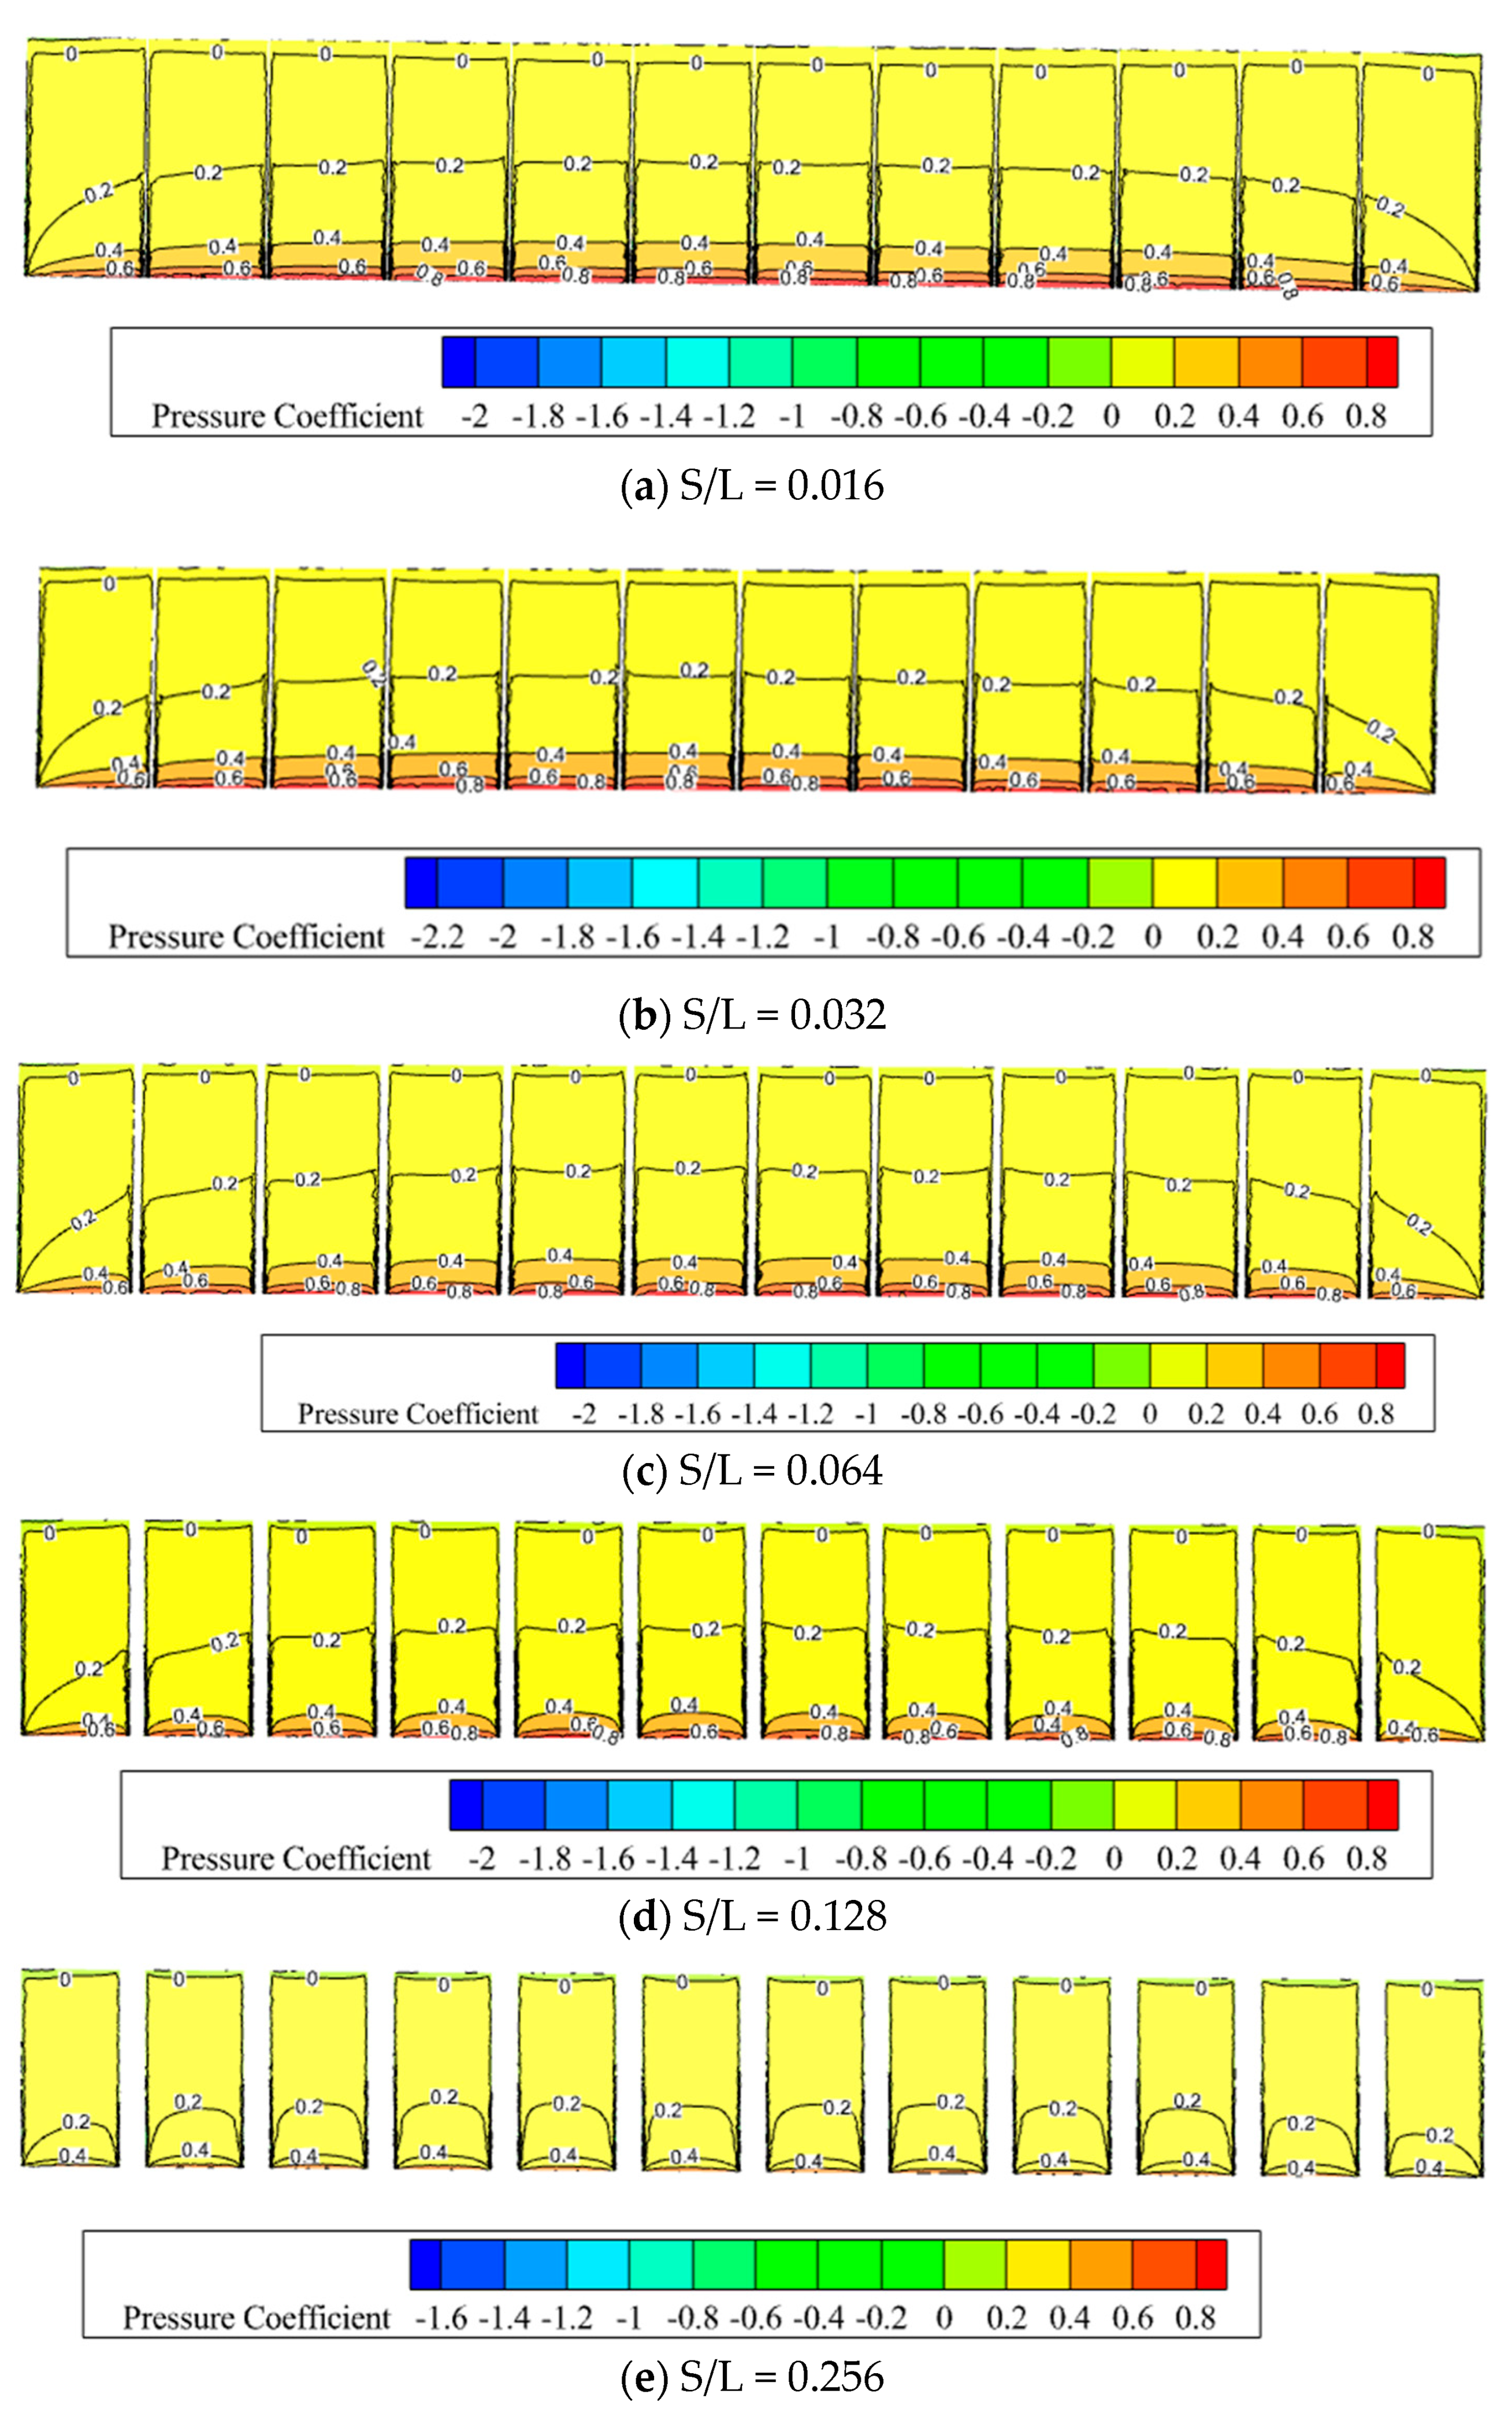
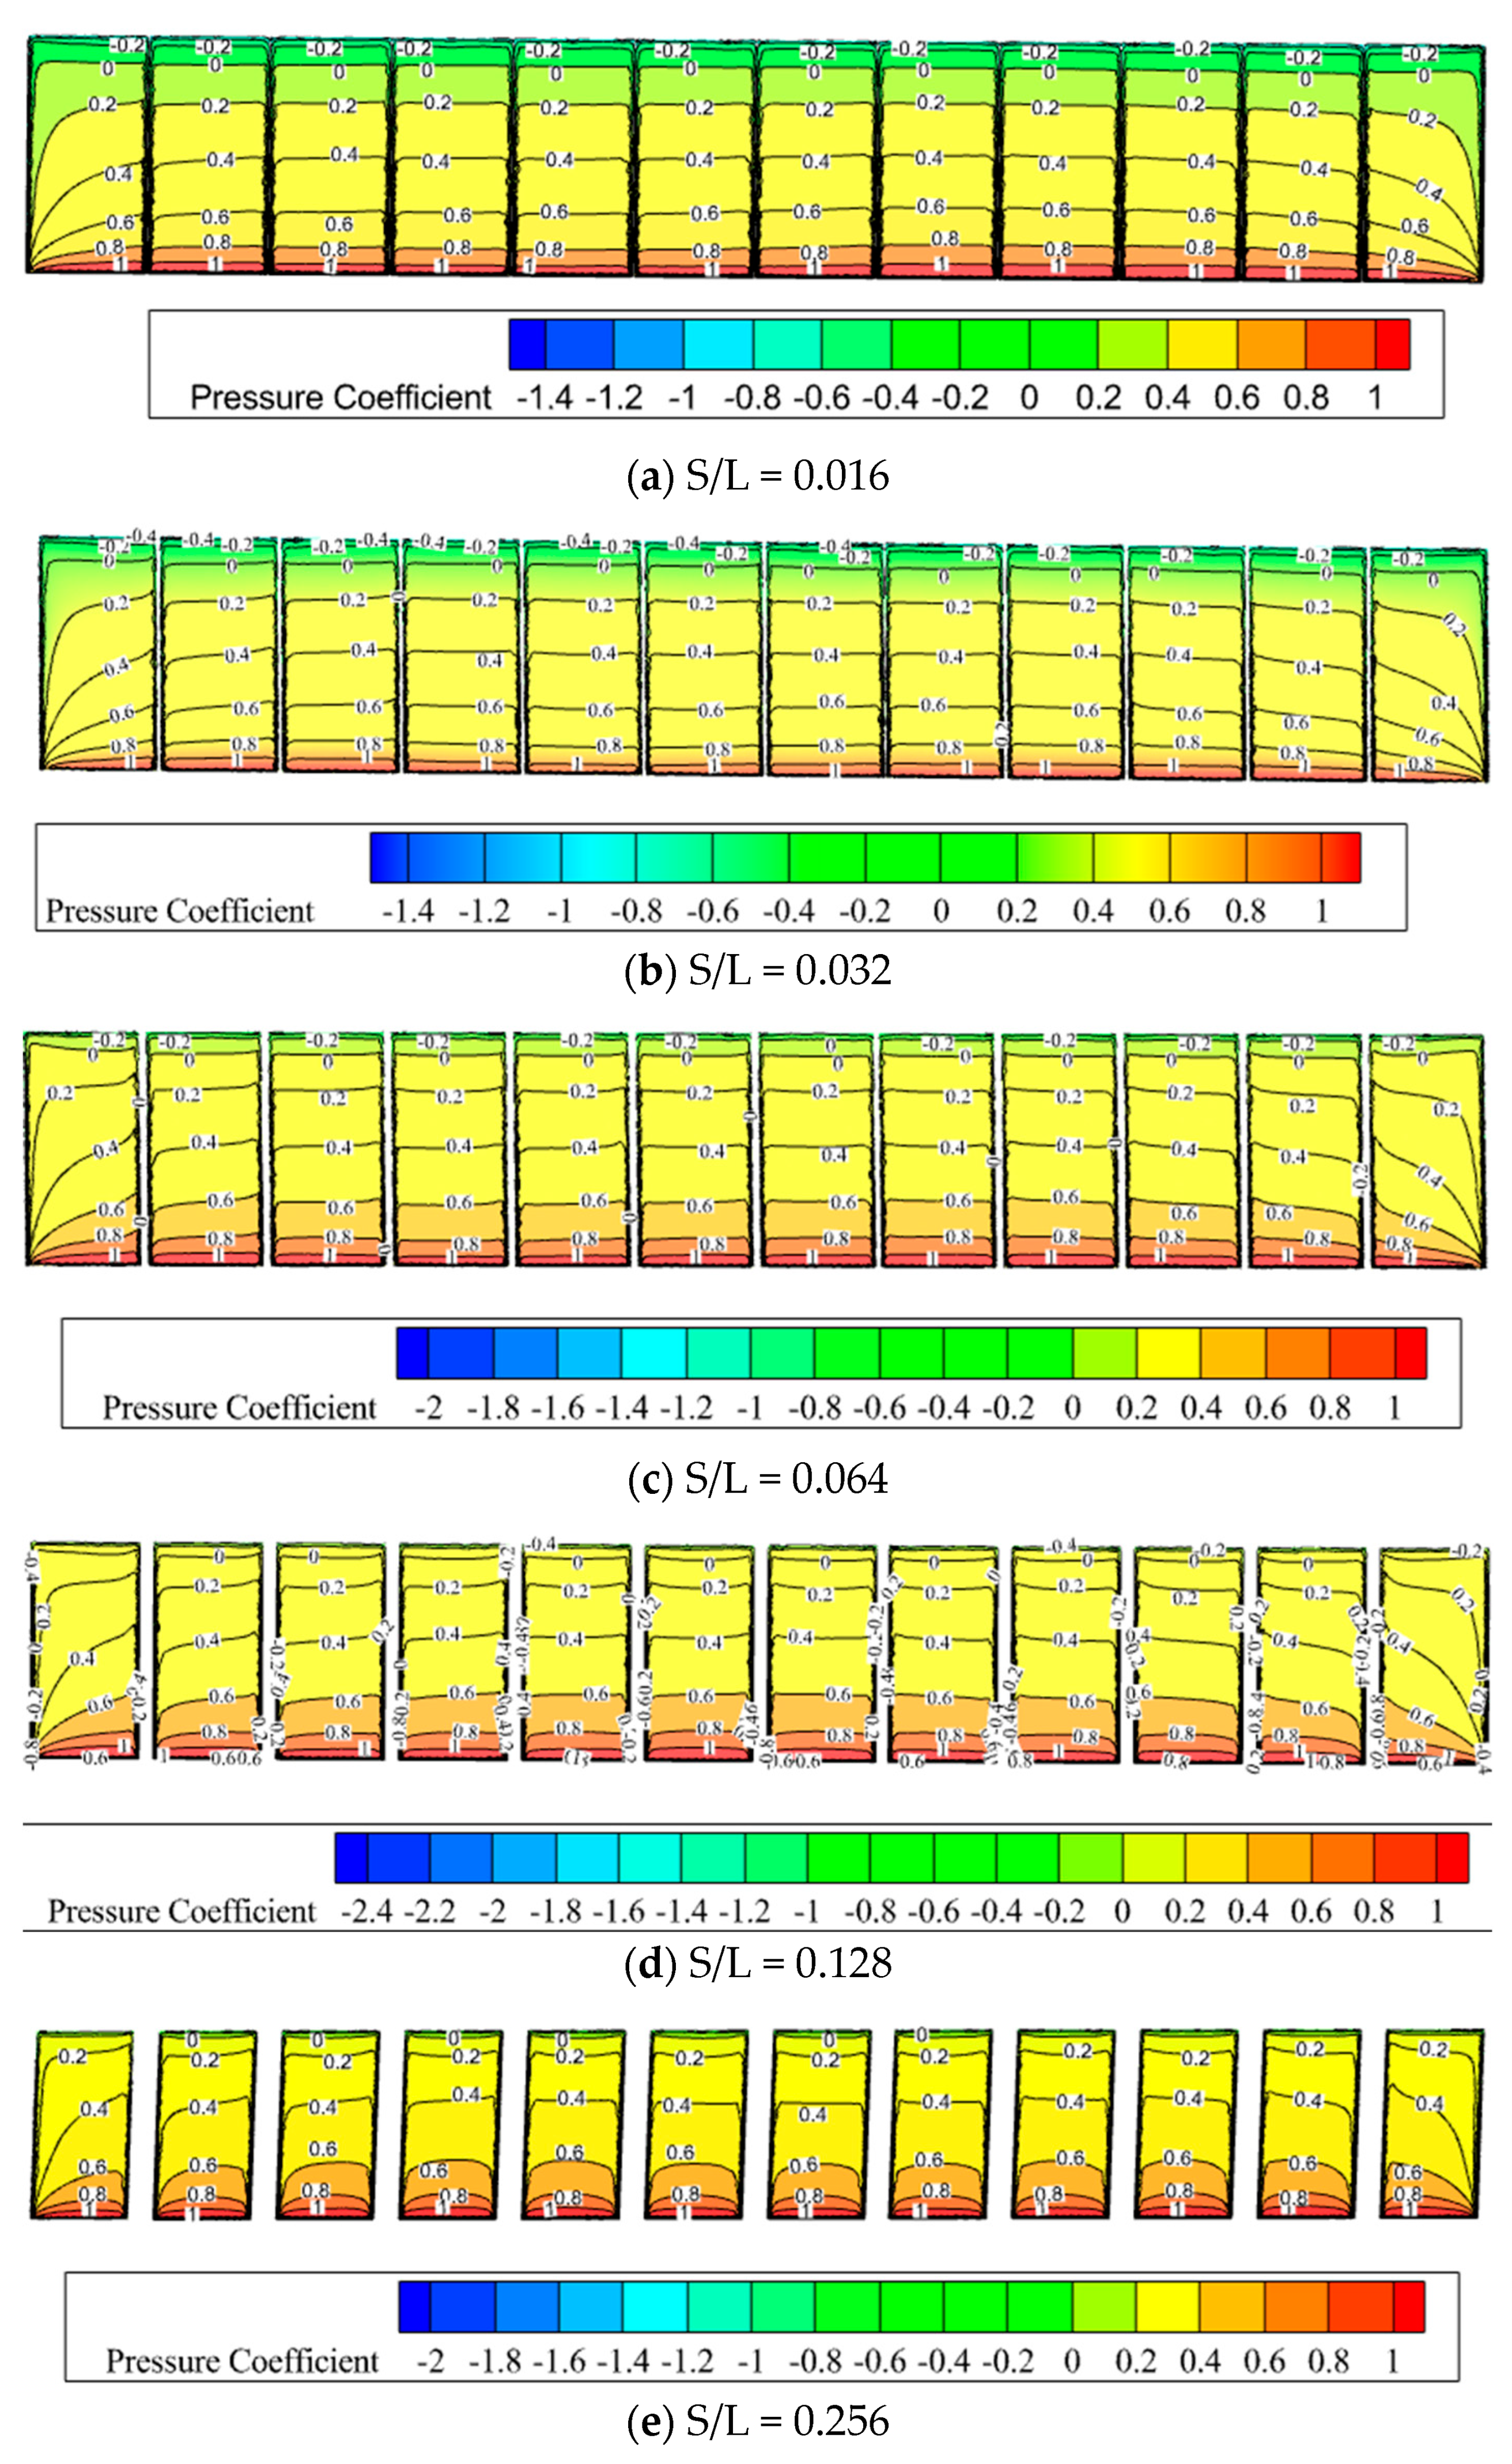
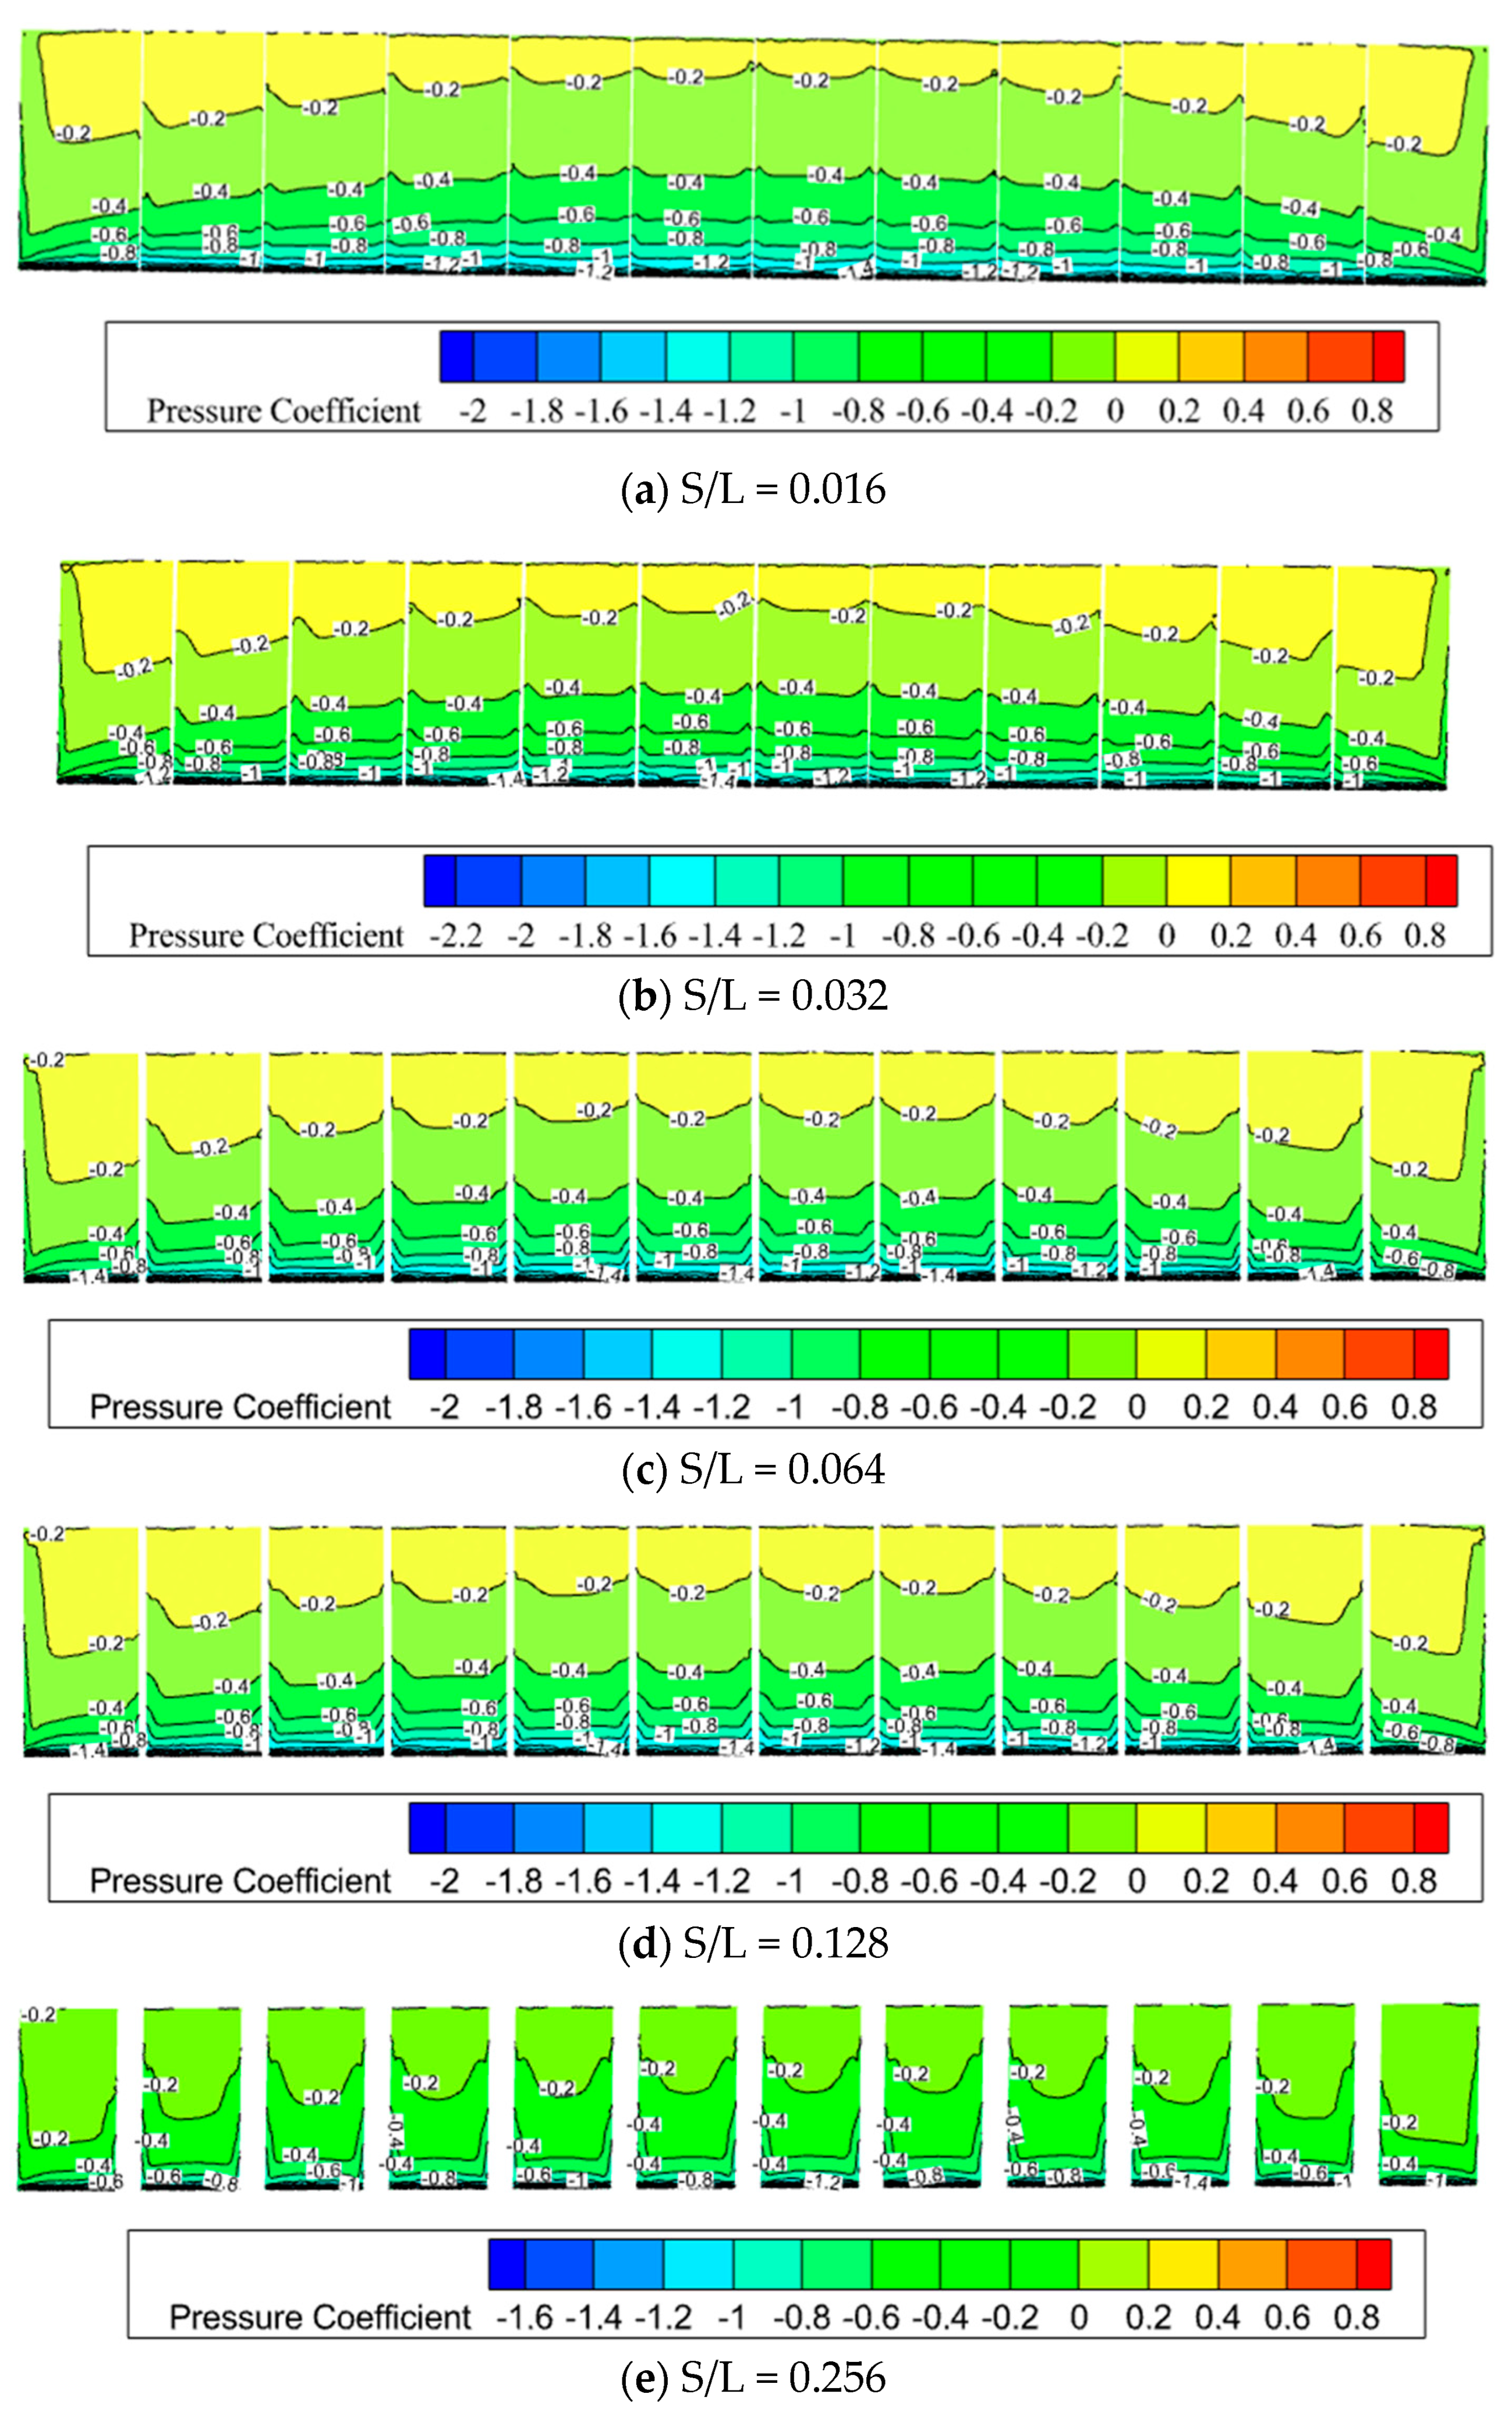
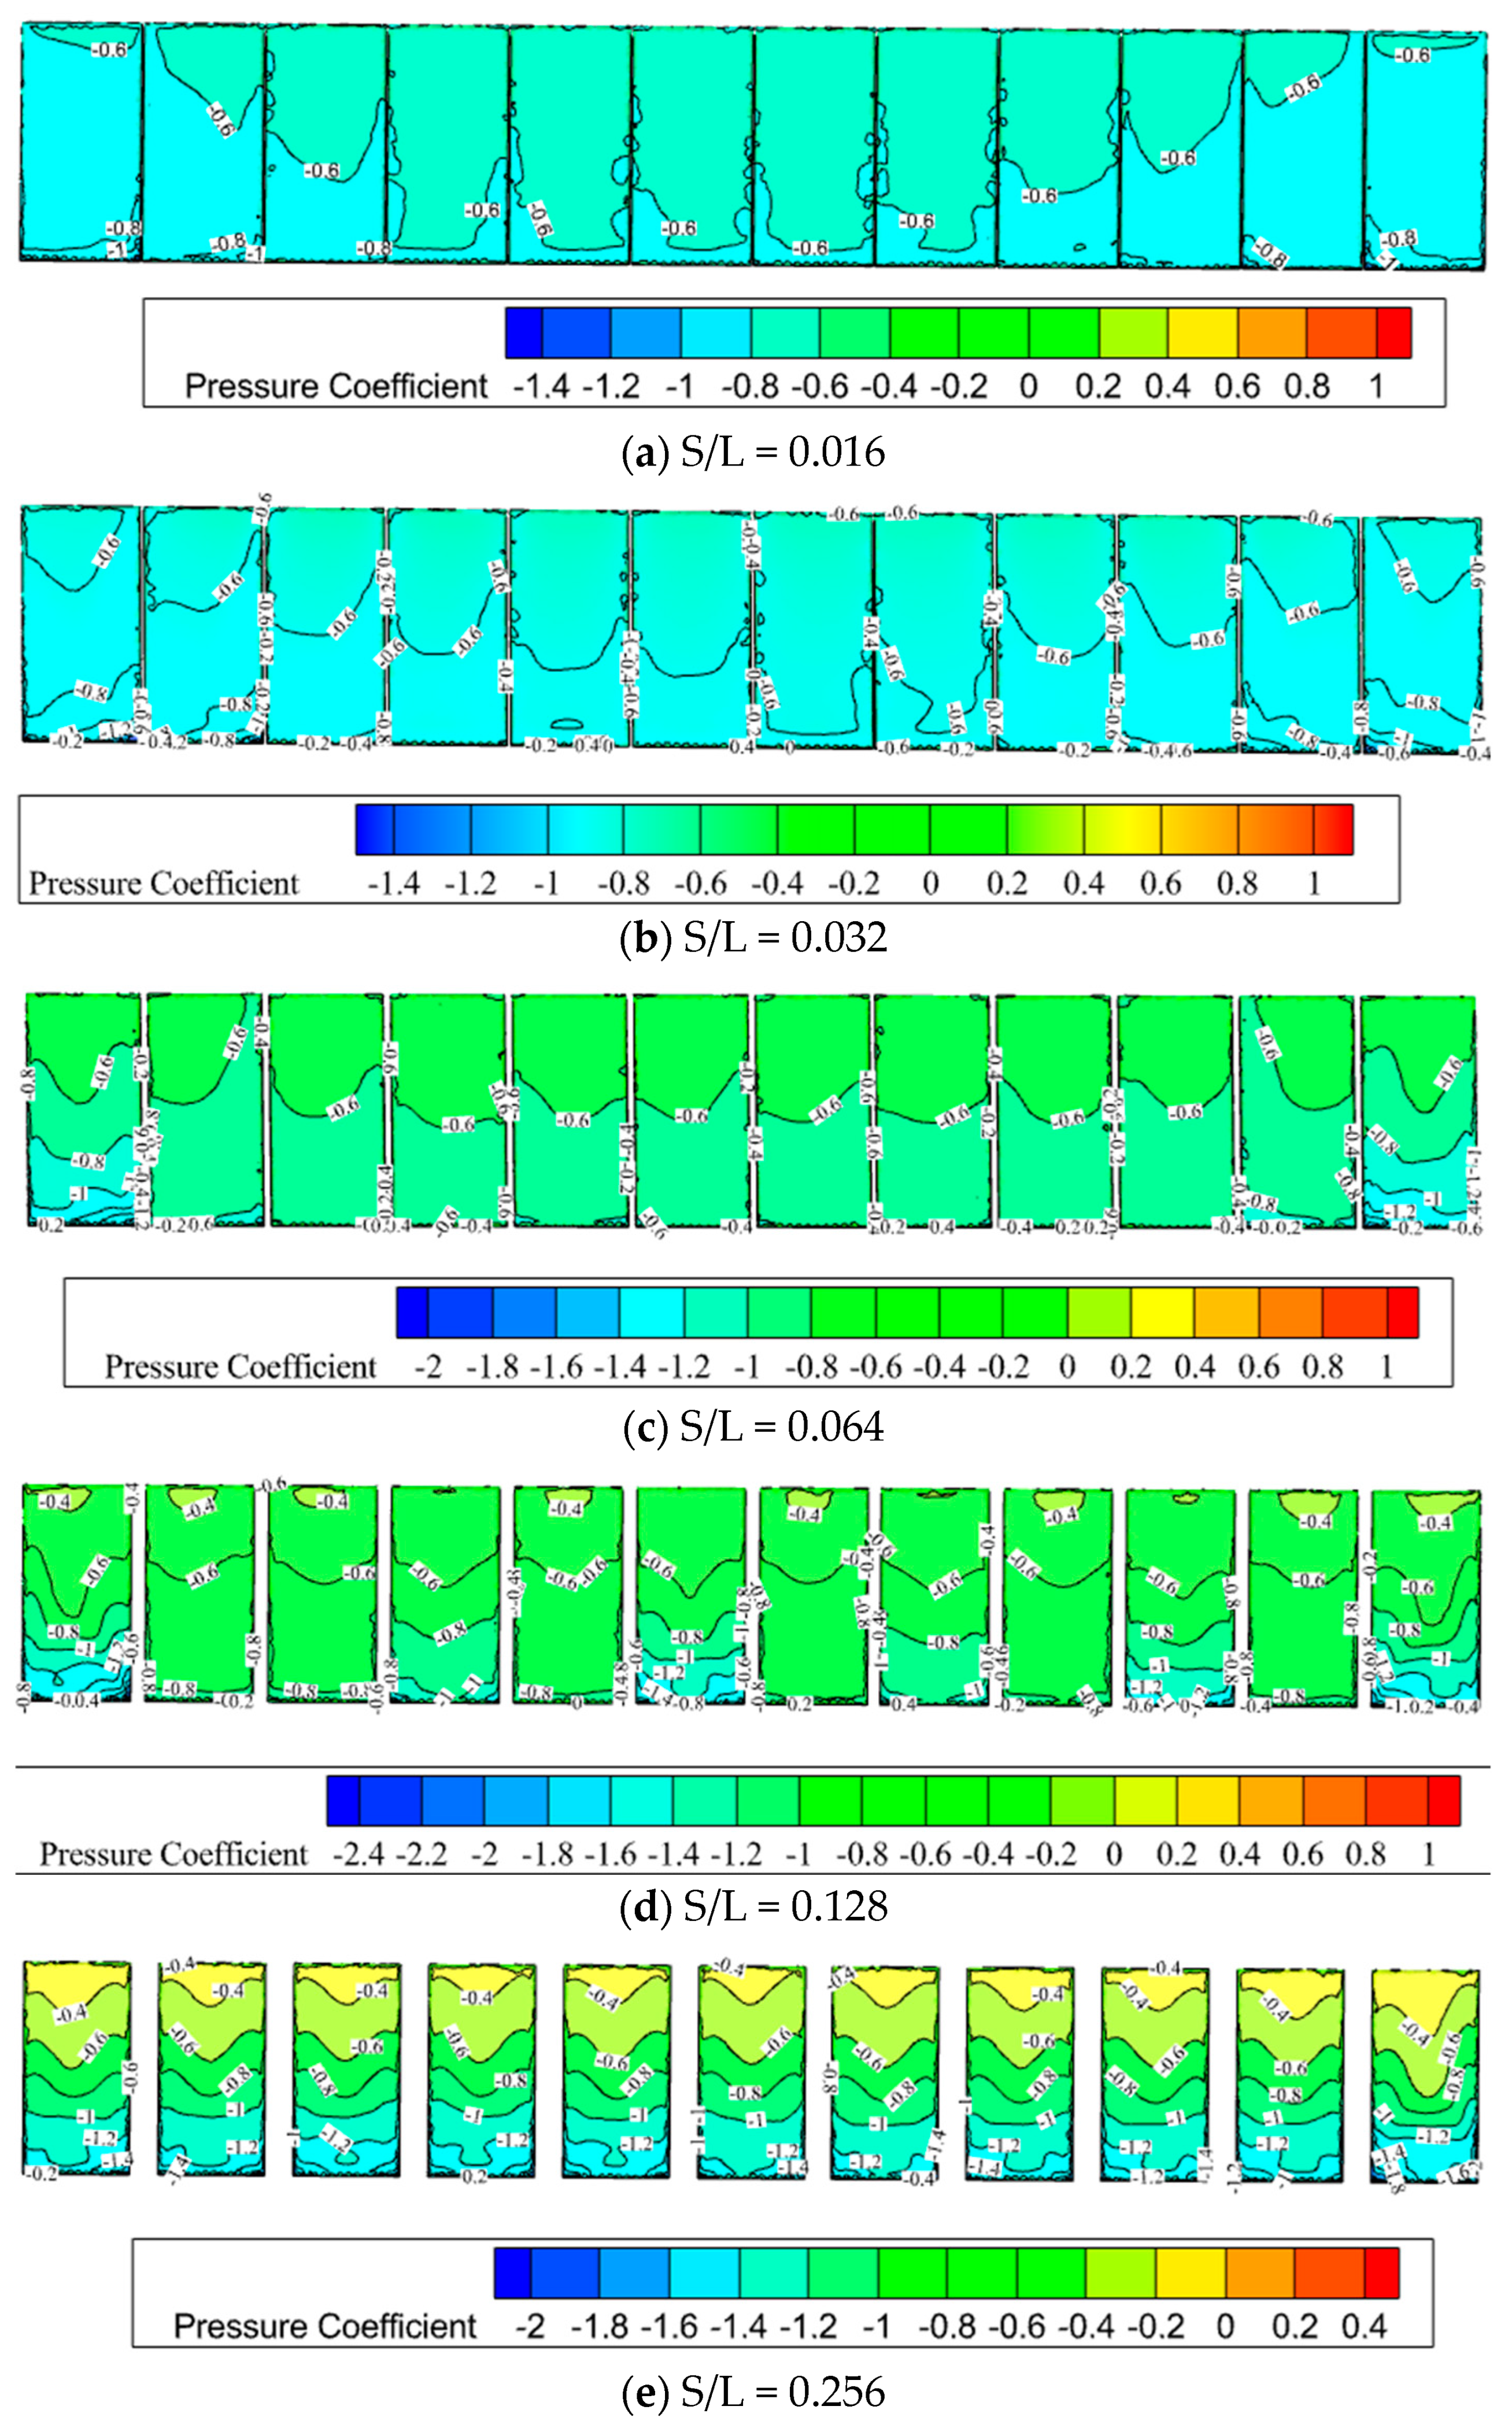
3.3. Effect of Flexible PV Panel Spacing Ratio on Wind Loads

In order to facilitate the analysis, Figure 10 depicts the variation in the shape coefficient of the first row of PV panels at different spacing ratios (S/L) and tilting angles under a wind angle of 0°. Similarly, Figure 11 illustrates the variation in the shape coefficient of the windward, leeward, and overall surfaces with the spacing ratios. Zhang Aishe et al. [31] posited that bypassing is the primary contributor to wind loads on PV modules. They observed that as the tilt angle increases at a given spacing, the three-dimensional bypassing effect intensifies, and the leeward side becomes more susceptible to wind loads. The shape coefficient of flexible PV panels increases with the increase in spacing ratio at a PV panel tilt angle of 30°. A spacing ratio of 0.016 was used as a baseline, and the shape coefficient of spacing ratios of 0.032, 0.064, 0.128, and 0.256 was found to increase by 2.7%, 4.23%, 15%, and 26.72%, respectively. This demonstrates that the spacing ratio exerts a more pronounced influence on the wind loads experienced by flexible PV panels when it exceeds 0.1. When the PV panel tilt angle is 10°, the wind load on both sides of the PV panel is relatively small, while the wind load on the middle of the PV panel is significant. This is because the spacing ratio of the impact is large when the spacing ratio is 0.064. However, as the spacing ratio increases due to the PV panels for this tilt angle, the side of the bypass is able to obtain the full flow, which reduces the impact of the wind load on the PV panel. The phenomenon of an increase in the spacing ratio is due to the fact that when the wind and PV module tilt direction angle is small, the wind is more likely to be from the top and bottom of the PV module bypass. This results in a reduction in the three-dimensional bypass effect. Conversely, a reduction in the spacing ratio makes the wind easier to flow from the side of the bypass, which in turn increases the three-dimensional bypass effect. When the tilt angle of the PV panel is 0°, the spacing ratio increases from 0.016 to 0.032, resulting in an overall shape coefficient of the PV module that is greater than that observed during the process of increasing from 0.032 to 0.256.
Given that the wind pressure distribution of PV panels remains relatively constant when the spacing ratio is unchanged (β = 0°), the wind pressure distributions of the windward and leeward sides of the first row of PV panels with β = 10° and β = 30° are presented, as illustrated in Figure. As illustrated in Figure 12, for the windward side of PV panels with β = 10°, the contour line of the wind pressure coefficient greater than or equal to 0.4 shifts from the top of the panels (upstream of the incoming direction of the flow) to the bottom of the panels with an increase in the spacing ratio. As illustrated in Figure 13, the maximum value of the wind pressure coefficient shifts from the bottom of the PV panel to the top of the PV panel. For the first row of PV panels with β = 0°, β = 10°, and β = 30°, the wind pressure coefficient of the middle PV panel is greater than that of the two sides of the PV panels. Furthermore, the distribution of the wind pressure coefficients of the two sides of the PV panels is more similar to that of the middle part of the PV panels as the spacing ratio increases due to the ease with which the fluid can flow on the two sides of the PV panels. As illustrated in Figure 14, the wind pressure coefficient contour on the leeward side of the PV panels with β = 10° exhibits minimal variation when the S/L ratio is varied from 0.016 to 0.128. However, a notable shift in the contour is observed when the S/L ratio is increased from 0.128 to 0.256, with the contour moving rapidly towards the top of the PV panels. As illustrated in Figure 15, for the leeward side of the PV panel with β = 30°, the wind pressure coefficient contour shifts from the bottom to the top of the PV panel as the spacing ratio increases.
Figure 16 shows the wind pressure distribution on the windward side of the bottom of the PV panels with β = 0°, β = 10°, and β = 30° under the tilt ratio of 0. It can be seen that for the PV panels with β = 0°, the negative value of the wind pressure coefficient decreases from the top to the bottom to 0 first. At 256, when it can be seen that for the PV panels with β = 0°, the negative value of the wind pressure coefficient first decreases to 0 from top to bottom and then increases to the maximum of the positive value of the wind pressure coefficient, and the maximum value of the wind pressure coefficient appears at about 20 mm at the bottom, which is about 1/120 of the total length of the single PV panel, as shown in Figure 16. By measuring the location of the maximum value of the wind pressure coefficient of all PV panels, it can be seen that the maximum value of the wind pressure coefficient occurs at the bottom of about 20 mm; that is, the total length of a single PV panel is 1/120. For β = 10° PV panels, the wind pressure coefficient increases from the top to the bottom, and the wind pressure coefficient decreases from the center to the sides. For β = 30° PV panels, the wind pressure coefficient increases from top to bottom and then decreases, and the positive value of the wind pressure coefficient decreases from the center to both sides to 0 first, and then the negative value gradually increases from 0. Measuring the location of the maximum value of all PV panels shows that the maximum value of the wind pressure coefficient occurs at about 15 mm up from the bottom, which is about 1/160 of the total length of a single PV panel.

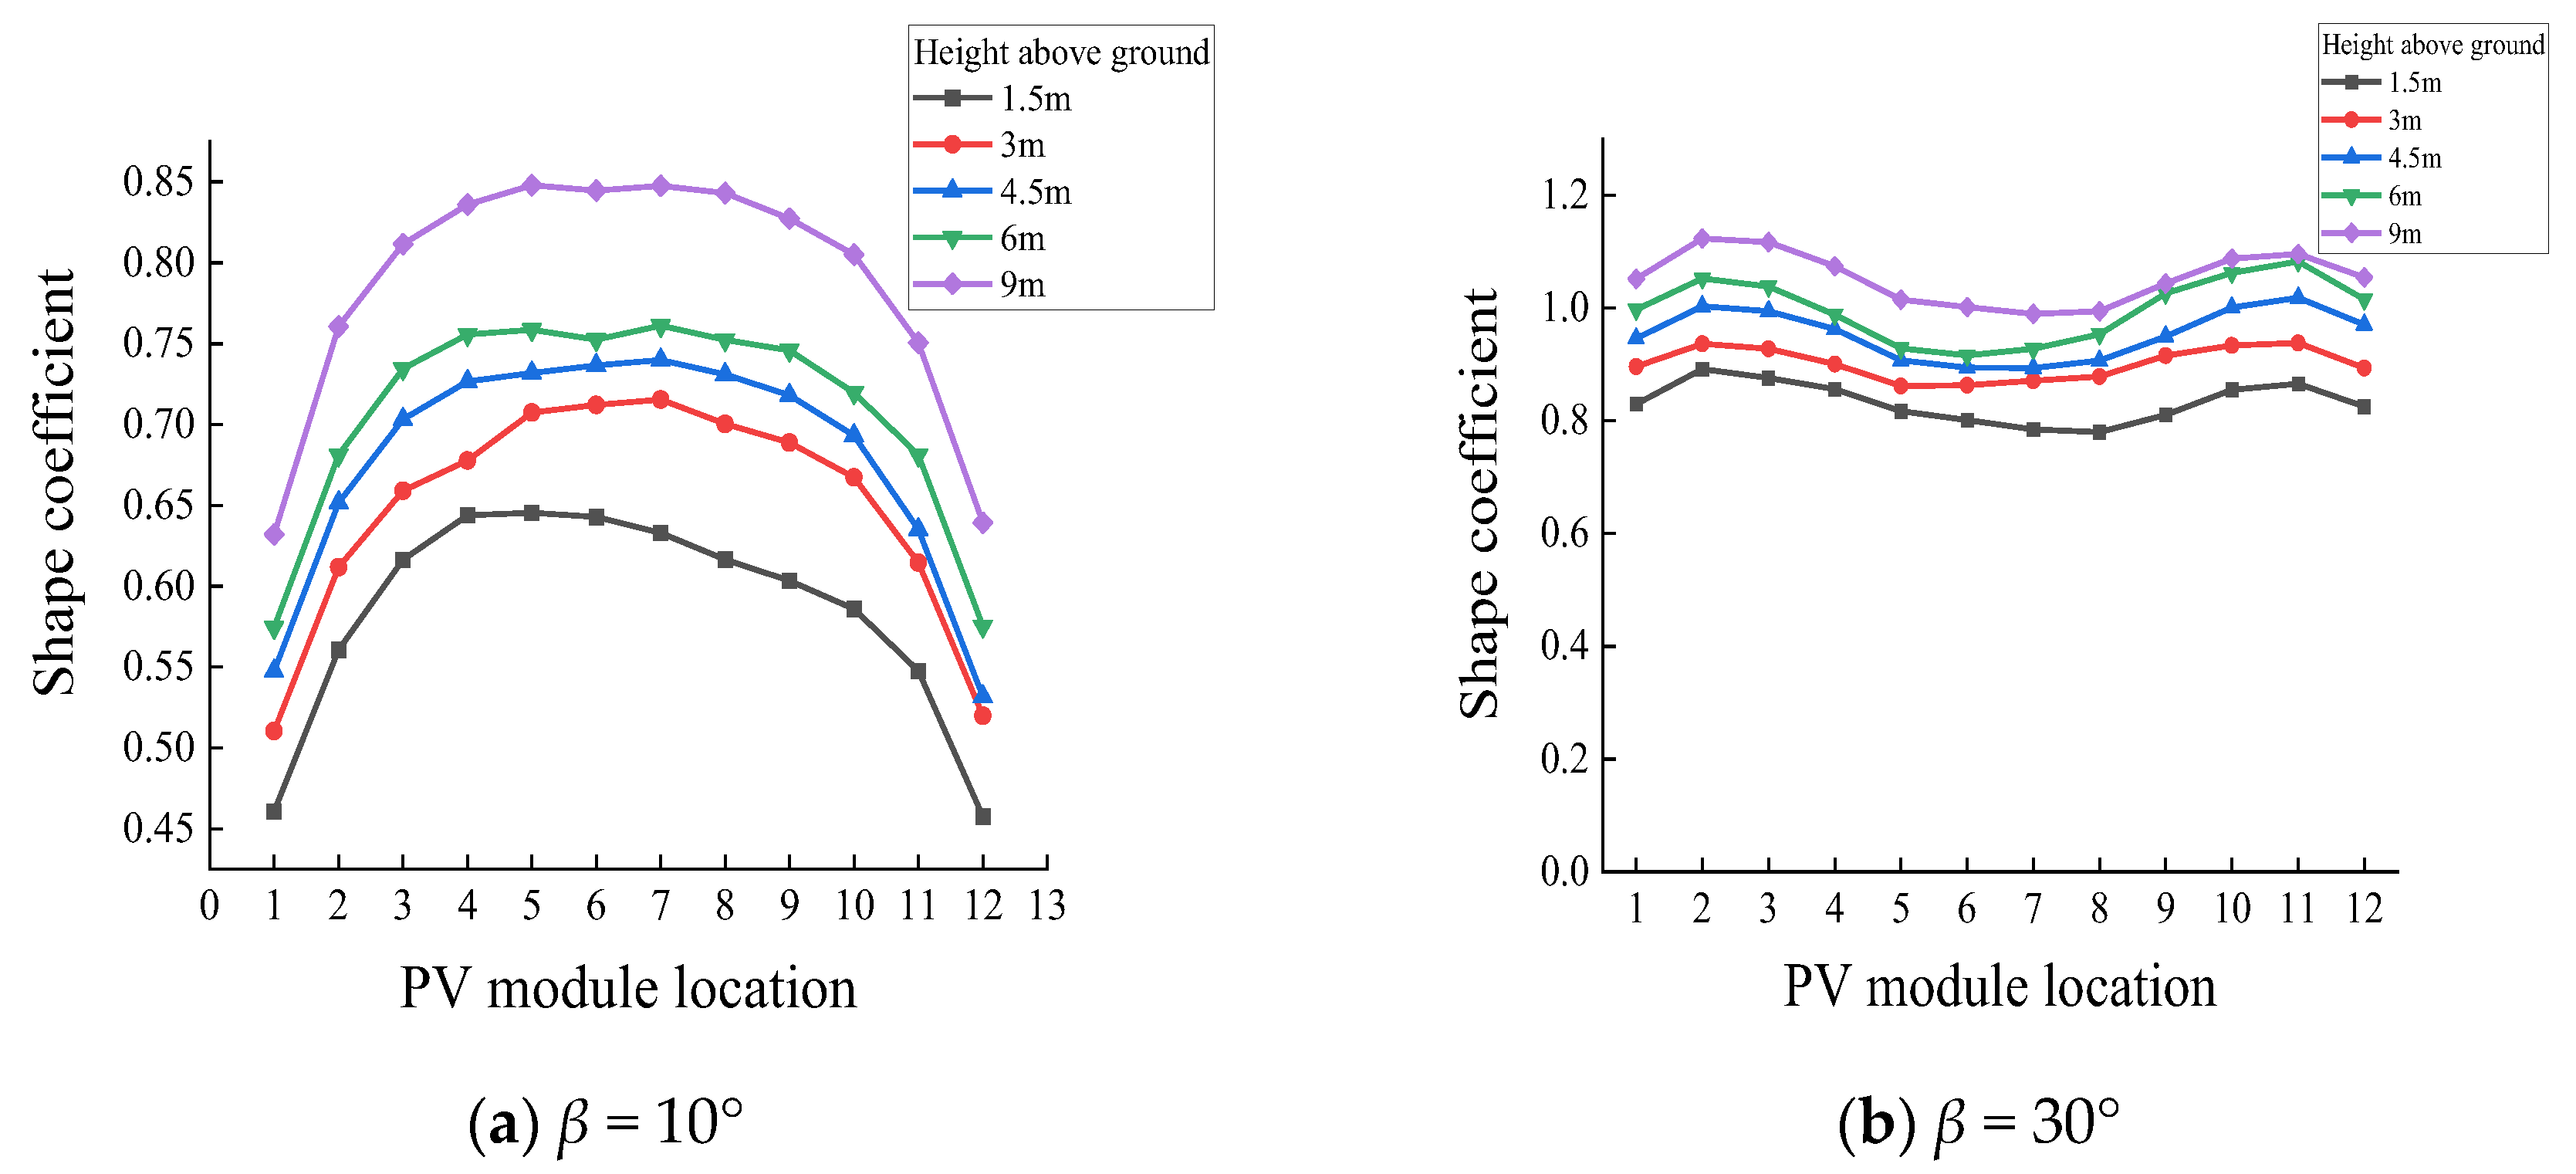
3.4. Effect of Height above Ground on Wind Loads

The Figure 17 displays alterations in the shape coefficients of the initial line of PV panels, with varying inclination angles of 10° and 30° and the wind angle set at 0°. The diagram reveals that as the wind moves closer to the ground, the ground friction increases, leading to a lower wind speed. As the height above the ground increases, the PV panels encounter larger wind loads, and this is shown in the diagram. The calculation shows that for every 1 m increase in height above ground, the PV panel shape coefficient increases by an average of 4% (Figure 17).

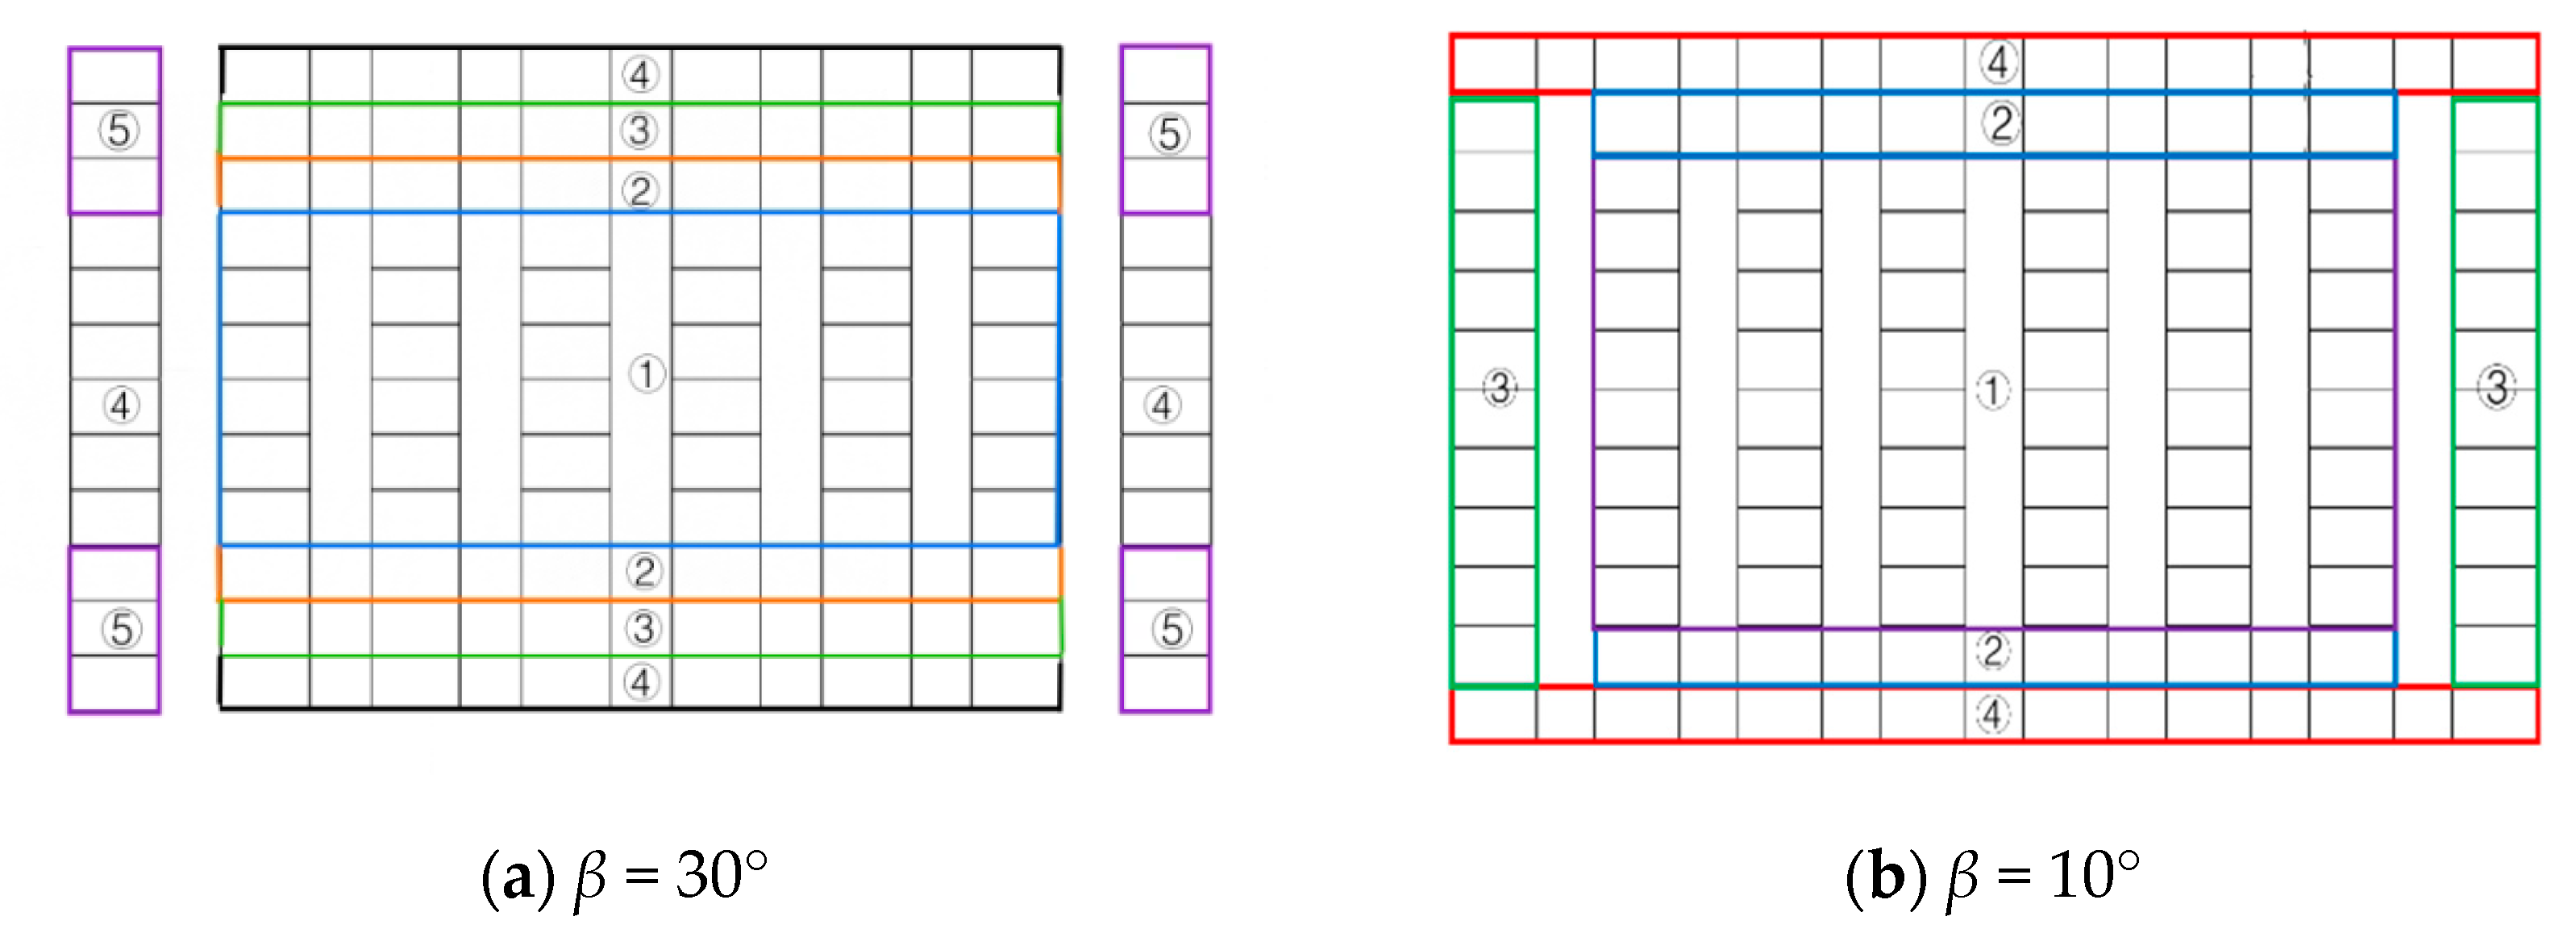
4. Optimization Recommendations for Wind Load Shape Coefficients in Different Regions of PV Panel Arrays

Based on the results obtained from the aforementioned numerical wind tunnel analysis, the following recommendations are provided for the division of regions and the corresponding wind load shape coefficient values for PV panel arrays with tilt angles of 10° and 30° under all wind direction angles. The different color divisions are the recommended values of the shape coefficient for the number corresponding to the region, as shown in Figure 18. At a tilt angle (β) of 30°, the maximum wind load on the PV panel array occurs in region 5, whereas at a tilt angle (β) of 10°, the maximum wind load occurs in region 4. These areas should be given special attention in wind-resistant design. Table 2 and Table 3 present the recommended shape coefficient values for PV arrays with tilt angles of 30° and 10°, respectively. Dividing the PV array into multiple regions and designing flexible PV supports according to these regions can meet wind resistance requirements while enhancing economic efficiency.
In order to improve the wind load standard value calculation formula given in the Structural Design Regulations for PV Racks (NB/T 10115-2018) [30], it is now supplemented with the introduction of the height coefficient μ1 based on the height above the ground in the range of 0–10 m, and the introduction of the spacing ratio coefficient μ2 based on the spacing ratio to the standard value of the wind load calculation formula, that is
ω k = C p β z μ 1 μ 2 ω k
ωk is standard value of wind load, kN/m2; Cp is the wind load shape coefficient; βz is the wind vibration coefficient at height z; μ1 is the height above ground coefficient, taking the height at 1.5 m as a reference (see Table 4); μ2 is spacing ratio coefficient, taking the spacing ratio 0.016 as a reference (see Table 5); ωk is basic wind pressure, kN/m2.

5. Conclusions

PV panel array clusters modeled in CAD and meshed in ICEM. Mesh-independence verification is then carried out, followed by case validation to ensure the accuracy of the method described in this paper. Numerical wind tunnel simulation analyses are conducted for the group of flexible support PV panel arrays with varying inclination angles, wind angles, off-ground heights, spacing ratios, and mountainous conditions in FLUENT. The results lead to the following main conclusions:
  • The maximum wind load shape coefficient for PV panels typically occurs near α = 30° or α = 150° on the windward-facing PV panels. The distribution pattern of wind load shape coefficients varies with different tilt angles of the PV panel arrays. Wind load increases almost linearly with the tilt angle, and the sensitivity of wind load to the tilt angle of the PV panels is greater than that of other parameters. In mountainous conditions, wind loads on the middle and upper sections of the PV panels should be prioritized. When designing flexible support structures, special attention should be paid to the impact of changes in the tilt angle on structural wind loads.
  • The spacing ratio significantly affects wind loads. The change in wind load shape coefficients with varying spacing ratios is inconsistent across different tilt angles. For PV panels with a tilt angle of β = 0°, the wind pressure distribution remains almost unaffected by changes in the spacing ratio. For β = 10° panels, the contour line where the wind pressure coefficient is greater than or equal to 0.4 shifts from the top (upstream direction) to the bottom of the PV panels as the spacing ratio increases. When β = 30°, the maximum wind pressure coefficient on both the windward and leeward sides shifts from the bottom to the top of the PV panels. The maximum wind pressure coefficient appears at the bottom for β = 0° and β = 10° but at the upper bottom region for β = 30°. Ground clearance height also affects wind loads, with higher clearance resulting in larger wind load shape coefficients. Both the spacing ratio and ground clearance height are critical factors in structural design.
  • When estimating wind loads on flexibly supported PV panels, factors such as wind direction angle, tilt angle, ground clearance height, spacing ratio, and location must be considered. The standard wind load estimation for flexible PV arrays can integrate the shape coefficient values for different regions provided in this study with the wind load standard calculation formula that accounts for ground clearance height and spacing ratio. This approach ensures safety while saving materials.

Author Contributions

Conceptualization, J.Z. and Y.L.; methodology, J.Z.; software, Y.L.; validation, Y.L. and J.Z.; formal analysis, J.Z.; investigation, Y.L.; resources, J.Z.; data curation, Y.L.; writing—original draft preparation, Y.L.; writing—review and editing, J.Z.; visualization, Y.L.; supervision, J.Z.; project administration, J.Z.; funding acquisition, J.Z. All authors have read and agreed to the published version of the manuscript.

Funding

This research was funded by the National Natural Science Foundation of China (Grant No. 51979130, 52201323).

Data Availability Statement

The data presented in this study are available upon request from the corresponding author.

Acknowledgments

The support of the funder is greatly appreciated.

Conflicts of Interest

The authors declare no conflicts of interest.

References

  1. Aly, A.; Bitsuamlak, G. Aerodynamics of ground-mounted solar panels: Test model scale effects. J. Wind Eng. Ind. Aerodyn. 2013, 123, 250–260. [Google Scholar] [CrossRef]
  2. Aly, A.; Bitsuamlak, G. Wind induced pressures on solar panels mounted on residential homes. J. Archit. Eng. 2014, 20, 04013003. [Google Scholar] [CrossRef]
  3. Kopp, G.A.; Banks, D. Use of wind tunnel test method for obtaining design wind loads on roof-mounted solar arrays. J. Struct. Eng. 2013, 139, 284–287. [Google Scholar] [CrossRef]
  4. Pratt, R.N.; Kopp, G.A. Velocity measurements around low-profile, tilted, solar arrays mounted on large flat-roofs, for wall normal wind directions. J. Wind Eng. Ind. Aerodyn. 2013, 123, 226–238. [Google Scholar] [CrossRef]
  5. Stathopoulos, T.; Zisis, I.; Xypnitou, E. Local and overall wind pressure and force coefficients for solar panels. J. Wind Eng. Ind. Aerodyn. 2014, 125, 195–206. [Google Scholar] [CrossRef]
  6. Warsido, W.P.; Bitsuamlak, G.T.; Barata, J. Influence of spacing parameters on the wind loading of solar array. J. Fluids Struct. 2014, 48, 295–315. [Google Scholar] [CrossRef]
  7. Ren, G.; Wan, J.; Liu, J.; Yu, D. Spatial and temporal assessments of complementarity for renewable energy resources in China. Energy 2019, 177, 262–275. [Google Scholar] [CrossRef]
  8. Wang, C.; Shuai, J.; Ding, L.; Lu, Y.; Chen, J. Comprehensive benefit evaluation of solar PV projects based on multi-criteria decision grey relation projection method: Evidence from 5 counties in China. Energy 2022, 238, 121654. [Google Scholar] [CrossRef]
  9. Shafique, M.; Luo, X.; Zuo, J. Photovoltaic-green roofs: A review of benefits, limitations, and trends. Sol. Energy 2020, 202, 485–497. [Google Scholar] [CrossRef]
  10. Trindade, A.; Cordeiro, L. Automated formal verification of stand-alone solar photovoltaic systems. Sol. Energy 2019, 193, 684–691. [Google Scholar] [CrossRef]
  11. Glick, A.; Smith, S.E.; Ali, N.; Bossuyt, J.; Recktenwald, G.; Calaf, M.; Cal, R.B. Influence of flow direction and turbulence intensity on heat transfer of utility-scale photovoltaic solar farms. Sol. Energy 2020, 207, 173–182. [Google Scholar] [CrossRef]
  12. Wittwer, A.R.; Podestá, J.M.; Castro, H.G.; Mroginski, J.L.; Marighetti, J.O.; De Bortoli, M.E.; Paz, R.R.; Mateo, F. Wind loading and its effects on photovoltaic modules: An experimental–Computational study to assess the stress on structures. Sol. Energy 2022, 240, 315–328. [Google Scholar] [CrossRef]
  13. Alrawashdeh, H.; Stathopoulos, T. Wind loading of rooftop PV panels cover plate: A codification-oriented study. J. Wind. Eng. Ind. Aerodyn. 2023, 240, 105489. [Google Scholar] [CrossRef]
  14. Dai, S.F.; Liu, H.J.; Yang, J.H.; Peng, H.Y. Wind loads on roof-mounted isolated solar panels of tall buildings through wind tunnel testing. Sol. Energy 2022, 231, 607–622. [Google Scholar] [CrossRef]
  15. Alrawashdeh, H.; Stathopoulos, T. Critical considerations for modeling roof mounted solar panels in atmospheric wind tunnels. In Proceedings of the 3rd International Conference Coordinating Engineering for Sustainability and Resilience (CESARE’22), Irbid, Jordan, 6–9 May 2022; Volume 1–10. [Google Scholar]
  16. Alrawashdeh, H.; Stathopoulos, T. Experimental investigation of the wind loading on solar panels: Effects of clearance off flat roofs. J. Struct. Eng. 2022, 148, 04022202. [Google Scholar] [CrossRef]
  17. Ghazal, T.; Elshaer, A.; Aboshosha, H. Wind load evaluation on storm shelters using wind tunnel testing and North American design codes. Eng. Struct. 2022, 254, 113821. [Google Scholar] [CrossRef]
  18. Ghazal, T.; Aboutabikh, M.; Aboshosha, H.; Abdelwahab, M. Thunderstorm wind load evaluation on storm shelters using wind tunnel testing. Eng. Struct. 2022, 262, 114350. [Google Scholar] [CrossRef]
  19. Valentín, D.; Valero, C.; Egusquiza, M.; Presas, A. Failure investigation of a solar tracker due to wind-induced torsional galloping. Eng. Fail. Anal. 2022, 135, 106137. [Google Scholar] [CrossRef]
  20. Martínez-García, E.; Blanco-Marigorta, E.; Gayo, J.P.; Navarro-Manso, A. Influence of inertia and aspect ratio on the torsional galloping of single-axis solar trackers. Eng. Struct. 2021, 243, 112682. [Google Scholar] [CrossRef]
  21. Winkelmann, U.; Kämper, C.; Höffer, R.; Forman, P.; Ahrens, M.A.; Mark, P. Wind actions on large-aperture parabolic trough solar collectors: Wind tunnel tests and structural analysis. Renew. Energy 2020, 146, 2390–2407. [Google Scholar] [CrossRef]
  22. Browne, M.T.L.; Taylor, Z.J.; Li, S.; Gamble, S. A wind load design method for ground-mounted multi-row solar arrays based on a compilation of wind tunnel experiments. J. Wind Eng. Ind. Aerod. 2020, 205, 104294. [Google Scholar] [CrossRef]
  23. Xu, A.; Ma, W.; Yuan, H.; Lu, L. The effects of row spacing and ground clearance on the wind load of photovoltaic (PV) arrays. Renew. Energy 2024, 220, 119627. [Google Scholar] [CrossRef]
  24. Yemenici, O.; Aksoy, M.O. An experimental and numerical study of wind effects on a ground-mounted solar panel at different panel tilt angles and wind directions. J. Wind. Eng. Ind. Aerodyn. 2021, 213, 104630. [Google Scholar] [CrossRef]
  25. Yang, Y.; Gu, M.; Chen, S.; Jin, X. New inflow boundary conditions for modelling the neutral equilibrium atmospheric boundary layer in computational wind engineering. J. Wind Eng. Ind. Aerod. 2009, 97, 88–95. [Google Scholar] [CrossRef]
  26. GB 50009-2012; Building Structural Load Specification. Ministry of Housing and Urban-Rural Construction of the People’s Republic of China: Beijing, China, 2012.
  27. Ye, L.; He, T.; Zhang, X.; Sun, S.; Li, B.; Wang, M. Research on influence of sunlight incident angle difference on power generation capacity of vertically installed PV modules on the facade in different climate zones. Sol. Energy 2023, 1, 35–42. [Google Scholar] [CrossRef]
  28. Du, H.; Xu, H.W.; Zhang, Y.L.; Lou, W.J. Wind pressure characteristics and wind vibration response of large-span flexible photovoltaic bracket structure. J. Harbin Inst. Technol. 2022, 54, 67–74. [Google Scholar]
  29. Ma, W.; Chai, X.; Liu, Q.; Xing, K.; Liu, X. Study on effect of bottom flow obstruction on wind load of solar photovoltaic panels. Build. Struct. 2019, 49, 129–134. [Google Scholar]
  30. NB/T 10115—2018; Code for Structural Design of Photovoltaic Support. Inner Mongolia Electric Power Survey and Design Institute Co., Ltd.: Beijing, China, 2018.
  31. Zhang, A.; Gao, C.; Shen, C.; Zhang, B. Numerical analysis of wind load characteristics of photovoltaic panels mounted on a roof. Chin. J. Comput. Mech. 2016, 33, 683–688, 737. [Google Scholar]
Figure 1. Definition of parameters.
Buildings 14 01677 g001
Figure 2. The effect of different mesh numbers on the shape coefficients of the first row PV modules.
Buildings 14 01677 g002
Figure 3. The variation of shape coefficients for PV modules P1, P2, P3, P4 with wind direction angle.
Buildings 14 01677 g003
Figure 4. Shape coefficients of PV arrays for a population at β = 0° with regards to varying wind angle effects.
Buildings 14 01677 g004
Figure 5. Shape coefficients of PV arrays for a population at β = 10° with regards to varying wind angle effects.
Buildings 14 01677 g005
Figure 6. Shape coefficients of PV arrays for a population at β = 30° with regards to varying wind angle effects.
Buildings 14 01677 g006aBuildings 14 01677 g006b
Figure 7. Shape coefficients of PV arrays under different wind directions in mountain conditions.
Buildings 14 01677 g007aBuildings 14 01677 g007b
Figure 8. The variation of PV module shape coefficients with inclination angle.
Buildings 14 01677 g008
Figure 9. Changes in shape coefficients of different PV panel angles with position at a 0° wind direction angle.
Buildings 14 01677 g009
Figure 10. The variation of the shape coefficient of photovoltaic panels with different spacing ratios with the position of PV modules.
Buildings 14 01677 g010
Figure 11. The variation of the windward, leeward, and overall shape coefficient with spacing ratio.
Buildings 14 01677 g011
Figure 12. Distribution of wind pressure coefficients on the windward side of PV panels with different spacing ratios (β = 10°).
Buildings 14 01677 g012
Figure 13. Distribution of wind pressure coefficients on the windward side of PV panels with different spacing ratios (β = 30°).
Buildings 14 01677 g013
Figure 14. Distribution of wind pressure coefficients on the leeward side of PV panels at different spacing ratios (β = 10°).
Buildings 14 01677 g014
Figure 15. Distribution of wind pressure coefficients on the leeward side of PV panels at different spacing ratios (β = 30°).
Buildings 14 01677 g015
Figure 16. Wind pressure coefficient distribution at the bottom of the windward face of PV panels at varying tilt angles (S/L = 0.256).
Buildings 14 01677 g016
Figure 17. The variation of the aerodynamic shape coefficient of the first row of PV panels at different heights above the ground when β = 10°, β = 30°, and α = 0°.
Buildings 14 01677 g017
Figure 18. Regional division of shape coefficients for PV panel arrays with tilt angles of 30° and 10°.
Buildings 14 01677 g018
Table 1. Comparison of wind load shape coefficients.
Drift Angle αShape Coefficientsβ ≤ 15°β = 30°
Simulation value0.600.88
Standardised value0.801.00
180°Simulation value−0.59−0.95
180°Standardised value−0.95−1.31
Table 2. Recommended shape coefficient values for different regions of PV panel arrays with a tilt angle of 30°.
TiltRegion1Region2Region3Region4Region5
30°0.400.350.501.000.90
Table 3. Recommended shape coefficient values for different regions of PV panel arrays with a tilt angle of 10°.
TiltRegion1Region2Region3Region4
10°0.370.500.700.95
Table 4. Height coefficient.
Heights H3 m4.5 m6 m9 m
Tilt10°1.1091.0461.0431.113
β30°1.0831.0581.0471.055
Table 5. Spacing ratio coefficient.
Spacing Ratio0.0320.0640.1280.256
Tilt10°1.0271.0421.151.267
β30°0.9920.9640.8890.718
Disclaimer/Publisher’s Note: The statements, opinions and data contained in all publications are solely those of the individual author(s) and contributor(s) and not of MDPI and/or the editor(s). MDPI and/or the editor(s) disclaim responsibility for any injury to people or property resulting from any ideas, methods, instructions or products referred to in the content.

