Article

Bearing Characteristics with Effect of Bond–Slip Behavior in Massive Ring-Type Reinforced Concrete Structures

1
State Key Laboratory of Water Resources Engineering and Management, Wuhan University, Wuhan 430072, China
2
Key Laboratory of Rock and Soil Mechanics and Engineering, Changjiang River Scientific Research Institute, Wuhan 430010, China
*
Author to whom correspondence should be addressed.
Buildings 2024, 14(5), 1332; https://doi.org/10.3390/buildings14051332
Submission received: 21 March 2024 / Revised: 6 May 2024 / Accepted: 7 May 2024 / Published: 8 May 2024
(This article belongs to the Section Building Structures)

Abstract

:
The bond–slip behavior of the steel–concrete interface is critical in reinforced concrete (RC) structures since the bond action is the mechanism that ensures the two materials work in co-operation. However, there is little research considering the bond–slip behavior in massive ring-type reinforced concrete (MRRC) structure bearing analyses due to the complexity of modeling the interfacial behavior. Hence, the influence of the bond–slip behavior on the bearing characteristics of MRRC structures remains unclear. Steel-lined reinforced concrete penstock is such an MRRC structure, composed of steel liner and reinforced concrete and commonly used in diversion pipelines. This paper aims to explore the bearing characteristics considering the bond–slip behavior in the composite penstock by using a promising numerical method, the cohesive zone model. Three interface models were proposed to represent the different interaction conditions at the steel–concrete interface. Moreover, a sensitivity analysis was performed to study the impact of the bond strength on the bond performance and structural behavior. The simulation results showed that the prediction results (steel stress and crack process) considering the bond–slip behavior were in good agreement with the experimental results. The steel stresses near the cracks were smaller and more uniform after considering the bond–slip behavior, since the stresses were no longer concentrated on the crack but distributed in an area near the crack. However, the steel stress differences in these models were within 10%, which means that the bond performance had a limited effect on the structural safety design. The crack widths were greatly influenced by the bond conditions, and the maximum crack width (0.461 mm) in poor conditions was beyond the limiting value (0.3 mm). Consequently, bond–slip behavior must be paid more attention in durability design.

1. Introduction

Over the past decades, reinforced concrete structures have been the most commonly used structures in civil engineering. Steel-lined reinforced concrete penstock (SLRCP) is broadly utilized in high-water-head and large-diameter diversion pipelines for its high safety and low cost [1]. The pressure is shared by the reinforced concrete and steel liner (as shown in Figure 1), which improves the bearing capacity of the penstock and prolongs its service life [2,3]. Increasing numbers of studies [4,5,6] have been conducted to understand the bearing mechanism of massive ring-type reinforced concrete structures (MRRCs). The intricate interplay between materials has a profound impact on its structural performance and longevity, making it imperative to take into account the bond–slip behavior for accurate predictions in various aspects, such as crack formation, stress distribution, and deformation [7,8]. However, due to the complexities associated with modeling the bond effects, the majority of existing studies overlook the bond–slip behavior. Given that the behavior of reinforced concrete (RC) structures is inherently influenced by the bond–slip mechanism [9,10], it is crucial to develop a thorough understanding of the bearing characteristics in MRRC structures, taking into account the bond performance. This will ensure more accurate predictions and enhance the safety and durability of these structures.
Existing studies [11,12] indicate that considering the bond–slip performance is crucial for accurately predicting the behavior of RC structures, including crack spacing, crack widths, stress, and deformation. Tang et al. [11] found that the bond–slip behavior has a significant effect on the mechanical and seismic performance of the structure and crack members. Casanova et al. [12] proposed a new finite element approach to simulate the effects of steel–concrete bonding, revealing that cracking in RC structures was generally influenced by the stress distribution along the interface between steel and concrete. However, the literature mainly focuses on small beam and column structures [13,14,15], while the mechanisms controlling the bond behavior of MRRC structures differ from those of conventional structures, and there is limited research considering the bond–slip behavior of the steel–concrete interface of MRRC structures. Due to the importance of the bond–slip property, a thorough study on the bond–slip performance of MRRC structures needs to be conducted.
The bond performance, as determined by the bond–slip relationship, is influenced by many factors [16,17]. However, there is a scarcity of experimental data available on the interaction between the stresses and displacements [18]. Consequently, comprehensively understanding the effects of all these factors on the bond behavior solely through laboratory tests becomes challenging. Moreover, due to the high cost associated with model testing massive reinforced concrete structures, the finite element method is utilized to model the bond–slip behavior of MRRC structures in this paper. Different models exist to simulate the bond–slip behavior at the steel–concrete interface. The spring elements, proposed by Ngo and Scordelis [19], are introduced at the steel–concrete interface to model the bond–slip behavior with a linear bond–slip law. To improve the simulation of this bond behavior, zero thickness elements [20,21] using nonlinear bond–slip laws are embedded at the interface between the steel and concrete. Finally, both the material behavior and bond behavior are simulated within a single element with a high accuracy and effectivity [22]. The cohesive zone model (CZM) is an innovative approach that addresses predicting bond–slip behavior issues [23,24]. Cohesive elements, automatically generated at the steel–concrete interface in ABAQUS using a separation–traction law, effectively simulate the bond–slip performance and prove more suitable for large-scale structures like MRRCs.
The objective of this paper is to utilize the CZM numerical simulation model, which shows promise, in order to gain insights into the bearing characteristics of MRRC structures such as SLRCP while considering the bond–slip behavior. In particular, three different interface finite models are implemented to analyze the conditions of interface interaction and further investigate the influence of the bond strength on the bearing mechanism. Additionally, experimental results obtained from a 1:2 large-scale prototype model of the Three Gorges Hydropower Station are used for validation purposes. The novelty of this research is the application of the cohesive model to elucidate the mechanical response at the steel reinforcement to the concrete interface within pipes, as well as its influence on the load-bearing capacity and cracking behavior. However, there is a limitation in the lack of experimental validation of the bond–slip constitutive model of the pipe. Future work will focus on supplementing this aspect.

2. Theoretical Models

2.1. Modeling of Crack Model

The discrete crack model and smeared crack model are commonly used in FE simulations for cracking analyses of RC structures [25]. The discrete crack model can directly model the material separation process, since it simulates the fracture as a discontinuity [26]. However, the process needs element re-meshing and node re-numbering at each iteration step to follow the crack formation, limiting its applicability [27]. On the other hand, the smeared crack model treats the concrete as a continuum body and models the crack by changing the constitutive properties of the element [28]. This approach avoids the need to iteratively generate crack elements to simulate the crack formation and propagation, thus reducing the computational overhead [29]. Therefore, the smeared crack model is adopted in this study.

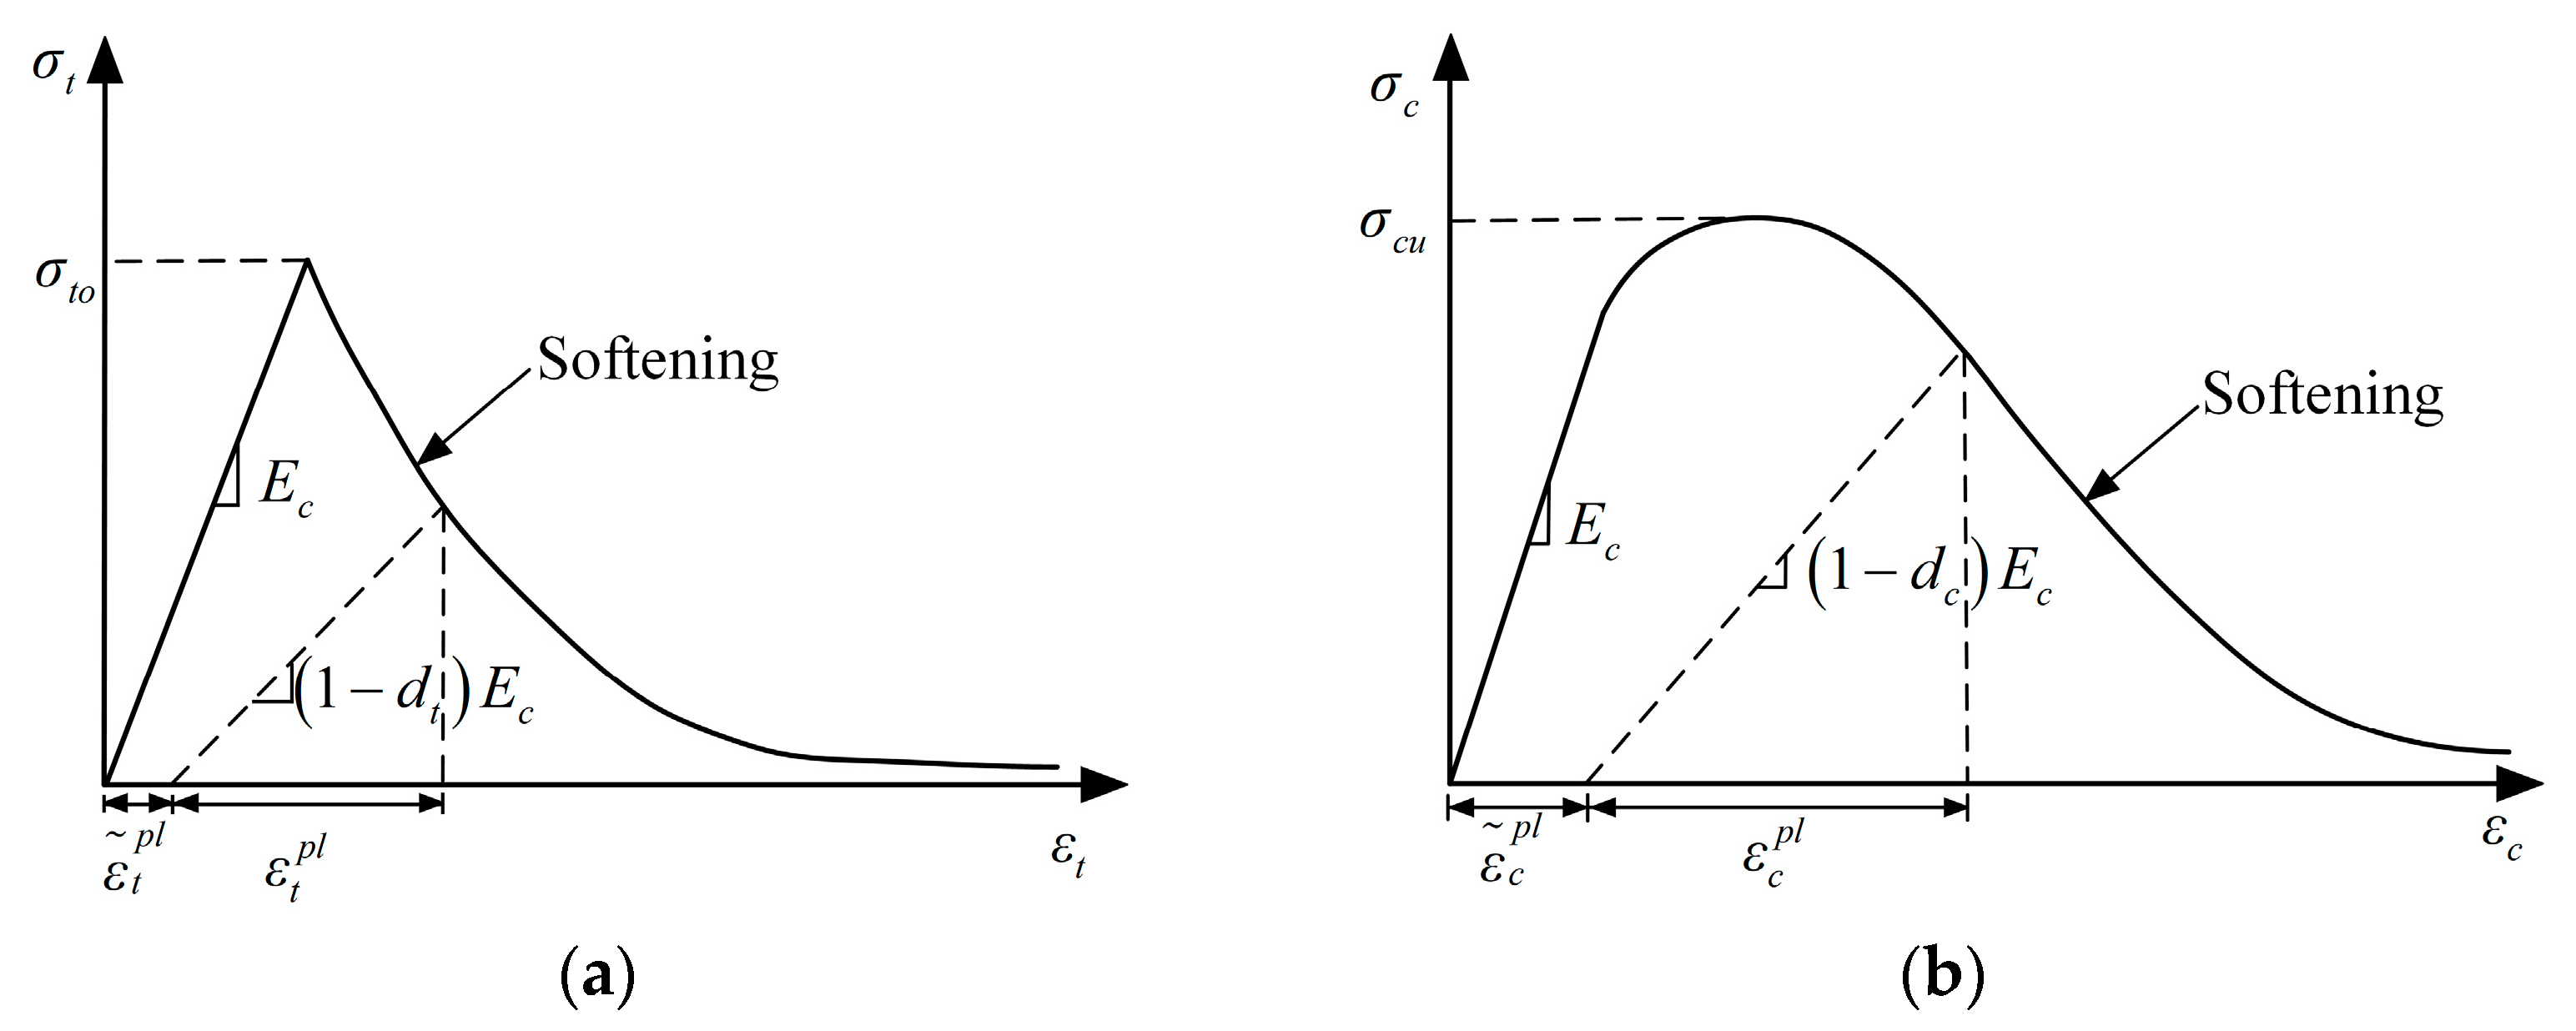
2.2. Modeling of Concrete

Many constitutive models have been proposed to describe the quasi-brittle behavior of concrete in ABAQUS 2016, particularly for reinforced concrete [30,31]. The concrete behavior is brittle, which is properly represented by damage models, while the steel behavior is ductile, which is suitable for plasticity models [32,33]. Hence, the concrete subjected to confinement pressure can be better simulated with models that combine plasticity and damage [34]. The concrete damage plasticity model (CDPM) is successful in predicting the cracking behavior of the reinforced concrete in ABAQUS by coupling the plasticity and damage characteristics [31]. In CDPM, concepts such as isotropic damaged elasticity and isotropic tensile and compressive plasticity are utilized to represent the inelastic behavior of concrete. The theory of CDPM is illustrated in Figure 2.
The tensile ( σ t ) or compressive ( σ c ) stress for concrete structures under uniaxial stress can be expressed as plastic strain ( ε ˜ t p l or ε ˜ c p l ) and plastic strain rate ( ε · t p l or ε · c p l ):
σ t = σ t ( ε ˜ t p l , ε · t p l )
σ c = σ c ( ε ˜ c p l , ε · c p l )
The damage variable under a uniaxial stress state dt or dc can be expressed as increasing functions of the equivalent plastic strain as follows:
d t = d t ( ε ˜ t p l ) ,   0 d t 1
d c = d c ( ε ˜ c p l ) ,   0 d c 1

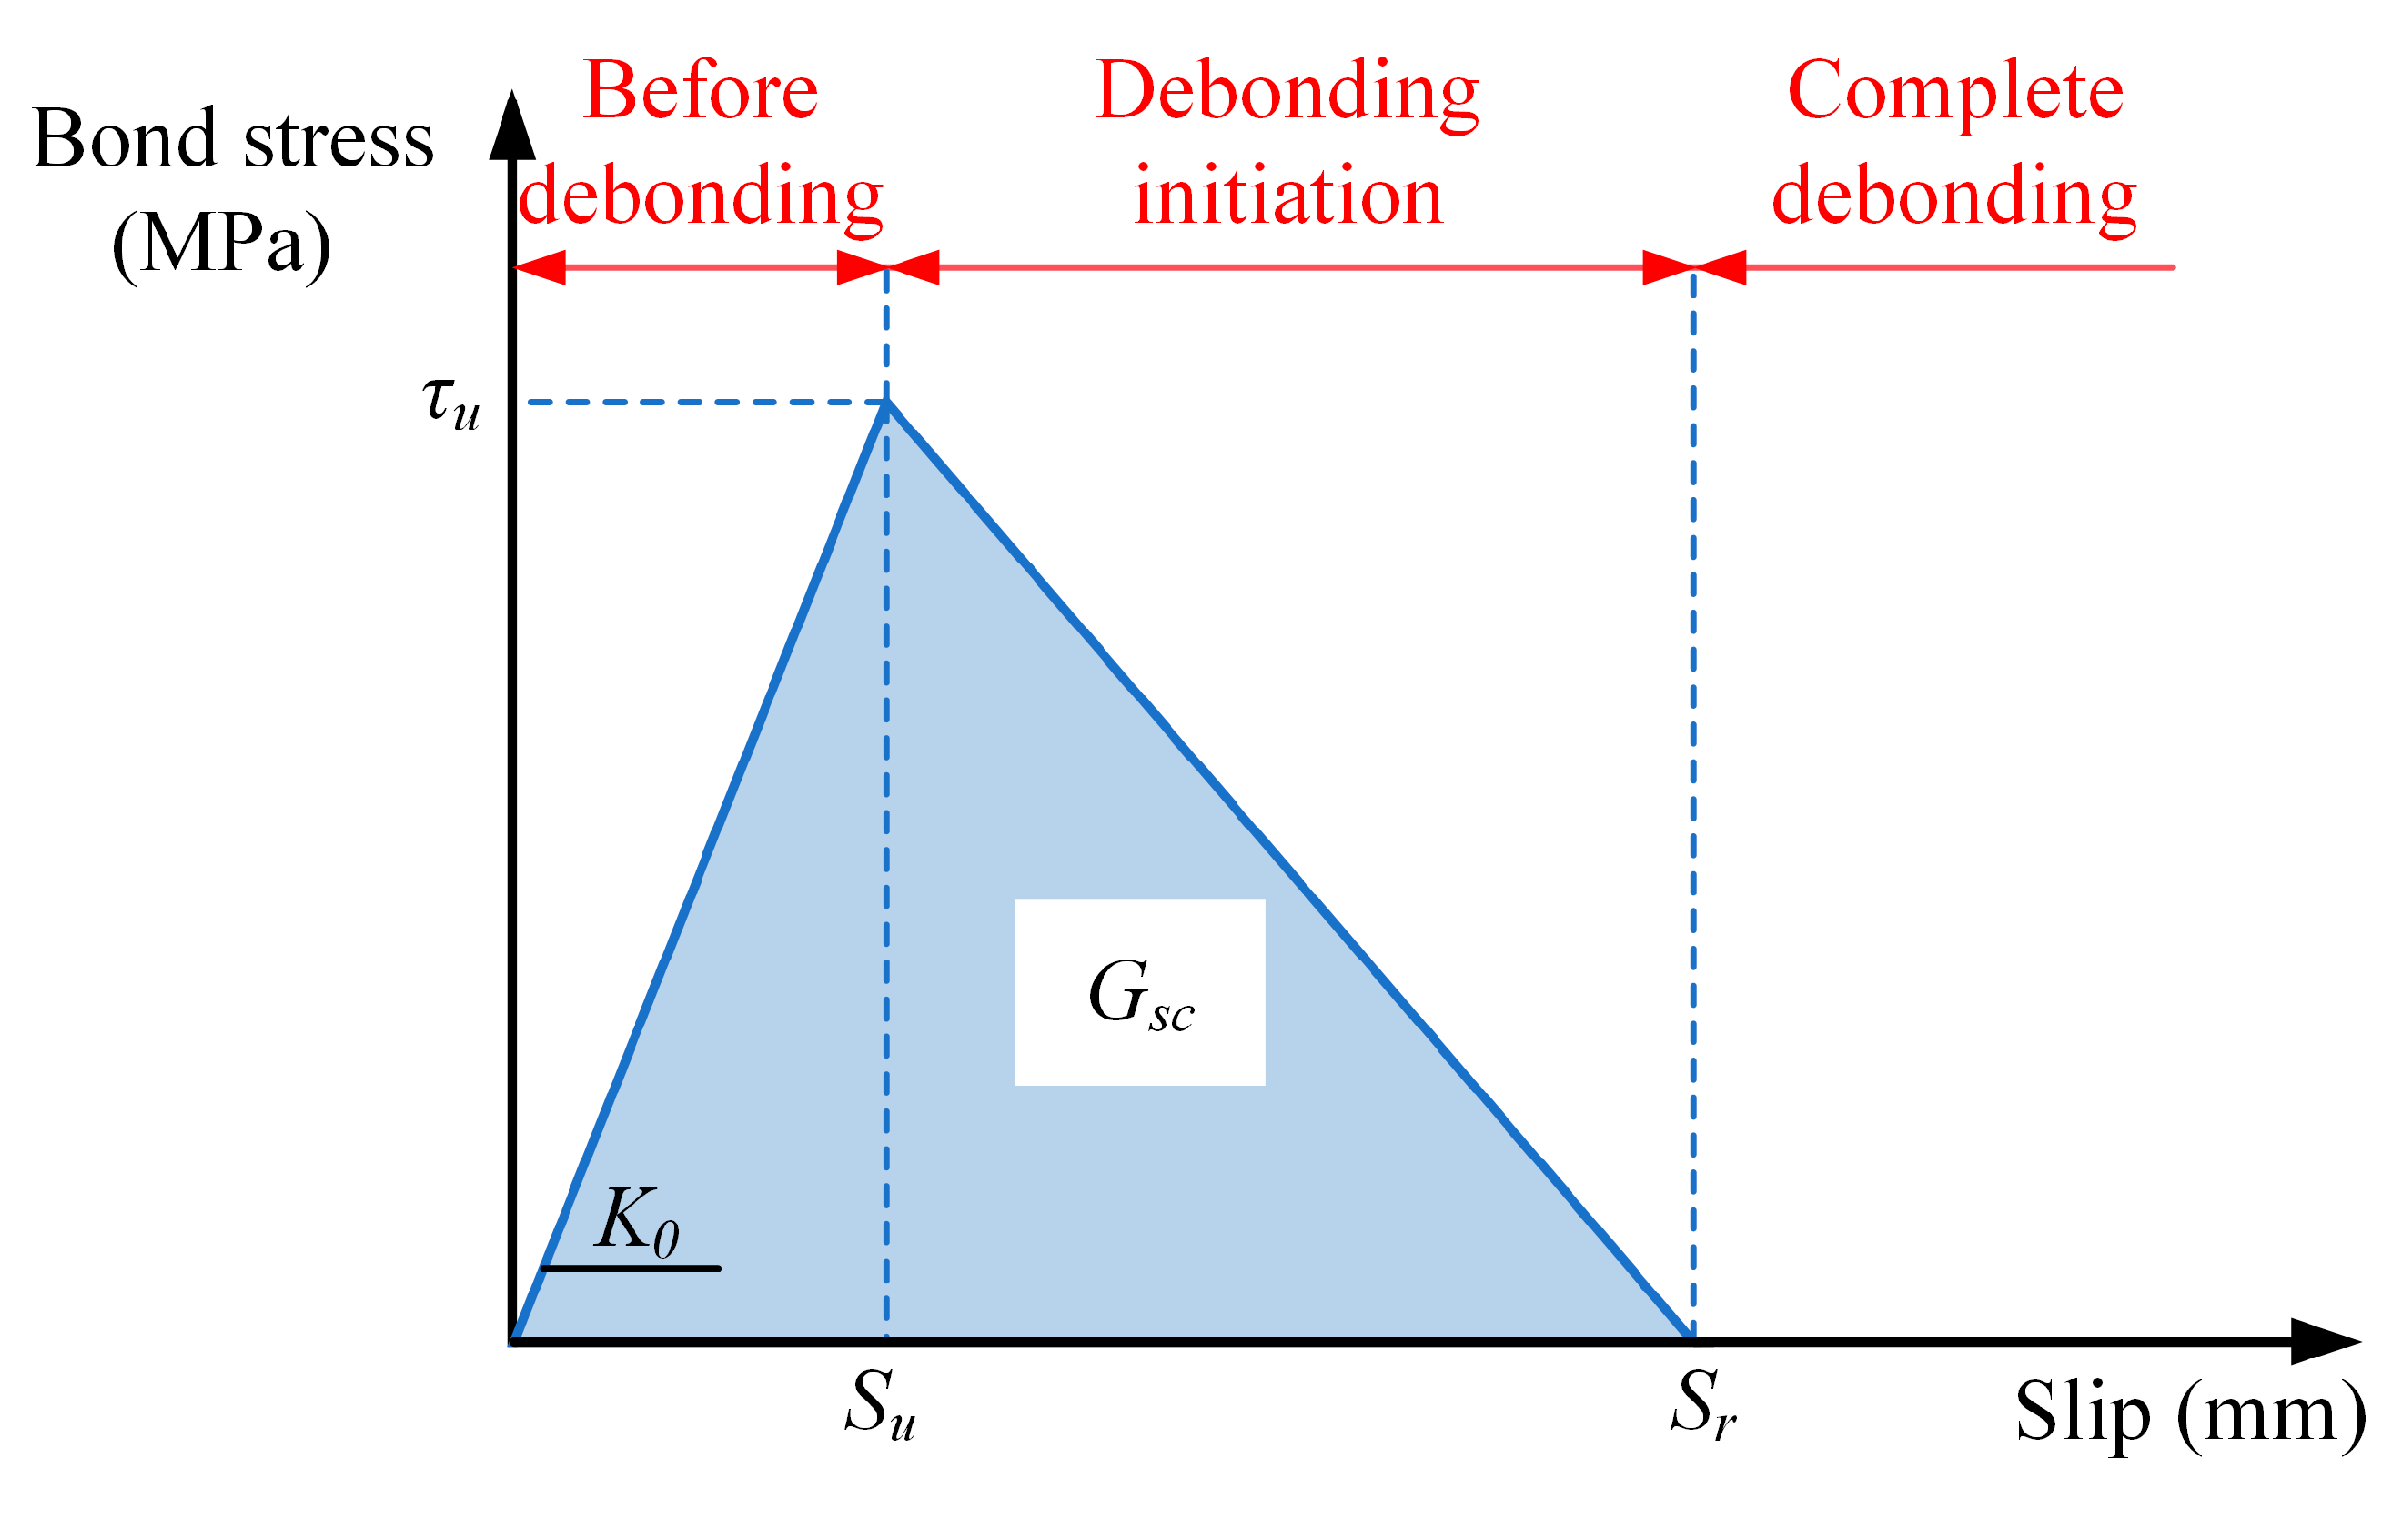
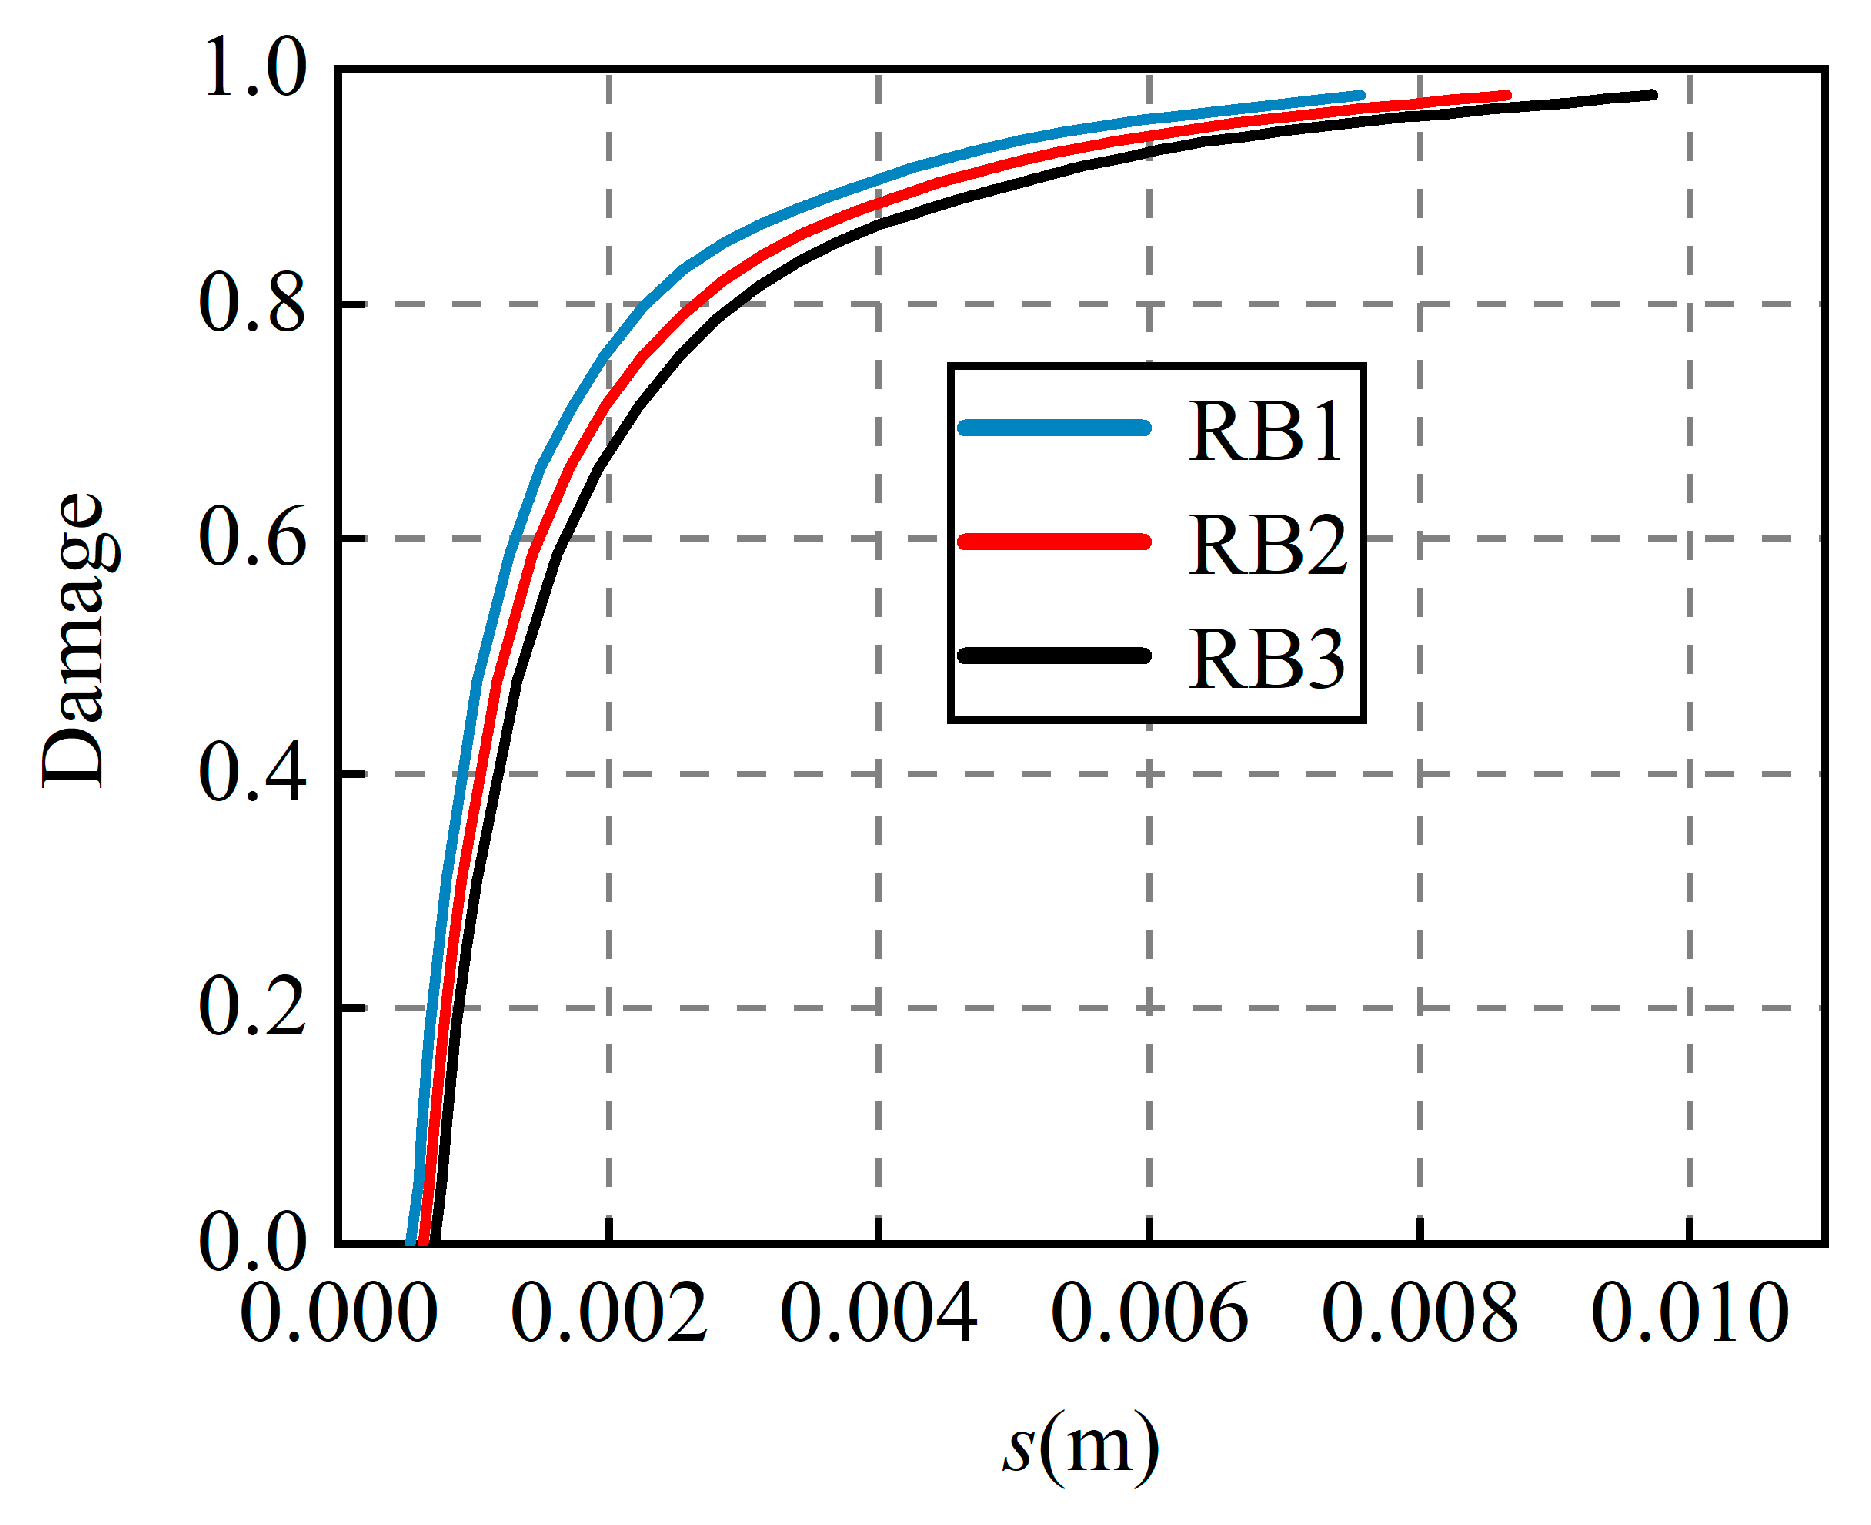
2.3. Modeling of Bond–Slip Behavior at the Concrete–Reinforcing Bar Interface

Different models exist to represent the steel–concrete bond behavior in FE software [12]. Among these, the cohesive zone model (CZM) stands out as one of the most promising methods for simulating fracture issues across various materials due to its simplicity and time efficiency. This model characterizes the traction–separation relationship within the fracture process zone until a fracture occurs and new free surfaces emerge to simulate the interfacial bond failure [35,36,37]. This process can be easily implemented in finite element software by introducing cohesive elements at the interfaces between different materials. The bond–slip behavior at the steel–concrete interface is then governed by the constitutive law of the cohesive elements. Studies [38,39,40] showed that the shape and parameters of the CZM significantly affect the FE simulation results of the decohesion process in composite structures. The bilinear cohesive zone model can give acceptable prediction results in bond–slip analyses of reinforced concrete. Hence, the bilinear cohesive model is utilized in this paper and the stress–slip relation is given by Equation (5), according to the GB 50010-2011 standard [41]. The theory of the CZM modeling of bond performance is demonstrated in Figure 3.
τ = { τ u ( s s u ) 0.3 0 s s u τ u + ( τ u τ r s r s u ) ( s u s ) s u < s s r τ r s > s r
where τ and s are the local bond stress and local relative slip. τ u is the maximum bond strength, which is usually from three to six times larger than that in the normal stress, and τ r is the residual strength. s u and s r are the slip values when the bond stress reaches the bond strength and residual strength, respectively, which are related to the diameter of the reinforcing bar.

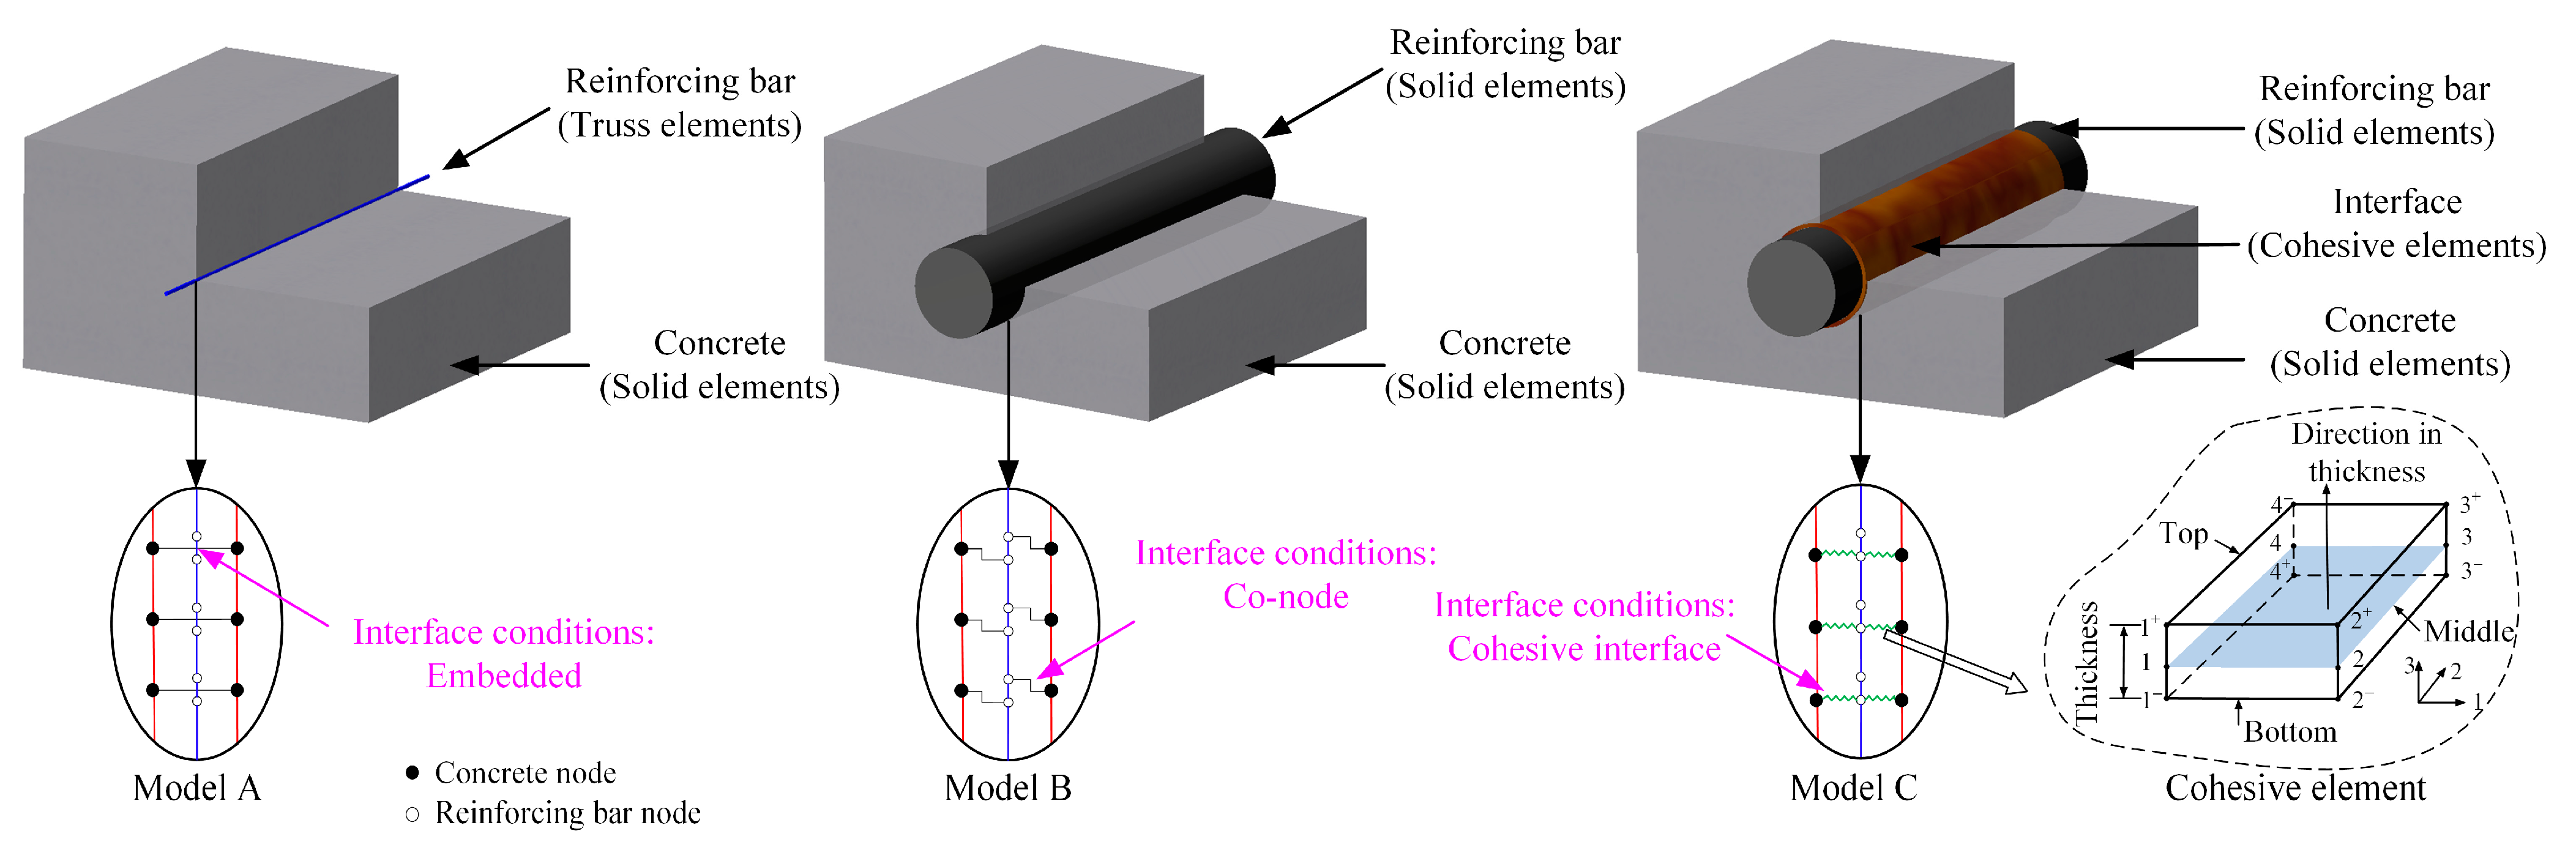
2.4. Modeling of Reinforcing Bars

Three interface interaction numerical models (named A, B, and C separately) are proposed to represent the steel–concrete interfacial behavior, as depicted in Figure 4. In model A, the reinforcing bars are modeled as truss elements embedded in the surrounding concrete, assuming a perfect bond between the truss elements and solid concrete elements. In contrast, the reinforcing bars are simulated by solid elements in the other two models. The reinforcing bars and concrete nodes are identical in model B, which means that the steel and concrete are perfectly bound too. However, in model C, the cohesive elements are embedded at the physical interface to imitate the bond–slip behavior of the steel–concrete interface, as mentioned in Section 2.3. The bond strength in model C1 is according to code GB 50010-2011 to simulate a good bond condition. Furthermore, another two bond strength values are artificially selected to represent poor bond conditions, facilitating further examination of their impact on the bond performance and structural behavior, as shown in Table 1.

3. Finite Element Modeling of the SLRCP

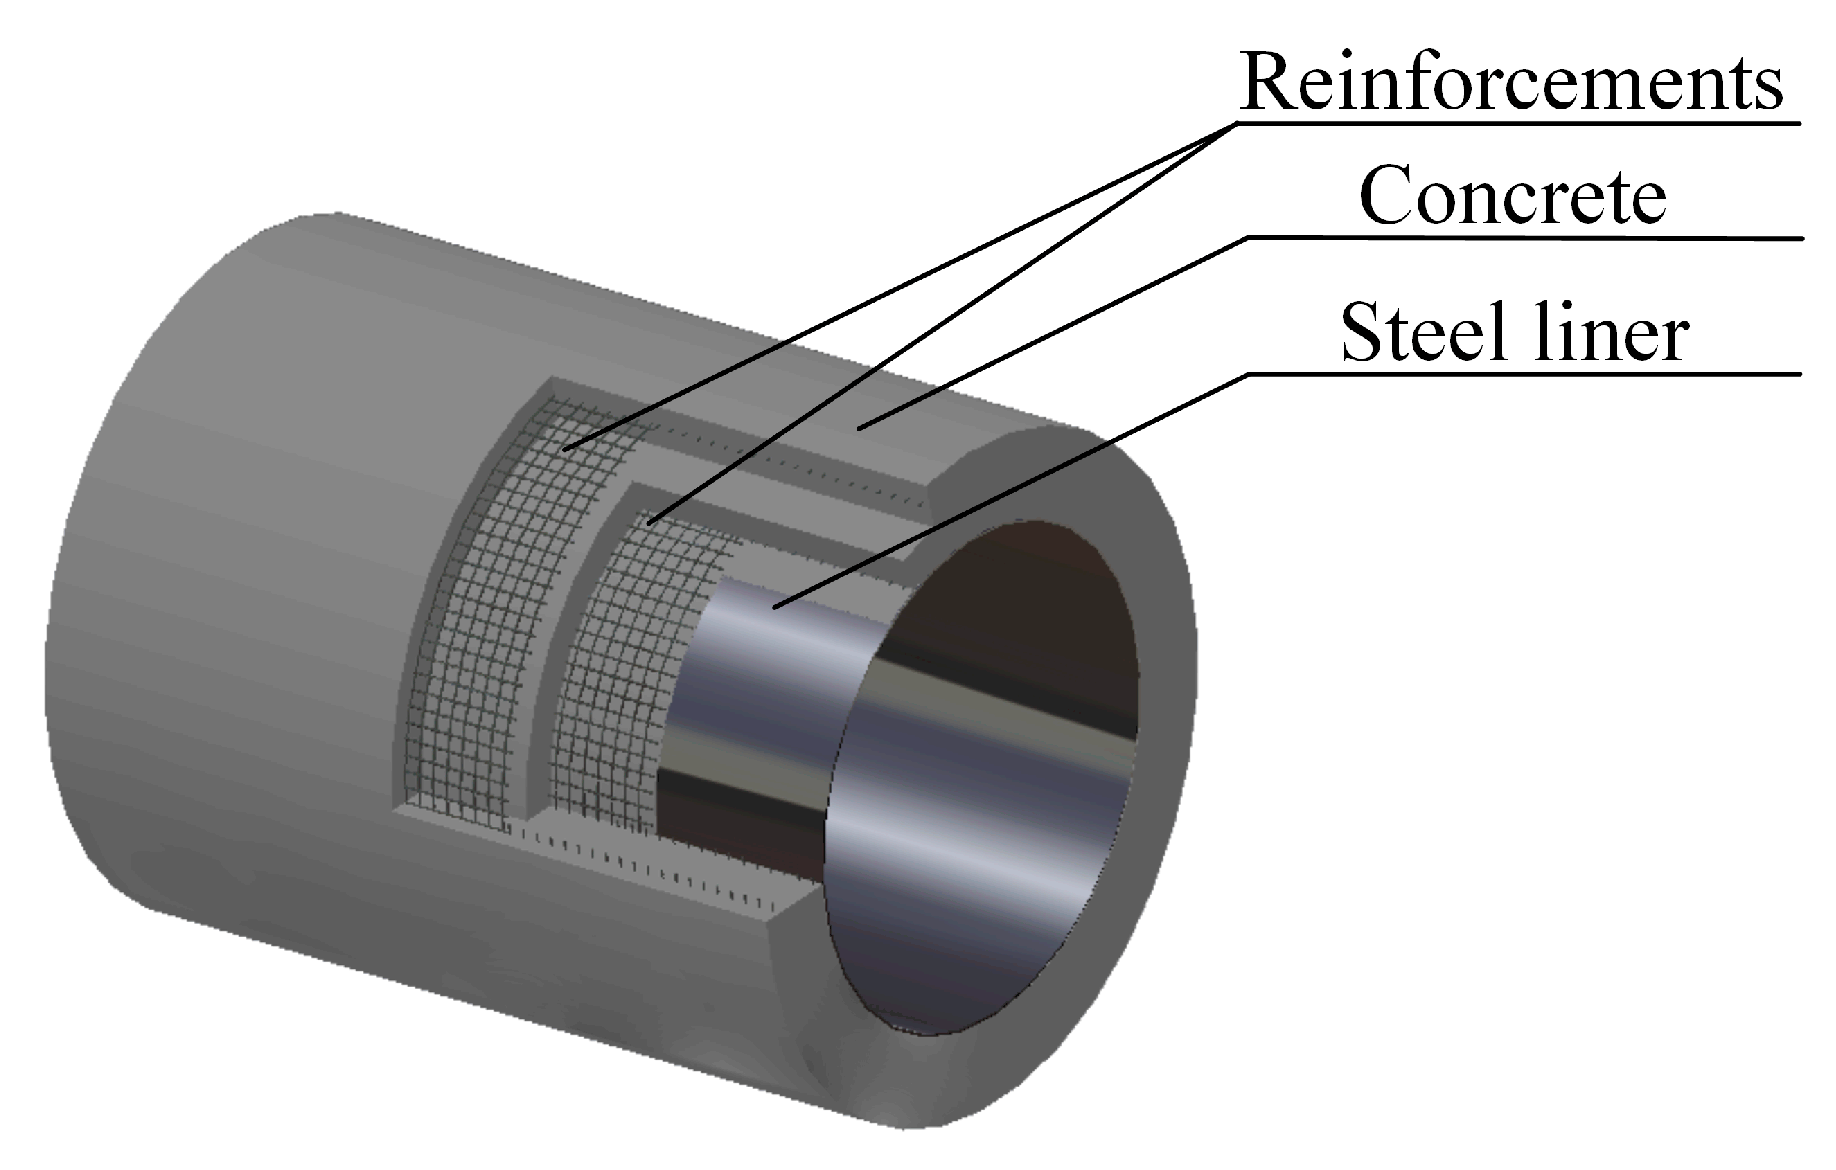
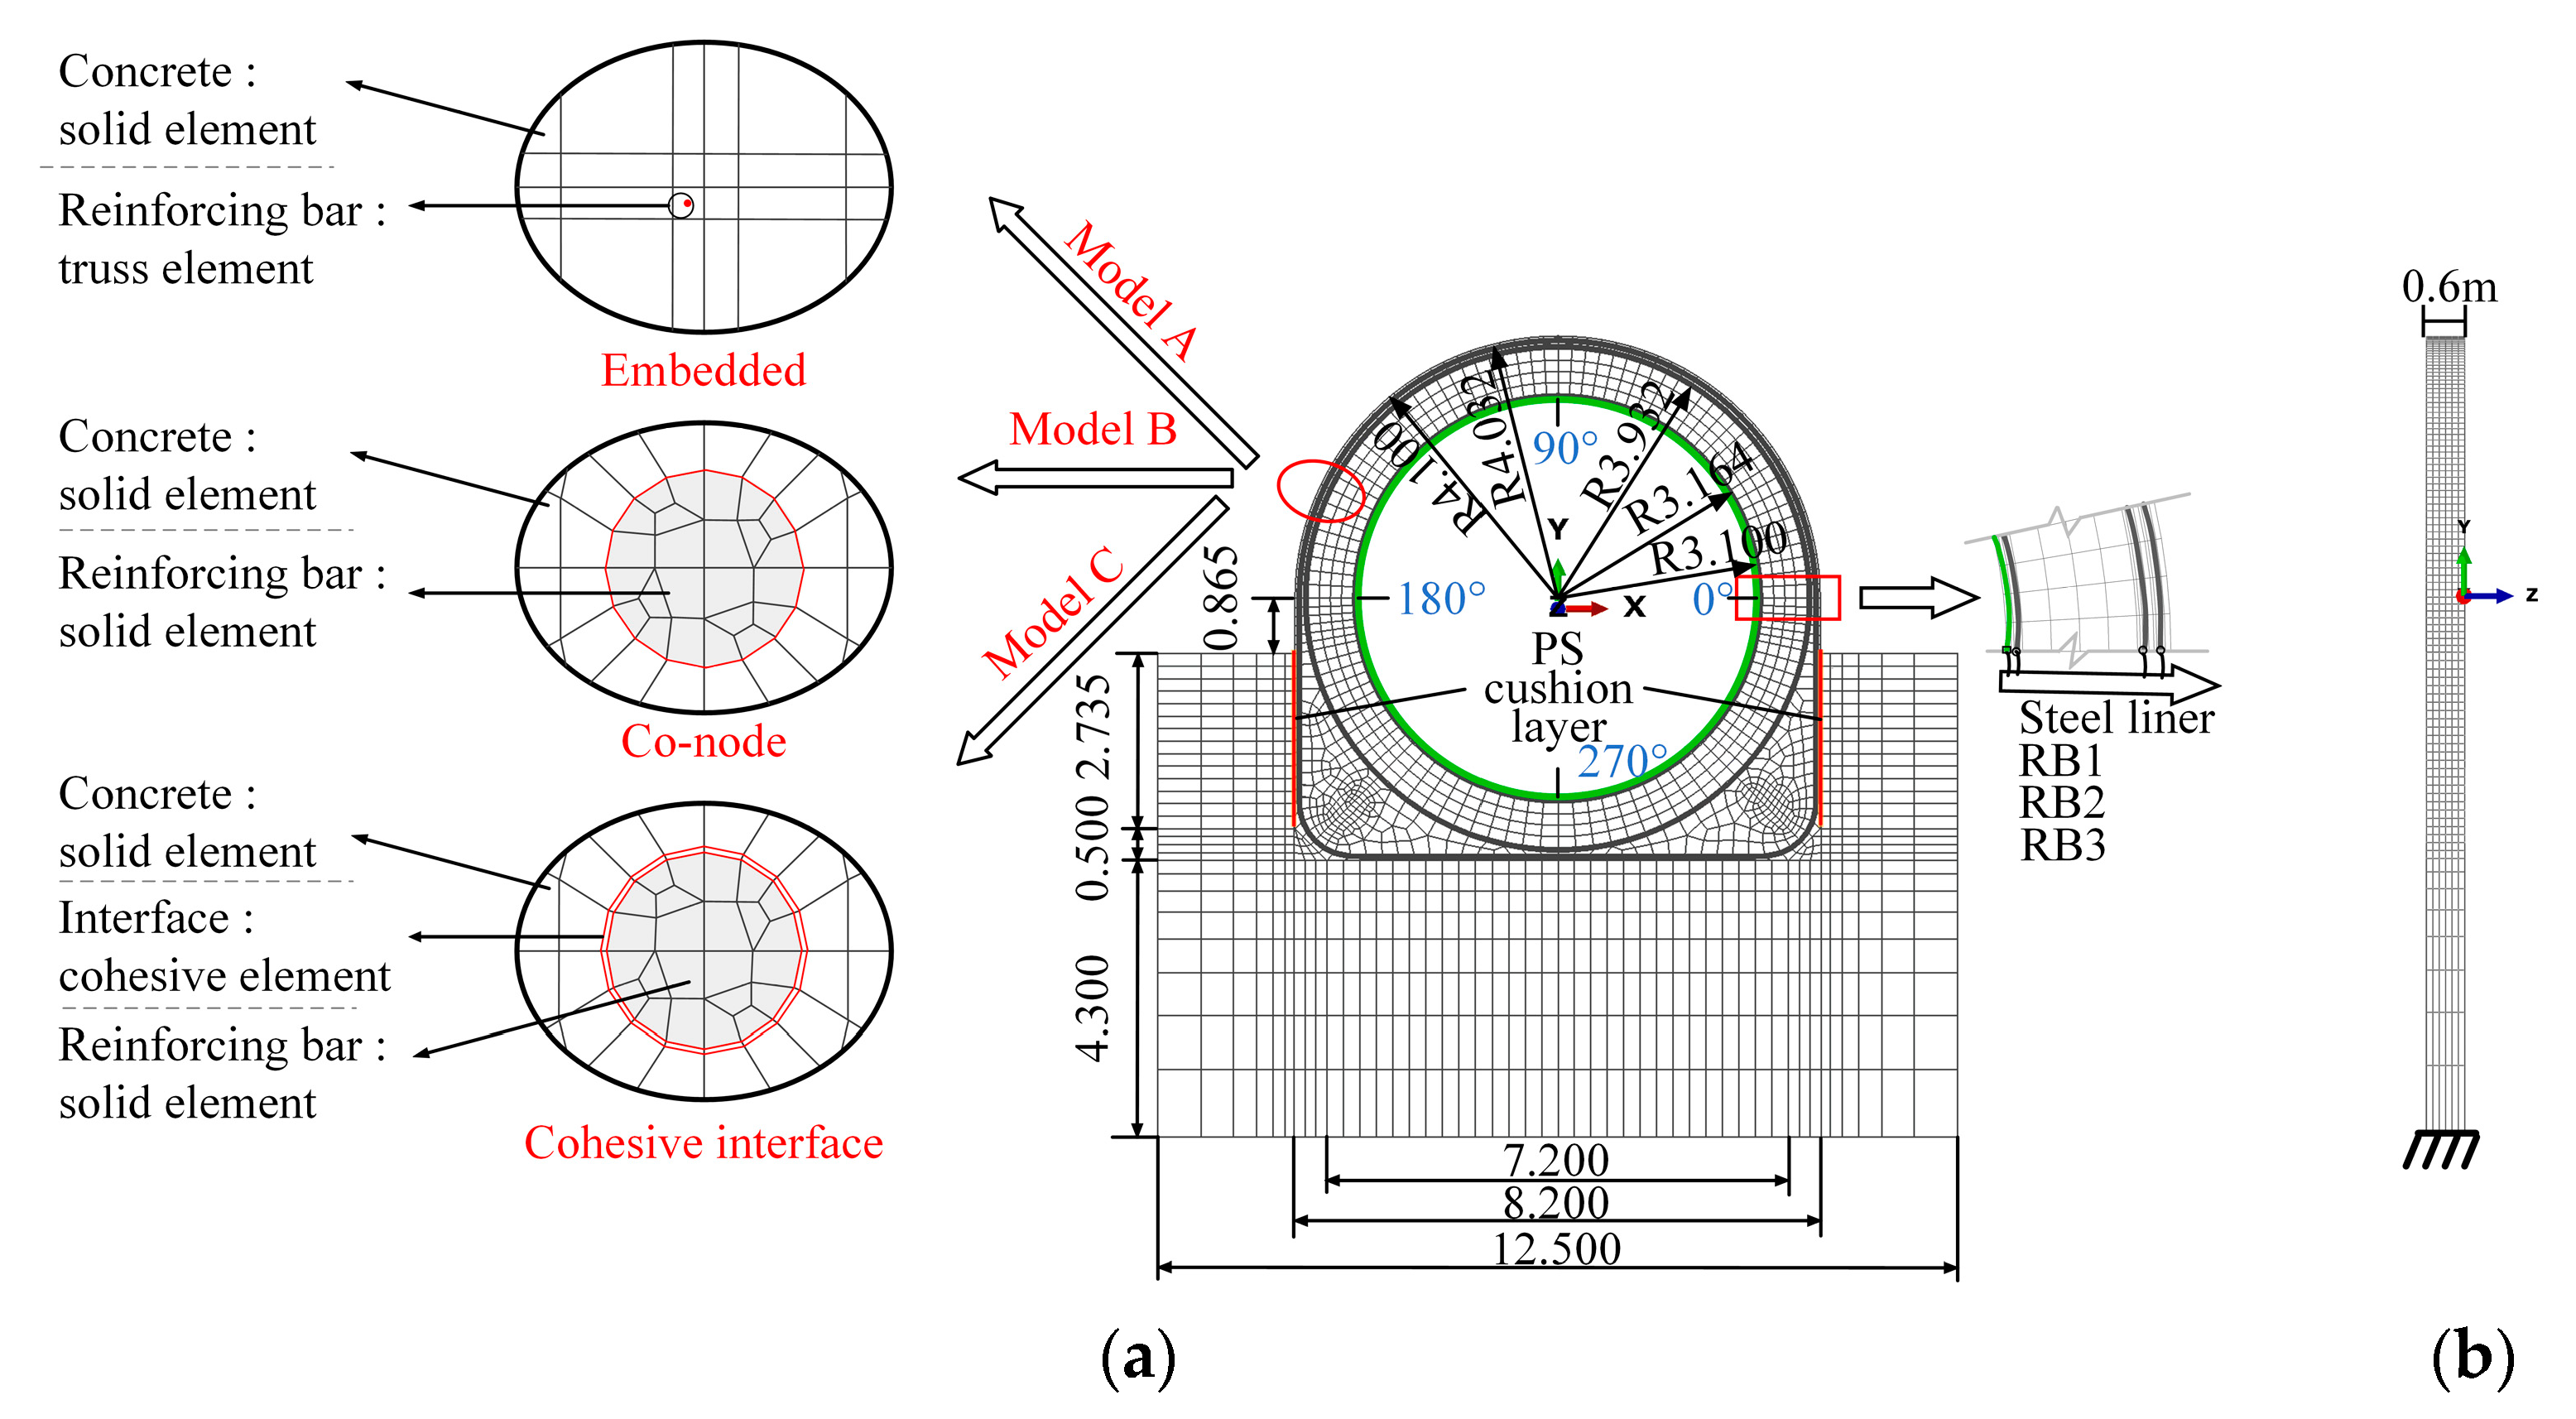
3.1. Finite Element Model

Three three-dimensional FE interface models (mentioned in Section 2.4) were developed in ABAQUS to investigate the effects of the steel–concrete interface interaction in the SLRCP, based on data from the 1:2 large-scale prototype model data of the Three Gorges Hydropower Station [42]. The specific FE interface models are demonstrated in Figure 5, with full constraints imposed on the bottom of the model. In model A, reinforcing bars were modeled using embedded truss elements (T3D2), while solid elements (C3D8) were used in model B and C. The concrete was all modeled as solid elements (C3D8) using the CDPM; the smeared crack model, representing cracks as crack bands, was adopted in all three models, employing a Newton–Raphson iterative method for convergence improvement. Eight-node cohesive elements (COH3D8) were inserted in the interface between the reinforcing bars and concrete to simulate the bond–slip behavior. The bond–slip initiation was determined by the maximum nominal stress criterion in a CZM analysis; the material properties of the concrete and reinforcements, based on mechanical tests, are given in Table 2. Figure 6 represents the concrete constitutive relationship obtained from the experimental results. With the absence of available bond–slip relation experimental data, the bond–slip law was according to the empirical formula in code GB 50010-2011, and the slip–damage curves (defined in ABAQUS) are shown in Figure 7.

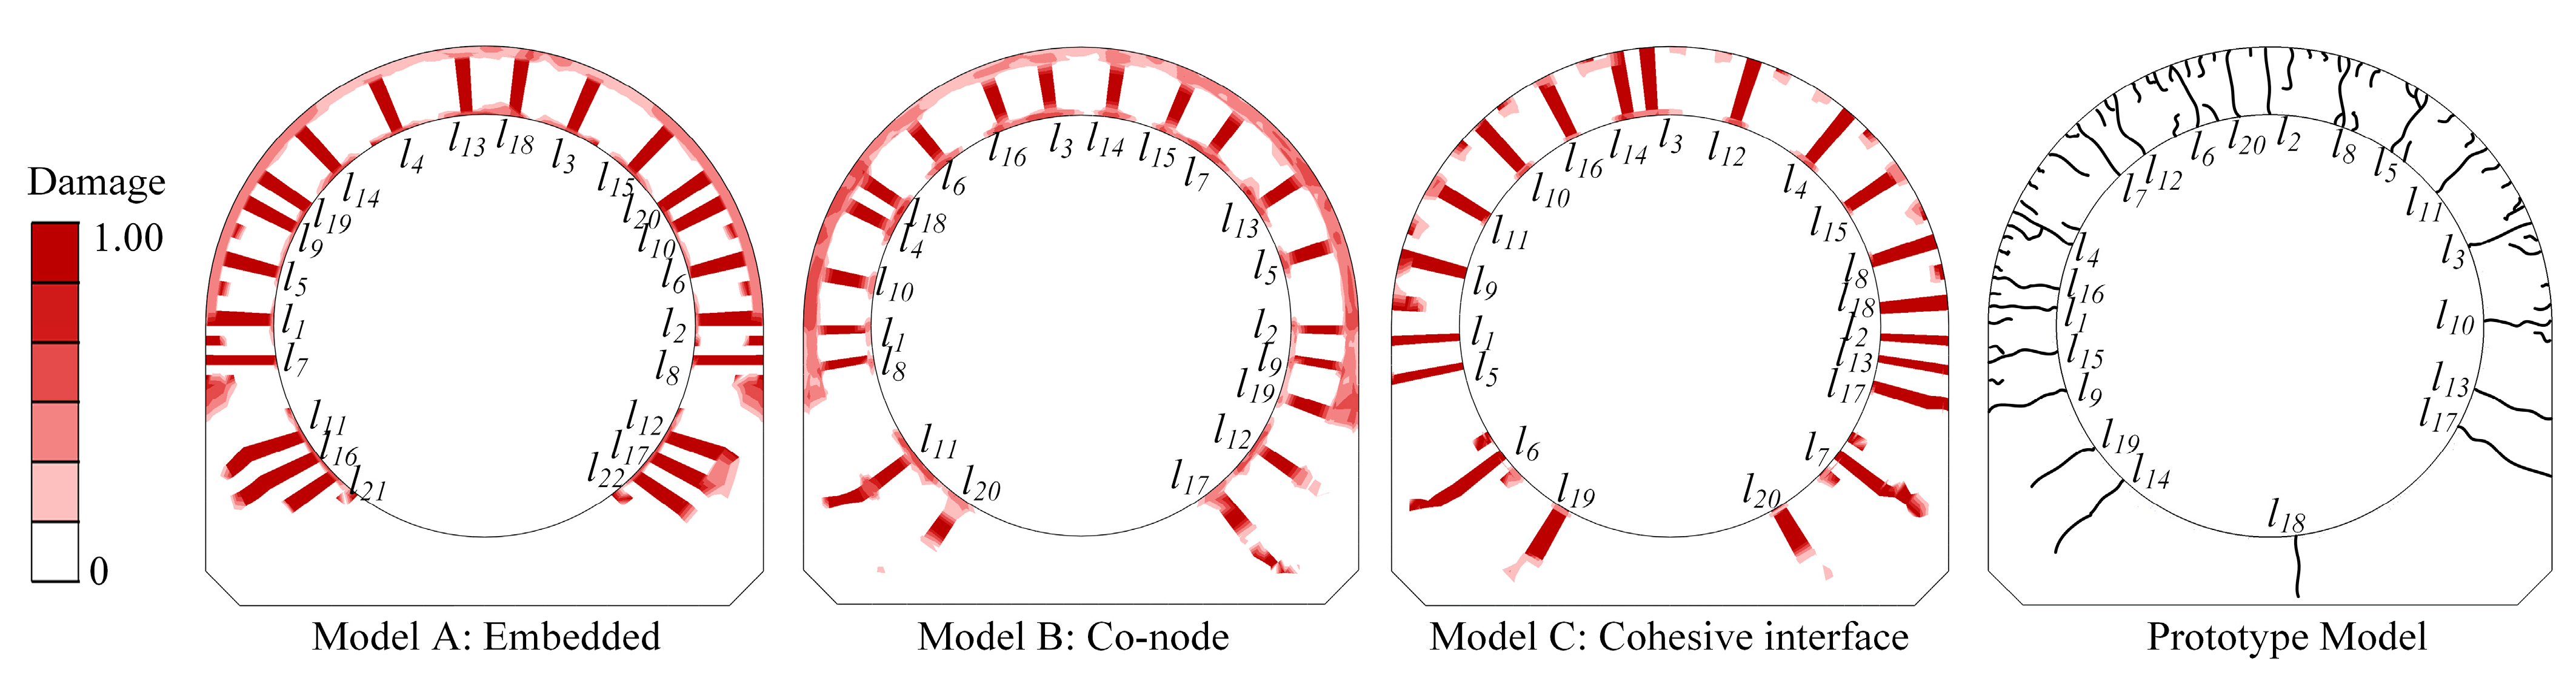
3.2. Crack Initiation and Propagation Analysis

During the numerical analysis, the cracks were obtained when the concrete stress reached the tensile strength, and then the fracture strain localized, meanwhile, the normal stress vanished. After that, the crack was formed and smeared within the finite elements using a crack band controlled by strain localization [25,28], as illustrated in Figure 8. Notably, the crack initiation occurred near the left waist when the pressure load reached from approximately 0.6 to 0.7 MPa across the three models. In model C, where the bond–slip behavior existed between the reinforcing bars and concrete, the stress transferred from concrete to steel was reduced compared to the perfect relation models and this led the concrete crack to occur earlier.
In the end, model A, B, and C exhibited 22, 20, and 20 radial cracks distributed along the circumferential direction of the penstock, respectively. The subscript of the crack indexes denotes the sequence in which the cracks initiated. The bond property considered in model C was closer to the actual situation, which makes the crack distribution more consistent with the experimental results in terms of location and number. The damaged crack bands were mainly concentrated in the upper penstock due to the restriction of the massive dam concrete in the lower part. As a result, the mean crack spacings were taken from the upper part to compare the interface interaction effects on concrete cracking. The mean crack spacings obtained by the three models were 0.404 m, 0.471 m, and 0.445 m, respectively, with differences from the experimental results of 7.126%, 8.276%, and 2.29%. Thus, considering the bond–slip behavior led to cracking results closer to the experimental results.

3.3. Penstock Deformation Analysis

The crack deformations at the left waist in the three interface models are presented in Figure 9. In models A and B, the restriction of the reinforcing bars being arranged internally and externally resulted in the crack being formed as an “eye” shape. In contrast, the deformation in model C was more uniform than the others. This can be explained by the deformation near the crack being distributed along the steel–concrete interface and not concentrated in the crack under the effect of the bond–slip behavior. Consequently, the conclusion can be drawn that the bond performance did influence the deformation near the crack.
To further analyze the relative slip at the steel–concrete interface, three normalized circumferential paths (NDP) are defined, as shown in Figure 10. Furthermore, the relative slip of three layer reinforcements related to the crack bands along the defining path is illustrated in Figure 11. It can be noted that the relative slip was the largest around the crack and decreased gradually to 0 away from the crack, with the opposite direction on both sides. The slip of the external layers (RB2 and RB1) fluctuated more remarkably than that of the internal (RB1). This phenomenon is consistent with the distribution of damage bands with non-penetrating cracks outside the penstock (Figure 8). In addition, the relative slip of the internal reinforcing bar was greater than that of the outer layers, whereas it was still within the allowable values of 1.12 mm (0.04 d, d is the reinforcing bar diameter) in Code GB 50010-2011 [41].
The bond–slip variation process of the composite penstock during loading was also discussed. Figure 12 represents the slip values at typical cracks during loading. At the initial stage of loading, no obvious slip between the reinforcing bar and concrete was observed. However, when the load reached 0.6 MPa, the slip appeared and developed slowly with the increase in the load, indicating that there was still a good bond state between the reinforcing bars and concrete.

3.4. Reinforcements Stresses Analysis

To evaluate the influence of the bond effects on the structural behavior of the penstock, the reinforcement stresses along the defined path (shown in Figure 10) of model C were compared with the case when the steel and concrete were perfectly bound (models A and B). Experimental results were also utilized to validate the numerical results in Figure 13. It can be observed that the reinforcing bar stresses in model C were more uniform and smaller than the others. This phenomenon can also be explained by the deformation near the crack not being concentrated at one point, but dispersed along the interface in model C. On the contrary, the steel strains in models A and B were focused on the crack element, resulting in a dramatic increase in stress post-cracking.
The prediction results of model C approximated the experimental results best. Taking the stress at the left waist as an example, the stresses of the reinforcing bars in models A, B, and C were 160.38 MPa, 157 MPa, and 153.46 MPa, respectively, with errors from the experimental results (150.00 MPa) of 6.93%, 5.29%, and 2.31%. In addition, a slight increase in the stress of the steel liner is observed in Figure 13a, since the whole penstock deformation was increased slightly with the effect of the bond–slip behavior. However, the increase was less than 10%, which did not affect the composite penstock safety.

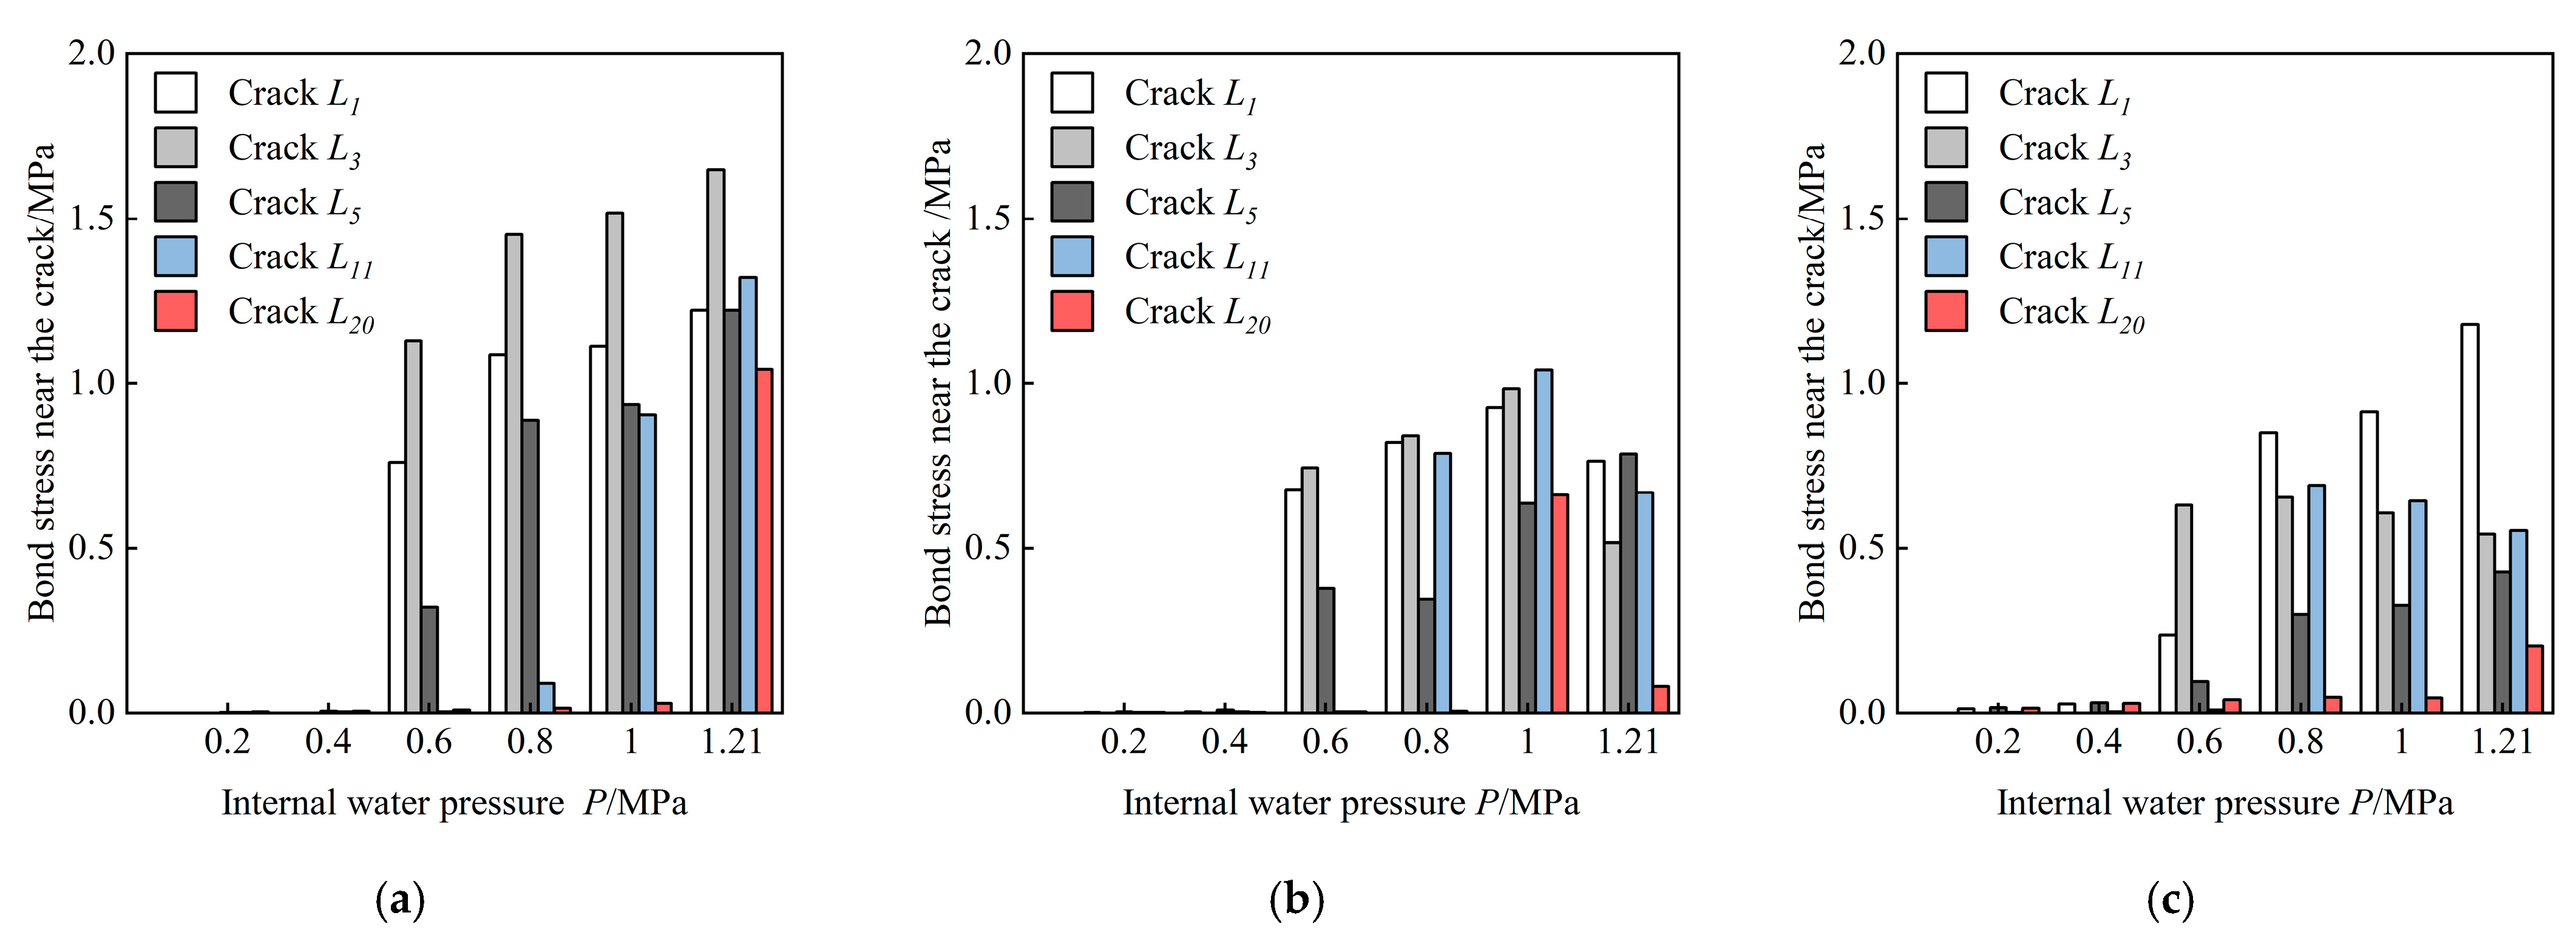
3.5. Bond Stress Analysis

Figure 14 shows the bond stresses between the reinforcing bars and concrete along the NDPs. In corresponding with the relative slip, the bond stresses were also opposite on both sides of a crack and decreased from the maximum (near the crack) to zero (middle of two cracks). To further understand the development process of the bond stress, the bond stress during loading is illustrated in Figure 15. It can be noted that the bond stresses near some cracks experienced a descending stage in layers RB2 and RB3. This phenomenon is in line with the CZM theory: once the crack was broken, the bond strength between the reinforcing bars and concrete started to decrease. However, the bond stresses of the three layers were greater than zero, which indicates that a good bond could still be maintained at the interface.

4. Sensitivity Analysis of Bond Strength

The above analysis shows that the structural behavior, including deformation, crack initiation and propagation, and stress distribution, was affected by the bond–slip behavior at the steel–concrete interface. However, the bond–slip relation is based on the empirical formulas proposed in code GB 50010-2011, with no experimental data available, and this may differ from the real situation. As a result, to evaluate the influence of the bond effects on the structural behavior, three different bond strengths were artificially selected to represent different bond conditions. Models C1, C2, and C3 were implemented to simulate the good, poor, and very poor bond conditions in ABAQUS.

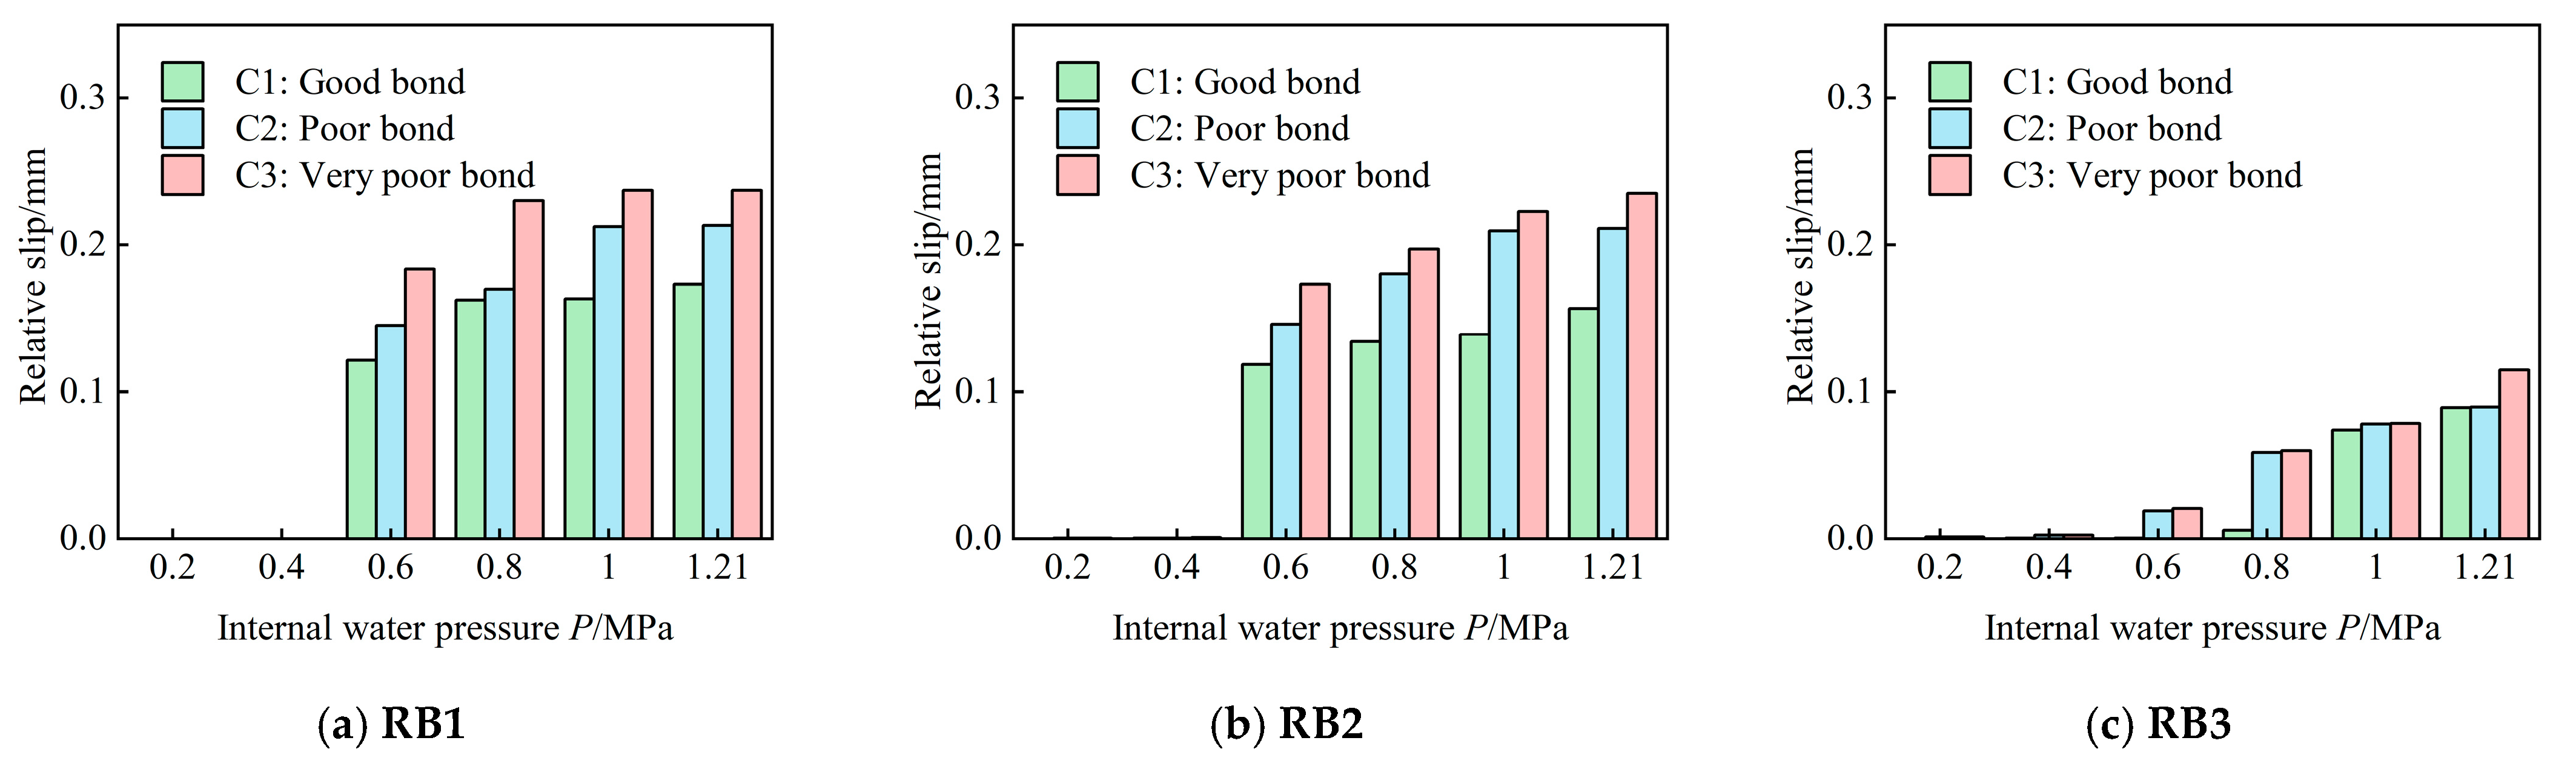
4.1. Relative Slip between Reinforcements and Concrete

As discussed in Section 3.3, the slip of the internal reinforcing bar was larger than that of the external layers and the maximum slip occurred near the left waist of the penstock. The relative slip along the internal reinforcing bar and near the waist crack under different bond conditions are, respectively, compared in Figure 16 and Figure 17. It is observed that the relative slip distribution along the interface was the same in the three models. The constraint effect of the reinforcing bars on the concrete gradually weakened with a decrease in the bond strength, and this made the relative slip increase at the interface. However, the maximum slips under different bond conditions were all less than the allowable value of 1.12 mm (0.04 d, d is the reinforcing bar diameter) in the code, which can mean that there was no bond failure at the interfaces. Therefore, for MRRC structures such as SLRCP, a perfect bond can be assumed between the reinforcing bars and concrete due to the small relative slip at the interfaces.

4.2. Steel Stresses and Bond Stresses

Comparing the circumferential stress distributions of reinforcements under three bond conditions (Figure 18), it can be found that the bond strength had little effect on the reinforcement stresses. The reinforcement stress in the uncracked area at the bottom of the penstock in the three models was roughly the same, but with an increase in the bond strength, the constraint effect of the reinforcing bars on the concrete was stronger. Therefore, the structural deformation around the crack was smaller, which directly reduced the peak stress. The bond stress in Figure 19 shows a similar phenomenon, where it increases with the bond strength in the cracking area of the penstock with a small difference. The reason may be that there is a perfect bond between the reinforcing bars and concrete for MRRC structures, no matter how weak the bond strength is. Therefore, when carrying out the safety analysis of such a structure, the influence of the bond strength (the compressive strength of the concrete remains constant) can be ignored to simplify the calculation.

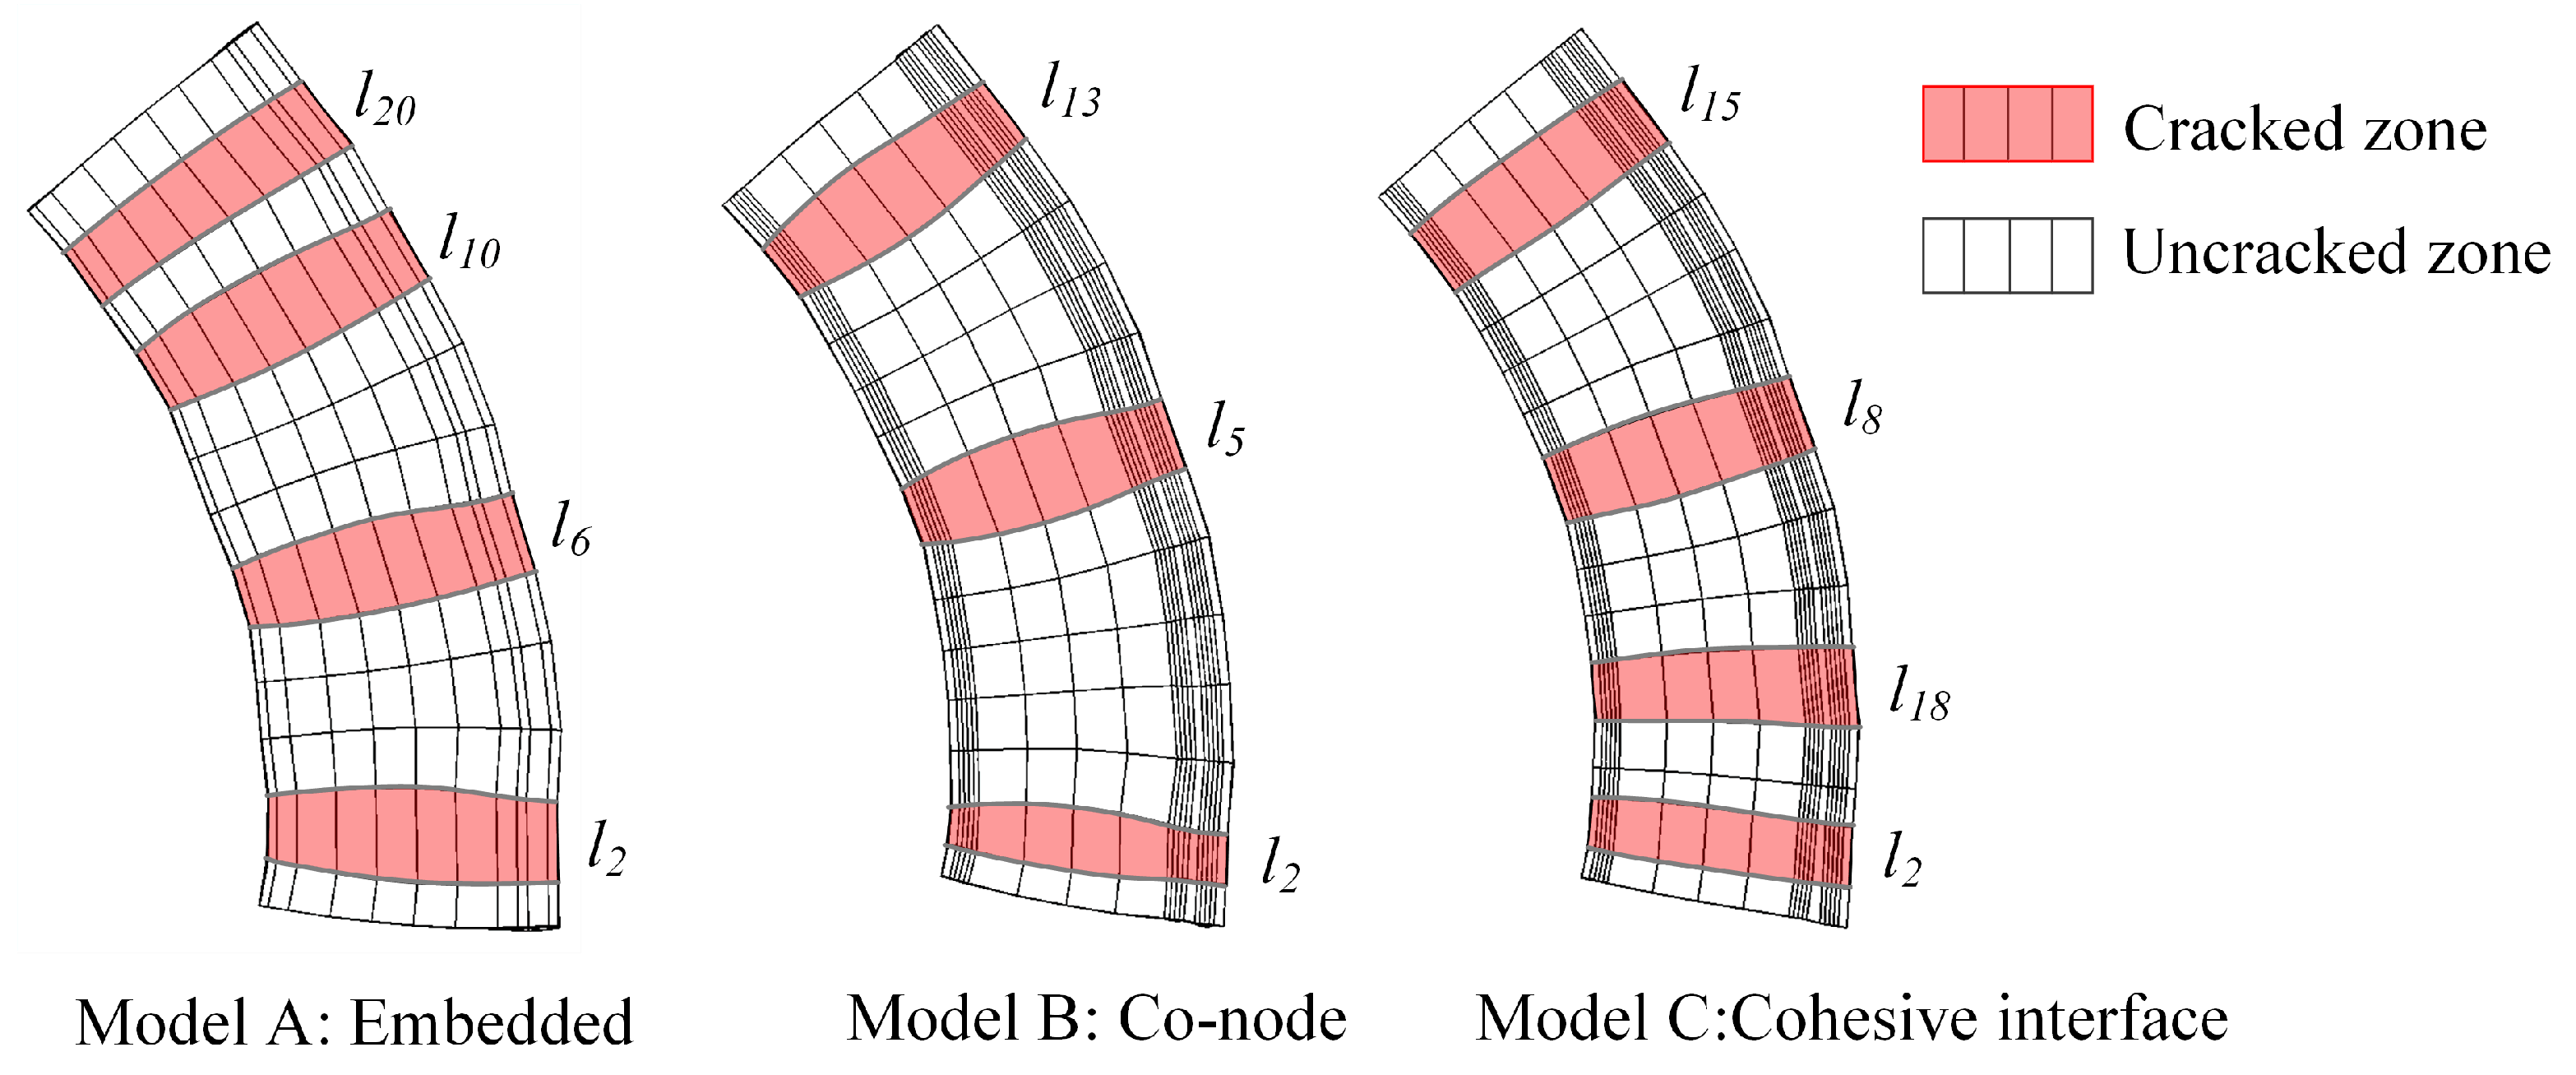
4.3. Concrete Crack Width and Distribution

While the bond performance has little effect on the behavior of the MRRC structure as a whole, it does have a certain impact on the structural deformation and steel stress around cracks, and this influence is usually accompanied by changes in the crack spacing and numbers. For instance, in the upper half of the penstock, models C1, C2, and C3 exhibited 15, 13, and 12 cracks, respectively. This suggests that the area of force transmission was reduced when the bond condition was good. In other words, the average crack spacing was smaller and the number of cracks was more.
The calculation of crack width is based on the bond–slip theory, that is, the crack width is equal to the difference between the elongation of the reinforcing bar and concrete between two cracks (Equation (6)) [41]. Additionally, the calculation principle is demonstrated in Figure 20. The crack widths on both sides of the waist and crown of the penstock are calculated and compared with the experimental results, as shown in Table 3. It can be noted that the crack width in all three models closely matches the experimental results, with the widest crack occurring in the middle, followed by the outer, and the narrowest in the inner portion. With an increase in bond strength, the constraint effect of the reinforcing bars on the concrete is enhanced, which limits the sliding of concrete and reduces the crack width. It can be concluded that a poor bond performance has a negative effect on the crack width and may reduce the durability of the penstock. Therefore, the bond–slip behavior between the reinforcing bars and concrete should be emphasized in durability analyses.
ω c r = ε s l c r ε c l c r = s 1 + s 2

5. Conclusions

This paper studied the bearing characteristics of massive ring-type reinforced concrete structures, such as steel-lined reinforced concrete penstock, taking into account the bond–slip behavior. Three interface finite models were proposed to represent the different interaction effects and investigate the effect of the bond performance on the structural behavior of MRRC structures. A cohesive zone model that inserted the cohesive elements into the physical interfaces between the reinforcing bars and concrete was employed to simulate the bond–slip behavior. Specifically, three bond strengths were artificially selected to explore the bond effects under different bond conditions. An assessment of numerical models was conducted using the test results of the 1:2 large prototype model results of the Three Gorges Hydropower Station. Based on the results and discussions presented in this paper, the following conclusions can be drawn:
  • The interaction effects in the cohesive interface model between the reinforcing bars and concrete were weakened in contrast to the perfect relation models. It was observed that the stress distribution of the reinforcing bars and steel liner was more uniform and the peak stress was smaller than the other two models. This can be attributed to the bond performance, which caused the strain around the crack to be distributed along the interface rather than concentrated on the crack section.
  • The numerical prediction results after considering the bond–slip behavior approximated the experimental results best. However, the differences in the steel stress and crack distribution were within 10%, which has a limited effect on the safety design of MRRC structures. The sensitivity analysis of the impact of the bond strength on the structural behavior and bond performance can also prove this. The relative slips under different bond conditions were smaller than 1.12 mm, within the allowable value in Code GB 50010-2011. Consequently, it can be assumed that there is a perfect bond between the reinforcing bars and concrete in MRRC structures. As a result, perfect relation models can be applied to simplify the calculation in the structural design analysis of MRRC structures.
  • The bond–slip behavior in MRRC structures has a limited effect on the whole structural behavior, but has a great influence on the crack initiation and propagation. The crack numbers and mean spacing were in line with the experimental results with the consideration of bond–slip behavior. The crack widths based on the bond–slip calculation theory were closely related to the bond conditions, which can directly affect the durability of RC structures. In this situation, the bond–slip behavior should be paid more attention in structure durability design.
Previous finite element simulations and experiments have proven that the empirical bond–slip law in code GB 50010-2011 can model the bond–slip behavior of RC structures with a good accuracy. However, a more accurate bond performance of MRRC structures should be explored, combined with experiments in future works.

Author Contributions

Conceptualization and funding acquisition, H.-G.W.; data curation and formal analysis, W.-T.X. and Z.M.; writing—original draft, W.-T.X., Z.M. and C.-Z.S.; All authors have read and agreed to the published version of the manuscript.

Funding

This paper was supported by the National Natural Science Foundation of China (No. 51409194).

Data Availability Statement

The data are available by querying the authors.

Conflicts of Interest

The authors declare no conflicts of interest.

References

  1. Su, K.; Yang, Z.J.; Zhang, W.; Wu, H.L.; Zhang, Q.L.; Wu, H.G. Bearing mechanism of composite structure with reinforced concrete and steel liner: An application in penstock. Eng. Struct. 2017, 141, 344–355. [Google Scholar] [CrossRef]
  2. Shi, C.; Wu, H.; Su, K. Applications of FEM and elasticity centre method of structure mechanics in designing penstock laid on downstream surface of dam. J. Hydraul. Eng. 2010, 41, 856–862. [Google Scholar] [CrossRef]
  3. Wu, H.; Ma, Z.; Shi, C. Overview of research and engineering application of steel-lined reinforced concrete penstocks laid on downstream dam surfaces. Shuili Fadian Xuebao/J. Hydroelectr. Eng. 2020, 39, 1–12. [Google Scholar]
  4. Kai, S.; Wei, Z.; Hegao, W.; Changzheng, S. Bearing mechanism of reinforced concrete penstock with steel liner considering friction-contact behavior. J. Hydraul. Eng. 2016, 47, 1070–1078. [Google Scholar]
  5. Shi, C.; Wu, H. Damage and bearing characteristics of steel lined reinforced concrete penstock on downstream face of dam in hydropower station. Tianjin Daxue Xuebao (Ziran Kexue Yu Gongcheng Jishu Ban)/J. Tianjin Univ. Sci. Technol. 2014, 47, 1081–1087. [Google Scholar] [CrossRef]
  6. Su, K.; Yang, Z.; Wu, H.; Zhou, L.; Shi, C. Influence of Gap on Bearing Mechanism of Steel-Lined Reinforced Concrete Penstock. Tianjin Daxue Xuebao (Ziran Kexue Yu Gongcheng Jishu Ban)/J. Tianjin Univ. Sci. Technol. 2018, 51, 967–976. [Google Scholar] [CrossRef]
  7. Pang, Y.; Wu, G.; Wang, H.; Liu, Y. Interfacial bond-slip degradation relationship between CFRP plate and steel plate under freeze-thaw cycles. Constr. Build. Mater. 2019, 214, 242–253. [Google Scholar] [CrossRef]
  8. Coccia, S.; Di Maggio, E.; Rinaldi, Z. Bond slip model in cylindrical reinforced concrete elements confined with stirrups. Int. J. Adv. Struct. Eng. 2015, 7, 365–375. [Google Scholar] [CrossRef]
  9. Jin, L.; Li, X.; Zhang, R.; Du, X. Bond-slip behavior between concrete and deformed rebar at elevated temperature: Mesoscale simulation and formulation. Int. J. Mech. Sci. 2021, 205, 106622. [Google Scholar] [CrossRef]
  10. Lu, X.Z.; Teng, J.G.; Ye, L.P.; Jiang, J.J. Bond-slip models for FRP sheets/plates bonded to concrete. Eng. Struct. 2005, 27, 920–937. [Google Scholar] [CrossRef]
  11. Tang, C.W.; Cheng, C.K. Modeling local bond stress-slip relationships of reinforcing bars embedded in concrete with different strengths. Materials 2020, 13, 3701. [Google Scholar] [CrossRef] [PubMed]
  12. Casanova, A.; Jason, L.; Davenne, L. Bond slip model for the simulation of reinforced concrete structures. Eng. Struct. 2012, 39, 66–78. [Google Scholar] [CrossRef]
  13. Yazarlu, A.; Dehestani, M. Application of discrete element method (DEM) in characterization of bond-slip behavior in RC beams with confinement subjected to corrosion. Structures 2020, 28, 1965–1976. [Google Scholar] [CrossRef]
  14. Marin-Artieda, C.; Buitrago, D. Numerical predictions of observed failure modes on non-ductile reinforced concrete frames. Eng. Struct. 2021, 243, 112568. [Google Scholar] [CrossRef]
  15. Fawaz, G.; Murcia-Delso, J. Three-dimensional finite element modeling of RC columns subjected to cyclic lateral loading. Eng. Struct. 2021, 239, 112291. [Google Scholar] [CrossRef]
  16. Wu, Z.; Zhang, X.; Zheng, J.; Hu, Y.; Li, Q. Experimental study on the bond behavior of deformed bars embedded in concrete subjected to lateral tension. Mater. Struct. Constr. 2014, 47, 1647–1668. [Google Scholar] [CrossRef]
  17. Melo, J.; Rossetto, T.; Varum, H. Experimental study of bond-slip in RC structural elements with plain bars. Mater. Struct. Constr. 2015, 48, 2367–2381. [Google Scholar] [CrossRef]
  18. Murcia-Delso, J.; Benson Shing, P. Bond-Slip Model for Detailed Finite-Element Analysis of Reinforced Concrete Structures. J. Struct. Eng. 2015, 141, 04014125. [Google Scholar] [CrossRef]
  19. Ngo, D.; Scordelis, A.C. Finite element analysis of reinforced concrete beams. ACI J. 1967, 64, 152–163. [Google Scholar]
  20. Lowes, L.N. Concrete-steel bond model for use in finite element modeling of reinforced concrete structures. ACI Struct. J. 2004, 101, 501–511. [Google Scholar] [CrossRef]
  21. Richard, B.; Ragueneau, F.; Cremona, C.; Adélaide, L.; Tailhan, J.L. A three-dimensional steel/concrete interface model including corrosion effects. Eng. Fract. Mech. 2010, 77, 951–973. [Google Scholar] [CrossRef]
  22. Monti, G.; Filippou, F.C.; Spacone, E. Analysis of hysteretic behavior of anchored reinforcing bars. ACI Struct. J. 1997, 94, 248–261. [Google Scholar] [CrossRef] [PubMed]
  23. Hadjazi, K.; Sereir, Z.; Amziane, S. Cohesive zone model for the prediction of interfacial shear stresses in a composite-plate RC beam with an intermediate flexural crack. Compos. Struct. 2012, 94, 3574–3582. [Google Scholar] [CrossRef]
  24. Rabinovitch, O. An extended high order cohesive interface approach to the debonding analysis of FRP strengthened beams. Int. J. Mech. Sci. 2014, 81, 1–16. [Google Scholar] [CrossRef]
  25. Dias-da-Costa, D.; Cervenka, V.; Graça-e-Costa, R. Model uncertainty in discrete and smeared crack prediction in RC beams under flexural loads. Eng. Fract. Mech. 2018, 199, 532–543. [Google Scholar] [CrossRef]
  26. Hillerborg, A.; Modéer, M.; Petersson, P.E. Analysis of crack formation and crack growth in concrete by means of fracture mechanics and finite elements. Cem. Concr. Res. 1976, 6, 773–781. [Google Scholar] [CrossRef]
  27. Ma, F.J.; Kwan, A.K.H. Crack width analysis of reinforced concrete members under flexure by finite element method and crack queuing algorithm. Eng. Struct. 2015, 105, 209–219. [Google Scholar] [CrossRef]
  28. Rimkus, A.; Cervenka, V.; Gribniak, V.; Cervenka, J. Uncertainty of the smeared crack model applied to RC beams. Eng. Fract. Mech. 2020, 233, 107088. [Google Scholar] [CrossRef]
  29. De Borst, R.; Remmers, J.J.C.; Needleman, A.; Abellan, M.A. Discrete vs smeared crack models for concrete fracture: Bridging the gap. Int. J. Numer. Anal. Methods Geomech. 2004, 28, 583–607. [Google Scholar] [CrossRef]
  30. Hany, N.F.; Hantouche, E.G.; Harajli, M.H. Finite element modeling of FRP-confined concrete using modified concrete damaged plasticity. Eng. Struct. 2016, 125, 1–14. [Google Scholar] [CrossRef]
  31. Mirmiran, A.; Zagers, K.; Yuan, W. Nonlinear finite element modeling of concrete confined by fiber composites. Finite Elem. Anal. Des. 2000, 35, 79–96. [Google Scholar] [CrossRef]
  32. Carrazedo, R.; Mirmiran, A.; de Hanai, J.B. Plasticity based stress-strain model for concrete confinement. Eng. Struct. 2013, 48, 645–657. [Google Scholar] [CrossRef]
  33. Samani, A.K.; Attard, M.M. A stress-strain model for uniaxial and confined concrete under compression. Eng. Struct. 2012, 41, 335–349. [Google Scholar] [CrossRef]
  34. Alfarah, B.; López-Almansa, F.; Oller, S. New methodology for calculating damage variables evolution in Plastic Damage Model for RC structures. Eng. Struct. 2017, 132, 70–86. [Google Scholar] [CrossRef]
  35. Yang, Q.; Cox, B. Cohesive models for damage evolution in laminated composites. Int. J. Fract. 2005, 133, 107–137. [Google Scholar] [CrossRef]
  36. Li, G.; Tan, K.H.; Fung, T.C.; Yu, Q.J.; May, M. A coupled dynamic cohesive zone model for FRP-concrete mixed-mode separation. Compos. Struct. 2021, 268, 113872. [Google Scholar] [CrossRef]
  37. De Morais, A.B. Mode I cohesive zone model for delamination in composite beams. Eng. Fract. Mech. 2013, 109, 236–245. [Google Scholar] [CrossRef]
  38. Alfano, G. On the influence of the shape of the interface law on the application of cohesive-zone models. Compos. Sci. Technol. 2006, 66, 723–730. [Google Scholar] [CrossRef]
  39. Heidari-Rarani, M.; Ghasemi, A.R. Appropriate shape of cohesive zone model for delamination propagation in ENF specimens with R-curve effects. Theor. Appl. Fract. Mech. 2017, 90, 174–181. [Google Scholar] [CrossRef]
  40. Williams, J.G.; Hadavinia, H. Analytical solutions for cohesive zone models. J. Mech. Phys. Solids 2002, 50, 809–825. [Google Scholar] [CrossRef]
  41. GB 50010-2011; Code for Design of Concrete Structures. China Building Industry Press: Beijing, China, 2011.
  42. Wu, H.G.; Gosling, P.D. Structural Reseach on the Penstocks for Three Gorges. Hydropower Dams 2000, 1, 64–68. [Google Scholar]
Figure 1. Schematic of the steel-lined reinforced concrete penstock.
Buildings 14 01332 g001
Figure 2. The stress–strain relation of concrete of CDPM in ABAQUS: (a) the tensile state and (b) the compressive state.
Buildings 14 01332 g002
Figure 3. Bilinear cohesive zone model.
Buildings 14 01332 g003
Figure 4. Three interface finite element models.
Buildings 14 01332 g004
Figure 5. Finite element model of the SLRCP (units: m): (a) front view and (b) lateral view.
Buildings 14 01332 g005
Figure 6. Concrete stress–plastic strain and damage–strain curves.
Buildings 14 01332 g006
Figure 7. Relative slip–damage curves.
Buildings 14 01332 g007
Figure 8. Penstock cracks (damage) distribution of each scheme.
Buildings 14 01332 g008
Figure 9. Crack deformation at the waist section (Scale factor: 100).
Buildings 14 01332 g009
Figure 10. Normalized circumferential paths (NDP).
Buildings 14 01332 g010
Figure 11. Relative slip between the reinforcing bars and concrete (a) RB1, (b) RB2, and (c) RB3.
Buildings 14 01332 g011
Figure 12. Relative slip between the reinforcing bars and the concrete near the special cracks with the internal water pressure: (a) RB1, (b) RB2, and (c) RB3.
Buildings 14 01332 g012
Figure 13. Reinforcement stress distribution along the NDPs: (a) steel liner, (b) RB1, (c) RB2, and (d) RB3.
Buildings 14 01332 g013aBuildings 14 01332 g013b
Figure 14. Bond stress between the reinforcing bars and concrete: (a) RB1, (b) RB2, and (c) RB3.
Buildings 14 01332 g014aBuildings 14 01332 g014b
Figure 15. Bond stress between the reinforcing bars and the concrete near the special cracks with the internal water pressure: (a) RB1, (b) RB2, and (c) RB3.
Buildings 14 01332 g015
Figure 16. Relative slip between the reinforcing bar (RB1) and concrete along the NDP.
Buildings 14 01332 g016
Figure 17. Relative slip between the reinforcing bars and concrete at the left waist crack with the internal water pressure.
Buildings 14 01332 g017
Figure 18. The circumferential reinforcements stress under different bond conditions: (a) steel liner and (b) RB1.
Buildings 14 01332 g018
Figure 19. Bond stress between the reinforcing bar (RB1) and concrete along with the NDP.
Buildings 14 01332 g019
Figure 20. Calculation model of crack width based on the bond–slip theory.
Buildings 14 01332 g020
Table 1. Calculation schemes.
SchemesIf the Bond–Slip Is ConsideredReinforcing Bars ElementInterface
Conditions
Bond Strength
ANoTrussEmbedded/
BNoSolidCo-node/
C1YesSolidCohesive interfaceτu = 4.0ftk
C2YesSolidCohesive interfaceτu = 2.0ftk
C3YesSolidCohesive interfaceτu = ftk
Table 2. Mechanical properties of the test model.
MaterialElastic Modulus (MPa)Poisson RatioTensile Strength (MPa)Compression Strength (MPa)
Concrete of penstock28,5000.171.7820.2
Concrete of dam24,0000.171.014.6
Steel liner198,0000.30350 * 1350 *
Steel bar205,0000.30375 * 1375 *
PS cushion layer 20.40.30//
1 “*” means the yield strength of the steel. 2 PS cushion layer is not the main focus, having minimal impact on the results. Therefore, only its elastic modulus and Poisson’s ratio are considered.
Table 3. Crack widths at the special sections of the penstock (mm).
Crack LocationModel TestSchemes
C1C2C3
Left waistInner0.0780.0830.1090.124
Middle0.3000.2350.3290.356
Outer0.2040.2240.2830.323
Right waistInner0.0880.1110.1450.179
Middle0.4880.2780.3520.461
Outer0.1570.2210.3280.316
TopInner0.1000.1020.1180.158
Middle0.4230.2200.2940.331
Outer0.1320.1460.1670.214
Disclaimer/Publisher’s Note: The statements, opinions and data contained in all publications are solely those of the individual author(s) and contributor(s) and not of MDPI and/or the editor(s). MDPI and/or the editor(s) disclaim responsibility for any injury to people or property resulting from any ideas, methods, instructions or products referred to in the content.

