Abstract
Within the rapidly growing urban tourism industry, the development of urban landscapes plays a crucial role in shaping a city’s image and competitiveness; however, standardized and mismatched landscapes often have a negative impact, highlighting the importance of assessing urban landscape perceptions. Although existing studies have discussed this through subjective questionnaires and physiological methods, the underlying neural mechanisms have not been thoroughly explored. The research focuses on Jingdezhen, a renowned historical and cultural city in China, as its case study. Utilized the event-related potential (ERP) method to explore individuals’ perceptual consistency and neural activity toward different types of urban landscapes. We adopted a 2 (landscape type: historical, modern) X 2 (perceptual match: consistent, inconsistent) within-subject design while recording behavioral data and electrophysiological responses. The results showed that, under any condition, there were no significant differences in people’s behavioral data. Neurophysiological results indicate that consistent perceptions of modern landscapes elicited greater P200 responses, suggesting increased attention driven by visual aesthetics and emotional activation. Under conditions of perceptual inconsistency, historical landscapes elicited higher N400 amplitudes than modern landscapes, revealing cognitive conflict and effort. This study demonstrates that P200 and N400 components are effective indicators for assessing urban perception, proving the viability of the event-related potential method in urban landscape research. Additionally, the research reveals the neural mechanisms of urban environmental perception from the early stages of attention and emotional distribution to the later stages of cognitive decision-making, which involve cognitive processes from “bottom-up” to “top-down”. This study not only provides a reference for efficient design planning for those involved in urban science but also inspires the coordination between the developmental needs of historical and modern urban landscapes. Moreover, it offers a new perspective for an interdisciplinary approach to urban perception assessment.
1. Introduction
1.1. Urban Landscape and Perception Research
According to statistics from China’s National Bureau and the Ministry of Culture and Tourism, the Chinese tourism sector saw a significant revival in the first half of 2023, with domestic tourist numbers hitting 2.384 billion, marking a 63.9% growth compared to the previous year [1]. On this account, several regions have robustly developed urban landscapes that epitomize local characteristics [2]. As carriers of a city’s image, urban landscapes not only beautify spaces and enhance the quality of life but also promote the sustainable development of culture and history [2,3,4]; however, due to the rapid expansion of urban development, the natural and cultural landscapes of some cities have been damaged. Certain landscape designs tend to be utilitarian and stereotypical, potentially conveying misleading information and negatively impacting observers, and may even be detrimental to urban planning and management [5,6], underscoring the importance of research in landscape perception.
Current studies on landscape perception primarily investigate the interplay between environmental and human elements [7,8], sustainability issues [9,10], and the influence of cultural and social factors [11]. While these studies have made significant contributions both subjectively and objectively, there remains a gap in utilizing more precise and efficient scientific methods to investigate the neural correlates of landscape perception. How do people perceive these urban landscapes? When we observe differences in cognition, what neural processing mechanisms underlie these differences? With event-related potentials (ERPs), the findings contribute to a deeper understanding of the neural mechanisms underlying urban environmental perception, emphasizing the importance of integrating interdisciplinary approaches from psychology, landscape studies, and neuroscience into urban research. This provides valuable insights for managers and designers in their planning and design strategies.
1.2. Perceptual Match: Consistency and Inconsistency
The concept of perceptual matching, originating from the field of psychology, mainly elucidates the tight association between a particular phenomenon and the corresponding human response [12]. This concept focuses on comparing or matching sensory data with signals stored within the brain, thereby aiding humans in recognition and understanding. This mechanism, amalgamating perceptual input with cognitive processes, is vital not merely for efficient information processing; it also assumes a paramount role in emotional responses and decisions undertaken [13]. The concept of perceptual matching has been applied in fields such as graphic design [14,15], consumer marketing [16,17], and semantic processing [18,19]. For example, Bufquin et al. [20] investigated the impact of perceptual consistency among postmodern hotel architecture, local scenery, tourists’ self-image, and winery branding on tourist emotions and related behaviors. Lu and Hou [15] studied the semantic consistency and inconsistency of public space signage systems. Markey et al. [21] delved into the semantic as well as syntactic inconsistencies in art paintings and their neural mechanisms. Although the concept of perceptual matching has been widely discussed, it still requires further exploration in the field of urban landscape research. For designers and managers, a cognitively matched landscape design will elicit the audience feedback that designers anticipate. If the perceptual consistency among viewers can be assessed in the early stages of urban planning, it could save a significant amount of time and human resources.
1.3. The Dichotomy of Historical and Modern Perspectives
The integration of historical and modern elements in urban landscapes has always attracted scholarly attention. In 2005, the concept of the “Historic Urban Landscape” was first introduced at the international conference on “World Heritage and Contemporary Architecture—Managing Historic Urban Landscapes” [22]. In 2011, UNESCO adopted the Recommendation on the Historic Urban Landscape, highlighting the importance of historical buildings [23]. From the perspectives of urban studies and cultural geography, Lynch [24] emphasized the importance of intangible elements, such as history, which enhance the uniqueness and image of the urban environment. It also serves as a carrier of collective memory and identity, maintaining a connection with the past [4]. The historical environment of cities is the result of long-term interaction and integration between human civilization and nature. Contemporary urban design theories advocate for human-centered cities, prioritizing livability and sustainability, usually achieved by integrating modern design principles and urban infrastructure [25]. With urban advancement, the interest in harmonizing historical heritage with contemporary urban development is growing. Pintossi et al. [26] proposed new adaptation strategies for the longstanding urban cultural heritage of Amsterdam. Jiang et al. [5] took Suzhou, China, as a case study with which to explore the processes of urban heritage conservation and modern urban development, introducing the concept of historic urban landscapes; however, as Sennett [27] warned, superficially incorporating historical elements into cities can create a sense of “patchiness”, undermining the authenticity and integrity of urban spaces. Such conditions may lead to a disjunction between material spaces and the essence of urban culture. Balancing the need for historical features and modernity in urban development presents a challenge for managers and designers. These reasons highlight the importance of conducting research from both historical and modern perspectives. Starting from deep neural mechanisms, we aim to reveal the perceptual differences between these two typical urban landscape images, thereby devising more inclusive urban design and planning sustainable strategies.
1.4. Previous Research Methods and Limitations
Perception studies have primarily relied on subjective methods, such as self-reports and questionnaire surveys [28,29]. The advantage of these methods is their ability to collect rich data from a wide range of samples; however, these methods have limitations, such as the inability to capture participants’ emotional responses in real time, which may lead to discrepancies between reported experiences and actual feelings [30,31]. Additionally, traditional data collection may be influenced by participants’ environments and willingness, with cognitive processing often occurring unconsciously or during distraction, which direct interviews may not fully reveal [32].
Considering these limitations, the academic field has started to utilize physiological experimental methods for more in-depth exploration. Physiological measurement technologies, such as eye tracking, electromyography (EMG), a galvanic skin response (GSR), an electroencephalogram (EEG), and an electrocardiogram (ECG), can objectively record participants’ physiological responses. Analyzing these indicators can establish a relationship between specific physiological responses and perceptual behaviors. For instance, Zhu et al. [33] conducted research on the environmental factors related to nighttime walking safety by using GSR and GPS signals. Li et al. [34] combined eye tracking and ECG data to analyze the emotional impact of high-density urban riverside spaces on individuals. Bower et al. [35] measured people’s responses to color adjustments in architectural environments using EEG brain signals. The study indicates that the use of blue in buildings increases the range of neural activity in the brain, involving emotional processing. Kim et al. [36] used EEG to analyze emotional perception and experiences of fear in nighttime environments, offering a novel approach to analyzing nightscapes. Sun et al. [37] combined physiological indicators such as wrist and forehead blood pressure and heart rate, among five parameters, to evaluate people’s perceptions of environmental factors like temperature, lighting, and sound levels. Wang et al. [38] tracked people’s views on public visual behavior through eye movement indicators. Qin et al. [39] conducted a quantitative assessment of the visual appeal of highway landscapes by combining eye-tracking, EEG, ECG, and other physiological measurement methods.
Although physiological measurement methods have provided new perspectives and objective data for perception research, these technologies also face their own challenges and limitations. For example, research has shown that individual differences, such as age, gender, and body temperature, can affect the results of a galvanic skin response, making the comparison of GSR data across individuals complex [40,41]. Moreover, although an ECG can capture the physiological differences between positive and negative stimuli, it cannot effectively distinguish emotional changes occurring a few seconds before the stimulus appears [42]. These constraints highlight the necessity of acknowledging the limitations inherent in these physiological measurement technologies when employing them. Therefore, consistent with this study’s objectives, it is necessary to explore more precise physiological means for gauging the participants’ landscape perception experiences.
1.5. Event-Related Potential-Based Method for Perceptual Evaluation
Event-related potentials (ERPs), a validated non-invasive neurotechnological method, are preferred for obtaining brain data due to their low cost and high temporal resolution [43,44]. The core characteristics of ERPs include amplitude, latency, and distribution across brain regions, all of which are key factors in precisely describing the brain’s response to specific events [45]. For example, the central N200 component refers to a negative fluctuation recorded in the central brain region within 200 to 300 ms after a stimulus occurs. ERP components not only reveal emotional responses but are also crucial for a deeper understanding of the complexity of cognitive functions within the brain [45,46].
P200, an early-appearing positive potential component, typically peaks approximately 200 ms after stimulus onset, with primary activity in the frontal–central and occipital regions [47,48]. It is interpreted as being linked to shifts in attention, the allocation of cognitive resources, and emotional arousal [32,49,50]. Studies show that stimuli-matching cognitive states can elicit positive responses [51,52]. Furthermore, the amplitude of P200 significantly increases in response to positive or beneficial stimuli [32,53]. As demonstrated by Guo et al. [54] on preferences for robot appearances, the results indicated a significantly increased P200 amplitude in individuals’ responses to preferred robots compared to non-preferred ones. Cao et al. [53] investigated the visual appeal of smartphone icons, specifically between anthropomorphic and non-anthropomorphic icons. The outcome revealed that appealing anthropomorphic icons elicited more intense P200 responses than their non-anthropomorphic counterparts. Based on related studies, we propose Hypothesis 1:
H1:
When individuals encounter perceptually consistent urban landscapes, it triggers an increased P200 component.
The N400 component, an essential ERP index for investigating language comprehension and processing, belongs to the category of the brain’s endogenous potentials, characterized by a peak that typically occurs around 400 ms following stimulus presentation. N400 is primarily associated with the retrieval of semantic information from long-term memory and the processing of higher-order cognitive conflicts [55,56]. Traditionally, N400 has been linked to semantic or lexical conflicts; however, even non-linguistic stimuli, if they are meaningful and present conflicting information, can also elicit an N400 response [57,58]. This indicates that N400 can reflect information that does not match expectations; for instance, Shi et al. [59] observed a significant increase in N400 amplitude with low-design-aesthetic products in their study related to product design aesthetics. It uncovered the discrepancy between labels and expected prices. Markey et al. [21] found that inconsistencies in the meanings and structures of paintings triggered the N400. Based on the previous studies, we propose Hypothesis 2:
H2:
When people are confronted with perceptually inconsistent urban landscapes, it leads to an increased N400 component.
This research intends to investigate the perceptual consistency and associated neural responses in individuals when they encounter diverse urban landscapes, utilizing neuroscience techniques. We employ the ERP research method, combining the S1–S2 experimental paradigm of images and text with a 2 (landscape type: modern, historical) X 2 (perceptual match: consistent, inconsistent) factorial repeated measures experimental design to record corresponding behavioral and ERP data. The study hypothesizes that participants will exhibit different neural activities when confronted with consistent or inconsistent urban landscapes, resulting in corresponding P200 and N400 components. Our goal is to identify some neurophysiological indicators that reveal individuals’ genuine feelings and matching cognitive behaviors upon viewing urban landscapes, provide an objective evaluation method and neural indicators for urban landscape planning and environmental perception, and promote the application of cognitive neuroscience in urban research.
2. Materials and Methods
2.1. Study Area
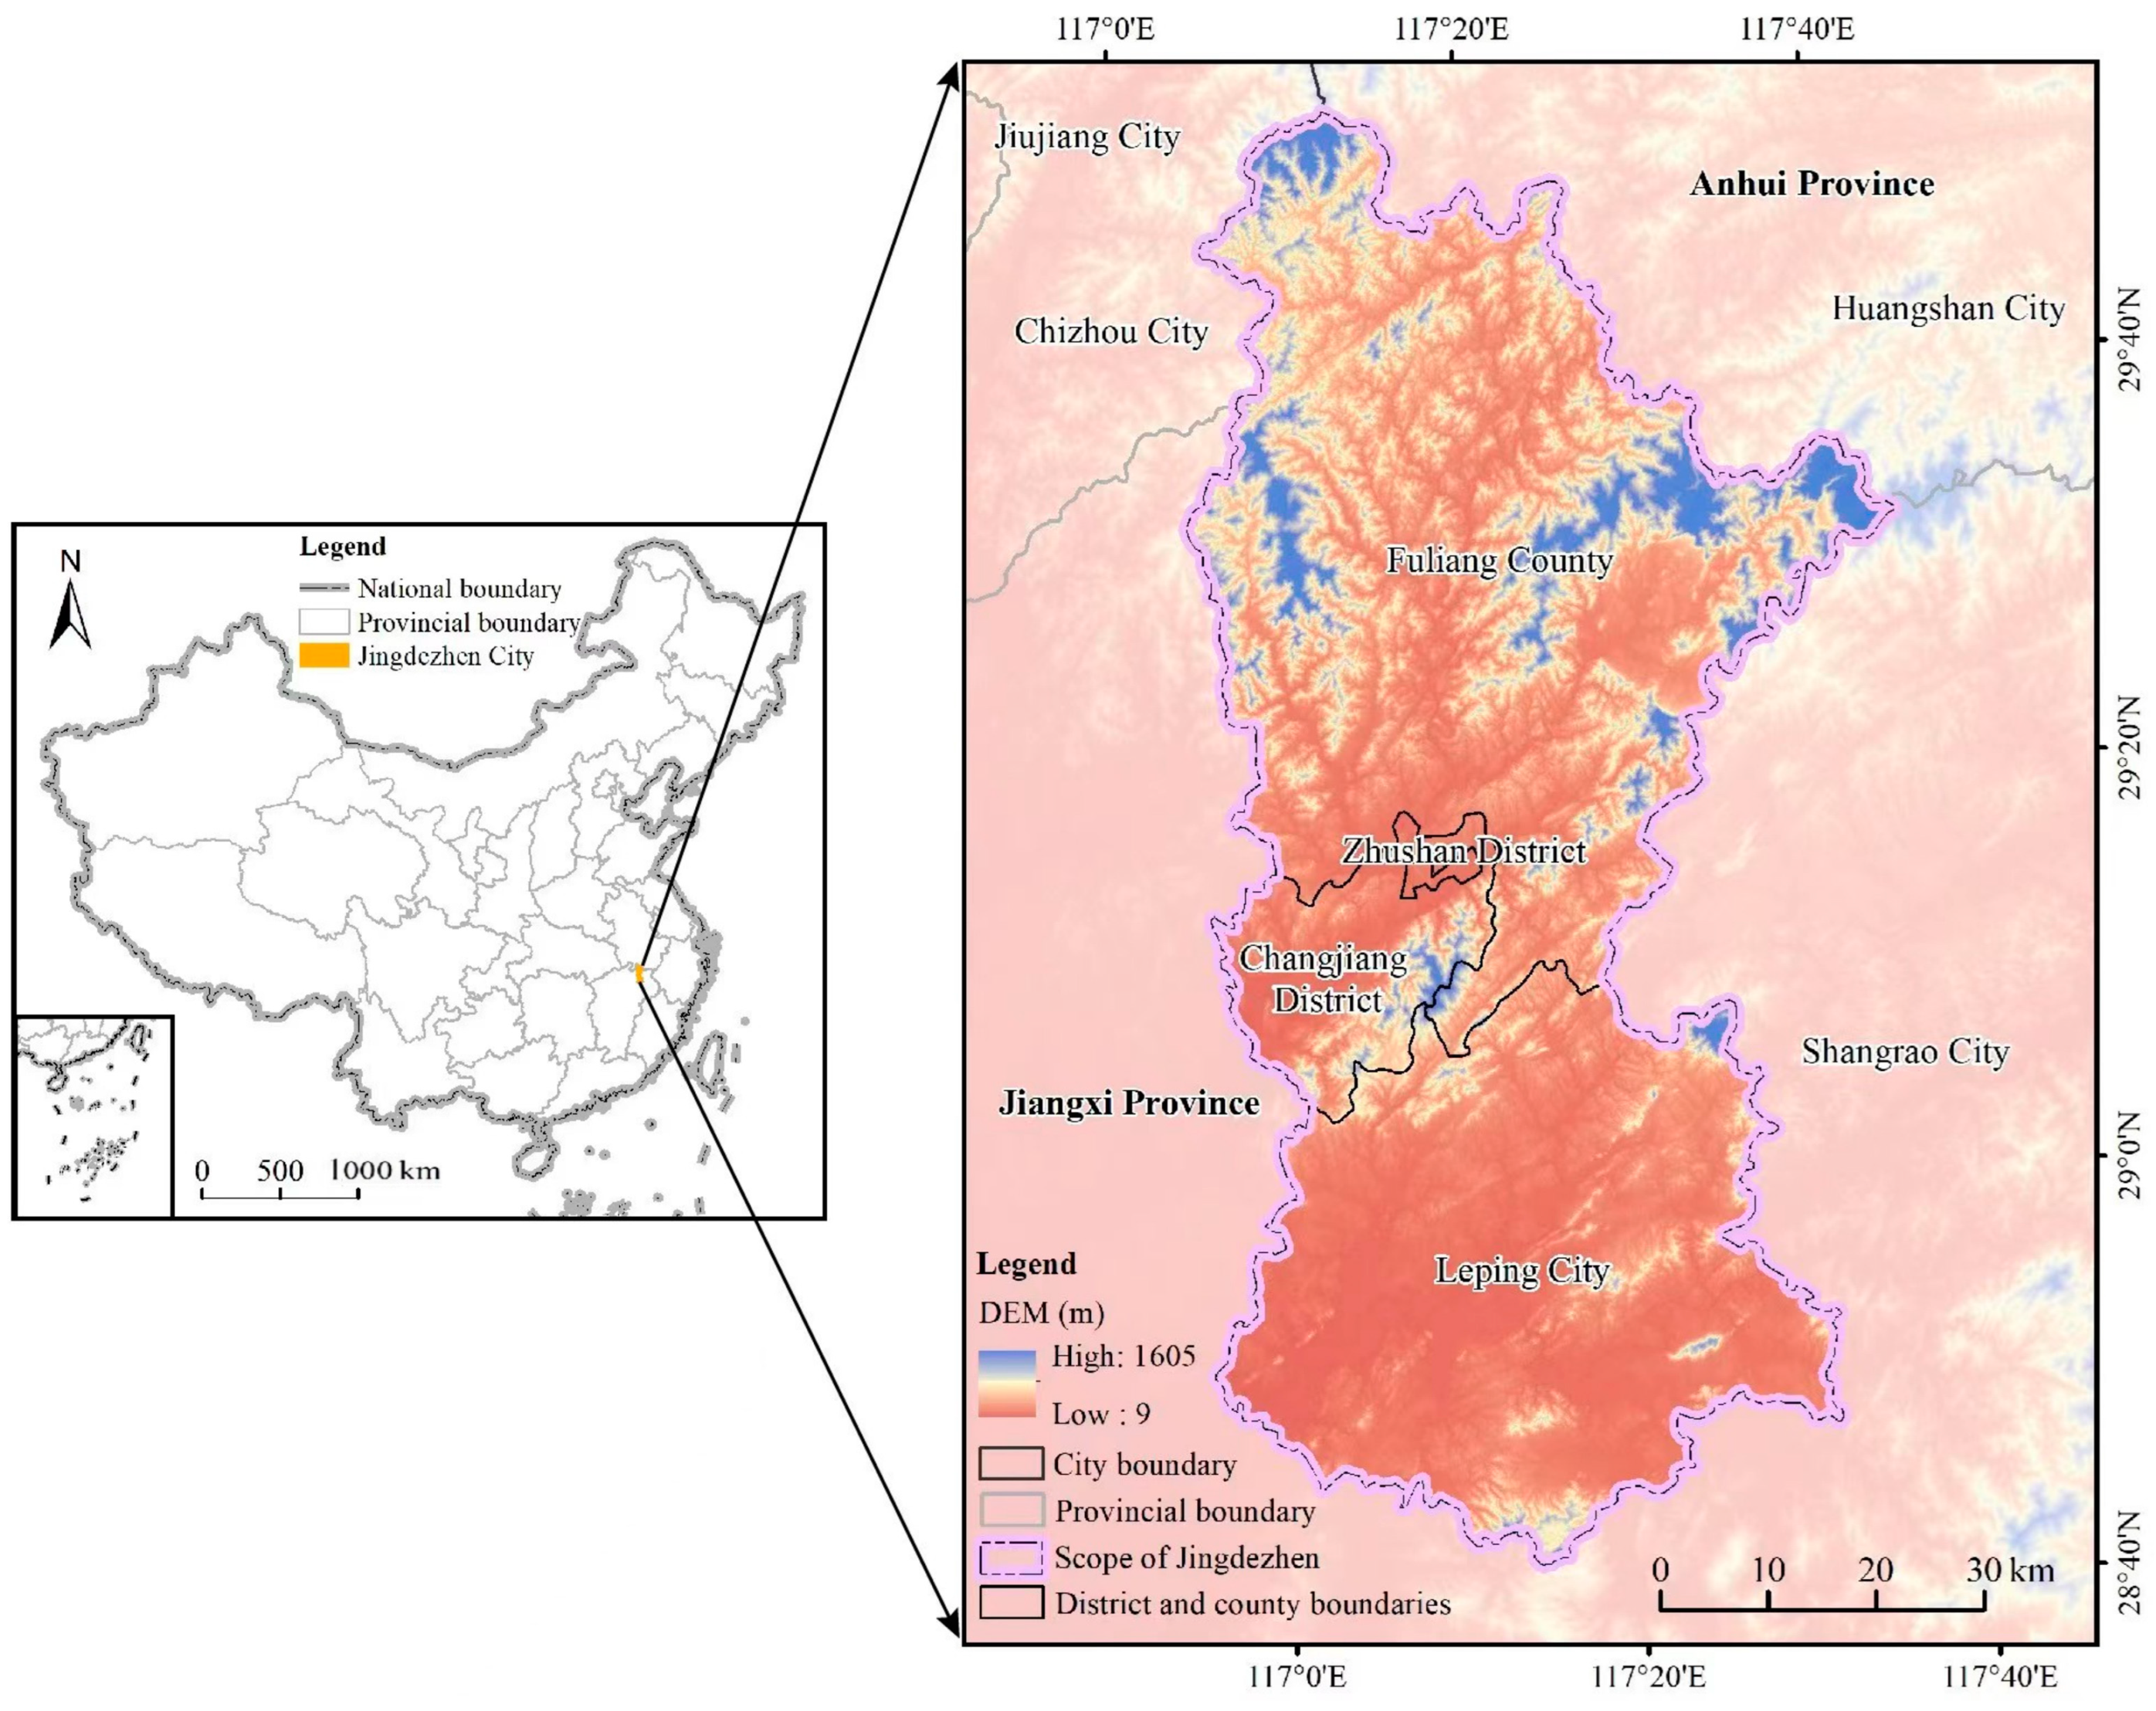
The study area focuses on Jingdezhen City, a prefecture-level city under the jurisdiction of Jiangxi Province, People’s Republic of China (see Figure 1). It is in the northeastern part of Jiangxi Province. The urban area of Jingdezhen covers 355.9 square kilometers. As of the end of 2022, the population was approximately 1.6219 million, accounting for about 3.58% of the total population of Jiangxi Province [60].
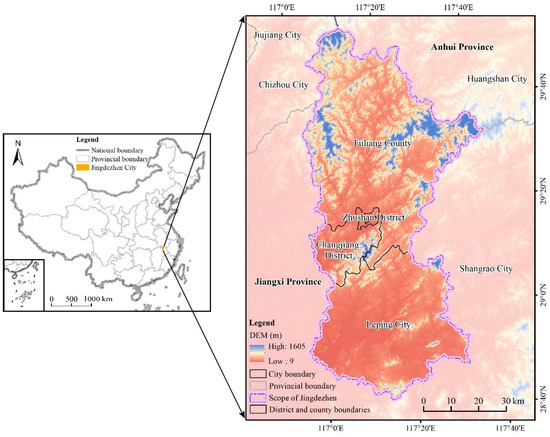
Figure 1.
Regional overview of the Jingdezhen area.
Jingdezhen has been producing porcelain since the Five Dynasties period, undergoing a millennium of development. It is one of the first historical and cultural cities approved by the State Council, with over 150 ancient kiln sites and 108 old streets as cultural relics, as well as a national tourist attraction featuring the world’s only completely preserved intangible cultural heritage production line for ceramics: the Jingdezhen Ancient Kiln Folk Customs Expo Area. As of December 2023, Jingdezhen has established 20 national- and provincial-level cultural industry demonstration bases, 100 intangible cultural heritage productive protection demonstration bases, and 1899 intangible cultural heritage inheritors [61,62]. Jingdezhen’s rich cultural heritage history has endowed it with numerous historical landmarks and fostered a series of unique cultural landscapes centered around the creation and production of ceramics.
The achievements of Jingdezhen, a city renowned for its historical and cultural significance in China and internationally, sufficiently attest to its representativeness. In 2014, Jingdezhen was designated by UNESCO as a City of Crafts and Folk Art [63]. In August 2019, Jingdezhen was approved as China’s sole cultural experimental zone—the Jingdezhen National Ceramic Cultural Heritage and Innovation Experimental Zone. Furthermore, Jingdezhen has established friendly relations with over 180 cities from 72 countries, leveraging platforms like the “Capital of World Handicrafts and Folk Art” and the “United Nations Marine and Land Silk Road Cities Alliance” [64].
Furthermore, Jingdezhen, as an emerging popular tourist city, has an increasingly significant influence. During the 2023 National Day holiday, the city welcomed a total of 8.5199 million visitors, a 42.26% increase compared to 2019 [65]. It also earned the title of National Excellent Tourism City due to having 19 national scenic spots. Here, one can find modern art galleries, creative cultural districts, and pottery markets. An increasing number of young people visit to experience pottery making and participate in various art fairs. Classical and trendy cultures converge in this small city.
While cultural tourism has greatly promoted the local economy and urban image, the increase in tourist numbers has also brought issues such as historical district overload, crude landscape design, and neglect of local culture. Therefore, from the perspective of both historical and modern urban landscapes, choosing Jingdezhen, a typical cultural tourism city, as the research subject to study the perceptual consistency among audiences holds significant practical relevance. The framework diagram of the research method is shown in Figure 2.
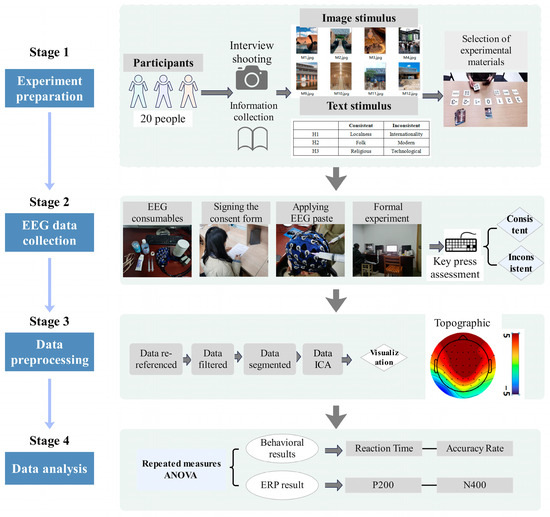
Figure 2.
Framework diagram of the research method, including four stages, from experimental preparation to data analysis.
2.2. Participants
Participants in this study were recruited from Jingdezhen Ceramic University. Based on similar studies [58,66] and sample size estimation using G*Power 3.1, the initial sample size was set at 22. During the EEG data preprocessing, data from 2 participants were excluded due to significant bodily swaying, resulting in a final sample size of 20, with an age range of (mean = 21 ± 1.73, 20–25 years, 10 females). Upon screening, all subjects had normal vision, were right-handed, and had no known psychiatric disorders, alcohol, or drug intake. Participants signed an informed consent form after being briefed about the experiment’s content. The experiment was approved by the Fifth People’s Hospital of Jingdezhen and conducted under the standards set forth in the Declaration of Helsinki. Participants received compensation of RMB 80 upon completion of the experiment.
2.3. Experimental Stimuli
The stimuli for this experiment comprised two components: firstly, landscape images reflecting the visual characteristics of the landscape, and, secondly, descriptive words depicting the content of the landscape.
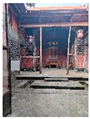
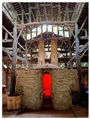
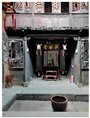
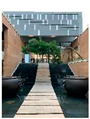
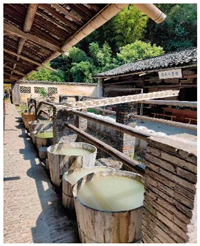
In some studies, photographs have been used as tools for landscape evaluation [67]. Although this method is somewhat controversial, mainly because it lacks physical contact with the scene, it has generated research that assesses individuals’ perceptions of landscapes through photographs, showing little difference from in situ studies [68]. Landscape images were categorized into two types: historical landscapes, including local folk architecture, temples, kiln sites, traditional workshops, etc., and modern landscapes, such as local art buildings and creative districts. The images were sourced through field photography conducted by research personnel. Between September 14 and 21, 2023, from 10 a.m. to 4 p.m., photography sessions were conducted at popular local tourist spots (Table 1).

Table 1.
Locations of the experimental materials selected for this study representing both historic and modern landscapes of Jingdezhen.
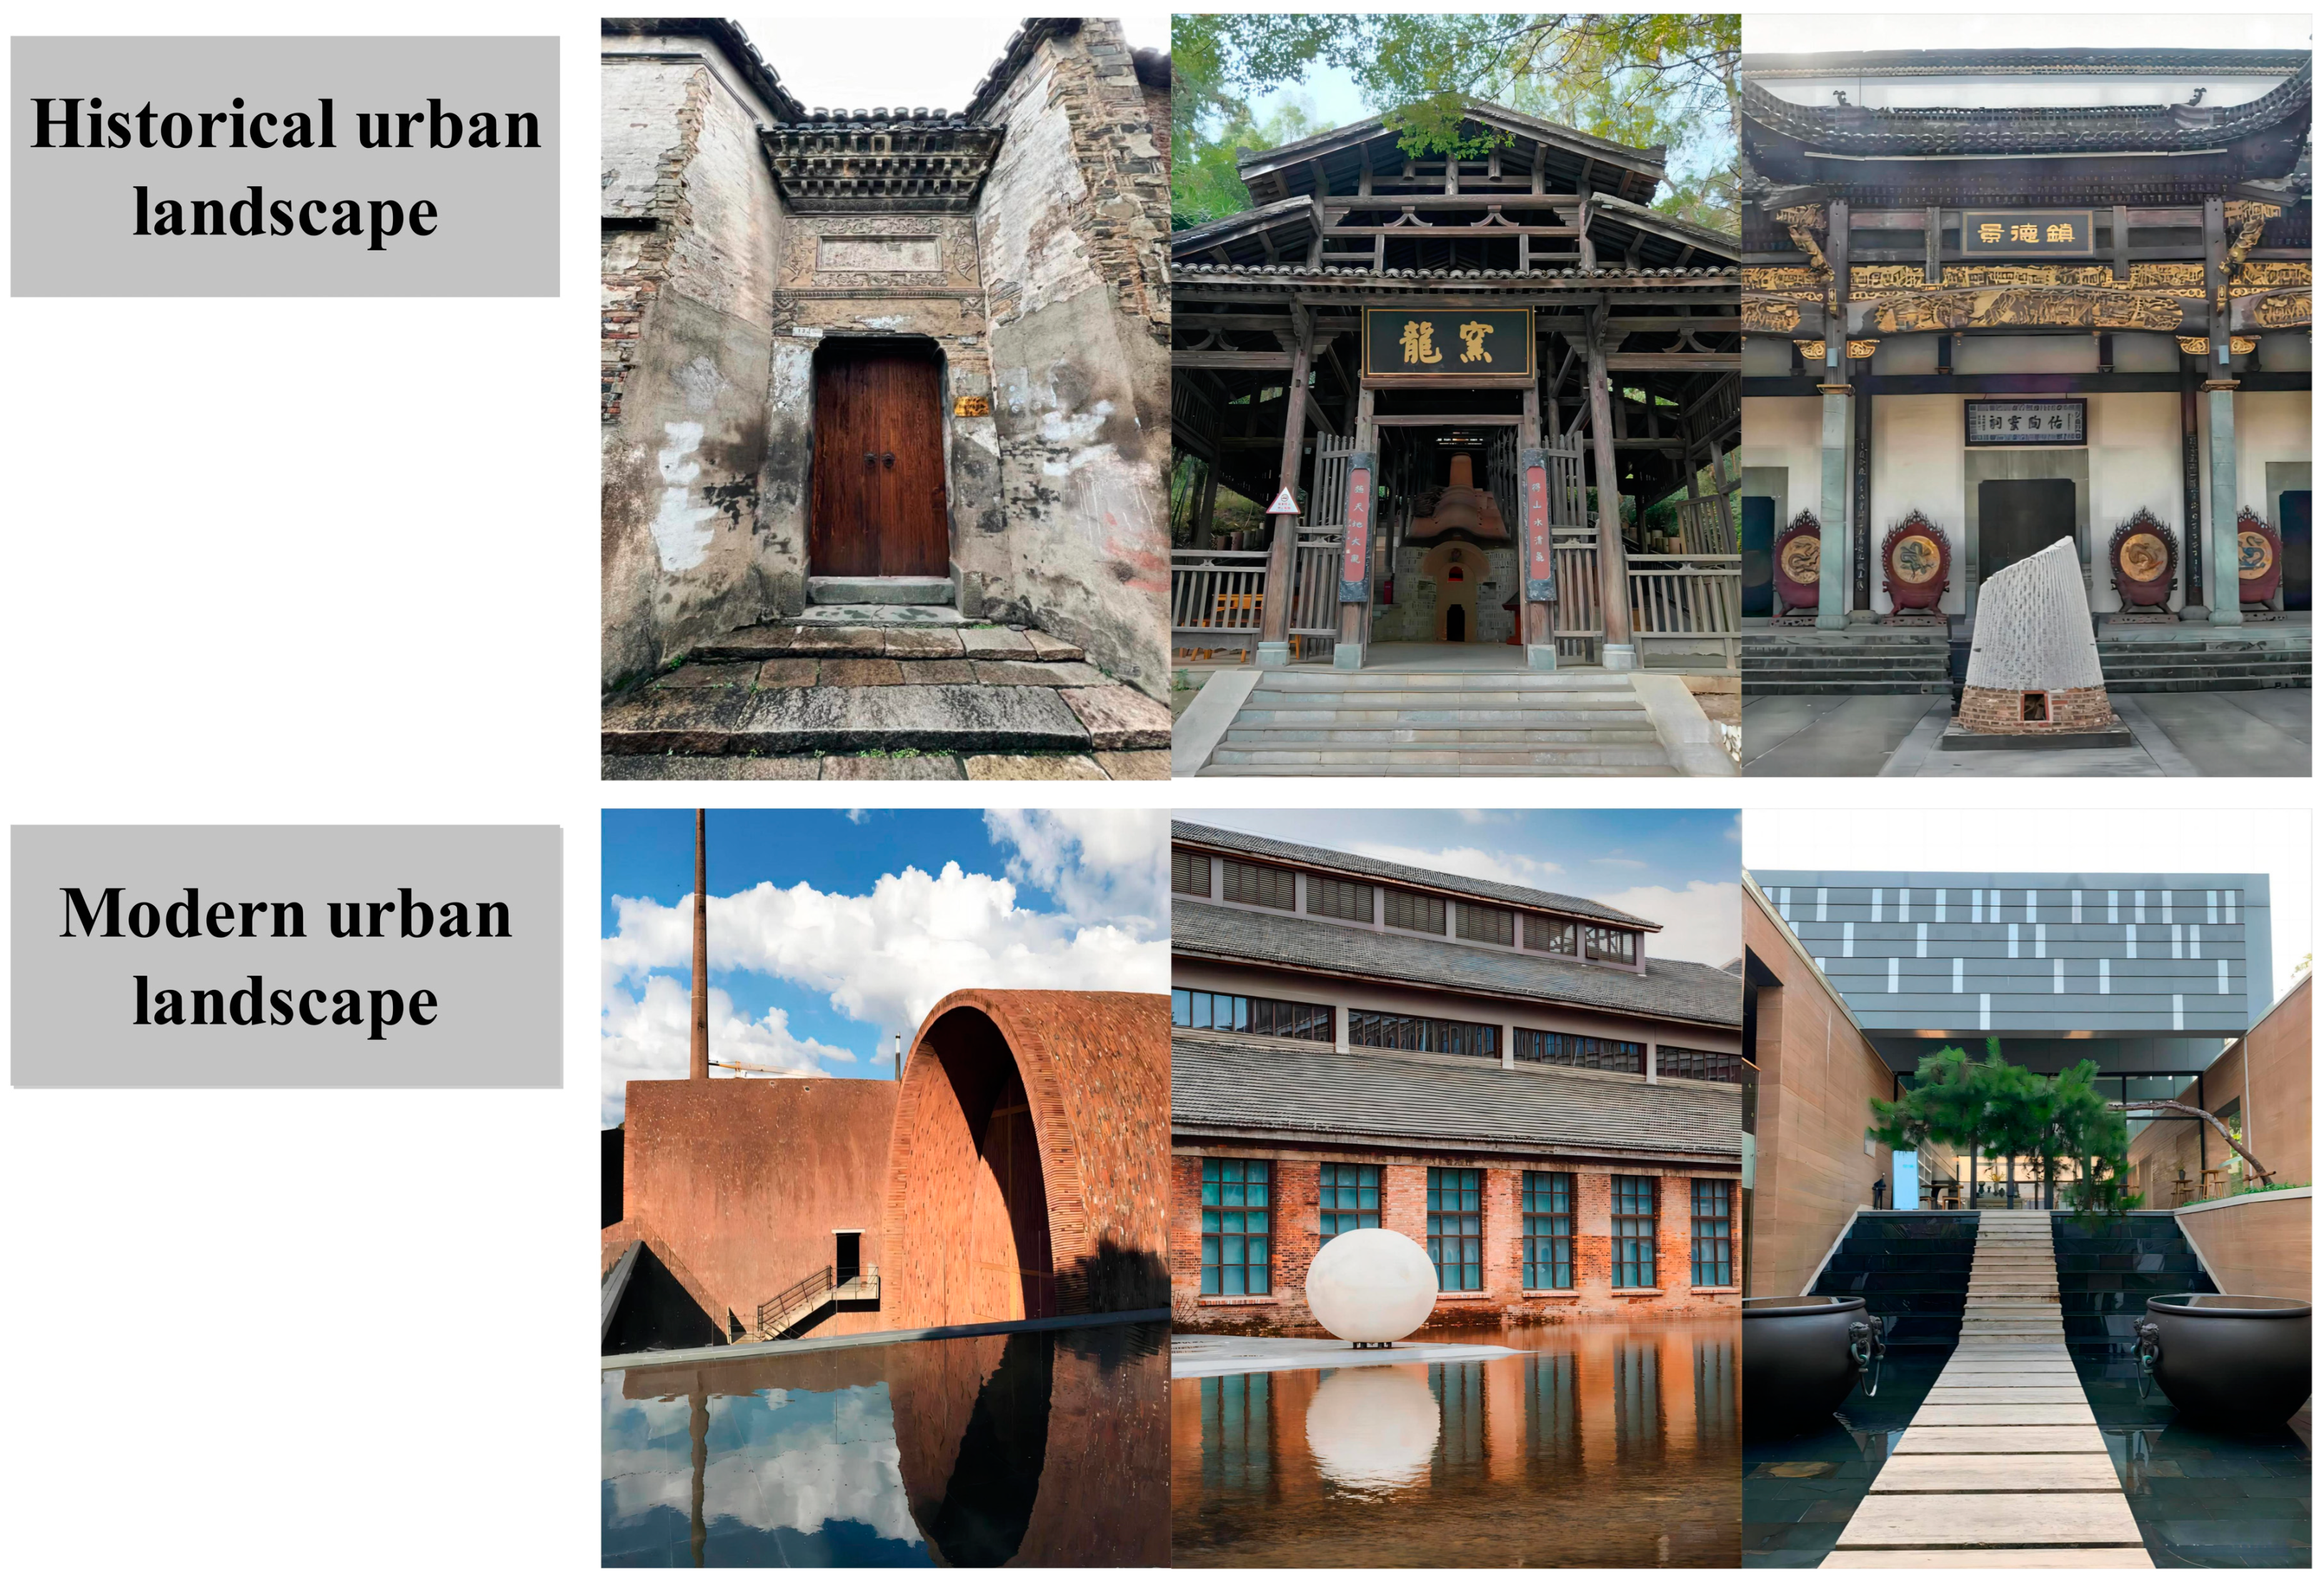
To minimize the impact of lighting and weather, all photos were taken in clear weather with good lighting conditions. The criteria for photo selection and shooting were as follows: (a) typical representation of the landscape category; (b) clear and identifiable main content; and (c) no significant difference in perspective. Ultimately, 60 relevant images were selected for the material library. Subsequently, in a pre-test questionnaire using a 7-point Likert scale (1 = strongly disagree, 7 = strongly agree), five landscape design experts were invited for an online survey. They scored the characteristic degree of the two types of urban landscapes. Based on the scoring results, the highest-scoring 13 images from each category were selected, totaling 26 images (2 × 13) as experimental stimuli (Appendix A). A paired-sample T-test showed a significant difference between the two sets of materials (t = 5.53, p < 0.001). Finally, the images were standardized in terms of size, specifications, and pixels using Adobe Photoshop 2023, as shown in Figure 3.

Figure 3.
Experimental stimuli of historical and modern landscapes from Jingdezhen.
In terms of consistency materials, this study references the semantic analytic method proposed by Osgood [69], utilizing landscape affective vocabulary for representation. It is a method for researching the emotional meanings of vocabulary, allowing for the quantification of affective vocabulary. By using a series of comparative adjectives (e.g., “good” vs. “bad”), it evaluates the scores of affective vocabulary scales for research purposes, thus gaining wide application in the fields of linguistics and psychology. In this study, by combining the literature [70] and research summaries, 56 pairs of adjectives related to the landscape were collected. By excluding words with similar or identical meanings, a final set of 40 pairs of image-based vocabulary was determined. Lastly, five experts were also invited to pair the affective vocabulary with the content of the landscape images. We used a 7-point semantic scale for classification (−3 to +3). The closer to −3, the less the word pair corresponds with the content of the image; conversely, +3 indicates a higher correspondence between the word pair and the image content. Word pairs that matched across different materials could be shared, ultimately selecting 9 pairs of words for the 26 landscape image stimuli to enter the final experiment, as shown in Table 2.
Table 2.
Nine sets of landscape imagery vocabulary selected after evaluation.
2.4. Experimental Procedure
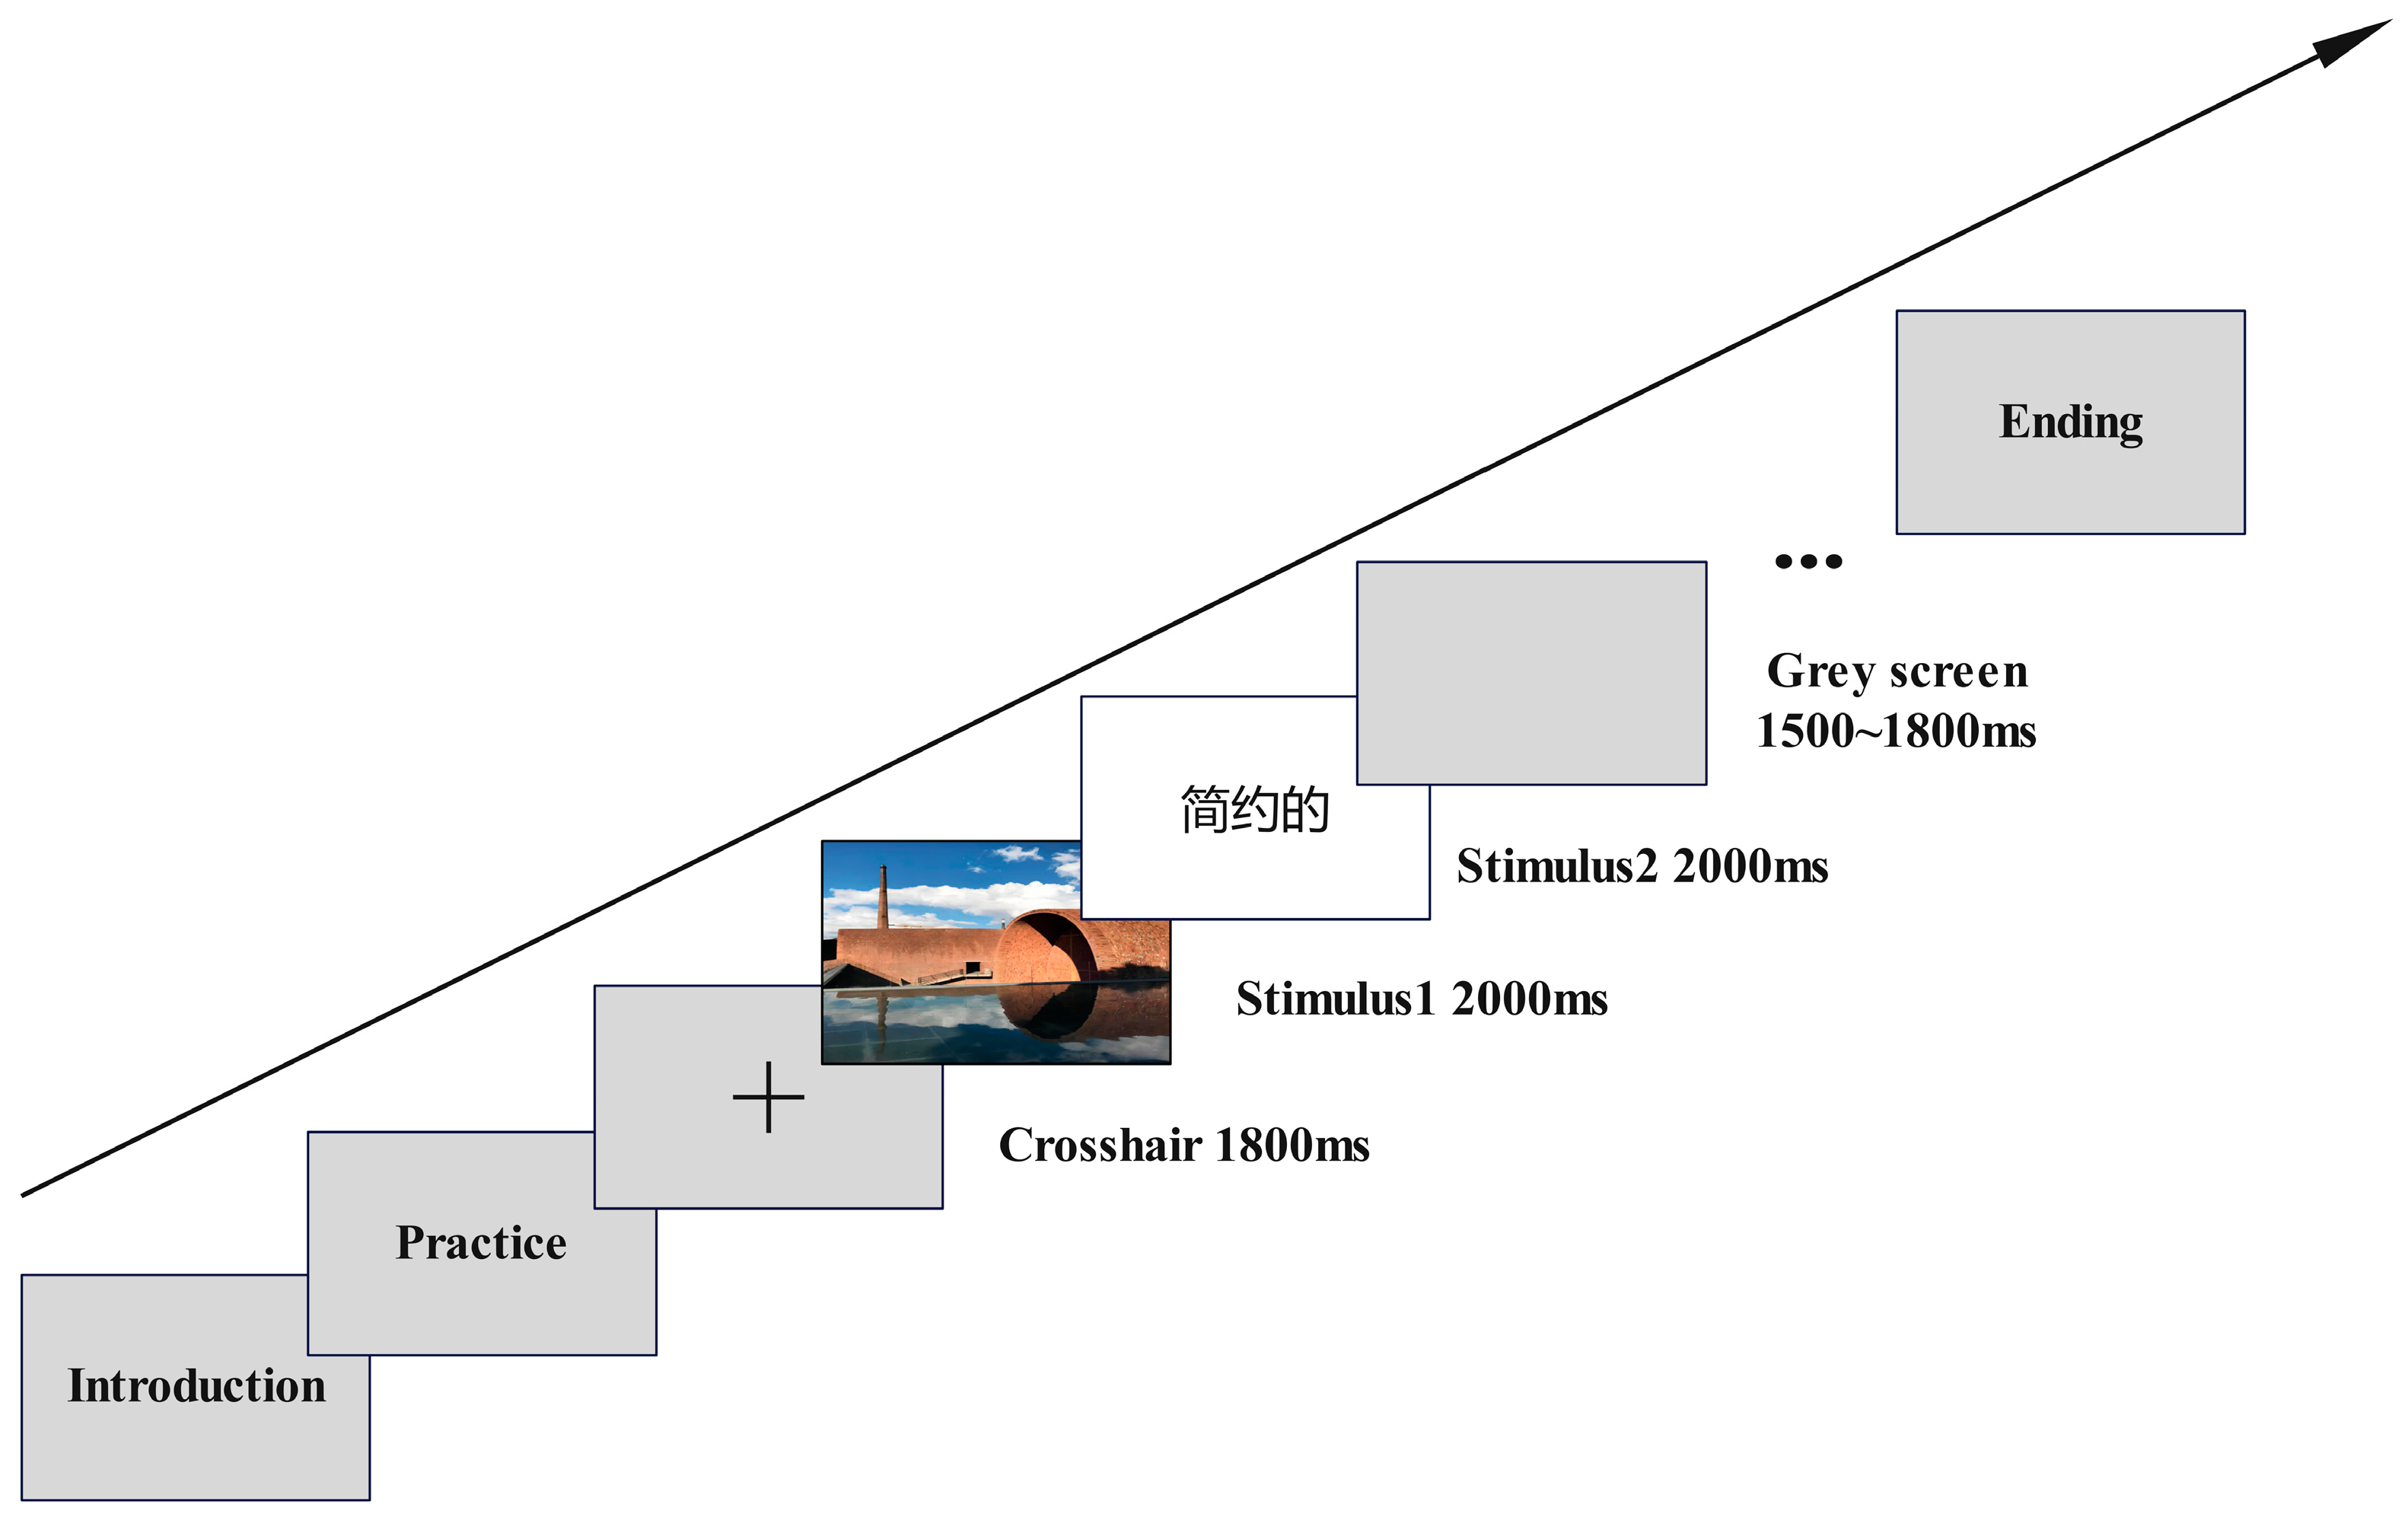
The experiment aims to explore the perceptual differences between consistency and inconsistency when individuals are faced with urban landscapes of historical and modern types, requiring the presentation of stimuli in the form of images and words. Therefore, we utilized the S1–S2 experimental paradigm, which has been applied in some non-semantic processing studies [15,58], with the experimental procedure flow depicted in Figure 4. The experiment was conducted in a well-lit and stable indoor environment. The monitor was positioned approximately 70 cm from the participants, with a field of view maintained at 31.5° × 18.9° (width × height), a resolution of 1920 × 1080, and a size of 24 inches. The ERP experiment protocol was programmed and executed using Eprime 3.0. The experimental materials consisted of 13 × 4 (historically consistent image–word pairs, historically inconsistent image–word pairs, modern, consistent image–word pairs, and modern inconsistent image–word pairs), making up 52 sets of materials, randomly repeated 4 times, for a total of 208 trials. Following a brief introduction and declaration unrelated to the experiment’s content, participants entered the experimental phase. Initially, instructions appeared on the monitor, and after the participants were ready, they entered the pre-experiment phase. Participants proceeded to the official experiment by pressing the spacebar once they were familiar with the experimental content. A crosshair appeared on the screen for 1800 ms to focus the participants’ attention, followed by the presentation of the S1 image stimulus for 2000 ms and then the S2 word stimulus, also lasting for 2000 ms. Between the two sets of “image–word” stimuli, there was a grey interval background lasting 1500–1800 ms. Participants were instructed to press the “Y” key when the image and word content matched and the “N” key when they did not. All stimuli were alternately presented until the task was completed. The experiment lasted 60 min, including two short breaks.
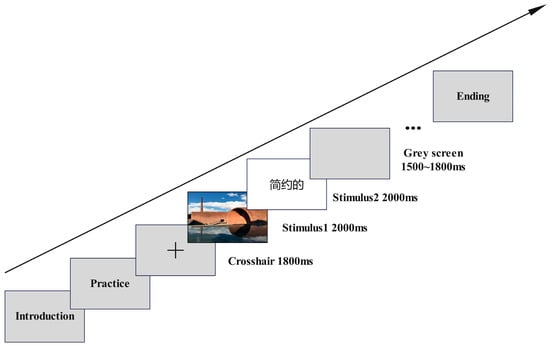
Figure 4.
Experimental procedure. In the experiment, participants are required to make quick judgments based on the displayed images and phrases as to whether their content is consistent or inconsistent. The Chinese word “简约的” appearing in the image means “Minimalistic”.
2.5. Data Acquisition and Analysis
This experiment utilized the Brain Products EEG signal acquisition system, continuously recording EEG data via a 64-channel Ag/AgCl electrode cap based on a standard 10–20 system. Data acquisition was performed using Recorder 2.0 software, with a sampling rate set at 500 MHz. The reference electrodes were allocated to the bilateral mastoids (M1, M2), and the ground electrode was positioned at FCZ. VEOG and HEOG electrodes were affixed with physiological tape under the right eye socket and at the outer canthus of the left eye, respectively. Throughout the experiment, the resistance of each electrode was strictly maintained below 5 kΩ.
After completing data recording, EEG data preprocessing was conducted using the MATLAB 2023a EEGlab toolbox. The specific steps are as follows:
- (1)
- Data format conversion and electrode positioning. Initially, the device manufacturer’s data format needs to be converted into a generic format compliant with analysis standards, and the corresponding coordinate file for electrode positioning is located based on the EEG cap model provided by the manufacturer.
- (2)
- Data filtering. The ERP components of evoked potentials are triggered by specific cognitive activities, each with a different frequency range. To eliminate unwanted frequencies, further digital filtering is required to obtain the desired data. This study uses a 0.1–30 Hz band-pass filter to retain frequencies within a specific range.
- (3)
- Baseline correction. Since the original waveform may be offset after digital filtering, baseline correction at the beginning of the waveform is necessary. This study selects the 200 ms period before stimulus onset as the baseline for correction.
- (4)
- Data segmentation. Since EEG data are recorded in continuous segments containing relevant stimulus markers and irrelevant signals between markers, it is necessary to segment the EEG data to extract and analyze key segment information. The EEG components in ERP experiments typically appear within 1000 ms; thus, this experiment segments the data from −200 ms to 1000 ms relative to the stimulus onset.
- (5)
- Independent component analysis (ICA). After data segmentation, manual selection is required to remove segments with poor signal quality and faulty channels. ICA is then used to eliminate artifacts such as ocular and muscular activities. According to international standards, each condition must consist of more than 30 segments to achieve high-quality data. In this study, each condition was maintained at over 40 segments following experimental preprocessing.
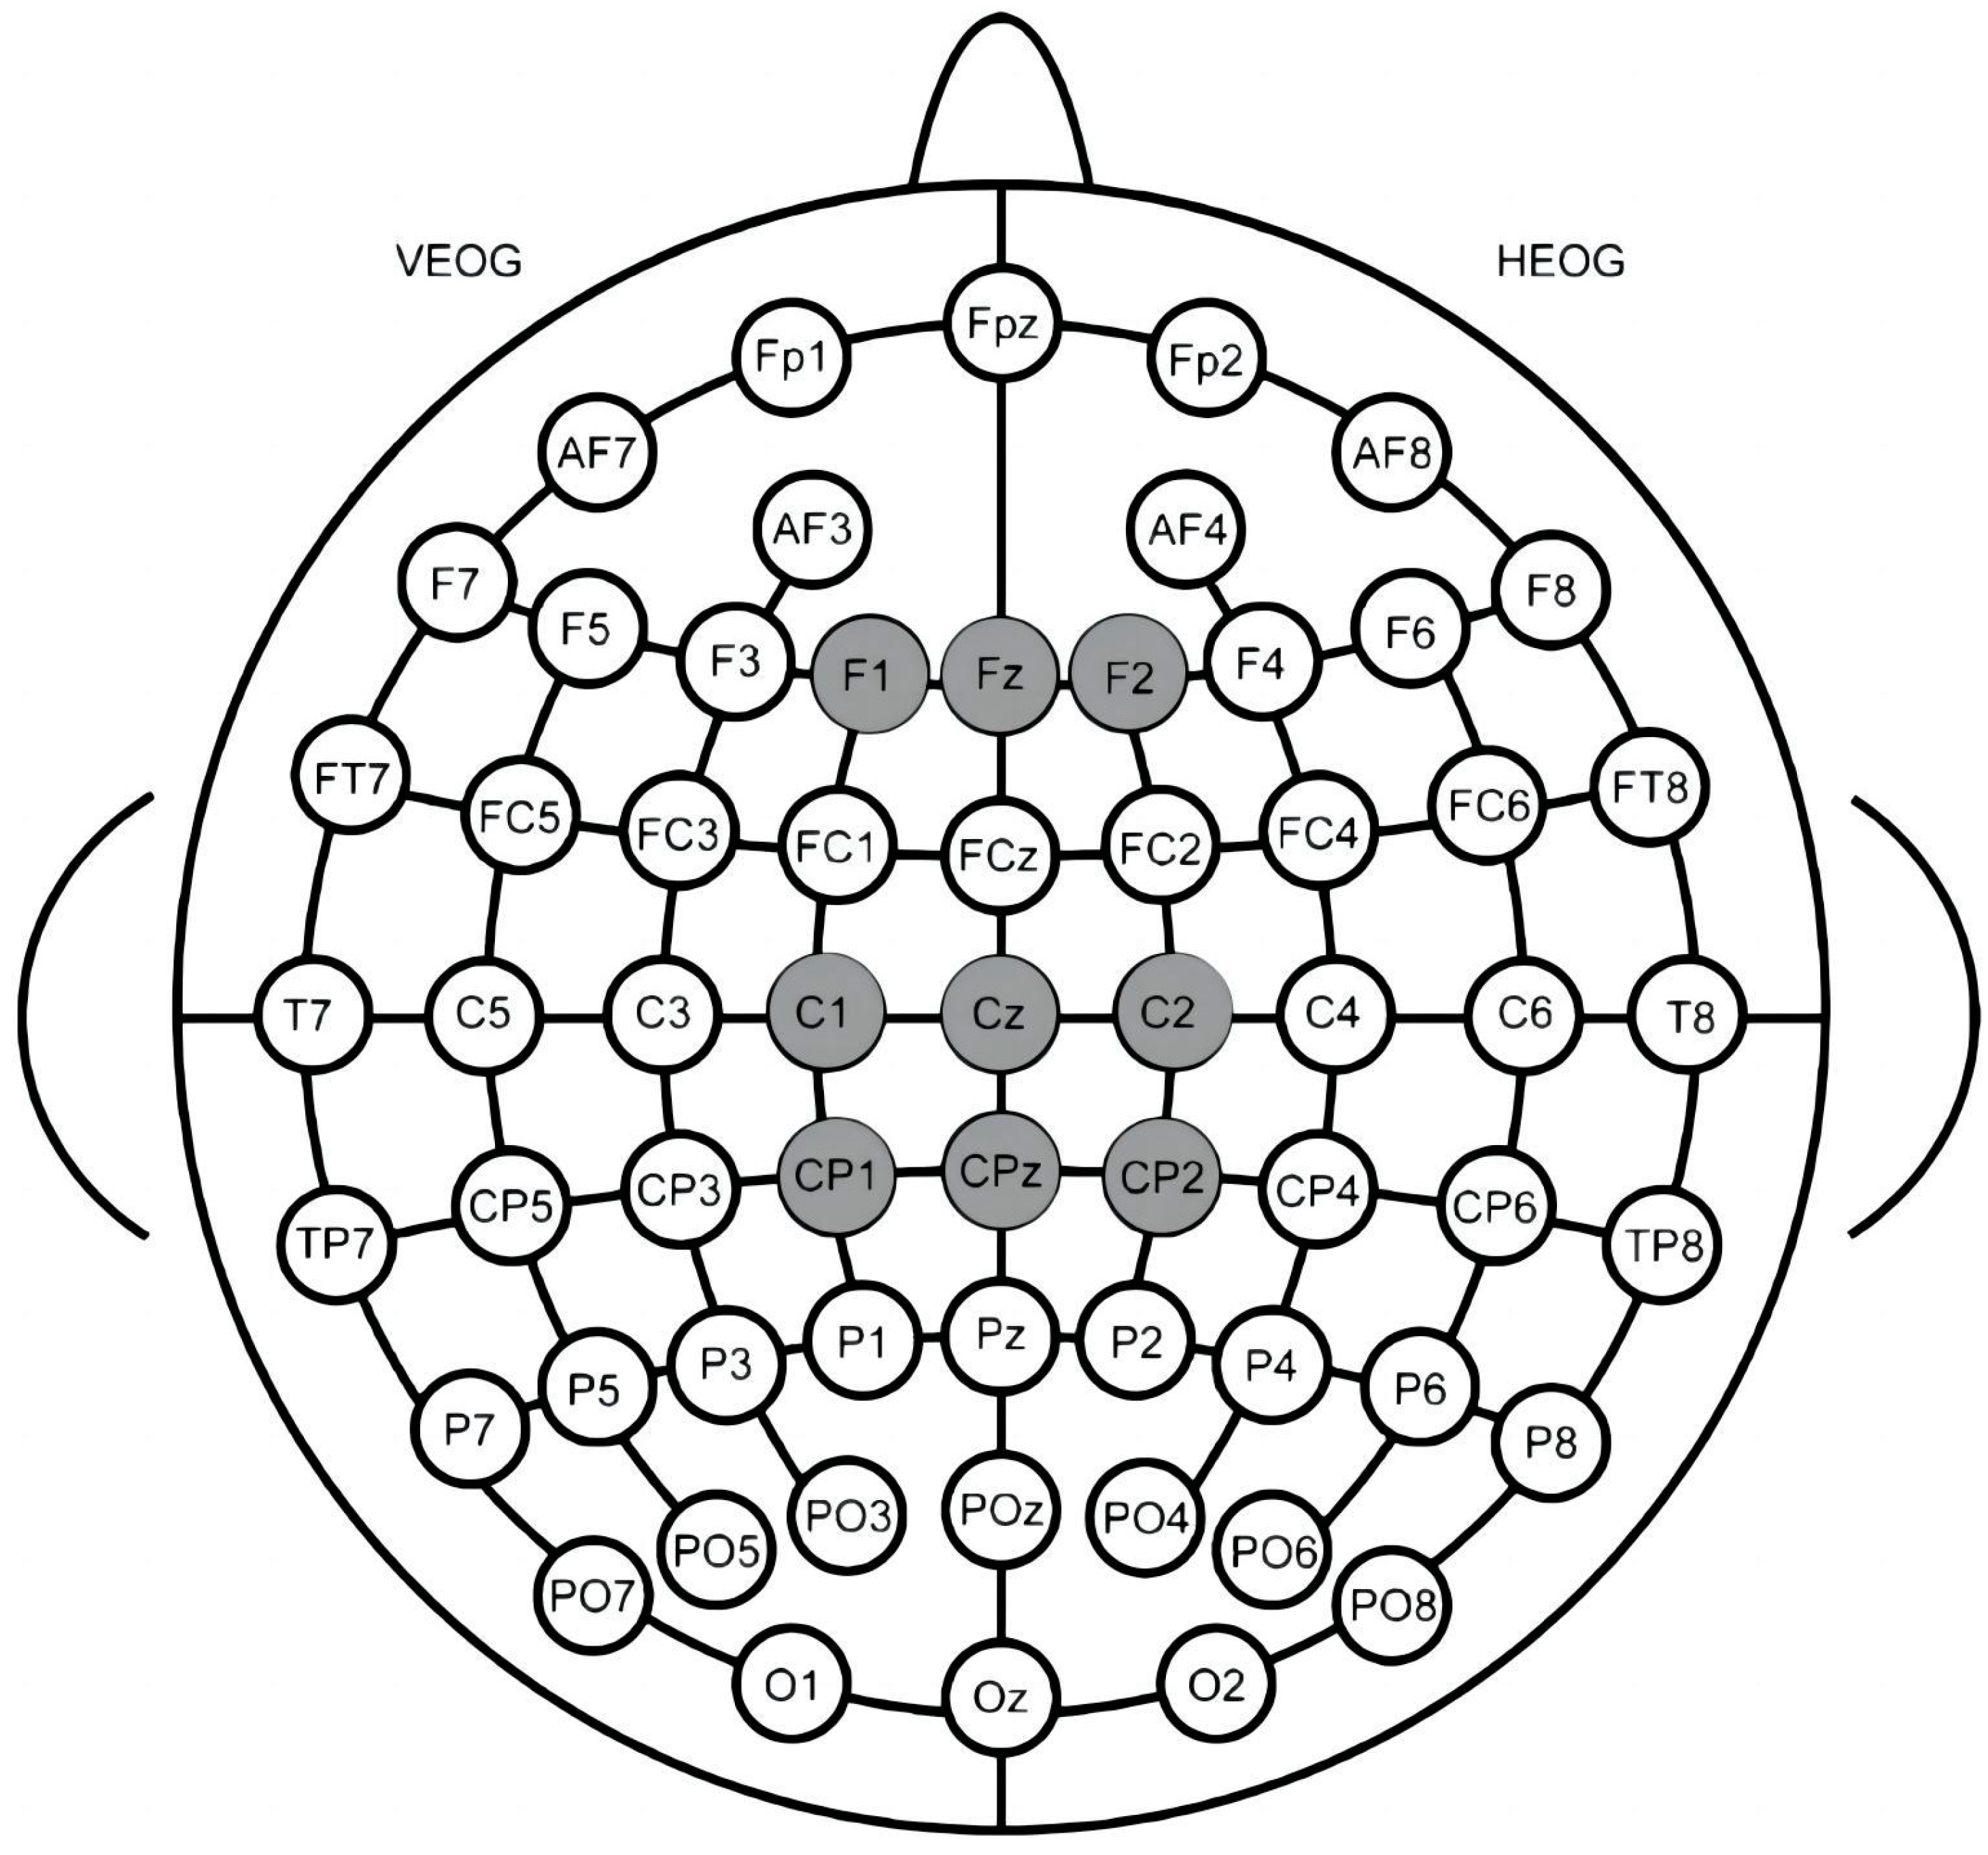
Based on the experimental content of this study and observations from whole-brain waveform graphs after the experiment, as well as related research [15,71,72], the P200 component within the 220–260 ms time window was selected for analysis, in conjunction with nine electrode points (C1, C2, CZ, CP1, CP2, CPZ, F1, F2, and FZ) located in the central, central–parietal, and frontal brain regions. Similarly, the N400 component within the 310–340 ms time window was analyzed using six electrode points (C1, C2, CZ, CP1, CP2, and CPZ) in the central and central–parietal brain regions (Figure 5).
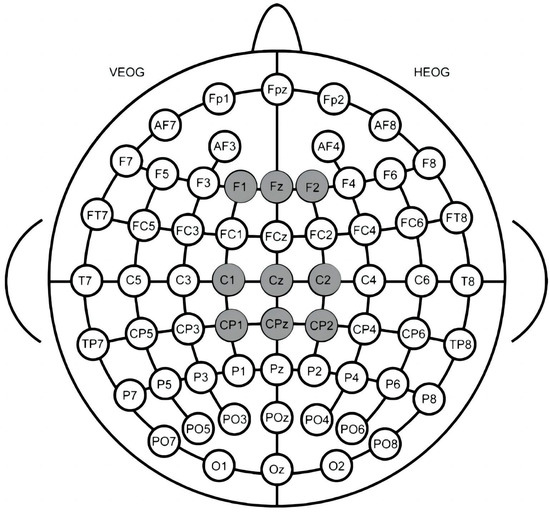
Figure 5.
The electrode distribution diagram for this study, analyzing nine electrode points across three brain regions: central (C1, C2, CZ), frontal (F1, F2, and FZ) and central–parietal (CP1, CP2, CPZ).
ERP data typically involve repeated measurements of subjects at multiple time points, such as the P200 component within the 200–260 ms window and the N400 component within the 300–340 ms window. Furthermore, ERP experiments often include various types of stimuli or different task conditions. Repeated measures analysis of variance (ANOVA) can account for the responses of each participant under all conditions.
In this study, we determined the mean amplitude values across various conditions and regions, conducting a two-factor repeated measures ANOVA on the ERP and behavioral data. This analysis accounted for two principal factors: landscape type (historical vs. modern) and perceptual consistency (consistent vs. inconsistent). All analyses were conducted using IBM SPSS Statistics 26 software, with the alpha level set at 0.05. Analyses were performed on data that passed tests for normality and homogeneity of variance. We reported means and standard deviations in the descriptive statistics, and where the assumption of sphericity was not met, corrections were made using the Greenhouse–Geisser method. Simple effects analysis was conducted in cases of significant interaction effects.
3. Results
3.1. Behavioral Results
The behavioral data of the study were primarily recorded using E-prime 3.0. This included the time (reaction time) required by participants to press key Y (consistent) and key N (inconsistent) in response to the image–word stimuli, as well as the key press ratio (accuracy rate), with descriptive statistics shown in Table 3.
Table 3.
Descriptive statistics of behavioral data (M ± SD).
A repeated measures ANOVA (M ± SE) showed no significant differences in reaction times to historical and modern landscape stimuli: F (1, 19) = 0.019, p = 0.891, and η2p = 0.001. Furthermore, consistent or inconsistent semantic content did not have a significant effect: F (1, 19) = 0.168, p = 0686, and η2p = 0.009. There was also no interaction between landscape type and perceptual match: F (1, 19) = 0.866, p = 0.188, and η2p = 0.089. According to the statistical results of reaction times, people gave equivalent feedback to semantic judgments of different landscape types.
Regarding the accuracy rate of key presses, people’s recognition accuracy for modern landscapes was higher than that for historical landscapes (91.52 ± 1.09% vs. 90.05 ± 1.81%, p = 0.377), though this was not statistically significant. In terms of perceptual consistency, there was no difference between consistent and inconsistent affective vocabulary: F (1, 19) = 0.092, p = 0.765, and η2p = 0.005. There was also no interaction between the two variables: F (1, 19) = 0.596, p = 0.449, and η2p = 0.030. From the key press accuracy rates, there was no significant gap in the judgment of perceptual matching between the two types of landscapes.
3.2. ERP Results
The study averaged EEG data across four conditions: 2 (landscape type: historical, modern) X 2 (perceptual matching: consistent, inconsistent). Based on related research, waveform graphs, and brain topography, the frontal (F1, F2, and FZ), central (C1, C2, and CZ), and central–parietal (CP1, CP2, and CPZ) regions were selected for two-way repeated measures ANOVA of the P200 and N400 components within the 220–260 ms and 310–340 ms time windows. Table 4 presents descriptive statistics for the P200 and N400 components. Figure 6 shows the waveform diagrams for nine electrodes across the entire brain.
Table 4.
Describes the statistical results of P200 and N400 components under different conditions, including the time windows and the brain area electrodes.
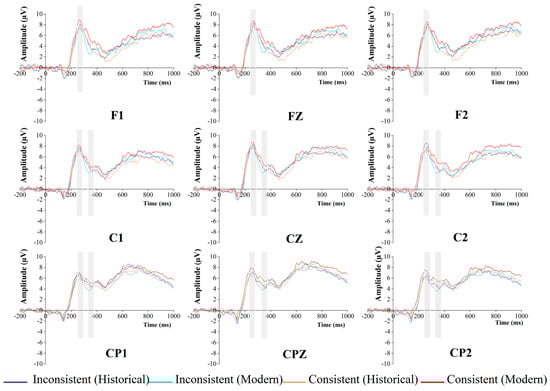
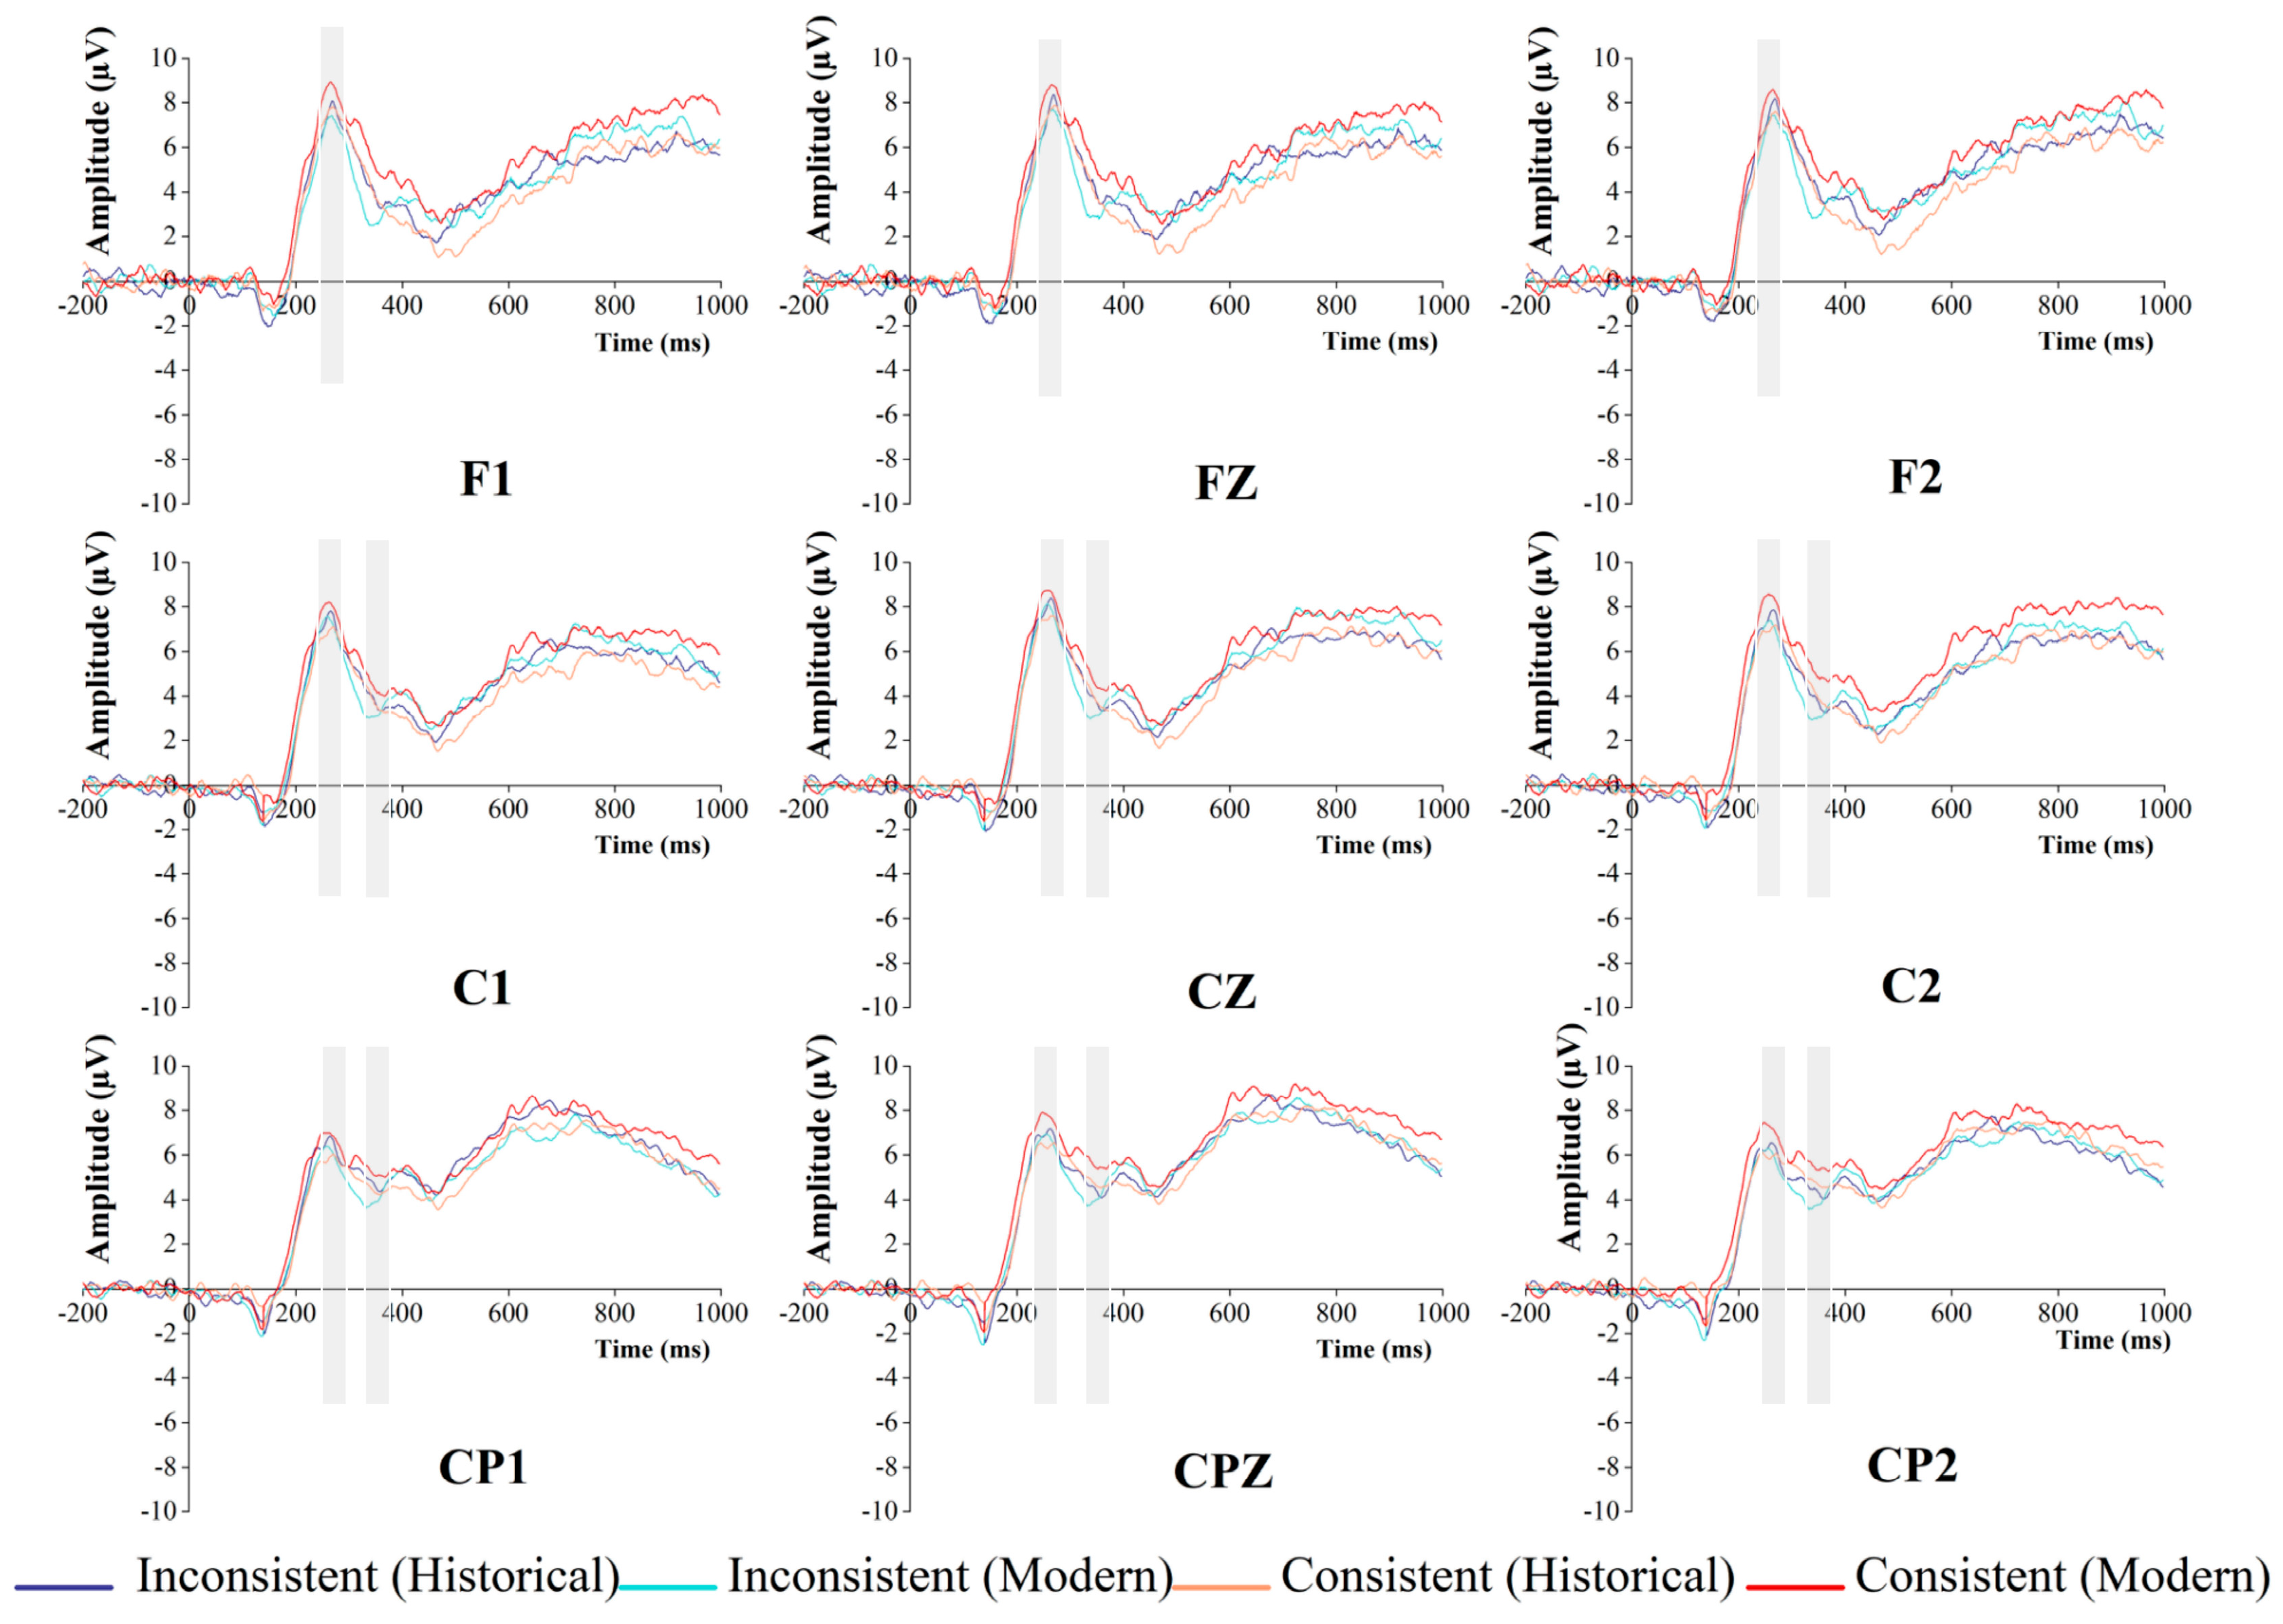
Figure 6.
The waveform diagrams for nine electrodes across the entire brain. The gray area represents the time windows selected for the P200 component (220–260 ms) and the N400 component (300–340 ms).
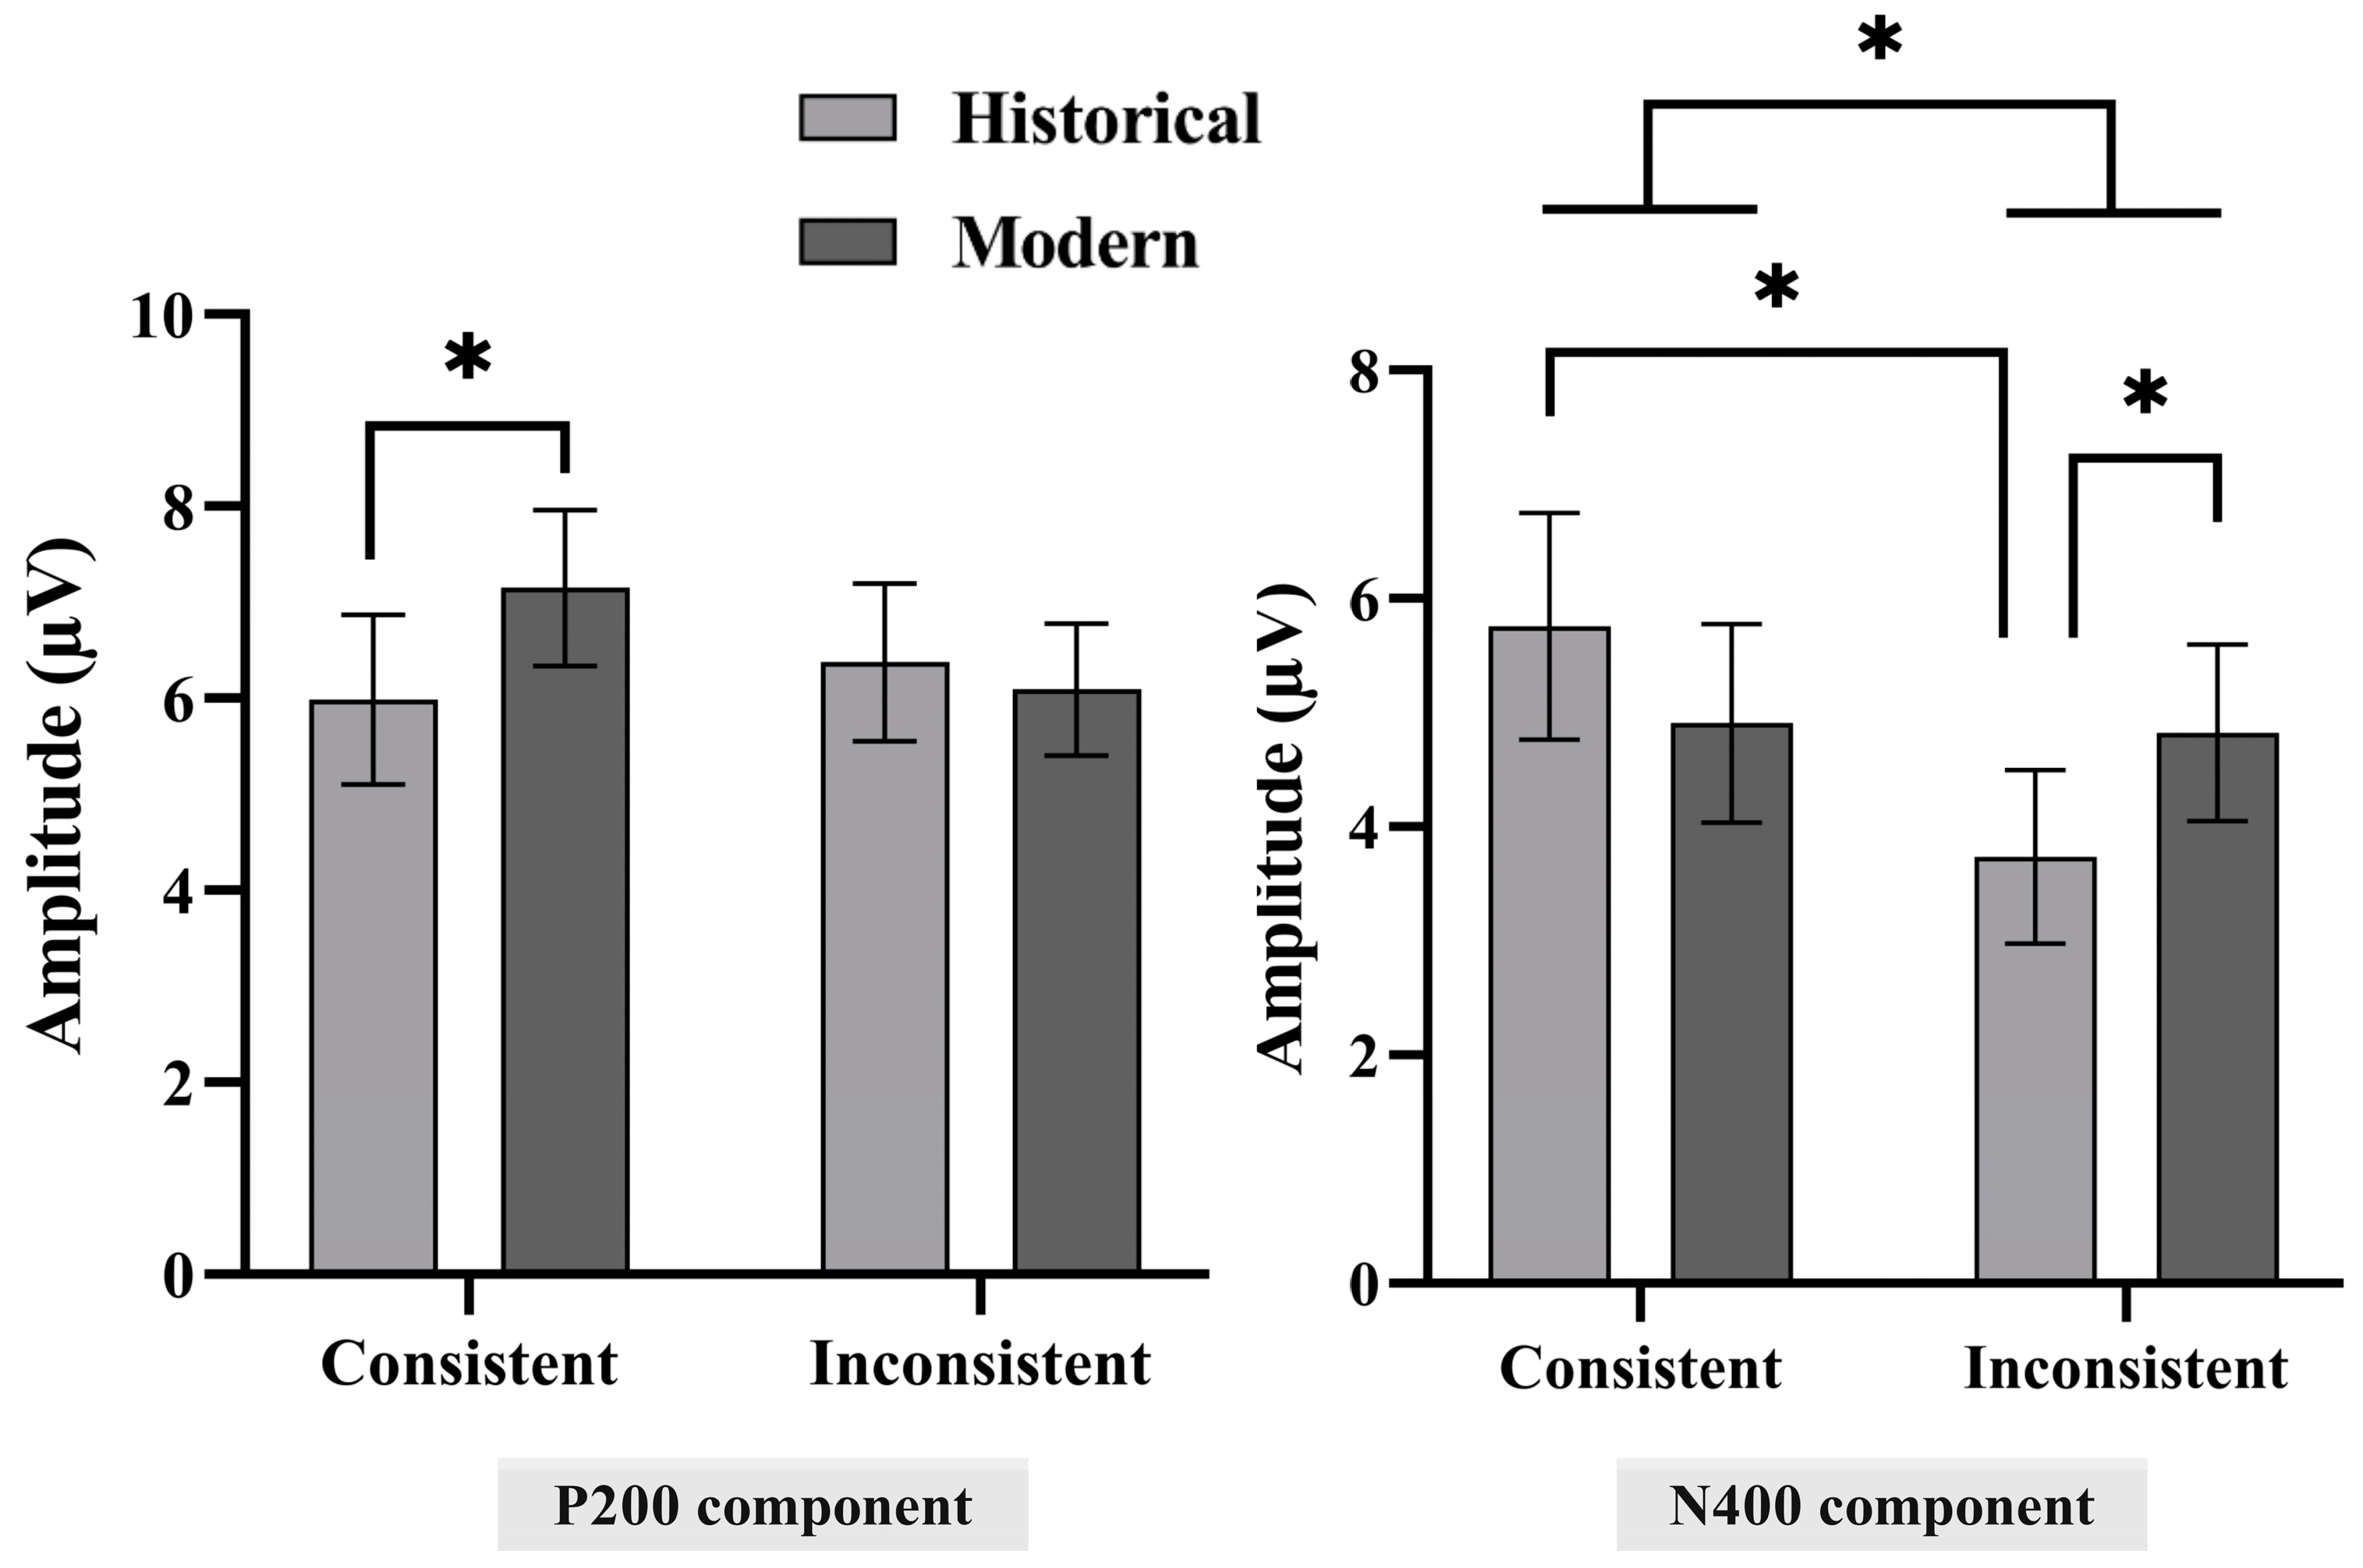
As shown, the P200 component appears within the 220–260 ms time window. Variance analysis (M ± SE) indicated a significant main effect of electrodes: F (8, 12) = 8.573, p < 0.001, and η2p = 0.851. There was no perceived difference in landscape images—F (1, 19) = 1.957, p = 0.178, and η2p = 0.093—and the consistency of perceptual judgments also had no significant effect: F (1, 19) = 0.576, p = 0.457, and η2p = 0.029. However, there was an interaction between landscape type and consistency variables: F (1, 19) = 7.994, p = 0.11, and η2p = 0.296. A simple effects analysis was conducted in cases of significant interaction. Results showed that, in cases of semantic consistency with the landscape, modern landscapes elicited a greater P200 amplitude than historical landscapes (7.15 ± 0.81 µV vs. 5.99 ± 0.88 µV, p = 0.003) (Figure 7). The distribution of P200 topography under different conditions is shown in Figure 8.
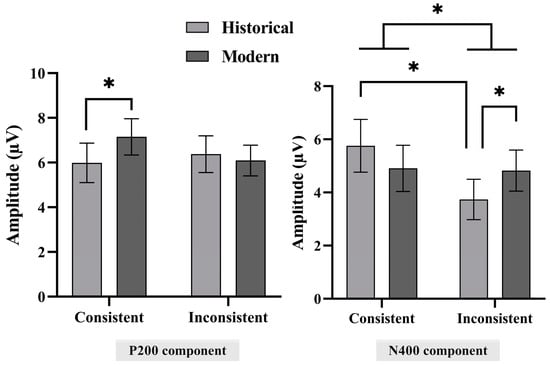
Figure 7.
Bar graphs of P200 and N400 components under four conditions of congruency and type, with error bars representing the standard error and * significant differences at p < 0.05 between conditions indicated by asterisks. In the N400 graph, although the bar graph for historical conditions is smaller than that for modern conditions, the N400 is a negative wave. More negative values are considered to elicit a larger N400 component, thus aligning with the results.
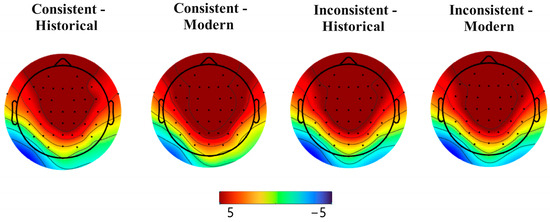
Figure 8.
The topographic map of the P200 component under each condition.
Within the 300–340 ms time window, the N400 component was observed based on waveform graphs. A repeated measures ANOVA (M ± SE) showed no significant main effect of electrodes: F (5, 15) = 1.102, p = 0.400, and η2p = 0.269. However, perceptual matching showed significant differences: F (1, 19) = 9.610, p = 0.006, and η2p = 0.336. Inconsistent affective imagery words (4.282 ± 0.73 µV) elicited a larger N400 amplitude than consistent imagery words (5.332 ± 0.89 µV). However, the main effect of landscape type was not significant: F (1, 19) = 0.073, p = 0.789, and η2p = 0.004. Yet, there was an interaction between the perceptual matching variable and the type variable: F (1, 19) = 12.442, p = 0.002, and η2p = 0.396. A further simple effects analysis found that people elicited more N400 for perceptually inconsistent historical landscapes (3.739 ± 0.76 µV vs. 4.824 ± 0.77 µV, p = 0.027). Figure 9 is the topographic distribution of N400.
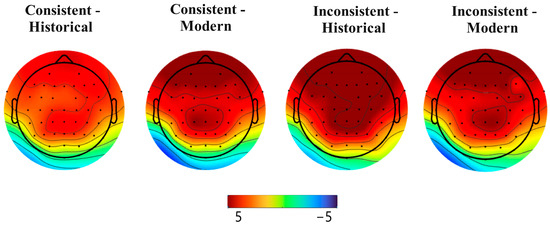
Figure 9.
Topographic map of the N400 component under different conditions.
4. Discussion
This study aims to discuss the perceptual consistency across various urban landscape types and their neural underpinnings, demonstrating the impact of landscape type and perceptual matching on cognitive processing. More specifically, in the ERP experiment, participants were shown images of historical and modern urban landscapes, along with corresponding affective vocabulary, and were asked to assess the consistency of the experimental stimuli within a set timeframe. In the experiment, we recorded relevant behavioral data and identified the P200 and N400 components in the ERP results.
4.1. Discussion on Behavioral Results of Urban Landscape Perceptual Matching
In the behavioral results, there were no significant differences in reaction times when participants viewed historical and modern urban landscapes, regardless of whether the textual descriptions matched. Additionally, in the matching judgment task, there were no significant differences in accuracy between historical and modern landscapes, consistent pairings, and inconsistent pairings. Existing research has shown that consistent information facilitates cognitive integration, with people displaying higher judgment accuracy for content that is expected to be consistent [73]. In a study by Lu and Hou [15] on the semantic consistency of traffic icons, it was found that subjects had a higher accuracy rate when faced with matching semantics than with mismatching semantics. The behavioral results of the experiment are inconsistent with those of previous studies. What could account for this discrepancy? One possible reason is the complexity of the experimental materials themselves. Urban landscapes, whether historical or modern, are complex visual scenes composed of numerous elements. People may not be able to judge these landscape contents as precisely as they would simple icons or text within a limited time. This complexity, coupled with participants’ varying familiarity with different urban landscapes, has led to similarities in cognitive processing efficiency and judgment at the behavioral level in the perceptual matching experiment. The behavioral outcomes underscore the edge that cognitive neuroscience methodologies hold over traditional surveys and behavioral studies in disclosing micro-level psychological mechanisms.
4.2. Neural Mechanisms of Urban Landscape Perceptual Matching
Through the interpretation of ANOVA, we discovered that urban landscapes could trigger a more significant P200 response in scenarios where images and texts were consistent, confirming Hypothesis 1. Previous research has proven that P200 is highly sensitive to emotional evaluation, with positive or affirmative emotional stimuli eliciting larger amplitudes than negative stimuli [53,54,74]. The research findings align with previous studies. Urban landscapes play a role in embellishing spaces and enhancing quality of life [2,3]. When they meet the audience’s expectations, it signifies that the original intent of the design has been realized. Such consistency in expectations can evoke pleasant emotional responses from the audience, thereby leading to an increase in P200. Additionally, previous studies have indicated that P200 is considered to reveal the distribution of stimuli in cognitive resources and early attention activation [75,76,77]. An increase in P200 amplitude signifies the need for more early attentional resources [47,78]. In this study, we found that the P200 response elicited by modern landscapes was significantly higher than that of historical landscapes. This result suggests that, in the initial stages of perception, the visually dominant design aesthetics of modern landscapes have a higher appeal compared to the content-focused historical and cultural elements in historical landscapes, thereby leading to a broader allocation of attention. This aligns with previous research, which has stated that P200 is related to the allocation of attentional resources triggered by early visual aesthetics [79]. Moreover, research indicates that, during the decision-making assessment phase involving P200, particularly in the process of top-down stimulus categorization activation, inconsistency in objectives triggers a stronger P200 response [66,80]; however, in this study, inconsistent P200 did not cause a significant effect. This discovery reveals that the primary cognitive processing stage of landscape perception is mainly triggered by the visual attributes of the landscape, driven by rapid attention allocation in bottom-up perceptual processing, leading to related emotional perception but not involving much in terms of decision-making evaluation content. Given the high complexity of the scenes, people need to expend more mental resources to cope with inconsistent scenes.
The N400 component was first identified in sentence reading experiments, particularly when participants read words at the end of a sentence that did not match the context, resulting in a significant increase in amplitude [81]. This component is not only associated with stronger cognitive conflicts but also involves the automatic retrieval and processing mechanisms of implicit memory [55,58]. Specifically, the amplitude of the N400 increases when faced with improper word pairings, informational conflicts, or semantic incoherence. This indicates that the N400 can reflect how the brain processes information that does not meet expectations, making it a crucial indicator for studying human cognitive processing. Further research has showcased the role of the N400 in revealing how people process products or symbols that do not match their expectations [21,59]. In our experiment, the neural processing of landscape perceptual matching was thoroughly investigated using ERP technology, combined with images of urban landscapes and their descriptive phrases. The results indicated that encountering landscape image–text stimuli that contradicted expectations elicited a higher N400, thus validating Hypothesis H2. This discovery is consistent with previous research findings and confirms that facing urban landscapes that are inconsistent with expectations leads to significant cognitive conflict, resulting in a marked increase in N400. Further analysis found that the N400 induced by inconsistencies in historical landscapes was significantly higher compared to modern landscapes. This result could be attributed to the combined effect of two factors. First, the public’s perception of historical landscapes is a subjective and abstract state [82]; compared to familiar modern urban architecture and living scenes, the historical landscapes we selected are mainly rare historical relics and buildings. When participants process this information, the unfamiliarity and complexity of the content may generate more cognitive load [83,84], thus causing a larger N400. Secondly, research has shown that people have high expectations for the “authenticity” of their perception of historical landscapes [85]. When these expectations are not met in actual observation, it may lead to stronger cognitive conflict, thus further increasing N400. In summary, the significant N400 observed in the urban landscape environment validates this indicator’s effectiveness and expands its application in complex scenarios. The interaction effect results, especially the pronounced N400 increase for inconsistent historical landscapes, highlight the complexity of processing urban landscapes that carry rich historical and cultural narratives. This indicates that more effort is needed to cognitively integrate these contents.
4.3. Theoretical Contributions and Inspiration for Urban Landscape Planning and Design
This study holds the following significance:
Firstly, compared to other subjective research and physiological experimental methods, the use of more precise ERP technology to record brain activity showcases the potential of the ERP method in revealing the neural mechanisms of daily experiences, such as viewing and interpreting urban spaces. This provides objective evaluation tools and neural indicators for urban landscape planning and perceptual studies, advancing the application of cognitive neuroscience in urban research.
Secondly, this article explores the impact of individual cognitive patterns and the content match of urban landscapes on perceptual behavior. It accentuates the complex interaction between cognitive expectations and urban environmental stimuli, offering a new perspective for urban environmental perception research.
Thirdly, this study conducts a comparative analysis of the neural responses to historical and modern urban landscapes. In the field of urban research, how to harmonize the development of historical landscapes with modern cities remains a core issue of concern to scholars. Investigating these issues can provide references for the optimization of current urban strategies and address practical needs.
Furthermore, the research also provides insights into city landscape planning and design:
Firstly, the use of neurophysiological measurement methods (ERPs) for the objective assessment of perceptual match in urban landscapes. This enables urban designers to carry out effective design planning. For example, applying the P200 and N400 neural indicators related to attention distribution and decision-making evaluation in design measurements helps designers predict the public’s perceptual experience in advance. This allows designers to optimize plans at an early stage, reducing the time and cost of modifications.
On the other hand, the research compares the differences in perceptual cognition between historical and modern landscapes, providing references for balancing the development of historical landscapes with modern urban growth, which is beneficial for landscape planning departments to formulate practical and feasible policies. For instance, modern landscapes with consistent content elicit stronger early attention resource allocation (N200), indicating that urban designs incorporating clear narrative elements can enhance residents’ perceptual experiences. This can guide the development of signage, informational plaques, and digital applications, thereby enriching the urban experience. The interpretation of the N400 component reflects the cognitive effort required by the public to reconcile inconsistent information in urban landscapes. It underscores the importance of narrative design in urban spaces, focusing not only on the visual elements of the landscape but also on the coherence of content. It encourages the integration of physical environments with historical or cultural elements and urges local residents to establish deeper perceptual connections with the urban cultural space, promoting and enriching the sustainable management of urban cultural ecosystems.
In summary, future research will involve enhanced collaboration with relevant stakeholders, such as the establishment of workshops and research centers, to integrate research methods with practical applications. ERP measurements of experimental plans will assist urban planners and designers in conducting perception measurements more quickly and effectively, optimizing urban environmental design to meet future development needs.
4.4. Limitations
Concerning the limitations of the study:
- (1)
- A significant one is that the sample size, despite meeting the basic neural experiment prerequisites, is still relatively small. Moreover, the demographic structure of the sample does not fully reflect the diversity of the urban population, as factors such as age and educational level could influence the results.
- (2)
- This paper utilizes static image stimuli, whereas dynamic urban landscape experiments align more closely with real-world experiences. In fact, existing studies have simulated real-world perceptions using videos or virtual reality (VR) equipment. For instance, Mouratidis and Hassan [86] measured people’s views and emotional assessments of modern and traditional architectural environments using VR devices. Kwon et al. [87] conducted experimental research on pedestrians’ safety perception and crossing behaviors on narrow urban streets using VR.
Despite this, our paper focuses on cognitive processing when individuals encounter historical or modern urban landscapes, whether perceptions are consistent or not. To achieve high temporal precision and concentrate on neural mechanisms of specific events, we have opted for the ERP method.
As previous studies have indicated, the ERP method does not readily integrate with dynamic experimental materials [45]. When using dynamic materials like videos, every small part of the stimulus could induce potential changes, making it difficult to precisely associate specific brain responses with particular events in the video [45]. Moreover, dynamic experimental materials often contain multiple complex variables that are hard to control, potentially interfering with participants’ brain responses and making it challenging to extract valid ERP components.
In summary, future research could benefit from the incorporation of methodologies such as video and virtual reality. This strategy would provide a complementary and contrasting perspective to ERP studies, facilitating a more thorough understanding of environmental perception.
- (3)
- This study primarily focuses on the neural responses related to visual stimuli of urban landscapes, which may overlook other sensory experiences within urban environments, such as sound and smell. Future research could consider adopting a multisensory approach to gain a deeper understanding of urban perception.
However, the decision to focus on visual ERP in this study is due to the following reasons:
First, based on the research’s focus, we discuss the reactions people have when faced with cognitively inconsistent landscape images. Compared to auditory or olfactory senses, visual perception is the most direct way of perceiving [24]. Visual assessment plays a crucial role in shaping individuals’ perceptions and responses to the environment [88]. Furthermore, incorporating multisensory stimuli into ERP research presents technical and methodological challenges. Crossmodal attention and integration effects complicate the interpretation of ERP responses [89].
These reasons have prompted the focus on visual assessment in the current study.
5. Conclusions
This study conducted an interdisciplinary exploration of urban landscape perception, taking typical urban landscapes in Jingdezhen, China, as a case study. Using the event-related potential (ERP) method, it aimed to investigate the neural mechanisms behind people’s perceptual matching (both consistent and inconsistent) when faced with different types of urban landscapes (historical and modern). According to behavioral results, the perceptual judgments of different landscape types did not show significant differences in reaction time or accuracy, suggesting the complexity of scene cognition and further highlighting the necessity of conducting ERP analysis. The ERP results revealed a significant P200 response in the context of consistent perception, with modern landscapes generating a greater amplitude than historical landscapes, indicating their superior ability to attract public attention. This may be attributed to the prominent visual design and aesthetic components in modern landscapes, which are more likely to arouse individual interest and positive emotions. During the N400 phase, the study discovered that perceptual inconsistencies resulted in a pronounced N400 component. Specifically, inconsistencies in historical landscapes induced a greater N400 response compared to modern landscapes, indicating that mismatches with cognitive expectations lead to greater conflict. This suggests that the cultural content inherent in historical landscapes is more likely to cause cognitive dissonance than in modern landscapes, revealing the implicit aspects of urban environmental perception.
The results indicate the following: (1) P200 and N400, as effectively detected neural components, can be considered assessment indicators for urban landscape perception research, confirming the potential application of neuroscience in urban research. (2) From the perspective of perceptual behavioral mechanisms, they encompass both “bottom-up” and “top-down” cognitive processes. The initial phase of landscape perception (P200) is determined by the landscape’s physical attributes, leading to the rapid allocation of attention driven by visual aesthetics and associated with positive emotional activation. In the further decision-making evaluation phase (N400), familiarity with content and recognition difficulty lead to cognitive conflict, affecting the final perceptual evaluation. (3) The importance of consistency between urban landscape imagery and content reveals the brain’s sensitivity to cognitive conflicts and the effort required to coordinate inconsistent information in urban environments. These insights advocate for urban design approaches that align with human neural and cognitive activities, emphasizing the need to synthesize characteristics of historical and modern landscapes to create spaces that are attractive not only aesthetically and content-wise but also cognitively harmonious.
In summary, this study offers insights into the perceptual assessment and design planning of urban landscapes. Within urban planning practices, the image of the urban landscape involves the audience’s viewing experience; it forms people’s first impression of a city. Landscapes that do not meet expectations are often difficult to change, requiring more time for public acceptance. The ERP method provides a relatively effective and rapid measurement technique to assess whether the landscape image meets user expectations, thereby enhancing city planning efficiency and reducing the losses caused by project failures.
Author Contributions
Conceptualization, Y.C. and D.L.; formal analysis, Y.C.; methodology, Y.C. and D.L.; resources, J.C., J.T. and W.X.; software, W.X.; supervision, J.C. and X.X.; visualization, Y.C.; writing—original draft, Y.C.; writing—review and editing, Y.C. All authors have read and agreed to the published version of the manuscript.
Funding
This work was partially supported by the National Nature Scientific Foundation of China (32260154), the Social Science Foundation of Jiangxi Province (No. 21YS21), and the Art Planning project of Jiangxi Province (YG2018244).
Data Availability Statement
The data presented in this study are available on request from the corresponding author due to privacy.
Acknowledgments
Heartfelt gratitude is expressed to the organizations and individuals who provided assistance during the research process.
Conflicts of Interest
The authors declare no conflict of interest.
Appendix A
Table A1.
Selection of 13 historical landscape (H) and 13 modern landscape (M) photographic stimuli used in the study.
Table A1.
Selection of 13 historical landscape (H) and 13 modern landscape (M) photographic stimuli used in the study.
| H1 | H2 | H3 | H4 | H5 | H6 | H7 |
|---|---|---|---|---|---|---|
 |  |  |  |  |  |  |
| H8 | H9 | H10 | H11 | H12 | H13 | |
 |  |  |  |  |  | |
| M1 | M2 | M3 | M4 | M5 | M6 | M7 |
 |  |  |  |  |  |  |
| M8 | M9 | M10 | M11 | M12 | M13 | |
 |  |  |  |  |  |
References
- Data on Domestic Tourism in the First Half of 2023. Available online: https://www.gov.cn/lianbo/bumen/202307/content_6892643.htm (accessed on 15 February 2024).
- Zhou, L.; Li, Y.; Cheng, J.; Qin, Y.; Shen, G.; Li, B.; Yang, H.; Li, S. Understanding the Aesthetic Perceptions and Image Impressions Experienced by Tourists Walking along Tourism Trails through Continuous Cityscapes in Macau. J. Transp. Geogr. 2023, 112, 103703. [Google Scholar] [CrossRef]
- Ganaie, S.A.; Parry, J.A.; Bhat, M.S. Evaluating the Urban Environment to Improve Quality of Life in Srinagar, India: The Use of the Urban Landscape Quality Index. Geography 2023, 108, 17–24. [Google Scholar] [CrossRef]
- Hussein, F.; Stephens, J.; Tiwari, R. Cultural Memories and Sense of Place in Historic Urban Landscapes: The Case of Masrah Al Salam, the Demolished Theatre Context in Alexandria, Egypt. Land 2020, 9, 264. [Google Scholar] [CrossRef]
- Jiang, J.; Zhou, T.; Han, Y.; Ikebe, K. Urban Heritage Conservation and Modern Urban Development from the Perspective of the Historic Urban Landscape Approach: A Case Study of Suzhou. Land 2022, 11, 1251. [Google Scholar] [CrossRef]
- Li, X.; Hou, W.; Liu, M.; Yu, Z. Traditional Thoughts and Modern Development of the Historical Urban Landscape in China: Lessons Learned from the Example of Pingyao Historical City. Land 2022, 11, 247. [Google Scholar] [CrossRef]
- Haapakangas, A.; Hongisto, V.; Oliva, D.; Haapakangas, A.; Hongisto, V.; Oliva, D. Audio-Visual Interaction in Perception of Industrial Plants—Effects of Sound Level and the Degree of Visual Masking by Vegetation. Appl. Acoust. 2020, 160, 107121. [Google Scholar] [CrossRef]
- Jeon, J.Y.; Jo, H.I.; Lee, K.; Jeon, J.Y.; Jo, H.I.; Lee, K. Psycho-Physiological Restoration with Audio-Visual Interactions through Virtual Reality Simulations of Soundscape and Landscape Experiences in Urban, Waterfront, and Green Environments. Sustain. Cities Soc. 2023, 99, 104929. [Google Scholar] [CrossRef]
- Hoppstadius, F.; Hoppstadius, F. Tourists’ Reflections on Sustainability in a Biosphere Reserve Landscape. J. Tour. Res. 2019, 21, 560–573. [Google Scholar] [CrossRef]
- Yi, K.; Zhu, J.; Zhang, Q.; Li, F.; Li, X.; Yi, K.; Zhu, J.; Zhang, Q.; Li, F.; Li, X. Push and Pull in the Sustainable Development of Ecological Landscape and Ecological Resources: A Dual Perceptions of Tourists and Service Staff. Sustain. Dev. 2023, 31, 2402–2415. [Google Scholar] [CrossRef]
- Gokce, G.C.; Aciksoz, S. Evaluation of the Relationship Between Cultural Landscape and Identity of Rural Landscape with Mind Map Method. Fresenius Environ. Bull. 2022, 31, 6962–6972. [Google Scholar]
- Krueger, L.E. A Theory of Perceptual Matching. Psychol. Rev. 1978, 85, 278–304. [Google Scholar] [CrossRef]
- Barsalou, L.W. Perceptual Symbol Systems. Behav. Brain Sci. 1999, 22, 577–660. [Google Scholar] [CrossRef] [PubMed]
- Cao, X.; Watanabe, M.; Ono, K. How Character-Centric Game Icon Design Affects the Perception of Gameplay. Appl. Sci. 2021, 11, 9911. [Google Scholar] [CrossRef]
- Lu, G.; Hou, G. Effects of Semantic Congruence on Sign Identification: An ERP Study. Hum. Factors 2020, 62, 800–811. [Google Scholar] [CrossRef]
- Huang, J.; Wang, Z.; Liu, H.; Yu, L. Similar or Contrastive? Impact of Product–Background Color Combination on Consumers’ Product Evaluations. Psychol. Mark. 2020, 37, 961–979. [Google Scholar] [CrossRef]
- Jaud, D.A.; Melnyk, V. The Effect of Text-Only versus Text-and-Image Wine Labels on Liking, Taste and Purchase Intentions. The Mediating Role of Affective Fluency. J. Retail. Consum. Serv. 2020, 53, 101964. [Google Scholar] [CrossRef]
- Chen, Q.; Zhang, J.; Xu, X.; Scheepers, C.; Yang, Y.; Tanenhaus, M.K. Prosodic Expectations in Silent Reading: ERP Evidence from Rhyme Scheme and Semantic Congruence in Classic Chinese Poems. Cognition 2016, 154, 11–21. [Google Scholar] [CrossRef] [PubMed]
- Valderrama, J.T.; Beach, E.F.; Sharma, M.; Appaiah-Konganda, S.; Schmidt, E. Design and Evaluation of the Effectiveness of a Corpus of Congruent and Incongruent English Sentences for the Study of Event Related Potentials. Int. J. Audiol. 2021, 60, 96–103. [Google Scholar] [CrossRef]
- Bufquin, D.; Back, R.M.; Park, J.-Y.; Nutta, M. The Effects of Architectural Congruence Perceptions on Winery Visitors’ Emotions and Behavioral Intentions: The Case of Marqués de Riscal. J. Destin. Mark. Manag. 2018, 9, 56–63. [Google Scholar] [CrossRef]
- Markey, P.S.; Jakesch, M.; Leder, H. Art Looks Different—Semantic and Syntactic Processing of Paintings and Associated Neurophysiological Brain Responses. Brain Cogn. 2019, 134, 58–66. [Google Scholar] [CrossRef]
- UNESCO Vienna Memorandum on World Heritage and Contemporary Architecture. Available online: https://whc.unesco.org/en/documents/5965/ (accessed on 23 February 2024).
- UNESCO World Heritage Centre—Recommendation on the Historic Urban Landscape. Available online: https://whc.unesco.org/en/hul/ (accessed on 23 February 2024).
- Lynch, K. The Image of the City; MIT Press: Cambridge, MA, USA, 1964; ISBN 978-0-262-62001-7. [Google Scholar]
- Gehl, J. Cities for People; Island Press: Washington, DC, USA, 2013; ISBN 978-1-59726-984-1. [Google Scholar]
- Pintossi, N.; Kaya, D.; Roders, A. Identifying Challenges and Solutions in Cultural Heritage Adaptive Reuse through the Historic Urban Landscape Approach in Amsterdam. Sustainability 2021, 13, 5547. [Google Scholar] [CrossRef]
- Sennett, R. The Conscience of the Eye: The Design and Social Life of Cities; W. W. Norton & Company: New York, NY, USA, 1992; ISBN 978-0-393-34649-7. [Google Scholar]
- Nakarmi, G.; Strager, M.P.; Yuill, C.; Moreira, J.C.; Burns, R.C.; Butler, P. Assessing Public Preferences of Landscape and Landscape Attributes: A Case Study of the Proposed Appalachian Geopark Project in West Virginia, USA. Geoheritage 2023, 15, 85. [Google Scholar] [CrossRef]
- Wartmann, F.M.; Frick, J.; Kienast, F.; Hunziker, M. Factors Influencing Visual Landscape Quality Perceived by the Public. Results from a National Survey. Landsc. Urban Plan. 2021, 208, 104024. [Google Scholar] [CrossRef]
- Calvert, G.A.; Brammer, M.J. Predicting Consumer Behavior: Using Novel Mind-Reading Approaches. IEEE Pulse 2012, 3, 38–41. [Google Scholar] [CrossRef]
- Wan, Q.; Li, X.; Zhang, Y.; Song, S.; Ke, Q. Visual Perception of Different Wood Surfaces: An Event-Related Potentials Study. Ann. For. Sci. 2021, 78, 25. [Google Scholar] [CrossRef]
- Cheng, Y.; Chen, J.; Li, J.; Li, L.; Hou, G.; Xiao, X. Research on the Preference of Public Art Design in Urban Landscapes: Evidence from an Event-Related Potential Study. Land 2023, 12, 1883. [Google Scholar] [CrossRef]
- Zhu, M.; Teng, R.; Wang, C.; Wang, Y.; He, J.; Yu, F. Key Environmental Factors Affecting Perceptions of Security of Night-Time Walking in Neighbourhood Streets: A Discussion Based on Fear Heat Maps. J. Transp. Health 2023, 32, 101636. [Google Scholar] [CrossRef]
- Li, M.; Liu, R.; Li, X.; Zhang, S.; Wu, D. The Effect of Perceived Real-Scene Environment of a River in a High-Density Urban Area on Emotions. Land 2024, 13, 35. [Google Scholar] [CrossRef]
- Bower, I.S.; Clark, G.M.; Tucker, R.; Hill, A.T.; Lum, J.A.G.; Mortimer, M.A.; Enticott, P.G. Built Environment Color Modulates Autonomic and EEG Indices of Emotional Response. Psychophysiology 2022, 59, e14121. [Google Scholar] [CrossRef] [PubMed]
- Kim, M.; Cheon, S.; Kang, Y. Use of Electroencephalography (EEG) for the Analysis of Emotional Perception and Fear to Nightscapes. Sustainability 2019, 11, 233. [Google Scholar] [CrossRef]
- Sun, X.; Wu, H.; Wu, Y. Investigation of the Relationships among Temperature, Illuminance and Sound Level, Typical Physiological Parameters and Human Perceptions. Build. Environ. 2020, 183, 107193. [Google Scholar] [CrossRef]
- Wang, P.; Yang, W.; Wang, D.; He, Y. Insights into Public Visual Behaviors through Eye-Tracking Tests: A Study Based on National Park System Pilot Area Landscapes. Land 2021, 10, 497. [Google Scholar] [CrossRef]
- Qin, X.; Fang, M.; Yang, D.; Wangari, V.W. Quantitative Evaluation of Attraction Intensity of Highway Landscape Visual Elements Based on Dynamic Perception. Environ. Impact Assess. Rev. 2023, 100, 107081. [Google Scholar] [CrossRef]
- Chen, F.; Zhou, J.; Wang, Y.; Yu, K.; Arshad, S.Z.; Khawaji, A.; Conway, D. Robust Multimodal Cognitive Load Measurement; Human–Computer Interaction Series; Springer International Publishing: Cham, Switzerland, 2016; ISBN 978-3-319-31698-7. [Google Scholar]
- Chen, J.; He, B.; Zhu, H.; Wu, J. The Implicit Preference Evaluation for the Ceramic Tiles with Different Visual Features: Evidence from an Event-Related Potential Study. Front. Psychol. 2023, 14, 1139687. [Google Scholar] [CrossRef]
- Guo, F.; Jiang, J.-Y.; Tian, X.-H.; Chen, J.-H. Applying Event-Related Potentials to Measure Perceptual Experience toward the Navigation Interface of a Mobile Game for Improving the Design. Symmetry 2019, 11, 710. [Google Scholar] [CrossRef]
- Daliri, M.R. Kernel Earth Mover’s Distance for EEG Classification. Clin. EEG Neurosci. 2013, 44, 182–187. [Google Scholar] [CrossRef]
- Edwards, D.J.; Trujillo, L.T. An Analysis of the External Validity of EEG Spectral Power in an Uncontrolled Outdoor Environment during Default and Complex Neurocognitive States. Brain Sci. 2021, 11, 330. [Google Scholar] [CrossRef]
- Luck, S.J. An Introduction to the Event-Related Potential Technique; MIT Press: Cambridge, MA, USA, 2014. [Google Scholar]
- Cacioppo, J.T.; Tassinary, L.G.; Berntson, G. Handbook of Psychophysiology; Cambridge University Press: Cambridge, UK, 2007; ISBN 978-1-139-46193-1. [Google Scholar]
- Thomas, S.J.; Johnstone, S.J.; Gonsalvez, C.J. Event-Related Potentials during an Emotional Stroop Task. Int. J. Psychophysiol. 2007, 63, 221–231. [Google Scholar] [CrossRef]
- Zhou, Y.; Yao, M.; Fang, S.; Gao, X. A Dual-Process Perspective to Explore Decision Making in Internet Gaming Disorder: An ERP Study of Comparison with Recreational Game Users. Comput. Hum. Behav. 2022, 128, 107104. [Google Scholar] [CrossRef]
- Handy, T.C.; Smilek, D.; Geiger, L.; Liu, C.; Schooler, J.W. ERP Evidence for Rapid Hedonic Evaluation of Logos. J. Cogn. Neurosci. 2010, 22, 124–138. [Google Scholar] [CrossRef]
- Kosonogov, V.; Martinez-Selva, J.M.; Carrillo-Verdejo, E.; Torrente, G.; Carretié, L.; Sanchez-Navarro, J.P. Effects of Social and Affective Content on Exogenous Attention as Revealed by Event-Related Potentials. Cogn. Emot. 2019, 33, 683–695. [Google Scholar] [CrossRef]
- Brandl, F.; Le Houcq Corbi, Z.; Mulej Bratec, S.; Sorg, C. Cognitive Reward Control Recruits Medial and Lateral Frontal Cortices, Which Are Also Involved in Cognitive Emotion Regulation: A Coordinate-Based Meta-Analysis of fMRI Studies. NeuroImage 2019, 200, 659–673. [Google Scholar] [CrossRef]
- Brydges, N.M.; Leach, M.; Nicol, K.; Wright, R.; Bateson, M. Environmental Enrichment Induces Optimistic Cognitive Bias in Rats. Anim. Behav. 2011, 81, 169–175. [Google Scholar] [CrossRef]
- Cao, Y.; Zhang, Y.; Ding, Y.; Duffy, V.G.; Zhang, X. Is an Anthropomorphic App Icon More Attractive? Evidence from Neuroergonomomics. Appl. Ergon. 2021, 97, 103545. [Google Scholar] [CrossRef]
- Guo, F.; Li, M.; Chen, J.; Duffy, V.G. Evaluating Users’ Preference for the Appearance of Humanoid Robots via Event-Related Potentials and Spectral Perturbations. Behav. Inf. Technol. 2022, 41, 1381–1397. [Google Scholar] [CrossRef]
- DeLong, K.A.; Kutas, M. Comprehending Surprising Sentences: Sensitivity of Post-N400 Positivities to Contextual Congruity and Semantic Relatedness. Lang. Cogn. Neurosci. 2020, 35, 1044–1063. [Google Scholar] [CrossRef]
- Yang, C.; Peng, Y.; Zeng, J. Research on Cognition and Application of Icon Complexity Based on EEG. CCF Trans. Pervasive Comp. Interact. 2021, 3, 170–185. [Google Scholar] [CrossRef]
- Wang, C.-Y.; Lin, Y.-E. The Influence of Semantic Relevance on the Discernment of Product Appearance and Function. BMC Psychol 2021, 9, 133. [Google Scholar] [CrossRef]
- Wei, Q.; Lv, D.; Lin, Y.; Zhu, D.; Liu, S.; Liu, Y. Influence of Utilitarian and Hedonic Attributes on Willingness to Pay Green Product Premiums and Neural Mechanisms in China: An ERP Study. Sustainability 2023, 15, 2403. [Google Scholar] [CrossRef]
- Shi, A.; Huo, F.; Hou, G. Effects of Design Aesthetics on the Perceived Value of a Product. Front. Psychol. 2021, 12, 670800. [Google Scholar] [CrossRef]
- Jingdezhen Municipal Bureau of Statistics. Jingdezhen Statistical Yearbook (2022); China Statistics Press: Beijing, China, 2023. [Google Scholar]
- Utilize Ceramic Culture to Tell China’s Story. Available online: http://www.jiangxi.gov.cn/art/2023/3/9/art_5296_4384466.html (accessed on 5 January 2024).
- Overview of the Achievements in the Construction of the Jingdezhen National Ceramic Culture Heritage and Innovation Pilot Zone. Available online: http://drc.jiangxi.gov.cn/art/2023/5/17/art_14687_4463009.html (accessed on 5 January 2024).
- Zhang, X.; Xie, H.; Zhou, C.; Zeng, B. Jingdezhen: The Millennium Porcelain Capital. Cities 2020, 98, 102569. [Google Scholar] [CrossRef]
- Belt and Road Initiative: China Story. Available online: https://www.yidaiyilu.gov.cn/p/0FFRT6PQ.html (accessed on 27 March 2024).
- Jingdezhen Delivers Impressive Results in Culture and Tourism during the “Double Festival” Holiday. Available online: http://jdz.gov.cn/zwzx/jrcd/t926512.shtml (accessed on 30 November 2023).
- Ma, Q.; Cheng, L.; Qiu, W.; Wang, J.; Ma, Q.; Cheng, L.; Qiu, W.; Wang, J. The Neural Basis of the Unattended Processing of Destination-Slogan Consistency. J. Destin. Mark. Manag. 2021, 19, 100556. [Google Scholar] [CrossRef]
- Bidegain, Í.; López-Santiago, C.A.; González, J.A.; Martínez-Sastre, R.; Ravera, F.; Cerda, C. Social Valuation of Mediterranean Cultural Landscapes: Exploring Landscape Preferences and Ecosystem Services Perceptions through a Visual Approach. Land 2020, 9, 390. [Google Scholar] [CrossRef]
- Nekhay, O.; Arriaza, M. How Attractive Is Upland Olive Groves Landscape? Application of the Analytic Hierarchy Process and GIS in Southern Spain. Sustainability 2016, 8, 1160. [Google Scholar] [CrossRef]
- Osgood, C.E.; Suci, G.J.; Tannenbaum, P.H. The Measurement of Meaning; University of Illinois Press: Champaign, IL, USA, 1957; ISBN 978-0-252-74539-3. [Google Scholar]
- Zhao, Y.; Liu, J.; Zheng, Y. Preservation and Renewal: A Study on Visual Evaluation of Urban Historical and Cultural Street Landscape in Quanzhou. Sustainability 2022, 14, 8775. [Google Scholar] [CrossRef]
- Ma, Y.; Jin, J.; Yu, W.; Zhang, W.; Xu, Z.; Ma, Q. How Is the Neural Response to the Design of Experience Goods Related to Personalized Preference? An Implicit View. Front. Neurosci. 2018, 12, 410929. [Google Scholar] [CrossRef]
- Enge, A.; Süß, F.; Abdel Rahman, R. Instant Effects of Semantic Information on Visual Perception. J. Neurosci. 2023, 43, 4896–4906. [Google Scholar] [CrossRef]
- Kutas, M.; Federmeier, K.D.; Kutas, M.; Federmeier, K.D. Thirty Years and Counting: Finding Meaning in the N400 Component of the Event-Related Brain Potential (ERP). Annu. Rev. Psychol. 2011, 62, 621–647. [Google Scholar] [CrossRef]
- Tortosa, M.I.; Lupiáñez, J.; Ruz, M. Race, Emotion and Trust: An ERP Study. Brain Res. 2013, 1494, 44–55. [Google Scholar] [CrossRef]
- Ma, Q.; Wang, M.; He, Y.; Tan, Y.; Zhang, L. Does Mobile Payment Change Consumers’ Perception during Payment Process? —An ERP Study. Neurosci. Lett. 2021, 762, 136138. [Google Scholar] [CrossRef] [PubMed]
- Olofsson, J.K.; Nordin, S.; Sequeira, H.; Polich, J.; Olofsson, J.K.; Nordin, S.; Sequeira, H.; Polich, J. Affective Picture Processing: An Integrative Review of ERP Findings. Biol. Psychol. 2008, 77, 247–265. [Google Scholar] [CrossRef] [PubMed]
- Schindler, S.; Bublatzky, F. Attention and Emotion: An Integrative Review of Emotional Face Processing as a Function of Attention. Cortex 2020, 130, 362–386. [Google Scholar] [CrossRef] [PubMed]
- Alzueta, E.; Melcón, M.; Poch, C.; Capilla, A.; Alzueta, E.; Melcón, M.; Poch, C.; Capilla, A. Is Your Own Face More than a Highly Familiar Face? Biol. Psychol. 2019, 142, 100–107. [Google Scholar] [CrossRef] [PubMed]
- Fudali-Czyż, A.; Francuz, P.; Augustynowicz, P. The Effect of Art Expertise on Eye Fixation-Related Potentials during Aesthetic Judgment Task in Focal and Ambient Modes. Front. Psychol. 2018, 9, 1972. [Google Scholar] [CrossRef] [PubMed]
- Freunberger, R.; Klimesch, W.; Doppelmayr, M.; Höller, Y.; Freunberger, R.; Klimesch, W.; Doppelmayr, M.; Höller, Y. Visual P2 Component Is Related to Theta Phase-Locking. Neurosci. Lett. 2007, 426, 181–186. [Google Scholar] [CrossRef] [PubMed]
- Kutas, M.; Hillyard, S.A. Reading Senseless Sentences: Brain Potentials Reflect Semantic Incongruity. Science 1980, 207, 203–205. [Google Scholar] [CrossRef] [PubMed]
- Liu, T.; Butler, R.J.; Zhang, C. Evaluation of Public Perceptions of Authenticity of Urban Heritage under the Conservation Paradigm of Historic Urban Landscape—A Case Study of the Five Avenues Historic District in Tianjin, China. J. Archit. Conserv. 2019, 25, 228–251. [Google Scholar] [CrossRef]
- Ma, Z.; Chang, X.; Yang, Y.; Sebe, N.; Hauptmann, A.G.; Ma, Z.; Chang, X.; Yang, Y.; Sebe, N.; Hauptmann, A.G. The Many Shades of Negativity. IEEE Trans. Multimed. 2017, 19, 1558–1568. [Google Scholar] [CrossRef]
- Wojciszke, B.; Brycz, H.; Borkenau, P.; Wojciszke, B.; Brycz, H.; Borkenau, P. Effects of Information Content and Evaluative Extremity on Positivity and Negativity Biases. J. Personal. Soc. Psychol. 1993, 64, 327–335. [Google Scholar] [CrossRef]
- Lu, L.; Chi, C.G.; Liu, Y. Authenticity, Involvement, and Image: Evaluating Tourist Experiences at Historic Districts. Tour. Manag. 2015, 50, 85–96. [Google Scholar] [CrossRef]
- Mouratidis, K.; Hassan, R. Contemporary versus Traditional Styles in Architecture and Public Space: A Virtual Reality Study with 360-Degree Videos. Cities 2020, 97, 102499. [Google Scholar] [CrossRef]
- Kwon, J.-H.; Kim, J.; Kim, S.; Cho, G.-H. Pedestrians Safety Perception and Crossing Behaviors in Narrow Urban Streets: An Experimental Study Using Immersive Virtual Reality Technology. Accid. Anal. Prev. 2022, 174, 106757. [Google Scholar] [CrossRef] [PubMed]
- Ding, W.; Wei, Q.; Jin, J.; Nie, J.; Zhang, F.; Zhou, X.; Ma, Y. Research on Public Space Micro-Renewal Strategy of Historical and Cultural Blocks in Sanhe Ancient Town under Perception Quantification. Sustainability 2023, 15, 2790. [Google Scholar] [CrossRef]
- Talsma, D.; Senkowski, D.; Soto-Faraco, S.; Woldorff, M.G. The Multifaceted Interplay between Attention and Multisensory Integration. Trends Cogn. Sci. 2010, 14, 400–410. [Google Scholar] [CrossRef] [PubMed]


Disclaimer/Publisher’s Note: The statements, opinions and data contained in all publications are solely those of the individual author(s) and contributor(s) and not of MDPI and/or the editor(s). MDPI and/or the editor(s) disclaim responsibility for any injury to people or property resulting from any ideas, methods, instructions or products referred to in the content. |
© 2024 by the authors. Licensee MDPI, Basel, Switzerland. This article is an open access article distributed under the terms and conditions of the Creative Commons Attribution (CC BY) license (https://creativecommons.org/licenses/by/4.0/).