
The Energy Saving Potential in an Office Building Using Louvers in Mid-Latitude Climate Conditions

 , ,
, ,
Abstract
1. Introduction
2. Methodology
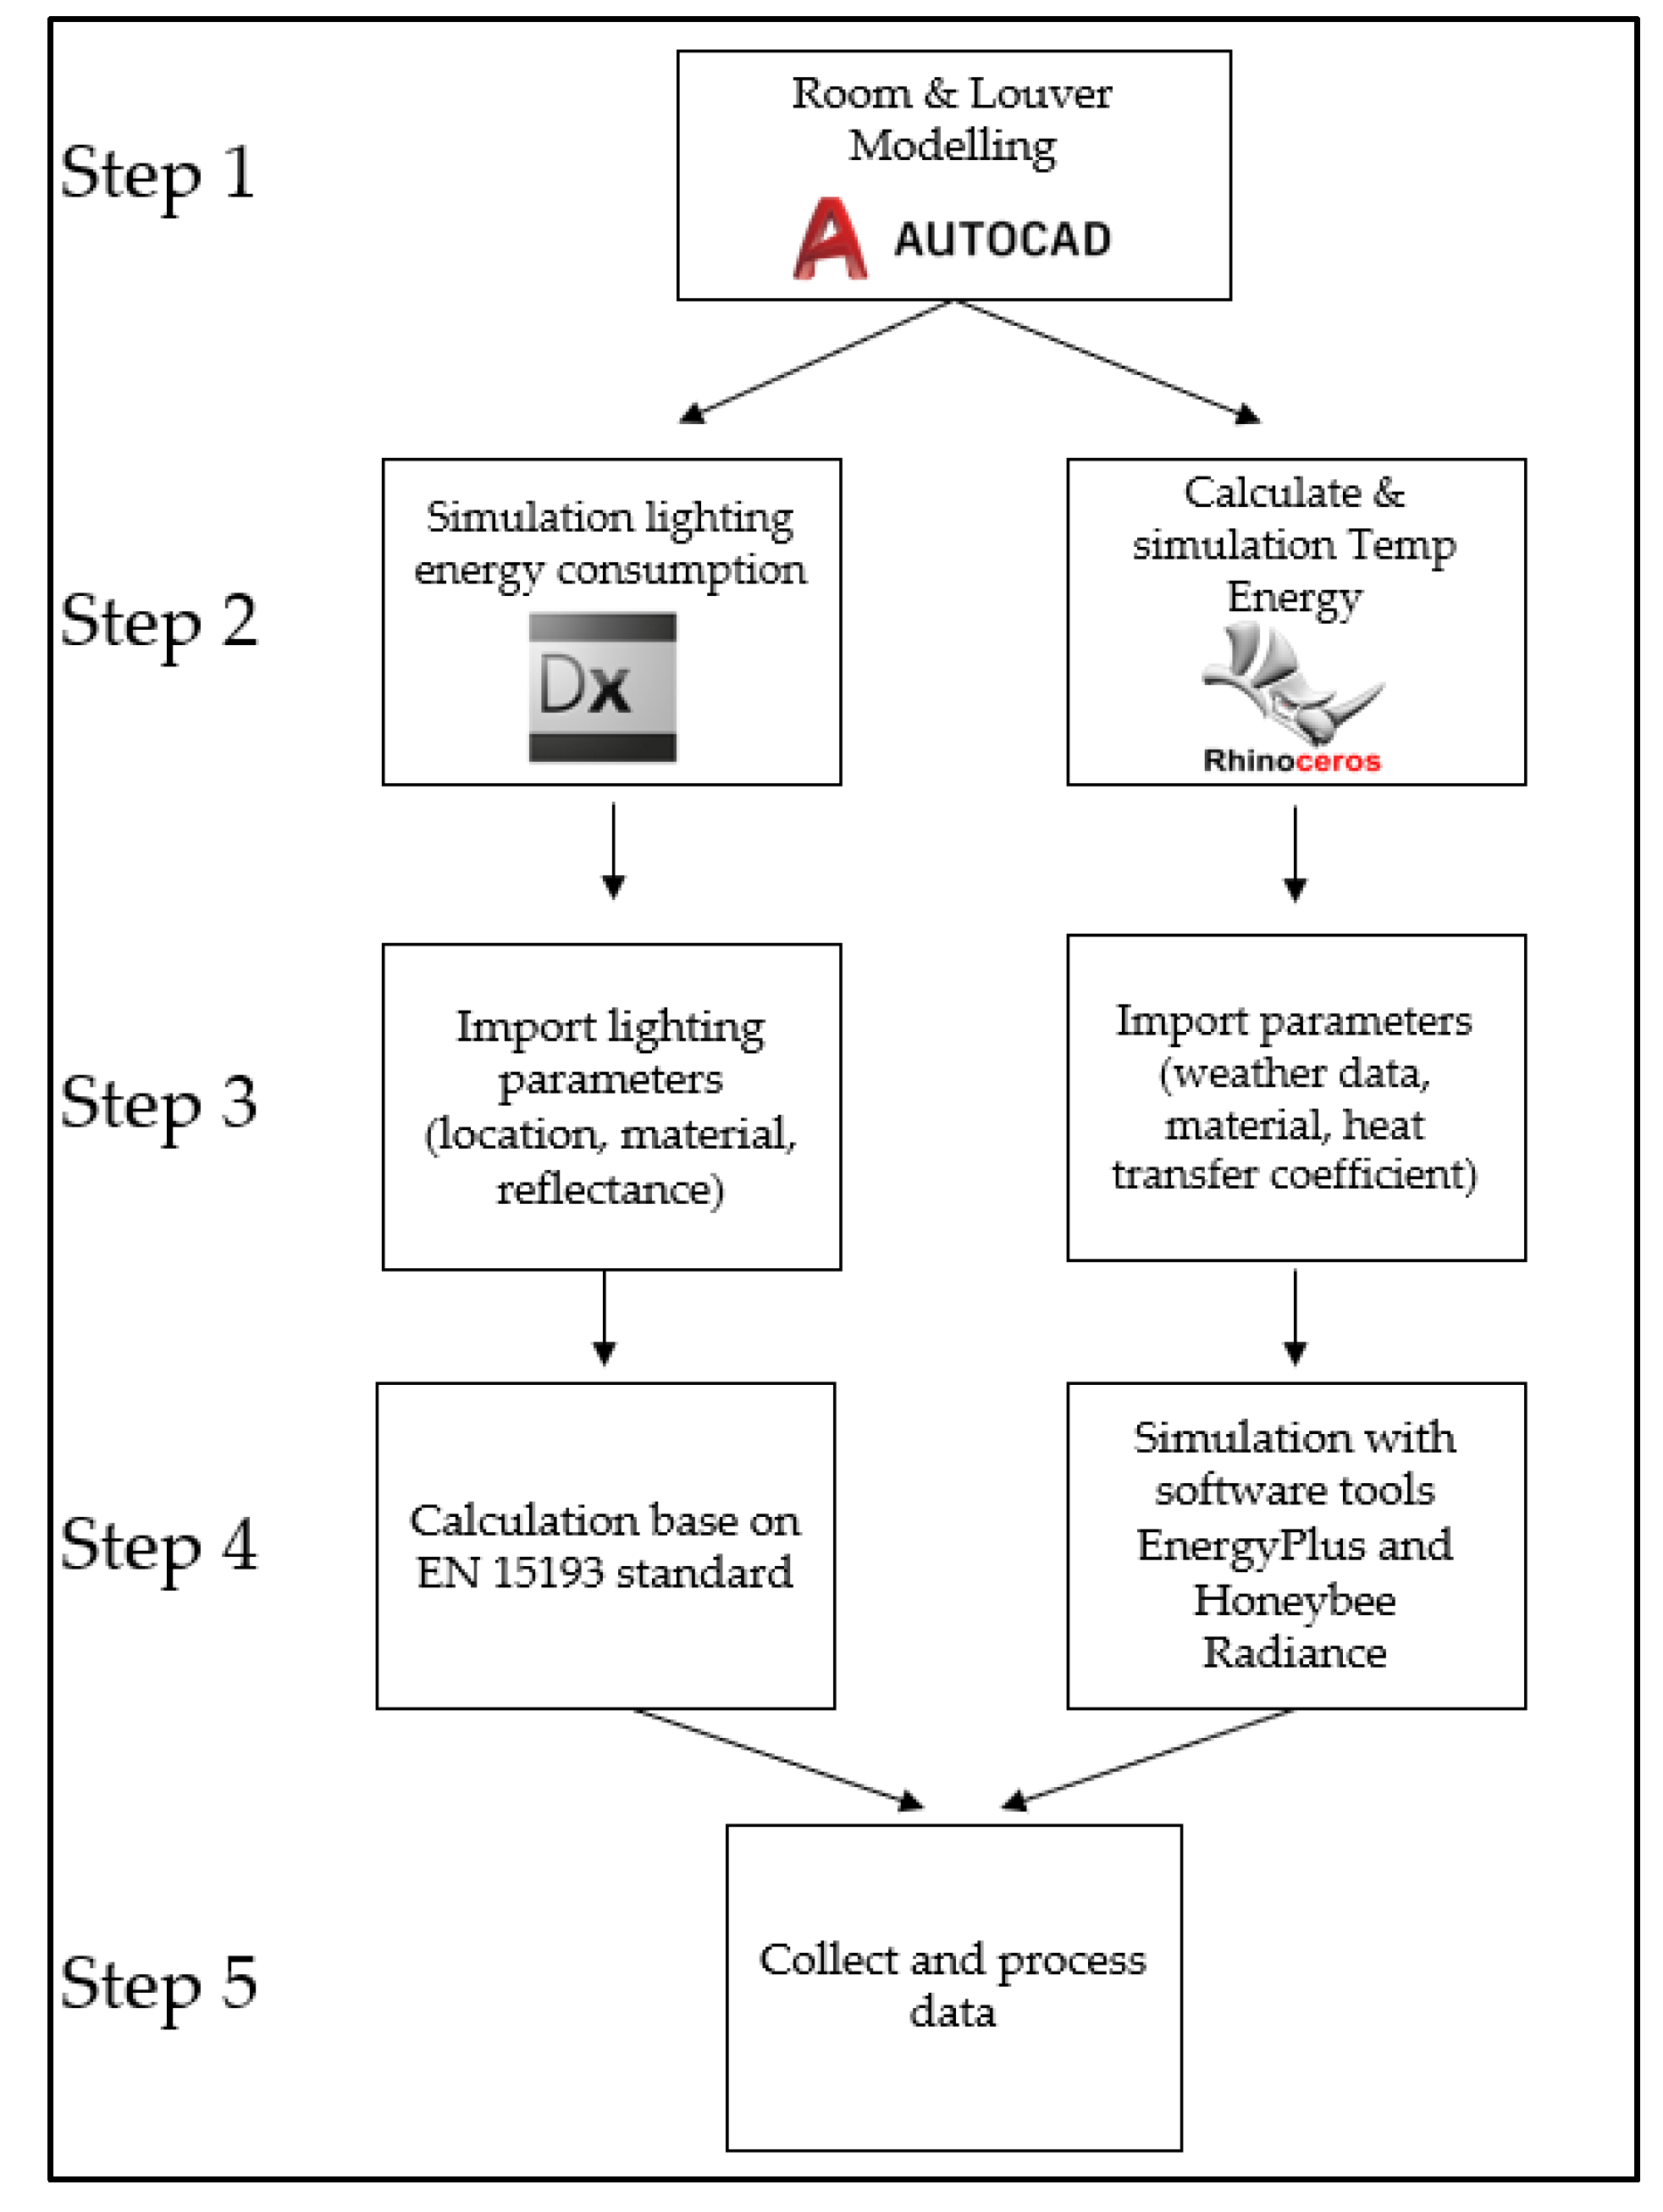
- Using DIALux software 11.0, lighting conditions within a room using louvers and the amount of energy saved using the louver system [24].
- Using Rhino software 7, calculation of the energy required for heating and cooling in an office with and without the use of louvers [25]. The results were then analyzed to determine the energy-saving potential of the louver system. The research was carried out using a virtual model and a parametric approach on a simulation platform. The research workflow is depicted in Figure 1.

2.1. Model Specifications
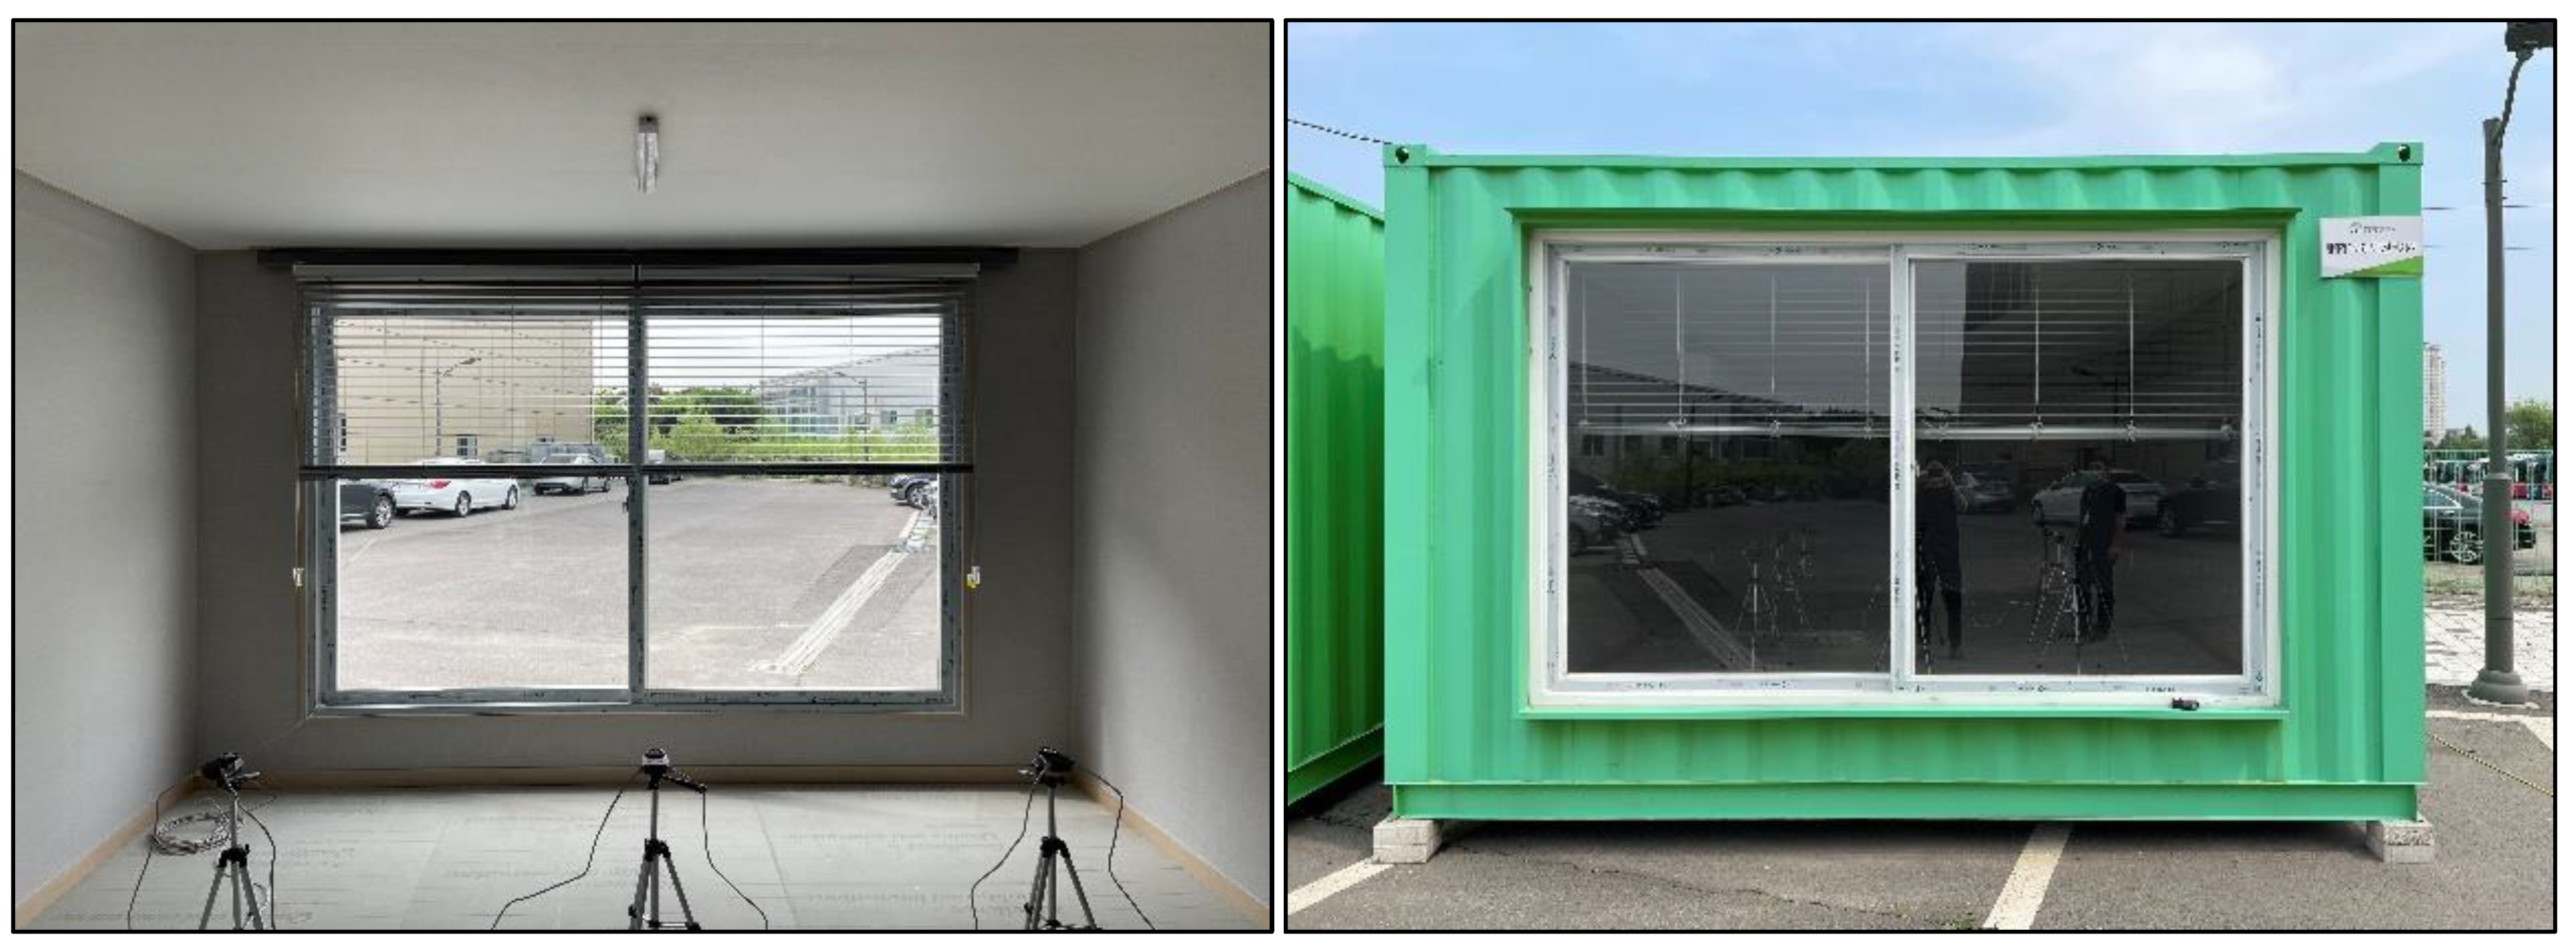
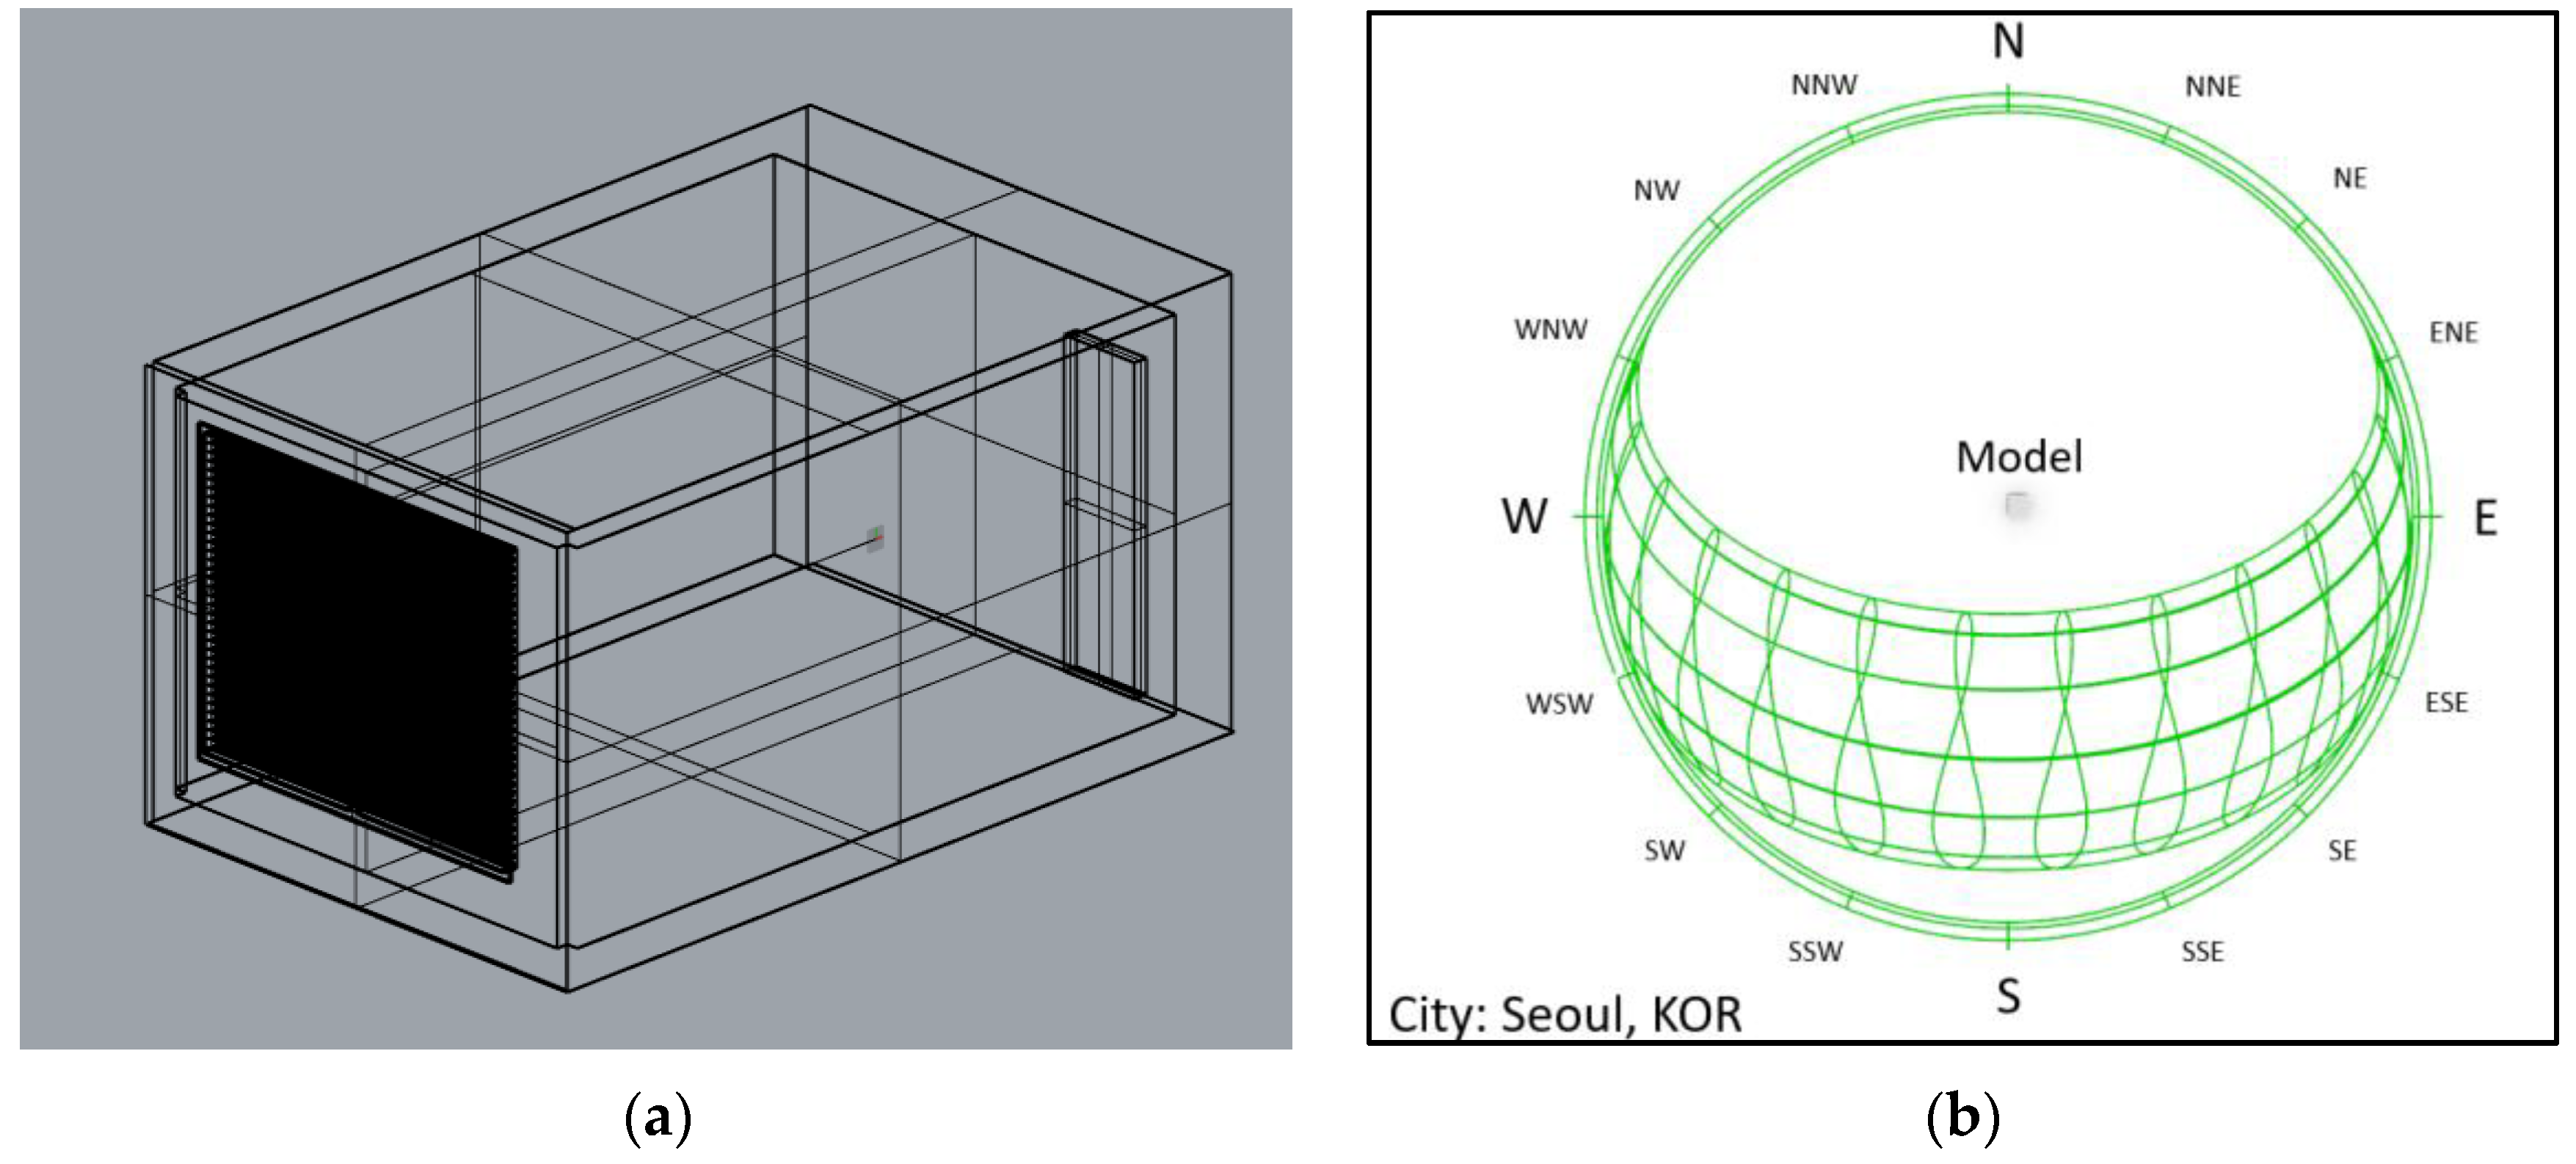
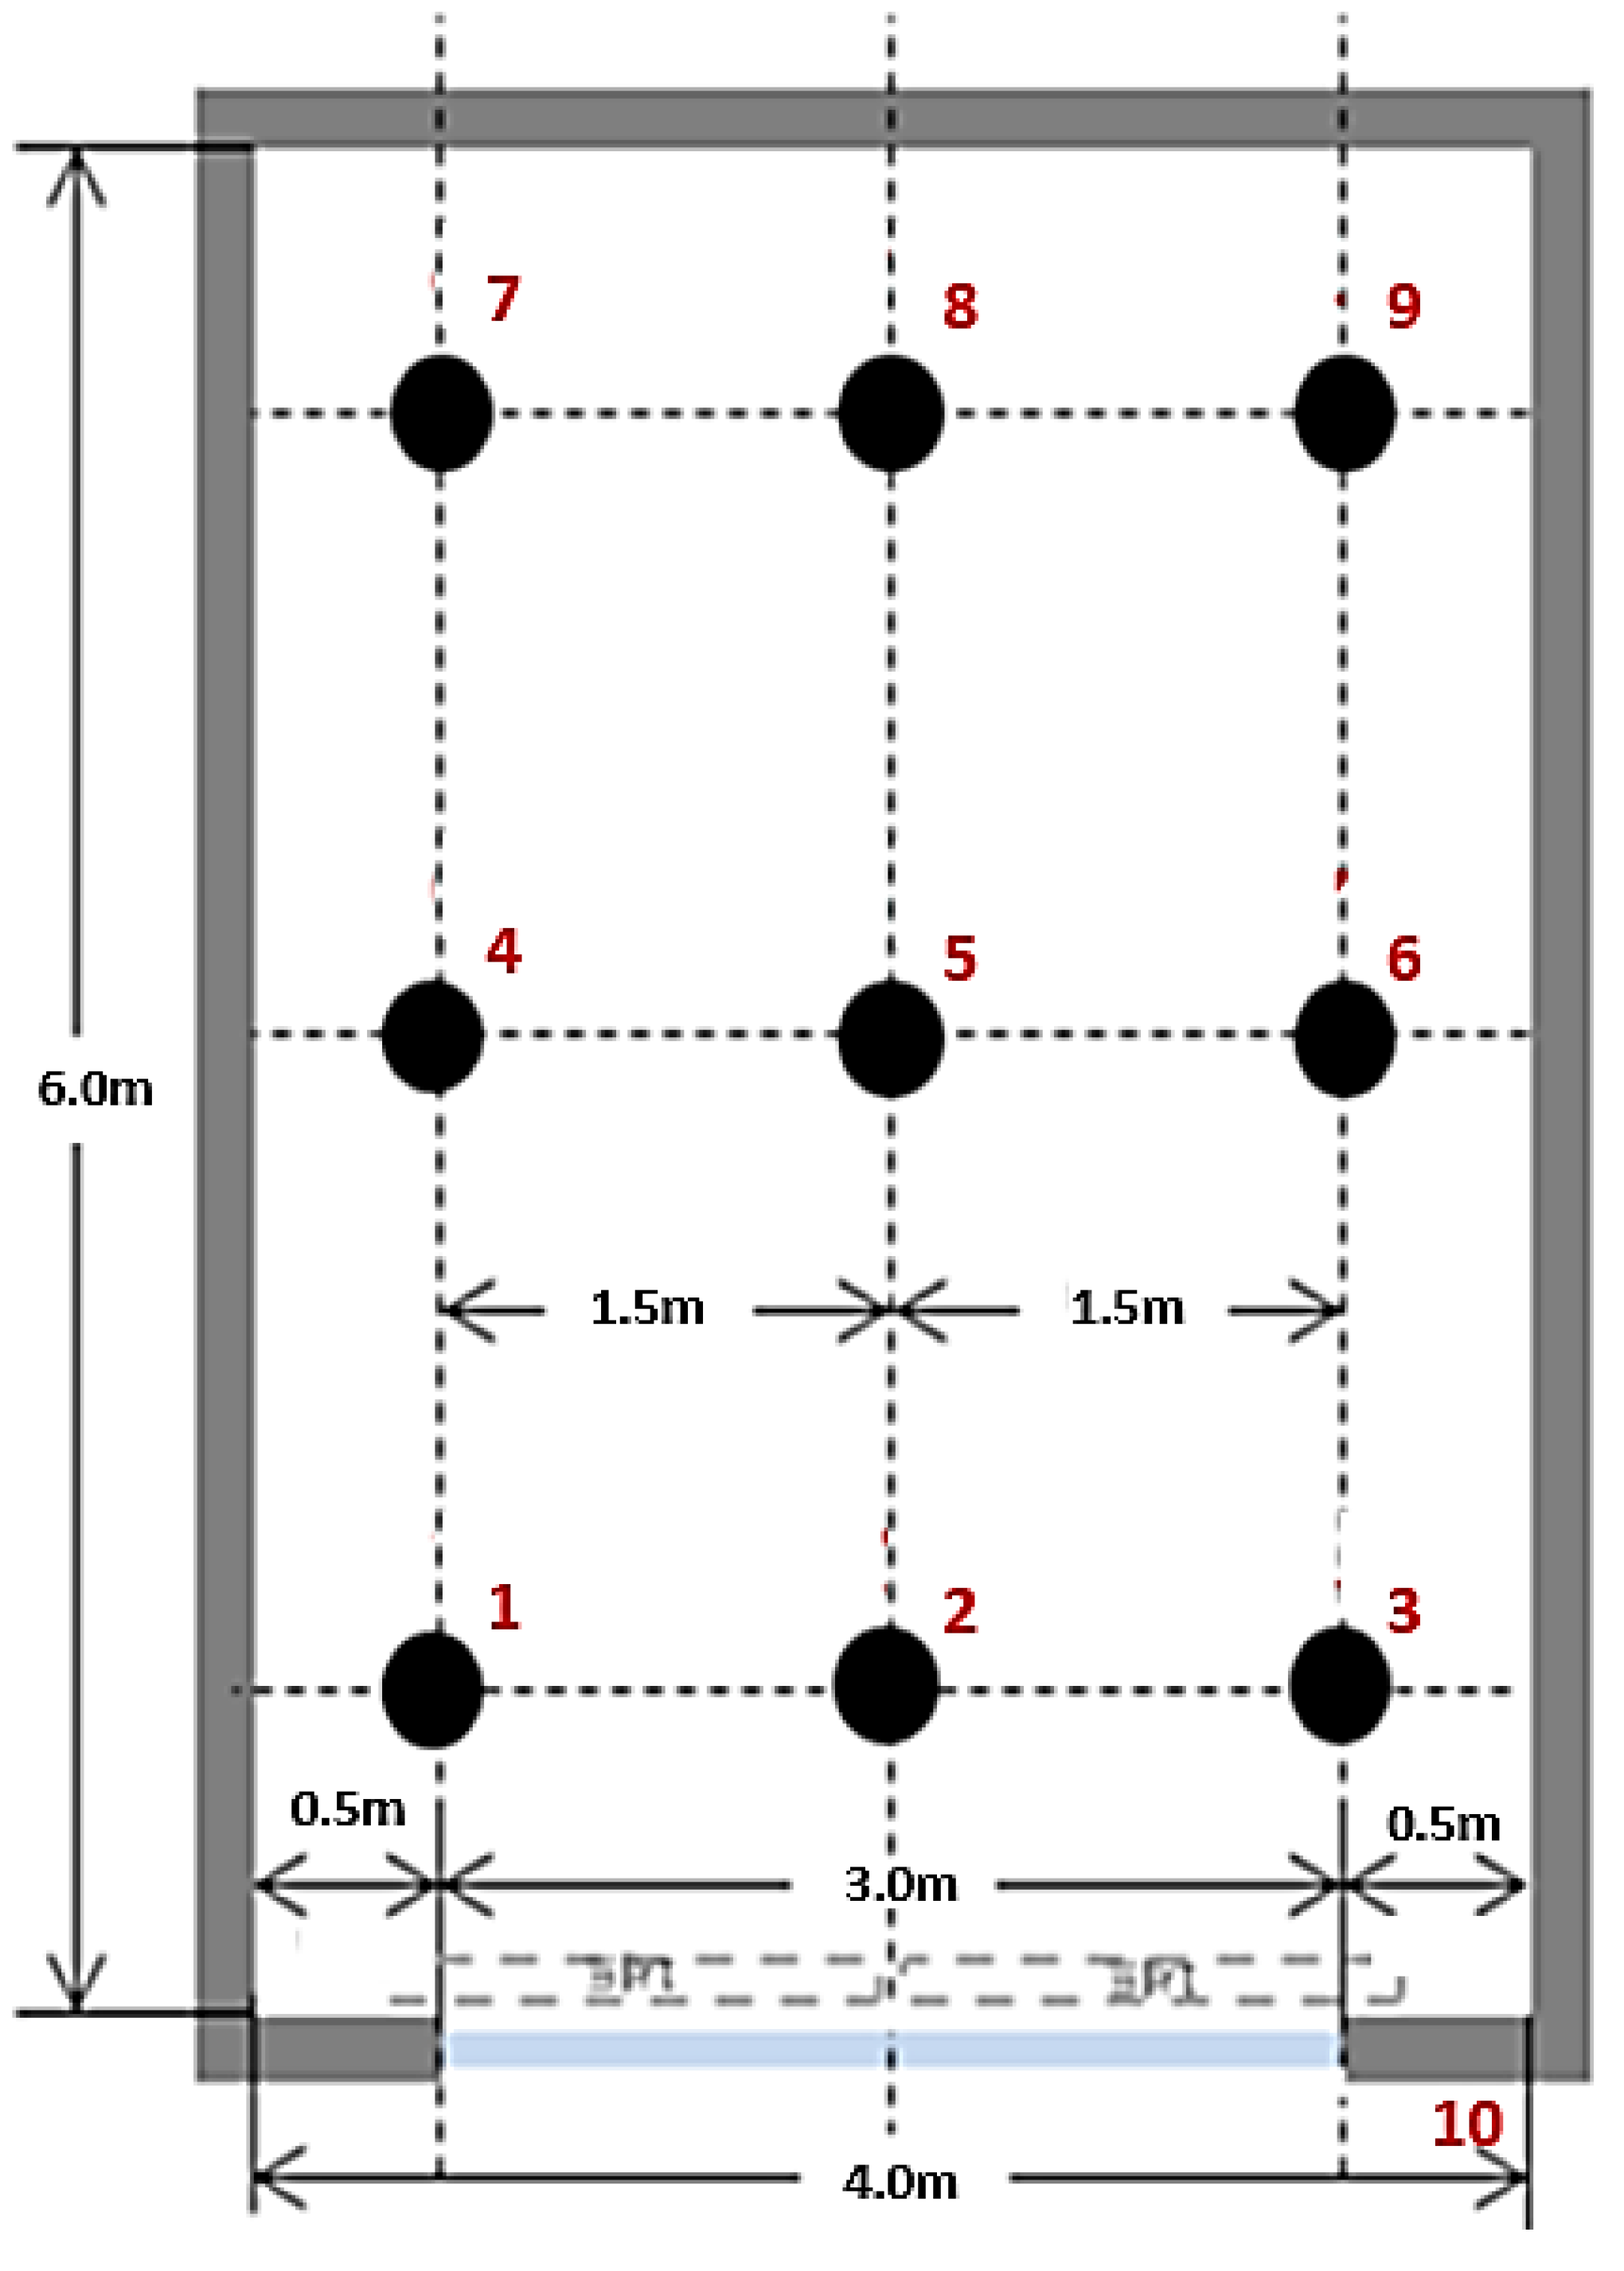
2.1.1. Test Room Specifications
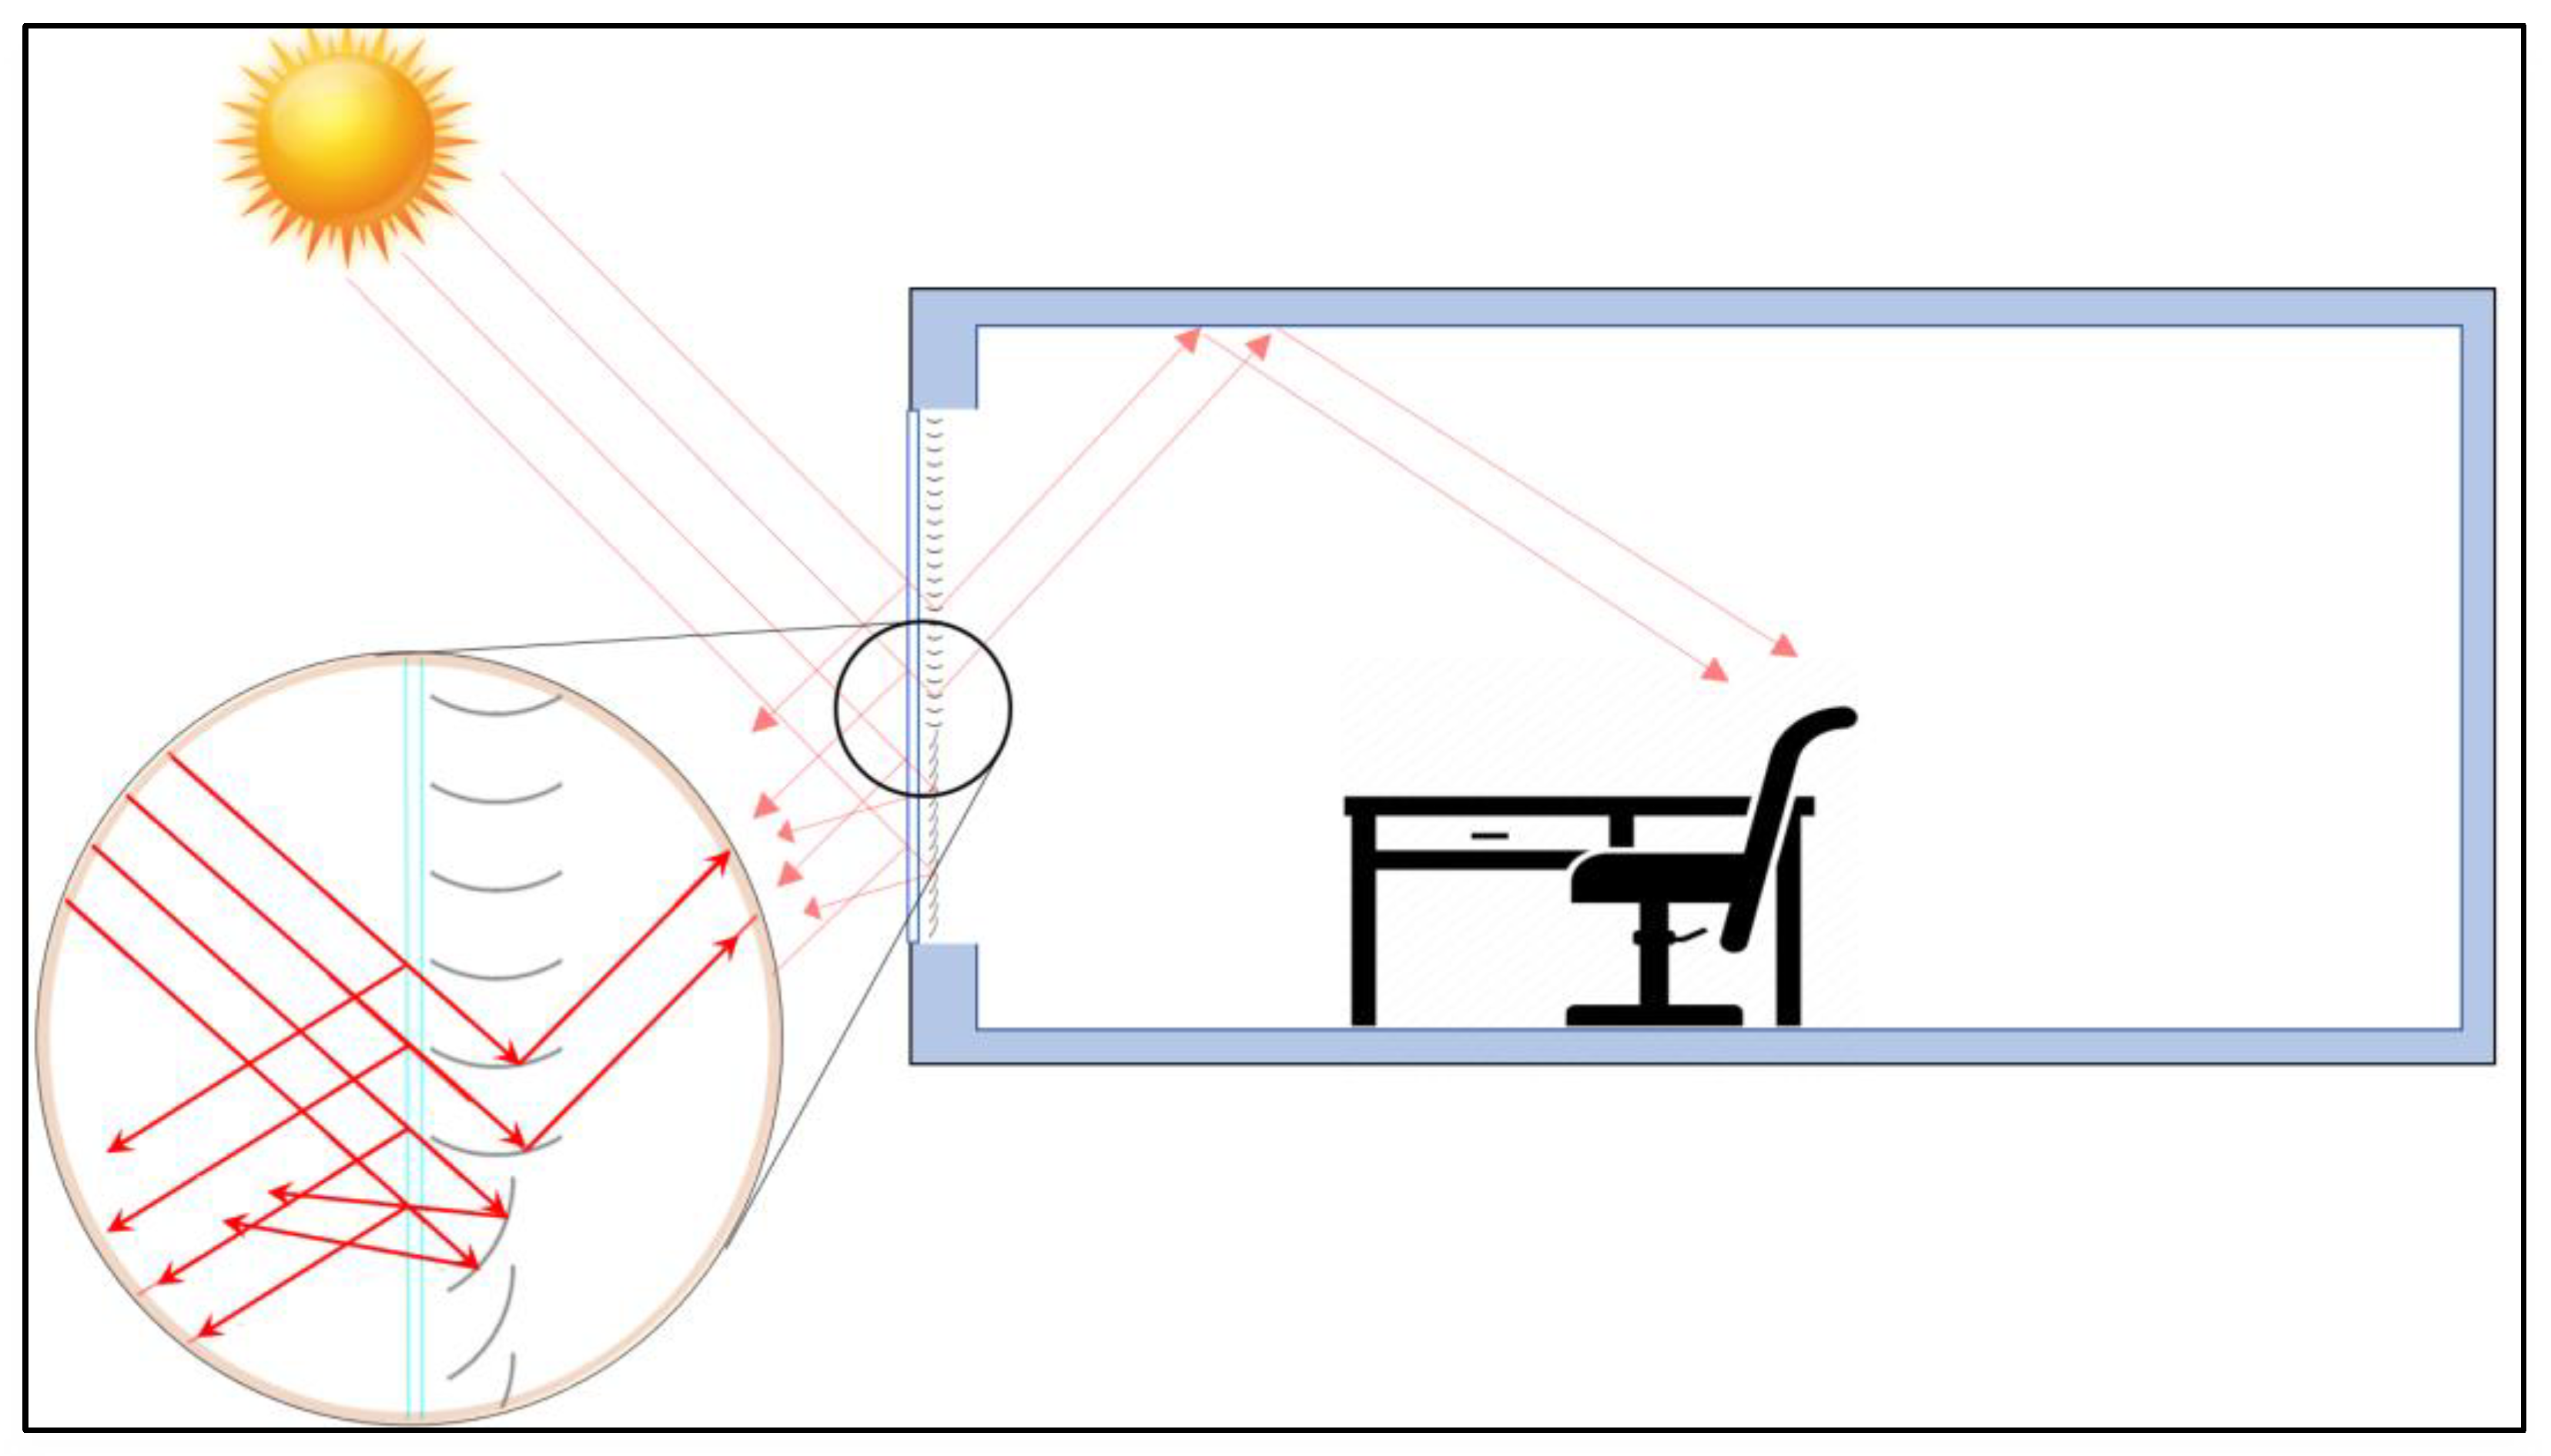
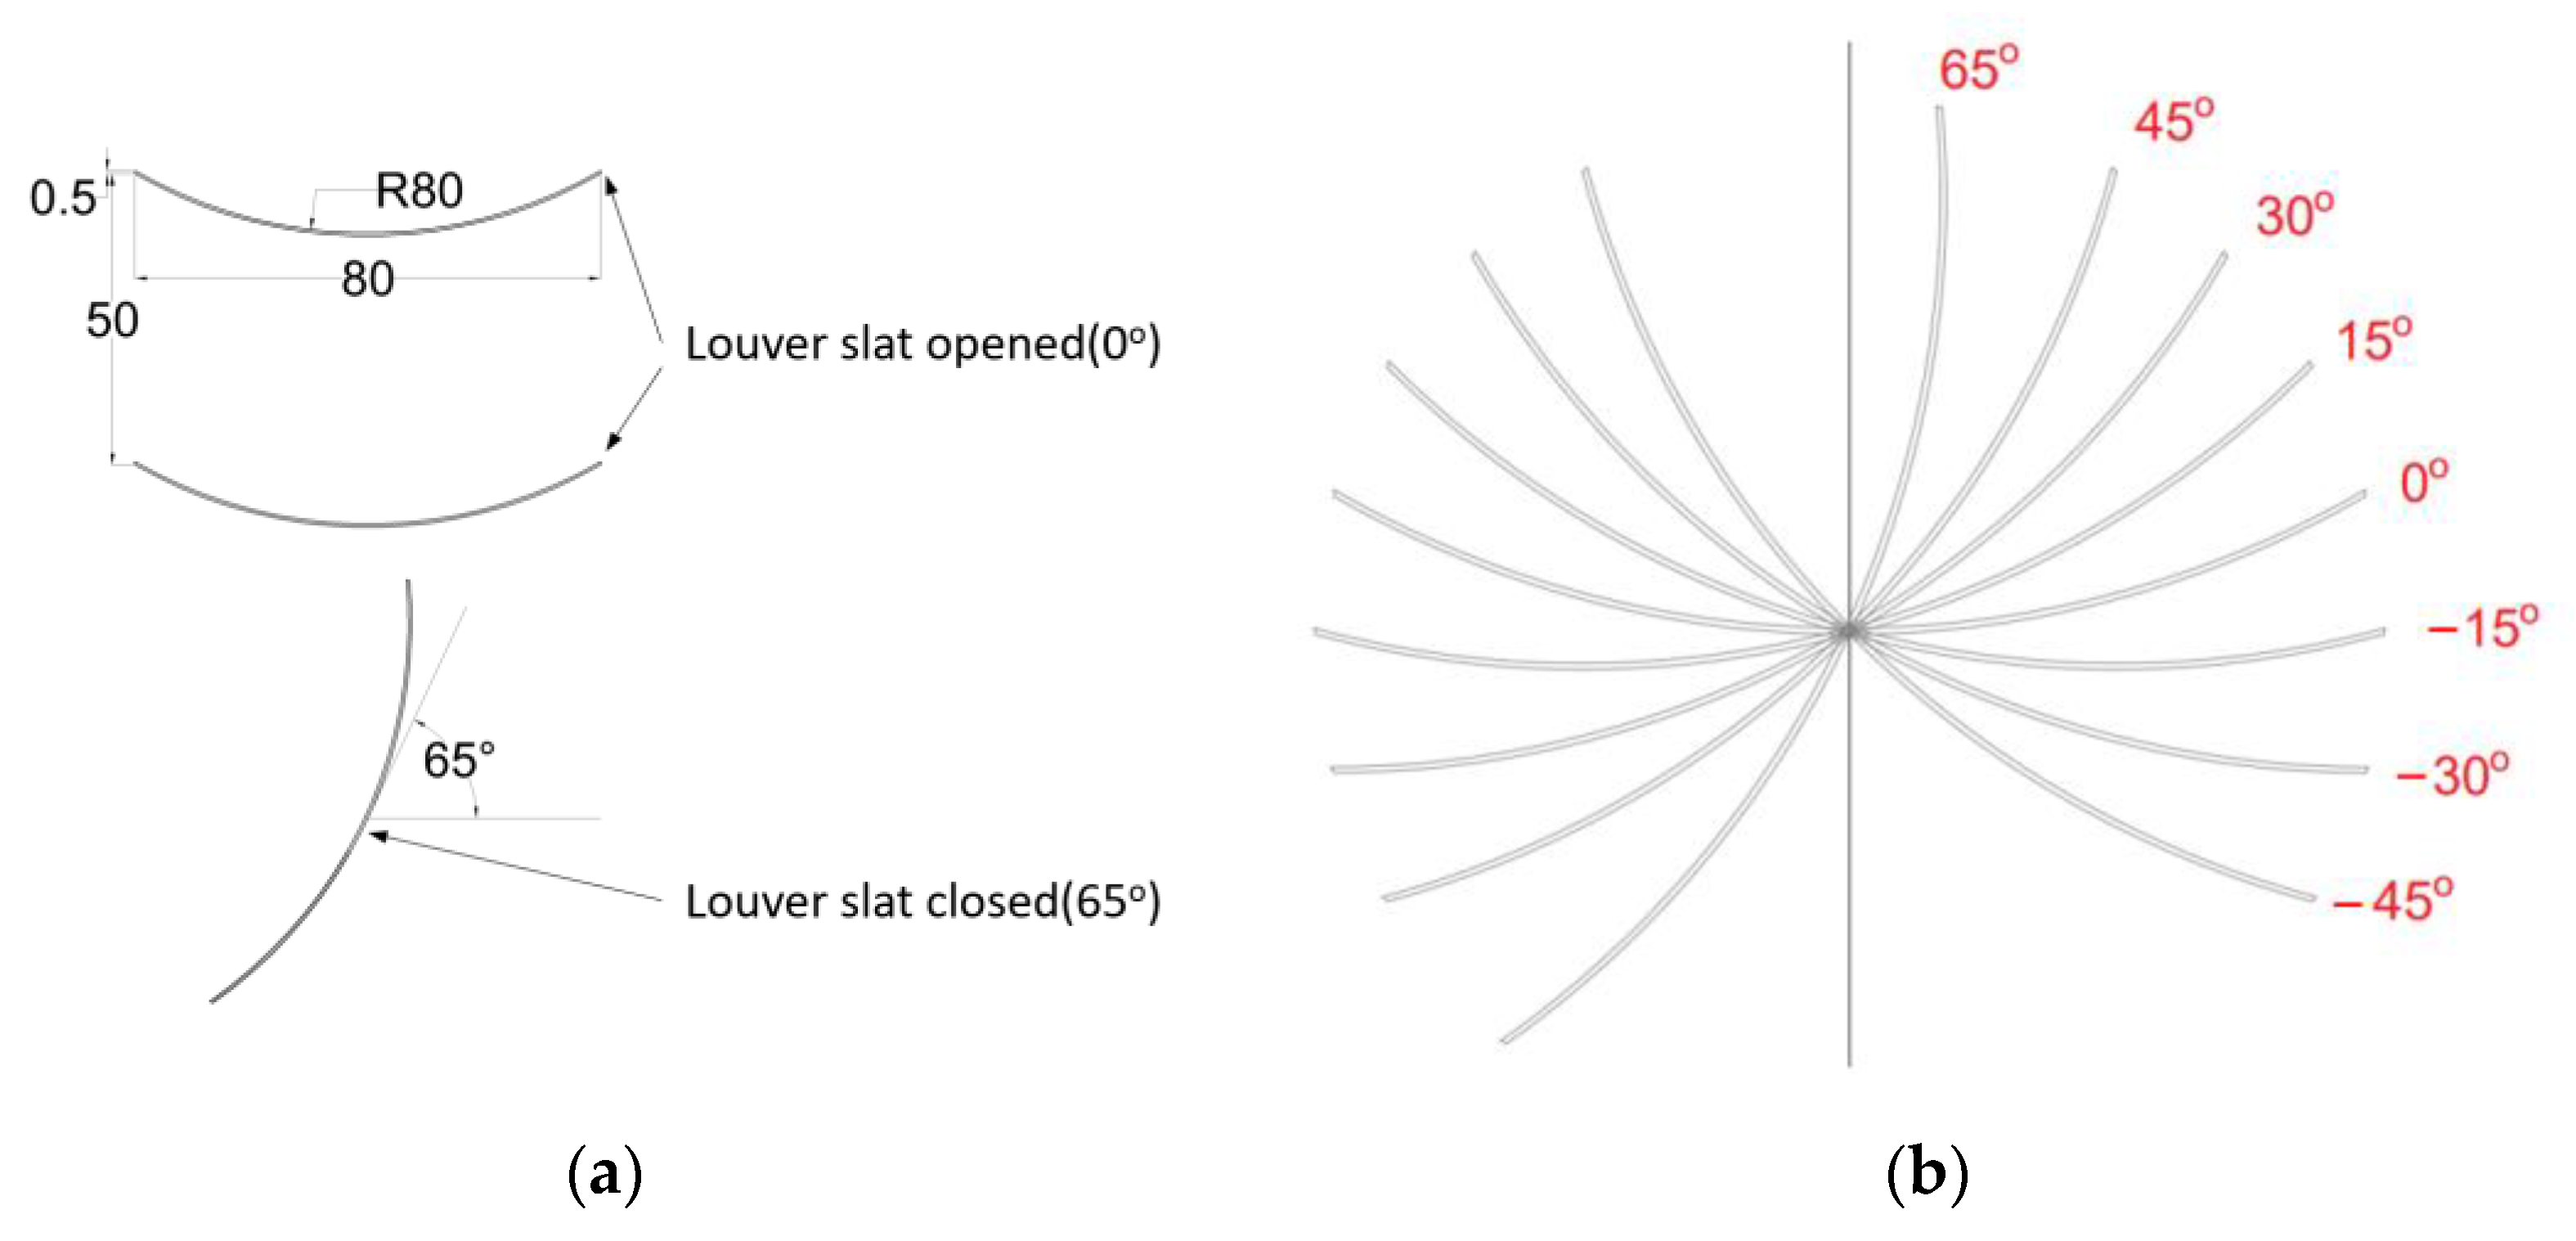
2.1.2. Louver
2.2. Measurement and Comparison Analysis
3. Simulation
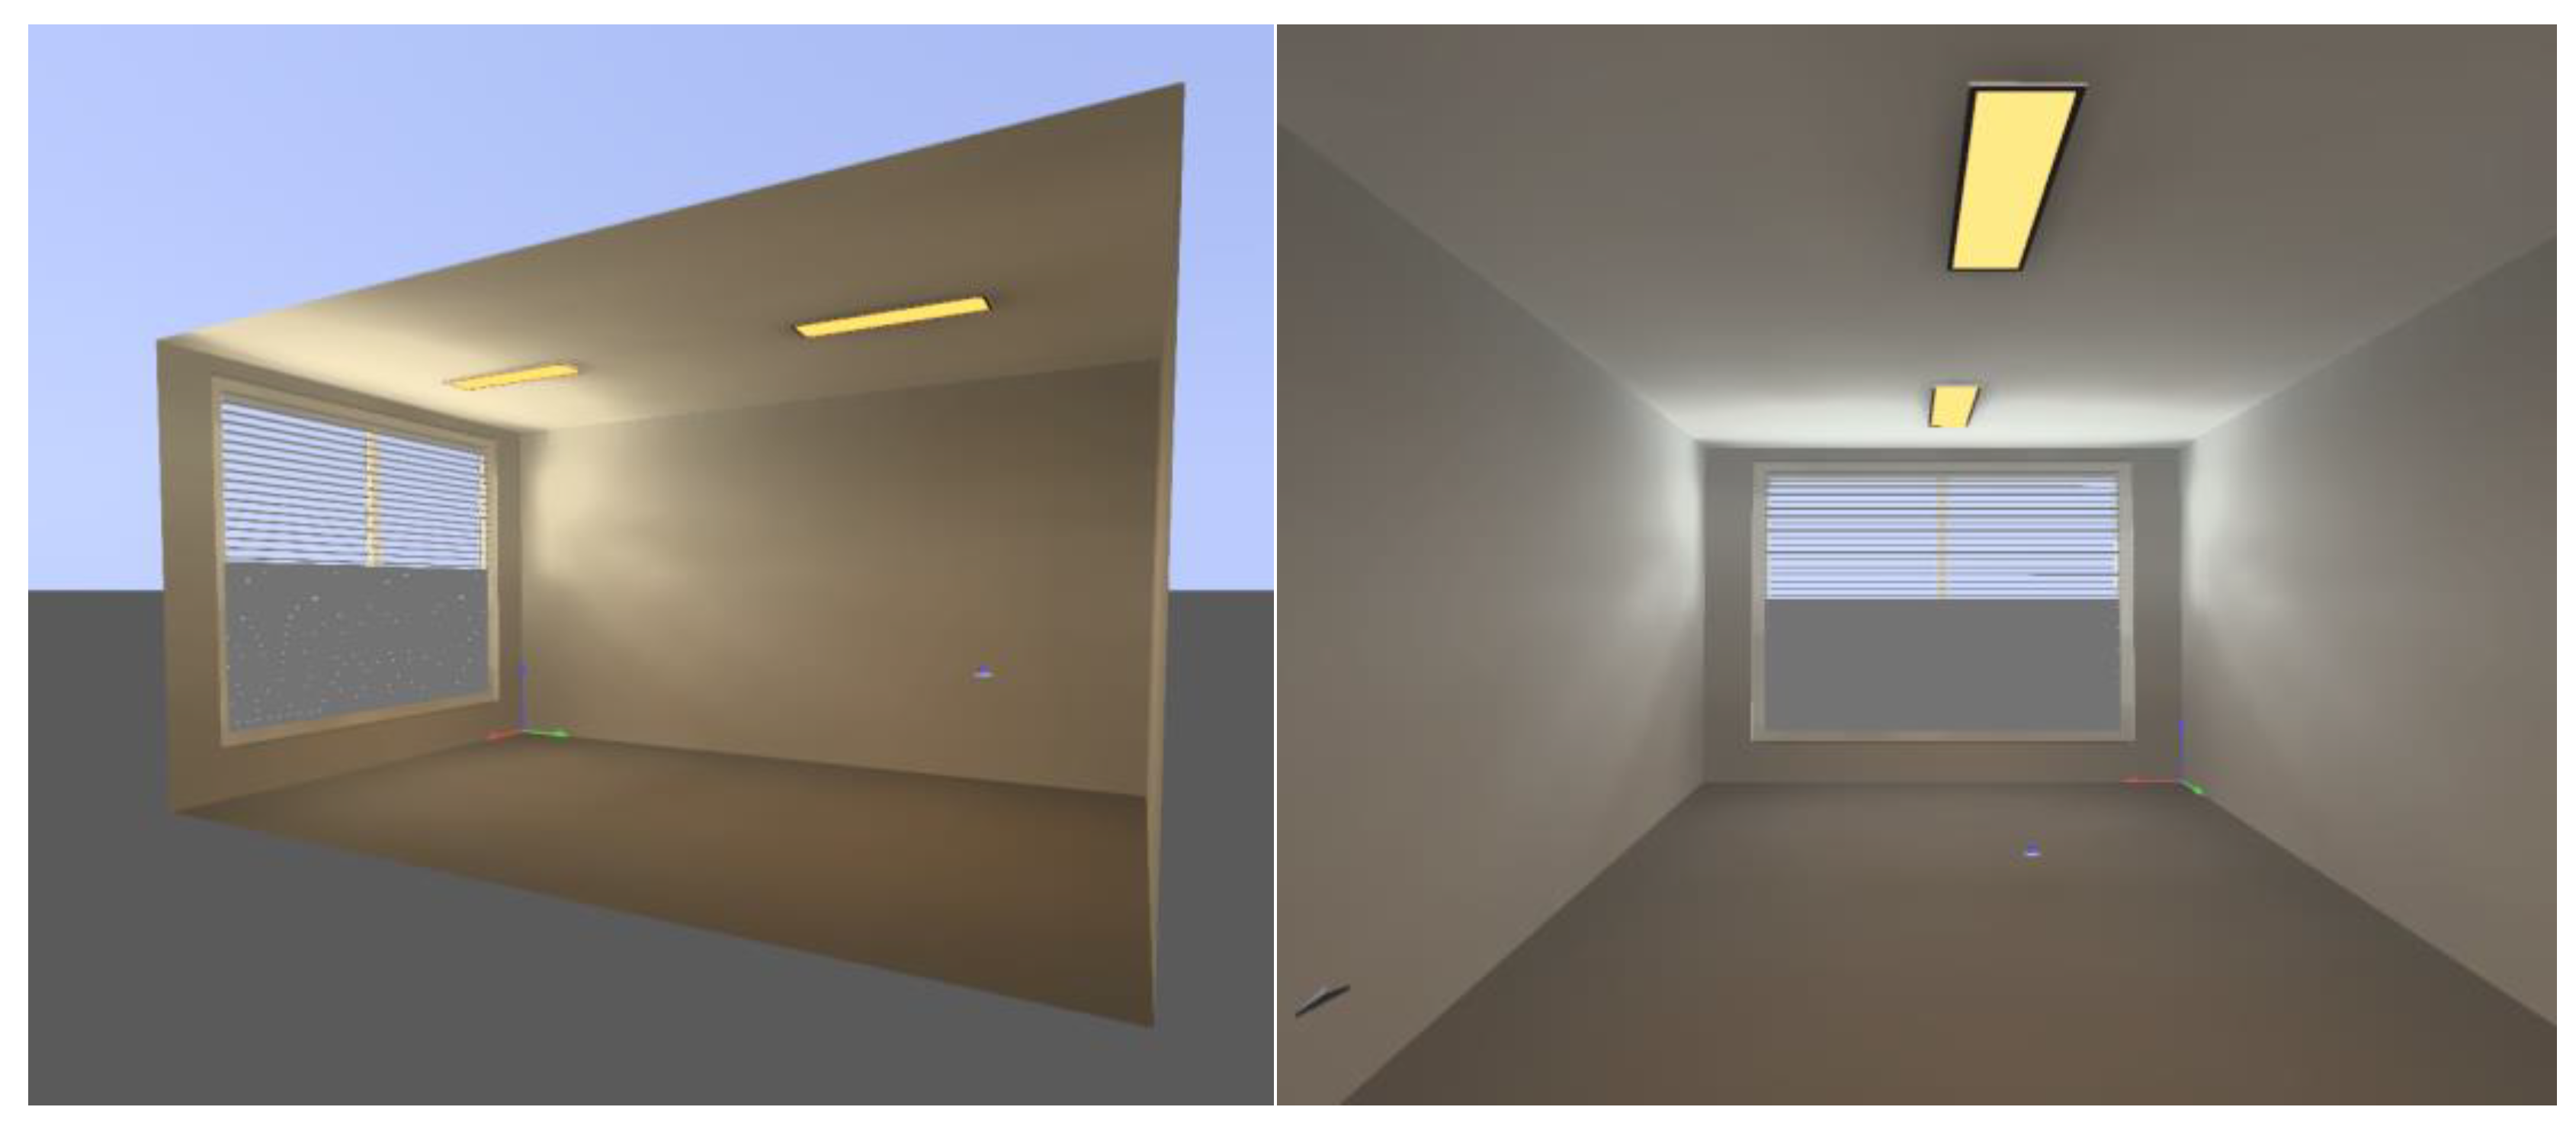
3.1. Calculation and Simulation of Room Lighting
3.2. Thermal Energy Calculation and Simulation Using Rhino Software
4. Result
4.1. Compare the Results of Measuring Light Distribution in the Test Room and the Simulated Values
4.2. Calculation and Simulation Results of Lighting Energy
4.3. Calculation and Simulation Results of Cooling Energy
4.4. Total Energy Saved
5. Conclusions
Author Contributions
Funding
Data Availability Statement
Conflicts of Interest
References
- United Nations Environment Programme. 2022 Global Status Report for Buildings and Construction: Towards a Zero-emission, Efficient and Resilient Buildings and Construction Sector. 2022. Available online: https://wedocs.unep.org/20.500.11822/41133 (accessed on 8 March 2023).
- Alsukkar, M.; Hu, M.; Eltaweel, A.; Su, Y. Daylighting performance improvements using of split louver with parametrically incremental slat angle control. Energy Build. 2022, 274, 112444. [Google Scholar] [CrossRef]
- Bian, Y.; Chen, Y.; Sun, Y.; Ma, Y.; Yu, D.; Leng, T. Simulation of daylight availability, visual comfort and view clarity for a novel window system with switchable blinds in classrooms. Build. Environ. 2023, 235, 110243. [Google Scholar] [CrossRef]
- Bahdad, A.A.S.; Fadzil, S.F.S.; Onubi, H.O.; BenLasod, S.A. Sensitivity analysis linked to multi-objective optimization for adjustments of light-shelves design parameters in response to visual comfort and thermal energy performance. J. Build. Eng. 2021, 44, 102996. [Google Scholar] [CrossRef]
- Hassan, F.H.; Ali, K.A.; Ahmed, S.A. Biomimicry as an Approach to Improve Daylighting Performance in Office Buildings in Assiut City, Egypt. J. Daylighting 2023, 10, 1–16. [Google Scholar] [CrossRef]
- Atthaillah, A.; Mangkuto, R.A.; Koerniawan, M.D.; Hensen, J.L.; Yuliarto, B. Optimization of Daylighting Design Using Self-Shading Mechanism in Tropical School Classrooms with Bilateral Openings. J. Daylighting 2022, 9, 117–136. [Google Scholar] [CrossRef]
- Jakubowsky, M.; De Boer, J. Façade elements for room illumination with integrated microstructures for daylight redirection and LED lighting. Energy Build. 2022, 266, 112106. [Google Scholar] [CrossRef]
- Tao, Y.; Fang, X.; Setunge, S.; Tu, J.; Liu, J.; Shi, L. Naturally ventilated double-skin façade with adjustable louvers. Sol. Energy 2021, 225, 33–43. [Google Scholar] [CrossRef]
- Yu, G.; Yang, H.; Luo, D.; Cheng, X.; Ansah, M.K. A review on developments and researches of building integrated photovoltaic (BIPV) windows and shading blinds. Renew. Sustain. Energy Rev. 2021, 149, 111355. [Google Scholar] [CrossRef]
- Freewan, A.A.; Shao, L.; Riffat, S. Interactions between louvers and ceiling geometry for maximum daylighting performance. Renew. Energy 2009, 34, 223–232. [Google Scholar] [CrossRef]
- Fang, J.; Zhao, Y.; Tian, Z.; Lin, P. Analysis of dynamic louver control with prism redirecting fenestrations for office daylighting optimization. Energy Build. 2022, 262, 112019. [Google Scholar] [CrossRef]
- Kobayashi, H.; Kawagishi, K.; Arata, K. Stationary dielectric daylighting louver based on concept of Köhler integrator. Sol. Energy 2022, 241, 361–371. [Google Scholar] [CrossRef]
- Liu, R. An Overview of Aluminum Protective Coating Properties and Treatments. 2009. Available online: https://wp.optics.arizona.edu/optomech/wp-content/uploads/sites/53/2016/10/An-Overview-of-Aluminum-Protective-Coating-Properties-and-Treatments.pdf (accessed on 8 March 2023).
- Khidmat, R.P.; Fukuda, H.; Paramita, B.; Koerniawan, M.D. The optimization of louvers shading devices and room orientation under three different sky conditions. J. Daylighting 2022, 9, 137–149. [Google Scholar] [CrossRef]
- Eltaweel, A.; Mandour, M.A.; Lv, Q.; Su, Y. Daylight Distribution Improvement Using Automated Prismatic Louvre. J. Daylighting 2020, 7, 84–92. [Google Scholar] [CrossRef]
- Chen, H.; Cai, B.; Yang, H.; Wang, Y.; Yang, J. Study on natural lighting and electrical performance of louvered photovoltaic windows in hot summer and cold winter areas. Energy Build. 2022, 271, 112313. [Google Scholar] [CrossRef]
- Jiang, F.; Li, Z.; Zhao, Q.; Tao, Q.; Lu, S.; Zhao, K. The influence of exterior louver blinds’ geometric and thermal attributes on the convective heat transfer at building facades. Sol. Energy 2019, 193, 654–665. [Google Scholar] [CrossRef]
- Tao, Q.; Jiang, F.; Li, Z.; Zheng, J. A model of heat gain calculation for buildings with shuttle louvers: Verification and a case study. J. Build. Eng. 2020, 29, 101101. [Google Scholar] [CrossRef]
- Jiang, F.; Yuan, Y.; Li, Z.; Zhao, Q.; Zhao, K. Correlations for the forced convective heat transfer at a windward building façade with exterior louver blinds. Sol. Energy 2020, 209, 709–723. [Google Scholar] [CrossRef]
- Uribe, D.; Vera, S.; Bustamante, W.; McNeil, A.; Flamant, G. Impact of different control strategies of perforated curved louvers on the visual comfort and energy consumption of office buildings in different climates. Sol. Energy 2019, 190, 495–510. [Google Scholar] [CrossRef]
- Hernández, F.F.; López, J.M.C.; Suárez, J.M.P.; Muriano, M.C.G.; Rueda, S.C. Effects of louvers shading devices on visual comfort and energy demand of an office building. A case of study. Energy Procedia 2017, 140, 207–216. [Google Scholar] [CrossRef]
- Kim, J.H.; Han, S.H. Indoor Daylight Performances of Optimized Transmittances with Electrochromic-Applied Kinetic Louvers. Buildings 2022, 12, 263. [Google Scholar] [CrossRef]
- Alsukkar, M.; Hu, M.; Gadi, M.; Su, Y. A Study on Daylighting Performance of Split Louver with Simplified Parametric Control. Buildings 2022, 12, 594. [Google Scholar] [CrossRef]
- DIALux. Available online: https://www.dialux.com/en-GB/about-dial (accessed on 2 April 2023).
- Rhino. Available online: https://blog.rhino3d.com/ (accessed on 2 April 2023).
- EN 15193:2017; European Standard: Energy Performance of Buildings—Energy Requirements for Lighting. European Committee for Standardization (CEN): Brussels, Belgium; p. 2017.
- Ullah, I.; Shin, S. Highly Concentrated Optical Fiber-Based Daylighting Systems for Multi-Floor Office Buildings. Energy Build. 2014, 72, 246–261. [Google Scholar] [CrossRef]
- EN 12464-1:2021; European Standard: Light and Lighting—Lighting of Work Places—Part 1: Indoor Work Places. European Committee for Standardization (CEN): Brussels, Belgium, 2021.
- Wu, Y.; An, J.; Gui, C.; Xiao, C.; Yan, D. A global typical meteorological year (TMY) database on ERA5 dataset. Build. Simul. 2023, 16, 1013–1026. [Google Scholar] [CrossRef]
- Thermal Environmental Conditions for Human Occupancy (Standard 55-2020) (ashrae.org). Available online: https://www.ashrae.org/technical-resources/bookstore/standard-55-thermal-environmental-conditions-for-human-occupancy (accessed on 2 April 2023).


| Article | Type | Louver Slat Angle | Comments |
|---|---|---|---|
| Muna Alsukkar et al. (2022) [2] | Horizontal | 0° to 60° and −40° to −10° | Free-glare indoor illumination |
| Jìaeng Fang et al. (2022) [11] | Horizontal | 7° | Better daylighting luminous environment |
| M. Alsukkar et al. (2022) [23] | Horizontal | 0° to 38° | Improve the daylighting performance of the split louver |
| J.-H. Kim et al. (2022) [22] | Horizontal | 0° to 90° | Uniform indoor illuminance |
| D. Uribe et al. (2019) [20] | Horizontal | 30°, 40°, 60° | Visual comfort |
| Fujian Jiang (2019) [17] | Horizontal | 0°, 45°, 60° | Airflow for heat exchange |
| F.F. Hernández et al. (2017) [21] | Horizontal and vertical | Vertical 0°, 30°, 60° −30°, −60° Horizontal 0° | Visual comfort and energy saving |
| Component | Construction | Reflectance | Transmittance | Heat Transfer Coefficient (W/m2K) |
|---|---|---|---|---|
| Interior Walls | General Interior Wall | 0.5 | - | 2.58 |
| Exterior Walls | General Exterior Wall | - | - | 0.46 |
| Interior Ceiling | General Ceiling | 0.8 | - | 1.45 |
| Interior Floor | General Floor | 0.2 | - | 1.45 |
| Window | Clear Glass | 0.05 | 0.9 | 0.5 |
| Louver slats | Coating Aluminum | 0.9 | - | 10 |
| Data No. | Date and Time | Ev [lx] (10) | Ev [lx] (1) | Ev [lx] (2) | Ev [lx] (3) | Ev [lx] (4) | Ev [lx] (5) | Ev [lx] (6) | Ev [lx] (7) | Ev [lx] (8) | Ev [lx] (9) |
|---|---|---|---|---|---|---|---|---|---|---|---|
| 1 | 30 November 2022 11:05:57 | 1.35 | 0.28 | 0.26 | 1.38 | 0.2 | 0.68 | 0.36 | 0.13 | 0.44 | 0.19 |
| 2 | 30 November 2022 11:06:27 | 5830 | 0.27 | 0.26 | 1.37 | 0.2 | 0.68 | 0.36 | 0.14 | 0.44 | 0.19 |
| 3 | 30 November 2022 11:06:57 | 12,530 | 0.28 | 0.26 | 1.4 | 0.2 | 0.68 | 0.37 | 0.12 | 0.45 | 0.19 |
| 4 | 30 November 2022 11:07:29 | 12,860 | 4710 | 8330 | 5840 | 2287 | 3200 | 2641 | 711 | 0.44 | 0.19 |
| 5 | 30 November 2022 11:07:58 | 14,240 | 4770 | 8370 | 5860 | 2321 | 3230 | 2659 | 944 | 1278 | 1134 |
| 6 | 30 November 2022 11:08:31 | 24,790 | 4830 | 8380 | 5860 | 2336 | 3240 | 2662 | 951 | 1286 | 1137 |
| 7 | 30 November 2022 11:09:01 | 39,700 | 4890 | 8430 | 5880 | 2354 | 3260 | 2673 | 959 | 1296 | 1143 |
| 8 | 30 November 2022 11:09:32 | 54,400 | 4960 | 8430 | 5880 | 2365 | 3270 | 2672 | 964 | 1302 | 1143 |
| 9 | 30 November 2022 11:10:02 | 65,700 | 5050 | 8440 | 5880 | 2377 | 3280 | 2676 | 970 | 1309 | 1147 |
| 10 | 30 November 2022 11:10:31 | 68,700 | 5090 | 8420 | 5850 | 2378 | 3270 | 2663 | 970 | 1309 | 1142 |
| 11 | 30 November 2022 11:11:01 | 68,700 | 5150 | 8420 | 5840 | 2388 | 3280 | 2663 | 974 | 1314 | 1143 |
| 12 | 30 November 2022 11:11:31 | 68,700 | 5170 | 8430 | 5840 | 2398 | 3280 | 2662 | 979 | 1321 | 1145 |
| 13 | 30 November 2022 11:12:01 | 69,600 | 5260 | 8520 | 5890 | 2432 | 3320 | 2686 | 992 | 1336 | 1156 |
| 14 | 30 November 2022 11:12:31 | 69,600 | 5280 | 8530 | 5900 | 2440 | 3330 | 2693 | 998 | 1344 | 1160 |
| 15 | 30 November 2022 11:13:01 | 69,700 | 5290 | 8530 | 5880 | 2448 | 3330 | 2682 | 997 | 1342 | 1155 |
| 16 | 30 November 2022 11:13:31 | 69,500 | 5280 | 8490 | 5850 | 2448 | 3320 | 2669 | 997 | 1342 | 1151 |
| 17 | 30 November 2022 11:14:01 | 69,300 | 5270 | 8460 | 5810 | 2449 | 3310 | 2654 | 996 | 1338 | 1145 |
| 18 | 30 November 2022 11:14:31 | 69,200 | 5270 | 8440 | 5800 | 2452 | 3310 | 2650 | 998 | 1340 | 1144 |
| 19 | 30 November 2022 11:15:01 | 69,500 | 5290 | 8530 | 5880 | 2448 | 3330 | 2682 | 997 | 1242 | 1355 |
| 20 | 30 November 2022 11:15:31 | 69,800 | 5290 | 8470 | 5800 | 2478 | 3330 | 2651 | 1007 | 1349 | 1145 |
| 21 | 30 November 2022 11:16:01 | 69,800 | 5290 | 8490 | 5800 | 2489 | 3340 | 2651 | 1012 | 1353 | 1147 |
| 22 | 30 November 2022 11:16:31 | 70,100 | 5310 | 8520 | 5820 | 2505 | 3350 | 2659 | 1019 | 1361 | 1150 |
| 23 | 30 November 2022 11:17:01 | 70,200 | 5300 | 8500 | 5800 | 2511 | 3350 | 2650 | 1020 | 1361 | 1148 |
| 24 | 30 November 2022 11:17:31 | 70,200 | 5310 | 8510 | 5800 | 2520 | 3360 | 2650 | 1024 | 1364 | 1148 |
| 25 | 30 November 2022 11:18:01 | 70,100 | 5310 | 8500 | 5790 | 2525 | 3360 | 2645 | 1026 | 1366 | 1145 |
| 26 | 30 November 2022 11:18:31 | 70,000 | 5320 | 8490 | 5770 | 2530 | 3350 | 2638 | 1029 | 1367 | 1144 |
| 27 | 30 November 2022 11:19:01 | 70,200 | 5350 | 8510 | 5770 | 2542 | 3360 | 2640 | 1035 | 1372 | 1145 |
| 28 | 30 November 2022 11:19:31 | 70,100 | 5360 | 8490 | 5760 | 2547 | 3360 | 2631 | 1035 | 1372 | 1141 |
| 29 | 30 November 2022 11:20:01 | 70,100 | 5380 | 8490 | 5750 | 2555 | 3370 | 2628 | 1039 | 1374 | 1141 |
| 30 | 30 November 2022 11:20:31 | 70,400 | 5410 | 8530 | 5760 | 2571 | 3380 | 2634 | 1045 | 1382 | 1144 |
| 31 | 30 November 2022 11:21:01 | 70,800 | 5420 | 8560 | 5780 | 2586 | 3390 | 2641 | 1051 | 1389 | 1148 |
| 32 | 30 November 2022 11:21:31 | 71,400 | 5460 | 8630 | 5820 | 2615 | 3420 | 2659 | 1062 | 1402 | 1156 |
| 33 | 30 November 2022 11:22:01 | 71,700 | 5460 | 8650 | 5820 | 2629 | 3440 | 2662 | 1069 | 1408 | 1158 |
| 34 | 30 November 2022 11:22:31 | 72,000 | 5470 | 8680 | 5830 | 2647 | 3450 | 2665 | 1075 | 1414 | 1160 |
| 35 | 30 November 2022 11:23:01 | 72,100 | 5470 | 8680 | 5820 | 2658 | 3450 | 2660 | 1079 | 1416 | 1159 |
| 36 | 30 November 2022 11:23:31 | 72,200 | 5460 | 8670 | 5800 | 2666 | 3450 | 2653 | 1082 | 1417 | 1156 |
| 37 | 30 November 2022 11:24:01 | 72,400 | 5470 | 8690 | 5800 | 2682 | 3460 | 2653 | 1089 | 1422 | 1157 |
| 38 | 30 November 2022 11:24:31 | 70,900 | 5350 | 8500 | 5660 | 2639 | 3390 | 2590 | 1073 | 1394 | 1132 |
| 39 | 30 November 2022 11:25:01 | 68,400 | 5140 | 8180 | 5440 | 2556 | 3260 | 2481 | 1036 | 1341 | 1083 |
| 40 | 30 November 2022 11:25:31 | 60,300 | 4520 | 7170 | 4750 | 2264 | 2860 | 2173 | 922 | 1184 | 953 |
| 41 | 30 November 2022 11:26:01 | 59,700 | 4480 | 7150 | 4730 | 2258 | 2840 | 2174 | 924 | 1188 | 957 |
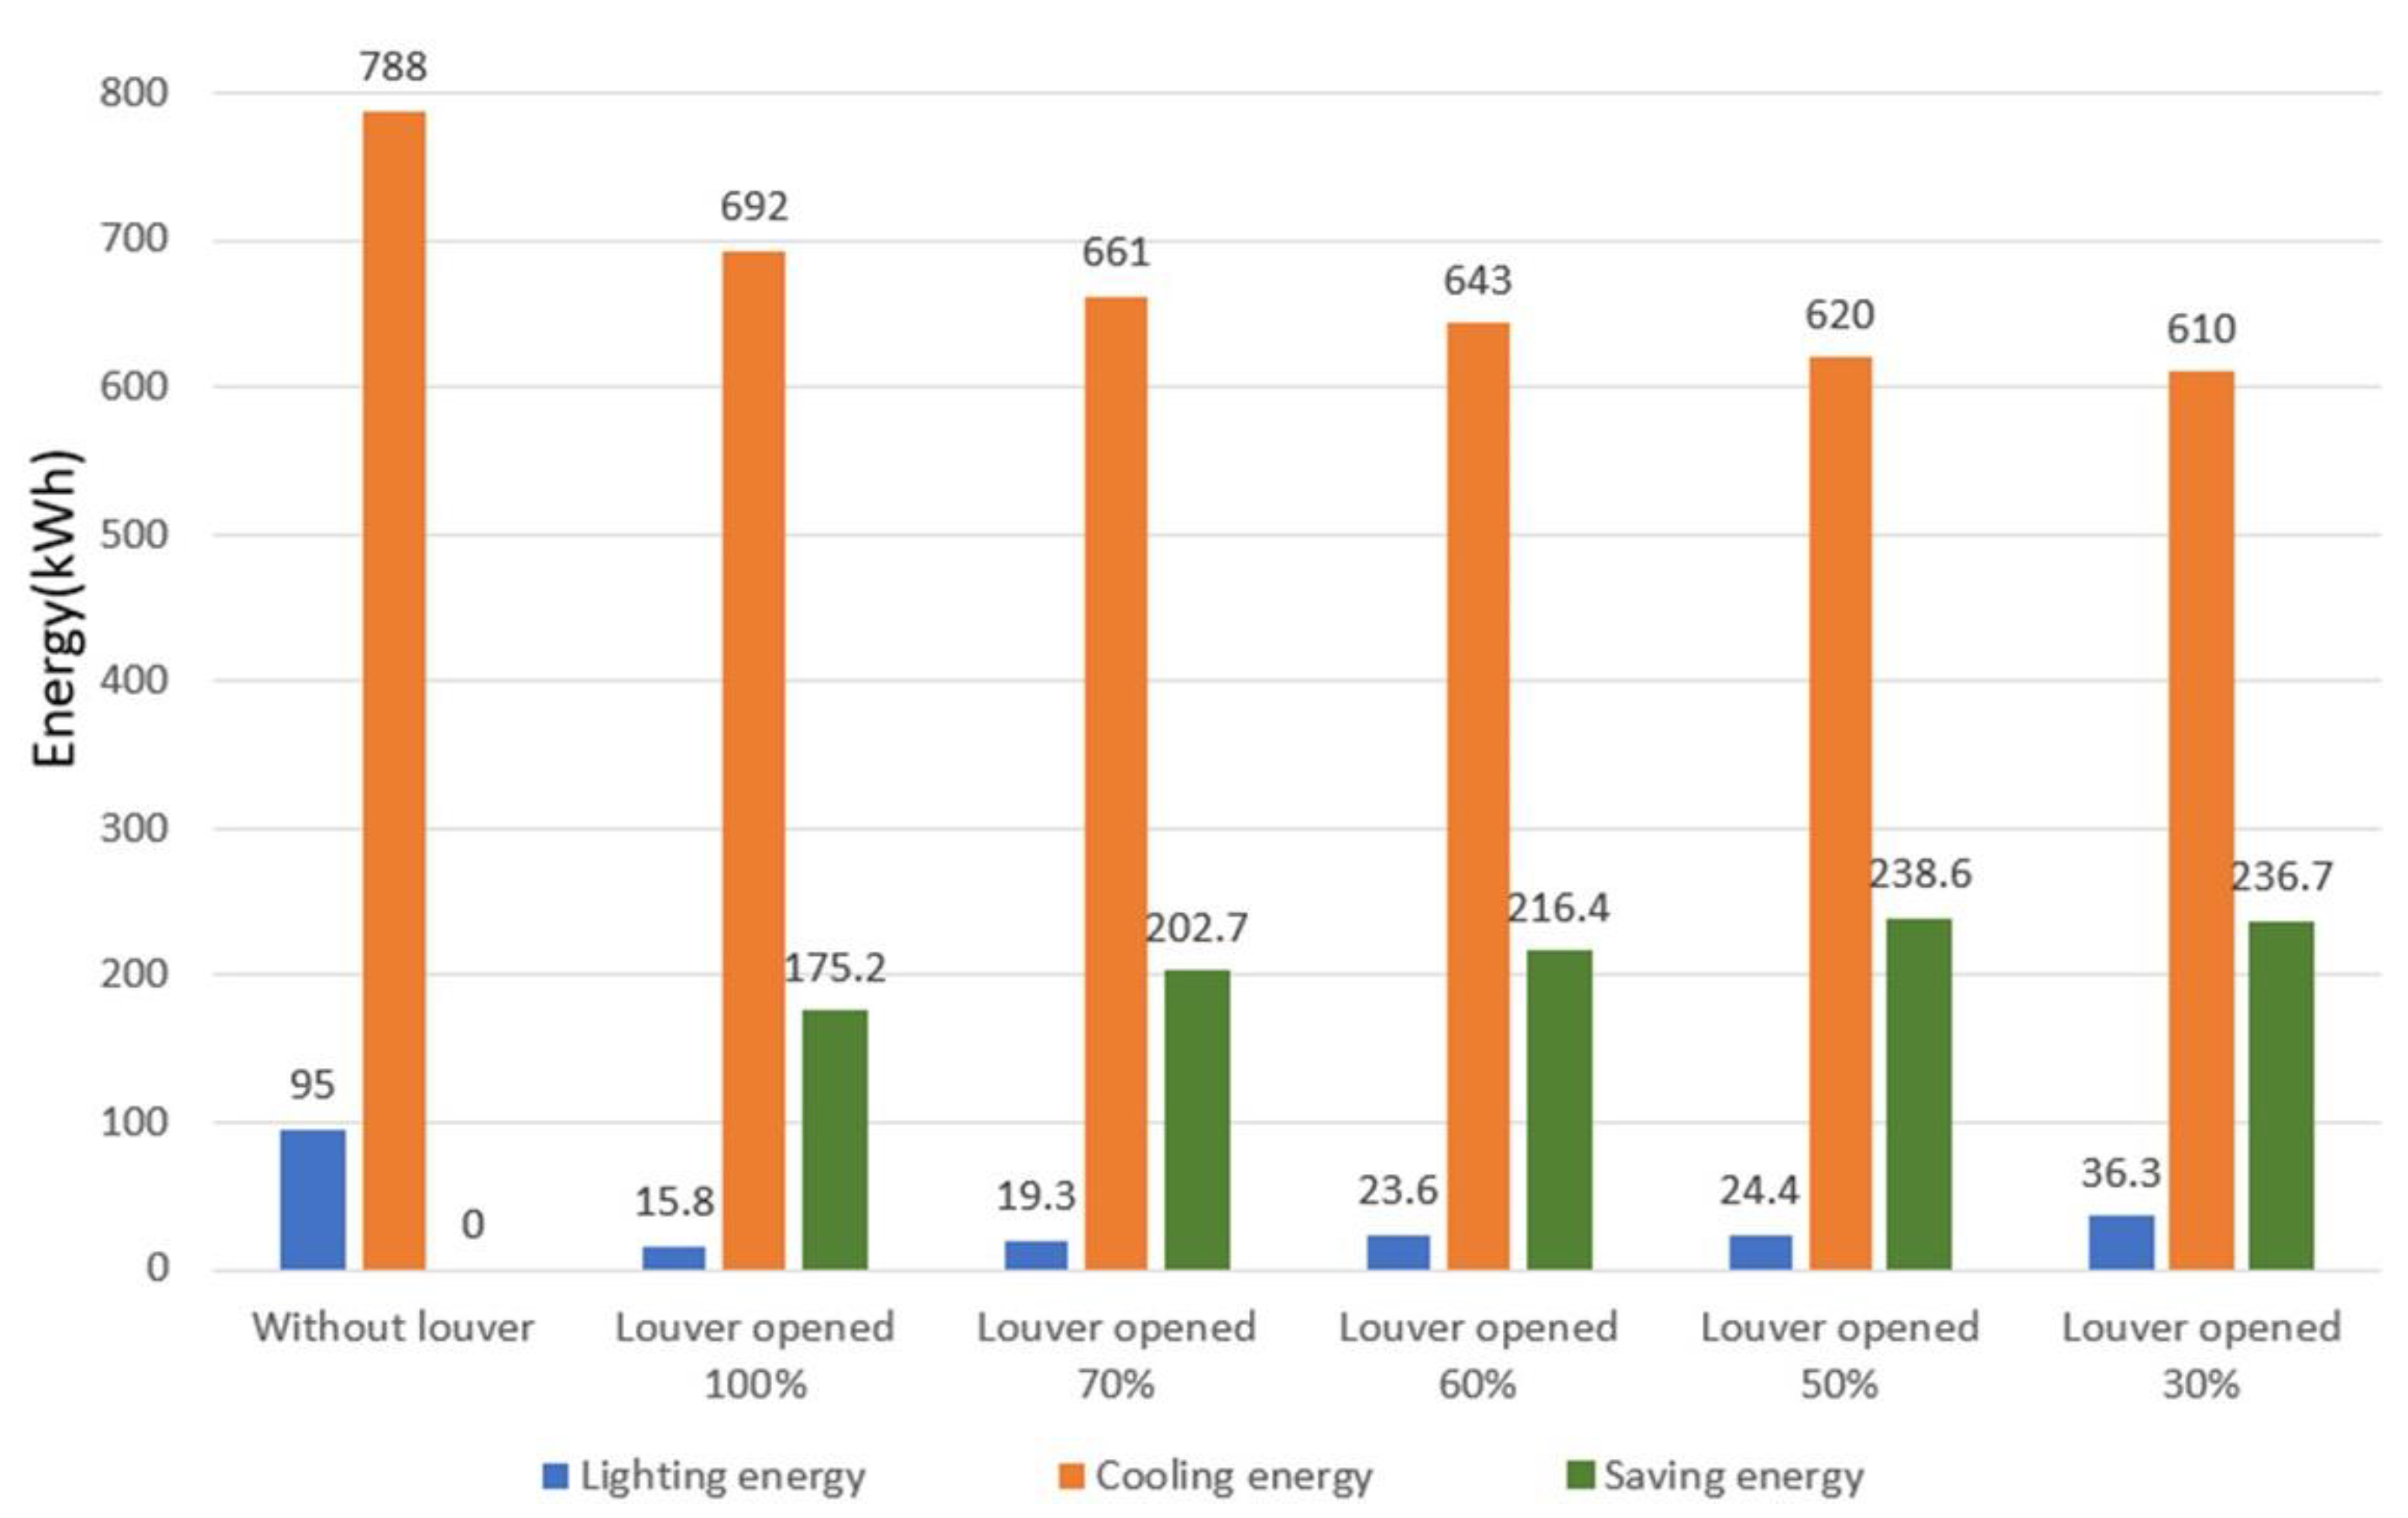
| Energy Requirement | Louver Opened 100% | Louver Opened 70% | Louver Opened 60% | Louver Opened 50% | Louver Opened 30% | |
|---|---|---|---|---|---|---|
| Lighting energy during a Year (kWh) | 95 | 15.8 | 19.3 | 23.6 | 24.4 | 36.3 |
| Energy saving (kWh) | 0 | 79.2 | 75.7 | 71.4 | 70.6 | 58.7 |
| Savings rate (%) | 0 | 83.3% | 79.7% | 75.2% | 74.3% | 61.8% |
| Without Louver | Louver Opened 100% | Louver Opened 70% | Louver Opened 60% | Louver Opened 50% | Louver Opened 30% | |
|---|---|---|---|---|---|---|
| Cooling energy during a year (kWh) | 788 | 692 | 661 | 643 | 620 | 610 |
| Energy saving (kWh) | 0 | 96 | 127 | 145 | 168 | 178 |
| Savings rate (%) | 0 | 12.2% | 16.1% | 18.4% | 21.3% | 22.5% |
Disclaimer/Publisher’s Note: The statements, opinions and data contained in all publications are solely those of the individual author(s) and contributor(s) and not of MDPI and/or the editor(s). MDPI and/or the editor(s) disclaim responsibility for any injury to people or property resulting from any ideas, methods, instructions or products referred to in the content. |
© 2024 by the authors. Licensee MDPI, Basel, Switzerland. This article is an open access article distributed under the terms and conditions of the Creative Commons Attribution (CC BY) license (https://creativecommons.org/licenses/by/4.0/).
Share and Cite
Kieu, N.-M.; Ullah, I.; Park, J.; Bae, H.; Cho, M.; Lee, K.; Shin, S. The Energy Saving Potential in an Office Building Using Louvers in Mid-Latitude Climate Conditions. Buildings 2024, 14, 512. https://doi.org/10.3390/buildings14020512
Kieu N-M, Ullah I, Park J, Bae H, Cho M, Lee K, Shin S. The Energy Saving Potential in an Office Building Using Louvers in Mid-Latitude Climate Conditions. Buildings. 2024; 14(2):512. https://doi.org/10.3390/buildings14020512
Chicago/Turabian StyleKieu, Ngoc-Minh, Irfan Ullah, Jongbin Park, Hojune Bae, Meeryoung Cho, Keonwoo Lee, and Seoyong Shin. 2024. "The Energy Saving Potential in an Office Building Using Louvers in Mid-Latitude Climate Conditions" Buildings 14, no. 2: 512. https://doi.org/10.3390/buildings14020512
APA StyleKieu, N.-M., Ullah, I., Park, J., Bae, H., Cho, M., Lee, K., & Shin, S. (2024). The Energy Saving Potential in an Office Building Using Louvers in Mid-Latitude Climate Conditions. Buildings, 14(2), 512. https://doi.org/10.3390/buildings14020512