Article

Non-Destructive Evaluation of Material Stiffness beneath Pile Foundations Tip Using Harmonic Wavelet Transform

1
Department of Civil Engineering, Chungnam National University, Daejeon 34134, Republic of Korea
2
Korea Railroad, Daejeon 34618, Republic of Korea
*
Author to whom correspondence should be addressed.
Buildings 2024, 14(2), 511; https://doi.org/10.3390/buildings14020511
Submission received: 3 January 2024 / Revised: 7 February 2024 / Accepted: 9 February 2024 / Published: 13 February 2024
(This article belongs to the Special Issue Advances in Foundation Engineering for Building Structures)

Abstract

:
Pile foundations are used to support superstructures and play an important role in the safety of these structures. The performance of pile foundations generally depends on the conditions of the pile itself and the material under the pile tip(i.e., bottom), especially for end-bearing piles installed in soft soil volumes. Therefore, to assess the performance of existing pile foundations, it is crucial not only to evaluate the structural integrity of the pile itself, but also to assess the ground conditions, such as subsoil stiffness beneath the pile foundation tip. Accessing the subsoil beneath the pile foundation tip is highly challenging in the field. Hence, there is a need for the development of non-destructive pile evaluation methods that allow the assessment of subsoil stiffness beneath the pile tip without direct access to the subsoil. Various non-destructive methods have been developed for pile performance assessment. However, these conventional non-destructive methods are primarily designed for assessing the structural integrity of the pile itself, and there are no existing non-destructive pile integrity testing methods applicable to evaluate the subsoil stiffness beneath the pile tip. In this study, a non-destructive method is developed to evaluate the subsurface soil stiffness beneath pile tip without direct access. The proposed method involves applying impact loading to the easily accessible pile head and measuring the elastic waves propagated within the pile foundation due to the impact loading. These wave signals are then recorded at the pile head. The measured time–history signals are decomposed using harmonic wavelet transform. This allows the obtainment of well-defined magnitude and phase information over time for various individual frequency components composing the wave. In this study, a method is proposed to assess the stiffness of the subsoil beneath the pile tip by simultaneously utilizing the magnitude and phase information of the measured signals obtained through harmonic wavelet transform. To facilitate this, a step-by-step data analysis procedure for evaluating the subsoil stiffness beneath the pile tip is introduced. To validate the proposed method, numerical simulations were conducted using ABAQUS. The experimental data obtained from the numerical simulations were processed using the proposed method to assess the subsoil stiffness beneath the pile. The determined subsoil stiffness was then compared with the exact soil stiffness used in the numerical simulation to evaluate the validity of the proposed method. Through this analysis, the proposed method demonstrated its effectiveness in assessing the subsoil stiffness beneath piles tip installed in weak soil volume.

1. Introduction

Pile foundations are utilized to support superstructures. Typically installed in soft or weak soil layers, the bottom end of the pile rests on stiffer soil or rock at a certain depth beyond the soft layer (Figure 1). The bearing capacity of pile foundations depends on both the stiffness of the pile itself and the stiffness of the material (soil or rock) beneath the pile bottom (i.e., pile tip), especially for end-bearing piles in soft soil volumes [1]. Even with an intact pile, poor soil or rock conditions beneath the pile can lead to significant settlement of a superstructure or failure in the supporting superstructure. Therefore, it is necessary to evaluate the conditions not only of the pile but also of the soil or rock beneath the pile tip to determine the soundness of the pile foundation system.
Various non-destructive methods have been developed to assess pile soundness. Non-destructive testing for pile foundations can be broadly classified into two categories. The first is the borehole method. The second method involves applying low-strain impact to the pile head, generating elastic waves that propagate within the pile. The signals produced when these elastic waves are reflected at the boundary interface within the pile foundation are then utilized.
Borehole testing methods include CSL (Cross-hole Logging) and PS (Parallel Seismic) methods. Non-destructive testing methods using reflected elastic waves include the SE (sonic echo) method for analyzing reflected waves in the time domain and IE (impact echo)/IR (impulse response) methods for frequency domain analysis [2]. Particularly, low-strain non-destructive pile integrity test methods using reflected elastic waves are characterized by their simplicity, rapid execution, and relatively low-cost nature. This allows for efficient testing on numerous piles and even facilitates integrity assessments on existing piles.
The CSL method is employed for assessing the strength and defects (size and location) of piles [3,4], while the PS method is applied for evaluating the length of piles and internal features such as voids, necking, and bulge parts within the piles [5]. In contrast to the CSL or PS methods that utilize elastic waves, the Thermal Integrity Profiling (TIP) method, which employs heat, has been applied to cast-in-place piles [6,7]. This method is utilized for detecting the size and location of defects (voids) or assessing changes in material properties over time [8].
Non-destructive pile integrity testing methods using reflected waves are employed primarily for estimating pile length. However, recent research has focused extensively on evaluating the size and location of pile defects (neck defects, bulge parts). Studies utilizing the impact echo method have investigated the assessment of internal defects within the pile [9,10,11], as well as the evaluation of the pile’s length [12]. In the case of the sonic echo technique, research has been conducted on estimating the pile length [13,14,15] and assessing defects in the pile (size and location) [10,16]. Additionally, there are methods such as ultra-sonic echo for evaluating cavities within the pile using ultrasound as the input wave [11,17]. Impulse response techniques have been applied to research on evaluating pile length [13,15,18,19], as well as assessing the size and location of defects in the pile [20,21].
Furthermore, research is being conducted using non-destructive testing methods such as Ground-Penetrating Radar (GPR) to detect cracks in piles [22] and to identify necking defects using electromagnetic waves [23]. While conventional non-destructive pile integrity testing methods primarily involve data analysis in the time or frequency domain, additional studies have attempted to evaluate pile integrity through the time–frequency analysis of measurement data [10,24,25,26,27,28].
These conventional non-destructive testing methods have primarily been developed for the structural integrity assessment of pile foundations, rather than evaluating the subsoil properties beneath the pile foundation, which can significantly influence the performance of the pile foundation system from a geotechnical perspective.
The pile-driving analysis (PDA) method [29,30] is a high-strain non-destructive test, utilizing a relatively higher energy source compared to conventional low-strain elastic wave non-destructive tests, as mentioned above. The PDA method does not evaluate the current stiffness of the subsoil beneath the pile foundation, but rather assesses the soil’s bearing capacity at the ultimate limit state. Particularly during restrike tests or the assessment of the ultimate bearing capacity of the subsoil beneath existing piles tip, the PDA method requires using a higher energy source than the initial test (EOID) to obtain reliable results [31,32].
In evaluating the performance of existing foundations, the structural integrity of the foundation itself and the ultimate bearing capacity of the soil surrounding pile foundations are crucial factors. Additionally, from a geotechnical perspective, the current stiffness state of the subsoil beneath the foundation is also an important consideration [1,33]. In the previously mentioned various conventional non-destructive pile integrity test methods, it is not possible to assess the stiffness of the subsoil beneath existing pile foundations.
In this study, a non-destructive method is proposed to evaluate the stiffness of the subsurface soil or rock layers beneath existing pile foundations tip, which are generally inaccessible. The proposed method employs a simple non-destructive test configuration similar to conventional low-strain non-destructive pile integrity testing methods such as SE or IE. Additionally, it introduces a novel data analysis method based on harmonic wavelet transform [34,35] for assessing the stiffness of the subsoil beneath the pile foundation tip.
To achieve this, Section 2 describes the propagation characteristics of elastic waves within the pile and at the pile bottom interface from a signal perspective. In Section 3, an explanation is provided for the harmonic wavelet transform utilized in this study, along with a step-by-step data analysis procedure for assessing the subsoil stiffness beneath the pile foundation tip. Section 4 applies the proposed method to numerical simulation experiments, evaluating the feasibility of the proposed method. Through numerical simulation, the proposed method demonstrates its capability to assess the subsoil stiffness beneath the pile tip.

2. Characteristics of Wave Propagation in the Pile

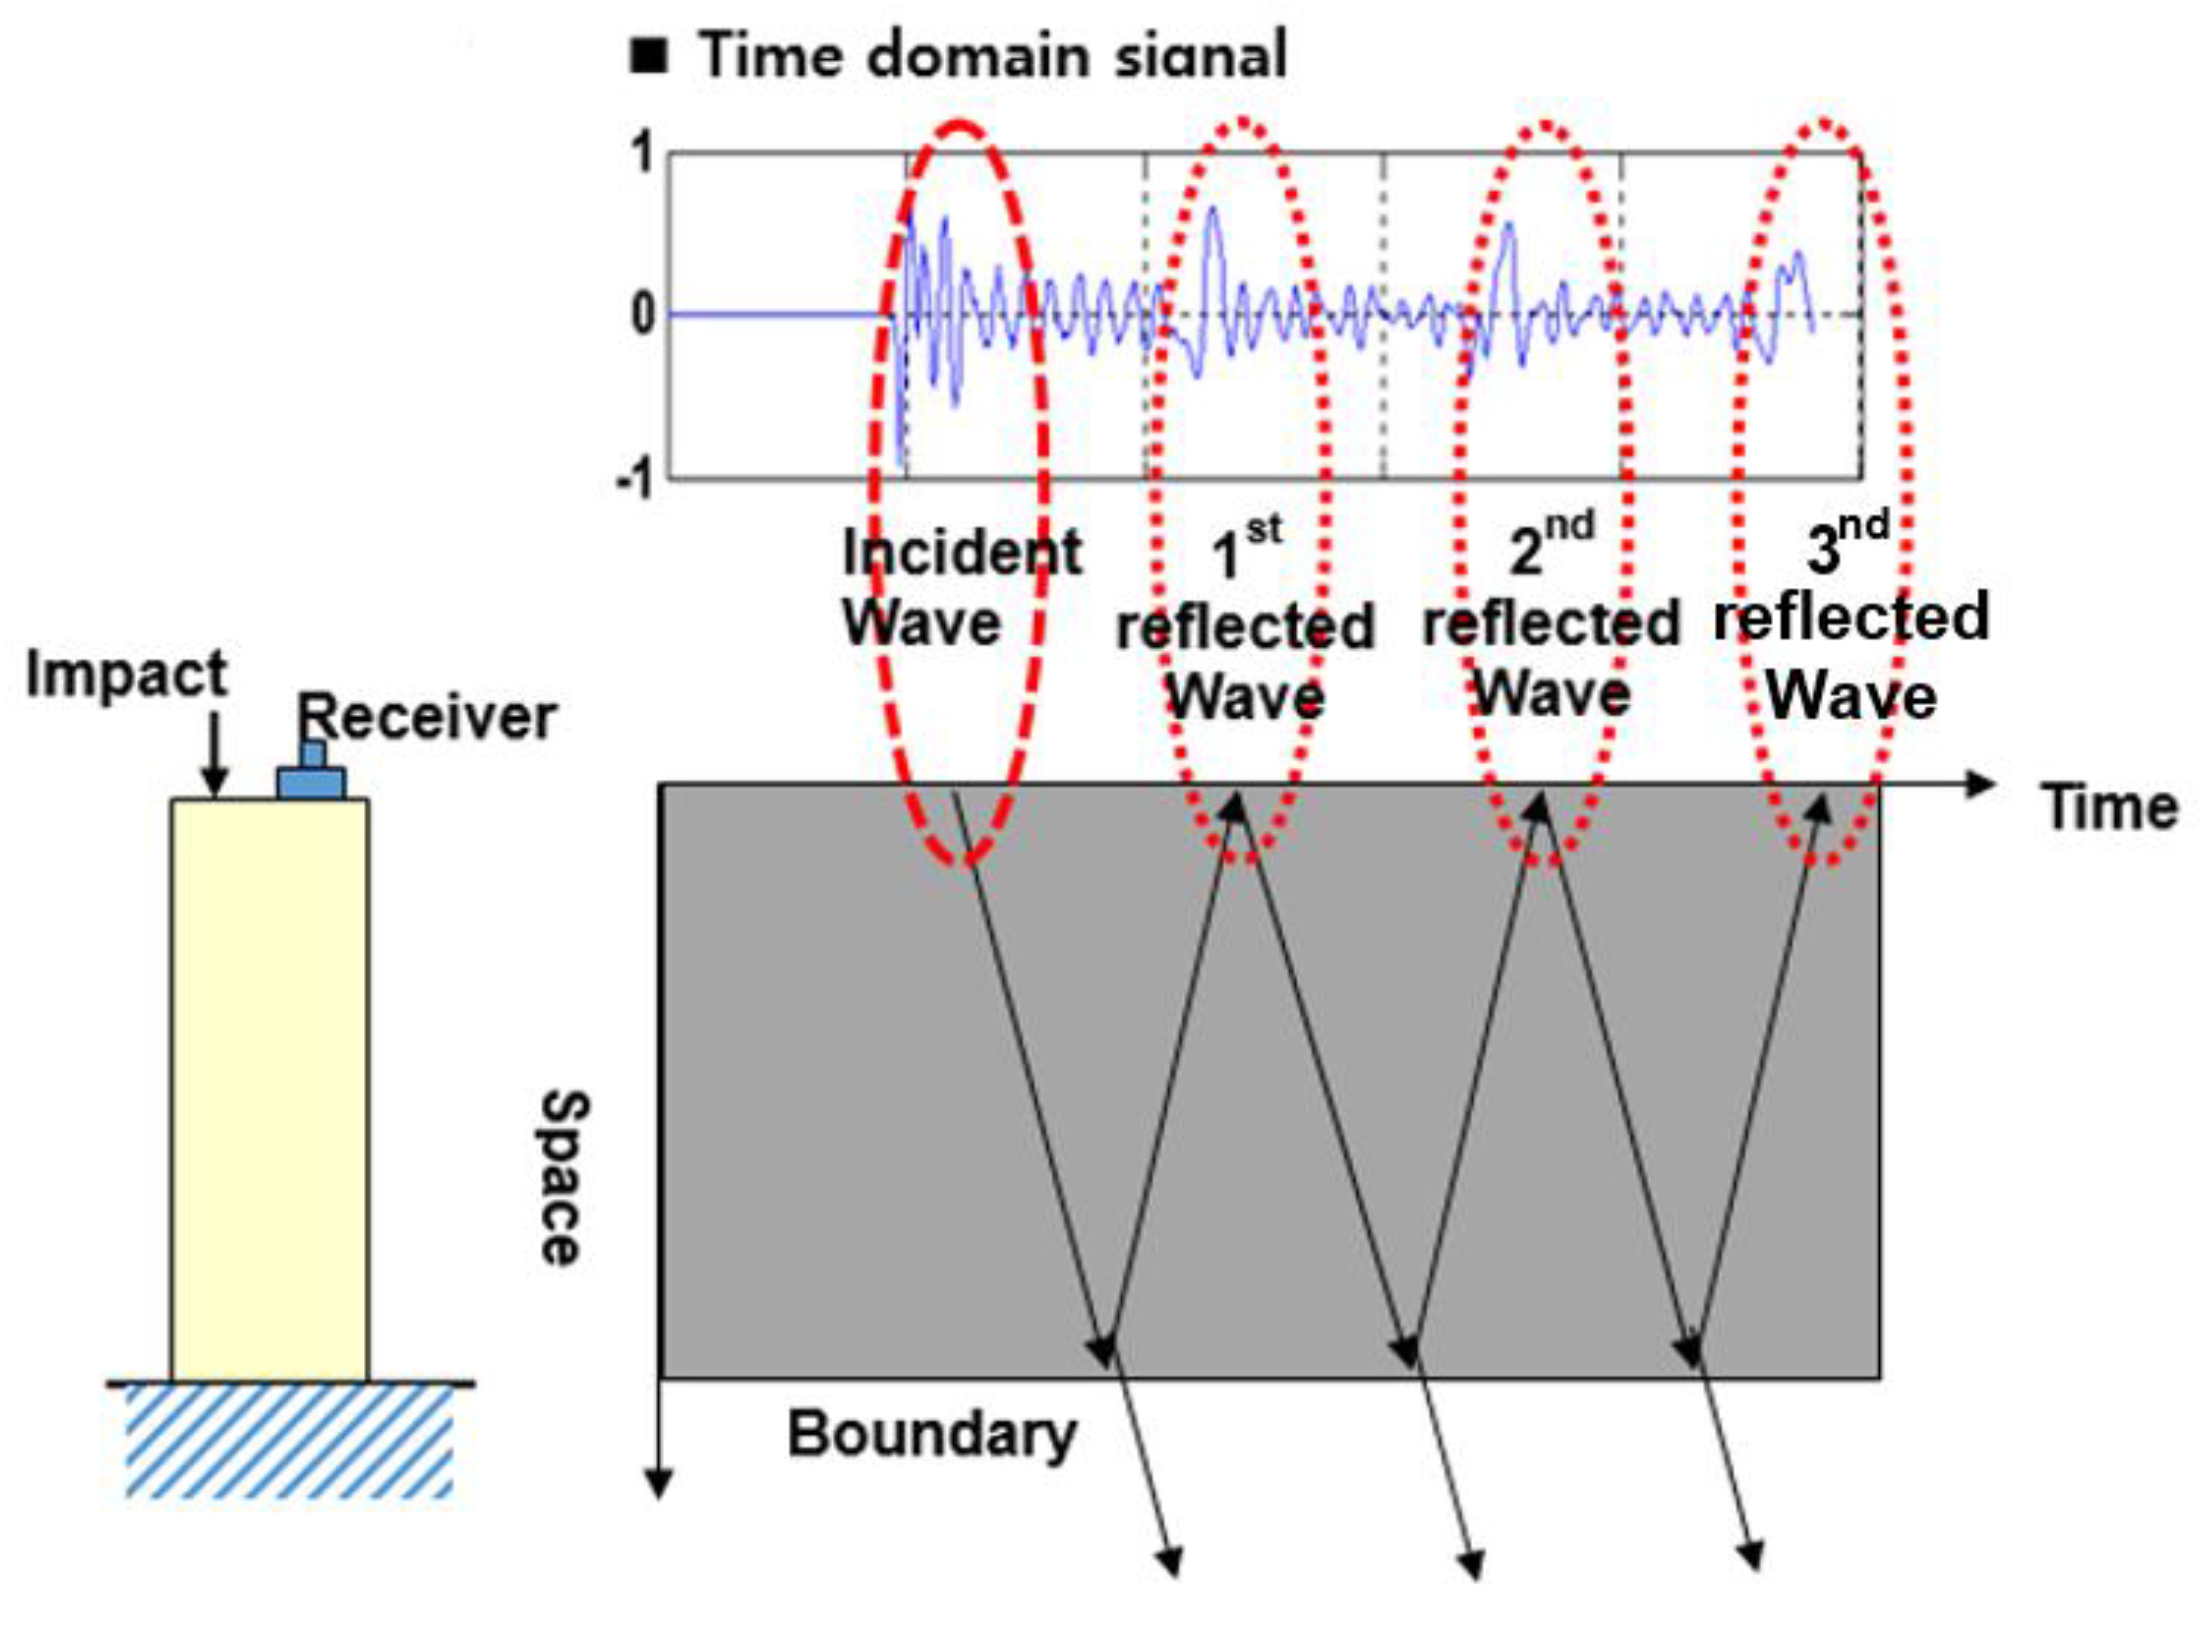
Piles are installed in the soil with the pile head being the only accessible point for non-destructive tests. A vertical impact on the pile head primarily generates a P-wave that propagates along the pile and is then reflected at the bottom of the pile. A traveling P-wave in the pile forms a guided wave showing a dispersive characteristic [21,26]. The measured signal on the pile head consists of the incident wave and a series of reflected waves, as shown in Figure 2.
The energy of the traveling wave within the pile can dissipate either through the pile bottom (i.e., pile tip), through the pile sides in the form of a transmitted wave, or via the damping effect of the concrete itself. Generally, the material damping ratio of concrete is relatively small, approximately around 0.5% [36]. In a pile surrounded by soft soil, energy transmission into the surrounding soil through the sides of the pile is assumed to be relatively small. This is attributed to the diminished energy transmission to the laterally surrounding soft soil, resulting from the large stiffness contrast between the pile and the soft surrounding soil [37].
Furthermore, the primary direction of particle motion of the P-wave is parallel to the pile’s length axis. Consequently, the energy dissipation of the traveling P-wave in a pile laterally surrounded by soft soil is assumed to depend mainly on the boundary condition at the pile bottom. If the soil or rock under the pile bottom is as soft as the surrounding soil, then the P-wave’s energy is largely trapped in the pile shaft. As the subsoil (or rock) stiffness of the pile foundation approaches the stiffness of the pile itself, the dissipation of energy in the form of transmitted waves through the pile bottom increases.
The boundary condition at the bottom of the pile depends on the stiffness of the material (mainly soil or rock) under the pile bottom. The stiffness can be categorized into two types. The first type is one of a stiffer boundary where the material under the pile is stiffer than that of the pile. The second type is the inverse; the material under the pile bottom is softer than that of the pile.
When a wave meets the boundary, a part of the wave is transmitted across the boundary and the rest is reflected back towards the pile head, as mentioned previously. The measured wave signal at the pile head consists of several wave groups corresponding to incident and reflected waves and it shows the variation in magnitude and phase with respect to time. This is shown in Figure 2.
The energy (or magnitude) ratio between the incident and reflected waves depends on the wave velocity (i.e., stiffness) ratio between the pile and the material under the pile bottom and is given as follows [37]:
E r E i = R = V p , b o t t o m V p , p i l e V p , p i l e + V p , b o t t o m = V p , b o t t o m V p , p i l e 1 V p , b o t t o m V p , p i l e + 1
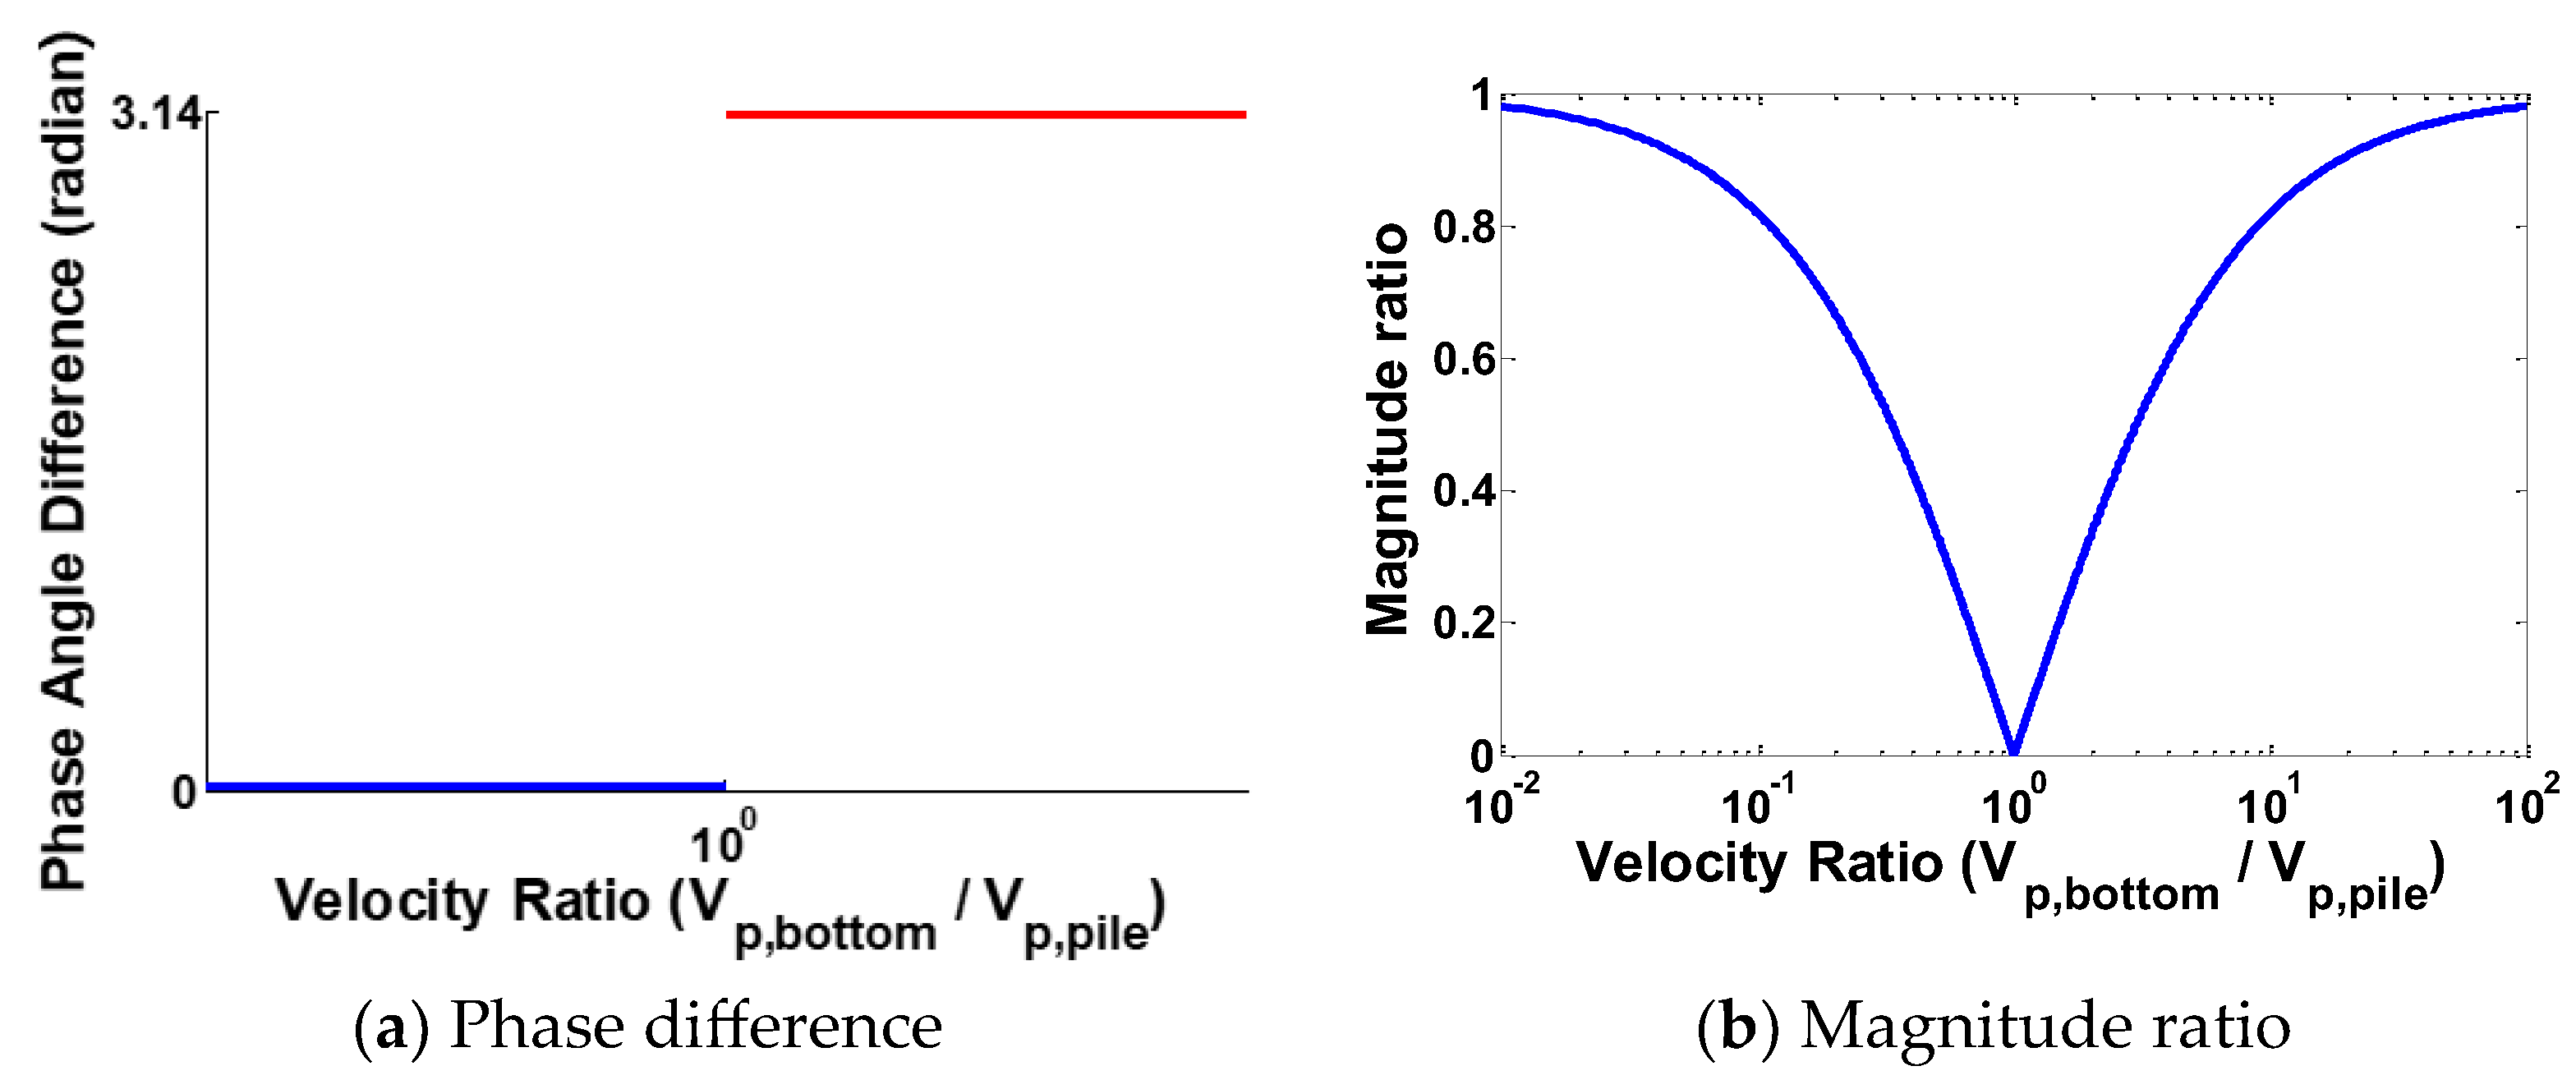
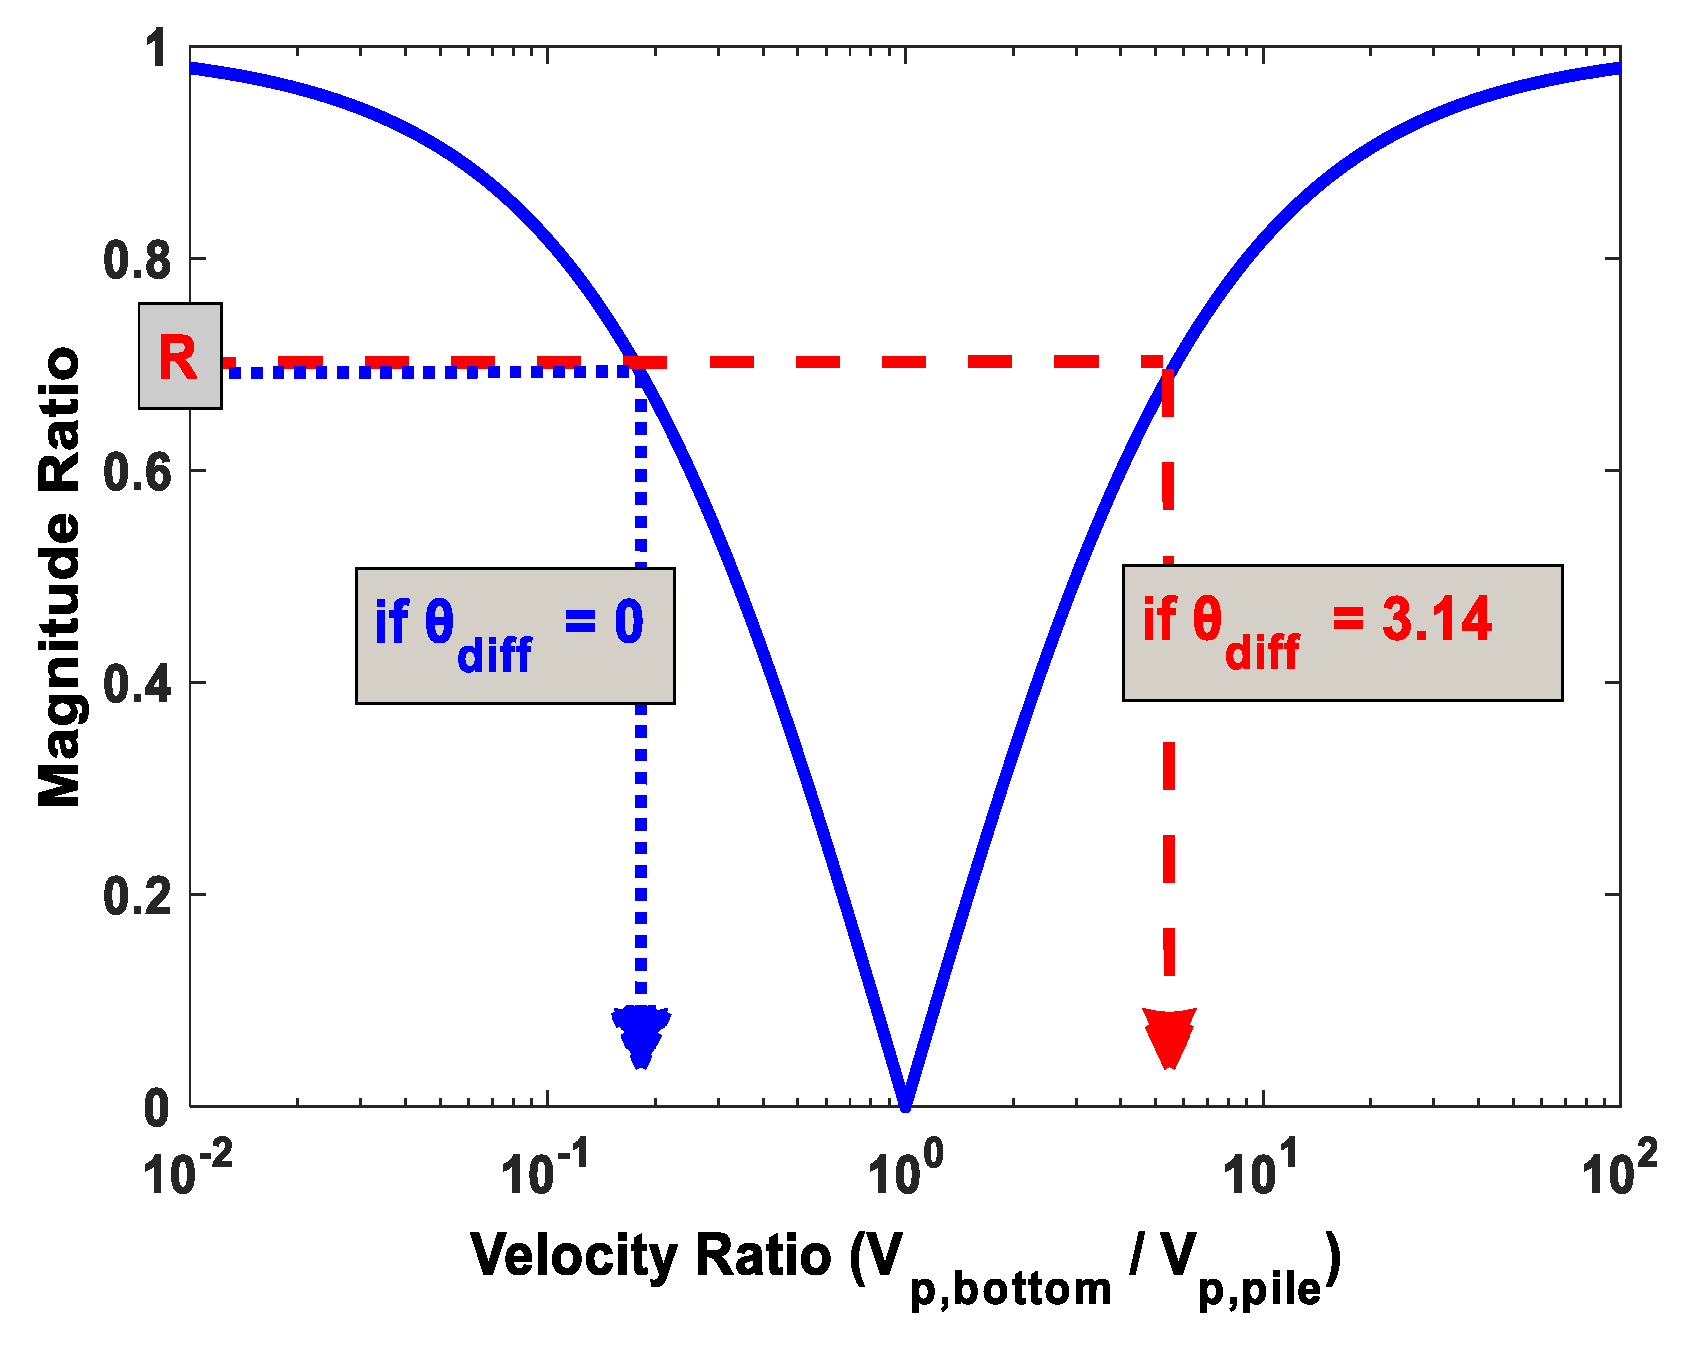
where Er and Ei are the energies (or magnitudes) of the reflected and incident waves, respectively. Vp,pile and Vp,bottom represent the phase velocities of the P-wave in the pile and the material under the pile bottom, respectively. R varies with the P-wave velocity ratio (Vp,bottom/Vp,pile) between the two materials, as shown in Figure 3b. In this figure, each magnitude ratio (Er/Ei) corresponds to two different velocity ratios at the same time. One is for the stiffer boundary range, and the other is for the softer boundary range. This means that it is impossible to determine the boundary condition under the pile from only the magnitude ratio.
Reflection also causes a phase change in the incident wave. The magnitude of the phase change between the incident and reflected waves depends on the boundary type. For the softer boundary type, the phase of the reflected wave is the same as that of the incident wave. For the stiffer boundary type, the two waves are 180 degrees out of phase. This is shown in Figure 3a [25]. In knowing this phase change, the stiffness of the material under the pile relative to the pile itself can be determined.
Therefore, if the magnitude ratio and the phase difference between the incident and reflected waves can be determined from the wave signal measured on the surface of the pile head (as shown in Figure 2), the pile bottom boundary condition (i.e., the stiffness of the material supporting the pile) can be found. To determine the magnitude and the phase of the incident and reflected waves, two criteria are required. The first is to identify the wave groups corresponding to the incident and reflected waves in the time domain signal. The second is to determine the instantaneous phase and magnitude corresponding to each wave group (or time variation in the magnitude and phase of the wave signal).
Generally, it is difficult to clearly define or evaluate the instantaneous magnitude and phase corresponding to each wave group in the time domain wave signal generated by the impact because the measured wave signal is a multi-component signal. It consists of various independent frequency components, each with its own magnitude and phase [38], and has dispersive characteristics that can cause distortions in the shape of the wave group over time in the time domain signal [39]. However, for the single-frequency component, the instantaneous magnitude and phase can be clearly defined [38,39]. The single-frequency component can be defined as an amplitude-modulated (AM) signal and is given as follows:
S f t = A t cos [ θ ( t ) ]
where Sf(t) is a single-frequency component (f Hz). A(t) and θ(t) are the magnitude and phase functions with respect to time, respectively. If A(t) and θ(t) can be determined from the measured wave signal for each frequency component, then the magnitude and phase corresponding to each wave group for the respective incident and reflected waves can be clearly defined. From this, the magnitude ratio and phase difference between the wave groups can be calculated. The harmonic wavelet transform can be used to determine A(t) and θ(t) for each frequency component of the measured signal.

3. Determination of Subsoil Stiffness Beneath a Pile Foundation Using Harmonic Wavelet Transform

3.1. Harmonic Wavelet Transform

Harmonic wavelet analysis is a fundamental correlation method. The harmonic wavelet coefficient (HWC), a m , n t , provides information concerning the structure of the signal through the evaluation of the similarity in the form between harmonic wavelets, w m , n t , and measured data, s(t), as follows:
a m , n t = s t w * t t d t
The harmonic wavelet is an orthogonal wavelet represented in the frequency and time domains, respectively, as follows [34,35]:
W m , n ω = 1 n m 2 π for m 2 π ω n 2 π = 0 elsewhere w m , n t = e j n 2 π t e j m 2 π t j n m 2 π t
where j = 1 . Each harmonic wavelet can be compared to an ideal bandpass filter as it has a constant real value inside the frequency band and a value of zero elsewhere. In the time domain, the harmonic wavelet has a localized harmonic characteristic.
According to the study of Park and Kim [40], the harmonic wavelet coefficient a m , n t , which is defined by w m , n t , can be represented as follows:
a m , n t = s f t + j π x x s f t t t d t = s f t + j H s f t = x t e j ϕ t
where s f t is the output signal of an ideal band-pass filtering operation having a bandwidth of m 2 π ω n 2 π , and f is the center frequency of the bandwidth. H represents the Hilbert transform and x t and ϕ t are the magnitude and phase of a m , n t , respectively. From Equation (5), it can be seen that the harmonic wavelet coefficient a m , n t is the analytic signal corresponding to s f t . The output signal of the bandpass filtering operation, s f t , is generally an amplitude-modulated signal, as shown in Equation (2). The analytic signal corresponding to s f t is obtained as follows:
a m , n t = s f t + j H s f t = A t cos θ t + j H A t cos θ t = A t cos θ t + j A t sin θ t       = A t e j θ t
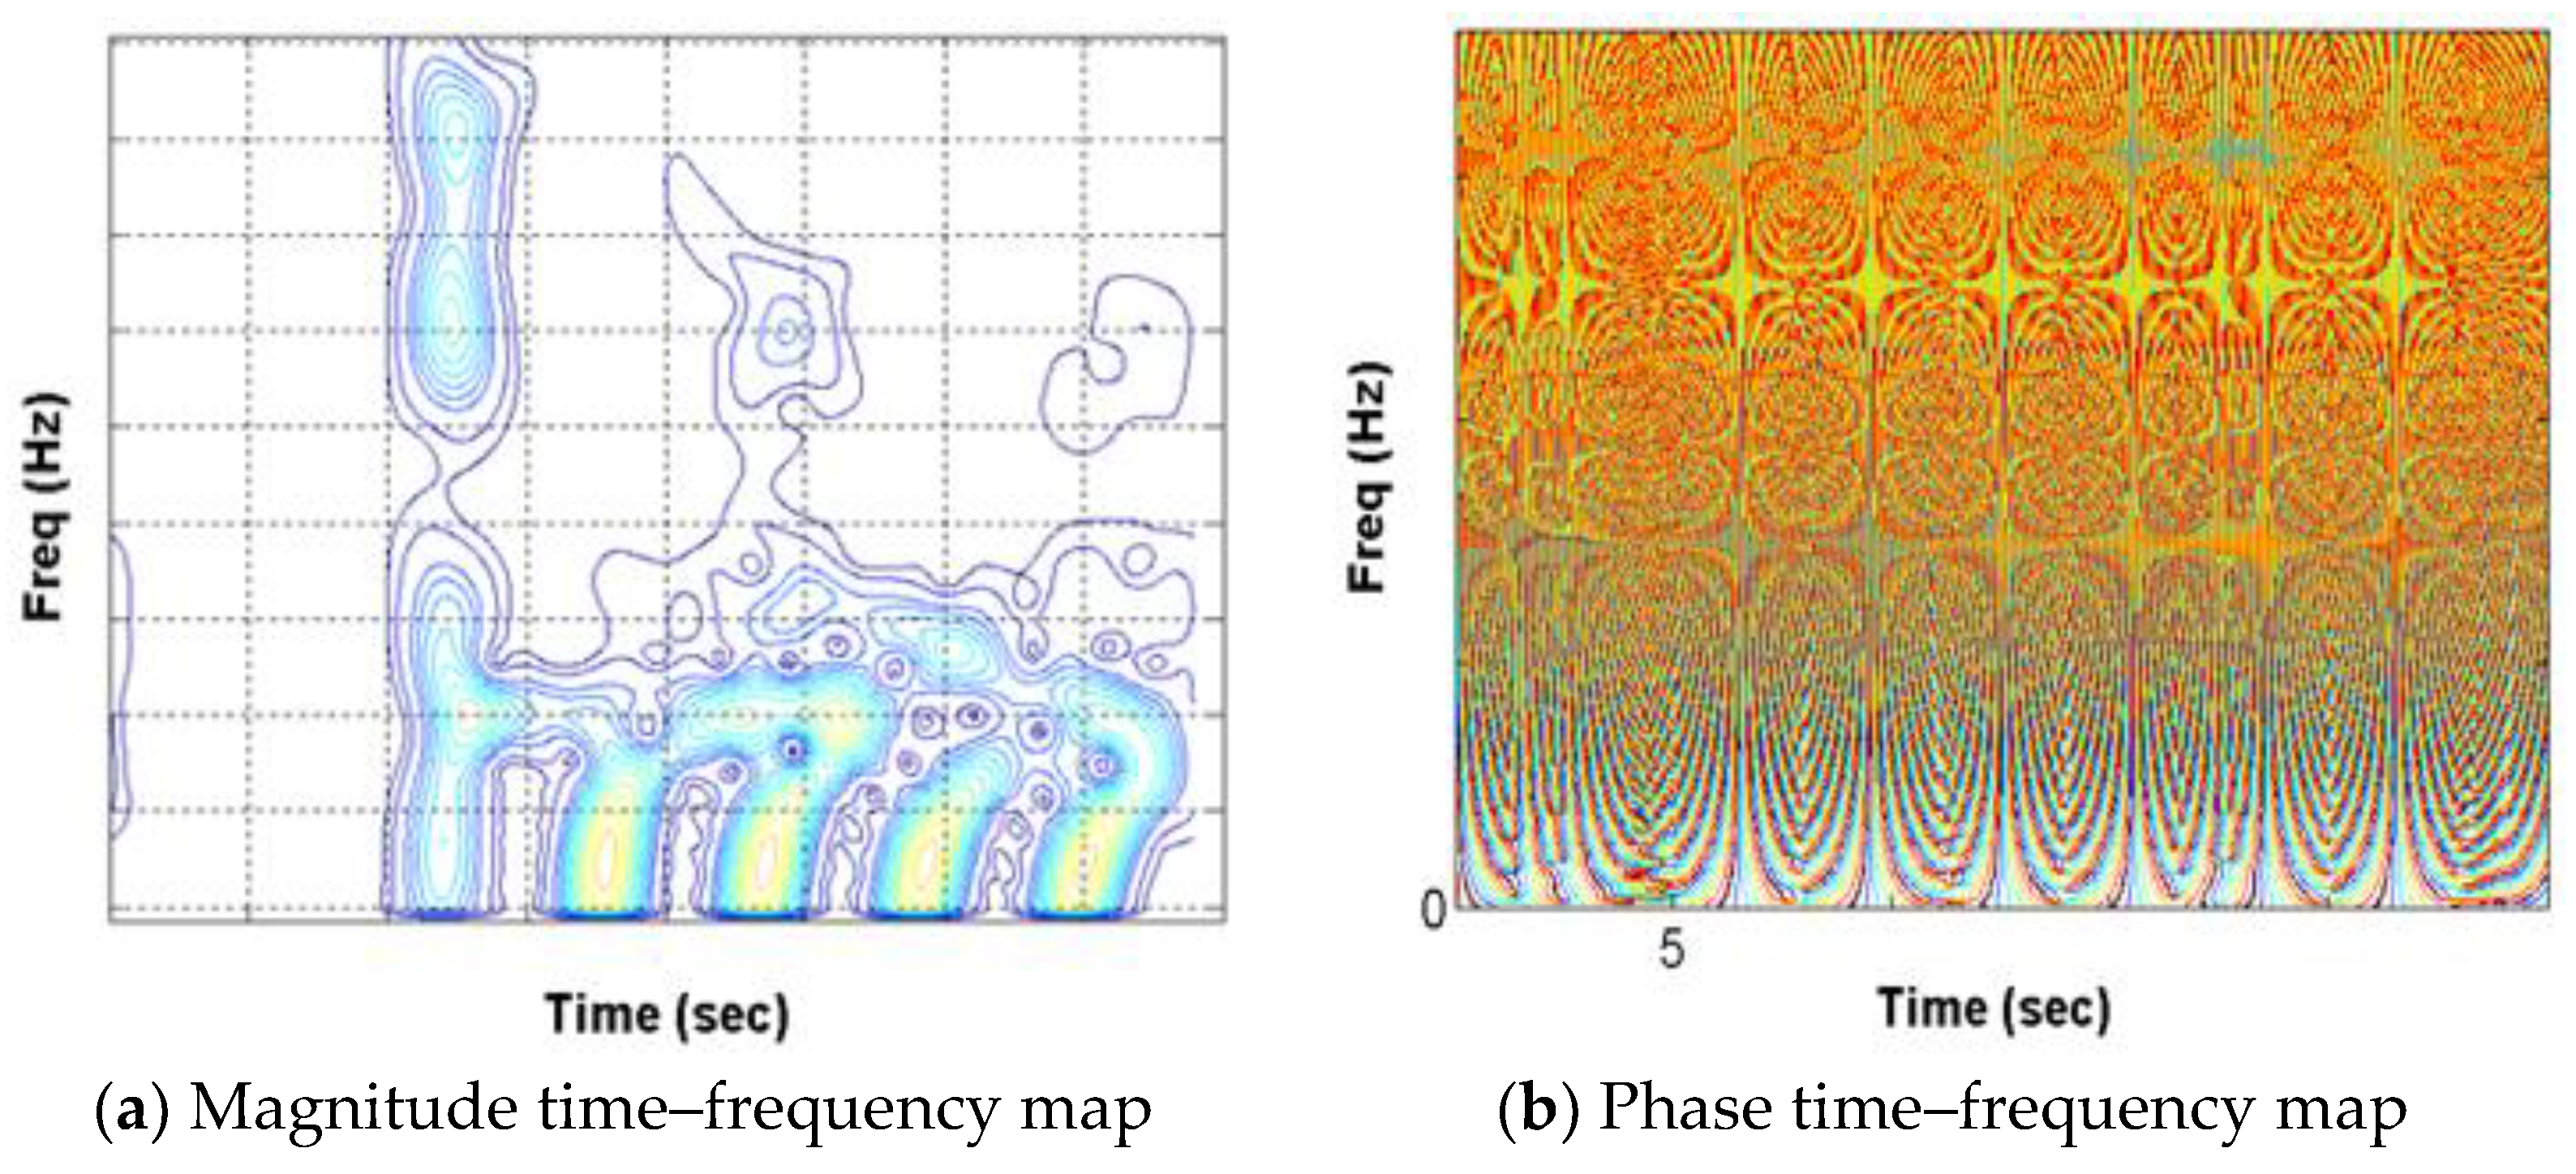
By comparing Equations (2) and (6), the magnitude and phase of a m , n t are shown to be representative of the magnitude and phase of a single-frequency amplitude-modulated (AM) signal s f t , as defined in Equation (2), versus time. Using the harmonic wavelet transform, the magnitude and phase time–frequency maps are determined and are shown in Figure 4. These time–frequency maps represent a time variation in the magnitude and phase angle for every frequency component with time. And, the magnitude and phase variations over time of a single-frequency signal component can be evaluated from these magnitude and phase time–frequency maps.
In this research, the harmonic wavelet transform is applied to decompose the wave signal measured on the pile head into single-frequency components in the time domain, as well as to define A(t) and θ(t) for each frequency component, which are used to determine the boundary condition under the pile bottom, as shown in Section 2.

3.2. Determination of Subsoil Stiffness Beneath a Pile Foundation

A step-by-step procedure for determining the wave velocity (i.e., stiffness) of the material under the pile bottom using harmonic wavelet transform is proposed and is given as follows:
  • Apply the impact force on the surface of the pile head and measure the wave signal in the time domain (Figure 2).
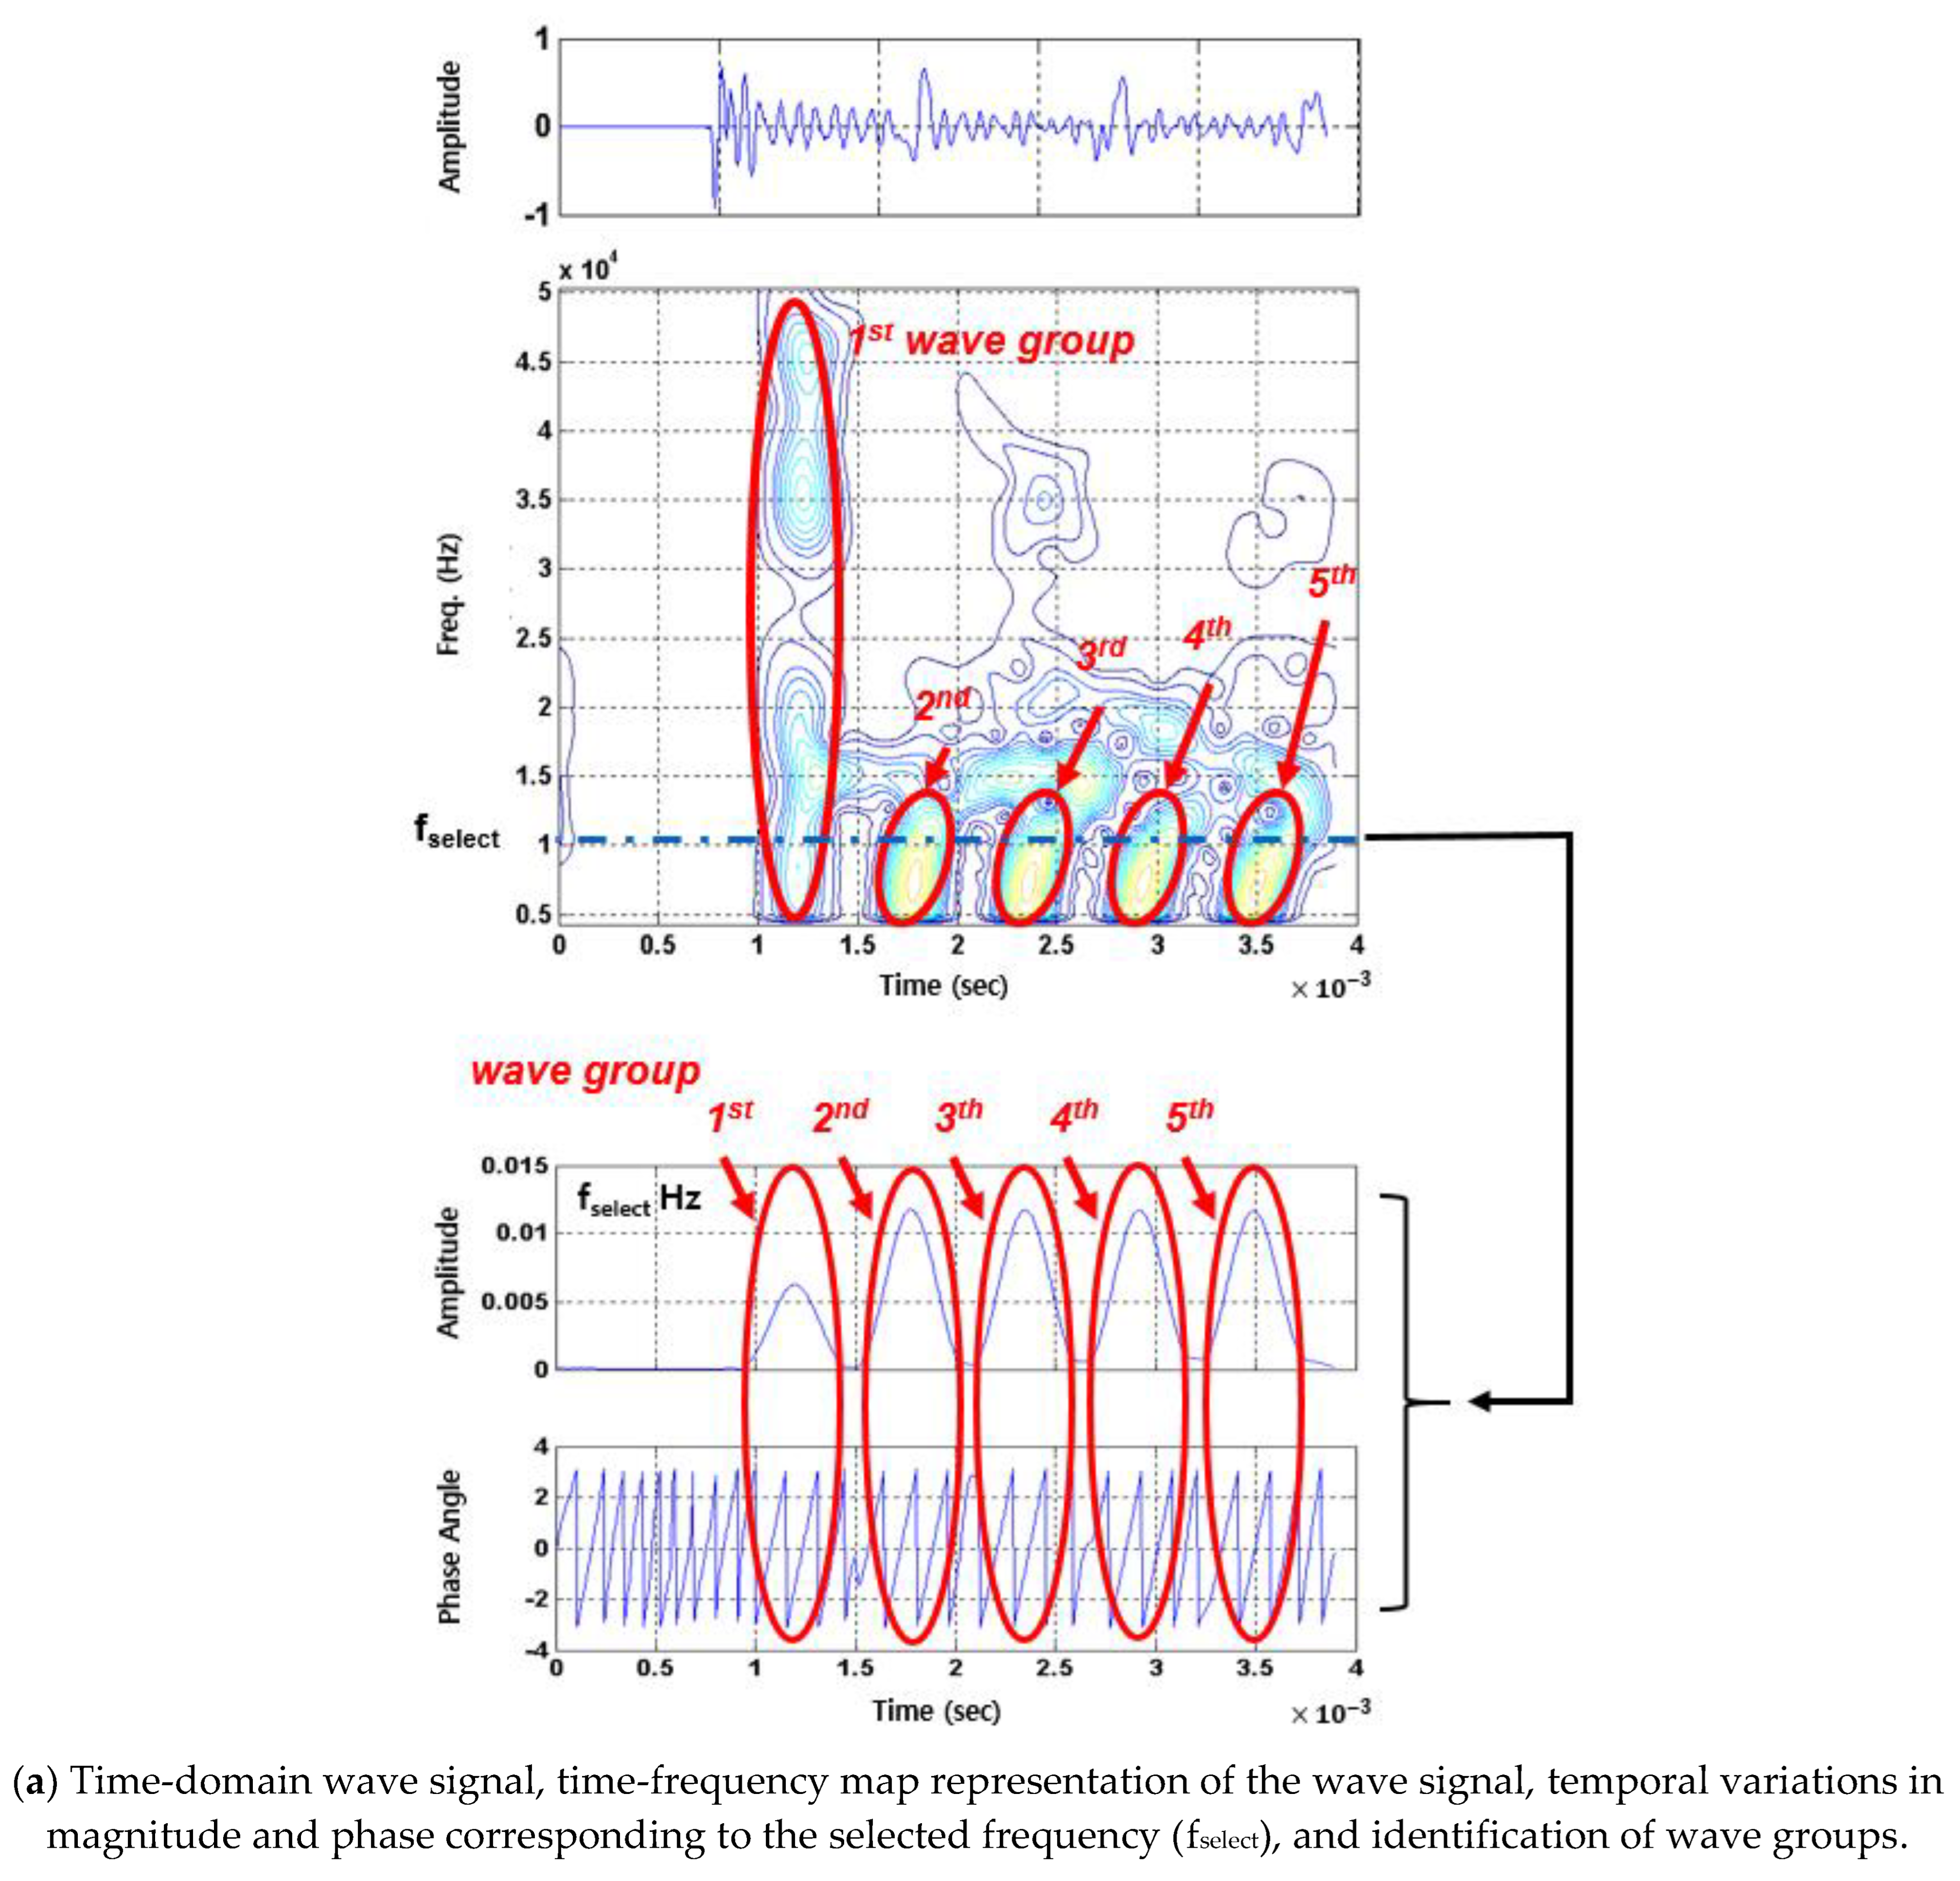
  • Compute the harmonic wavelet transform of the wave signal to identify the wave groups (Figure 5a). Each wave group corresponds to local maxima in the time–frequency (T-F) magnitude map (indicated by red circles in Figure 5a). The first wave group represents the incident wave; subsequent wave groups correspond to the reflected waves (Figure 5a).
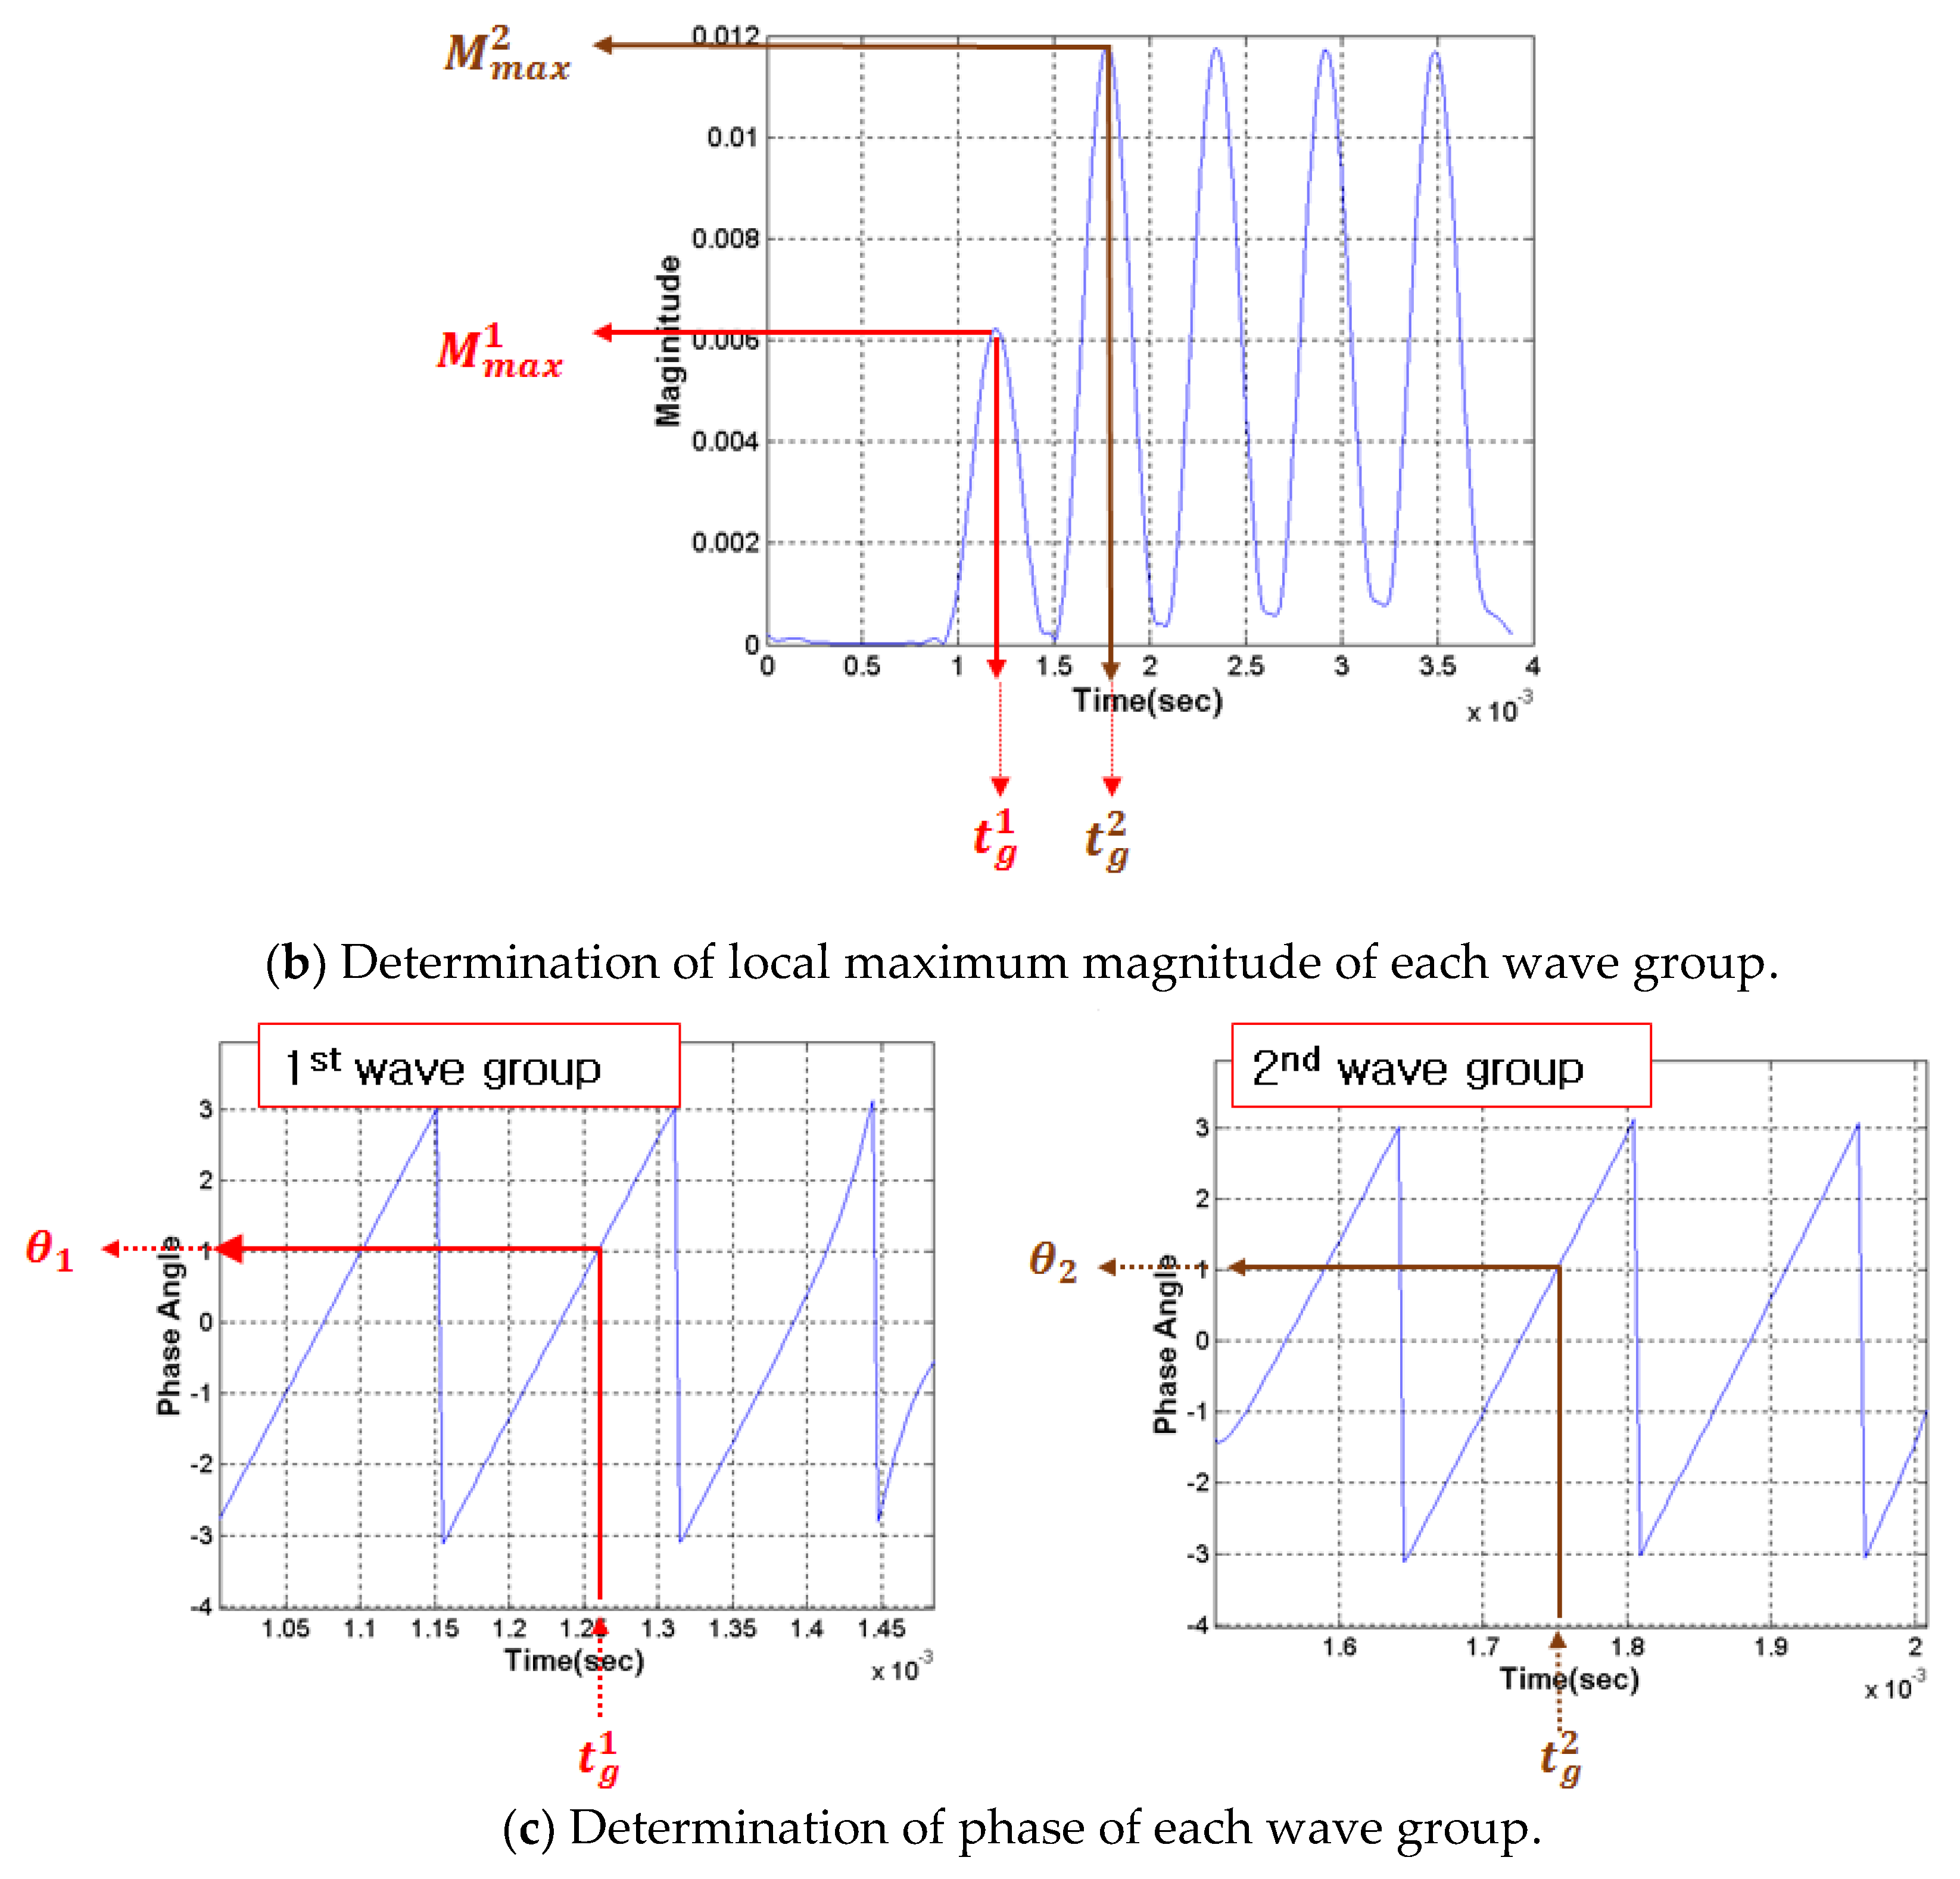
  • Select a certain frequency, fselect, within the frequency range where the second wave group exhibits sufficient magnitude. Determine tg1, tg2, tg3, etc., based on the magnitude of the harmonic wavelet coefficient corresponding to fselect Hz. Here, the magnitude and phase of the harmonic wavelet coefficient corresponding to fselect Hz represent the magnitude and phase of the single-frequency component, fselect Hz, of the wave propagating inside the pile. The time points, tg, correspond to local maximum magnitudes for each wave group (Figure 5b).
  • Determine the local maximum magnitude corresponding to each wave group. M1max, M2max, M3max, … are local maximum magnitudes measured at tg1, tg2, tg3, … corresponding to wave groups 1, 2, 3, … (Figure 5b).
  • Evaluate the magnitude ratio between the first (incident) and second (the first reflected) wave groups as follows:
Magnitude   Ratio :   R = 1 2 M m a x 2 M m a x 1
Since the pile head represents a free boundary condition, the magnitude of the reflected wave in the measured signal is amplified twice as much as that of the reflected wave coming from the reflected boundary (pile bottom). Therefore, half of the magnitude of the reflected wave is used to determine the magnitude ratio between the incident and first reflected wave. The magnitude ratio can also be determined from only the reflected wave groups as follows:
Magnitude   Ratio   R = M m a x 3 M m a x 2 = M m a x 4 M m a x 3
6.
Determine the phases θ1, θ2, θ3, … from the phase of the harmonic wavelet coefficient corresponding to fselect. These phases correspond to tg1, tg2, tg3, … (Figure 5c). Evaluate the phase difference θdiff between the consecutive wave groups.
θ d i f f = θ 1 θ 2
7.
Determine the velocity ratio ( V p , b o t t o m V p , p i l e ) using the magnitude ratio from Step (5) and phase difference from Step (6), as shown in Figure 6.
8.
Evaluate the wave velocity (i.e., stiffness) of the material under the pile bottom as follows:
V p , b o t t o m = ( V p , b o t t o m V p , p i l e ) f r o m   S t e p   7 × V p , p i l e
The magnitude and phase information obtained in the magnitude and phase T-F maps can be also used to determine the dispersion curve (variation in wave velocity with frequency) of the pile and the pile length [25].

4. Verification Using Numerical Simulation

4.1. Numerical Simulation Modeling

To demonstrate the feasibility of the proposed method for evaluating the wave velocity (i.e., stiffness) of the material under a pile installed in a soft soil layer, numerical simulations were performed using the ABAQUS computer program with axisymmetric modeling. The element size is 0.01 m and the sampling rate is 4 μ s , both meeting the necessary conditions for stable numerical wave propagation analysis [41,42,43]. The numerical simulation model comprises a pile, the laterally surrounding soft soil layer, and the material (i.e., soil or rock) layer under the bottom of the pile, as shown in Figure 7. The diameter and length of the pile are 0.5 m and 10 m, respectively. The P-wave velocity of the pile is 3500 m/s, and the damping ratio is 0.5%. A P-wave velocity of 150 m/s is used to simulate the surrounding soft soil [44]. The P-wave velocities of the soil or rock under the pile bottom are as follows: free boundary condition (0 m/s), 600 m/s, 1500 m/s, 2200 m/s, 4000 m/s, 6000 m/s, and fixed boundary condition (∞ m/s). The Poisson’s ratios of the pile and soil (or rock) are 0.2 and 0.25, respectively. The unit weights of the pile, surrounding soft soil, and bottom soil (or rock) are 2200, 1800, and 1950 kg/m3, respectively. These material properties are presented in Table 1. In this numerical test, an impact load is applied to the pile head, and the acceleration of vibration of the pile head surface is measured.

4.2. Numerical Simulation Results

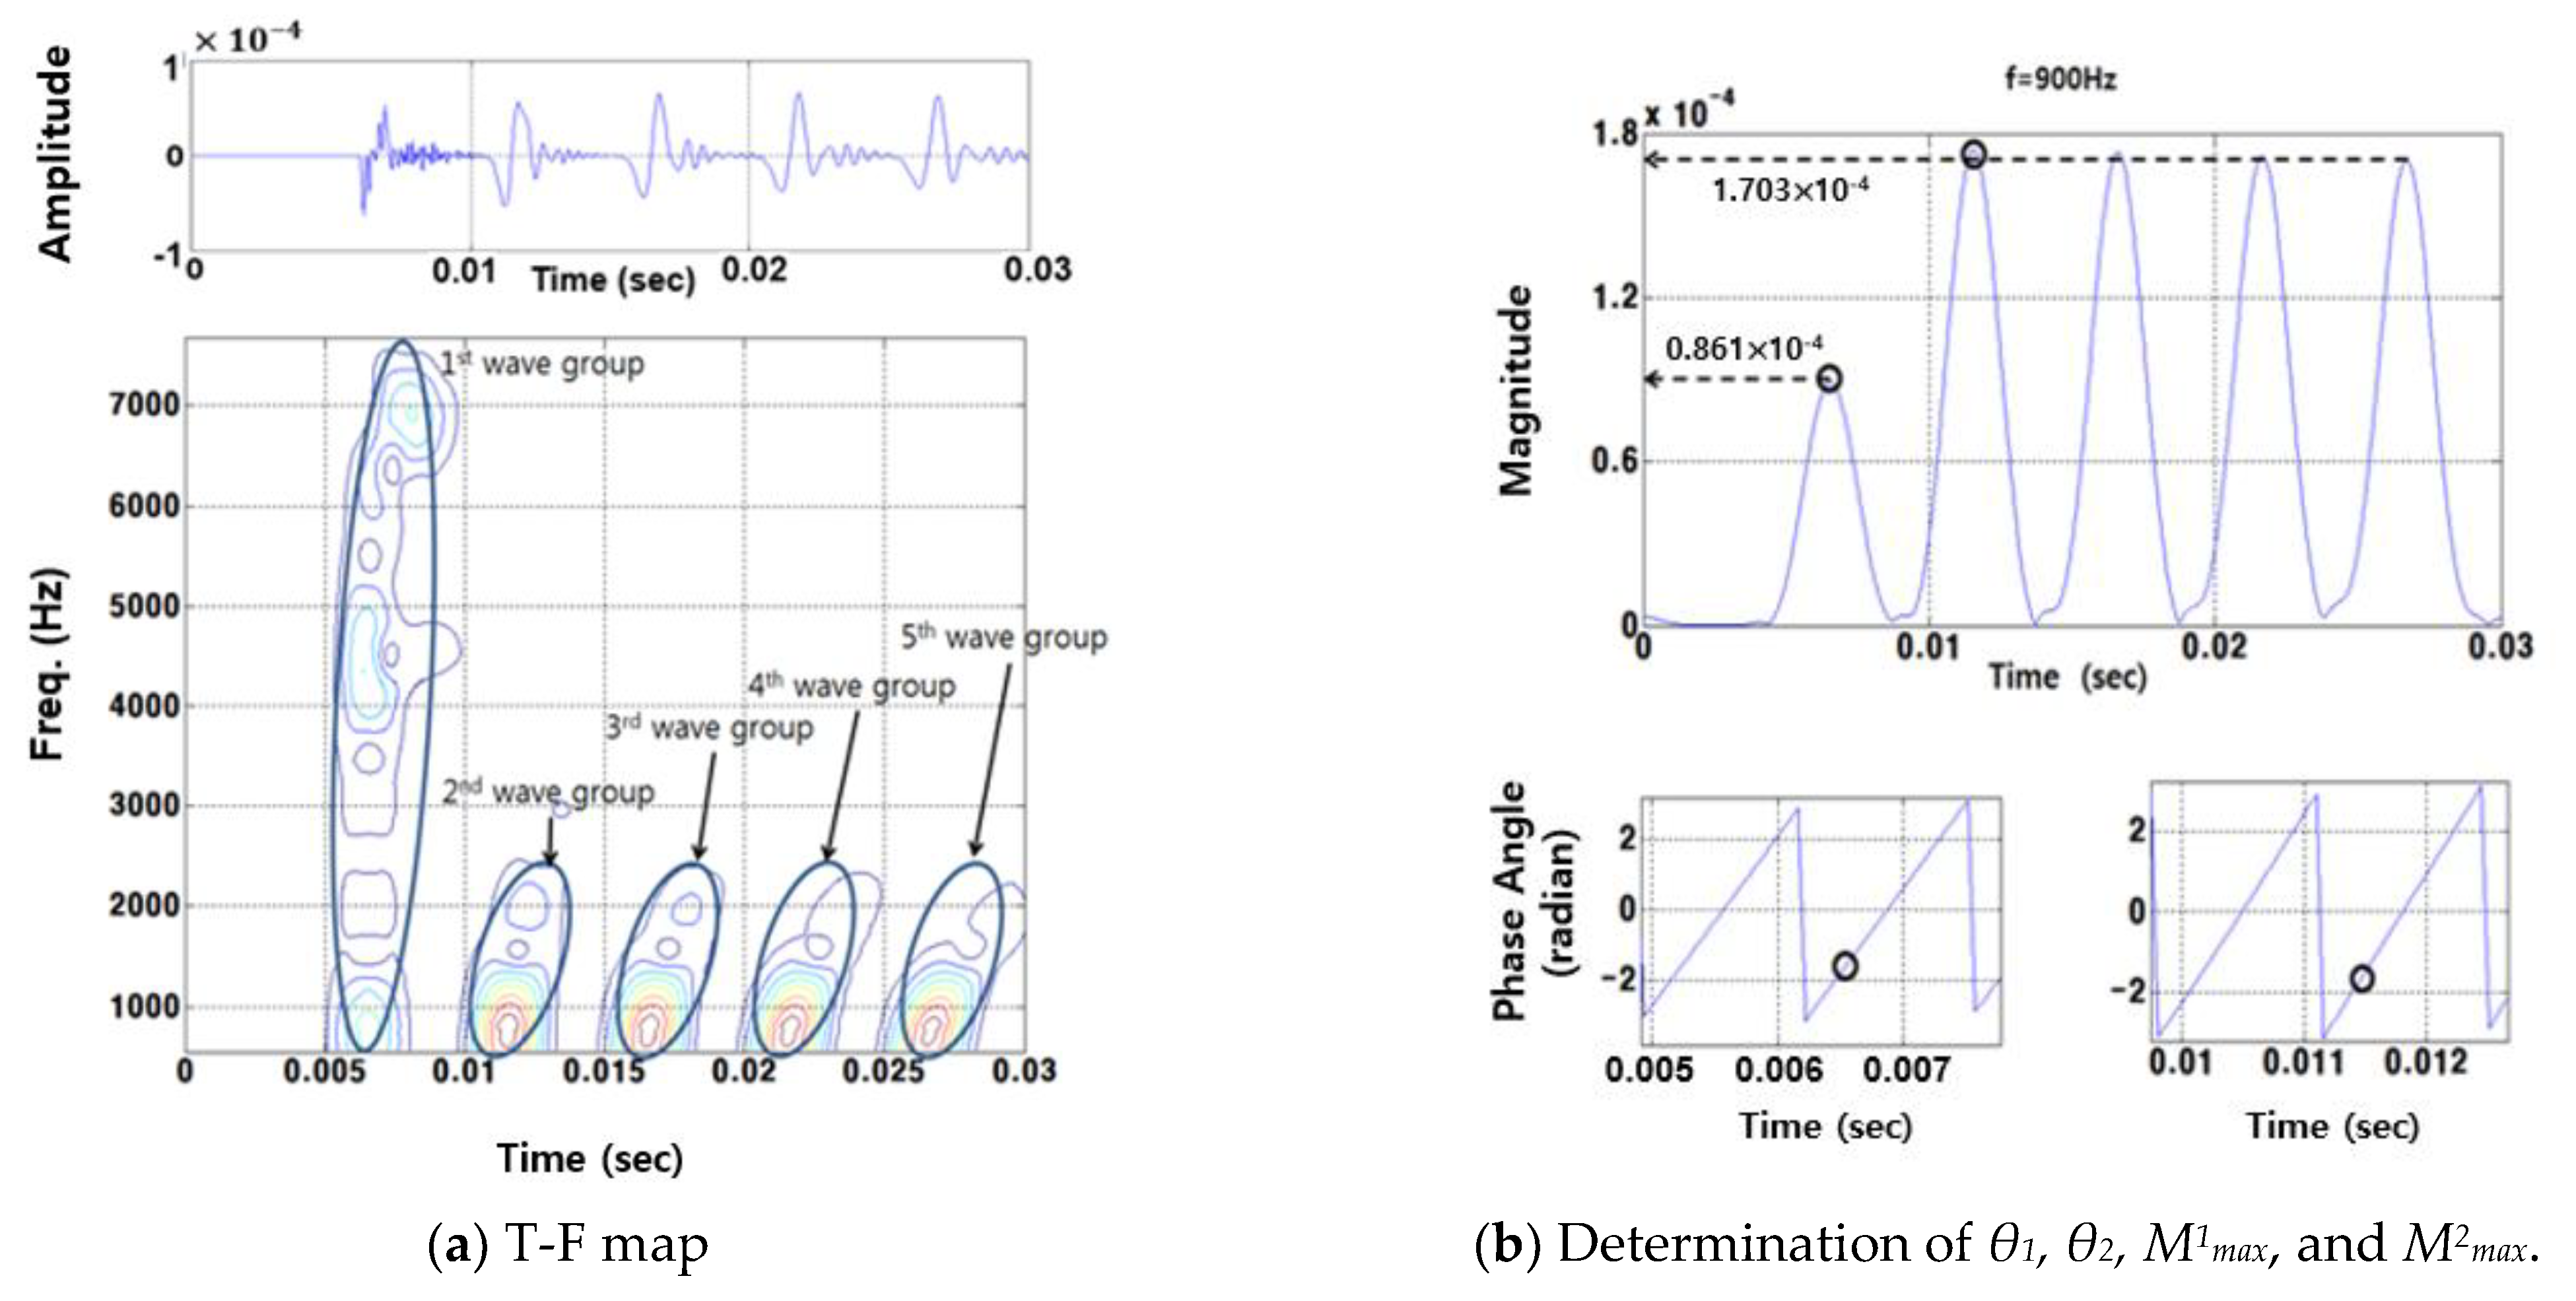
Figure 8a shows the time domain wave signal generated by numerical simulation and the time–frequency magnitude map generated by harmonic wavelet transform for the free boundary condition case. In the time–frequency map, five wave groups are identified. The first wave group corresponds to the incident wave and the others correspond to the reflected waves. It is noted that in this figure, the degree of obliqueness in the shape of the wave group curve varies with time, which means that the P-wave propagation along the pile has a dispersive characteristic. Figure 8b shows the magnitude and phase of the harmonic wavelet coefficient corresponding to fselect. In these cases, fselect is 900 Hz. Figure 8b represents the time-dependent variations in magnitude and phase of the wave component with a single frequency of 900 Hz, as measured at the pile cap. From the plot depicting changes in magnitude over time, it is straightforward to distinguish each wave group corresponding to 900 Hz.
θ1, θ2, M1max, and M2max of wave groups 1 and 2 are depicted in this figure (indicated by black circles). The phase difference and magnitude ratio determined from these values are 0 and 0.989, respectively. Using these values and Figure 3 or Figure 6, V p , b o t t o m V p , p i l e is determined to be 0.010. The Vp of the material under the pile tip is evaluated to be 19 m/s using the value of V p , b o t t o m V p , p i l e and Equation (10). In this case, the exact value is zero and the test results show little difference from this value. However, 19 m/s can be considered as a free boundary condition.
Figure 9 shows the magnitude and phase of the harmonic wavelet coefficient corresponding to 900 Hz for the fixed boundary condition case. θ1, θ2, M1max, and M2max are depicted in this figure (indicated by black circles). The phase difference and magnitude ratio determined from these values are 3.14 and 0.981, respectively. Using Figure 3 or Figure 6, V p , b o t t o m V p , p i l e is determined to be 0.010. The Vp of the material under the pile bottom is evaluated to be 364,000 m/s using the value of V p , b o t t o m V p , p i l e and Equation (10). In this case, the exact value is infinite. In contrast, 364,000 m/s is not infinite; however, it could be acceptable as a fixed boundary condition.
The numerical simulation results corresponding to fixed and free boundary conditions are summarized in Table 2.
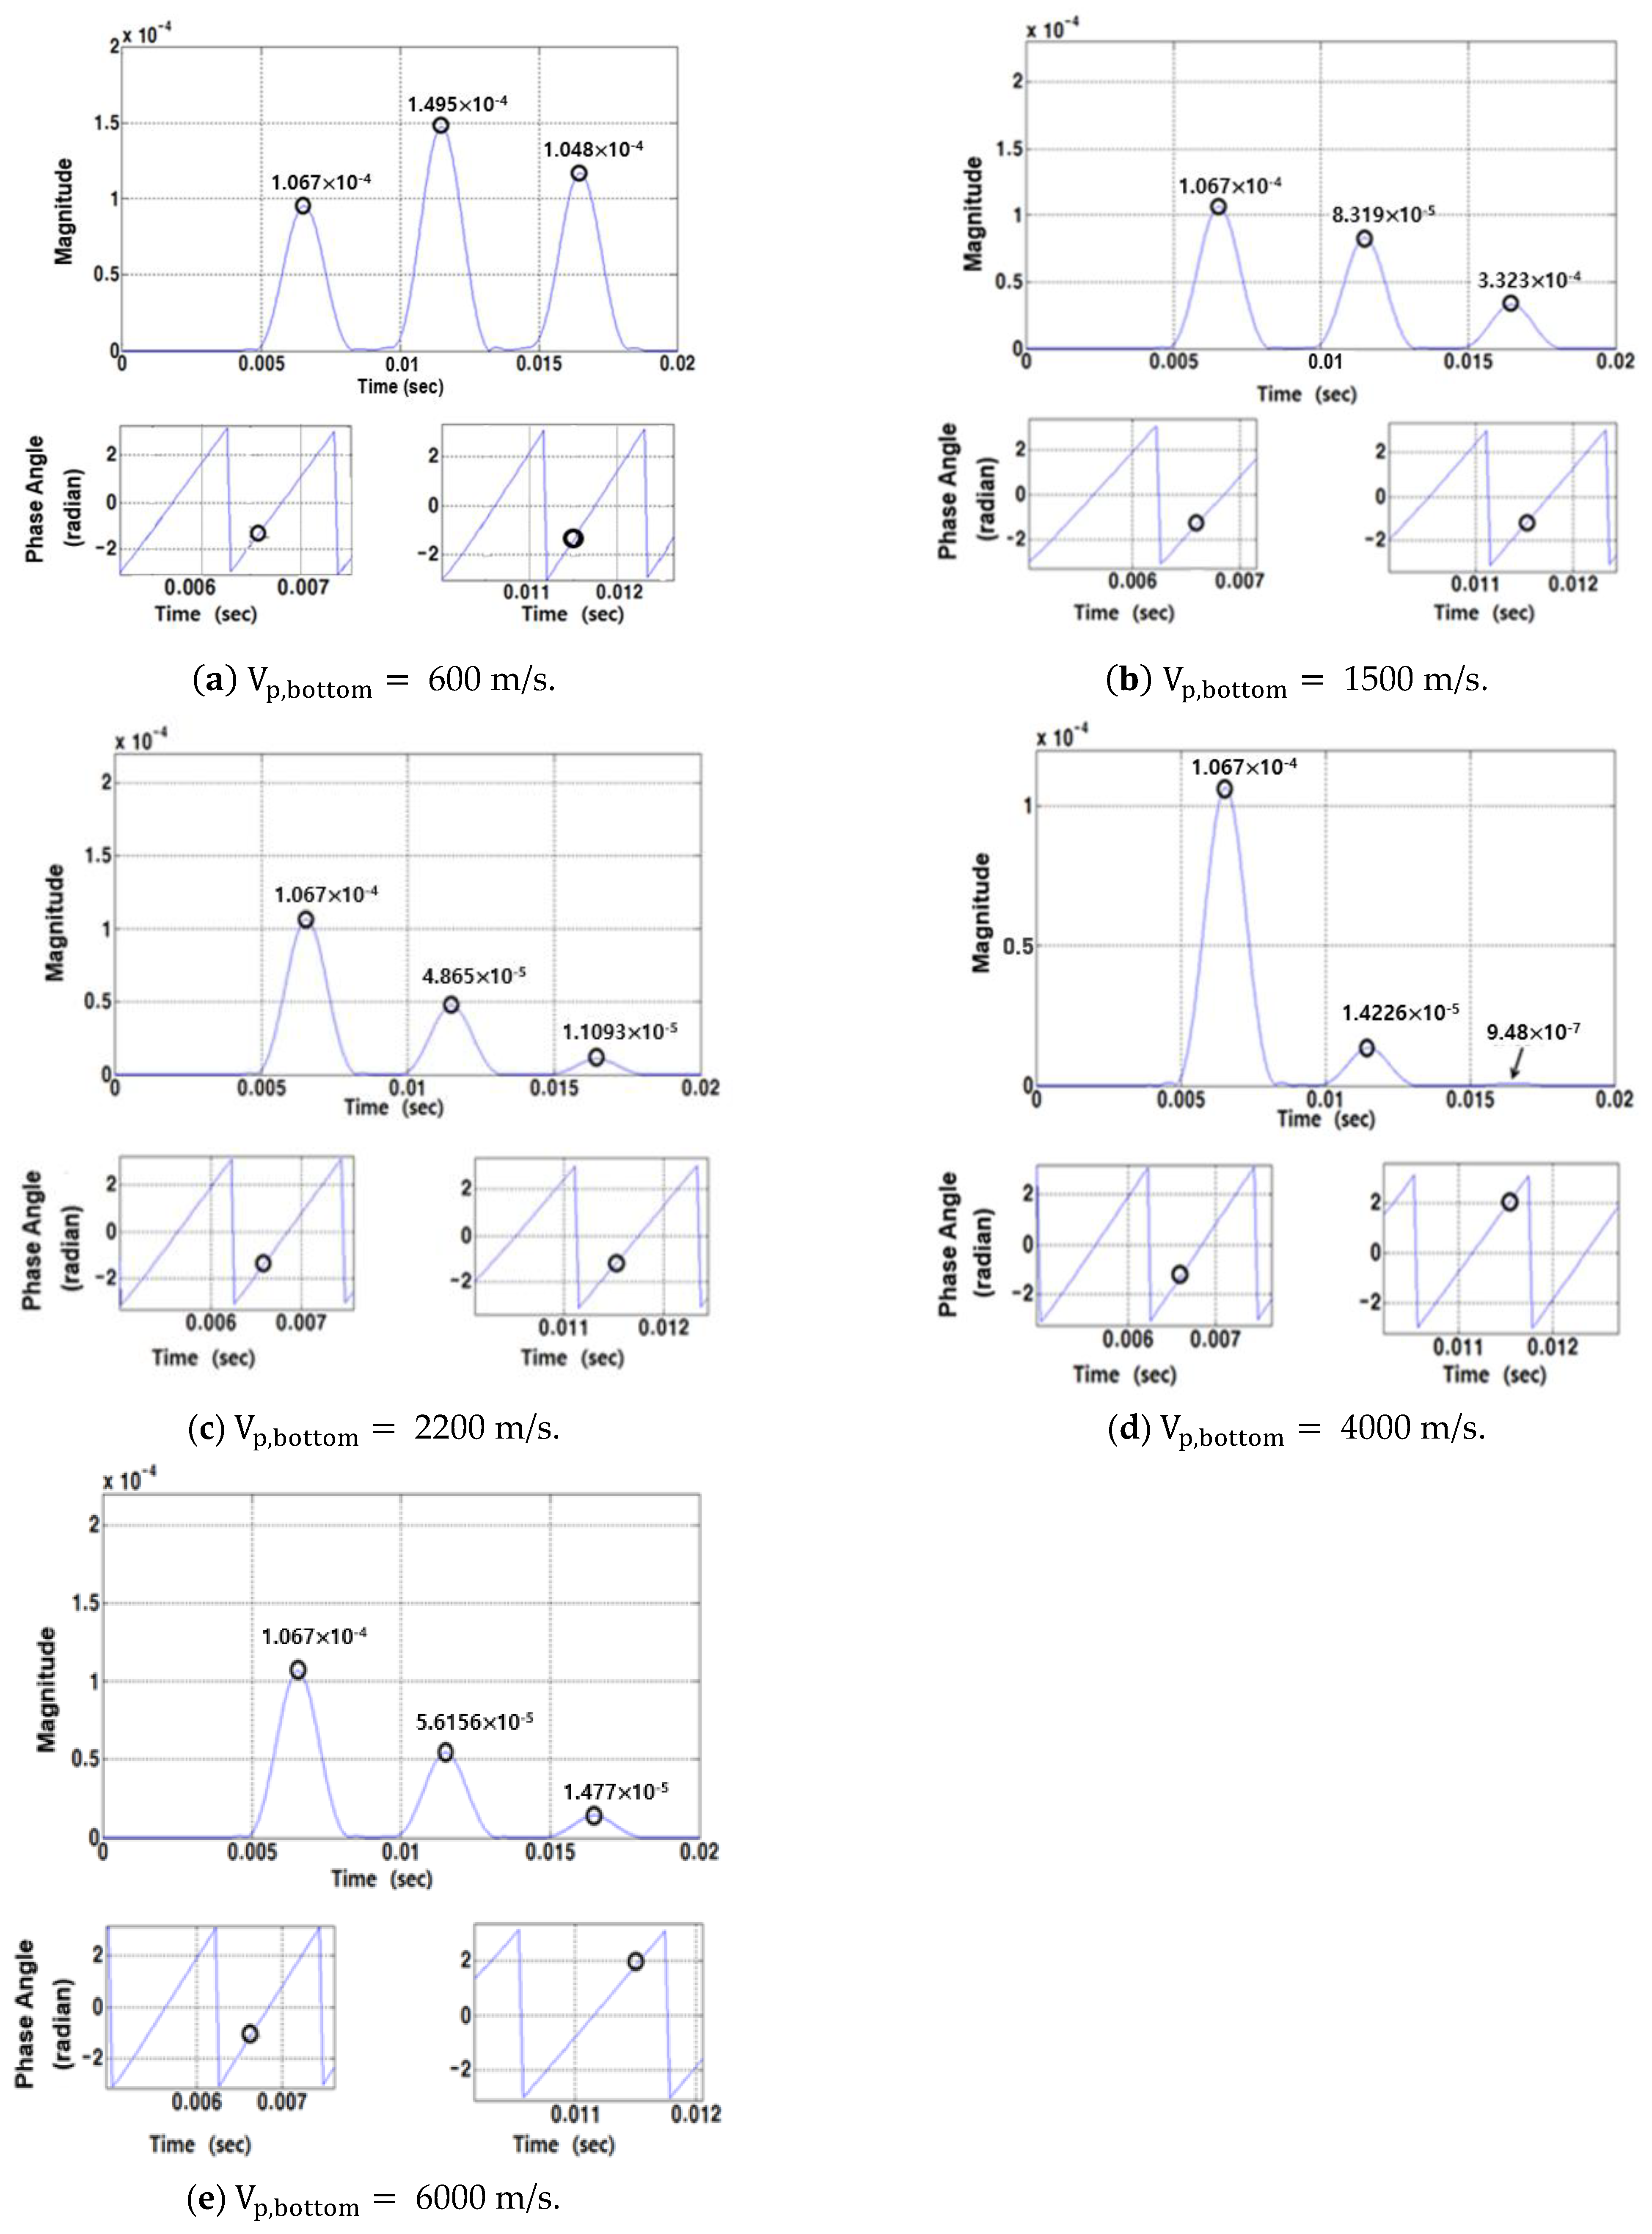
Figure 10a–e shows the magnitude and phase of the harmonic wavelet coefficients corresponding to 900 Hz for the intermediate boundary condition case. θ1, θ2, M1max, and M2max for each case are depicted in these figures (indicated by black circles). In the cases of Vp,bottom values of 600, 1500, and 2200 m/s (as shown in Figure 10a–c), the phase differences are determined to be zero and the magnitude ratios are calculated to be 0.701, 0.400, and 0.228, respectively. V p , b o t t o m V p , p i l e is evaluated to be 0.175, 0.429, and 0.629, respectively, using the phase difference, the magnitude ratio, and Figure 3 or Figure 6. Vp,bottom is calculated to be 615, 1500, and 2200 m/s, respectively, using Equation (10) and V p , b o t t o m V p , p i l e . In the cases of a Vp,bottom value of 4000 and 6000 m/s (as shown in Figure 10d,e), the phase differences are determined to be 3.14 for both cases and the magnitude ratios are calculated to be 0.067 and 0.263, respectively. V p , b o t t o m V p , p i l e is evaluated to be 1.144 and 1.714, respectively, using the phase difference, the magnitude ratio, and Figure 3 or Figure 6. Vp,bottom is calculated to be 4003 and 5990 m/s, respectively, using Equation (10) and V p , b o t t o m V p , p i l e .
The numerical simulation results corresponding to the intermediate boundary conditions are summarized in Table 3.

4.3. Discussion

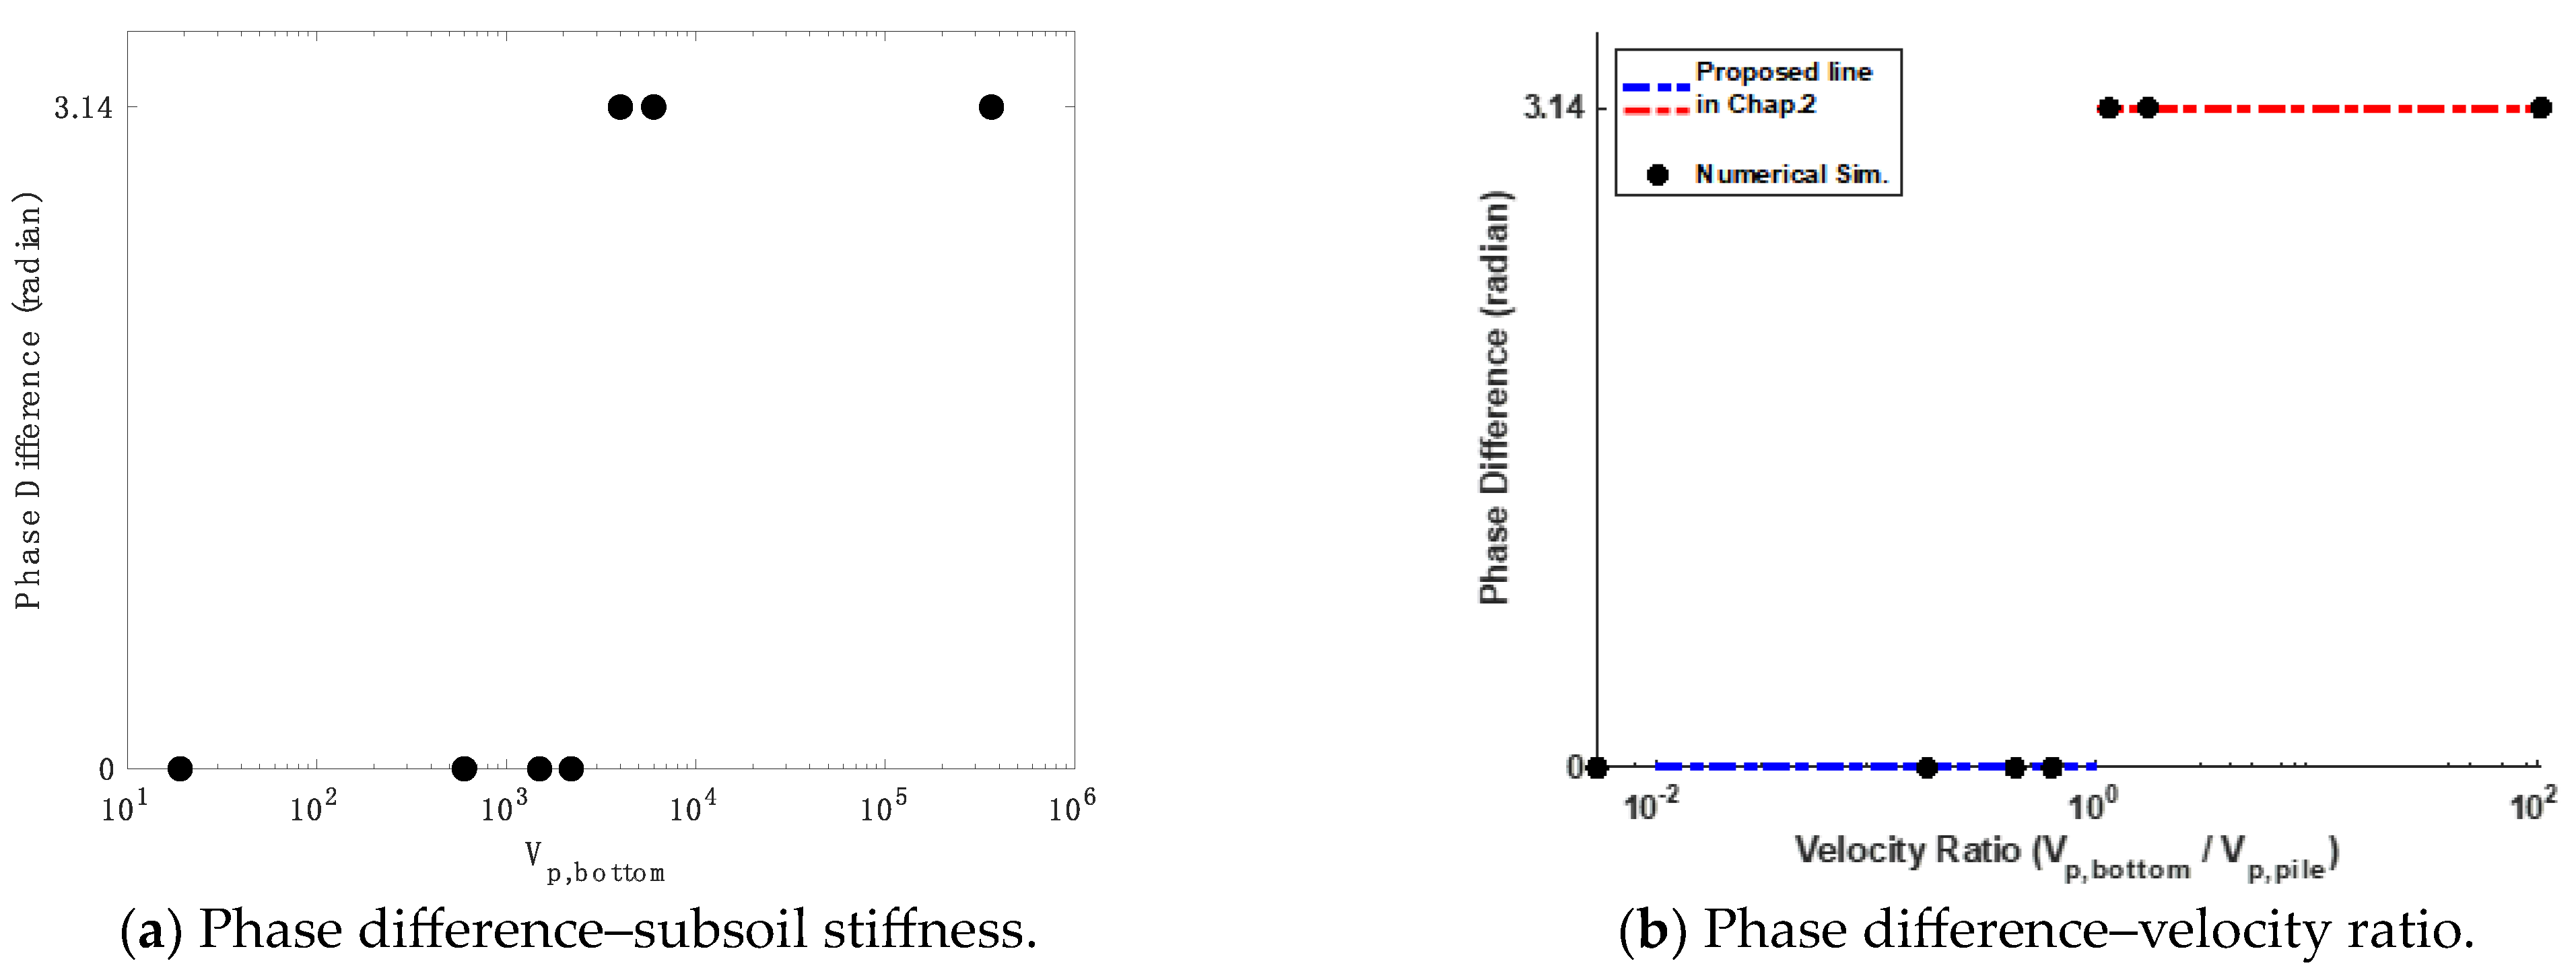
Figure 11 depicts the phase difference between the incident and reflected waves of the 900 Hz single-frequency component determined through numerical simulation experiments conducted while varying the stiffness of the subsoil beneath the pile foundation tip. Figure 11a depicts the phase difference of the incident and reflected waves based on the stiffness (or wave velocity) of the subsoil beneath the pile foundation, while Figure 11b shows the phase difference of incident and reflected waves according to the ratio of subsoil stiffness beneath the pile and the pile foundation’s own stiffness (or velocity ratio). Figure 11a shows that, in the numerical simulation experiments, the phase of the reflected wave at the reflection boundary consistently always exhibits a phase difference of either 0 or 180 degrees relative to the incident wave. This phase difference was observed to be solely determined by the boundary category conditions at the reflection interface, irrespective of the magnitude ratio between the incident and reflected waves. Specifically, it was noted that in all cases where the boundary condition is characterized by a stiffness smaller than the propagating medium (Vp,bottom = 0 (free boundary), 600, 1500, 2200 m/s), the incident and reflected waves exhibit the same phase (0-degree phase difference). Conversely, in all instances where the boundary condition possesses a stiffness greater than the medium (Vp,bottom = 4000, 6000 m/s, ∞ (fixed boundary)), the phase difference between the incident and reflected waves consistently remains at 180 degrees, irrespective of the magnitude of the subsoil stiffness beneath the pile foundation tip.
Single-frequency wave signals, as shown in Equations (2) and (6), are represented in terms of magnitude and phase [38]. The magnitude represents the envelope function of the single-frequency signal, while the phase represents the carrier shape of the signal [40]. Magnitude and phase are independent components of each other, and when a single-frequency function is given, altering its magnitude does not affect the phase. This observation is derived from numerical simulation results (Figure 11a, Table 2 and Table 3), where, despite variations in the stiffness of the boundary conditions altering the magnitude ratio of the incident and reflected waves, the phase difference remains constant for all conditions falling within the same category. In the single-frequency functions, changes in magnitude do not influence the associated phase, a characteristic consistently observed in the numerical simulation experiments under different boundary condition cases.
Therefore, by comparing the phases of incident and reflected waves (or phase difference information), the boundary conditions at the reflection interface can be qualitatively assessed. In other words, phase difference information enables the determination of whether the stiffness of the medium at the boundary is greater or smaller than the stiffness of the medium through which the wave propagates (in this study, the pile).
In the numerical simulation experiments with subsoil stiffness values of 0 (free), 600, 1500, and 2200 m/s, the quantitative evaluation of the stiffness magnitude of the subsurface beneath the pile foundation tip is not achievable when relying solely on phase information. However, qualitatively, it can be inferred from the phase information (in all four cases where the phase difference between incident and reflected waves is 0 degrees) that the subsurface possesses a stiffness lower than that of the pile. Conversely, in the cases with stiffness values of 4000 and 6000 m/s, as well as a fixed boundary condition, qualitative assessment from phase information (in all three cases where the phase difference between the incident and reflected waves is 180 degrees) indicates that the subsoil stiffness is greater than that of the pile.
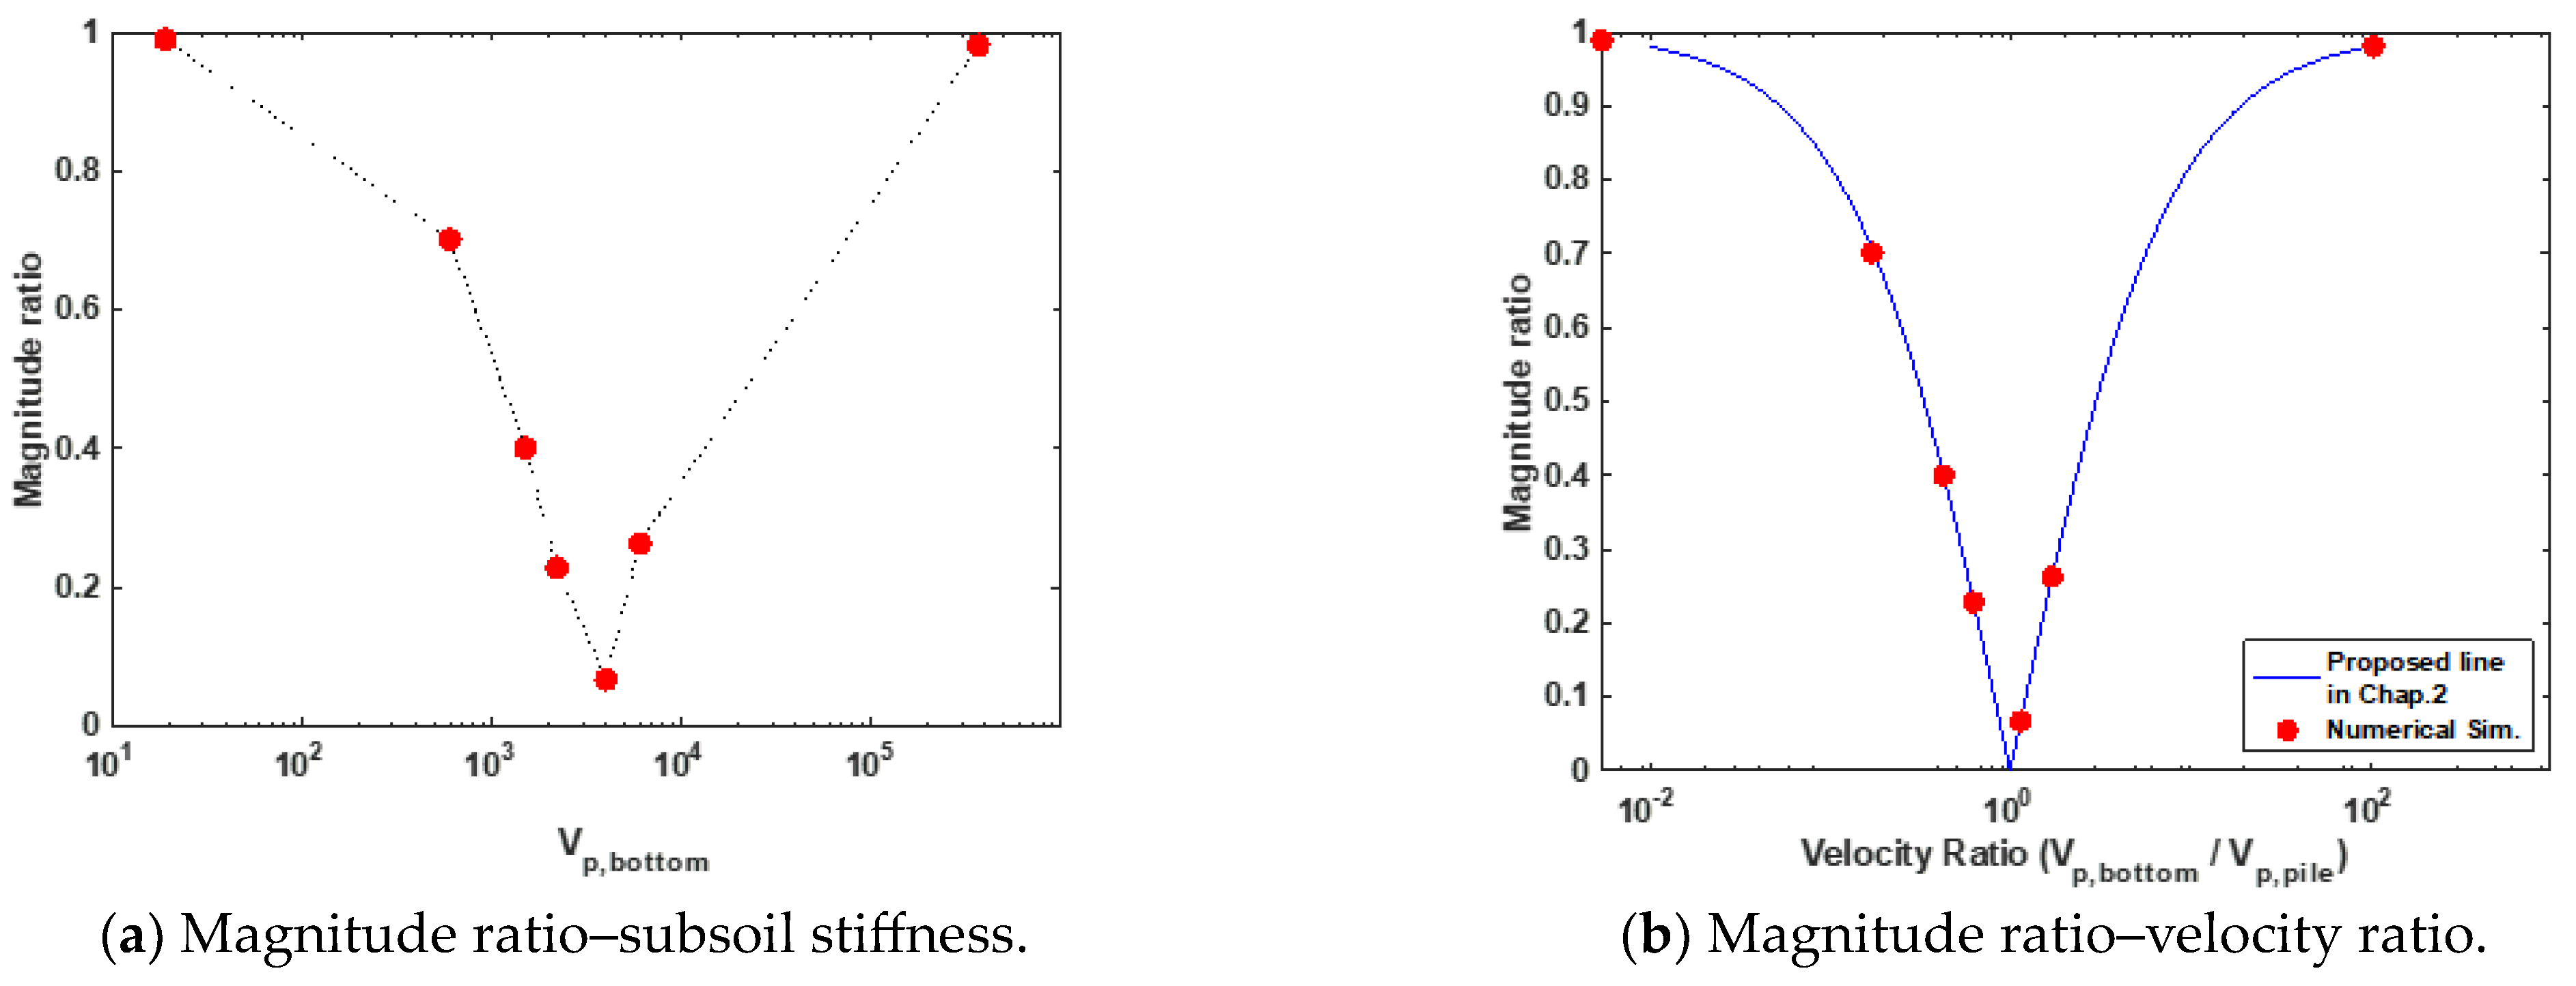
Figure 12a shows the magnitude ratio of incident and reflected waves measured at the pile cap with respect to the subsoil boundary stiffness obtained from the numerical simulation experiments. The figure depicts how the magnitude ratio varies with changes in subsoil stiffness; notably, a single magnitude ratio can arise from two different subsoil stiffness conditions. When a wave composed of a single-frequency component is reflected at the reflection interface, magnitude undergoes variations based on the boundary conditions at the reflection interface. Unlike phase, which remains constant, magnitude changes with the stiffness of the boundary interface. Therefore, a quantitative assessment of the boundary interface stiffness can be derived from the magnitude ratio of incident to reflected waves.
Magnitude and phase are independent components of each other, but magnitude information entirely lacks any details related to the qualitative characteristics of the boundary interface that phase information may possess (whether the boundary interface stiffness is greater or smaller than that of the pile). In other words, while the magnitude ratio information includes details about the boundary interface stiffness, it simultaneously has uncertainty (whether this magnitude ratio originated from a subsoil stiffness greater or smaller than that of the pile). Therefore, it is evident that the assessment of the pile subsoil stiffness cannot be solely achieved through magnitude ratio information. This is evident from the numerical simulation results provided in Figure 12a.
Figure 12b compares the numerical simulation results with the magnitude ratio plot in Figure 3b, which represents the magnitude ratio according to the pile-to-subsoil stiffness ratio (velocity ratio) in Section 2. The two results in this figure are well matched, indicating that the magnitude characteristics depicted in Figure 3b based on the velocity ratio effectively reflect the signal’s magnitude behavior induced by waves propagating within the pile.
As elucidated above, the phase difference and magnitude ratio information of incident/reflected wave signals, as discerned from numerical simulation experiments, offer partial information about the stiffness of the subsoil or bedrock beneath the pile foundation. To assess the stiffness of the subsoil or bedrock beneath the pile foundation, both types of information need to be used concurrently, as shown in Figure 3. The data analysis procedure presented in Section 3 enables the evaluation of the stiffness of the subsoil beneath the pile foundation by simultaneously utilizing the magnitude (Figure 3b) and phase information (Figure 3a) in the incident/reflected wave signals.
The boundary conditions beneath the pile foundation (stiffness of the subsoil or bedrock beneath the pile), determined by applying the step-by-step data analysis procedure provided in Section 3 to the measured signals obtained from the numerical simulation experiments, were compared with the exact stiffness values used in the numerical simulations, as illustrated in Figure 13. Upon observing Figure 13, it can be noted that the stiffness determined by the proposed method aligns well with the actual values.
Through numerical simulation experiments, the capability of the proposed method to assess the stiffness of the subsoil or bedrock beneath the pile foundation is shown.

5. Conclusions

1. The objective of this study was to develop a non-destructive evaluation method for subsurface soil stiffness beneath pile foundations tip, which is one of the important factors in the assessment of existing pile performance. Access to the subsurface beneath existing piles tip is challenging (almost impossible in the field). Therefore, there is a need for the development of a non-destructive testing method for pile foundations that allows for easy and convenient testing. Various non-destructive pile integrity evaluation methods have been developed; however, these conventional methods can only assess the structural integrity of the pile itself and cannot evaluate the subsurface soil stiffness beneath the pile tip.
2. The characteristics of waves propagating within the pile were verified from the perspective of measured signals through numerical simulation experiments. The measured signals are represented using independently obtained magnitude and phase information. Through numerical simulation experiments, the phase information extracted from signals measured at the pile cap allows for a qualitative assessment of the stiffness of the subsoil or rock layers beneath the pile foundation tip. Additionally, the magnitude information of the signals enables a quantitative assessment of the stiffness of the subsoil or rock layers beneath the pile foundation tip. However, it was observed that these results carry uncertainties. To mitigate the uncertainties that may arise in evaluating the stiffness of the subsoil or rock layers beneath the pile foundation, it is essential to simultaneously utilize both phase and magnitude information.
3. To obtain the phase and magnitude information of the measurement signal over time, it is necessary to distinguish/decompose the individual frequency components that constitute the measurement data. Through numerical simulations, it was demonstrated that harmonic wavelet transform can effectively determine the phase and magnitude information of individual frequency components constituting the signals measured at the pile cap through the decomposition of the measured signals.
4. In this study, harmonic wavelet transform was employed in the processing of measured signals to simultaneously utilize phase and magnitude information. Additionally, a step-by-step procedure for evaluating the subsoil stiffness of the pile foundation using harmonic wavelet transform was proposed. The proposed method was applied to the numerical simulation results, and the determined subsoil stiffness was compared with the exact values used in the numerical simulations. The subsoil stiffness determined by the proposed method closely matched the exact values. Through this comparison, it was demonstrated that the proposed non-destructive method effectively evaluates the subsoil stiffness beneath the pile foundation tip.
5. When the soil surrounding the pile is stiffer than the soil used in this study, energy dissipation through the sides of the pile may occur. Therefore, for the application of the proposed method to a more general case, consideration should be given to energy dissipation through the sides of the pile based on the stiffness of the soil surrounding the pile.

Author Contributions

H.-J.O.: Methodology, Numerical Simulation, Writing—Original draft preparation, Writing—Reviewing & Editing. J.-H.P.: Numerical Simulation, Data Curation, Visualization. H.-C.P.: Methodology, Conceptualization, Writing—Reviewing & Editing, Supervision. All authors have read and agreed to the published version of the manuscript.

Funding

This research was funded by Chungnam National University [2021-0867-01].

Data Availability Statement

Due to legal issues and trade secrets, the monitoring data in this article cannot be provided free of charge. Nevertheless, all concepts and data are explained in the submitted studies, and some studies are available upon request.

Acknowledgments

The authors gratefully acknowledge the financial support provided by Chungnam National University.

Conflicts of Interest

The authors declare no conflict of interest.

References

  1. Das, B.M. Principles of Foundation Engineering, 7th ed.; Cengage Learning India: Noida Uttar Pradesh, India, 2010. [Google Scholar]
  2. Rausche, F.; Likins, G.; Kung, S.R. Pile integrity testing and analysis. In Application of Stress-Wave Theory to Piles; Routledge: London, UK, 2022; pp. 613–617. [Google Scholar]
  3. Li, D.Q.; Zhang, L.M.; Tang, W.H. Reliability evaluation of cross-hole sonic logging for bored pile integrity. J. Geotech. Geoenviron. Eng. 2005, 131, 1130–1138. [Google Scholar] [CrossRef]
  4. Ly, C.; Eng, C.; Heng, M.Y.; Yos, P. Concrete Pile Defect Identification: Insights from Cross-Hole Sonic Logging and High Strain Dynamic Pile Test. IOP Conf. Ser. Earth Environ. Sci. 2022, 1117, 012059. [Google Scholar] [CrossRef]
  5. Lu, Z.T.; Zhi, L.W.; Dong, J.L. A study on the application of the parallel seismic method in pile testing. Soil Dyn. Earthq. Eng. 2013, 55, 255–262. [Google Scholar] [CrossRef]
  6. Sun, Q.; Elshafie, M.; Banker, C.; Fisher, A.; Schooling, J.; Rui, Y. Thermal integrity testing of cast in situ piles: An alternative interpretation approach. Struct. Health Monit. 2021, 20, 2493–2512. [Google Scholar] [CrossRef]
  7. Piscsalko, G.; Cotton, D.; Belardo, D.; Likins, G. Using Thermal Integrity Profiling to Confirm the Structural Integrity of foundation applications. In Proceedings of the International Foundations Congress and Equipment Expo 2015, San Antonio, TX, USA, 17–21 March 2015; pp. 2607–2616. [Google Scholar]
  8. Johnson, K.R. Analyzing thermal integrity profiling data for drilled shaft evaluation. DFI J.-J. Deep Found. Inst. 2016, 10, 25–33. [Google Scholar] [CrossRef]
  9. Ambrosini, D.; Ezeberry, J. Long Piles Integrity Trough Impact Echo Technique. Mec. Comput. 2005, 24, 651–670. [Google Scholar]
  10. Kim, H.J.; Mission, J.L.; Dinoy, P.R.; Kim, H.S.; Park, T.W. Guidelines for impact echo test signal interpretation based on wavelet packet transform for the detection of pile defects. Appl. Sci. 2020, 10, 2633. [Google Scholar] [CrossRef]
  11. Amir, J.M. Single-tube ultrasonic testing of pile integrity. In Deep Foundations 2002: An International Perspective on Theory, Design, Construction, and Performance; American Society of Civil Engineers: Reston, VA, USA, 2002; pp. 836–850. [Google Scholar]
  12. Cui, S.H.; Liu, H.W.; Maghoul, P. Pile length estimation based on guided wave theory and dispersion analysis for reuse of foundations. Int. J. Solids Struct. 2023, 283, 112486. [Google Scholar] [CrossRef]
  13. Rashidyan, S.; Tang-tat, N.; Arup, M. Study of the effect of sensor location on sonic echo/impulse response testing in timber piles. AUT J. Civ. Eng. 2020, 4, 473–486. [Google Scholar]
  14. Rashidyan, S.; Tang-tat, N.; Arup, M. Bridge foundation depth estimation using sonic echo test. In Experimental and Applied Mechanics, Volume 4: Proceedings of the 2015 Annual Conference on Experimental and Applied Mechanics, Costa Mesa, CA, USA, 8–11 June 2015; Springer International Publishing: Berlin/Heidelberg, Germany, 2016. [Google Scholar]
  15. Liao, S.T.; Chin, K.H.; Wang, C.Y. Sonic echo and impulse response tests for length evaluation of soil nails in various bonding mediums. Can. Geotech. J. 2008, 45, 1025–1035. [Google Scholar] [CrossRef]
  16. Cunha, R.P.; Cordeiro, A.F.; Cárdenas, J.C.R. Comparison of integrity and echo tests in the assessment of defects in pile foundations. Balt. Piling 2013, 165–169. [Google Scholar]
  17. Lozovsky, I.N.; Zhostkov, R.A.; Churkin, A.A. Numerical simulation of ultrasonic pile integrity testing. Russ. J. Nondestruct. Test. 2020, 56, 1–11. [Google Scholar] [CrossRef]
  18. Finno, R.J.; Gassman, S.L. Impulse response evaluation of drilled shafts. J. Geotech. Geoenviron. Eng. 1998, 124, 965–975. [Google Scholar] [CrossRef]
  19. Liao, S.T.; Roesset, J.M. Dynamic response of intact piles to impulse loads. Int. J. Numer. Anal. Methods Geomech. 1997, 21, 255–275. [Google Scholar] [CrossRef]
  20. Davis, A.G. The nondestructive impulse response test in North America: 1985–2001. NDT&E Int. 2003, 36, 185–193. [Google Scholar]
  21. Finno, R.J.; Popovics, J.S.; Hanifah, A.A.; Kath, W.L.; Chao, H.C.; Hu, Y.H. Guided wave interpretation of surface reflection techniques for deep foundations. Ital. Geotech. J. 2001, 35, 76–91. [Google Scholar]
  22. Yang, Y.; Li, G.; Luo, N.; Cao, X. Testing of Structural Integrity of U-Shaped Sheet Pile in Canal Engineering Using Ground Penetrating Radar. Appl. Sci. 2022, 12, 11558. [Google Scholar] [CrossRef]
  23. Lee, J.S.; Song, J.U.; Hong, W.T.; Yu, J.D. Application of time domain reflectometer for detecting necking defects in bored piles. NDT&E Int. 2018, 100, 132–141. [Google Scholar]
  24. Baker, C.N., Jr.; Drumright, E.E.; Mensah, F.D.; Parikh, G.; Ealy, C.D. Use of nondestructive testing to evaluate defects in drilled shafts: Results of FHWA research. Transp. Res. Rec. 1991, 1331, 28–35. [Google Scholar]
  25. Park, H.C.; Kim, D.S. Non-Destructive Pile Integrity Test Using HWAW Method. Key Eng. Mater. 2006, 321, 363–366. [Google Scholar] [CrossRef]
  26. Park, H.C.; Kim, D.S.; Cho, S.E. Development of non-distructive pile soundness test using HWAW method. J. Korean Geotech. Soc. 2008, 234, 13–23. [Google Scholar]
  27. Liu, J.L.; Wang, S.F.; Zheng, J.Y.; Chang, C.M.; Wei, X.J.; Ren, W.X. Time–Frequency Signal Processing for Integrity Assessment and Damage Localization of Concrete Piles. Int. J. Struct. Stab. Dyn. 2020, 20, 2050020. [Google Scholar] [CrossRef]
  28. Ni, S.H.; Yang, Y.Z.; Tsai, P.H.; Chou, W.H. Evaluation of pile defects using complex continuous wavelet transform analysis. NDT&E Int. 2017, 87, 50–59. [Google Scholar]
  29. Goble, G.G. The analysis of pile driving-A state-of-the-art. In Proceedings of the International Conference on the Application of Stress-Wave Theory to Piles, Stockholm, Sweden, 4–5 June 1980. [Google Scholar]
  30. Linkis, G.E.; Rausche, F.; Thendean, G.; Svinkin, M. CAPWAP Correlation Studies. In Proceedings of the 5th International Conference on the Application of Stress-Wave Theory to Piles, Orlando, FL, USA, 11–13 September 1996. [Google Scholar]
  31. Lee, J.S.; Seo, M.J.; Park, G.W.; Kim, D.H.; Kim, Y.D. Research on the Development of Rational Dynamic Load Test Bearing Capacity Analysis Methods and Guidelines; LH Land and Housing Research Institute: Daejeon, Republic of Korea, 2020. [Google Scholar]
  32. Park, J.B. A comparative study on the bearing capacity of dynamic load test and static load test of PHC bored Pile. J. Korean Geo-Environ. Soc. 2017, 18, 19–31. [Google Scholar]
  33. Wang, C.; Han, J.T. Effect of preloaded micropile on the foundation underpinning by centrifuge experiments. Géotech. Lett. 2021, 11, 10–15. [Google Scholar] [CrossRef]
  34. Newland, D.E. Wavelet analysis of vibration, Part 1: Theory. J. Vib. Acoust. Trans. ASME 1994, 116, 409–416. [Google Scholar] [CrossRef]
  35. Newland, D.E. Wavelet analysis of vibration, Part 2: Wavelet maps. J. Vib. Acoust. Trans. ASME 1994, 116, 417–425. [Google Scholar] [CrossRef]
  36. Jung, B.S.; Lee, J.H.; Kweon, G.C. Application of Impact Resonance Test to the Determination of Elastic Modulus and Damping Ratio of Concrete. J. Korea Concr. Inst. 2010, 22, 625–632. (In Korean) [Google Scholar] [CrossRef]
  37. Graff, K.F. Wave Motion in Elastic Solids; Dover Publications: Mineola, NY, USA, 1991. [Google Scholar]
  38. Boashash, B. Estimating and interpreting the instantaneous frequency of a signal. I. Fundamentals. Proc. IEEE 1992, 80, 520–538. [Google Scholar] [CrossRef]
  39. Hwang, H.J.; Park, H.C. Evaluation of condition of gravel ballast layer on high-speed railway using surface wave method based on harmonic wavelet analysis of waves. NDT&E Int. 2010, 68, 78–687. [Google Scholar]
  40. Park, H.C.; Kim, D.S. Evaluation of dispersive phase and group velocities using harmonic wavelet transform. NDT&E Int. 2001, 34, 457–467. [Google Scholar]
  41. Villiappan, S.; Muriti, V. Finite Element Constraints in the Analysis of Wave Propagation Problem; UNICV Report No. R-218; The University of New South Wales, The School of Civil Engineering: Sydney, Australia, 1984. [Google Scholar]
  42. Saenger, E.H.; Gold, N.; Shapiro, S.A. Modeling the propagation of elastic waves using a modified finite-difference grid. Wave Motion 2000, 31, 77–92. [Google Scholar] [CrossRef]
  43. Zerwer, A.; Cascante, G.; Hutchinson, J. Parameter estimation in finite element simulations of Rayleigh waves. J. Geotech. Geoenviron. Eng. 2002, 128, 250–261. [Google Scholar] [CrossRef]
  44. A Study on Site-Specific Seismic Design Response Spectrum; Ministry of Construction and Transportation: Seoul, Republic of Korea, 1997.
Figure 1. Pile foundation (end-bearing pile).
Buildings 14 00511 g001
Figure 2. Wave propagation in the pile.
Buildings 14 00511 g002
Figure 3. Relationship of the magnitude and phase between the incident and the first reflected wave or between subsequent reflected waves.
Buildings 14 00511 g003
Figure 4. Harmonic wavelet transform.
Buildings 14 00511 g004
Figure 5. Identification of wave groups using time–frequency map and determination of local maximum magnitudes and phases for corresponding wave groups.
Buildings 14 00511 g005aBuildings 14 00511 g005b
Figure 6. Determination of velocity ratio using magnitude ratio and phase difference.
Buildings 14 00511 g006
Figure 7. Numerical simulation model.
Buildings 14 00511 g007
Figure 8. Free boundary case.
Buildings 14 00511 g008
Figure 9. Fixed boundary case.
Buildings 14 00511 g009
Figure 10. Intermediate boundary cases.
Buildings 14 00511 g010
Figure 11. The phase difference between incident and reflected waves with respect to the subsoil stiffness beneath the pile and velocity ratio.
Buildings 14 00511 g011
Figure 12. The magnitude ratio between incident and reflected waves with respect to the subsoil stiffness beneath the pile and velocity ratio.
Buildings 14 00511 g012
Figure 13. Comparison of the measured and exact Vp,bottom.
Buildings 14 00511 g013
Table 1. Material properties of numerical model.
P-Wave Velocity (m/s)Poisson’s Ratio and Unit Weight (kg/m3)
PileSurrounding SoilBottom Soil (or Rock)PileSurrounding SoilBottom Soil (or Rock)
3500150Free boundary condition0.2
and
2200 kg/m3
0.25
and
1800 kg/m3
0.25
and
1950 kg/m3
600
1500
2200
4000
6000
Fixed boundary condition
Table 2. Numerical simulation results (free and fixed boundary conditions).
Calculated Value
R θ d i f f
(Radian)
V p , b o t t o m V p , p i l e V p , b o t t o m
(m/s)
Free boundary condition0.98900.01019
Fixed boundary condition0.9813.14104364,000
Table 3. Numerical simulation results (intermediate boundary condition).
Boundary Type V p , b o t t o m
(m/s)
Calculated Value
R θ d i f f
(Radian)
V p , b o t t o m V p , p i l e V p , b o t t o m
(m/s)
Softer boundary6000.70100.175615
15000.40000.4291500
22000.22800.6292200
Stiffer boundary40000.0673.141.1444003
60000.2633.141.7145998
Disclaimer/Publisher’s Note: The statements, opinions and data contained in all publications are solely those of the individual author(s) and contributor(s) and not of MDPI and/or the editor(s). MDPI and/or the editor(s) disclaim responsibility for any injury to people or property resulting from any ideas, methods, instructions or products referred to in the content.