Article

Wind-Induced Vibration Analysis of a Pentagonal Three–Four Strut Hybrid Open-Type Cable Dome

1
College of Civil Engineering and Architecture, Nanchang Hangkong University, Nanchang 330063, China
2
Space Structures Research Center, Zhejiang University, Hangzhou 310058, China
3
NIDA Technology Company Limited, Hong Kong Science Park, Hong Kong, China
4
Beijing Institute of Architectural Design, Beijing 100045, China
*
Author to whom correspondence should be addressed.
Buildings 2024, 14(2), 461; https://doi.org/10.3390/buildings14020461
Submission received: 2 January 2024 / Revised: 29 January 2024 / Accepted: 5 February 2024 / Published: 7 February 2024
(This article belongs to the Special Issue Non-linear Behavior and Design of Steel Structures)

Abstract

:
Previous research has confirmed that the newly proposed pentagonal three–four strut hybrid cable dome exhibits superior static performance compared to traditional cable domes, though its dynamic characteristics still require further study. Cable domes are wind-sensitive structures, and the results of a wind-induced vibration analysis are beneficial for the selection and construction of cable domes. In this study, a finite element model of a new open-type cable dome with a span of 120 m is established. The MATLAB 2017a programming language is employed to simulate pulsating winds, followed by a nonlinear dynamic analysis to analyze the wind-induced vibrations of the structure. The reliability of the pulsating wind model is confirmed by comparing the simulated spectrum with the target spectrum. Moreover, a wind-induced vibration time history analysis is performed to obtain the node displacement and internal force of components wind vibration coefficients, aiding in the approximation of pulsating winds with average winds in a wind-resistant design. Furthermore, a parametric analysis is carried out, ranking nodes and components based on sensitivity. The result shows that the structure exhibits the strongest wind resistance when the rise–span ratio is f / l = 0.07 and the thickness–span ratio is h / l = 0.08 . Notably, the outer upper chord node, 2 a , and the inner lower chord hoop cable, H 1 , are identified as the most sensitive node and component within the structure, respectively. Overall, the structure demonstrates excellent wind resistance performance, and the maximum wind vibration coefficient value remains below 3.

1. Introduction

The cable dome structure originated from R. B. Fuller’s concept of “tensegrity” [1]. Building upon this idea, the renowned American architect Geiger introduced the Geiger-type cable dome, which marked the first practical application of this structure in engineering practice. Subsequently, Levy further contributed to the field by proposing the Levy-type cable dome [2].
Architects favor the cable dome design for its lightweight nature, aesthetic appeal, and other advantages. However, the Geiger-type cable dome suffers from insufficient out-of-plane stiffness, which leads to structural instability. Additionally, the dense grid division of the Levy-type cable dome poses challenges for membrane installation. To address these issues, scholars have extensively researched the topological innovation and structural performance optimization of cable dome structures. They have proposed multi-strut cable domes [3,4] and hybrid cable domes [5,6]. The newly proposed cable dome designs not only have a significantly improved mechanical performance, but also offer a more rational grid division, which provides the feasibility of rigid roof laying [7,8].
Large-span roofs, being lightweight structures, are highly susceptible to wind damage. Even a slight change in wind conditions can cause devastating damage to these roof structures. A notable example occurred in 2005 when the New Orleans Superdome was severely damaged during a hurricane. Moreover, in 2008, strong winds led to the collapse of the Reno/Virginia Peak dome [9]. Therefore, studying the dynamic response of structures to wind is of significant importance.
The dynamic response and structural damage mechanisms of large-span roofs under wind loads have been the highlights of research conducted both domestically and internationally. Several scholars focused on investigating structural dynamic characteristics. Wei et al. [10,11] conducted a wind-induced vibration analysis using the frequency domain and time history methods. Their results showed that the energy dissipation of the membrane during vibration is significant. Further, they successfully identified the sensitive components and weak parts of the structure that are susceptible to vibration. Li et al. [12] investigated the dynamic response of large-span domes under various levels of tornadoes. Wang and Chang [13] examined the impact of structural parameters on wind-induced vibration in beam string structures while considering the fluid–structure interaction. Sun et al. [14] indicated that the wind pressure characteristics of cable domes are influenced by the locations and number of openings. Zhang and Shan [15] employed the ARMA model to simulate pulsating wind and carried out a wind-induced vibration analysis while considering the fluid–structure effects. Wood et al. [16] measured membrane vibrations in a wind tunnel experiment, taking into account the fluid–structure effect to study the flexible membrane structure characteristics under changing fluid conditions. Park et al. [17] characterized the wind pressure distribution in open domes. Lai et al. [18] emphasized the importance of considering friction coefficients in a form-finding analysis of air-supported membrane structures.
Some scholars have employed various analysis methods to study structural wind vibration issues. Li et al. [19] conducted a wind-induced vibration parametric analysis of a single-layer reticulated shell in a wind tunnel. Their research findings indicate that wind vibration coefficients are influenced by wind angles. Zhou et al. [20] performed a time history analysis of a single-layer reticulated shell, focusing on the effects of geometric parameters, structural stiffness, and geometric parameters on wind vibration coefficients. Feng et al. [21] proposed wind vibration coefficients that consider the peak factor of the Weibull distribution. Shen et al. [22] introduced two methods to conduct a wind-induced vibration analysis, taking into account the fluid–structure effects. They also provided a simplified numerical simulation method. Wang et al. [23] verified the suitability of the FPM (Fourier Pseudo-excitation method) for conducting a wind-induced vibration analysis of large-span roofs. Jing et al. [24] calculated the structural wind vibration coefficients using the BP (backpropagation) neural network algorithm. Their research examined the effects of average wind speed and membrane tension on the wind vibration coefficients. Qiu [25] used the NSGAII (non-dominated sorting genetic algorithm II) to optimize the structure’s wind resistance performance. Kim et al. [26] divided the dome into two zones. They proposed positive and negative peak pressure coefficients based on the experimental results. Kiani and Efazati [27,28] utilized Eringen’s non-local elasticity theory to investigate the non-local vibrations and stability issues of nanocables, offering a fresh perspective for structural vibration analysis.
The pentagonal three–four strut open-type cable dome structure abandons the traditional cable dome concept of “strut islands in a sea of cables”, instead adopting a mixed strut philosophy for innovative structural topology. This structure offers superior mechanical performance and a more flexible grid division, facilitating the laying of rigid roofs. As the structure is sensitive to wind, conducting a wind vibration analysis on it is extremely necessary. This paper conducts a wind-induced vibration time history analysis to study the characteristics of wind-induced vibration and calculate the corresponding wind vibration coefficients for a dome structure. In addition, parametric analyses are carried out to investigate the effects of the rise–span ratio, thickness–span ratio, and damping factor on the wind-induced vibration coefficients. Furthermore, the sensitivity of different nodes and components is ranked. Overall, this research provides an essential reference for the design of wind-resistant structures and for the practical application of the pentagonal three–four strut open-type cable dome structure.

2. Structural Model and Analysis Method

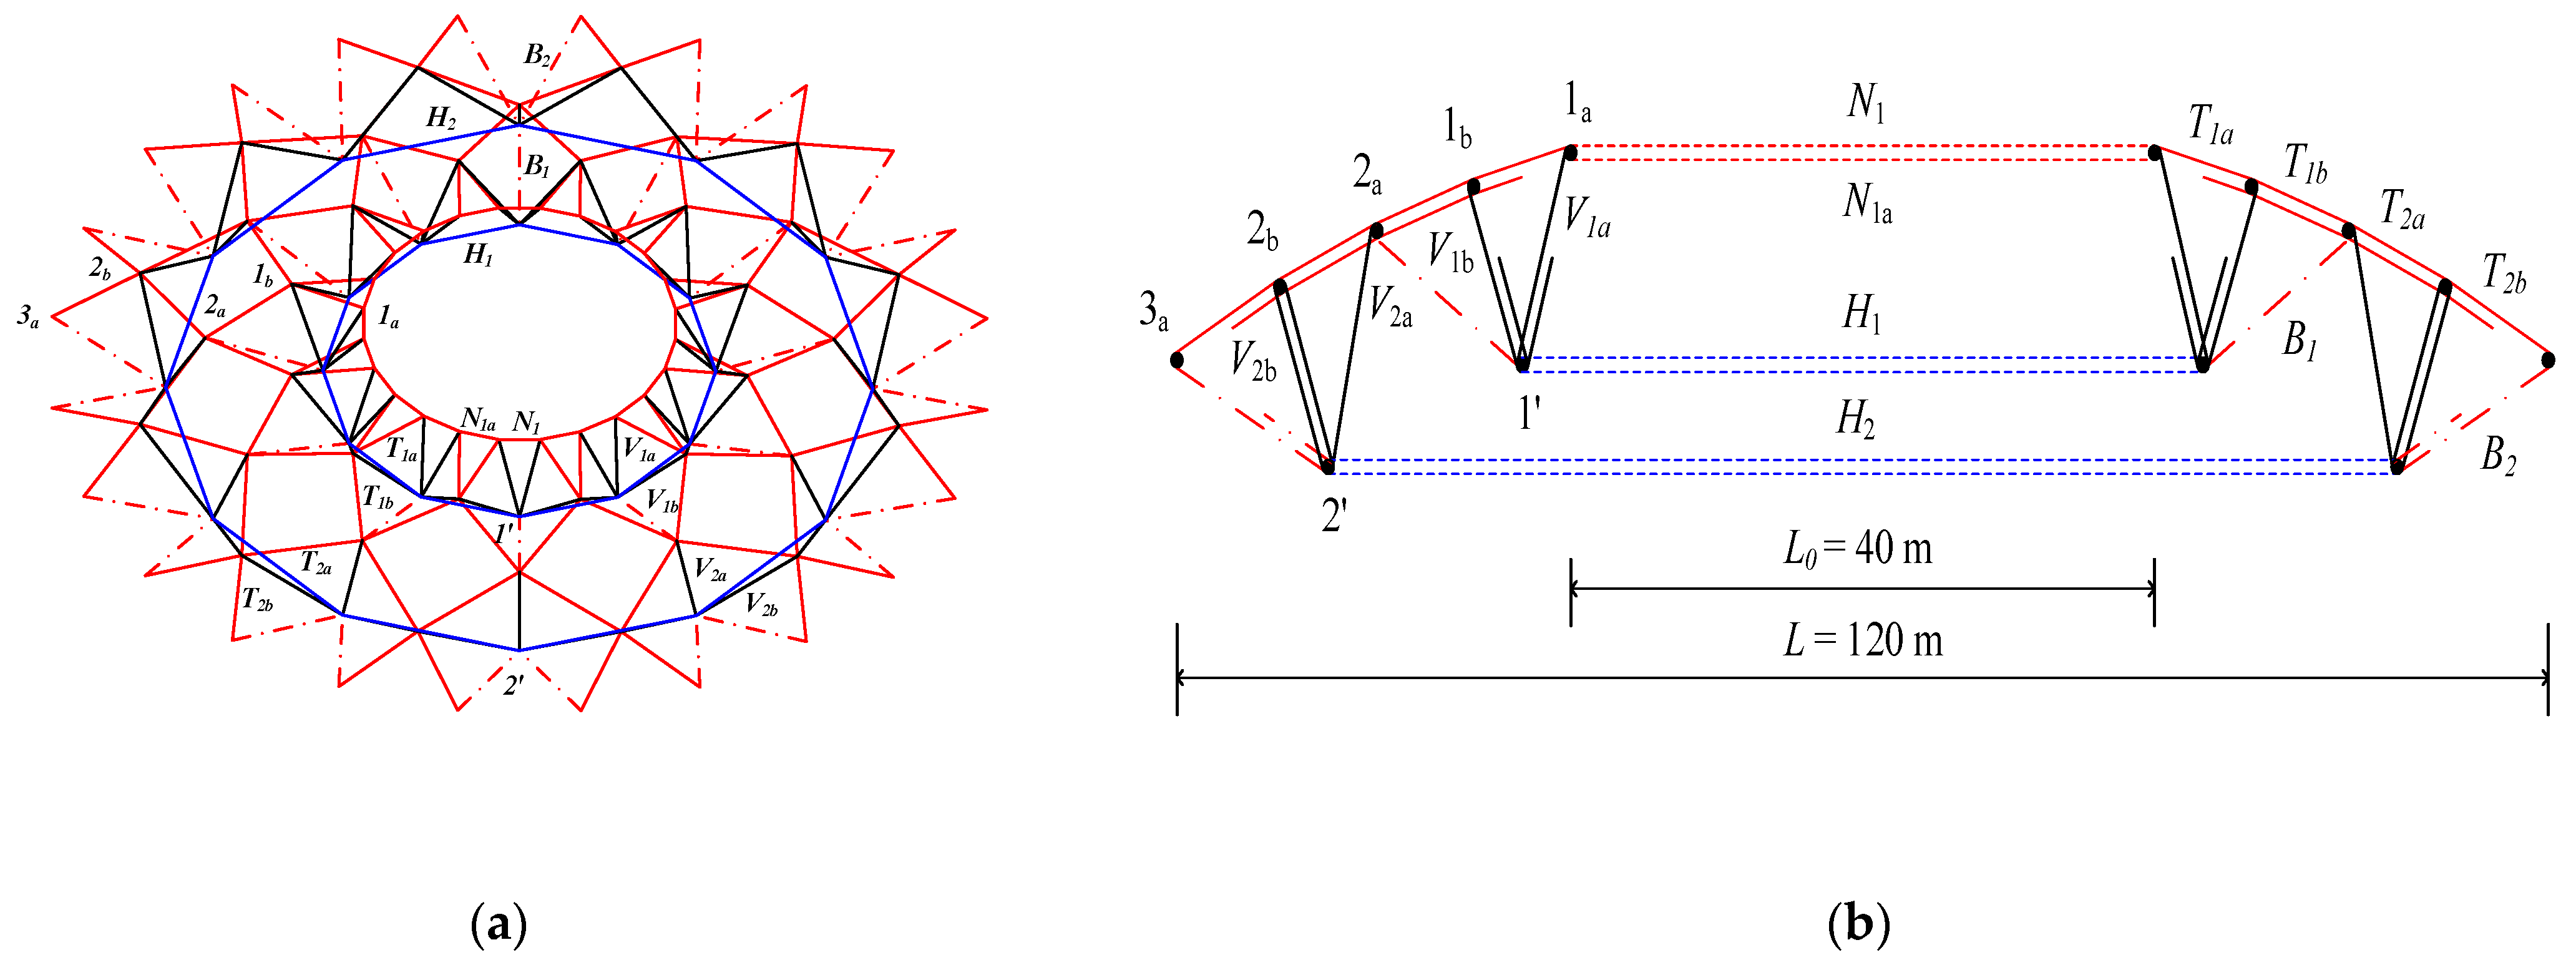
2.1. Structural Model

A finite element model of the cable dome structure with a span of 120 m and an inner opening of 40 m was constructed. The rise–span ratio and thickness–span ratio of the structure are both 0.07. The schematic diagram of the model is shown in Figure 1. The cable dome consists of ten types of cables and four types of struts.
In the finite element model, the compression struts are simulated using the Link 180 element, while the tension cables are simulated using the Link 10 element. The struts and cables are made of seamless steel tubes and steel strands, respectively. The material properties for these components are shown in Table 1. The initial pre-stress for each component is determined by satisfying the node equilibrium equations. The cross-sections for the components are selected based on the initial pre-stress levels, ensuring that the initial pre-stress levels of the cables do not exceed 40% of their breaking force. Additionally, the selection of the struts’ cross-sections follows the principle of the slenderness ratio. The cross-sections and initial pre-stress levels of the components are shown in Table 2. It is assumed that the outer hoop nodes are hinged to the support hoop beam.

2.2. Analysis Method

2.2.1. Fundamental Theory of Wind Load Simulation

1.
Basic Assumption
Before conducting a dynamic analysis, the following basic assumptions are clarified:
(1)
The average wind profile follows the exponential law model.
(2)
Under the quasi-steady-state assumption, the wind speed at each node is considered constant within each time step.
(3)
The wind direction remains constant in the wind field where the structure is located.
2.
Power Spectral Density of Pulsating Wind
Power spectra play crucial roles in the structural wind-induced vibration analysis. These spectra can be categorized into two types: those with spectral densities that remain constant across the height, exemplified by the Davenport and Harris spectra, and those with spectral densities that decrease with the height, such as the Kaimal and Simiu spectra. Among the various options, due to the ease of computing, the Davenport spectrum has been widely adopted in many national standards. This paper also adopts the Davenport spectrum for the wind speed time history simulation.
The Davenport spectrum, proposed by the renowned wind engineering expert George V. Davenport in the 1950s, has been widely applied in wind-induced vibration and structural dynamic response analyses. The empirical formula for the Davenport spectrum is as follows:
S v ( n ) = 4 k v ̄ 10 2 x 2 n ( 1 + x 2 ) 4 / 3
x = 1200 n / v ̄ 10 2
S v ( n ) represents the power spectral density, and n represents the frequency of the pulsating wind. v ̄ 10 stands for the average wind speed at a height of 10 m. The coefficient k is terrain-dependent.
3.
Transformation of Wind Velocity to Wind Pressure
The wind load comprises both the pulsating wind load and the average wind load components. The wind load can be calculated using the following formula:
p ( t ) = 1 2 C p ρ A V ( t ) 2
In Equation (3), C p represents the wind pressure distribution coefficient; ρ denotes the air density, which is assumed to be 1.2   kg / m 3 for this analysis; A stands for the wind pressure acting area; and V ( t ) represents the sum of the mean wind velocity v ̄ and pulsating wind velocity u ˙ ( t ) . Considering the effect of the fluid–structure interaction, V ( t ) can be expressed using the following equation:
V ( t ) = v ̄ + v ( t )   u ˙ ( t )
By simultaneously solving Equations (3) and (4), while neglecting higher-order minor terms, the total wind load can be represented as follows:
p ( t ) = C p A [ 1 2 v 2 + v ̄ v ( t )   v u ˙ ( t ) ]
In this study, the wind speed time history is simulated using the harmonic superposition method. Specifically, the node wind speed time history is simulated by superposing multiple harmonic components with different frequencies. Subsequently, the simulated wind speed time history is transformed using the Bernoulli transformation to obtain the load time history. Finally, a wind-induced vibration analysis is performed based on the obtained load time history.

2.2.2. Dynamic Analysis Method

1.
Dynamic Equation
The wind-induced vibration analysis follows the principles of structural dynamics, and the governing structural dynamic equation is as follows:
[ M ] u ¨ ( t ) + [ C + F C ] u ˙ ( t ) + [ K ] u ( t ) = [ Q ] p ( t ) + [ R ] u ( t )
In dynamic Equation (6), [ M ] denotes the mass matrix, [ C ] represents the damping matrix, [ F C ] stands for the aerodynamic damping matrix, and [ K ] is the structural stiffness matrix. [ Q ] is the load indicator vector, which distributes the pulsating wind load p ( t ) across the nodes. u ( t ) ,   u ˙ ( t ) , and u ¨ ( t ) denote the displacement, velocity, and acceleration vectors, respectively. [ R ] represents the nonlinear terms that account for the geometric nonlinearity and large deformation characteristics of the structure. It is worth noting that aerodynamic damping is correlated with the motion state of the structure, and material damping can be employed to simulate aerodynamic damping for a transient analysis. Furthermore, geometric nonlinearity is primarily manifested during the phase when the structure experiences cable slack. When cable slack has not occurred, the structure can be treated with linear elasticity [29].
2.
Solving the Dynamic Equation
This paper employs the Newmark- β method, a direct integration method, to solve the dynamic equations. It establishes a recursive formula for the structural state vector. Equations (7) and (8) express the displacement–time relationship for a given time interval:
{ u t + Δ t } = { u t } + { u t } Δ t + [ ( 1 2 η ) { u ¨ t } + η { u ¨ t + Δ t } ] Δ t 2
{ u ˙ t + Δ t } = { u ˙ t } + [ ( 1 γ ) { u ¨ t } + γ { u ¨ t + Δ t } ] Δ t
The parameters η and γ can be adjusted to meet the stability requirements and integration accuracy. u t and u t + Δ t represent displacement vectors at times t and t + Δ t , respectively. By substituting Equations (7) and (8) into Equation (6), dynamic equilibrium Equation (9) at any given time is expressed as follows:
[ M ] u ¨ ( t + Δ t ) + [ C + F c ] u ˙ ( t + Δ t ) + [ K ] u ( t + Δ t ) = [ Q ] p ( t + Δ t ) + [ R ] u ( t + Δ t )
3.
Damping Matrix
In a wind-induced vibration time history analysis, an approximate Rayleigh damping model is employed. In this paper, the damping ratios ξ i and ξ j are set to 0.03. Parameters α and β can be obtained using Equation (11). The Rayleigh damping equation is expressed as follows:
[ C ] = α [ M ] + β [ K ]
α = 2 ω i ω j ζ i ω j ζ j ω i ω j 2 ω i 2 β = 2 ζ j ω j ζ i ω i ω j 2 ω i 2

3. Simulating Wind Fields and Modal Analysis

3.1. Simulating Wind Fields
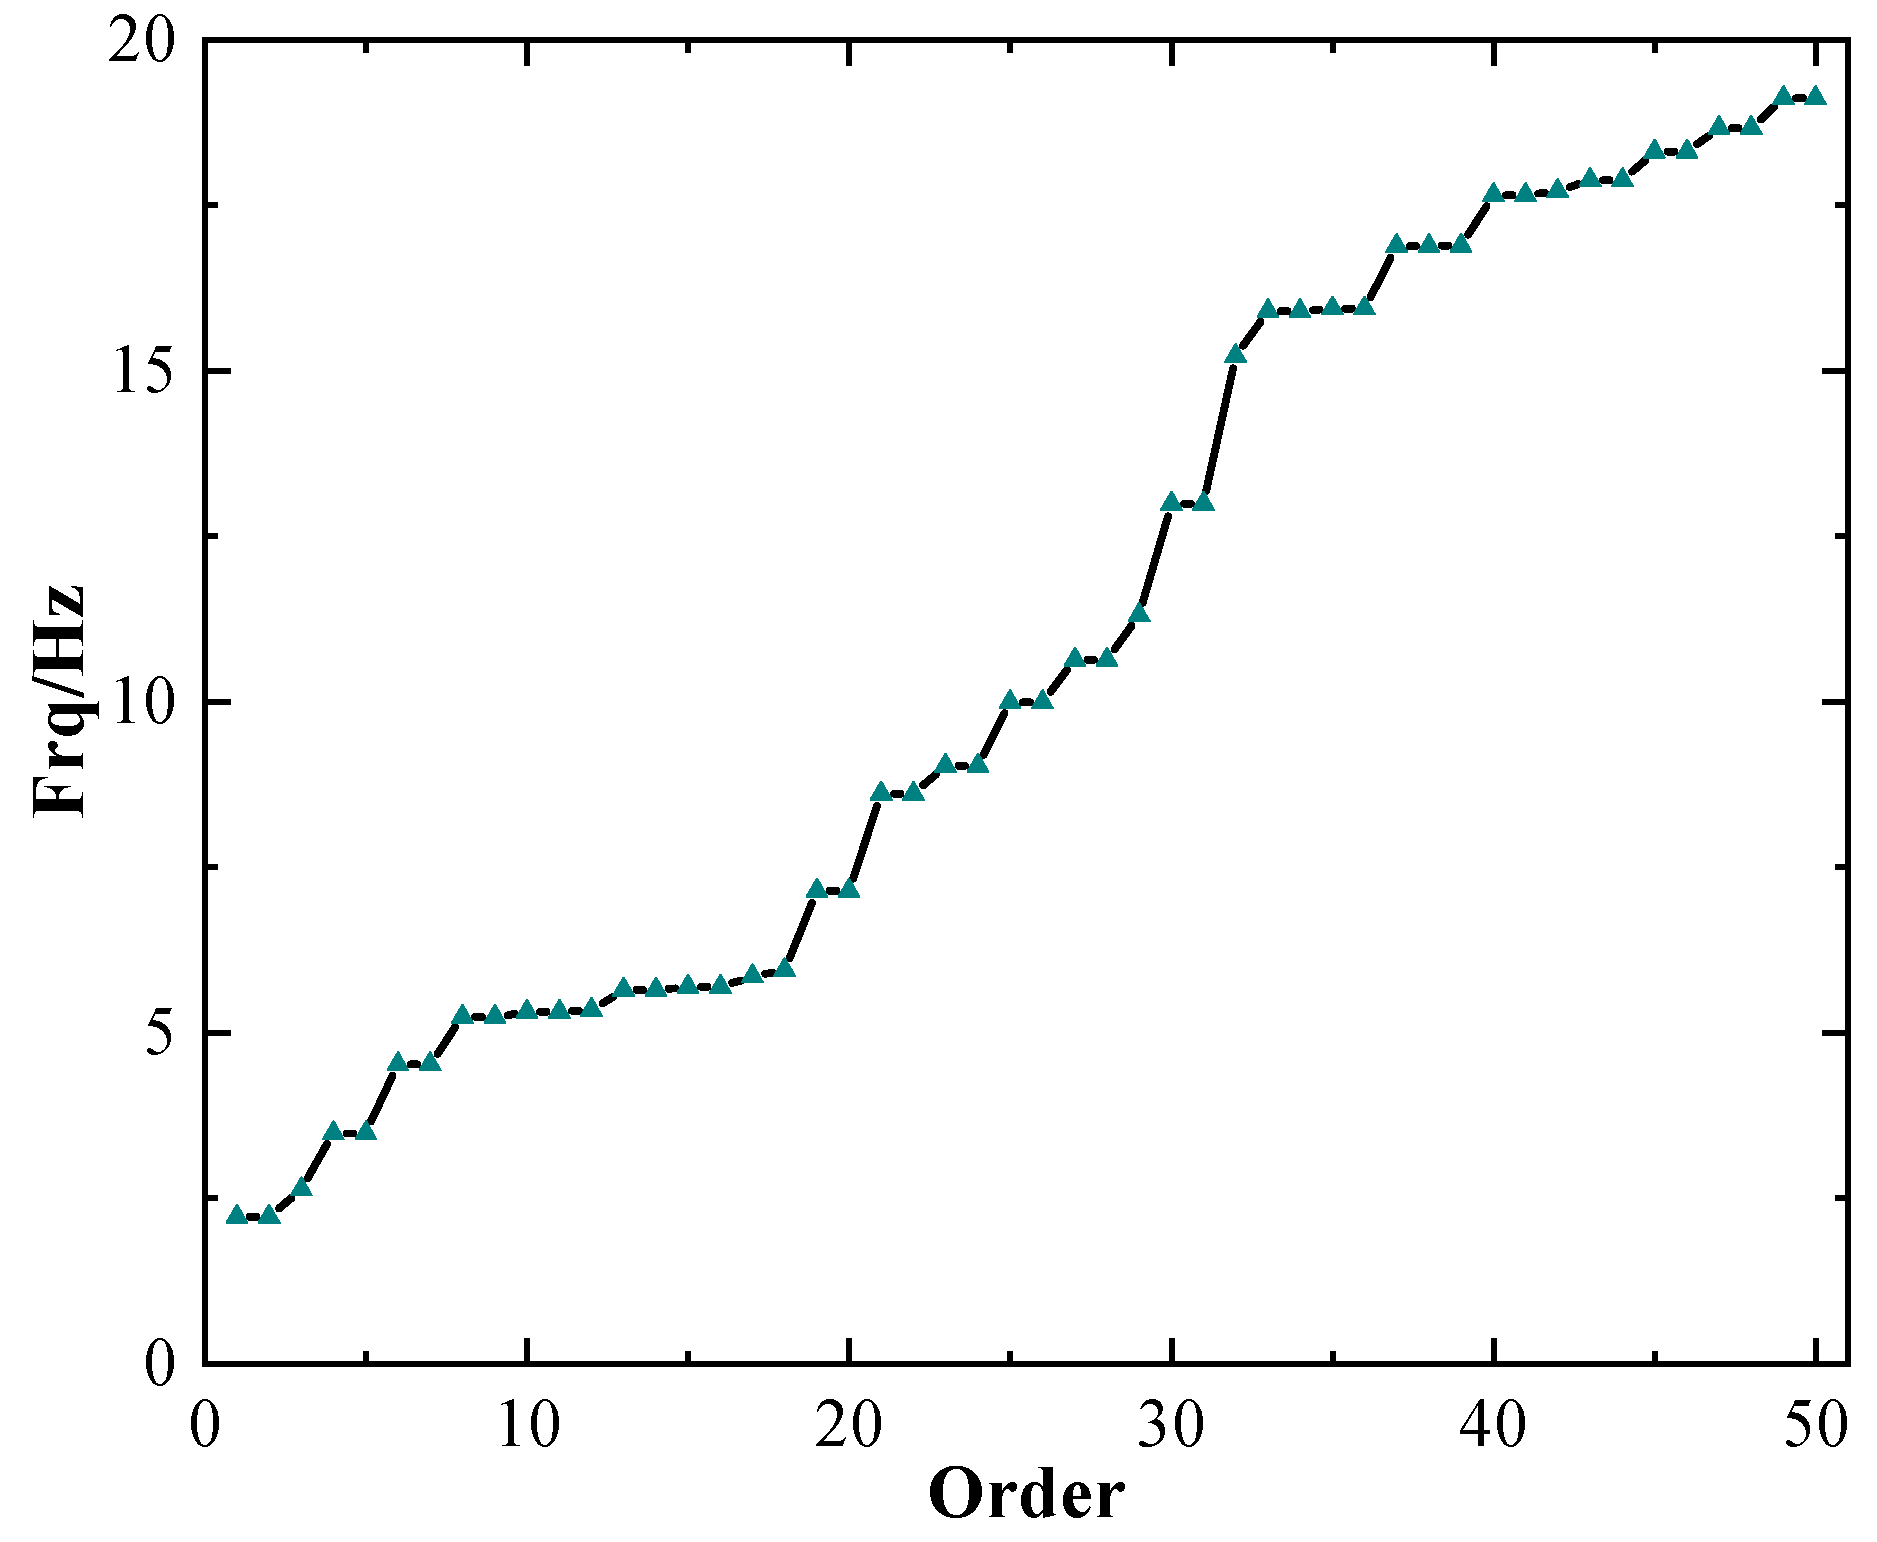
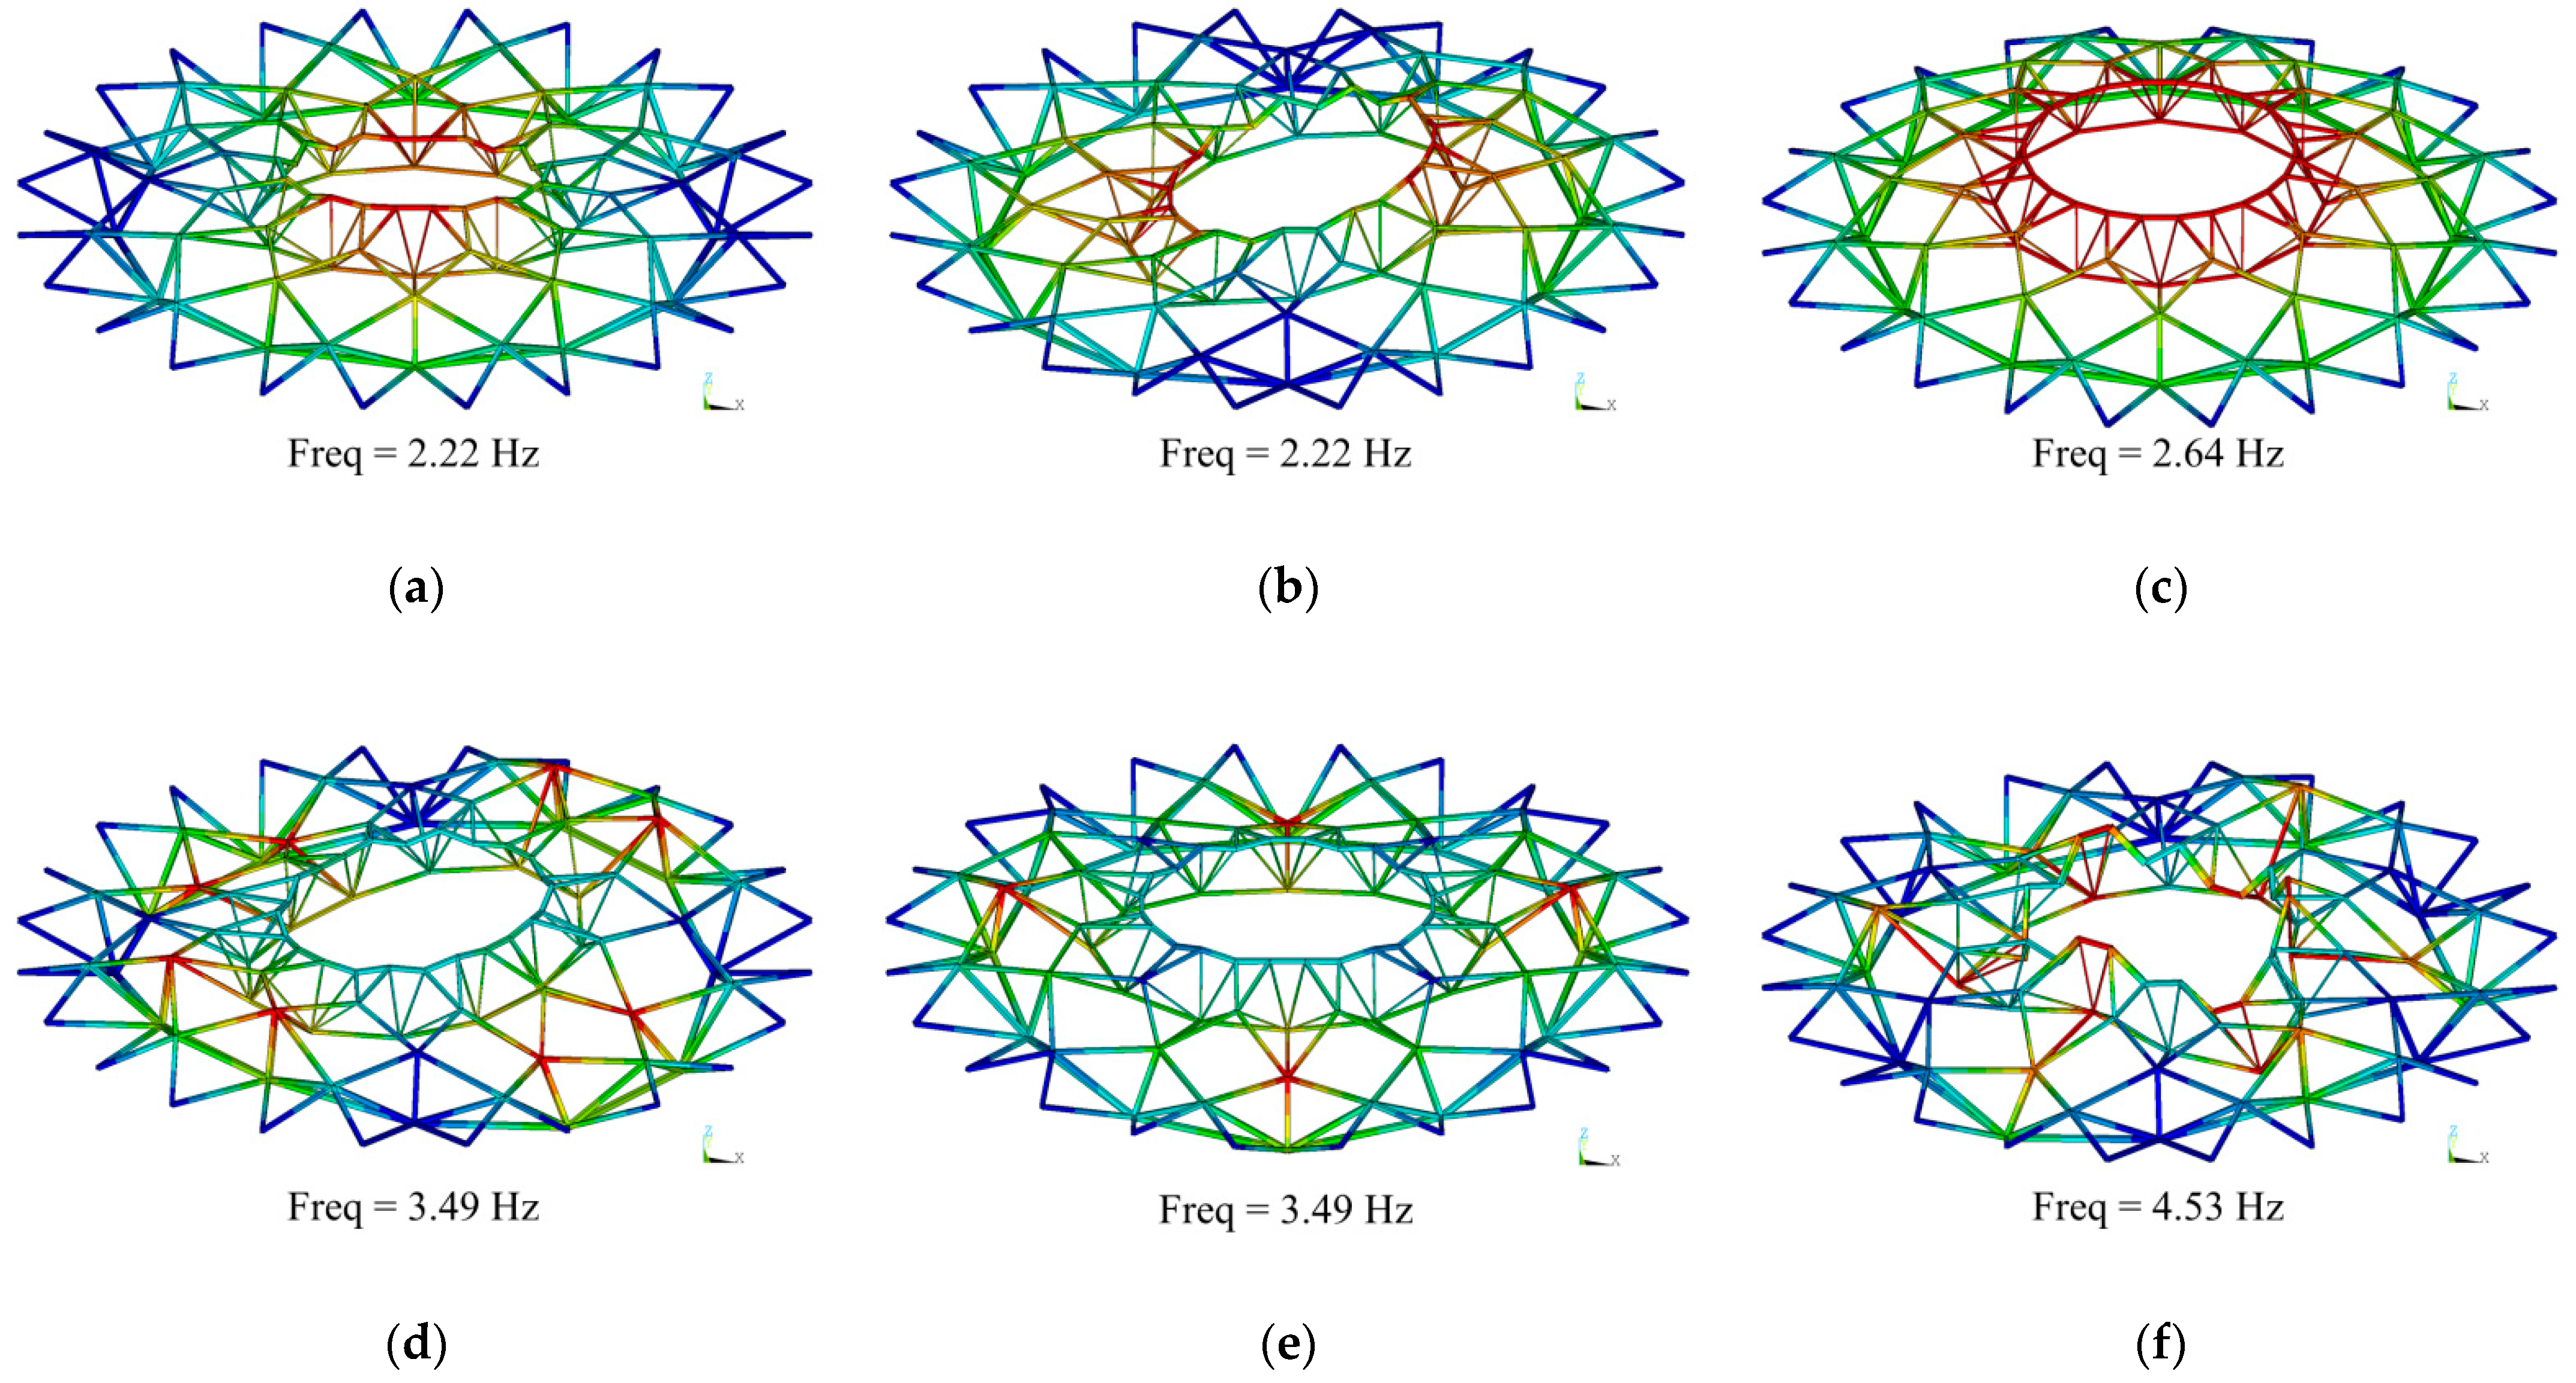
This paper simulates wind fields using the Matlab programming language. The standard wind pressure of the wind field ω 0 is equal to 0.45   kN / m 2 . The terrain category is classified as Class A , and the ground roughness coefficient k is 0.00129. The simulated horizontal power spectral density function at a height of 30 m is shown in Figure 2. The statistical characteristics of the simulation results closely resemble the Davenport spectrum. This indicates the reliability of the stochastic process simulation theory employed in this paper. Furthermore, the time history of the horizontal pulsating wind speed at a height of 30 m is shown in Figure 3.

3.2. Modal Analysis

A modal analysis serves as the foundation for studying the dynamic characteristics of various structures. The vibration modes, characteristic frequencies, and damping coefficients of the structure can be obtained through a modal analysis. Additionally, vibration modes provide insights into the dynamic properties of the structure.
The first 50 modal frequencies of the structure are shown in Figure 4. Notably, the first 18 orders of natural vibration frequencies are densely distributed, with closely spaced adjacent modal frequencies. However, beyond the 18th modal, a sudden increase in frequencies is observed. Moreover, due to the symmetry of the structure, identical frequency groups emerge. Figure 5a–f display the first six modals of natural vibration of the cable dome.

4. Wind-Induced Vibration Analysis

4.1. Displacement Time History Analysis

Table 3 displays the maximum node displacements in the X-, Y-, and Z-directions obtained from the wind-induced vibration analysis. The results show that pulsating wind has a minor effect on the structural displacements in the X - and Y -directions. However, the primary displacements are predominantly observed in the Z -direction, with a maximum displacement of 12 mm. Figure 6a identifies the nodes A, B, C, and D as the locations with the maximum displacements in each direction. By plotting the displacement time history curves for each node and comparing them with the results under a average wind loading, the impact of pulsating wind can be observed. Figure 7a–d demonstrate that the displacements induced by pulsating wind oscillate both above and below the results obtained under an average wind loading. The analysis results further confirm the accuracy of the time history analysis.

4.2. Internal Force Time History Analysis

The extreme internal force components are shown in Figure 6b. Similarly, the extreme internal forces of the members are extracted during the time history analysis, and the corresponding internal force time history curves are plotted. Figure 8a–c show the time history curves of the cable axial forces and support reaction forces under wind-induced vibrations. The internal force time history curves demonstrate a regular pattern, further validating the accuracy of the model.
Among the ten types of cables, it is observed that the outer hoop cable, H 2 , experiences the largest fluctuations in internal forces. Similarly, among the four types of struts, the inner hoop strut, V 1 a , exhibits the greatest variations in internal forces. Table 4 presents the extreme values of the wind-induced vibration response.

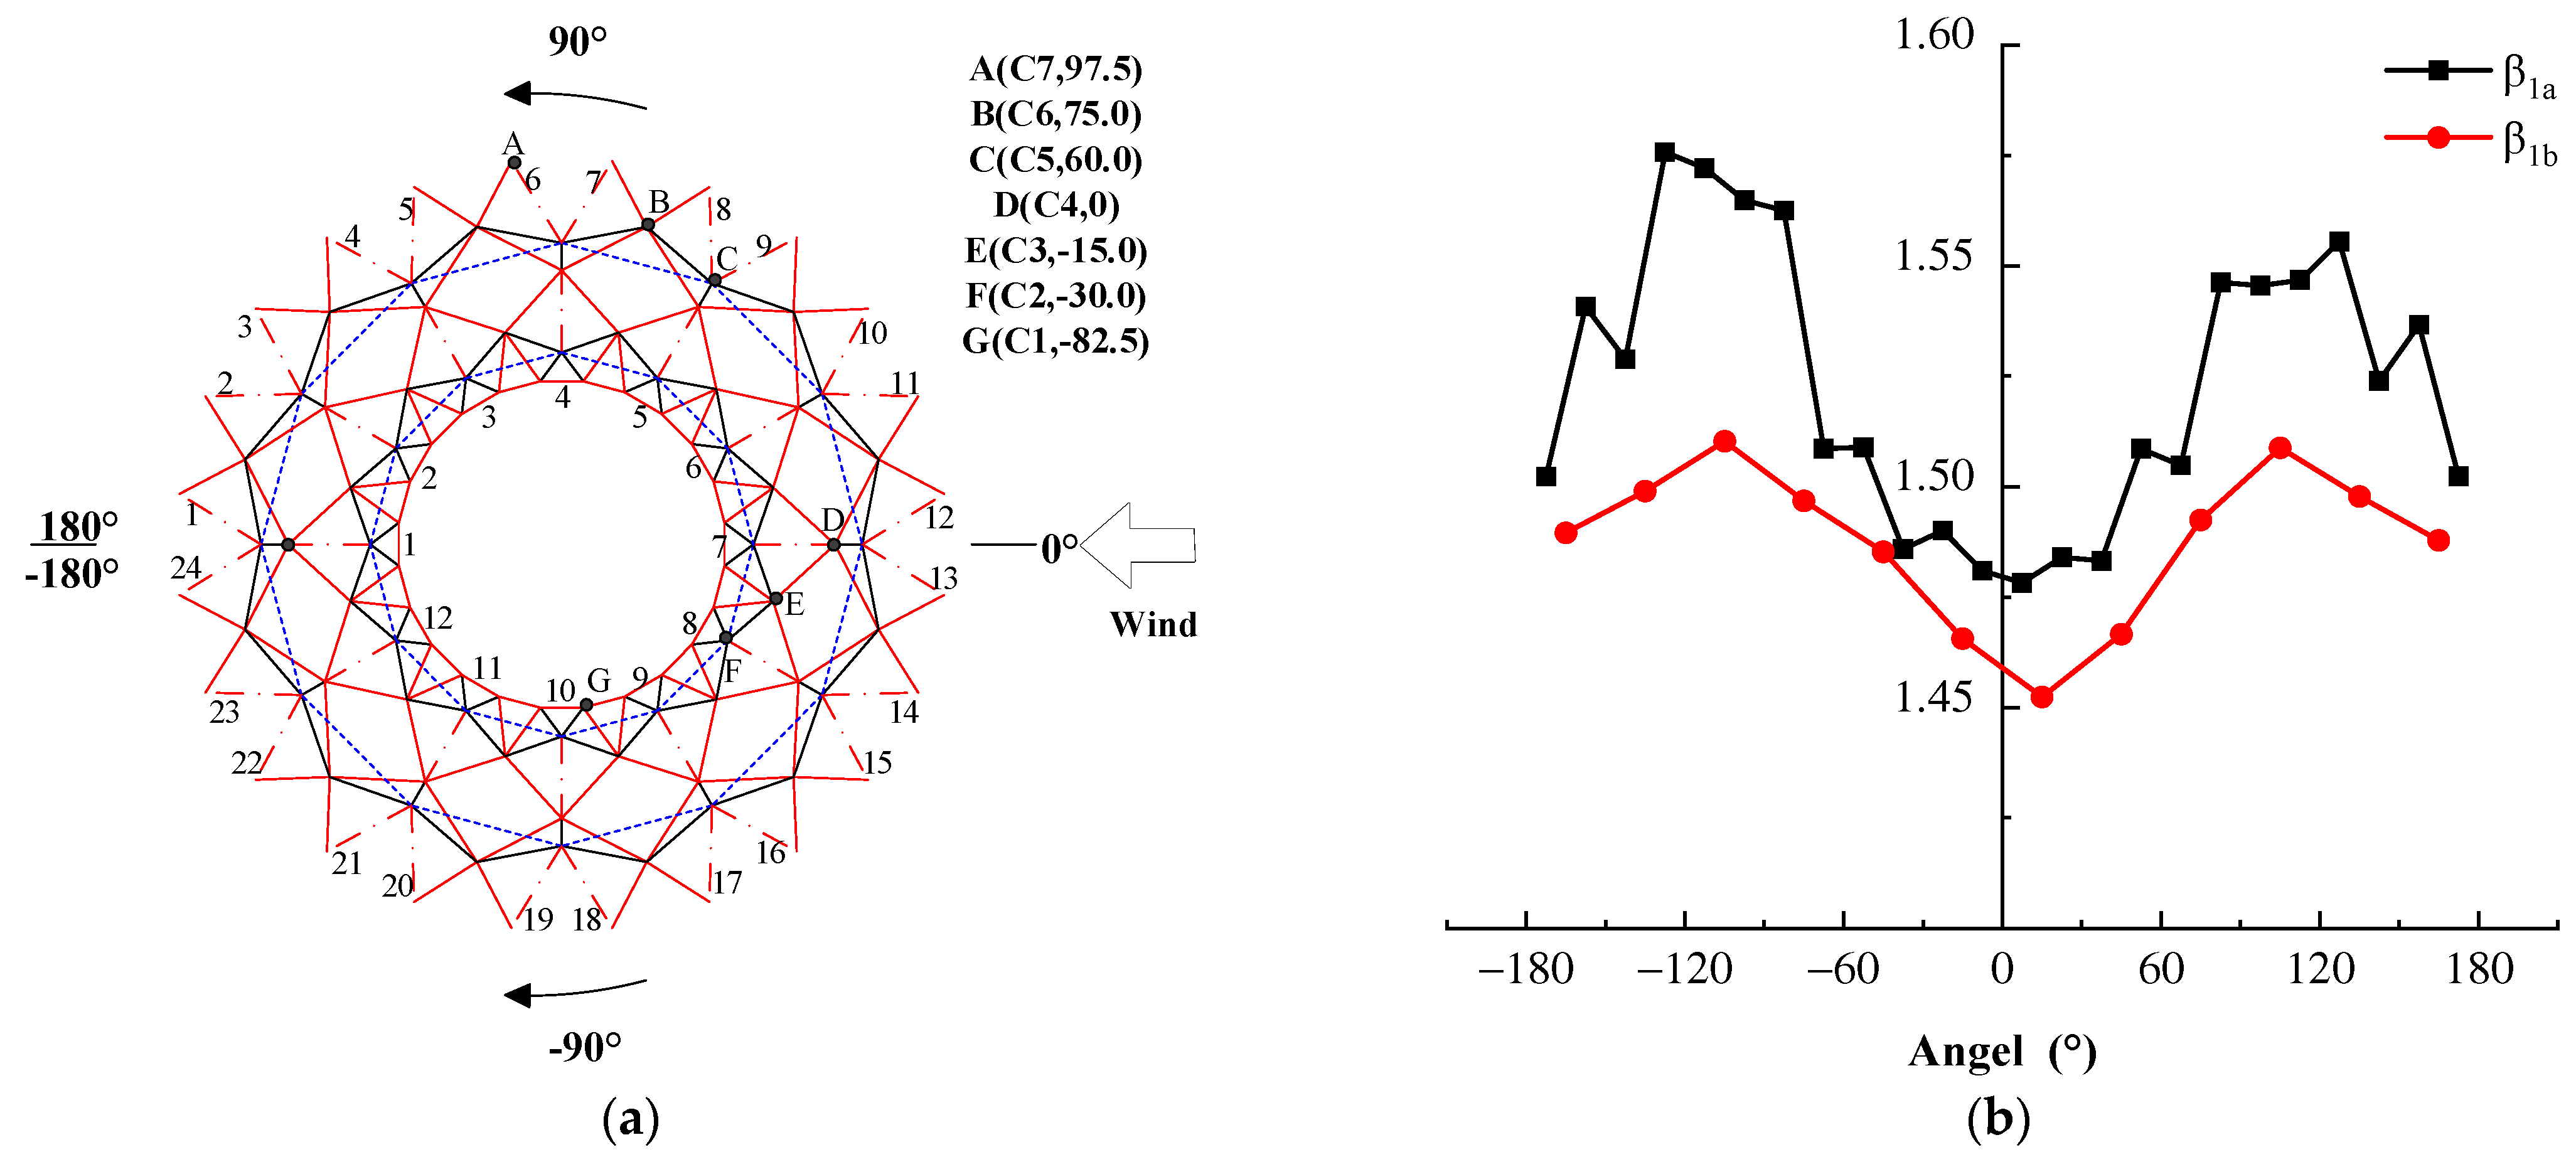
4.3. Structural Wind Vibration Coefficient

The wind vibration coefficient provides a statistical measure of a structure’s sensitivity to wind-induced vibrations. In a structural wind-resistant design, these coefficients are employed to magnify the average wind load to consider the impact of pulsating wind loads on the structure.

4.3.1. Structural Wind Vibration Coefficient Calculation

In wind engineering research for tall or towering structures, wind vibration coefficients are typically obtained by back-calculating from the structural responses to loads. However, the cable dome, being a doubly nonlinear structure, poses challenges in deriving wind vibration coefficients directly from structural responses. Hence, displacement and internal force wind vibration coefficients are typically derived from the structural responses using the following equations:
β u i = 1 + μ σ u i U ̄ σ i 2 = 1 n ( U i U ̄ i ) n
β s i = 1 + μ σ s i S ̄ σ i 2 = 1 n ( S i S ̄ i ) n
U ̄ i   ( S ̄ i ) represents the average wind node displacement (or element force) response, U i   ( S i ) represents the pulsating wind node displacement (or element force) response, σ u i   ( σ s i ) represents the root mean square (RMS) of the node displacement (or force) response, μ represents the peak factor (assumed to be 3.5 in this paper), and n represents the number of subdivisions for the pulsating wind time history.

4.3.2. Displacement Wind Vibration Coefficient

The structure comprises seven types of nodes (upper chord nodes 1 a , 1 b , 2 a , 2 b , and 3 a ; lower chord nodes 1   a n d   2 ). Node 3 a is a support node whose displacement wind vibration coefficient is not computed. Each category of nodes is uniformly distributed in a concentric circle. The naming convention is based on the angle between the corresponding concentric circle and the line connecting the node to the center of the circle with respect to the wind direction, as shown in Figure 9a. For instance, point A in the figure is represented as (C7, 97.5).
The displacement wind vibration coefficients for each node are depicted in Figure 9b–d. Among the upper chord nodes, the wind vibration coefficients are observed to be lower in the outer hoop nodes compared to the inner hoop nodes. Additionally, the windward nodes’ wind vibration coefficients are lower than those of the leeward nodes within the same node category. For example, the windward node (C4, 0) exhibits slightly lower displacement wind vibration coefficients compared to the corresponding leeward node (C4, 180).

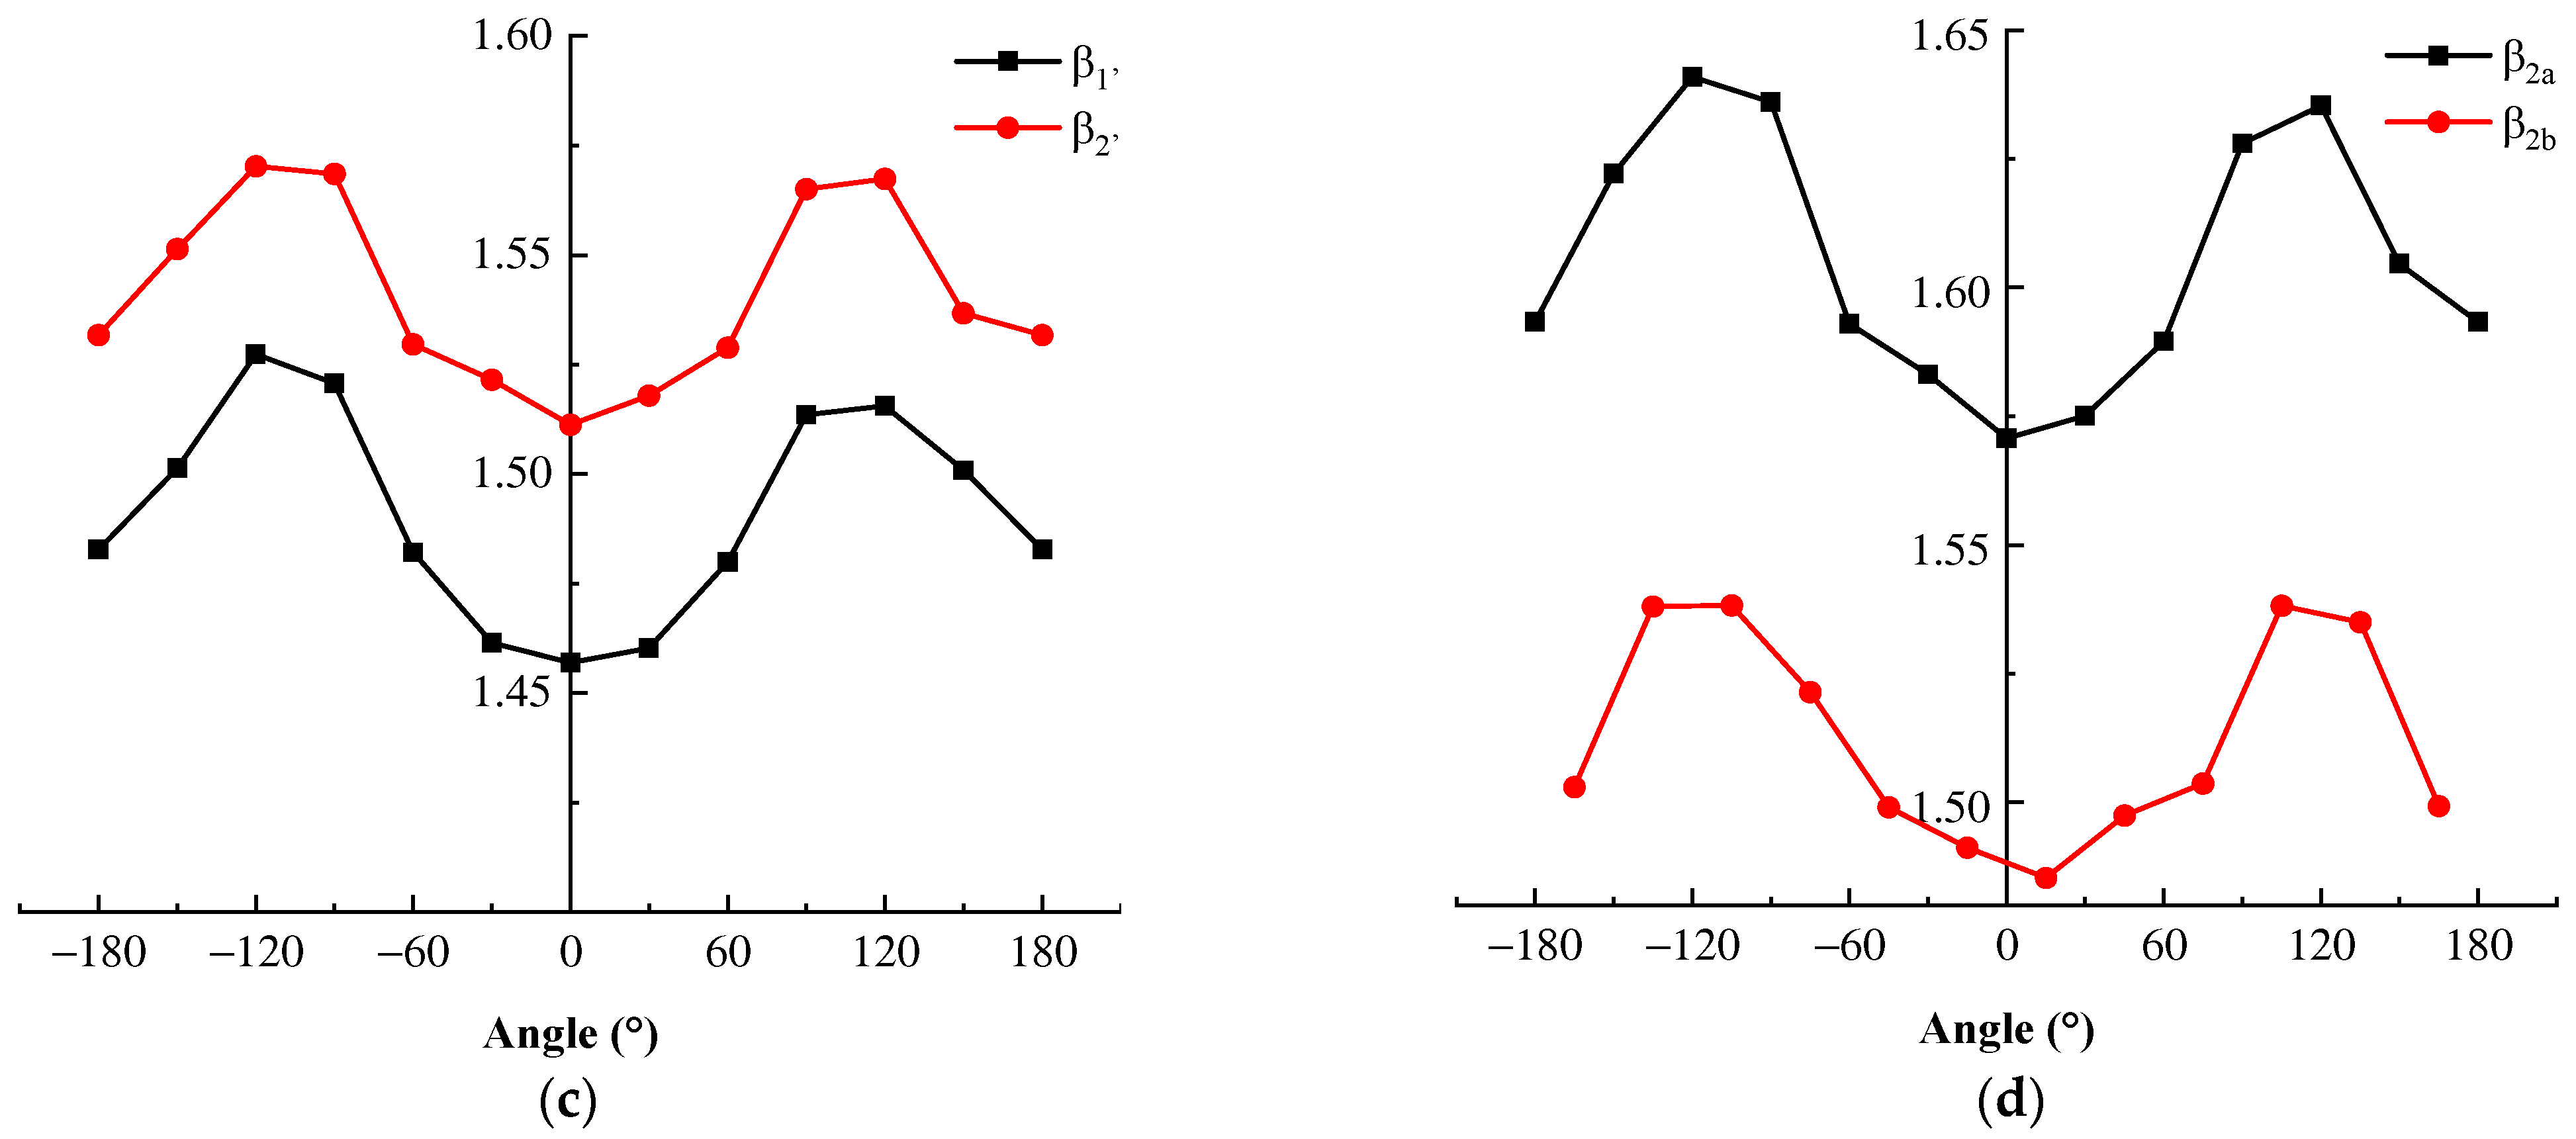
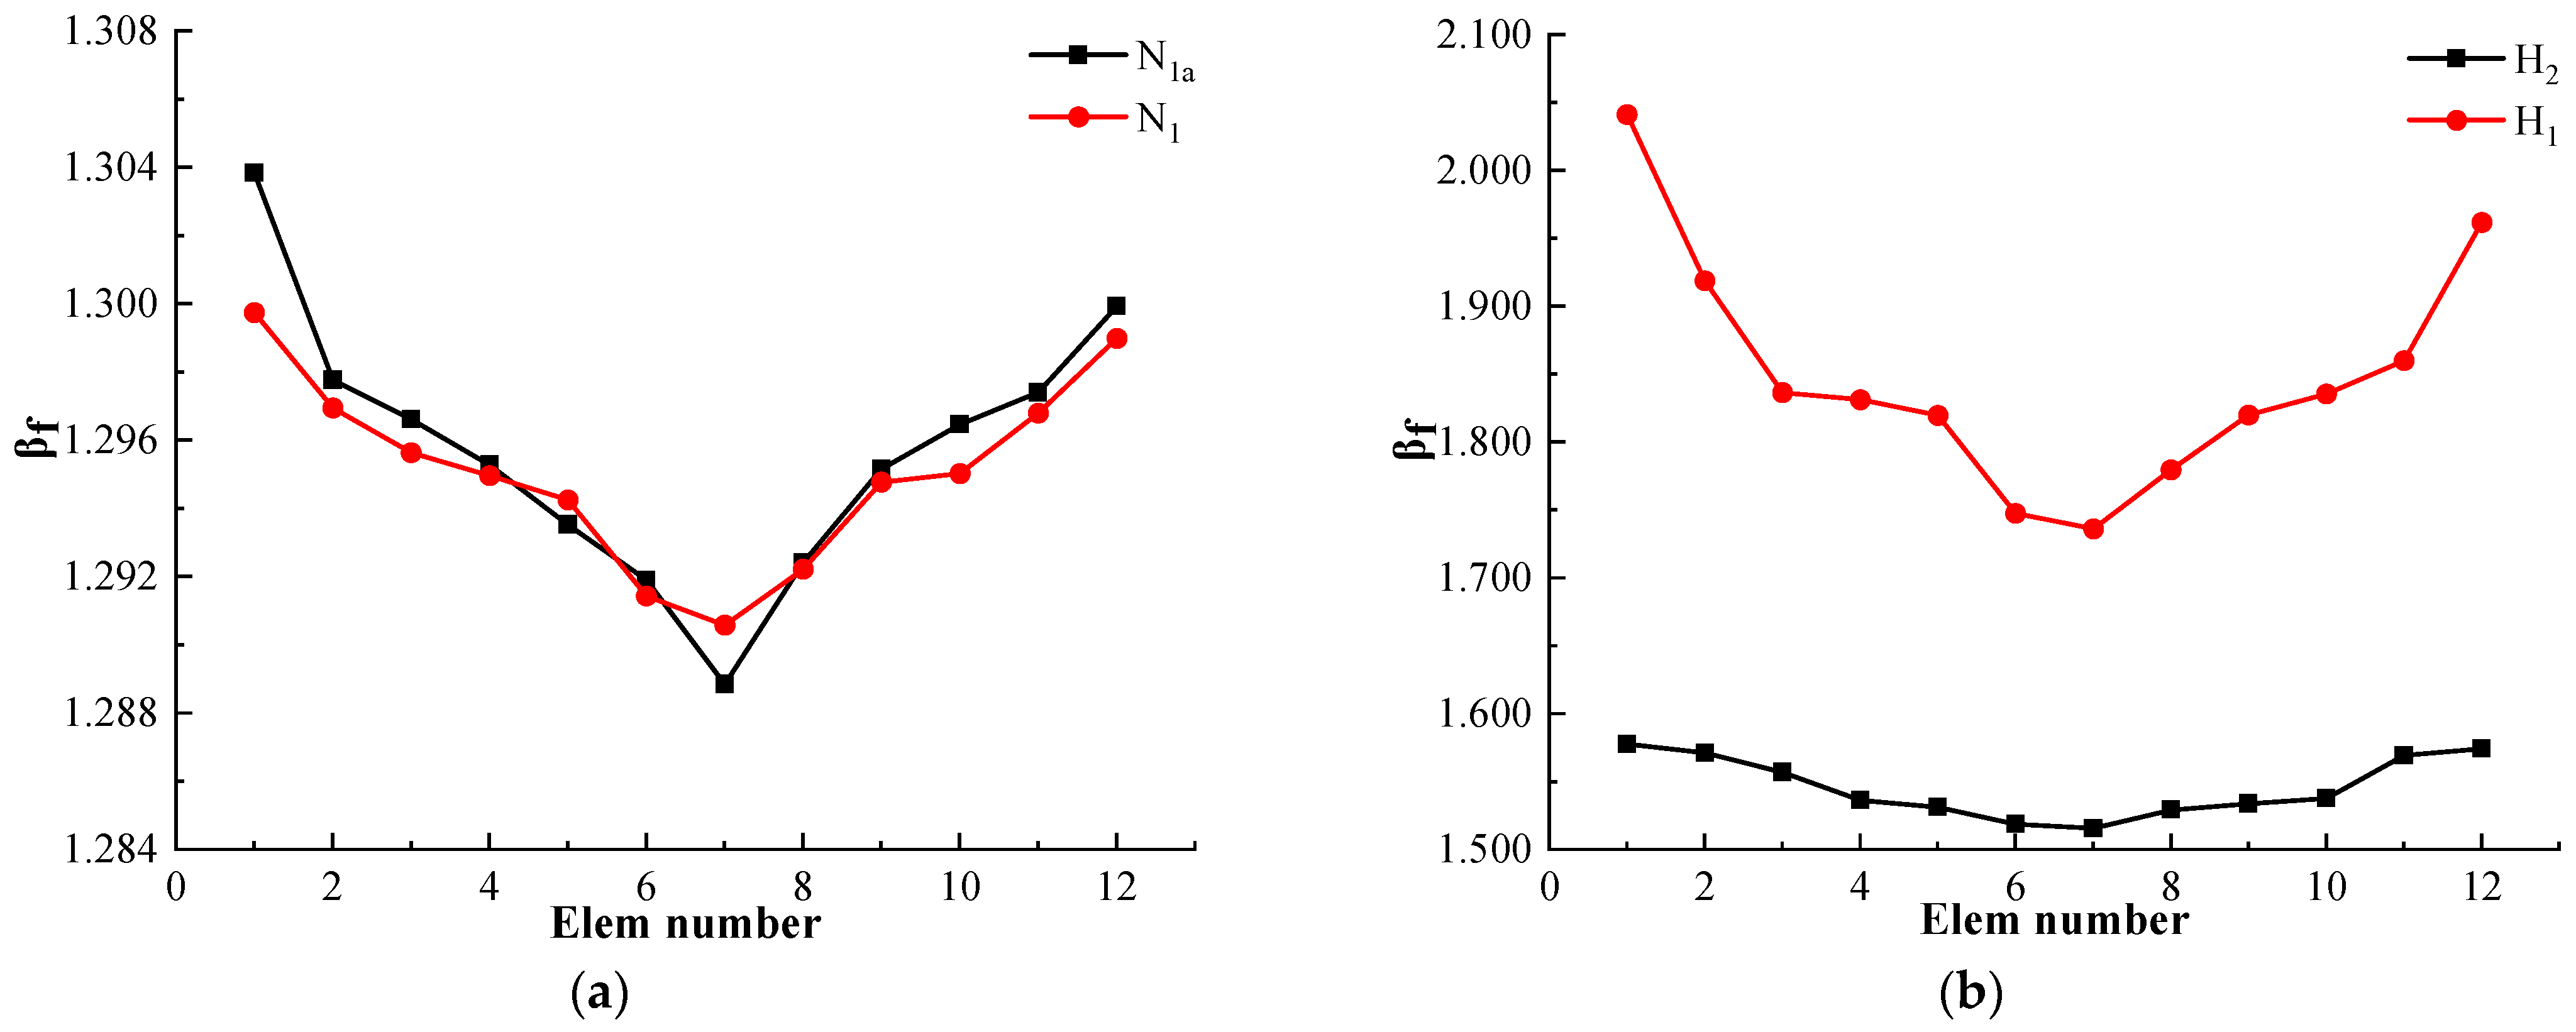
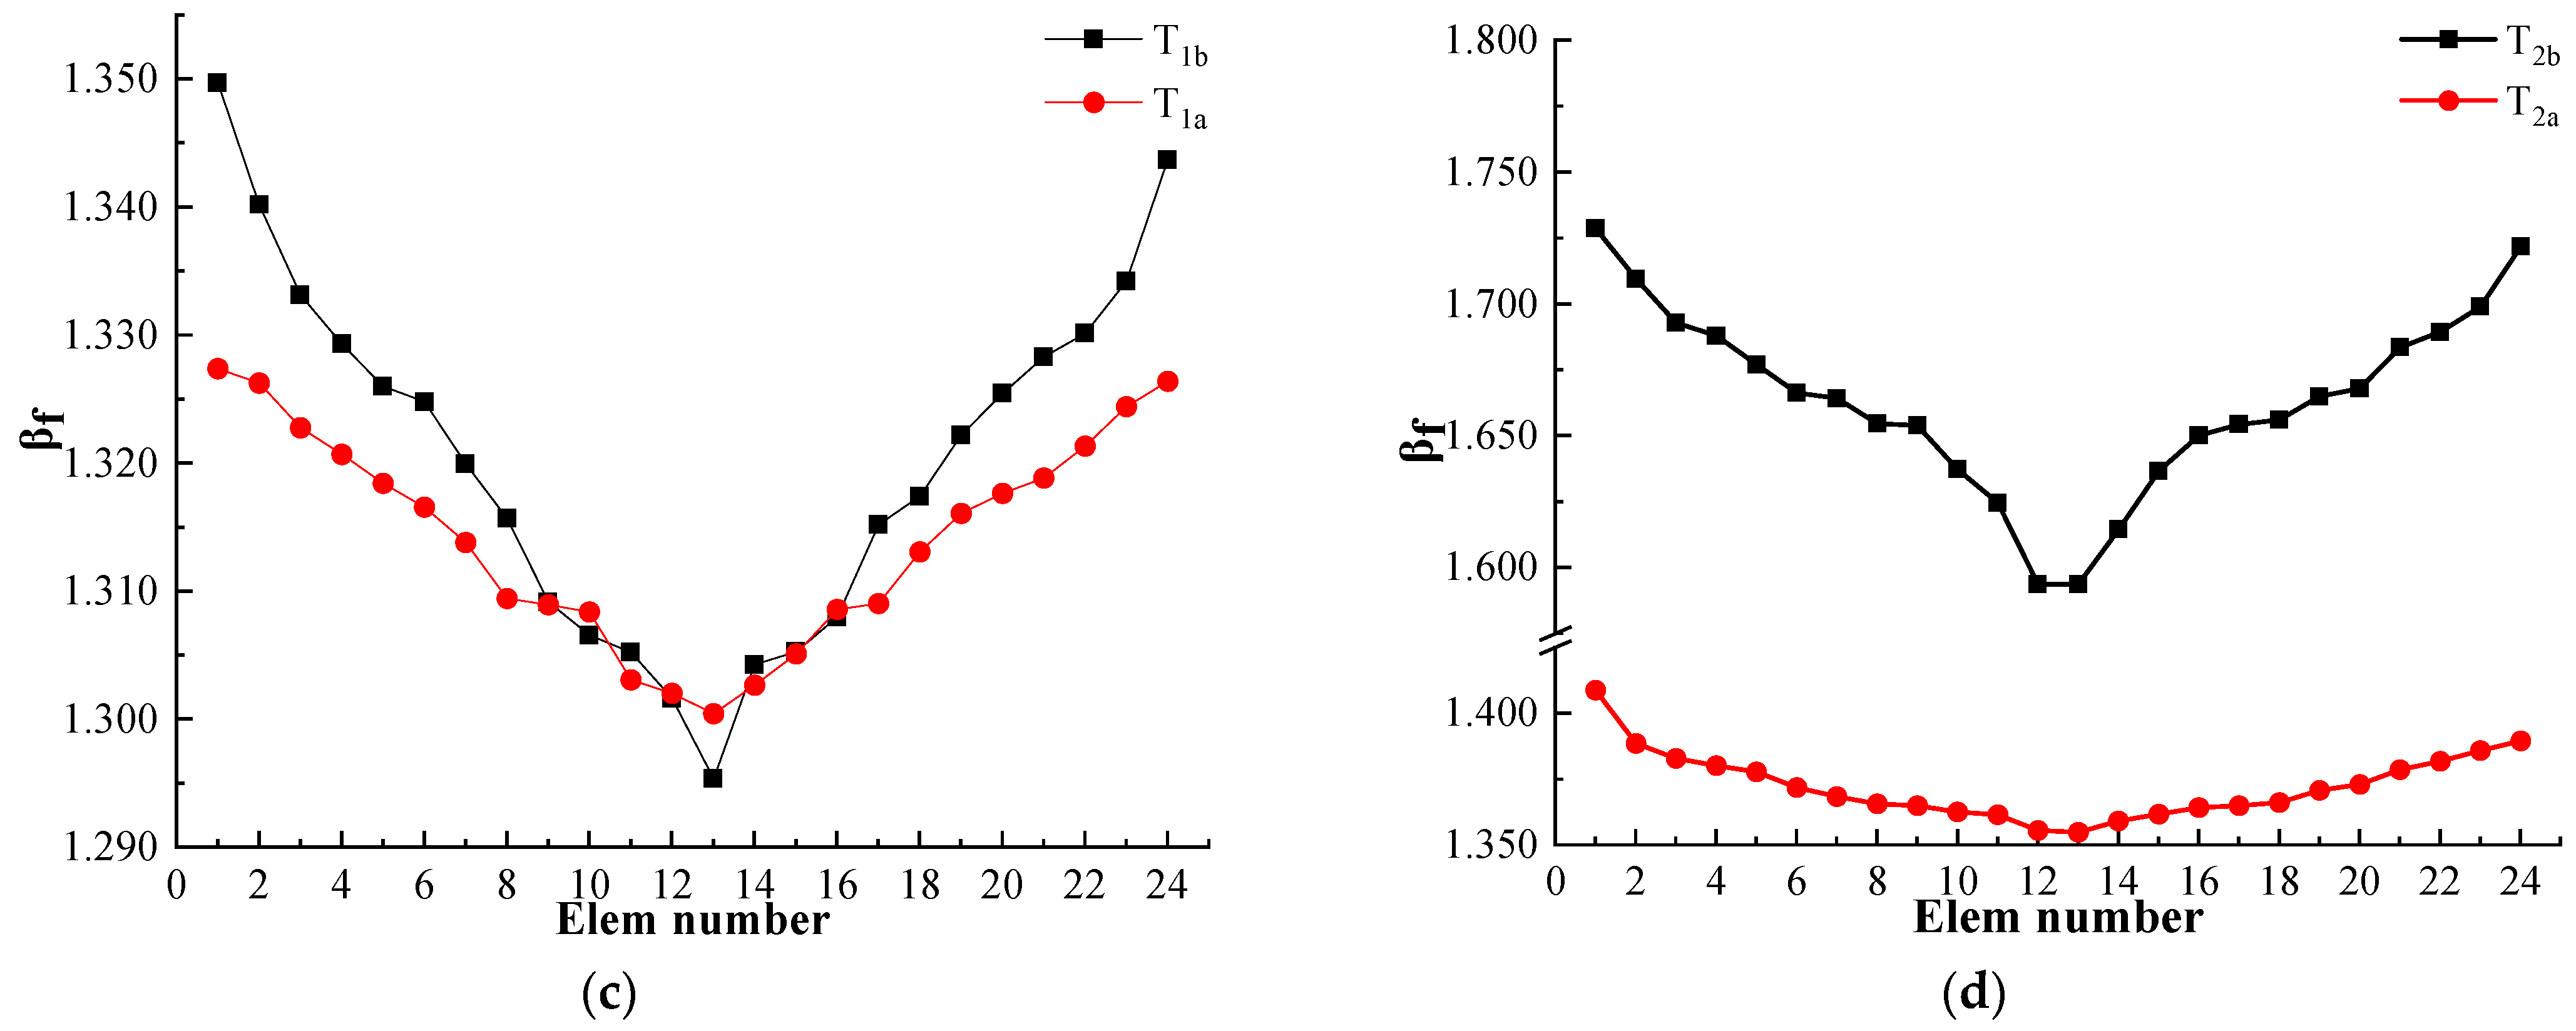
4.3.3. Force Wind Vibration Coefficients

The force wind vibration coefficients statistically illustrate the sensitivity of each structural component to pulsating wind loads. There are 14 types of components in the structure. This paper numbers each type of component in a clockwise sequence. Taking cable B 2 as an example, the numbering sequence is illustrated in Figure 9a.
Figure 10 represents the force wind vibration coefficients of various components in the structure. Since the force wind vibration coefficients of struts are significantly larger compared to those of cables, and the force response of struts is minimal under average and pulsating wind loads, these special components are ignored.
The differences in the internal force wind vibration coefficients among various types of components are relatively small. The internal force wind vibration coefficients of the inner hoop components are generally smaller than those of the outer hoop components. However, when considering the force wind vibration coefficients of hoop cables, it is observed that the values are higher for the inner hoop cables compared to the outer hoop cables. Notably, hoop cable H 1 exhibits the largest overall internal force wind vibration coefficient.

5. Parametric and Sensitivity Analyses

5.1. Parametric Analysis

Damage resulting from wind in large-span spatial structures has been a persistent issue. The vibration response caused by wind loads has become a significant consideration in structural design. However, research on the relationship between wind-induced responses and parameters, such as the rise–span ratio, thickness–span ratio, and damping factor, remains limited. This paper conducts a parametric analysis on the pentagonal three–four strut hybrid open-type cable dome with the aim of investigating the impacts of these parameters on wind vibration coefficients.
To maintain consistent pre-stress levels in the outer hoop cables, separate finite element models are established for modal and wind-induced vibration analyses. The parameters of the model are shown in Table 5. The results of the modal analysis indicate that the rise–span and thickness–span ratios have minimal impacts on the low-order natural vibration frequencies of the structure. Notably, the first three natural vibration frequencies are very close to each other.
This paper specifically focuses on studying the influence of parameters on the structural wind vibration coefficient on node 1 a and hoop cable H 1 .
Figure 11a,b display the analysis results that investigate the impact of the rise–span ratio on the structural wind vibration coefficients. The conclusions are as follows:
At f / l = 0.07 , both the displacement and internal force wind vibration coefficients of the structure are smaller compared to those of the other two cases. This implies that when f / l = 0.07 , the wind-induced responses of node 1 a and hoop cable H 1 are minimal.
Additionally, the displacement wind vibration coefficient distribution of node 1 a is the most scattered at f / l = 0.06 , as shown in Figure 11a.
The results of the analysis illustrating the influence of the thickness–span ratio on the structural wind vibration coefficients are shown in Figure 12a,b.
In Figure 12, it is observed that, while keeping the other parameters constant, there is a decrease in the displacement wind vibration coefficient of node 1 a and the wind internal force coefficient of cable H 1 with an increase in the thickness–span ratio. This decrease indicates that the structure has a reduced sensitivity to wind.
When h / l = 0.08 , the wind vibration coefficients for node displacements and component internal forces reach their minimum values. Additionally, the distribution of wind coefficients is more concentrated at this value.
The damping ratio is a crucial input parameter in wind vibration analysis. Its magnitude directly affects the wind resistance safety of the structure. However, field measurements of the damping ratio in cable dome structures are rare. Investigating the mechanism by which the damping ratio affects the wind vibration coefficient is important for establishing the most unfavorable conditions for cable dome structures [30,31]. The results of the analysis illustrating the influence of the damping factor on the structural wind vibration coefficients are shown in Figure 13a,b.
When the other parameters remain constant, larger damping coefficients lead to a reduction in both the displacement and internal force wind vibration coefficients.
Notably, when the damping factor is 0.01, the distribution of structural wind vibration coefficients exhibits the most scattered pattern.

5.2. Wind-Induced Vibration Sensitivity Analysis

The wind vibration coefficients statistically represent the sensitivity characteristics of components’ internal forces and node displacements. Thus, the sensitivity ranking of nodes and components can be determined based on the results of the wind vibration coefficient analysis. In this study, the maximum values of the internal force and displacement wind vibration coefficients are selected as the primary focus to guarantee structural safety.
The results of the impact analysis of parameters on the internal force wind vibration coefficients of the components are presented in Table 6. The parameters have the most significant impact on the internal force wind coefficients of diagonal cables B 1 and B 2 , outer hoop ridge cables T 2 a and T 2 b , and hoop cables H 1 and H 2 . The sensitivity of the components can be represented as H 1   >   B 1   >   T 2 b   >   B 2     H 2   >   T 2 a > T 1 b >   T 1 a   >   N 1 a = N 1 .
The impact analysis of the parameters on the node displacement wind vibration coefficients is presented in Table 7. The largest displacement wind vibration coefficient is observed at node 2 a , while the smallest coefficient is found at node 2 . The sensitivity of the nodes can be represented as 2 a   >   1 >   1 a   >   2 b   >   2 >   1 b .
The dispersion of structural internal forces and node wind vibration coefficients in this work is characterized using the root mean square (RMS). The parametric analysis results of the internal force and node displacement wind vibration coefficients are shown in Table 8 and Table 9, respectively.
The mean and RMS of the displacement and internal force wind vibration coefficients are the lowest when f / l = 0.07 and h / l = 0.08 . This implies that the structural sensitivity to wind vibration is optimal at these specific values of f / l and h / l .

6. Conclusions

This paper presents a comprehensive wind-induced vibration analysis of the newly proposed pentagonal three–four strut hybrid open-type cable dome. Utilizing numerical simulation, this study investigates the structural dynamic response of the structure and explores the impacts of various parameters on the wind vibration coefficients. Furthermore, it conducts a sensitivity analysis to rank the sensitivity of both nodes and components in terms of their structural behaviors. The main conclusions drawn from this study are outlined below:
  • The Davenport power spectrum simulation was performed using the Matlab programming language. The resulting simulated spectrum aligns statistically with the target spectrum, satisfying the prerequisites for the calculation of wind vibration coefficients.
  • During the wind-induced vibration analysis, the predominant displacement in the structure was observed along the Z -axis, with the maximum value being recorded at node (C4, 0), measuring 12 mm. The pulsating wind load induces structural deformation, but the structure is capable of self-equilibrating in its new position with a minimal internal force response.
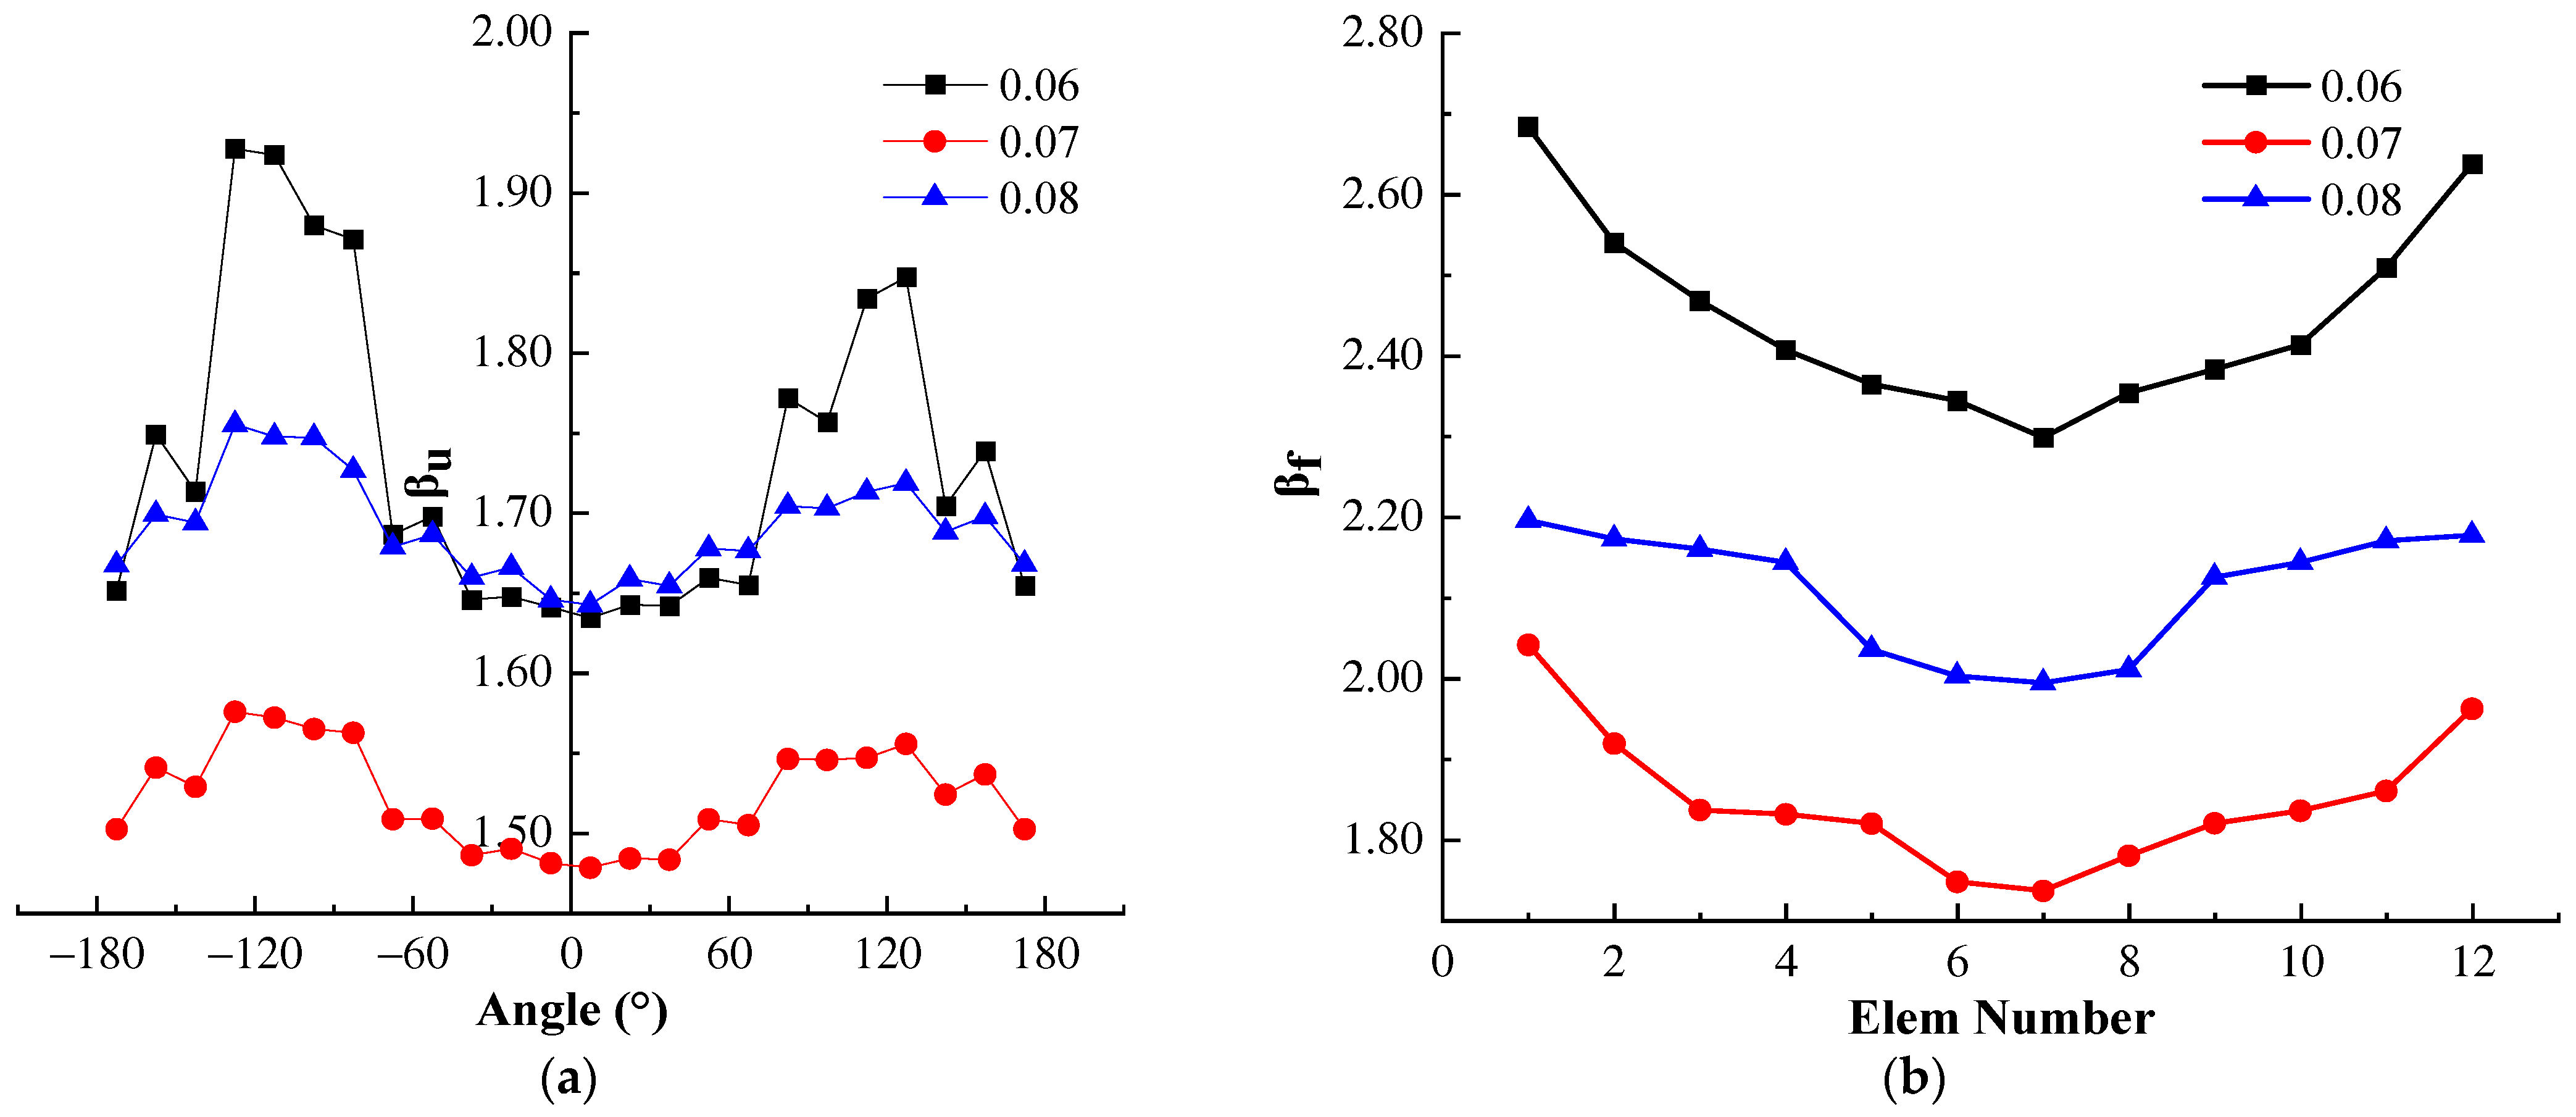
  • When creating a wind-resistant design, it is crucial to prioritize the selection of appropriate rise–span and thickness–span ratios. Additionally, increasing structural damping can help alleviate the adverse effects of pulsating wind on the structure.
  • This paper recommends using a rise–span ratio of f / l = 0.07 and a thickness–span ratio of h / l = 0.08 for this structure. The root mean square (RMS) values of the displacement and force wind vibration coefficients in the structure are minimized.
  • The RSM values for the displacement and force wind vibration coefficients are minimal. In a wind-resistant design, the average wind vibration coefficient can be employed to approximate the pulsating wind load with the average wind load.
  • The most wind-sensitive component is hoop cable H 1 . The cross-sectional area of H 1 can be increased to prevent it from breaking under pulsating wind loads.

Author Contributions

Conceptualization, H.L. and D.L.; methodology, Z.Z. and D.L.; software, D.L.; validation, L.S.; formal analysis, H.L.; investigation, L.S.; resources, Y.L.; data curation, Y.Z.; writing—original draft preparation, D.L.; writing—review and editing, Y.L.; visualization, Y.Z.; supervision, S.D.; project administration, Z.Z. and H.L.; funding acquisition, S.D. All authors have read and agreed to the published version of the manuscript.

Funding

This study was funded by the National Natural Science Foundation of China (NSFC) [Grant No. 52278224] and the Intelligent Building Engineering Research Center of Jiangxi Province Open Fund [Grant No. HK20213005].

Data Availability Statement

The data presented in this study are available in the article. The data are not publicly available due to privacy.

Conflicts of Interest

Author Yaopeng Liu was employed by the company NIDA Technology Company Limited. The remaining authors declare that the research was conducted in the absence of any commercial or financial relationships that could be construed as a potential conflict of interest.

References

  1. Zhang, H.; Lv, H.; Zhu, Z.Y.; Chen, Z.Q.; Chu, Y. Study on the Dynamic Response of the Component Failure of Drum-Shaped Honeycomb-Type III Cable Dome with Quad-Strut Layout. Buildings 2023, 13, 1894. [Google Scholar] [CrossRef]
  2. Zhang, H.Y.; Lu, J.Y.; Lu, M.; Li, N. Active Control Experiments on a Levy Cable Dome. Eng. Struct. 2023, 278, 115450. [Google Scholar] [CrossRef]
  3. Dong, S.L.; Wang, Y.D.; Liu, H.C. Structural Form Innovation and Initial Prestress Analysis on Drum-shaped Honeycomb-type Cable Domes with Multi-strut Layout. Spat. Struct. 2022, 28, 3–15. [Google Scholar]
  4. Zhang, A.L.; Wu, C.Q.; Zhang, Y.X. Analysis on the Structure and Initial Prestress of T-Type Three Strut Cable Dome. J. Beijing Univ. Civ. Eng. Archit. 2021, 37, 1–7. [Google Scholar]
  5. Yuan, X.F.; Zhang, P. Research of Parametric Configuration of Hybrid Cable Dome Structure. J. Huazhong Univ. Sci. Technol. (Nat. Sci. Ed.) 2023, 1–8. [Google Scholar]
  6. Lv, H.; Song, C.L.; Dong, S.L.; Liu, D.W.; Tao, Y.Y. Analysis of Prestressing Mode and Multi-Parameter Sensitivity of Circular Pentagonal Three-Four-Strut Alternated Cable Dome with Inner Hole. Eng. Mech. 2023, 1–15. [Google Scholar]
  7. Yuan, X.F.; Dong, S.L. New Forms and Initial Prestress Calculations for Cable Domes. Eng. Mech. 2005, 22, 22–26. [Google Scholar]
  8. Lv, H.; Liu, D.W.; Dong, S.L.; Zhong, Y.F. Conformational and Static Performance Analysis of Pentagonal Three-four Strut Hybrid Open-type Cable Dome. Adv. Steel Constr. 2023, 19, 403–410. [Google Scholar]
  9. Li, T.T.; Qu, H.Y.; Zhao, Y.; Honerkamp, R.; Yan, G.R.; Chowdhury, A.; Zisis, L. Wind Effects on Dome Structures and Evaluation of CFD Simulations through Wind Tunnel Testing. Sustainability 2023, 15, 4635. [Google Scholar] [CrossRef]
  10. Wei, D.M.; Xu, M.; Li, D. Frequency Domain Analysis of Wind Vibration Response of Large-Span Cable Dome Structure. J. South China Univ. Technol. (Nat. Sci. Ed.) 2012, 40, 112–117. [Google Scholar]
  11. Wei, D.M.; Xu, M.; Li, D. Time-history Analysis of Wind-induced Vibration Response for a Cable Dome Structure. J. Vib. Shock 2013, 32, 68–73. [Google Scholar]
  12. Li, T.T.; Yan, G.R.; Yuan, F.P.; Chen, G.D. Dynamic Structural Responses of Long-span Dome Structures Induced by Tornadoes. J. Wind Eng. Ind. Aerodyn. 2019, 190, 293–308. [Google Scholar] [CrossRef]
  13. Wang, X.L.; Chang, W.B. Analysis of Wind-induced Vibrational Response of Beam-String Structure to Coupled Action of Wind with Structure. J. Lanzhou Univ. Technol. 2008, 34, 108–112. [Google Scholar]
  14. Sun, F.J.; Chen, C.; Yu, L. Study on Wind Pressure Characteristics of Dome Structures with Openings. J. Disaster Prev. Mitig. Eng. 2017, 37, 481–486. [Google Scholar]
  15. Zhang, H.; Shan, J. Stochastic Wind Field Simulation and Wind-Coupled Response Study of Membrane Structures. Eng. Mech. 2006, 23, 19–24. [Google Scholar] [CrossRef]
  16. Wood, J.N.; Breuer, M.; De Nayer, G. Experimental Studies on the Instantaneous Fluid-Structure Interaction of an Air-Inflated Flexible Membrane in Turbulent Flow. J. Fluids Struct. 2018, 80, 405–440. [Google Scholar] [CrossRef]
  17. Park, M.J.; Yoon, S.W.; Kim, Y.C.; Cheon, D.J. Wind Pressure Characteristics Based on the Rise–Span Ratio of Spherical Domes with Openings on the Roof. Buildings 2022, 12, 576. [Google Scholar] [CrossRef]
  18. Lai, G.X.; He, Y.L.; Zhao, Y.G.; Zhang, L.M. Influence of Friction Coefficient between Cable and Membrane on Wind-Induced Response of Air-Supported Membrane Structures with Oblique Cable Net. Buildings 2023, 13, 649. [Google Scholar] [CrossRef]
  19. Li, Q.X.; Lou, W.J.; Yang, S.C.; Sun, B.N. Wind Load Factor and Parametric Analysis of Long-Span Single-Layer Spherical Reticulated Shell. J. Build. Struct. 2006, 27, 65–72. [Google Scholar]
  20. Zhou, D.; Shu, X.L. Wind-Induced Vibration and Parametric Analysis of Single-Layer Reticulated Shell Structures. Spat. Struct. 2003, 9, 6–12. [Google Scholar]
  21. Feng, H.; Huang, M.F.; Li, Q.; Shi, C.H. Wind-induced Vibration Time History Analysis and Equivalent Static Wind Loads for Long-Span Lattice Shells. J. Vib. Shock 2016, 35, 164–173. [Google Scholar]
  22. Shen, S.Z.; Wu, Y. Research Progress on Fluid-Solid Interaction Effect of Wind-Induced Vibration Response of Membrane Structure. J. Archit. Civ. Eng. 2006, 23, 1–9. [Google Scholar]
  23. Wang, Q.H.; Liu, F.H.; Yu, Y. Study on Wind-Induced Response of a Large-Span Roof by Using Finite Particle Method. Structures 2021, 34, 3567–3582. [Google Scholar] [CrossRef]
  24. Li, J.; Han, D.J. Study on Wind Vibration Coefficient of Large-Span Cable-Membrane Roof Structure. J. Vib. Shock 2009, 28, 153–159. [Google Scholar]
  25. Yue, L. Optimal Design for Cable Domes under Wind-Induced Vibration. Spat. Struct. 2015, 21, 18–22. [Google Scholar]
  26. Kim, Y.C.; Yoon, S.W.; Cheon, D.J.; Song, J.Y. Characteristics of Wind Pressures on Retractable Dome Roofs and External Peak Pressure Coefficients for Cladding Design. J. Wind Eng. Ind. Aerodyn. 2019, 188, 294–307. [Google Scholar]
  27. Kiani, K.; Efazati, M. Nonlocal Vibrations and Instability of Three-Dimensionally Accelerated Moving Nanocables. Phys. Scr. 2020, 95, 105005. [Google Scholar] [CrossRef]
  28. Kiani, K.; Efazati, M. Three-dimensional Nonlocal-Surface Energy-Based Statics, Dynamics, and Divergence Instability of Movable Cable-like Nanostructures with Arbitrary Translational Motion. Arch. Appl. Mech. 2021, 91, 3095–3123. [Google Scholar] [CrossRef]
  29. Feng, H.; Ruan, H.H.; Yuan, Y. Analysis of Nonlinear Wind-Induced Response for Cable Dome Structure. Struct. Eng. 2003, Z1, 64–69. [Google Scholar]
  30. Ke, S.T.; Yu, W.; Xu, L.; Ge, Y.J.; Tamura, Y. Identification of Damping Ratio and Its Influences on Wind- and Earthquake-induced Effects for Large Cooling Towers. Struct. Des. Tall Spec. Build. 2018, 27, e1488. [Google Scholar] [CrossRef]
  31. Yu, J.; Duan, Z.; Zhang, X.; Peng, J. Wind-Induced Vibration Control of High-Rise Structures Using Compound Damping Cables. Shock Vib. 2021, 2021, 5537622. [Google Scholar] [CrossRef]
Figure 1. Schematic diagram of the pentagonal three–four strut hybrid open-type cable dome. (a) Three-dimensional representation. (b) Cross-sectional view of the structural model.
Buildings 14 00461 g001
Figure 2. Power spectral density of pulsating wind at 30 m.
Buildings 14 00461 g002
Figure 3. Horizontal pulsating wind speed time history at 30 m.
Buildings 14 00461 g003
Figure 4. The first 50 modal frequencies.
Buildings 14 00461 g004
Figure 5. Diagrams of the first 6 modals: (a) 1st modal; (b) 2nd modal; (c) 3rd modal; (d) 4th modal; (e) 5th modal; and (f) 6th modal.
Buildings 14 00461 g005
Figure 6. Structural response extreme distribution diagram. (a) Displacement extreme node. (b) Internal force extreme element.
Buildings 14 00461 g006
Figure 7. Time history curves of node displacements under wind-induced vibration. (a) Node A— X -direction displacement; (b) node B— X -direction displacement; (c) node C— Y -direction displacement; (d) node D— Z -direction displacement.
Buildings 14 00461 g007
Figure 8. Time history curves of internal forces in the component (support). (a) Time history curve of the axial force of cable F. (b) Time history curve of the axial force of strut G. (c) Time-history curve of the support reaction force ( X -, Y -, and Z -directions) of support H.
Buildings 14 00461 g008
Figure 9. Node displacement wind vibration coefficients. (a) Node (component) distribution diagram. (b) Wind vibration coefficients for nodes 1 a and 1 b . (c) Wind vibration coefficients for nodes 1 and 2 . (d) Wind vibration coefficients for nodes 2 a and 2 b .
Buildings 14 00461 g009aBuildings 14 00461 g009b
Figure 10. Internal force wind vibration coefficients of components. (a) Internal force wind vibration coefficients of cables N 1 a and N 1 . (b) Internal force wind vibration coefficients of cables H 1 and H 2 . (c) Internal force wind vibration coefficients of cables T 1 a and T 1 b . (d) Internal force wind vibration coefficients of cables T 2 a and T 2 b .
Buildings 14 00461 g010aBuildings 14 00461 g010b
Figure 11. Wind vibration coefficients for various rise–span ratios. (a) Displacement vibration coefficients of node 1 a . (b) Internal force vibration coefficients of component H 1 .
Buildings 14 00461 g011
Figure 12. Wind vibration coefficients for various thickness–span ratios. (a) Displacement vibration coefficients of node 1 a . (b) Internal force vibration coefficients of component H 1 .
Buildings 14 00461 g012
Figure 13. Wind vibration coefficients for various damping factors. (a) Displacement vibration coefficients of node 1 a . (b) Internal force vibration coefficients of component H 1 .
Buildings 14 00461 g013
Table 1. Material properties.
PropertyCableStrut
Steel grade1860-grade steelQ345B steel
Tensile strength (MPa)1860345
Poisson’s ratio0.30.3
Modulus of elasticity (MPa)1.95 × 1052.06 × 105
Coefficient of linear expansion1.36 × 10−51.2 × 10⁻⁵
Density (kg/mm3)7.85 × 10−67.85 × 10−6
Table 2. Sectional size and initial pre-stress levels of the components.
ComponentPre-Stress (kN)Cross-Section (mm)
N 1 3711 Φ 155
N 1 a 4206 Φ 155
T 1 a 1196 Φ 131
T 1 b 1722 Φ 131
T 2 a 4108 Φ 155
T 2 b 3733 Φ 155
V 1 a −156 Φ 114 × 7.5
V 1 b −113 Φ 114 × 7.5
V 2 a −1263 Φ 630 × 11
V 2 b −449 Φ 630 × 11
B 1 1086 Φ 131
B 2 2823 Φ 155
H 1 2085 Φ 131
H 2 10000 Φ 190
Table 3. Node displacement extreme.
DirectionDisplacement (mm)Node Number
UX−−2.21A
UX+1.55B
UY−−1.89C
UY+1.84C
UZ−−7.30A
UZ+12.00D
Table 4. Extreme internal forces of elements.
ComponentForceElement Number
Cable10,621 kNF
Strut1265 kNG
ConstraintRFx = 4855 kNH
Table 5. Parameters of the models.
Model Freq/Hz
Rise–Span RatioThickness–Span RatioDamping Factor1st2nd3rd
0.060.070.032.44272.44272.5628
0.072.23832.23832.4532
0.081.98851.98852.7543
0.070.060.031.83361.83362.4358
0.072.22222.22222.6392
0.082.58222.58222.8657
0.070.070.012.23832.23832.4532
0.02
0.03
Table 6. Maximum values of internal force wind vibration coefficients.
ParameterRise–Span Ratio
(f/l = 0.07; damp = 0.03)
Thickness–Span Ratio
(h/l = 0.07; damp = 0.03)
Damping Factor
(f/l = 0.07; f/l = 0.07)
Component 0.060.070.080.060.070.080.010.020.03
N 1 1.511.301.301.301.301.301.471.351.30
N 1 a 1.511.301.301.301.301.301.471.351.30
T 1 a 1.561.331.331.331.331.321.501.381.33
T 1 b 1.591.351.351.341.351.341.501.391.35
T 2 a 1.631.411.381.401.411.401.601.471.41
T 2 b 2.441.731.841.791.731.651.911.791.73
B 1 2.581.751.992.011.751.692.001.791.75
B 2 2.091.591.821.761.591.521.881.651.59
H 1 2.682.042.202.392.041.852.162.072.04
H 2 2.081.581.811.741.581.511.861.651.58
Table 7. Maximum values of node displacement wind vibration coefficients.
ParameterRise–Span Ratio
(f/l = 0.07; damp = 0.03)
Thickness–Span Ratio
(h/l = 0.07; damp = 0.03)
Damping Factor
(f/l = 0.07; f/l = 0.07)
Node 0.060.070.080.060.070.080.010.020.03
1 a 2.011.571.761.691.571.491.811.631.57
1 b 1.911.511.681.611.511.451.751.581.51
2 a 2.171.641.931.811.641.561.951.721.64
2 b 1.931.541.711.651.541.481.801.621.54
1 2.071.581.801.701.581.511.861.651.58
2 1.921.531.681.631.531.451.771.591.53
Table 8. Results of internal force wind vibration coefficients.
Structural ParameterMaximumMeanMinimumRMS
Rise–span ratio
(f/l = 0.07; damping = 0.03)
0.062.681.791.450.350
0.072.041.471.280.177
0.082.201.541.290.254
Thickness–span ratio
(h/l = 0.07; damping = 0.03)
0.062.391.531.290.255
0.072.041.471.280.177
0.081.791.441.290.149
Damping factor
(f/l = 0.07; f/l = 0.07)
0.012.151.681.460.198
0.022.071.531.340.181
0.032.041.471.280.177
Table 9. Results of displacement wind vibration coefficients.
Structural ParameterMaximumMeanMinimumRMS
Rise–span ratio
(f/l = 0.07; damping = 0.03)
0.062.171.791.460.137
0.071.641.531.450.044
0.081.931.681.570.073
Thickness–span ratio
(h/l = 0.07; damping = 0.03)
0.061.811.631.520.061
0.071.641.531.450.044
0.081.561.451.360.034
Damping factor
(f/l = 0.07; f/l = 0.07)
0.011.951.761.660.067
0.021.721.601.520.049
0.031.641.531.450.044
Disclaimer/Publisher’s Note: The statements, opinions and data contained in all publications are solely those of the individual author(s) and contributor(s) and not of MDPI and/or the editor(s). MDPI and/or the editor(s) disclaim responsibility for any injury to people or property resulting from any ideas, methods, instructions or products referred to in the content.

