Article

Axial Compression Behavior of Elliptical Concrete-Filled Steel Tube Composite Short Columns with Encased Steel Considering Spherical-Cap Gap

1
Heilongjiang Key Laboratory of Disaster Prevention, Mitigation and Protection Engineering, Northeast Petroleum University, No. 99 Xuefu Street, High-Tech Industrial Development Zone, Daqing 163319, China
2
Key Laboratory of Structural Disaster and Control of the Ministry of Education, Harbin Institute of Technology, No. 92 West Dazhi Street, Nangang District, Harbin 150040, China
3
College of Civil Engineering and Architecture, Quzhou University, 78 Jiuhua Road, Kecheng District, Quzhou 324000, China
*
Authors to whom correspondence should be addressed.
Buildings 2024, 14(2), 350; https://doi.org/10.3390/buildings14020350
Submission received: 18 December 2023 / Revised: 21 January 2024 / Accepted: 22 January 2024 / Published: 26 January 2024
(This article belongs to the Section Building Structures)

Abstract

:
This study explored the axial compression behavior of elliptical concrete-filled steel tubes with encased steel considering spherical-cap gap (GSECFST) composite short columns. We designed 25 composite column specimens by varying the steel tube yield strength (fty), steel skeleton yield strength (fsy), concrete cubic compression strength (fcu), steel tube thickness (t), steel skeleton sectional area (As), the long and short half-axis ratio (a/b), the gap ratio (Xsg), and the slenderness ratio (λ). Based on the nonlinear constitutive models of the materials and the nonlinear contact effect among materials, the ABAQUS 6.20 finite element software established the refined finite element models of these composite short columns. Also, the rationality of the finite element modeling with a spherical-cap gap was verified by comparing it with the existing experimental results. The influence regularity of various parameters on the load (N)-displacement (Δ) curves, bearing capacity, initial stiffness, and ductility of the composite short columns was obtained. In addition, the failure modes, N-Δ process, sectional strain distribution, and gap feature index of the constraint partition model for GSECFST axial compression short columns were revealed. The results showed a weakened interaction between the elliptical steel tube and concrete. Also, the axial compression bearing capacity, initial stiffness, and core concrete ductility were reduced because of the spherical-cap gap. As fty, fsy, fc, and Asy increased, the axial bearing capacity, initial stiffness, and ductility of GSECFST composite short columns improved significantly but decreased with increasing of a/b, Xsg, and λ. When the gap ratio of the spherical crown was less than 4%, the outer steel tubes in the mid-span area of the GSECFST composite short columns buckled in the direction of the elliptical short axis under axial compression, and the concrete expanded outward and crushed. The failures were similar to those of the specimens without the spherical-cap gap. Based on the sectional constraint partition model, we propose the calculation formula of axial compression bearing capacity for GSECFST composite short columns. Consequently, this study is a reference for the elastic-plastic analysis of frame systems with similar composite columns.

1. Introduction

With the continuous development of high-rise buildings and large-span structures in China, people’s need for architectural aesthetics and structural efficiency has gradually increased. It is excellent to have an architectural aesthetic effect and a smooth, streamlined shape for the elliptical concrete-filled steel tube (CFST) columns; it avoids stress concentration at the sharp corners and reduces the flow resistance coefficient in the wind field and water flow [1]. Thus, this kind of composite member has been widely applied in many airport terminals, large-span buildings, large bridge engineering, and marine engineering in recent years [2]. However, using composite structures in large-scale projects to detect arch ribs and pier columns of some CFST bridges in China, we found that many structures have core concrete separation problems [3]. According to the different separation forms between core concrete and steel tubes, the gap of core concrete is mainly divided into spherical crown gaps and circumferential gaps [4]. Among them, the spherical-cap gap is common in horizontal crossing structures, such as CFST trusses and bridge arches. The main reasons are the unqualified quality of concrete materials, the non-standardized construction technology, the shrinkage and creep of core concrete, and the large temperature difference between internal and external maintenance. In particular, factors such as air cavities, bleeding, and shrinkage at the top of the section of the core concrete under gravity cause bleeding and a gap between the steel tube and core concrete. However, a void gap would induce local separation of the interface between the concrete and steel tube, weakening or eliminating the support and restraint behavior between the external steel tube and internal concrete, reducing the mechanical performance (such as bearing capacity, stiffness, and ductility of components). Given the objectivity of the spherical-cap gap and the severe consequences, combined with the practical application of elliptical CFST members with encased steel, it is necessary to study the mechanical properties of elliptical CFST composite short columns with encased steel considering the spherical-cap gap.
So far, scholars at home and abroad have conducted several studies on the mechanical properties of CFST with encased steel composite structures and CFST with spherical-cap gaps. For example, in 2003, Zhao et al. [5] conducted the axial compression test of 12 circular CFST composite short columns with encased steel, obtaining the specimens’ working process, bearing capacity, and ductility. Finally, a formula for the axial compression bearing capacity of the composite short columns was proposed based on the superposition principle. Similarly, Yang et al. [6] carried out static experiments of 21 elliptical CFST short columns under an axial compression load in 2008. They studied the influence of steel tube thickness, concrete strength, and constraint factors on elastic stiffness, ductility, and ultimate strength. The calculation formula of the axial compression bearing capacity of elliptical CFST short columns was regressed statistically. In 2010, Dai [7] numerically simulated the axial compression behavior of six elliptical CFST short columns. A reasonable finite element model was established based on the stress–strain constitutive model of confined concrete.
Elsewhere, in 2014, Ren [8] performed experiments and numerical simulations on the bending and compression properties of elliptical CFST members. It was reported that with an increased shear span ratio, the flexural bearing capacity of the specimens gradually decreased. Also, with increased long- and short-axis ratio, the flexural bearing capacity of the specimens around the long axis increased significantly. Conversely, the flexural bearing capacity of the specimens around the short axis decreased gradually. In 2019, Ji et al. [9] researched the axial compression behavior of H-type honeycomb composite columns with rectangular CFST flanges. Based on the truss model theory, the authors established simplified formulas for the axial compression bearing capacity of such composite columns. Two years later, the static tests of 12 elliptical CFST short columns with spherical-cap gaps under axial compression load were conducted [10], deducing the influence of the gap ratio on the mechanical properties of the specimens. Finally, the gap characteristic coefficient (GFI) was introduced to reveal the spherical-cap gap’s influence mechanism on the specimens’ bearing capacity. The year 2022 saw static tests on the axial compression behavior of six elliptical CFST short columns with spherical-cap gaps carried out [11]. The influence regularity of the steel tube’s yield strength; the concrete’s cubic compression strength; the gap ratio; the long and short half-axis ratio; and the diameter–thickness ratio on the bearing capacity, stiffness, and ductility were obtained. The research revealed the influence mechanism of the spherical-cap gap on the failure mode, typical load-displacement curves, stress–strain distribution, and contact stress of elliptical CFST short columns under axial load. Further, a simplified formula for the axial compression bearing capacity of elliptical CFST short columns was proposed, considering the influence of the spherical-cap gap.
Based on these tests, Shen et al. [12] clarified the influence mechanism of void characteristics on the constraint state of elliptical core concrete, proposing a sectional constraint partition model. Also, they deduced and verified the formula for the axial compression bearing capacity of elliptical CFST short columns, considering the influence of the spherical-cap gap. In 2023, Wang et al. [2] tested the axial compression behavior of 10 elliptical CFST short columns with circumferential void defects. They also investigated the influence of steel strength and void ratio on failure mode, axial compression strength, initial stiffness, and ductility, obtaining the mechanical mechanism and void influence characteristics of elliptical CFST short columns with circumferential void. Consequently, they proposed a simplified formula for calculating the axial bearing capacity of elliptical CFST short columns based on the circumferential void effect.
Although the research on CFST composite structures with encased steel and elliptical CFST columns with spherical-cap gaps is relatively mature, no research on the mechanical behavior of this type of GSECFST composite short column has been reported. Therefore, researching the mechanical properties and failure mechanism of GSECFST composite short columns subjected to axial compression is significant theoretically and practically.
This research designed 25 GSECFST specimens with the following main parameters: the steel tube yield strength (fty), steel skeleton yield strength (fsy), concrete cubic compression strength (fcu), steel tube thickness (t), steel skeleton sectional area (As), long and short half-axis ratio (a/b), gap ratio (Xsg), and slenderness ratio (λ), and the numerical simulation on the axial compression behavior of GSECFST specimens was conducted based on the experimental verification. We obtained the influence regularity of various parameters on the N-Δ curves, bearing capacity, initial stiffness, and ductility of the composite columns while revealing the failure mode, whole N-Δ process analysis, sectional strain distribution, and gap feature index of the constraint partition model for GSECFST axial compression short columns. Finally, based on the constraint partition model of core concrete with spherical-cap gap, the ultimate bearing capacity formula of GSECFST composite short columns under axial compression was proposed, laying the foundation for applying composite columns in practical engineering.

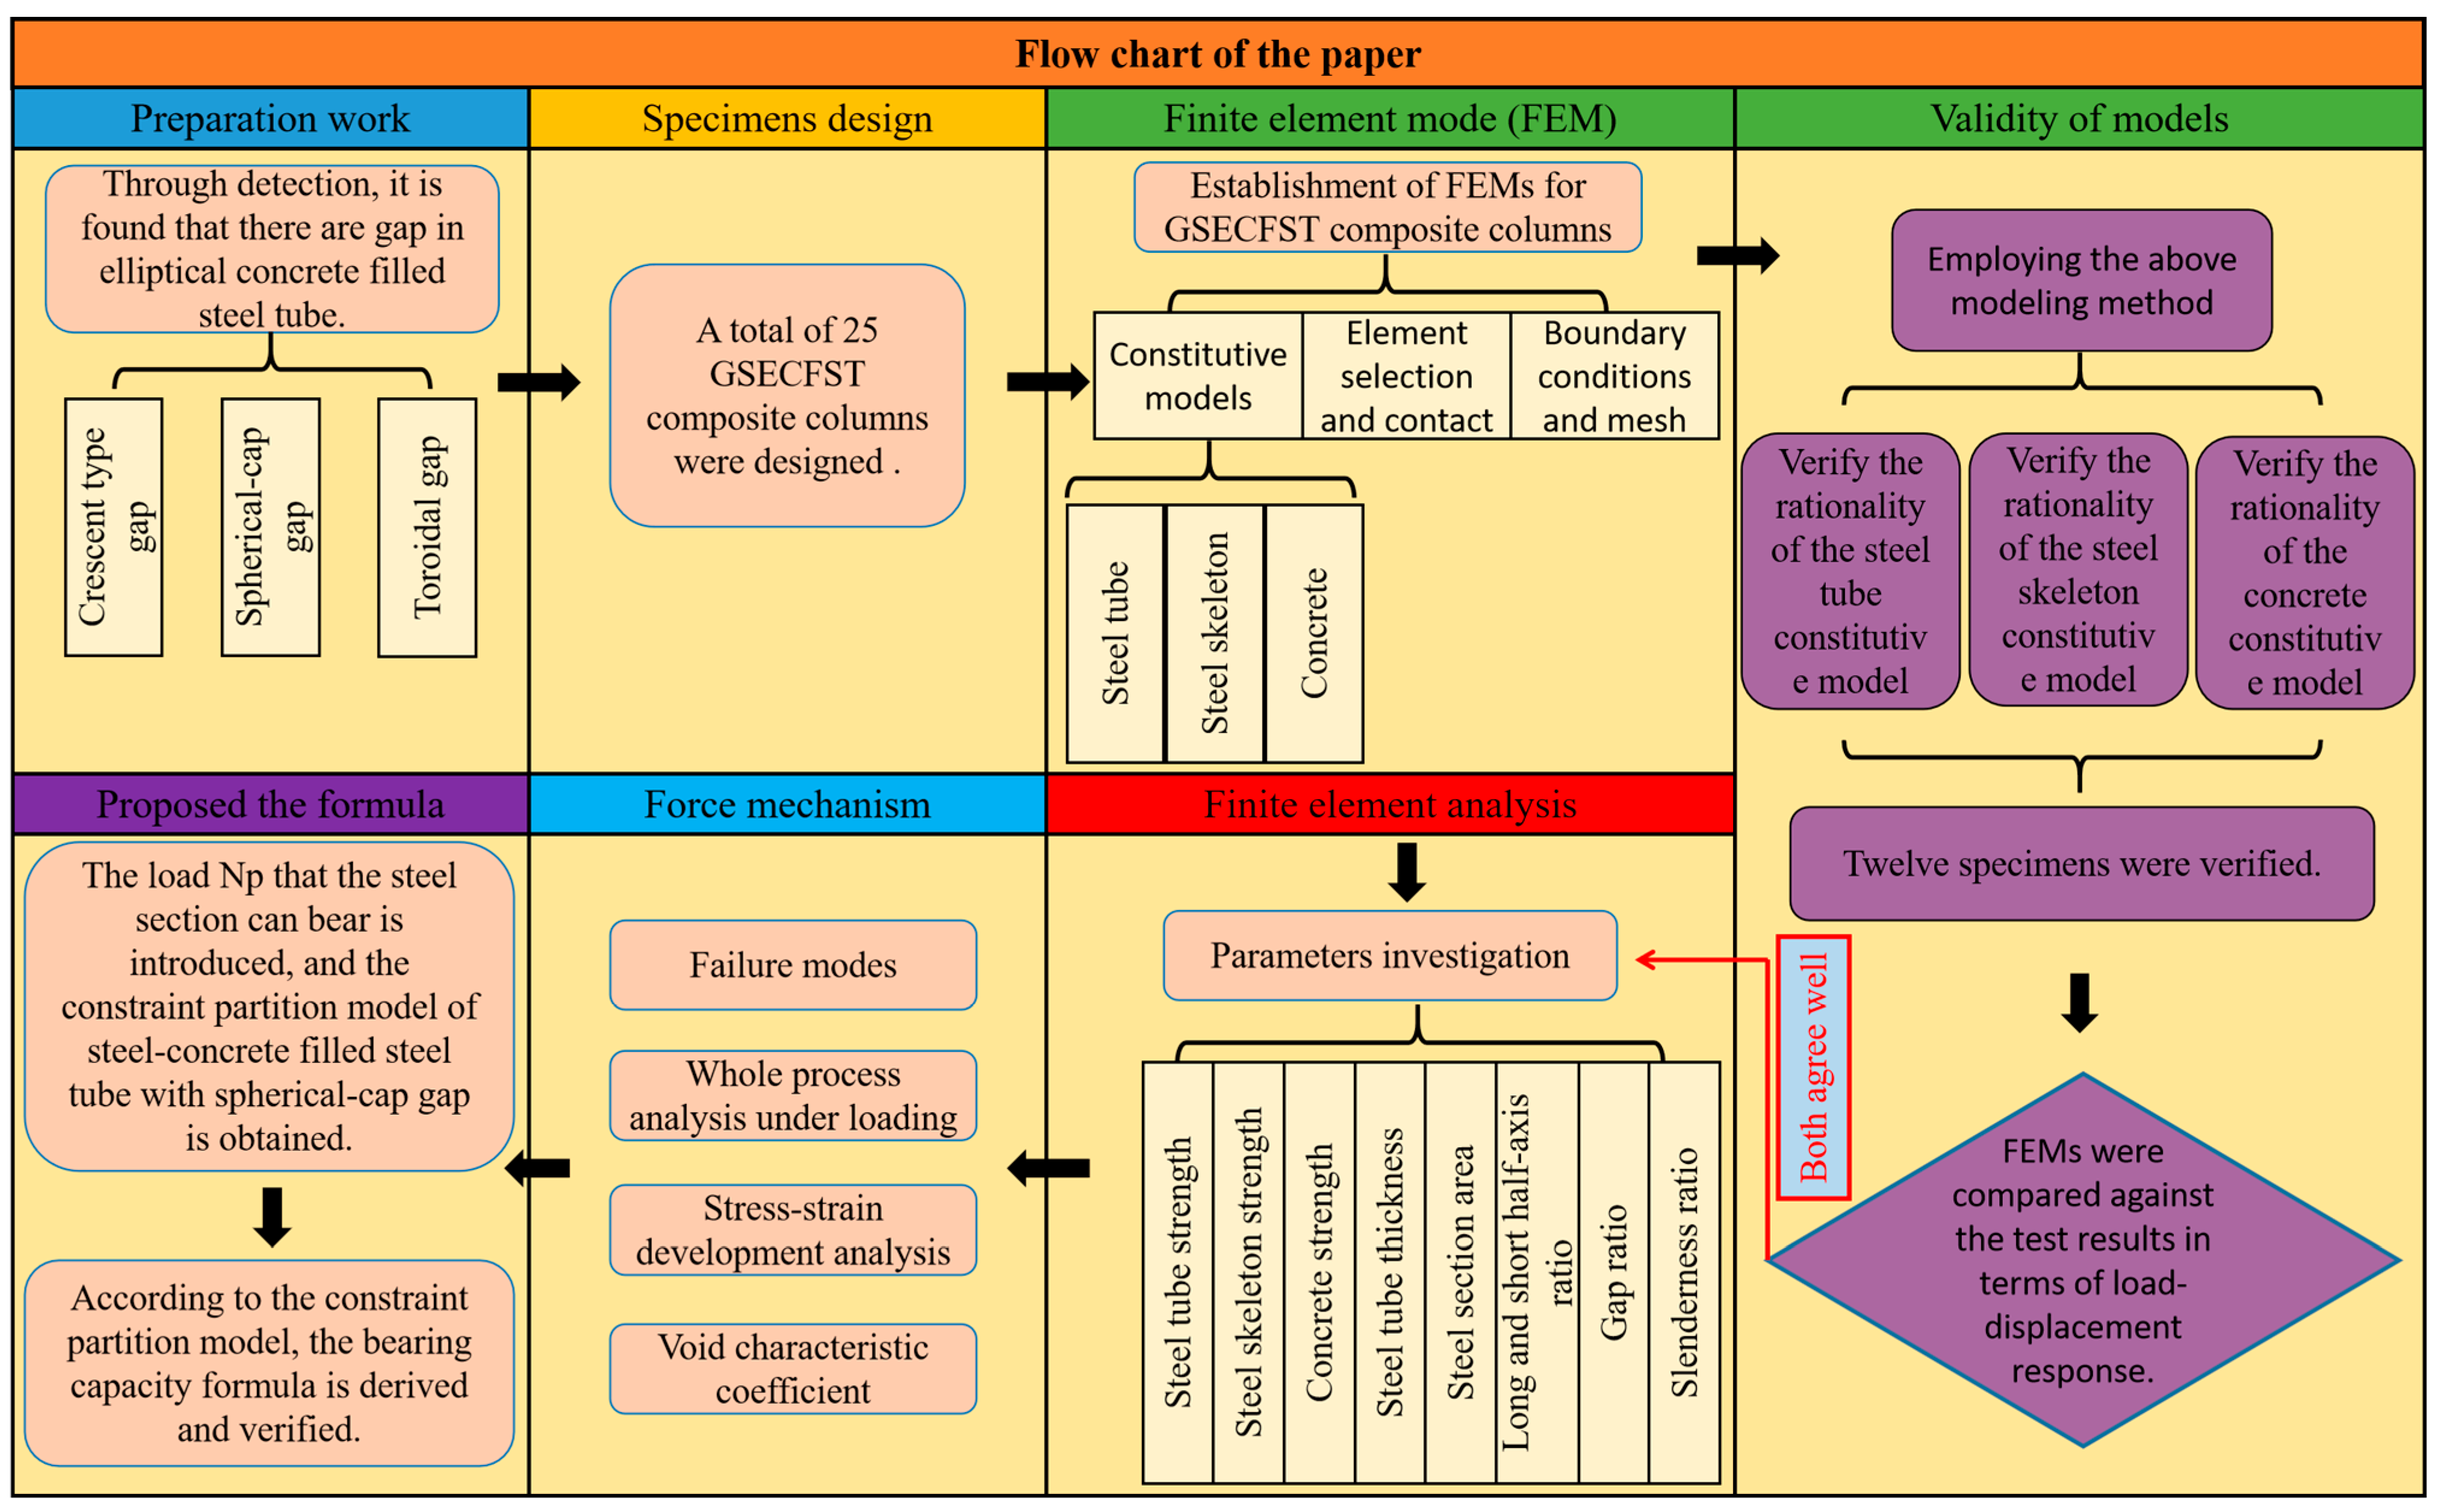
2. Analysis of the Paper
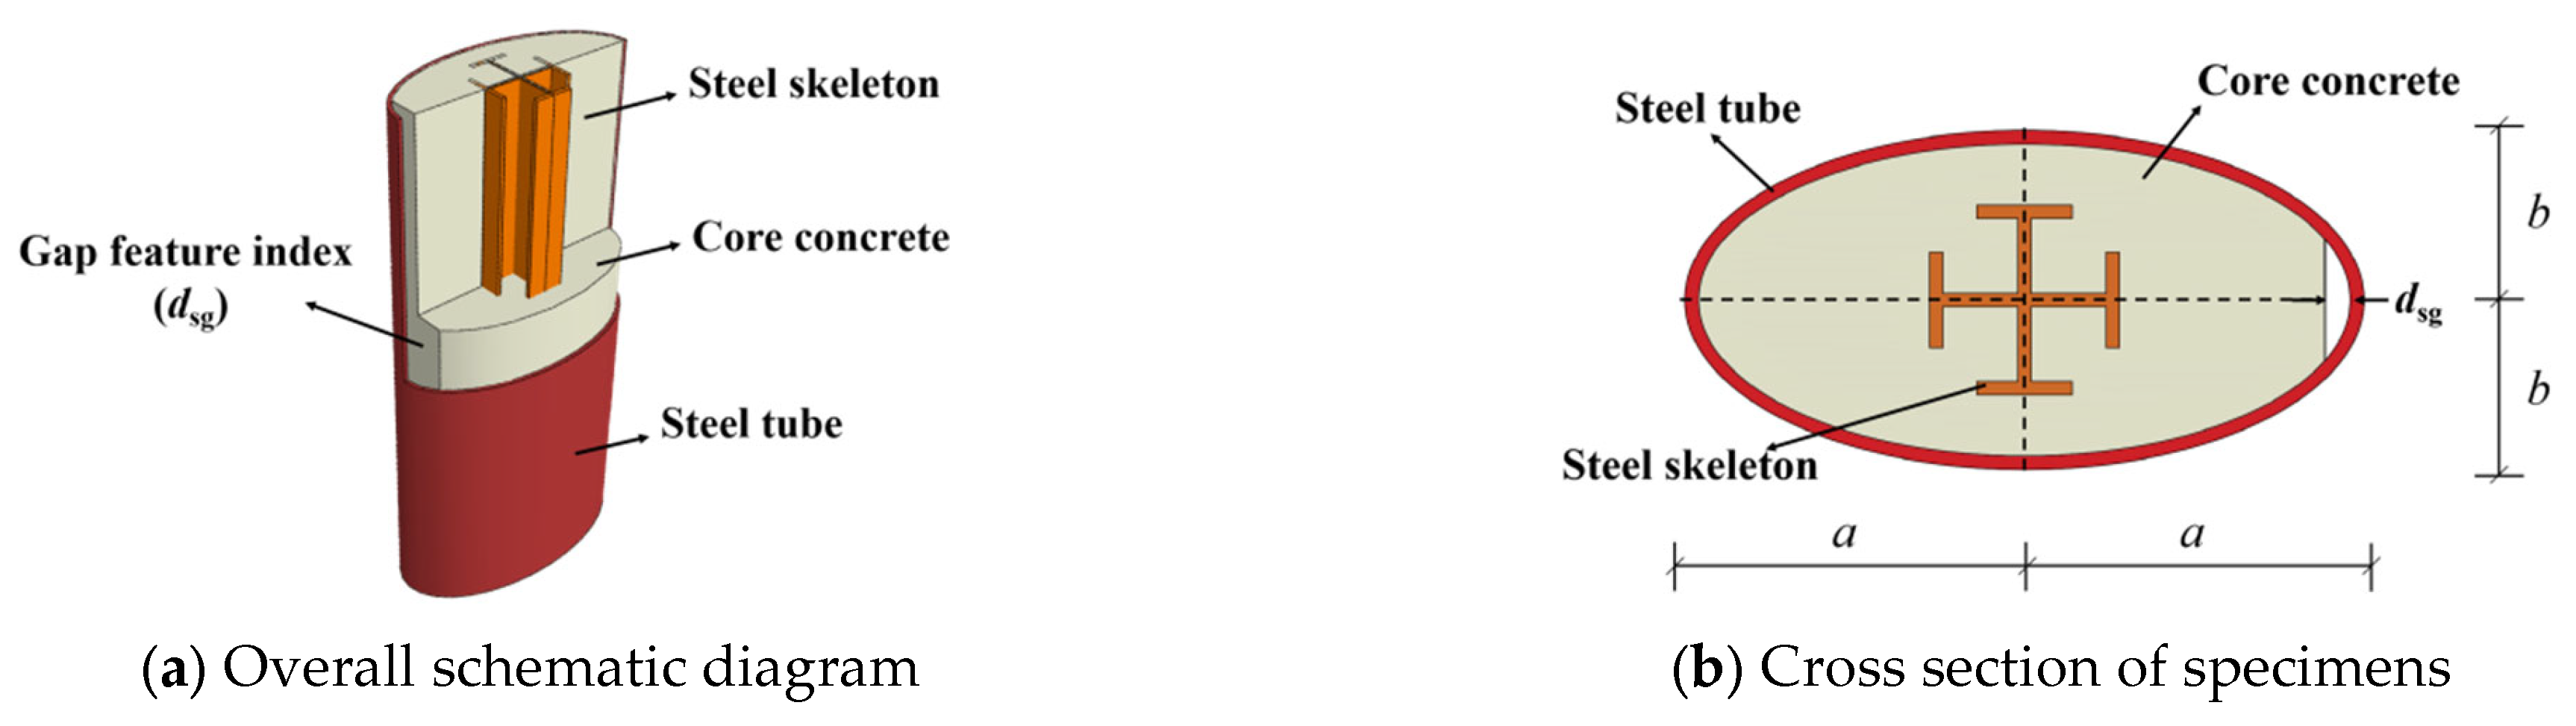
As detailed in Figure 1, this paper primarily consists of specimen design, establishment of finite element models, verification of the models’ rationality, simulation analysis, parameters’ investigation, force mechanism, and the proposed formula for the ultimate bearing capacity of the novel composite columns [13].

3. Specimen Design

To investigate the axial compression behavior of GSECFST composite short columns, this paper takes the steel tube yield strength (fty), steel skeleton yield strength (fsy), concrete cubic compression strength (fcu), steel tube thickness (t), steel skeleton sectional area (As), long and short half-axis ratio (a/b), gap ratio (Xsg), and slenderness ratio (λ) as the primary investigation parameters, resulting in designing 25 composite short columns. Table 1 lists the specific parameters of the specimens, and Figure 2 displays their sectional diagram.

4. Finite Element Model (FEM)

4.1. Constitutive Model for the Materials

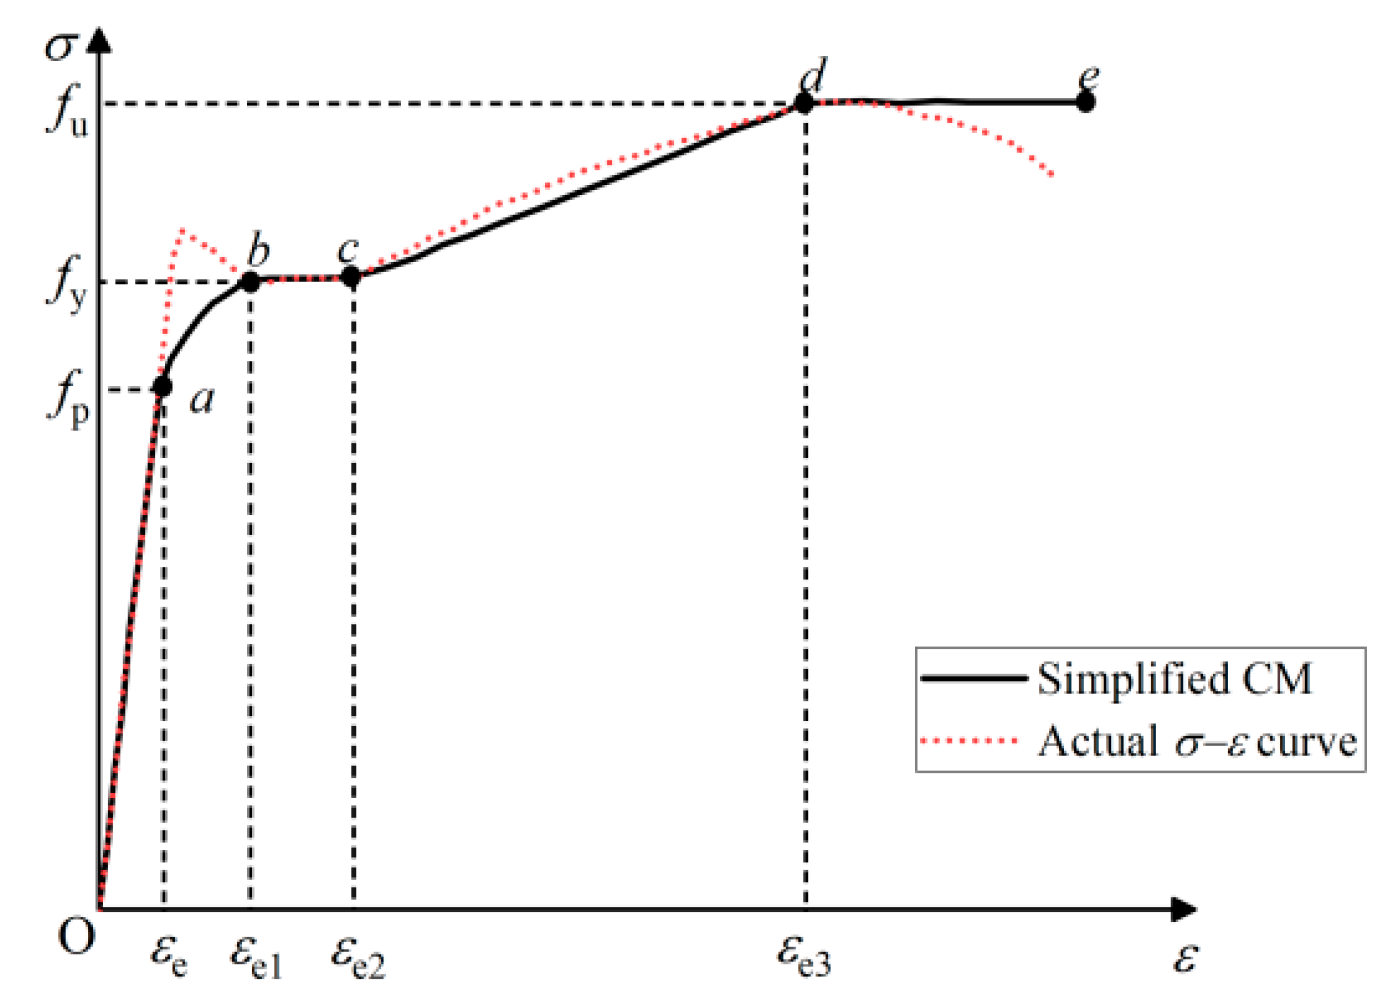
4.1.1. Constitutive Models of Steel Tube

The bilinear elastoplastic constitutive model (CM) that considers stress hardening was adopted for the steel tube. It is expressed in Formula (1) [15]:
σ i = E s × ε ε ε sy f sy + E 1 × ε ε sy ε > ε sy
where E1 is taken as 0.02, Es is the elastic modulus of steel, ε is the elastic strain of steel, fyk is the standard value of tensile strength of steel, and εyk is the strain value corresponding to the peak stress fyk for steel [16].

4.1.2. Constitutive Models of Cross-Shaped Steel Skeleton

The secondary plastic flow model with a yield platform was adopted as CM of the steel skeleton (Figure 3), where fp, fy, and fu are the proportional ultimate strength, yield strength, and ultimate tensile strength of the steel, respectively, and εe, εe1, εe2, and εe3 are the strain characteristic values, whose meaning is provided elsewhere [17].

4.1.3. Concrete Constitutive Models

Guo [18] studied the influence of the ratio of the long axis to the short axis of elliptical steel tubes on the binding force of core concrete, proposing a stress–strain relationship model suitable for simulating the core concrete of the elliptical section. Tang [3] believed their reduction effect on the confinement coefficient should be considered when the concrete-filled steel tube members have eccentricity or initial gap defects. Analyzing the test results revealed that the spherical-cap gap weakens the confinement effect of the core concrete [11]. Therefore, based on the test and simulation analysis, a reduction coefficient of the confinement effect related to the spherical crown gap ratio was introduced to modify the stress–strain constitutive relationship. The current paper modifies the concrete in Wang’s report [11]. Figure 4 depicts the constitutive expression of the elliptical concrete with a spherical-cap gap, expressed in Formulas (2)–(8).
y = 2 x x 2 1 + ( A 2 ) x x 1 x β 0 ( x 1 ) η + x x > 1
x = ε / ε 0
y = σ / f c
ε 0 = ε c + 800 ξ g 0.2 × 10 6
ε c = 1300 + 12.5 f c × 10 6
ξ = A s f y / A c f c
β 0 = 0.5 × ( 2.36 × a / b 5 × 10 5 ) 0.25 + ξ 0.5 7 f c 0.5 0.12
where σ and ε are the stress and strain of the core concrete, respectively; ε c is the peak strain of ordinary concrete; fy and fc are the yield strength of steel and the axial compressive strength of concrete, respectively (fc = 0.79fcu,k); ξ is the constraint effect coefficient of the steel tube, ξg = kgξ; η = 2; As and Ac are the cross-sectional areas of the steel tube and concrete, respectively.
To ensure a robust calculation convergence, the concrete failure energy criterion was adopted as the tensile softening behavior of concrete. With the concrete tensile strength formula provided elsewhere [19], the cracking stress is determined as follows:
σ to = 0.26 × 1.25 f c 2 / 3

4.2. Element Selection and Contact

Based on the finite element software ABAQUS 6.20, the finite element model of the composite column under axial load was established. The core concrete adopts the eight-node three-dimensional solid element (C3D8R) [20]. Due to the large diameter–thickness ratio of the finite element model, the solid component of the outer steel tube and the steel skeleton may reduce the calculation accuracy due to the small number of nodes. Therefore, the shell element S4R simulates the elliptical steel tube and the cruciform steel skeleton [21].
The interface between steel tube and concrete comprises hard contact (in the normal direction) and frictional contact, considering relative slip in the tangential direction. In the normal direction, the hard contact under pressure interference was adopted; it forced a complete interface [22]. Therefore, there is no over-closed situation, and the interface pressure of the contact unit is p. The shear stress τ can be freely transferred between the interface of the steel tube and the concrete in the tangential direction until the shear stress reaches the critical value τ bond of the interfacial bond stress. The interfacial bond stress fails; the relative slip between the steel tube and the concrete is generated, as shown in Equation (10) [23]. This paper also considers the relative slip between the steel tube and the concrete interface in the analysis process, and the friction coefficient μ is 0.6 [24]. The Embedded Region command in ABAQUS software embeds the steel in the concrete, and it is in an ideal state without considering the slip between the steel and the core concrete [25].
τ = μ p τ bond compatible   deformation > τ bond relative   slip

4.3. Boundary Conditions

In finite element modeling, the reference points RP-1 and R-P2 are set at the upper and lower ends of the specimen, respectively. The two reference points are rigidly bound to the upper and lower ends of the specimen to ensure that the upper and lower parts are uniformly stressed during the compression process to avoid component bias [26]. The displacement and rotation of the bottom surface of the column were restricted to consolidate the column bottom. Then, the displacement load is set at the reference point RP-1.
The two reference points (RP-1 and RP-2) are established at the top and bottom of the column. The bottom of the column is completely fixed, and the displacements in the X, Y, and Z directions (Ux = Uy = Uz = 0) and the rotations about three directions (URx = URy = URz = 0) are restricted. The top of the column is fixed in the displacements in the X and Y directions (Ux = Uy = 0), and the rotations about two directions (URx = URy = 0) are restricted [27]. This paper uses the hexahedral element to divide the grid. The loading modes are illustrated in Figure 5.

5. Experimental Verification of Finite Element Model

5.1. Existing Test

To verify the rationality of the finite element (FE) modeling method, five [28], seven [10], and five [5] specimens in the literature were selected to carry out FE analysis according to the mode. The specific parameters of typical specimens are listed in Table 2 and Table 3.

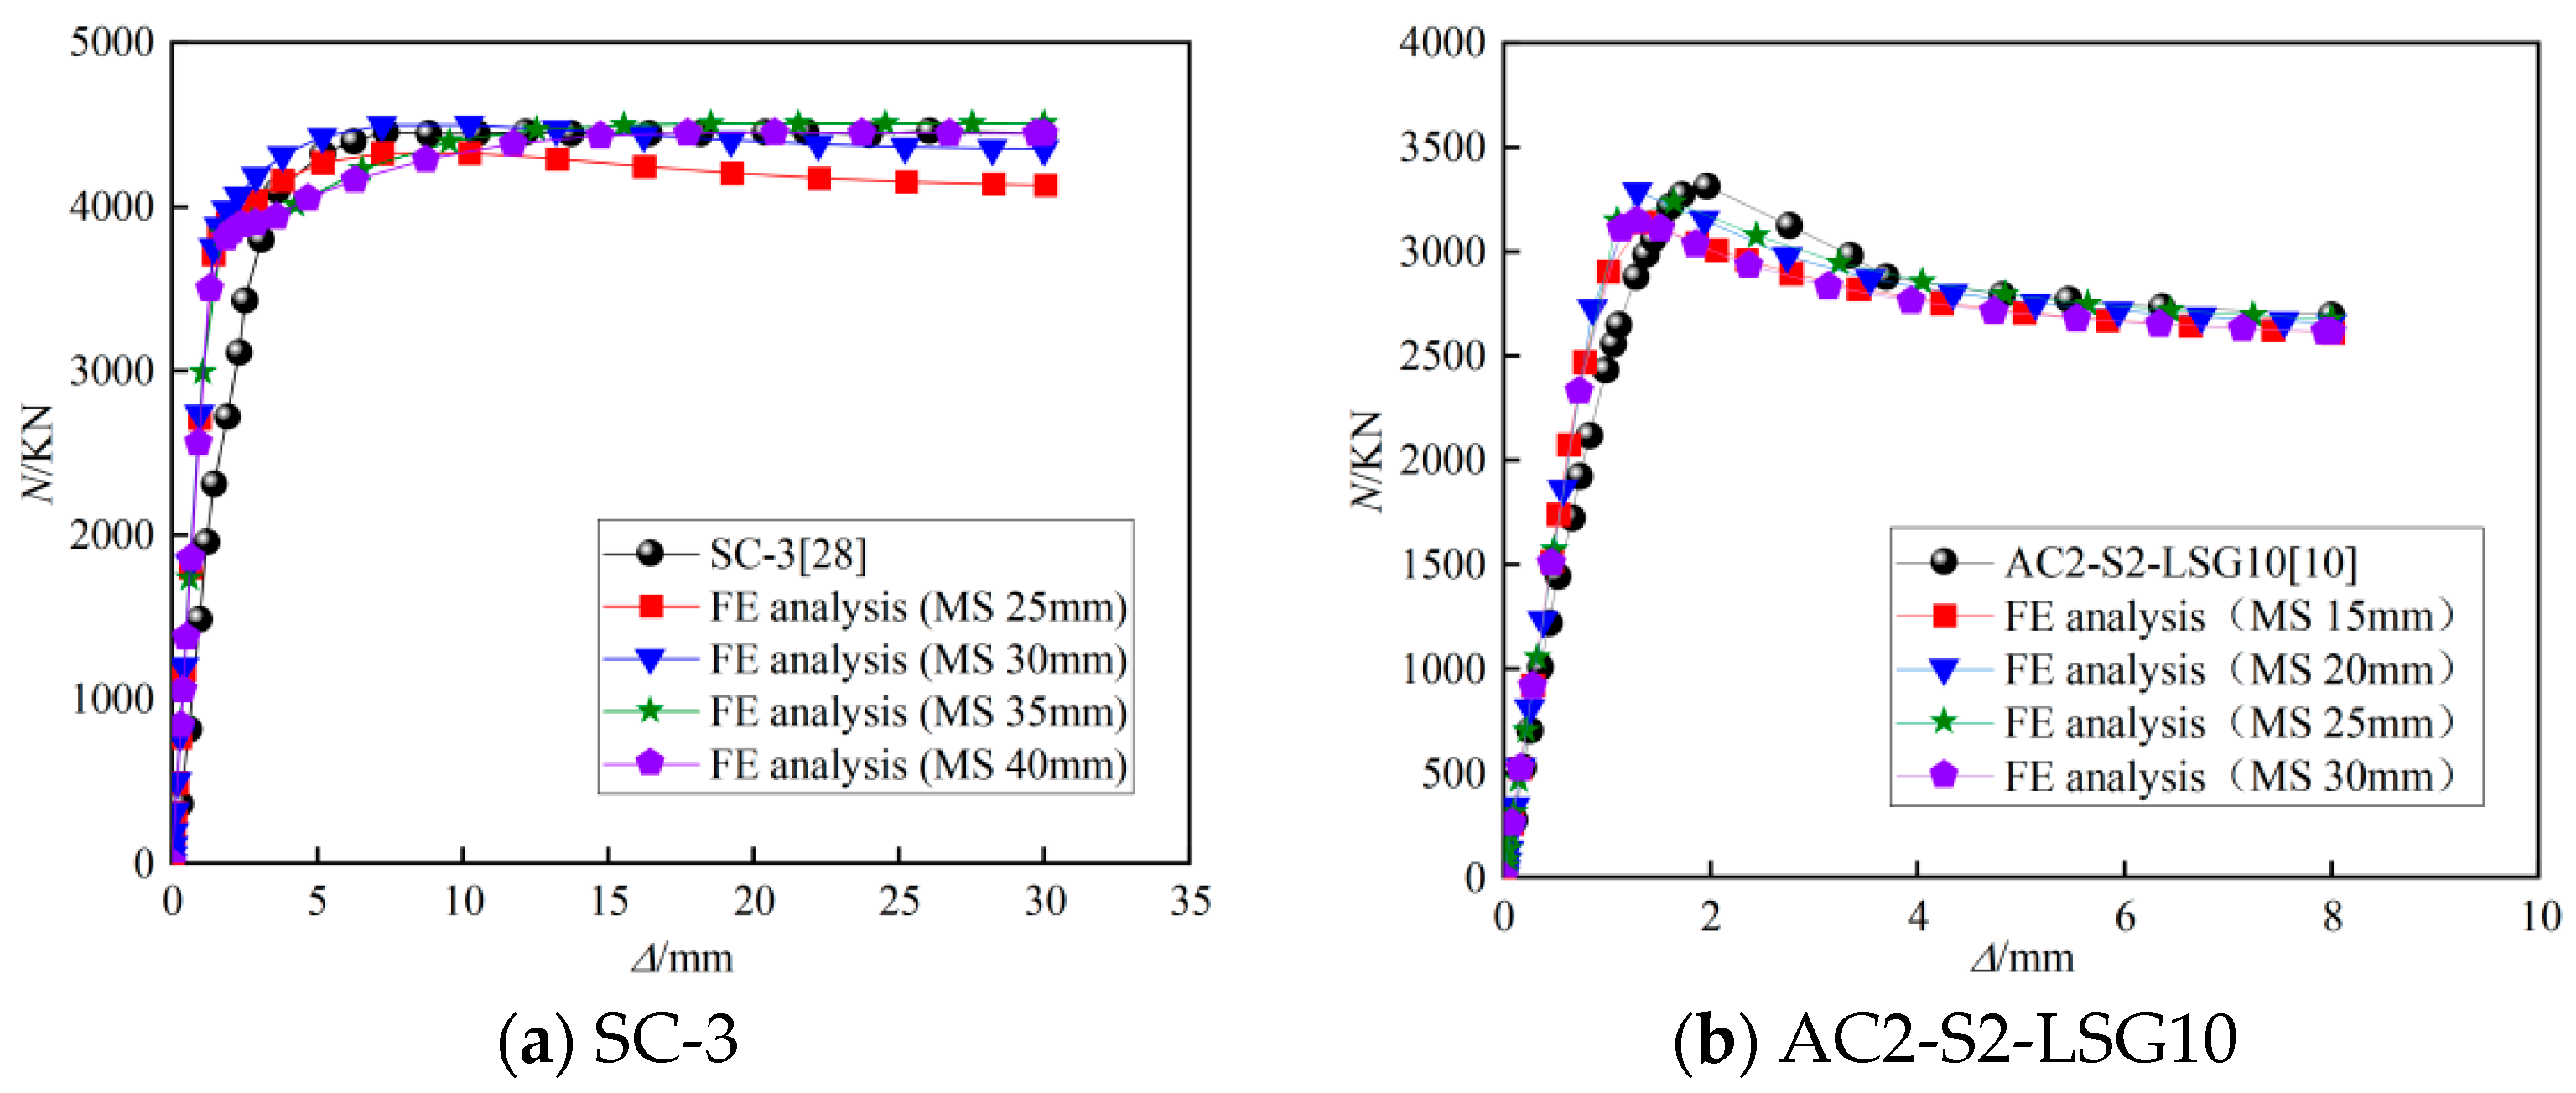
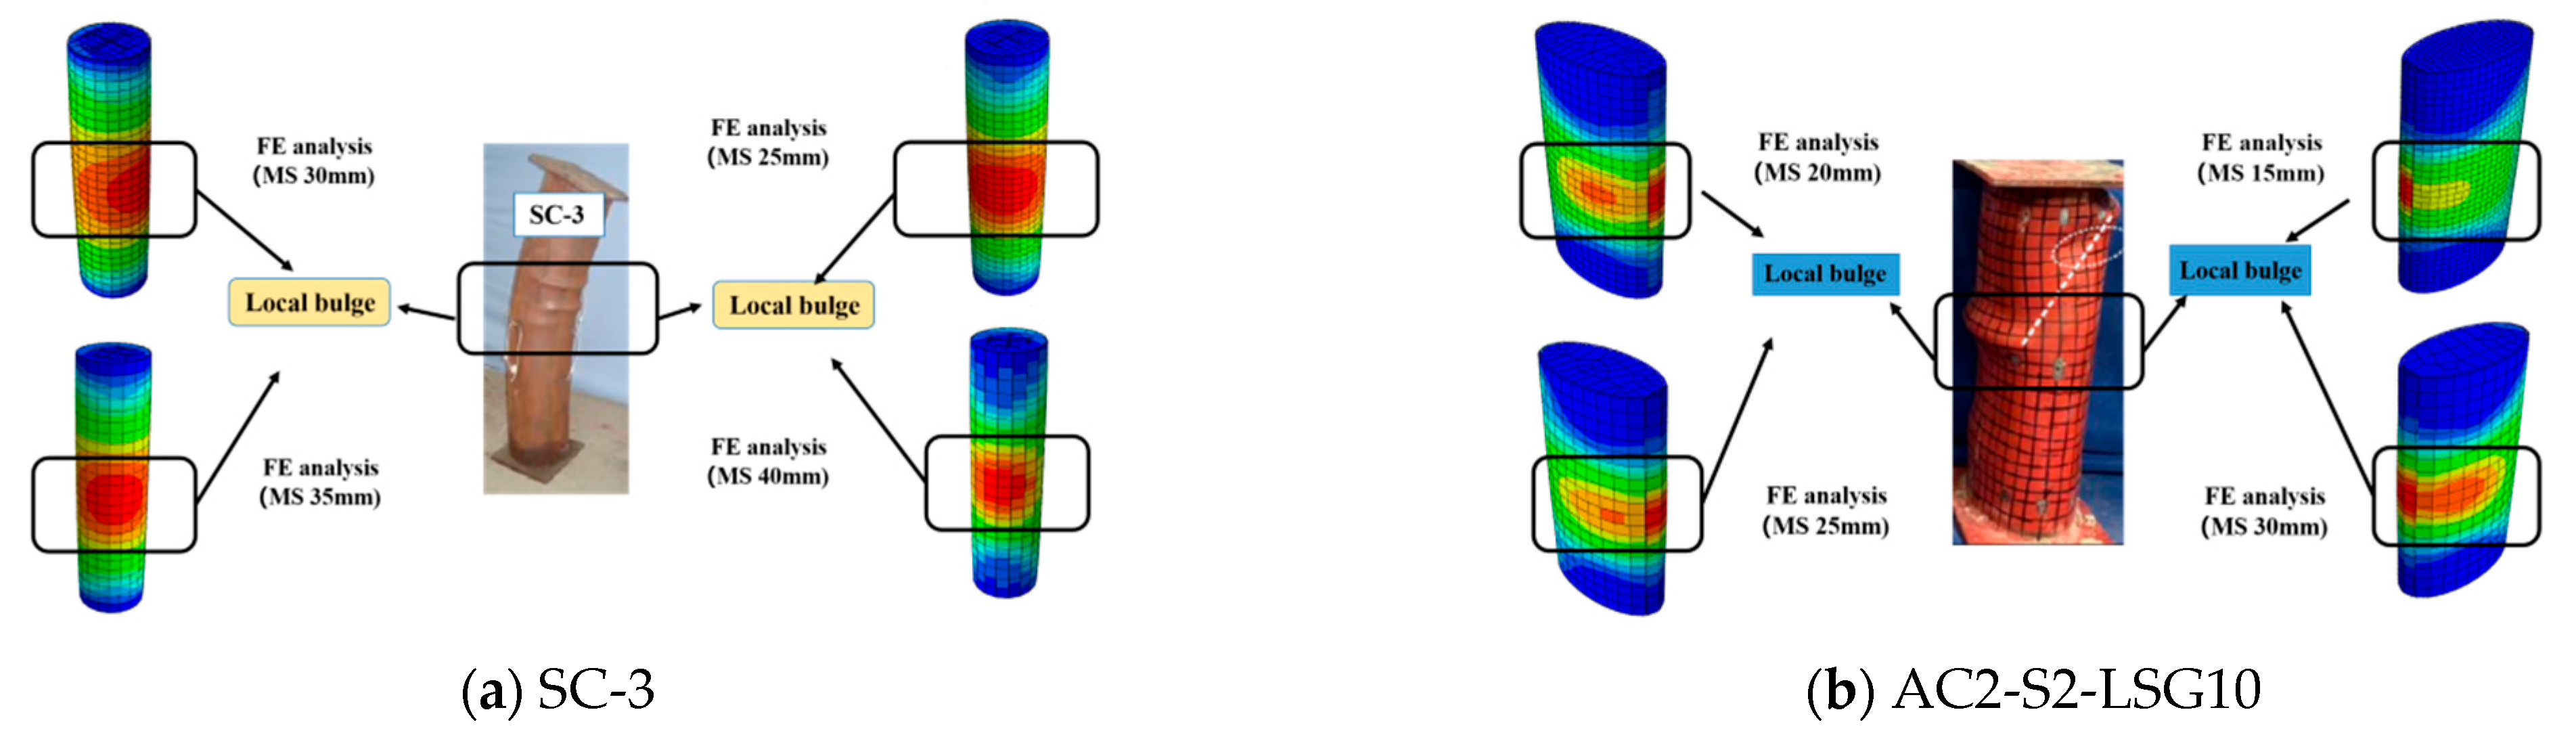
5.2. Grid Independence Analysis

Various mesh sizes significantly influence numerical simulation, so adopting the appropriate mesh size was necessary. First, a large mesh size was used for calculation before half of the original mesh size was calculated again. If the error from comparing the two results was within 2%, then the mesh size met the requirements. Otherwise, the mesh was further subdivided until it met the requirements [29]. Taking SC-3 and AC2-S2-LSG10 specimens in literature [10,28] as respective examples, the modeling comparisons of different grid sizes are shown in Figure 6. By comparing the simulation and experimental results, the simulation effect is better when the grid size is 30 and 20 mm. It shows that the calculation accuracy can be maintained when the grid size and specimen size ratio are about 0.1 and the operation rate is faster. Therefore, the mesh size selected in this paper at a ratio of 0.1 was determined to be 40mm. The failure modes of different mesh sizes are similar to the experimental results (Figure 7).

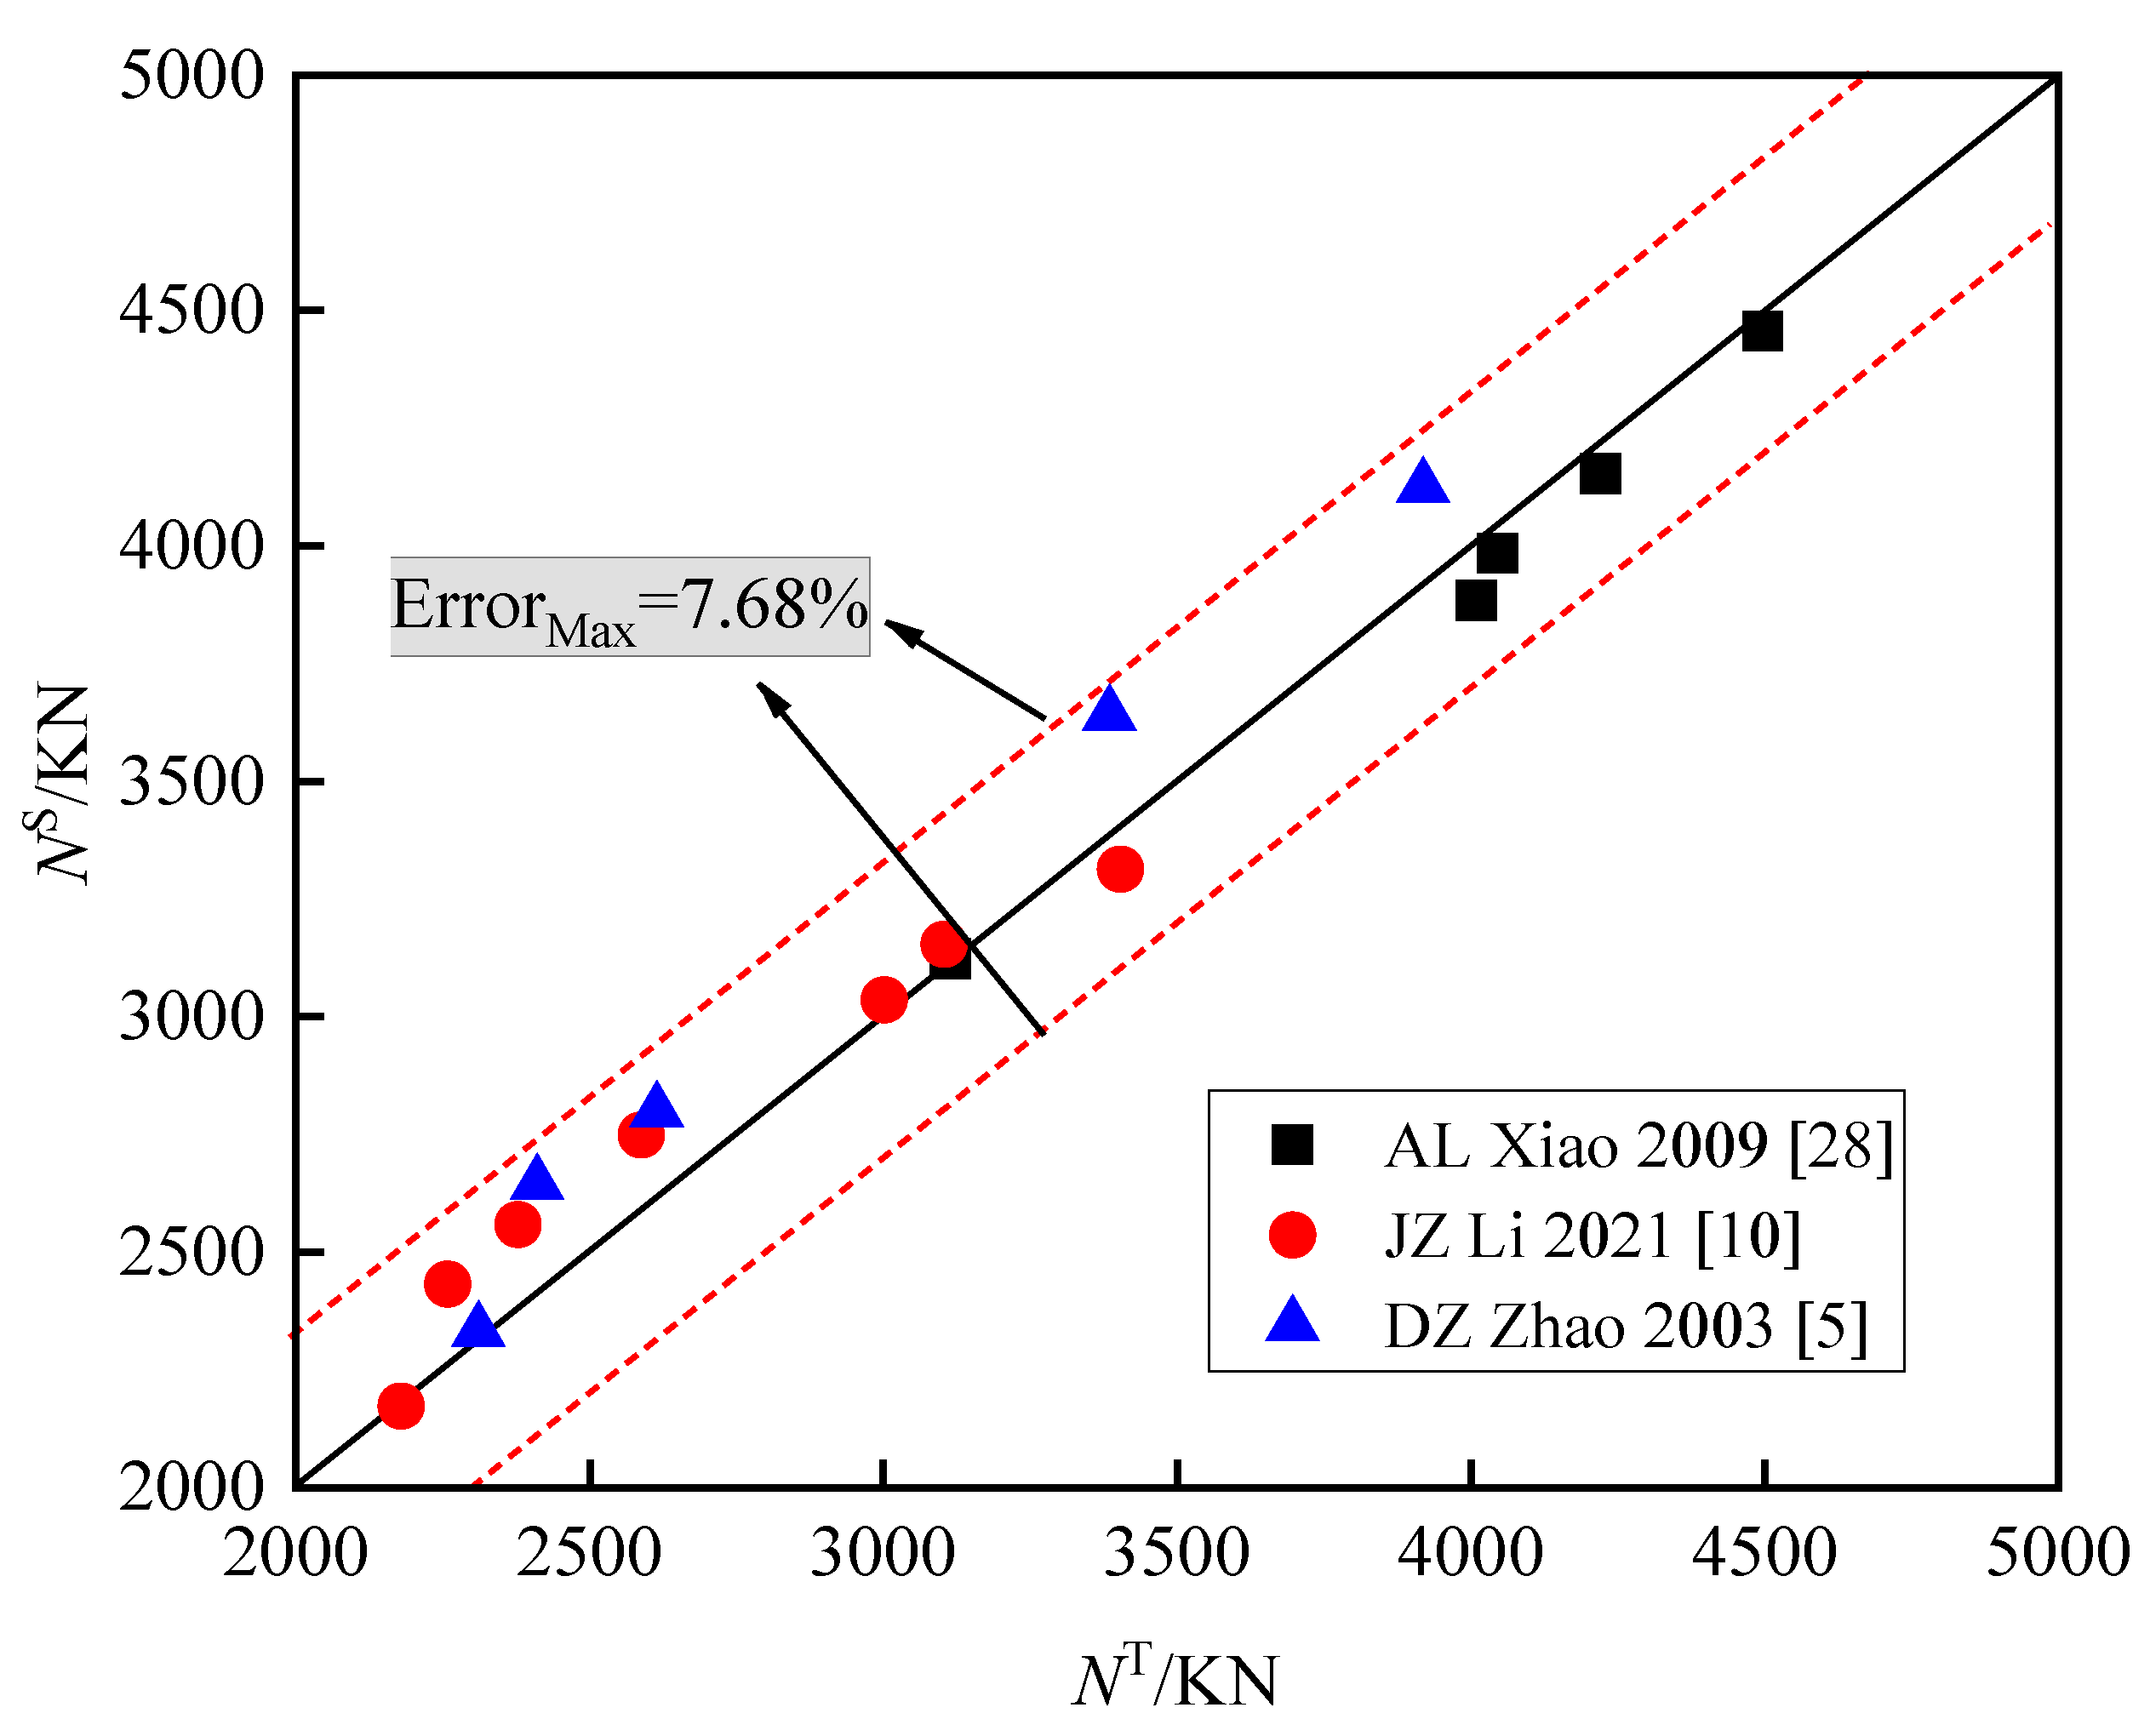
5.3. Verification Result

The FE analysis of the 12 specimens was carried out by adopting the modeling method, obtaining the N- curves (Figure 8). All the results agreed for most specimens. However, when the specimens were in the plastic stage, the agreement of the results between the FE analysis and the experiment was poor, probably because the concrete was regarded as an isotropic continuous element during the simulation analysis process, while the concrete belonged to the discrete element in the experiment. The axial compression bearing capacity (NT and NS) obtained by experimental means and the FE analysis are provided in Table 2 and Table 3 and Figure 9. The maximum error (ErrorMax) between them was 7.68%, and the simulation accuracy surpassed the requirements for practical engineering. The failure modes of all specimens were essentially similar to the experiment (Figure 10). Limited by space, the comparison of the load-displacement curves of the five specimens in reference [5] is no longer given, and the error comparison is shown in Figure 9.

6. Parametrical Investigations

6.1. Ductility

Based on the established and verified finite element model, seven design parameters were considered in the numerical simulation (i.e., steel tube strength, steel strength, concrete strength, steel tube thickness, steel section area, long–short axis ratio, and gap ratio) to fully understand the behavior of steel skeleton concrete-elliptical steel tube composite short columns with spherical-cap gap under axial compression. The effects of various parameters on the load-displacement (N-Δ) curve, bearing capacity change curve, ductility, and stiffness of composite columns can be obtained. Ductility is mainly expressed by the ductility coefficient (μ) in Formula (11), and Δy is determined by the energy equivalent method [30] (Figure 11).
μ = u y
where Δy and Δu are the yield displacement and ultimate displacement of members, respectively.

6.2. Steel Tube Yield Strength (fty)

The axial compression behavior of different steel tube strength (fty) specimens is compared and analyzed at a 2.5% gap ratio of GSECFST composite short columns (Figure 12). Figure 12a shows that when the gap defect was along the long axis of the ellipse, the strength of the steel tube increased from 235 to 335, 435, and 535 MPa. The axial compression ultimate bearing capacity of the columns increased from 6586 to 7187, 7821, and 8399 KN, respectively, increasing by 9.1%, 18.8%, and 27.5%. Figure 12b displays that the initial stiffness of the composite column increased from 5053 to 5091, 5106, and 5109 KN·mm−1, increasing by 0.8% and 1.1%, respectively. The ductility of the composite column improved from 3.08 to 3.40, 3.52, and 4.10, i.e., by 10.4%, 14.3%, and 33.1%, respectively. The results show that the axial bearing capacity and ductility of the GSECFST composite short columns increased with the steel strength, but the initial stiffness changed merely. Increasing the steel tube strength improved the axial compression bearing capacity of the composite column.

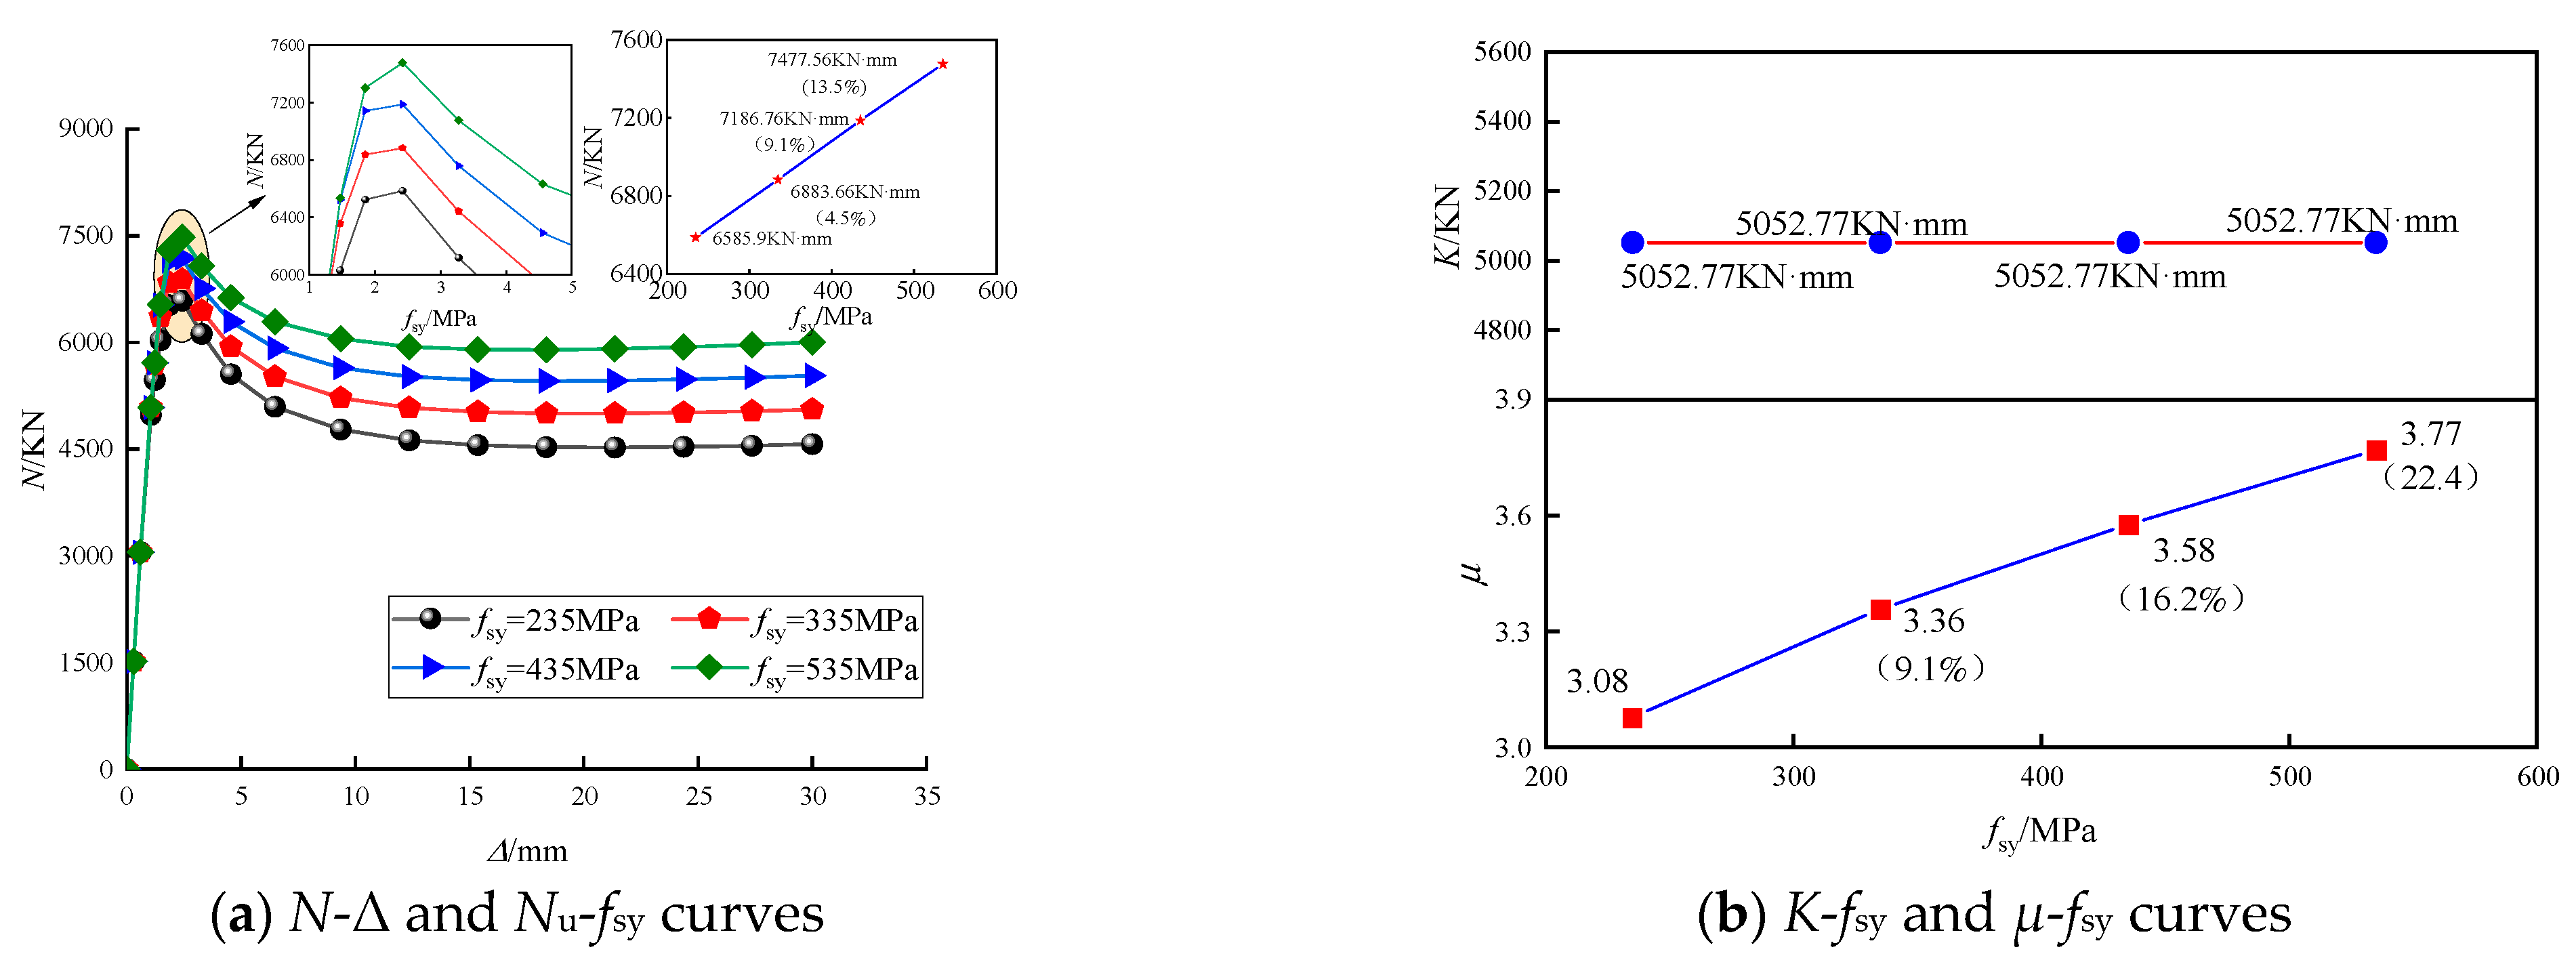
6.3. Steel Skeleton Yield Strength (fsy)

The axial compression behavior of various steel skeleton strength (fsy) specimens was compared and analyzed at a 2.5% gap ratio of GSECFST composite short columns (Figure 13). We observe from Figure 13a that when the gap defect was along the long axis of the ellipse, the steel strength increased from 235 to 335, 435, and 535 MPa. Figure 13b shows that the columns’ axial compression ultimate bearing capacity rose from 6586 to 684, 7187, and 7478 KN, respectively, increasing by 4.5%, 9.1%, and 13.5%. Figure 14b depicts that the initial stiffness of the composite column was maintained at 5053 KN·mm−1. The ductility of the composite column increased from 3.08 to 3.33, 3.58, and 3.77, signifying a 9.1%, 16.2%, and 22.4% increase, respectively. The results show that the axial bearing capacity and ductility of the GSECFST composite short columns increased with the steel strength. Still, the initial stiffness did not change, and the specimens showed a strong load-bearing capacity.

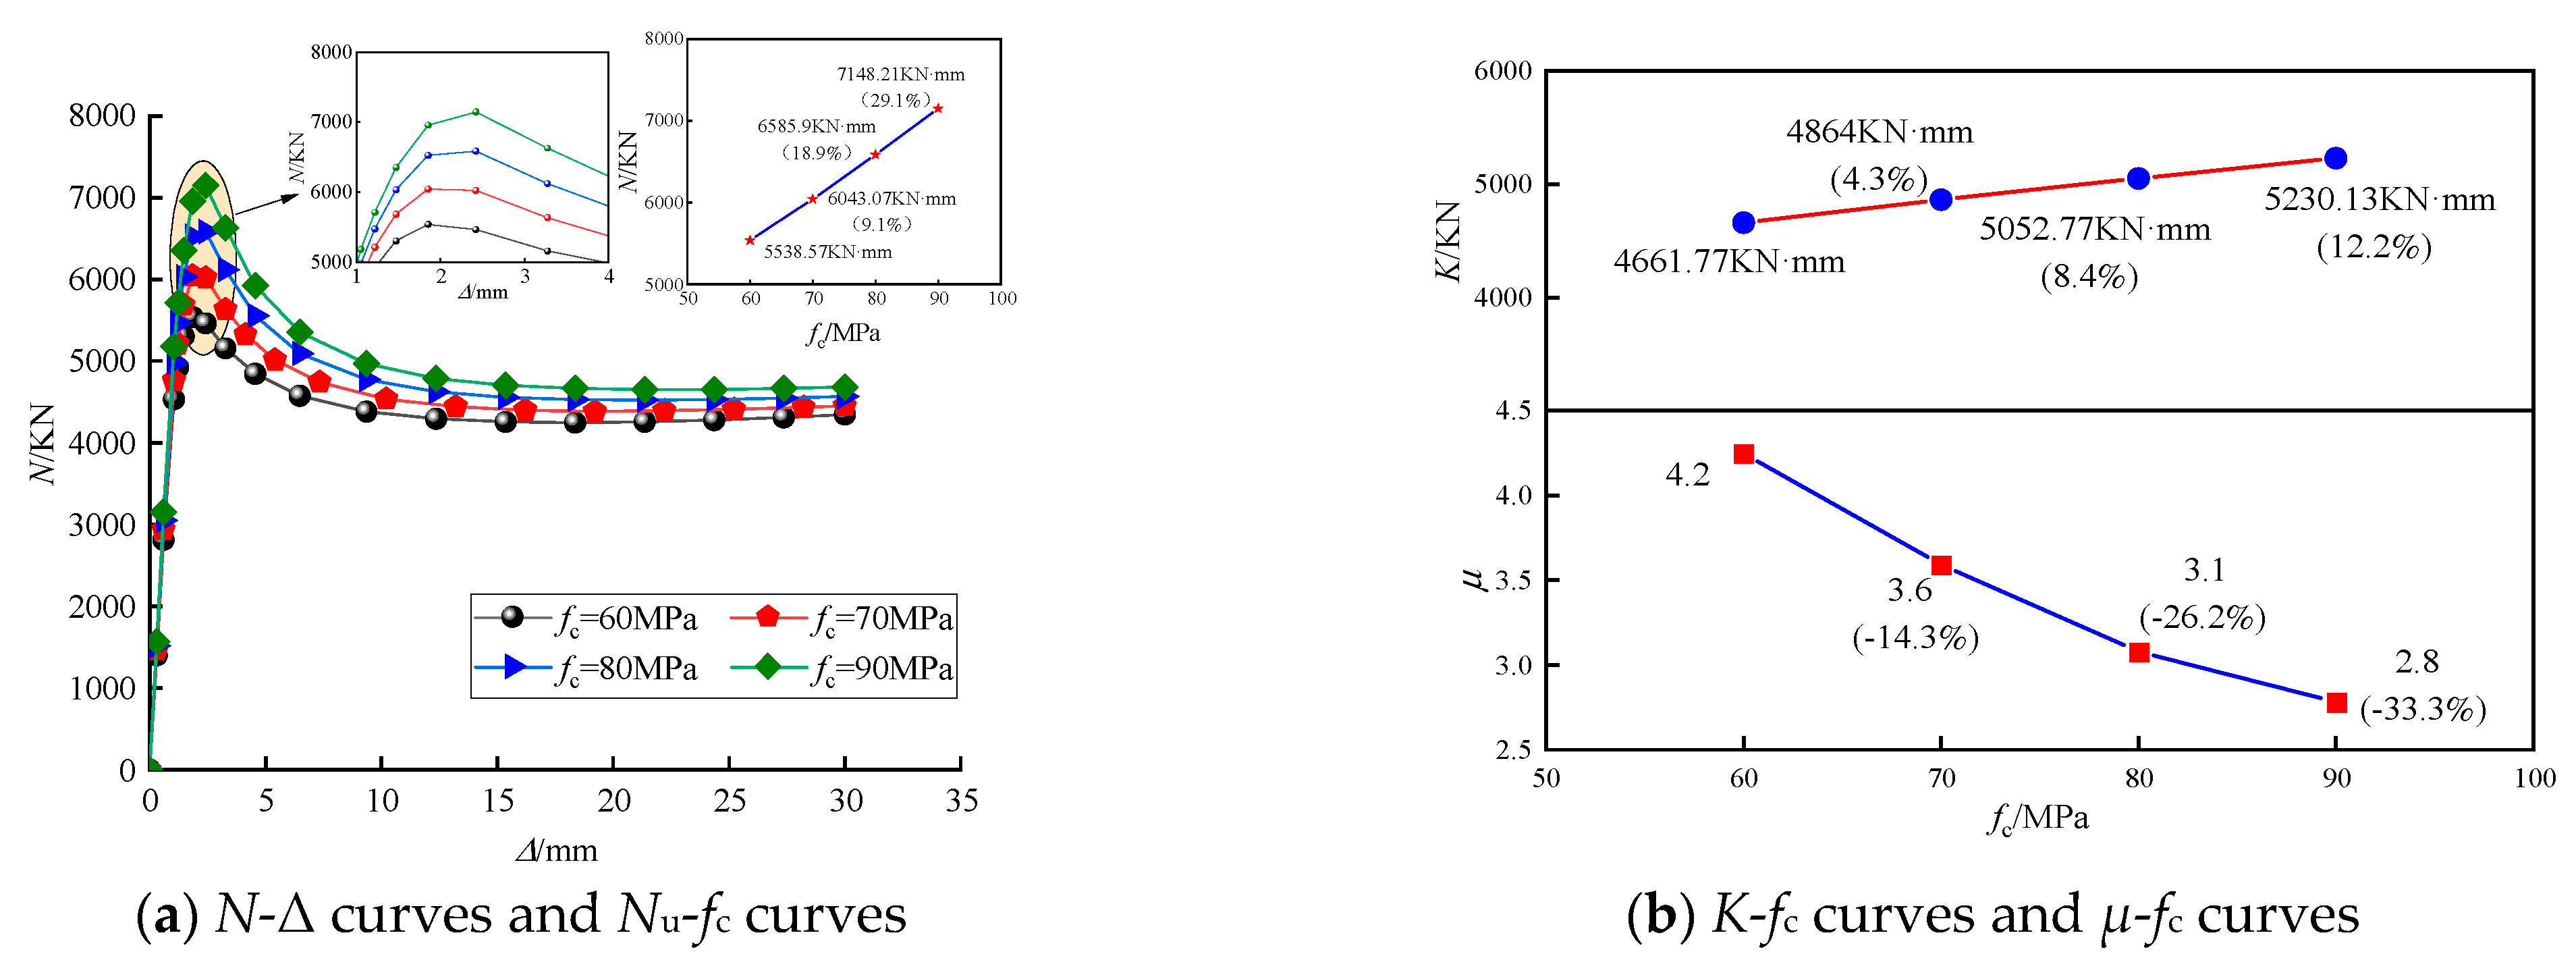
6.4. Concrete Axial Compressive Strength (fc)

The axial compression behavior of specimens with varied concrete strength (fc) was compared and analyzed at a 2.5% gap ratio for GSECFST composite short columns (Figure 14). Figure 14a illustrates that when the gap defect was along the long axis of the ellipse, the concrete strength increased from 60 to 70, 80, and 90 MPa. The axial compression ultimate bearing capacity of the GSECFST composite short columns increased from 5539 to 6043, 6586, and 7148 KN, i.e., a 9.1%, 18.9%, and 29.1% increase, respectively. Figure 14b shows that the initial stiffness of the composite column increased from 4662 to 4864, 5053, and 5230 KN·mm−1, i.e., a 4.3%, 8.4%, and 12.2% increase, respectively. The ductility of the composite columns decreased from 4.2 to 3.6, 3.1, and 2.8, respectively, meaning a 14.3%, 26.2%, and 33.3% decrease, respectively. The results show that the axial compression bearing capacity and initial stiffness of GSECFST composite short columns increased with concrete strength while the ductility decreased. Also, the brittleness of composite columns increased with the concrete strength.

6.5. Steel Tube Thickness (t)

The axial compression behavior of specimens with varied steel tube thicknesses (t) was compared and analyzed when the gap ratio of GSECFST composite short columns was 2.5% (Figure 15). When the gap defect was along the long axis of the ellipse, the thickness of the steel tube increased from 4 to 6, 8 and, 10 mm, and the axial compression ultimate bearing capacity of the GSECFST composite short columns increased from 6184 to 6586, 7065, and 7606.21 KN, i.e., a 11.3%, 14.3%, and 23% increase, respectively. Figure 15b shows that the initial stiffness of the composite column increased from 4585 to 5053, 5533, and 6020 KN·mm−1, i.e., a 10.2%, 20.7%, and 31.3% increase, respectively. Also, the ductility of the composite column increased from 2.68 to 3.08, 3.60, and 5.02, meaning a 14.9%, 34.3%, and 87.3% increase, respectively. The results show that the steel tube thickness increased the axial compression bearing capacity, initial stiffness, and ductility of the GSECFST composite short columns. The increase in the steel tube thickness was more significant for the specimen’s ductility.

6.6. Steel Cross-Sectional Area (Asy)

The axial compression behavior of the specimens with varied steel section area (Asy) was compared and analyzed at a 2.5% gap ratio of GSECFST composite short columns (Figure 16). Figure 16a suggests that when the gap defect was along the long axis of the ellipse, the cross-sectional area of the steel increased from 2700 to 3115, 3520, and 3915 mm2. The axial compression ultimate bearing capacity of the GSECFST composite short columns increased from 6586 to 6697, 6805, and 6914 KN, increasing by 1.7%, 3.3%, and 5.0%, respectively. We observe from Figure 16b that the initial stiffness of the composite column increased from 5053 to 5172, 5291, and 5409 KN·mm−1, increasing by 2.4%, 4.7%, and 7.1%, respectively. The ductility of the composite column increased from 3.08 to 3.21, 3.39, and 3.57, i.e., 4.2%, 10.1%, and 15.9%, respectively. The results show that the steel tube thickness increased the axial compression bearing capacity, initial stiffness, and ductility of the GSECFST composite short columns. Increasing the steel’s cross-sectional area improved the composite column’s axial compression bearing capacity.

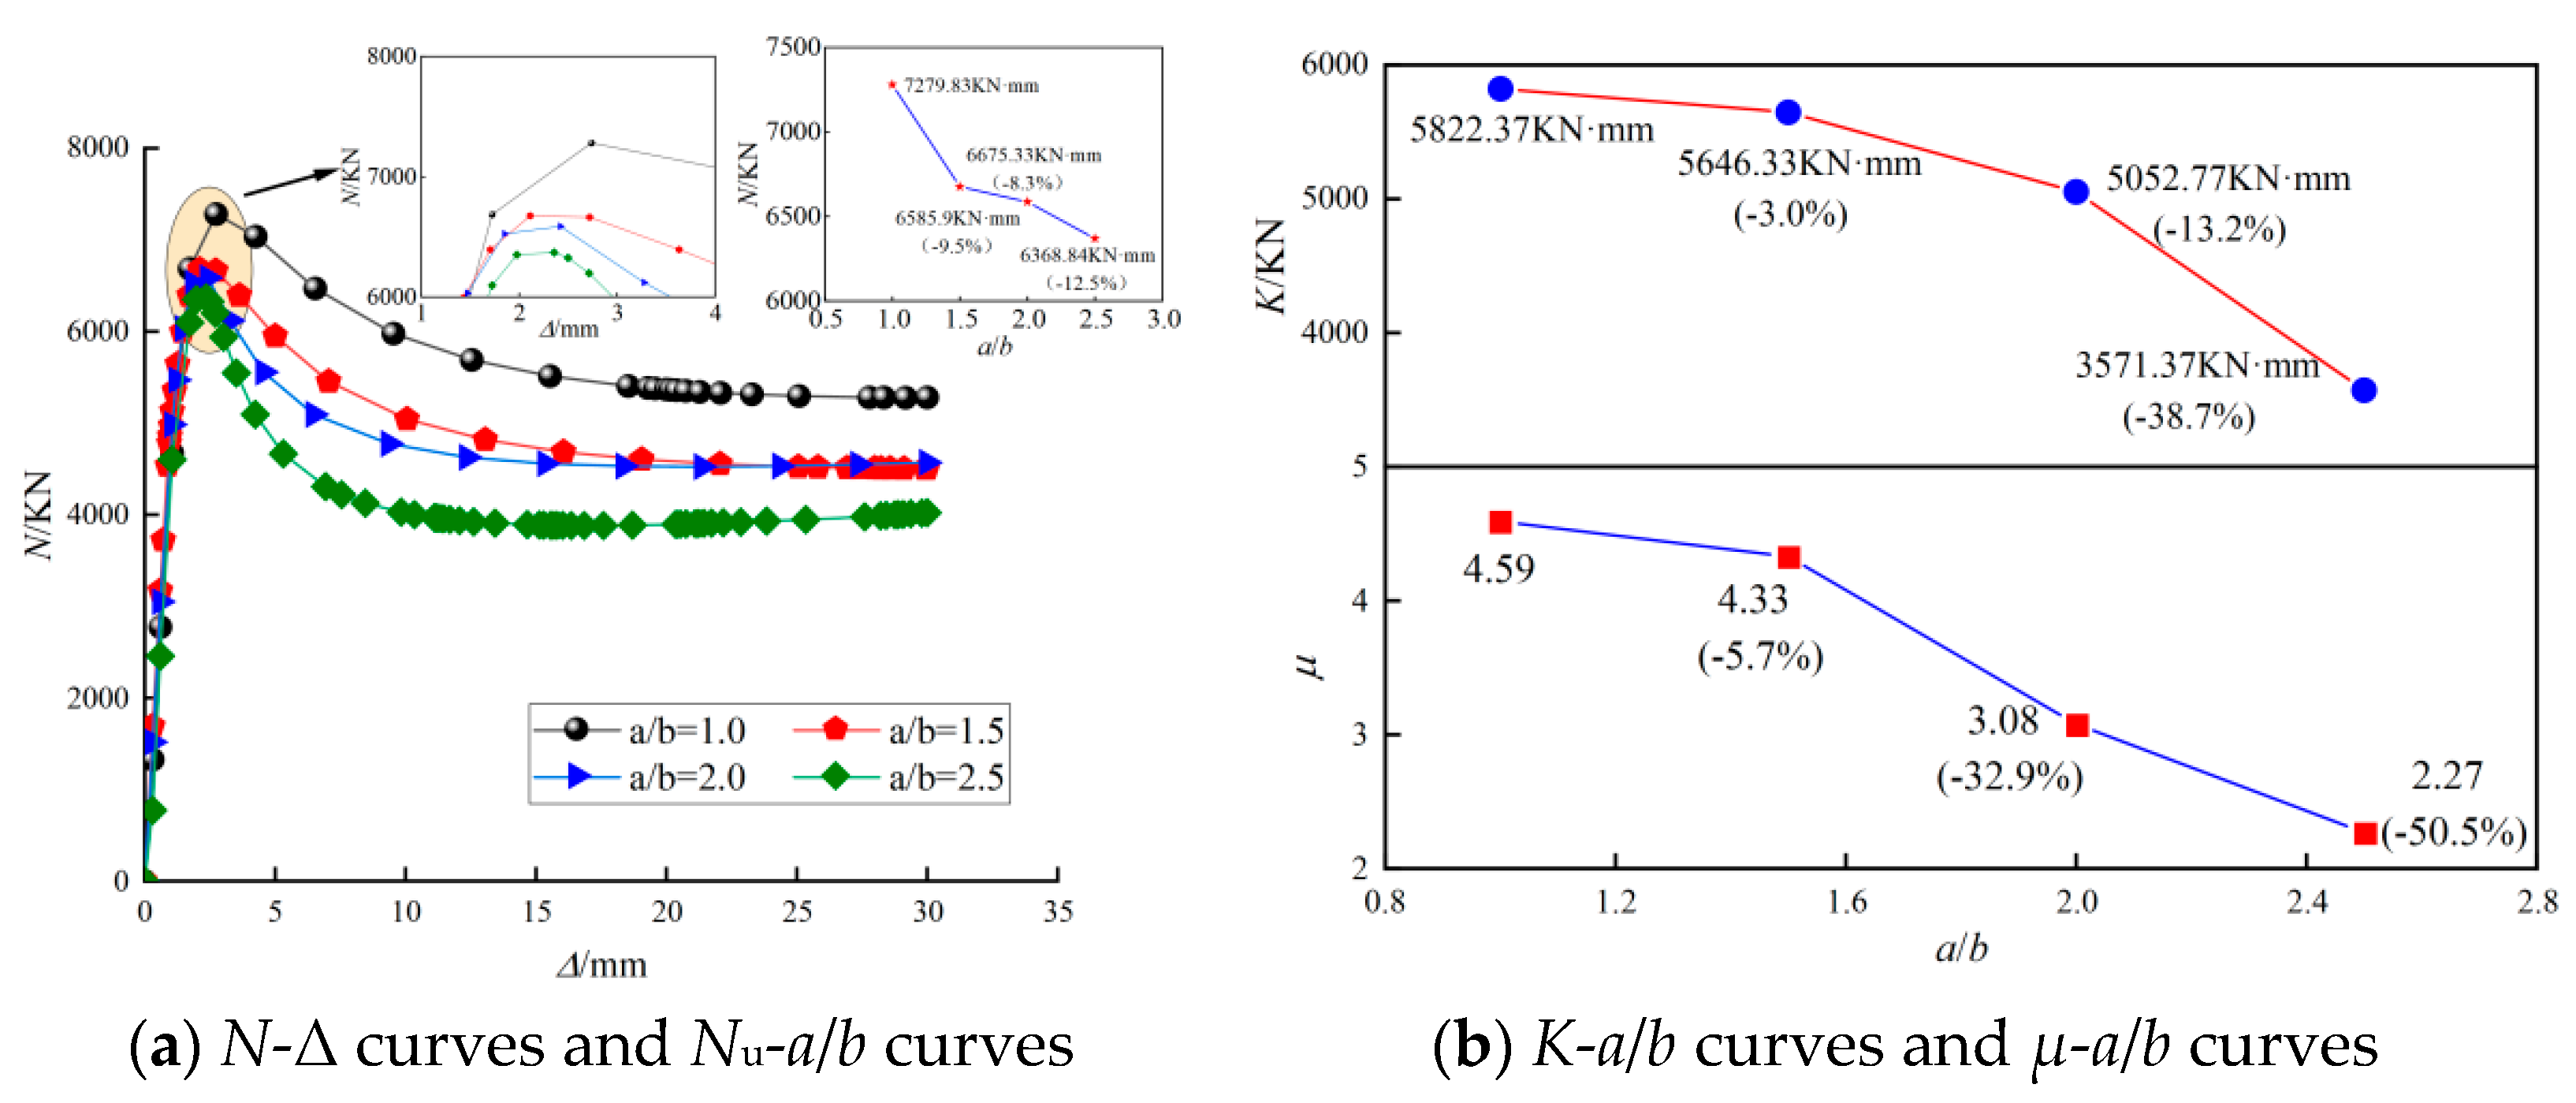
6.7. Long and Short Half Axis Ratio (a/b)

The axial compression behavior of different elliptical specimens with long and short axis ratios (a/b) was compared and analyzed when the gap ratio of GSECFST composite short columns was 2.5% (Figure 17). When the gap defect was along the long axis of the ellipse (Figure 1a), the ratio of the long axis to the short axis increased from 1.0 to 1.5, 2.0, and 2.5, while the axial compression ultimate bearing capacity decreased from 7280 to 6675, 6586, and 6369 KN, respectively, decreasing by 8.3%, 9.5%, and 12.5%. Figure 17b shows that the initial stiffness of the composite column decreased from 5822 to 5646, 5053, and 3571 KN·mm−1, i.e., a 3.0%, 13.2%, and 38.7% decrease, respectively. The ductility of the composite column decreased from 4.59 to 4.33, 3.08, and 2.27, which decreased by 5.7%, 32.9%, and 50.5%, respectively. The results show that the axial compression bearing capacity, initial stiffness, and ductility of the GSECFST composite short columns decrease with the increase of the elliptical specimen’s long and short axis ratio. Increasing the long and short axis ratio of the elliptical specimen would reduce the behavior of the GSECFST composite short columns.

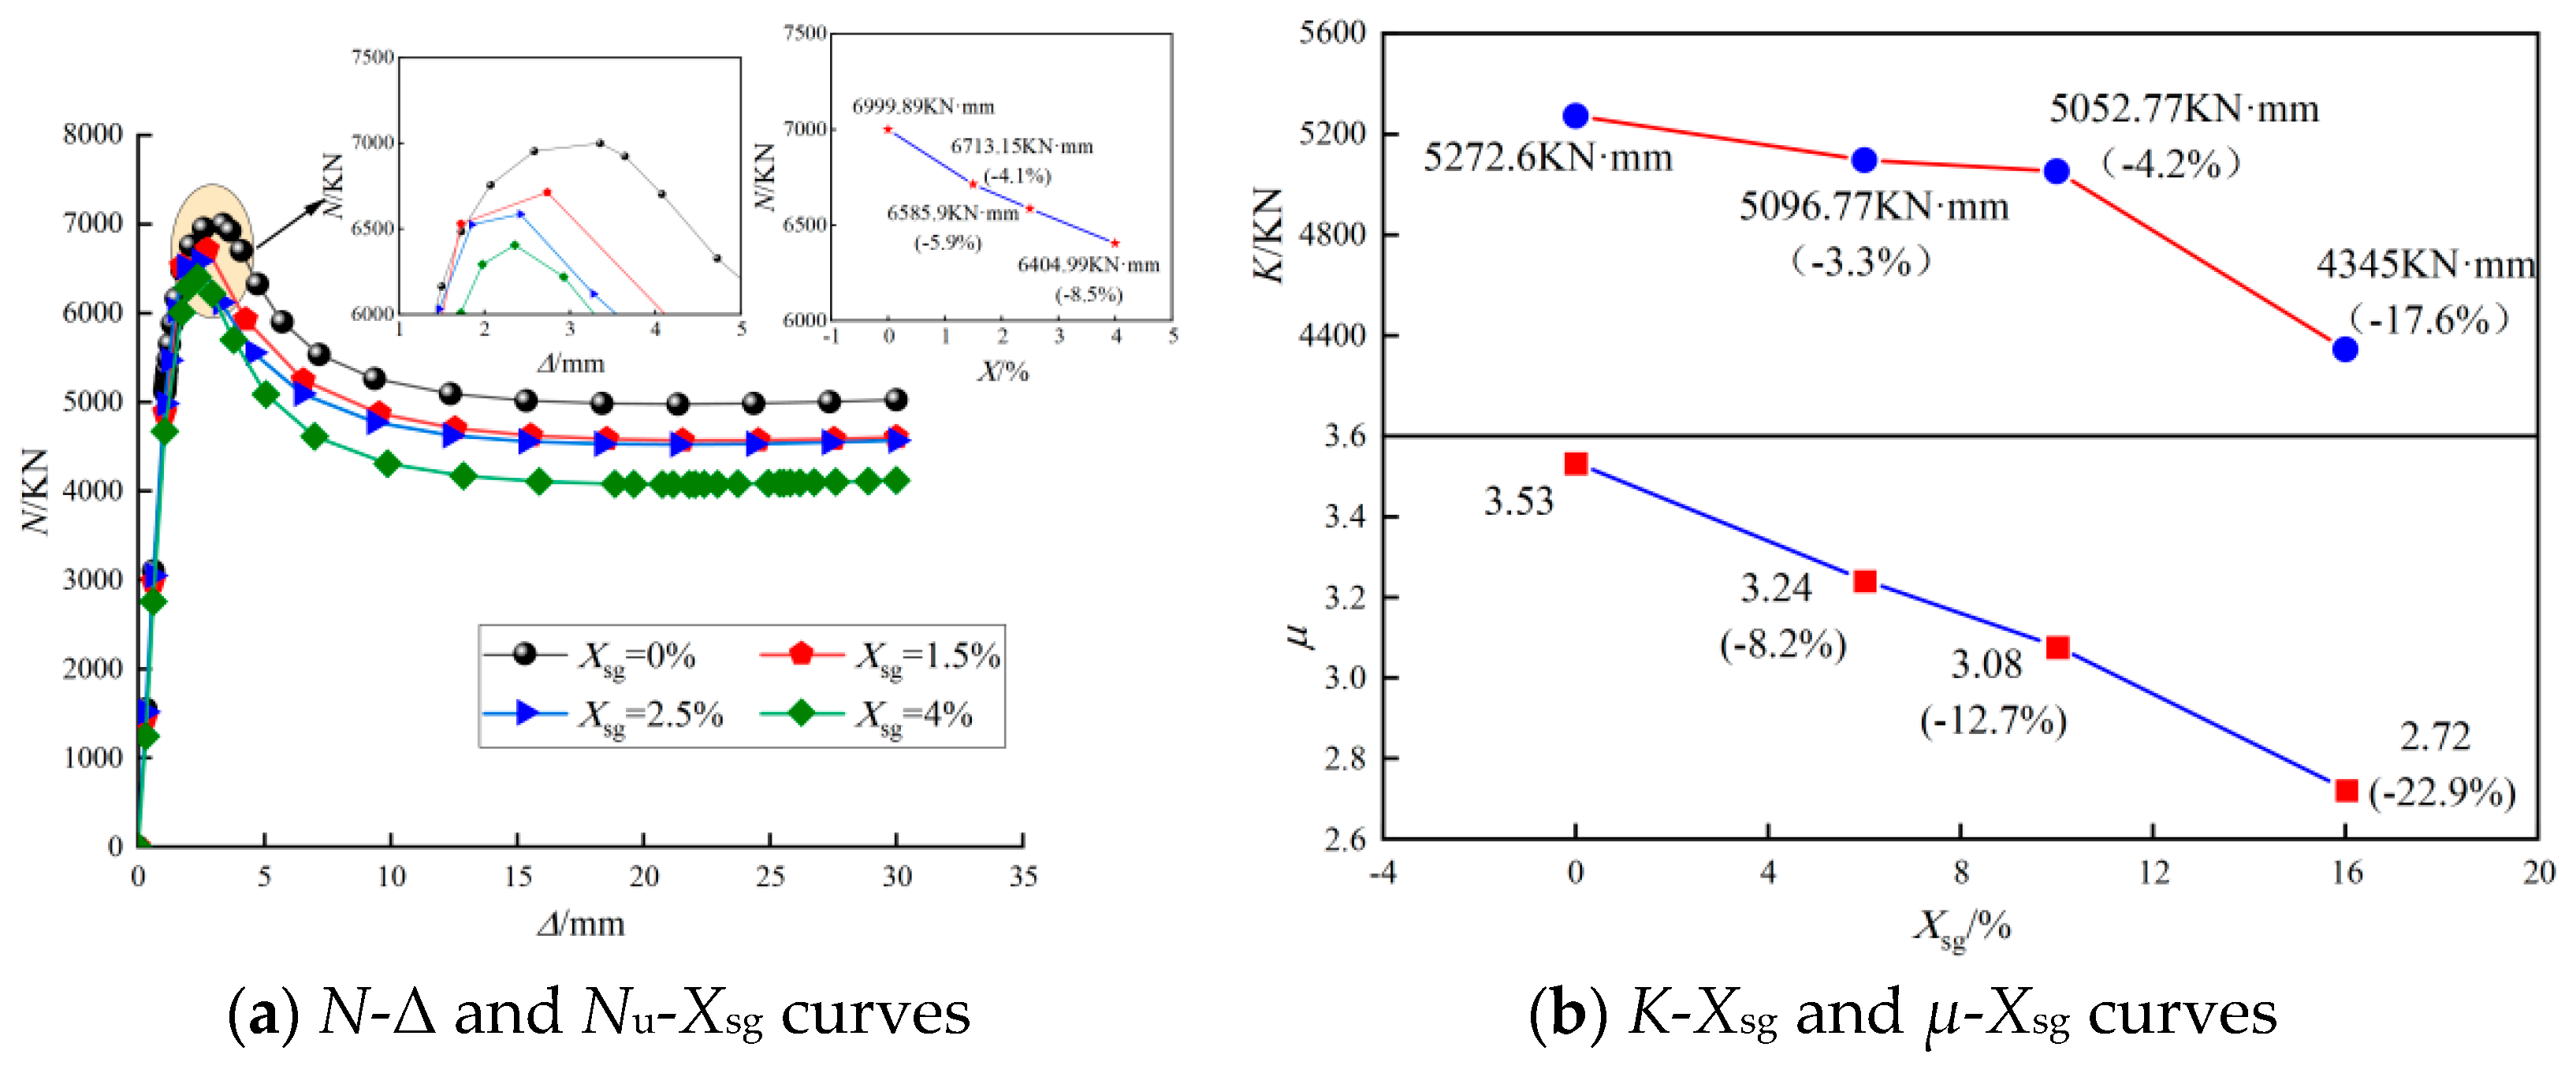
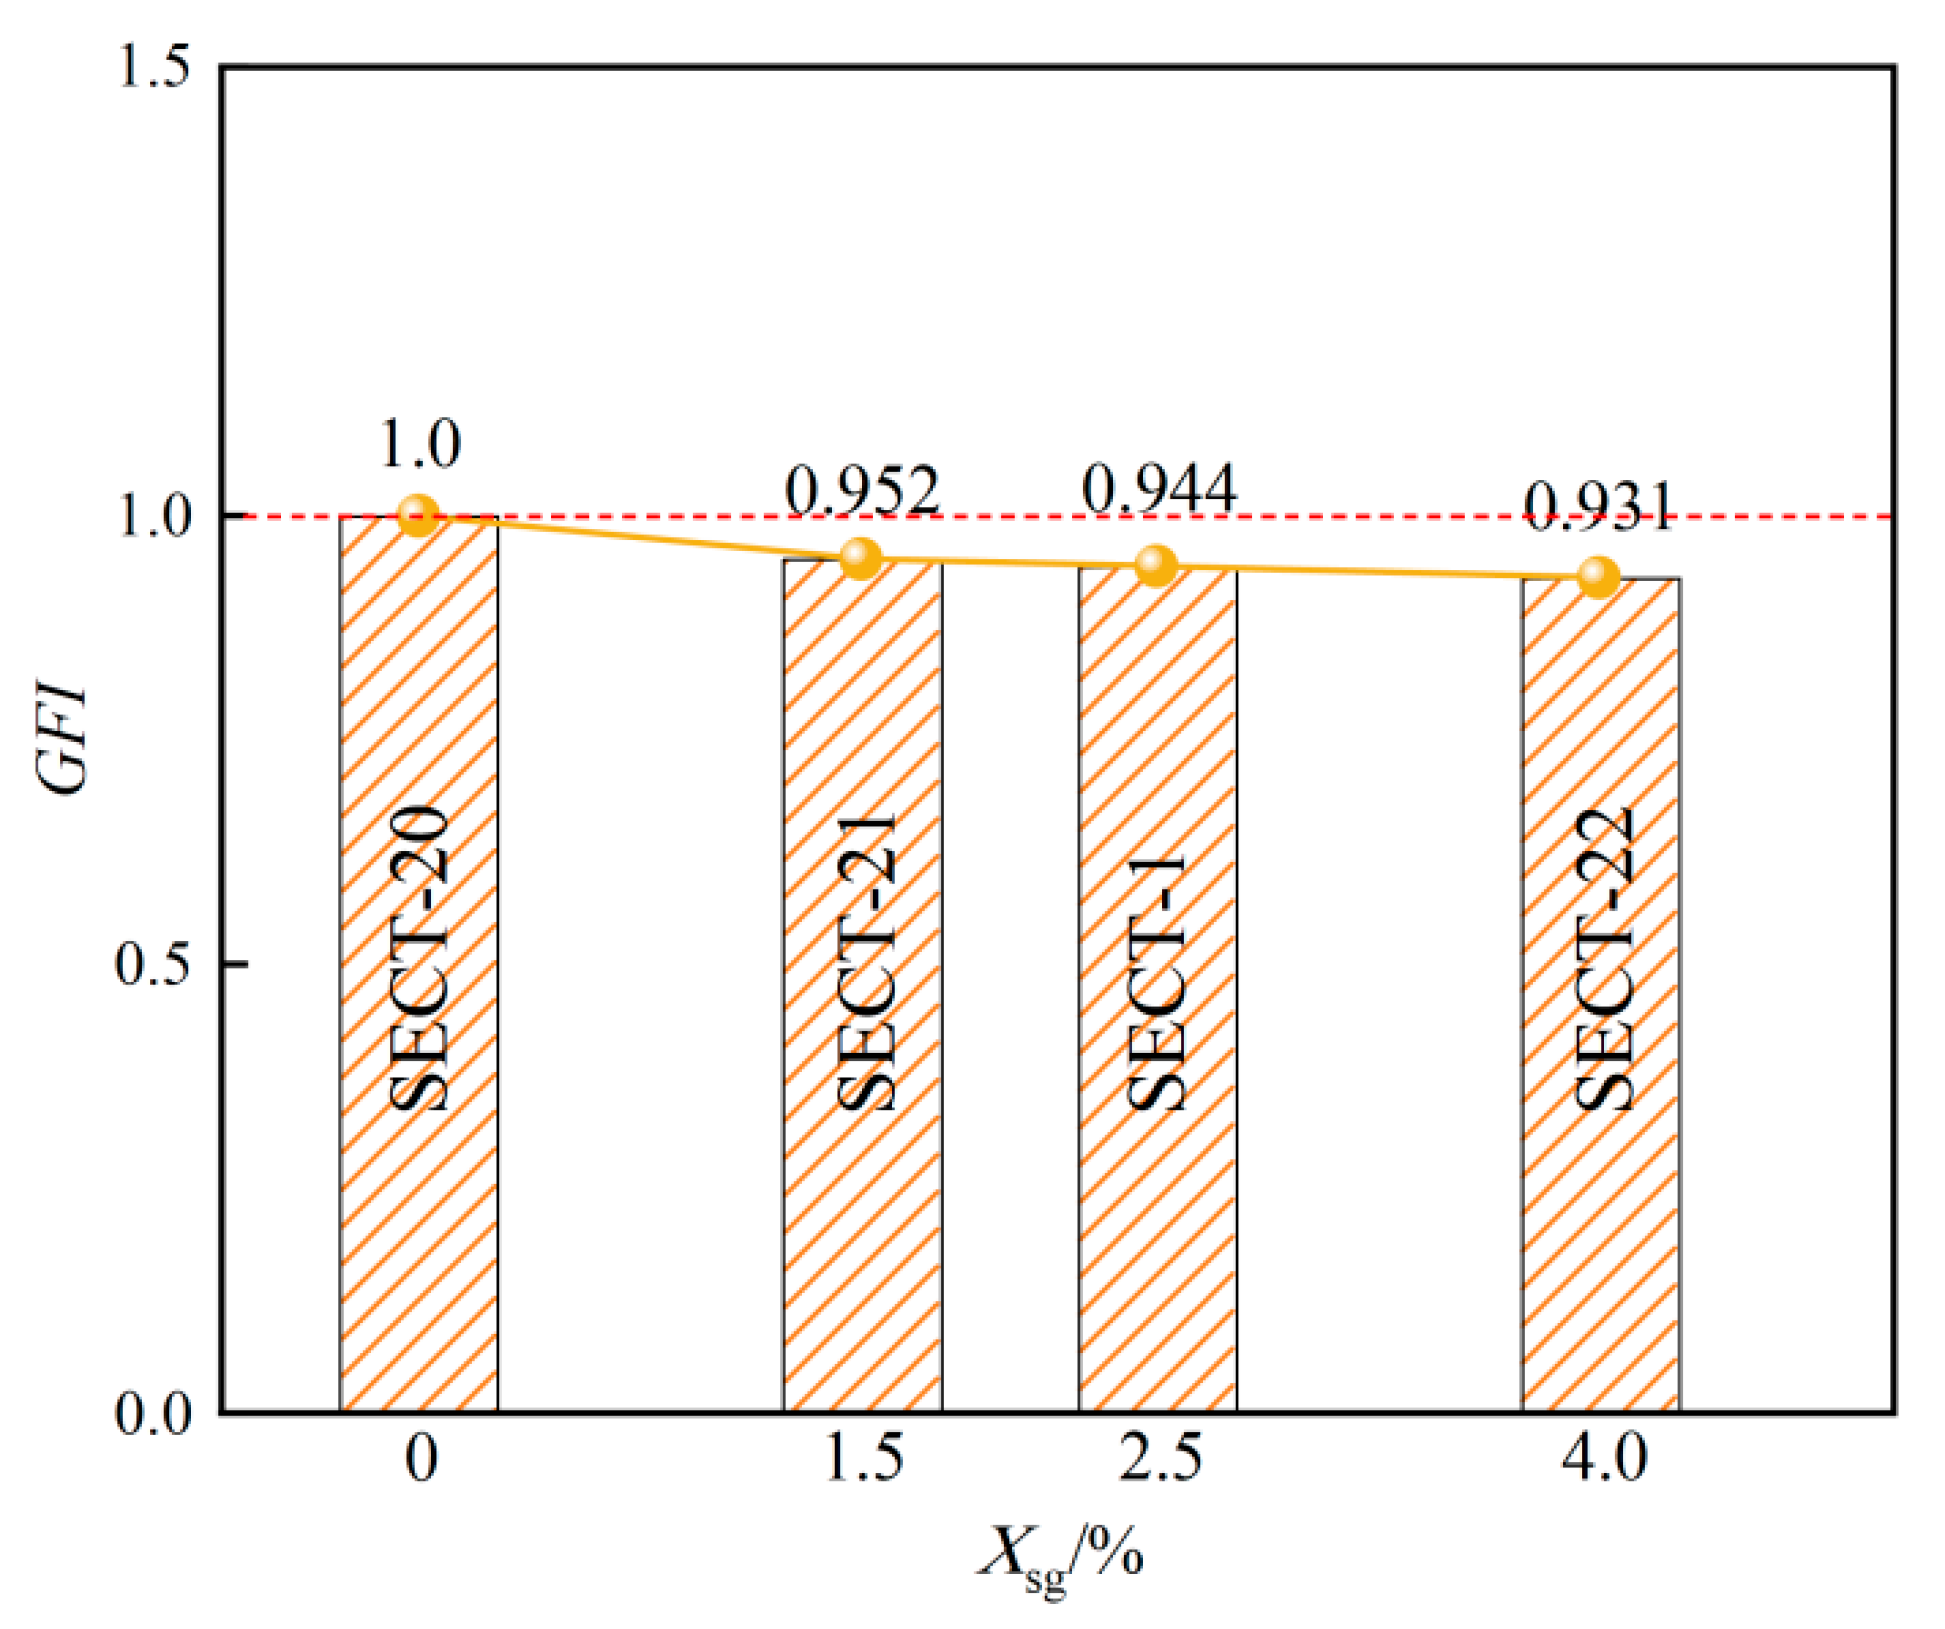
6.8. The Gap Ratio (Xsg)

The axial compression behavior of GSECFST composite short columns under varied gap ratios (Xsg) was compared and analyzed (Figure 18). When the gap was along the long axis of the ellipse, the axial compression bearing capacity of the specimens with the gap ratio of 1.5%, 2.5%, and 4.0% decreased from 7000 to 6713, 6586, and 6405 KN, respectively. The non-gap steel-concrete fill elliptical steel tube short column decreased by 4.1%, 5.9%, and 8.5%, respectively. Also, the initial stiffness of the composite column decreased from 5273 to 5097, 5053, and 4345 KN·mm−1, i.e., a 3.3%, 4.2%, and 17.6% decrease, respectively (Figure 18b). The ductility of the composite column decreased from 3.53 to 3.24, 3.08, and 2.72, decreasing by 8.2%, 12.7%, and 22.9%, respectively. The results show that the axial compression bearing capacity, initial stiffness, and ductility of GSECFST composite short columns decreased with increased gap ratio.

6.9. The Slenderness Ratio (λ)

The axial compression behavior of various elliptical specimens with slenderness ratio (λ) was compared and analyzed when the gap ratio of GSECFST composite short columns was 2.5% (Figure 19). When the gap defect was along the long axis of the ellipse, the slenderness ratio (λ) increased from 1.5 to 2.0, 2.5, and 3.0. Simultaneously, the axial compression ultimate bearing capacity decreased from 6789 to 6586, 6506, and 6395 KN, decreasing by 2.99%, 4.2%, and 5.8%, respectively. Figure 19b suggests that the initial stiffness of the composite column decreased from 5261 to 5053, 47,944, and 4615 KN·mm−1, decreasing by 3.9%, 8.9%, and 12.3%, respectively. The ductility of the composite column decreased from 3.37 to 3.08, 2.87, and 2.73, decreasing by 9.4%, 16.2%, and 20.7%, respectively. The axial compression bearing capacity, initial stiffness, and ductility of the GSECFST composite short columns decreased with the increase in the slenderness ratio of the elliptical specimen, which, in turn, lowered the behavior of the GSECFST composite short columns.

7. Force Mechanism

7.1. Failure Mode

The finite element analysis shows that under the axial compression N, the stress cloud diagram of the steel skeleton concrete-elliptical steel tube short column without gap defect is shown in Figure 20a. Due to the slight curvature of the steel tube along the short axis, the confinement effect on the core concrete was relatively weak, causing the core concrete brittle shear failure along the short axis under axial compression. In addition to this mode, the local concave buckling failure of the steel tube would occur along the long axis of the GSECFST composite short column. When the gap ratio was 4% (Figure 20b), the gap affected the interaction between the steel tube and the core concrete, showing a similar bias under axial compression. The steel tube on the gap side begins to buckle inward due to the lack of support from the core concrete. The specimen is biased toward the gap side (Figure 21 and Figure 22). Figure 21 shows the failure mode of each component of the specimen. Here, the steel tube in the mid-span area was buckled, and the steel skeleton and the core concrete expanded outward. The concrete strain was mainly concentrated in the area with a small curvature of the steel tube toward the short axis, indicating that most small curvature concretes toward the short axis were crushed. The synergistic deformation ability between steel, steel tube, and concrete was excellent, suggesting that steel tubes can provide a better constraint for core concrete and steel. At the same time, steel as the core of the column strengthens the core concrete’s constraint and avoids the core concrete’s premature brittle shear failure. Under the constraint of steel tube and steel skeleton, the structural risk caused by the high brittleness of core concrete was effectively reduced.
The deformation diagram of the steel tube is shown in Figure 22. The buckling failure occurred in the middle of the specimens under axial compression, and the steel tube and concrete at the measuring point B in the long axis direction bulged outward together. Due to the void at point A in the long axis direction of the specimen, the concrete did not contact the inside of the steel pipe, so only the steel pipe bulged outward, deforming the steel pipe at the measuring point B on the opposite side of the void defect more than at point A.

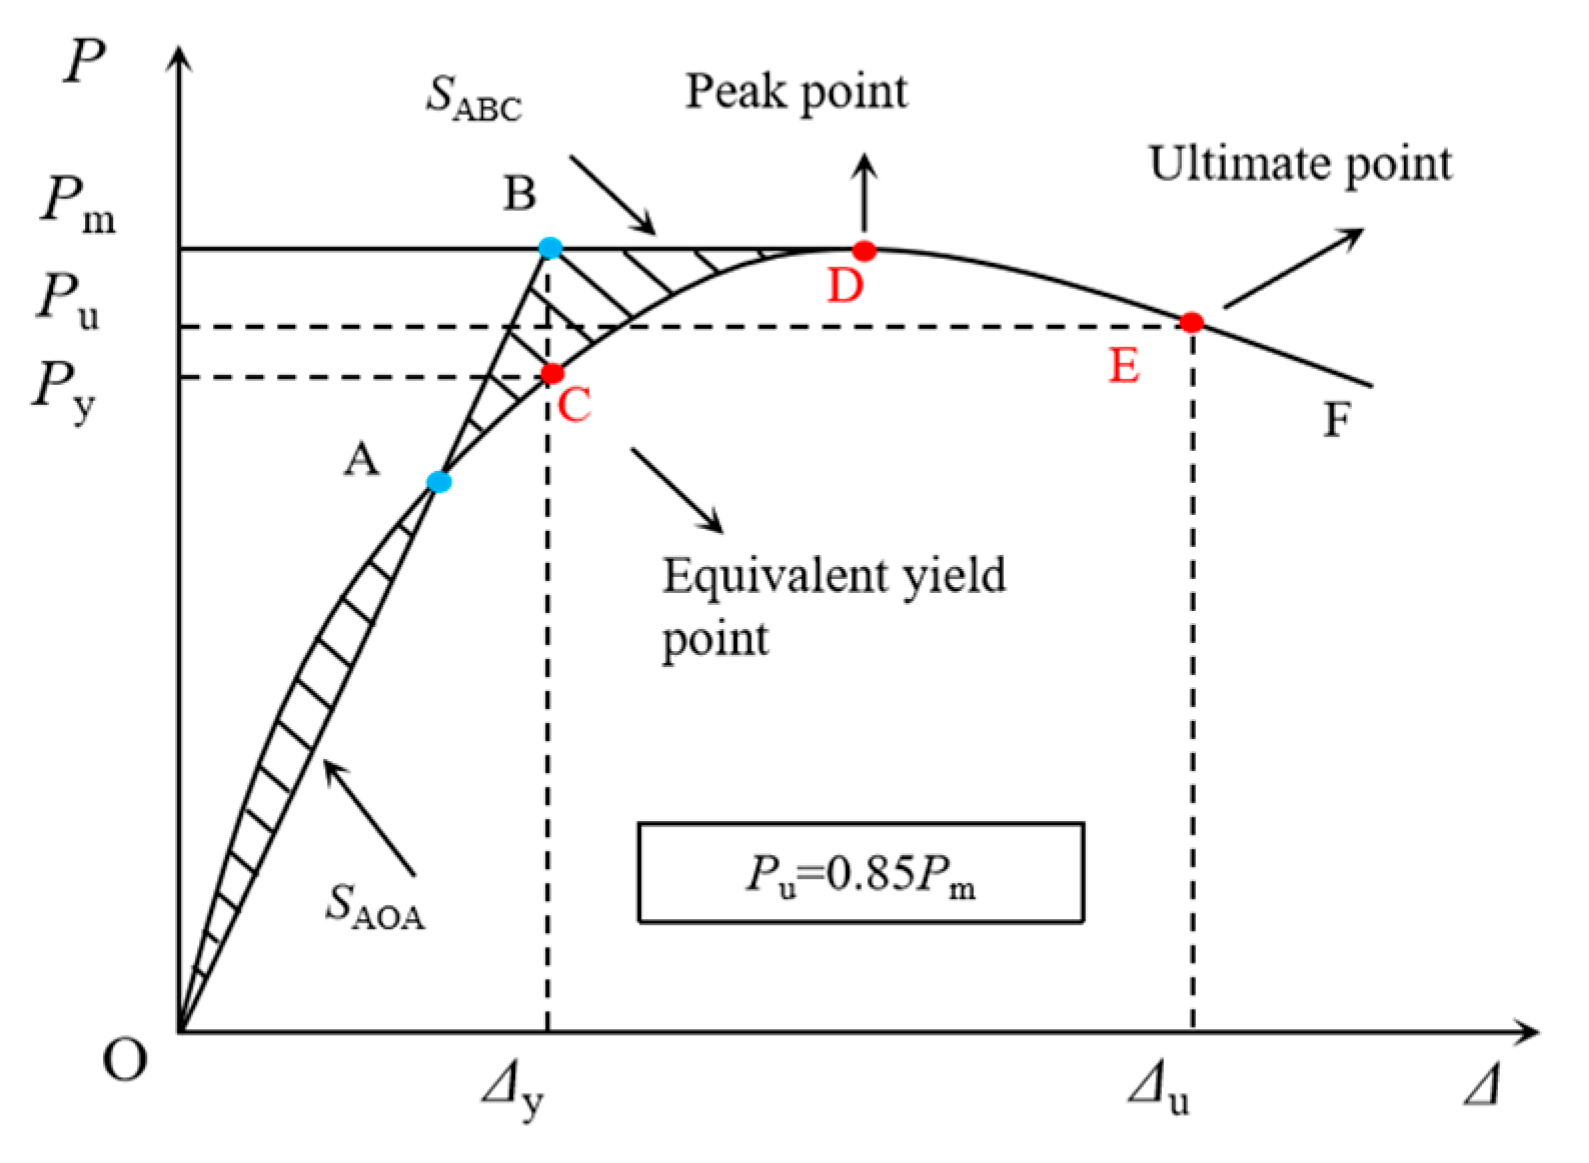
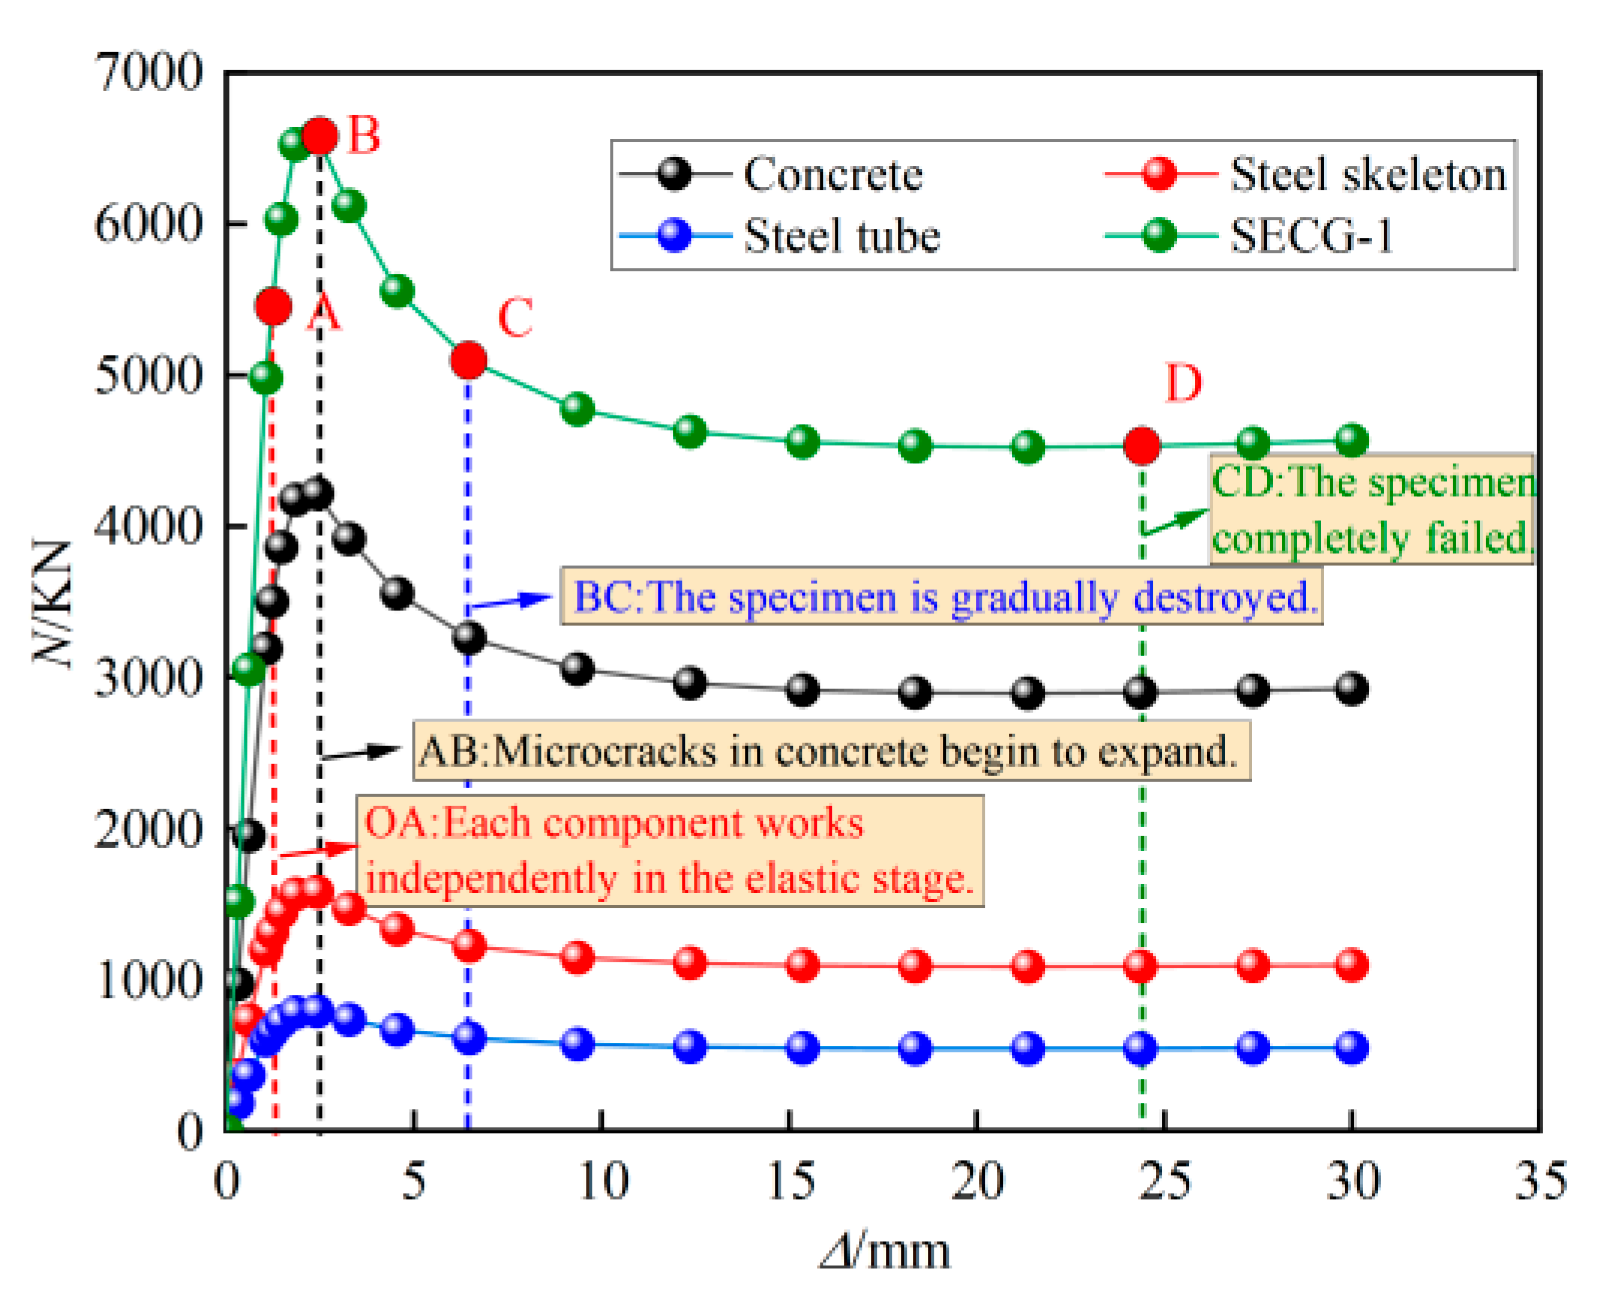
7.2. Whole N-Δ Process Analysis

The stress process of the GSECFST composite short column under axial load is divided into four stages: elastic stage, elastic-plastic stage, plastic stage, and failure stage. The load-displacement curve of the specimen SECT-1 is shown in Figure 23, while Figure 24 depicts the axial force distribution diagram of each component of the specimen SECT-1. Combining Figure 23 and Figure 24, the whole process of the composite column is analyzed.
The OA section was in the elastic stage (Figure 23), where the N-Δ curve was approximately linear. At this stage, the steel skeleton, steel tube, and concrete worked independently, and each component was in the elastic stage. Also, the load-displacement curve of the composite column changed linearly. As the load gradually increased, the steel reached the proportional limit. The specimen began to enter the elastic-plastic stage, and point A is roughly equivalent to the starting point of the steel entering the elastic-plastic stage.
The AB section was an elastic-plastic stage (Figure 23). At this time, the steel skeleton and the steel tube reached the yield strength, the micro-cracks in the concrete began to expand continuously, and the load-displacement curve of the specimen started to show nonlinear growth. The elastic modulus of steel decreased gradually, while the elastic modulus of concrete decreased slowly with the increase of steel tube constraints. This change in the relative proportion of stiffness would increase the bearing capacity of the core concrete, continuously increasing the transverse deformation coefficient of the concrete. Before point B, the cylinder was thicker, but the deformation was uniform. Also, no local buckling existed on the specimen surface. At this time, due to the steel tube constraints, the ultimate bearing capacity of concrete began to increase, and the bearing capacity of the specimen exceeded the sum of the bearing capacity of steel, steel tube, and concrete alone. The load-displacement curve of the specimen decreased after reaching point B, and the composite column reached the ultimate bearing capacity. Then, the specimen entered the plastic stage BC section.
The BC stage is the first stage of the plastic stage (Figure 23). After the steel yields, the load increment was borne by the core concrete alone, increasing the axial stress and strain of the concrete, while the lateral strain increased rapidly. The interaction among the concrete, the steel, and the steel tube intensified. This interaction improved the concrete’s poor ductility. At this time, the bearing capacity of the composite column began to decrease with increased displacement, and the steel tube in the middle of the short axis of the composite column began to yield outward. Due to the simplified double broken line constitutive model of the steel pipe, the stress value remained constant at the later loading stage. However, due to the strengthening of the interaction between the steel and the concrete, the stress value of the steel still rose at the stage when the yield strength stress value of the steel pipe was constant, thereby decreasing the rate of the load-displacement curve of the composite column after B point slowed down. Then, the specimen entered the complete failure stage CD.
The CD stage was the complete failure stage of the composite column (Figure 23). At this stage, the degree of outward buckling of the steel tube along the short axis increased gradually, and the concrete in the middle of the column began to be crushed. Here, the bearing capacity of the composite column decreased again and never rose again. With increased displacement load, the bearing capacity of the composite column began stabilizing, and the composite column was destroyed entirely.

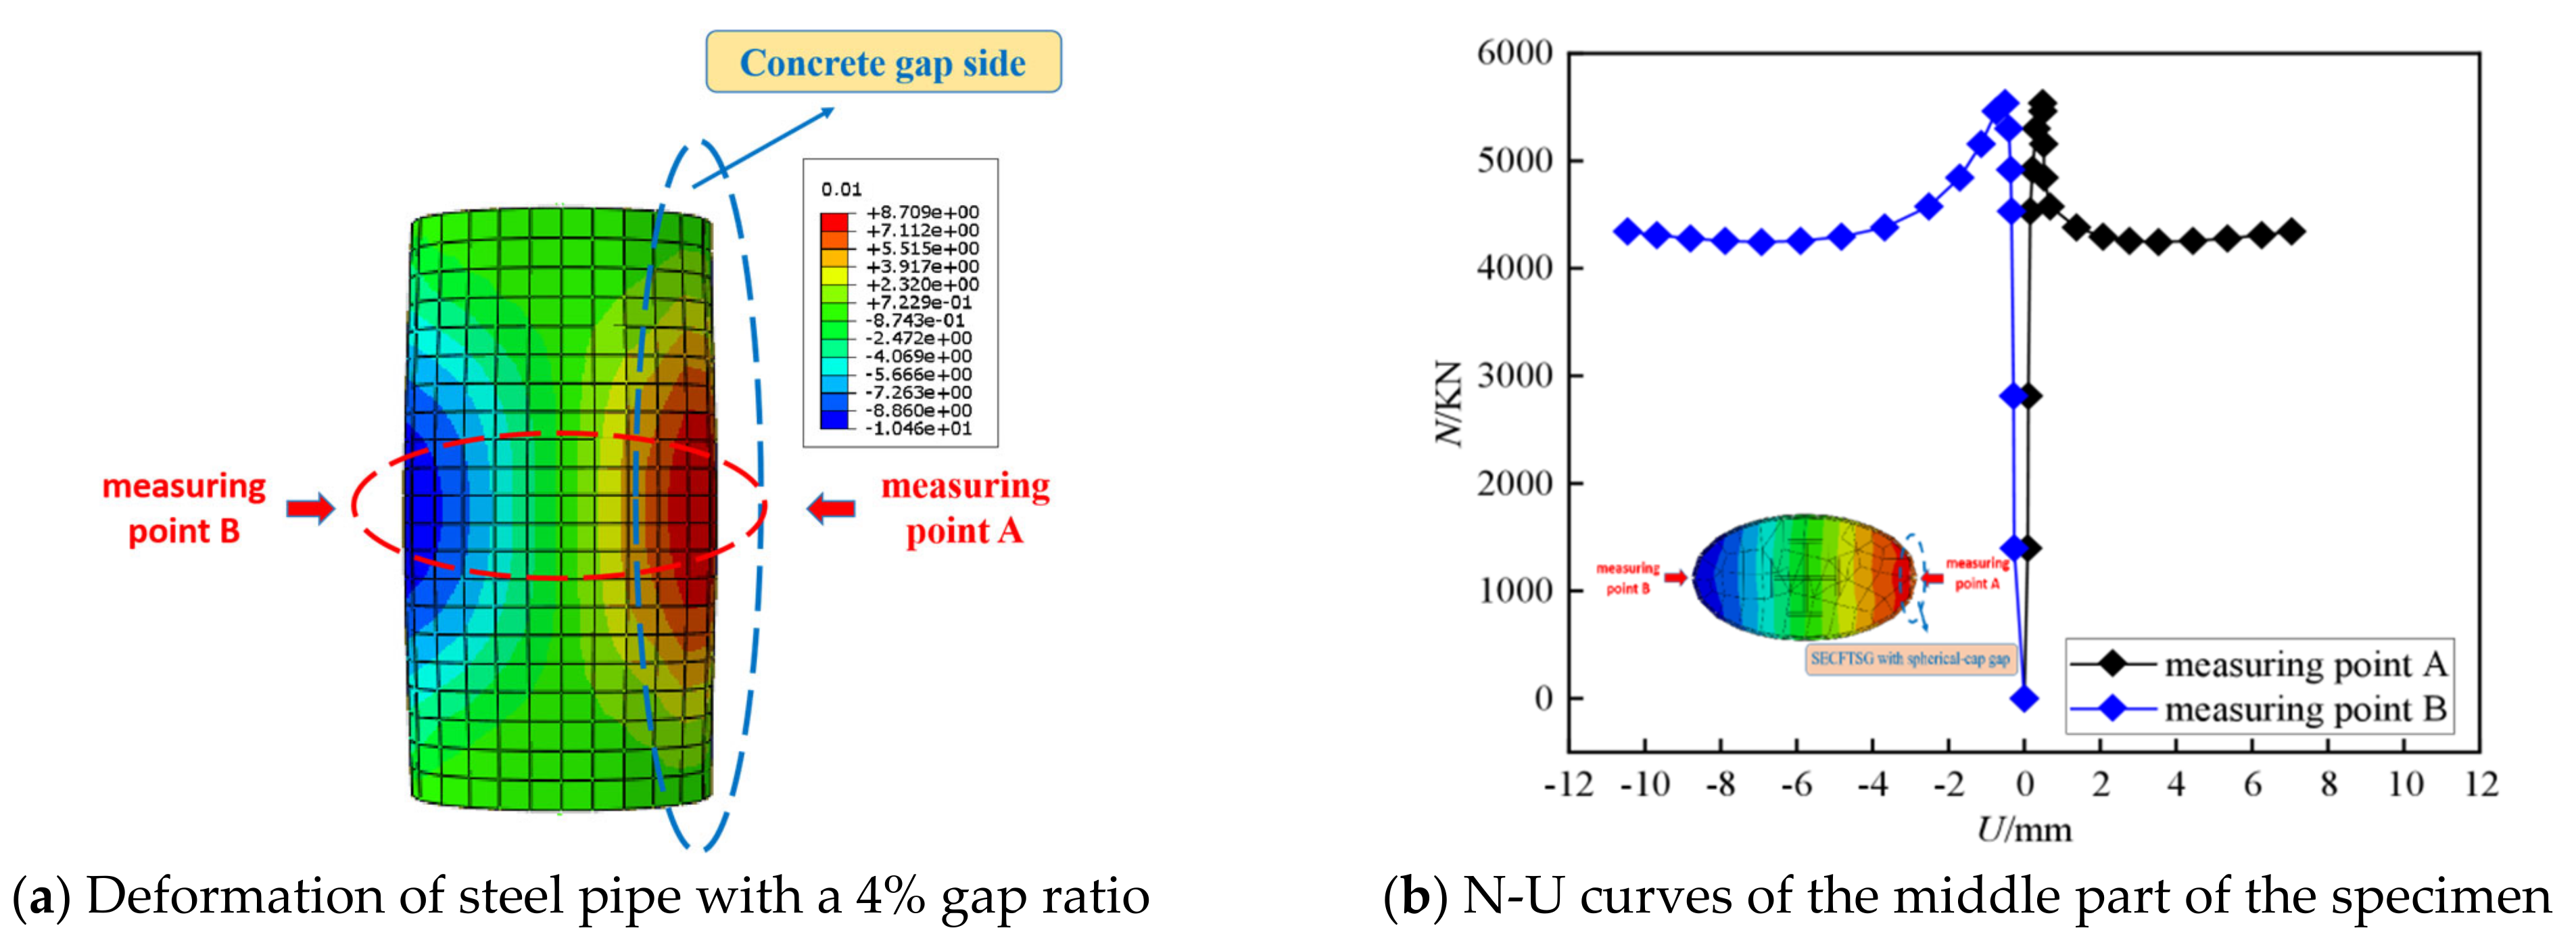
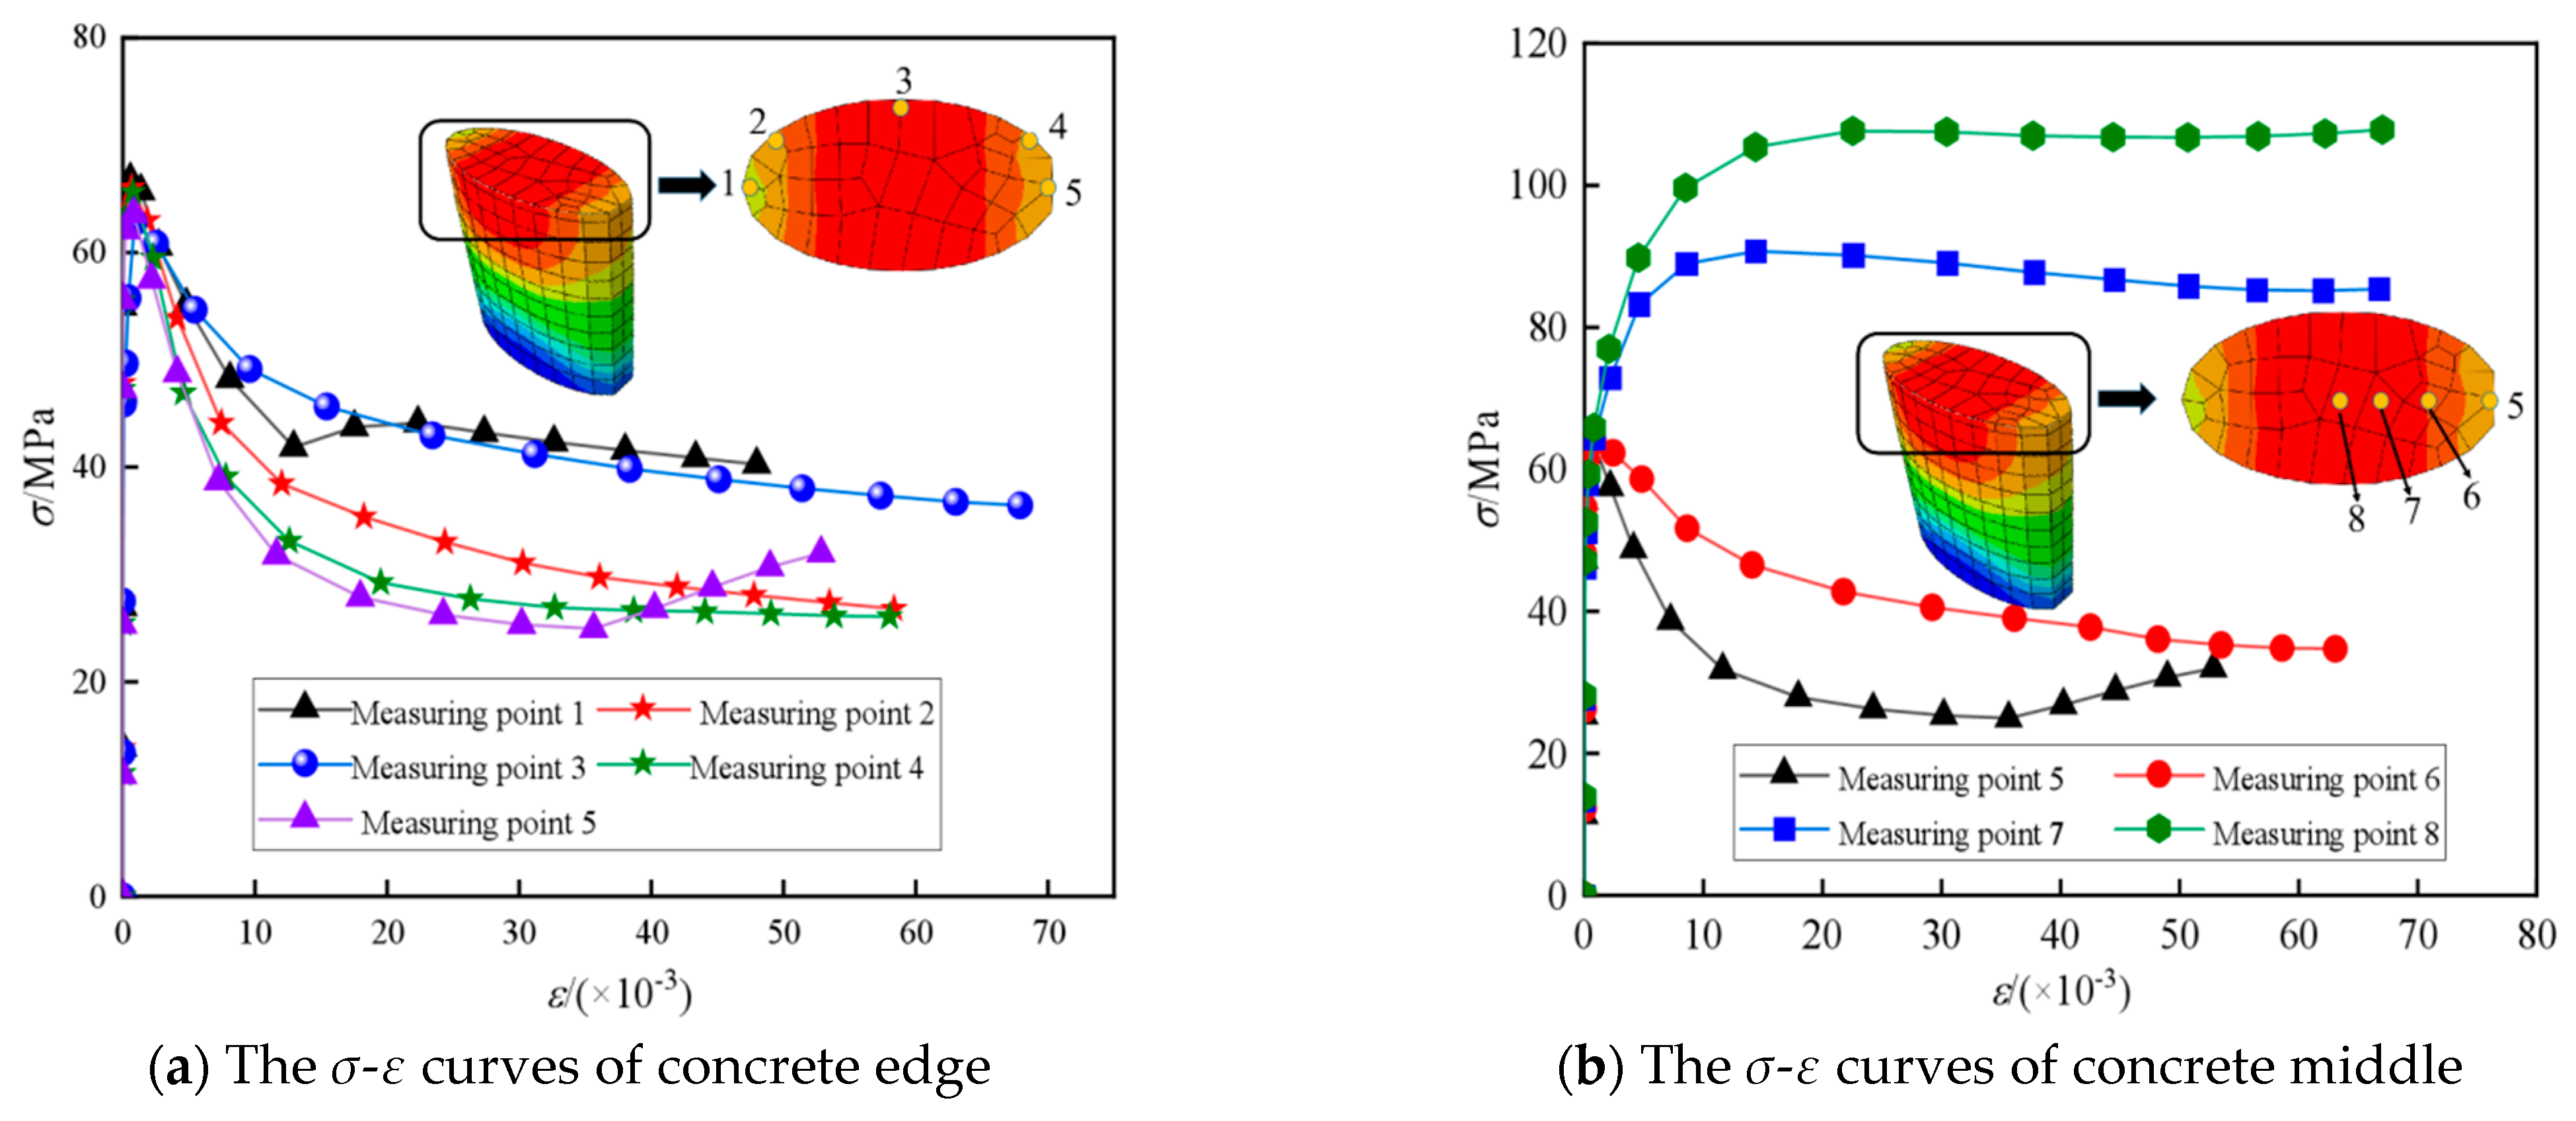
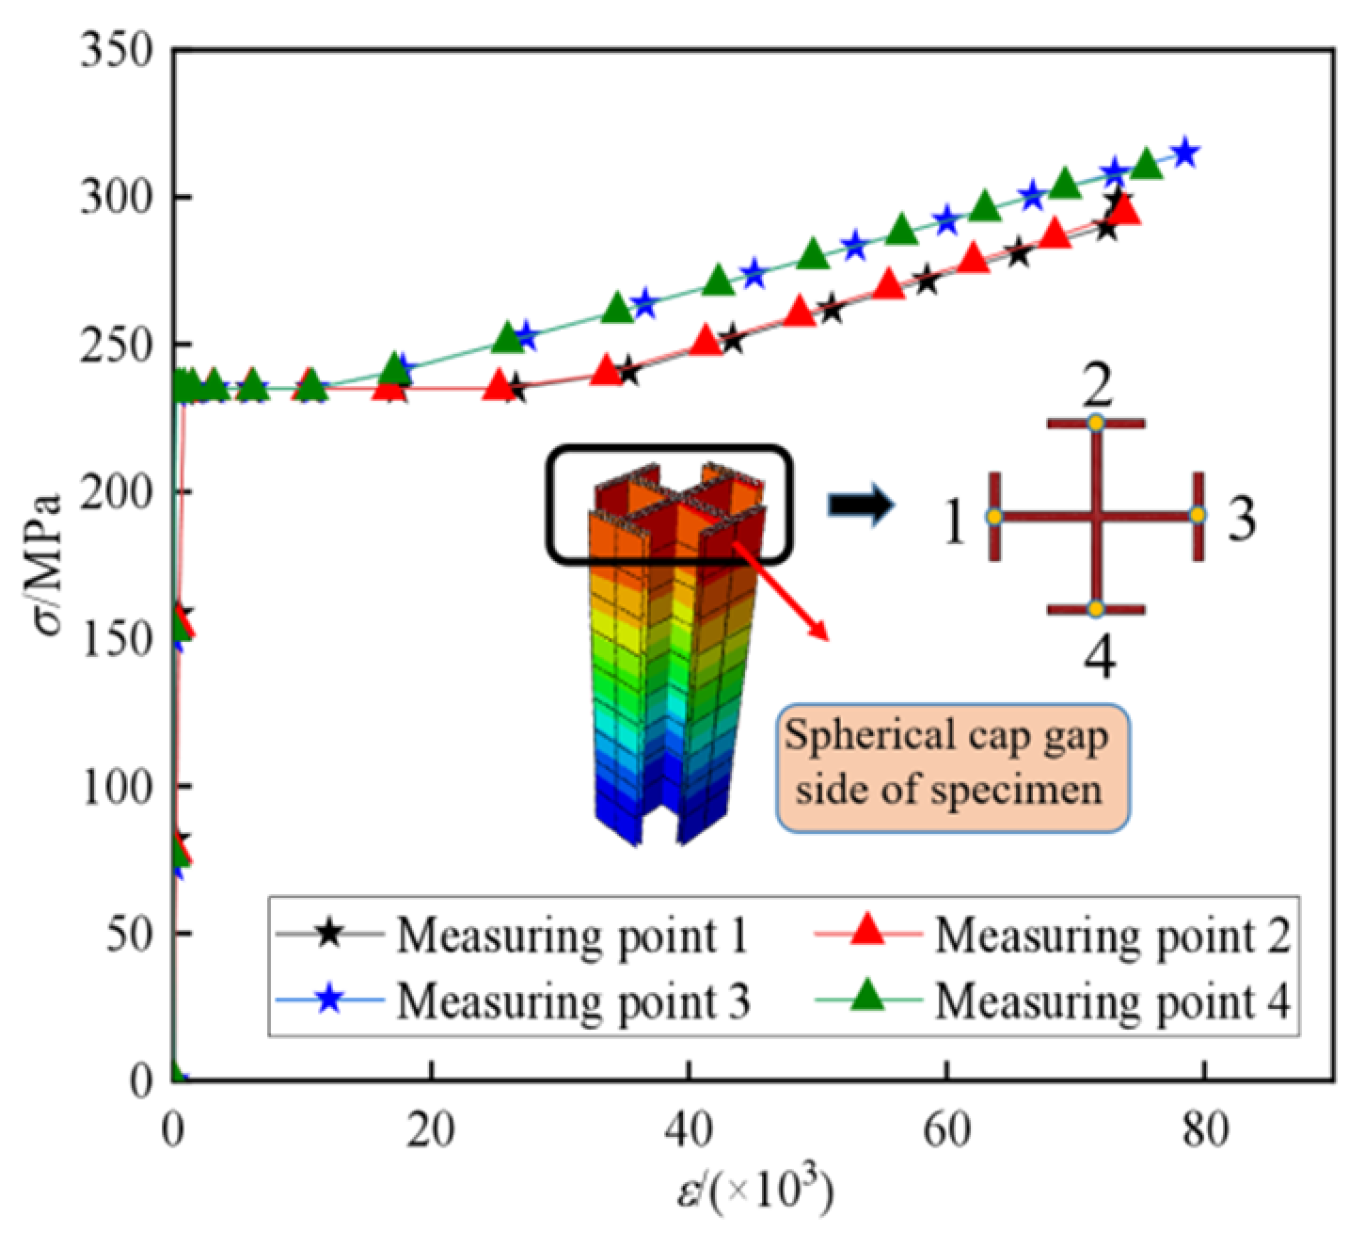
7.3. Stress-Strain Development Analysis

Based on the results of finite element analysis, to clarify the stress–strain development law of GSECFST composite short columns under axial compression, this section takes the specimen SECG-1 as an example to extract the stress–strain relationship curves of core concrete, steel tube, and steel bone of typical sections (Figure 25, Figure 26 and Figure 27).
The gap defects led to stress distribution inhomogeneity along the core concrete’s cross-section. Figure 25a shows that the bias effect caused by the local spherical crown gap made the concrete strain at measuring point 5 larger than at point 1, reaching the peak stress first. This phenomenon occurred because the steel tube at measuring point 1 had a restraining effect on the core concrete, and the steel tube at measuring point 5 had a debonding between the steel tube and the concrete due to the spherical crown gap. The steel tube could not provide an excellent constraint to the concrete at measuring point 5, thereby not improving the peak stress of the concrete at the point compared with the axial compressive strength of ordinary concrete.
The overall bending of GSECFST composite short columns is slightly biased towards the void side. The curvature of the long axis of the elliptical steel tube is large, exhibiting an excellent constraint on the core concrete, resulting in a larger peak stress of the concrete at measuring point 1 than point 3. The curvature of the short axis of the elliptical steel tube was small, having an inferior constraint effect on the core concrete. With the further development of the loading deformation, the component had a buckling failure along the short axis direction of the steel skeleton elliptical steel tube concrete. Therefore, the concrete strain at measuring point 3 was larger than at other positions. Both measuring point 2 and measuring point 4 are between the long and short axes of the ellipse. The steel tube constrained the concrete adequately, so the peak stress and ultimate strain of measuring points 2 and 4 were similar. We observed that the restraint effect of steel on concrete made the concrete stress at measuring point 8 larger than that at other positions (Figure 25b). Because measuring points 7 to 5 were far from the steel skeleton, the constraint of the steel skeleton on the concrete decreased, resulting in a gradual decrease in the peak stress.
The strain of the steel tube under axial compression showed inhomogeneity due to the influence of the spherical-cap-type gap defect. Due to the lack of concrete support, the steel pipe at the long axis of the specimen was slightly biased. The steel pipe at measuring point 5 first yields, and the longitudinal strain was significantly larger than that at measuring point 1 without a gap. Due to the existence of the gap defect, the steel skeleton elliptical concrete-filled steel tubular short column appears to be slightly biased towards the overall bending of the gap side at the later stage of loading, and the longitudinal strain of measuring point 1 on the opposite side of the gap side also appeared smallest. Measuring points 2 and 4 were supported by concrete and were symmetrical in position, so the stress and strain were approximately the same. The curvature of the steel tube at measuring point 3 was small, and the restraint effect on the concrete was poor. The specimen had a buckling failure along the short axis of measuring point 3, resulting in the largest strain at side point 3.
Due to the influence of the gap defect, the steel bone also exhibited a bias to the concrete gap side under axial compression. The lack of concrete support ensured that the three measuring points of steel bone first yielded, and the longitudinal strain was significantly larger than that of other measuring points. The longitudinal strain of measuring point 1 on the opposite side of the gap side also gradually decreased. The strain of measuring point 2 and side point 4 was similar because of their proximity to the neutral axis.

7.4. Gap Feature Index (GFI)

To further clarify the influence of the spherical-cap gap on the confinement of core concrete, the gap characteristic coefficient GFI was introduced [11] as follows:
GFI = N t f y A s f ng A sg
where Nt is the bearing capacity of finite element analysis; fy and As are the yield strength and cross-sectional area of the steel tube, respectively; fng is the average compressive strength of core concrete without gap; Asg is the actual core concrete cross-sectional area of the void specimen [12].
For the GSECFST composite short columns (Figure 28), GFI decreased with the increase in gap ratio, while the GFI decreased mildly as the bearing capacity of members increased due to the constraint of steel on concrete [31]. For the specimens with a 235 MPa yield strength, when the gap ratio was 0, 1.5%, 2.5%, and 4%, the GFI was 1.0, 0.952, 0.944, and 0.931, respectively [32]. The results showed that the gap characteristic coefficient of GSECFST composite short columns was less than 1.0. The spherical-cap gap on the axial compression bearing capacity of steel reinforced concrete elliptical steel tube decreased the core concrete area, increased the spherical-cap gap, and weakened the constraint effect of core concrete.

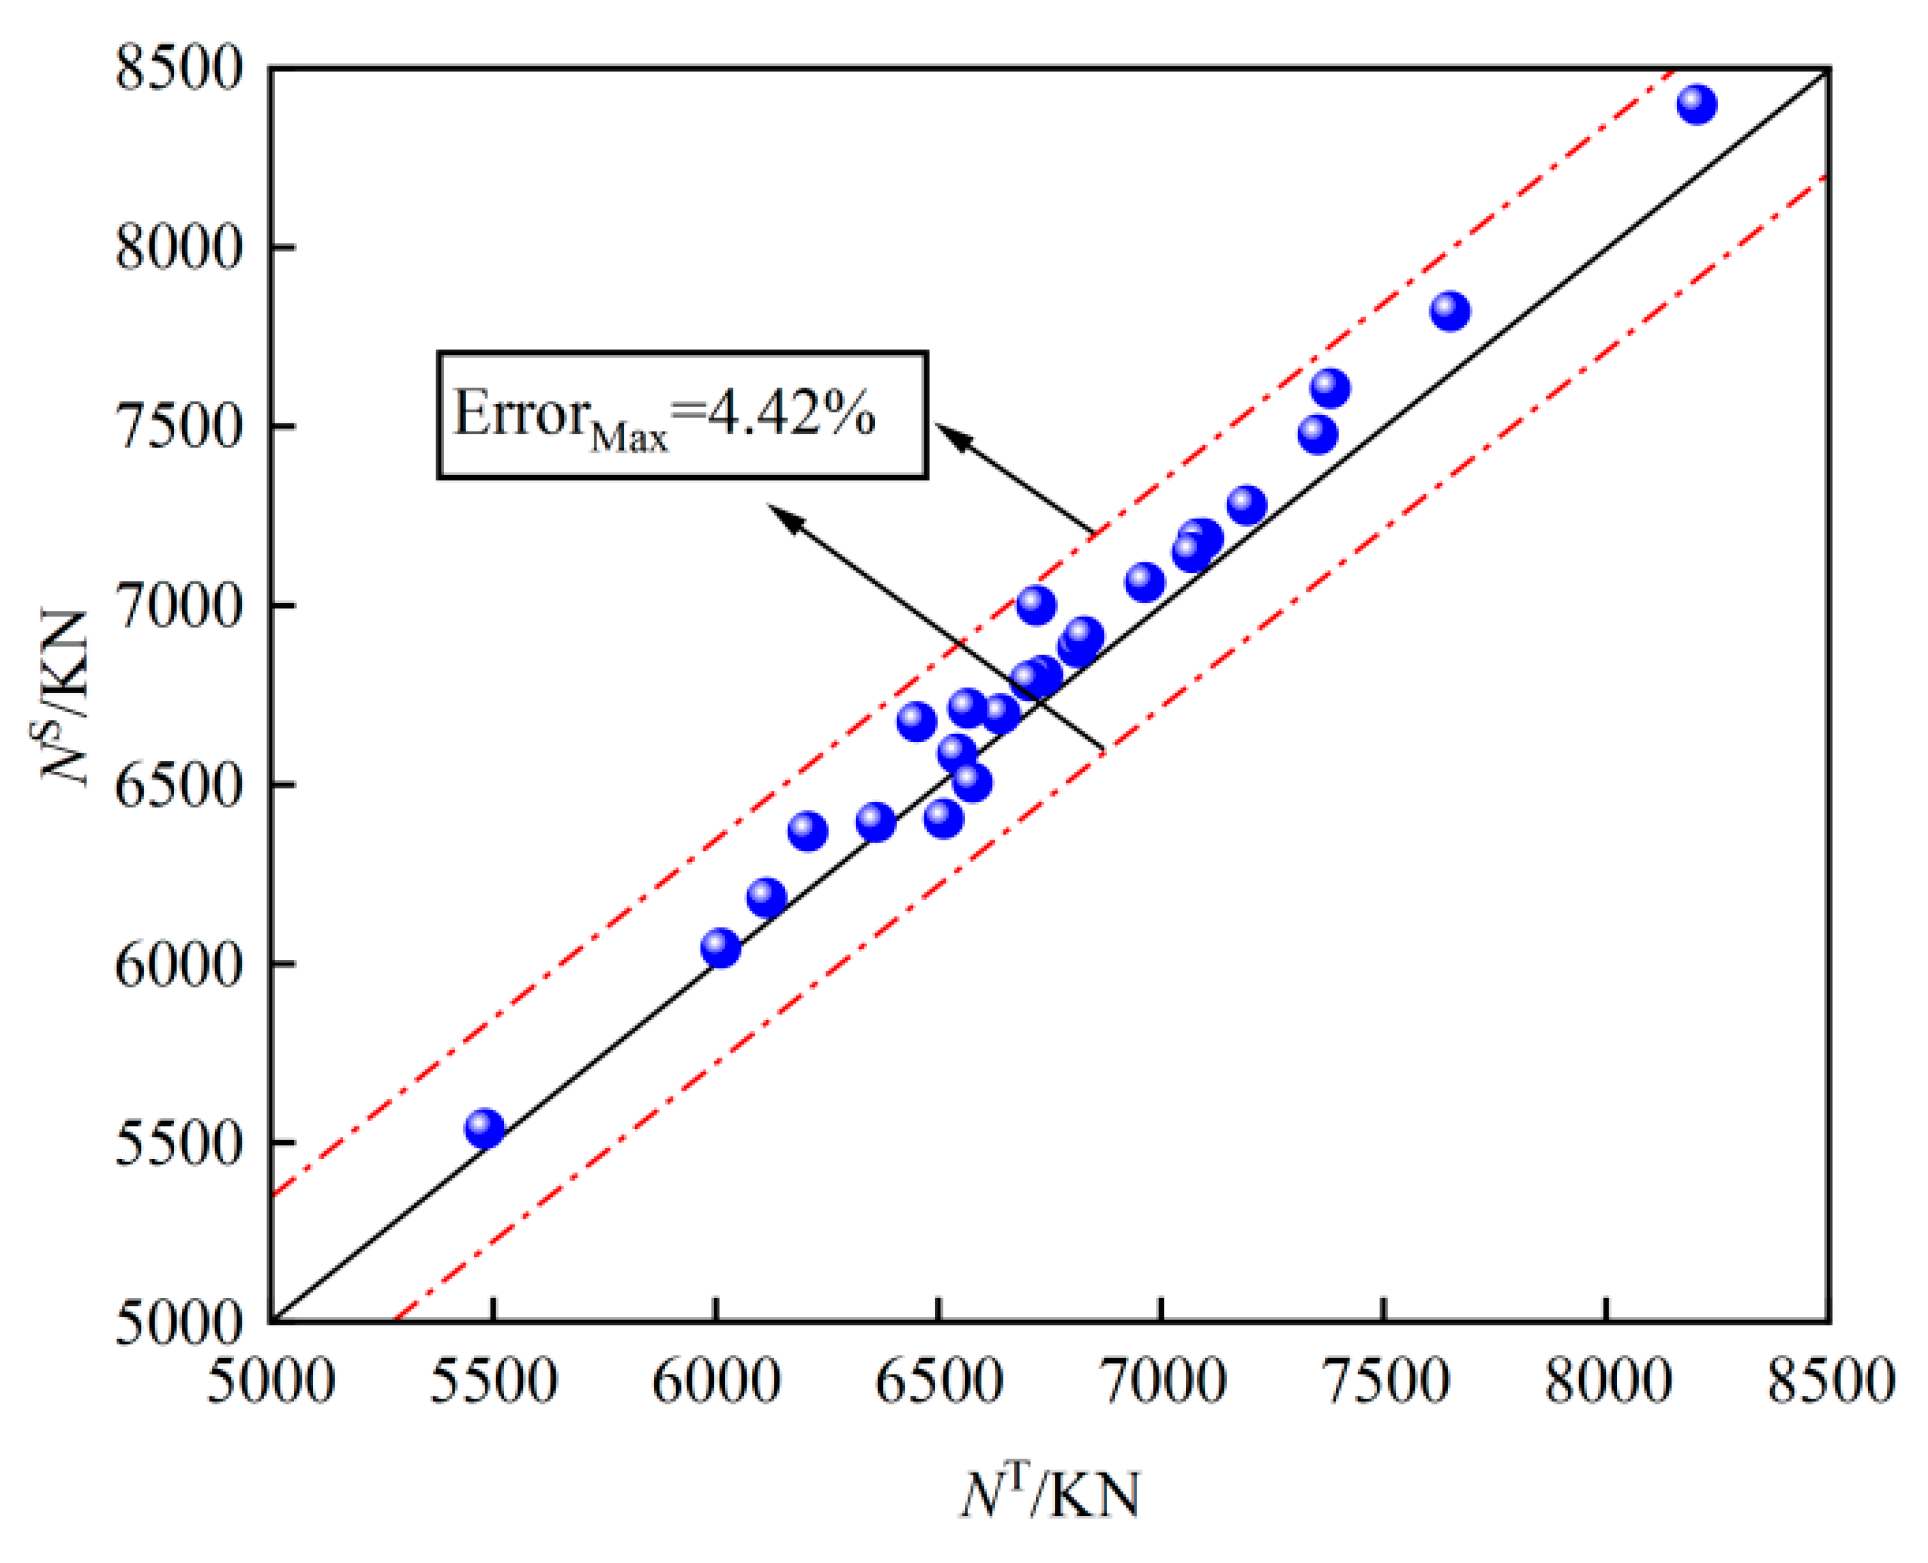
8. Axial Compressive Bearing Capacity of Composite Short Columns

Currently, there are established theoretical methods for detecting the defect damage of concrete-filled steel tubes globally [33]. However, only a few reports are available on the axial compression bearing capacity of steel skeleton concrete-filled elliptical steel tubular short columns with gaps [34]. The formula of the axial compression bearing capacity of elliptical concrete-filled steel tubular short columns with spherical-cap gaps based on the characteristics of elliptical section and the confined partition model of core concrete with spherical crowns, as proposed by Wang. [19], is illustrated in Formulas (13)–(15):
N u , c = N s + N c
N s = A s f y
N c = N fc + N pc + N co = A fc f cc + A pc f pc + A co f co
In this paper, the Wang et al. equation introduced the load Np that the steel skeleton can bear on considering Formula (13). According to the stress and strain law of concrete, the constraint partition model of a steel-concrete-filled steel tube with a spherical-cap gap was obtained (Figure 29). The formula for the ultimate bearing capacity of steel-elliptical concrete-filled steel tube composite short columns with spherical-cap gaps under axial compression is expressed in Formulas (16)–(19).
N u , c = N s + N c + N p
N s = A s f y
N p = A sy f sy
N c = N fc + N pc + N co = A fc f cc + A pc f pc + A co f co
where Ns, Nc, and Np are the loads that the elliptical steel tube, core concrete, and steel section can bear, respectively [35]. Nfc, Npc, and Nc0 are the section-bearing capacity of the core concrete in the strong constraint zone, the weak constraint zone, and the unconstrained zone, respectively. Afc and fcc are the cross-sectional area and compressive strength of concrete in the strong confinement zone, respectively; A fc = Π ab A pc A c 0 A sg ; f c c = 1 + 2 f ¯ r f co f co . Apc and fpc are the cross-sectional area and compressive strength of concrete in the weak constraint zone, respectively; A pc = 1 3   mn ; f pc = f cc + f co 2 . Ac0 and fc0 are the cross-sectional area and compressive strength of concrete in unconstrained area, respectively; A co = 2 3   mn ; f co = 0.67 f ck . m and n are determined by the gap value dsg. m = b a 2 a d sg d sg 2 , n = a d sg . The derivation process of m and n is given in Reference [12].
The axial compression ultimate bearing capacity of the GSECFST composite short columns calculated according to Formula 16 is compared with the calculated value of the axial compression ultimate bearing capacity obtained by finite element simulation (Table 4). The error between the two is shown in Figure 30. The maximum error is 4.42%, meeting the engineering accuracy requirements [36].

9. Conclusions

We established a model of 25 GSECFST composite short columns, taking the steel tube strength (fty), steel strength (fsy), concrete strength (fcu), steel tube thickness (t), steel cross-sectional area (As), ratio of long and short half-axis (a/b), gap ratio (Xsg), and slenderness ratio (λ) as the main investigation parameters. Based on these parameters, the mechanical properties of steel-elliptical concrete-filled steel tube short columns with spherical-cap gaps under axial load were analyzed, and the following conclusions were drawn:
(1)
Based on the simplified bilinear constitutive model of steel, the secondary back-flow constitutive model and the nonlinear constitutive model of concrete (considering the defect), the numerical simulation of 25 composite short-column test specimens was carried out by ABAQUS software, and the vertical load-displacement relationship curve of the short column was obtained. Comparing the axial compression bearing capacity of the extracted specimen with the existing test data, the maximum error was 7.68%, which verifies the rationality of the material nonlinear constitutive model and the finite element modeling method.
(2)
The ultimate bearing capacity of GSECFST composite short columns increased with the steel tube strength (fty), steel skeleton strength (fsy), concrete strength (fcu), steel tube thickness (t), and steel section area (As). The steel tube strength, concrete strength, and steel tube thickness significantly improved the bearing capacity of the specimens. However, by increasing the ratio of the long and short half axis (a/b), the gap ratio (Xsg), and the slenderness ratio (λ), the ultimate bearing capacity of the steel-elliptical concrete-filled steel tube short column with a spherical-cap gap decreased gradually. The spherical-cap gap would reduce the axial compression bearing capacity, stiffness, and ductility of steel skeleton elliptical concrete-filled steel tubular short columns. When the gap ratio at the long axis end increased from 0 to 4.0%, the axial compression bearing capacity of the specimen decreased by 8.5%, the initial stiffness decreased by 17.6%, and the ductility coefficient decreased by 22.9%. Therefore, the spherical-cap gap of the specimen weakened the axial compression behavior of the steel-elliptical steel tube concrete short column and intensified with the increase in the gap ratio.
(3)
The N-∆ curves of GSECFST composite short columns were divided into elastic, elastic-plastic, plastic, and failure stages. The characteristic form was driven by the gap ratio. With the increase in the gap ratio, the restraint effect of steel tubes on core concrete decreased. All the failure modes of the specimens under axial load were manifested as the outward expansion of steel tube, steel bone, core concrete, and the local outward bulging of the specimens. The stress–strain analysis shows that the existence of gap defects in the long axis direction of the specimen deviated from the neutral axis of the specimen section, and the initial eccentricity promotes the longitudinal compressive strain of the concrete on the gap side to develop faster than that on the non-gap side. Finally, the concrete in the gap area is broken, and the steel pipe is yielded first.
(4)
Based on the existing bearing capacity formula of GSECFST composite short columns, the load Np that the steel section can bear was introduced, and the axial compression bearing capacity formula that considered the influence of elliptical section characteristics and gap defects was proposed. The maximum error was 4.42%, meeting the engineering requirements.

Author Contributions

L.J.: Conceptualization, software, funding acquisition, writing—original draft. L.M.: Writing—original draft, software, investigation, formal analysis. X.H.: Software, writing—review & editing. J.J.: Software, validation, writing—review & editing. H.Z.: Visualization, writing—review & editing. Z.Z.: Investigation, writing—review & editing. Y.L.: Software, writing—review & editing. X.C.: Software, writing—review & editing. All authors have read and agreed to the published version of the manuscript.

Funding

This work is supported by Joint Guidance Project of Natural Science Foundation of Heilongjiang Province (No. LH2020E018), Scientific Research Fund of Institute of Engineering Mechanics of China Earthquake Administration (No. 2020D07), China-Pakistan Belt and Road Joint Laboratory on Smart Disaster Prevention of Major Infrastructures (No. 2022CPBRJL-05), Northeast Petroleum University Guided Innovation Fund (No. 2020YDL-02), Guiding Science and Technology Project of Daqing City (No. zd-2021-40).

Data Availability Statement

The data supporting this study’s findings are included in the article.

Conflicts of Interest

The authors declare that the research was conducted without any commercial or financial relationships that could be construed as a potential conflict of interest.

References

  1. Wang, J. Research on Mechanical Properties of Anti-Bending for Concrete Filled Steel Tube Circular Arch and Its Application. Ph.D. Thesis, China University of Mining and Technology, Beijing, China, 2014. [Google Scholar]
  2. Wang, J.F.; Liu, W.; Shen, Q.H.; Li, J.Z. Study on axial compression performance of elliptical concrete filled steel tubular short columns considering the influence of circumferential gap. J. Build. Struct. 2023, 44, 50–63. [Google Scholar]
  3. Tang, S. Study on Mechanical Properties of Hollow Concrete Filled Steel Tube Members. Ph.D. Thesis, Guangzhou University, Guangzhou, China, 2011. [Google Scholar]
  4. Liao, F.Y.; Han, L.H.; Tao, Z. Behavior of CFST stub columns with initial concrete imperfection: Analysis and calculations. Thin-Walled Struct. 2013, 70, 57–69. [Google Scholar] [CrossRef]
  5. Zhao, D.Z. Study on Mechanical Properties of Steel Reinforced High Strength Concrete Filled Steel Tube Composite Columns. Ph.D. Thesis, Dalian University of Technology, Dalian, China, 2003. [Google Scholar]
  6. Yang, H.; Lam, D.; Gardner, L. Testing and analysis of concrete-filled elliptical hollow sections. Eng. Struct. 2008, 30, 3771–3781. [Google Scholar] [CrossRef]
  7. Dai, X.; Lam, D. Numerical modeling of the axial compressive behavior of short concrete-filled elliptical steel columns. J. Constr. Steel Res. 2010, 66, 931–942. [Google Scholar] [CrossRef]
  8. Ren, Q.X.; Han, L.H.; Lam, D. Tests on elliptical concrete filled steel tubular (CFST) beams and columns. J. Constr. Steel Res. 2014, 99, 149–160. [Google Scholar] [CrossRef]
  9. Ji, J.; Xu, Z.C.; Jiang, L.Q.; Liu, Y.C.; Yu, D.Y.; Yang, M.M. Experimental study on compression behavior of H-shaped composite short column with rectangular CFST flanges and honeycombed steel web subjected to axial load. Build. Struct. 2019, 40, 63–73. [Google Scholar]
  10. Li, J.Z. Study on Axial Compression Performance and Bearing Capacity Calculation Method of Elliptical Concrete Filled Steel Tubular Short Columns with Gap Defects. Ph.D. Thesis, Hefei University of Technology, Hefei, China, 2021. [Google Scholar]
  11. Wang, J.F.; Cheng, A.L.; Shen, Q.H. Analysis of axial compression performance and stress mechanism of elliptical concrete-filled steel tubular short columns with spherical crown-shaped gap defects. Prog. Steel Build. Struct. 2022, 24, 41–54. [Google Scholar]
  12. Shen, Q.H.; Wang, J.F.; Li, J.Z. Study on axial compression performance and calculation method of elliptical concrete filled steel tubular short columns with spherical crown gap defects. Eng. Mech. 2022, 39, 141–150. [Google Scholar]
  13. Ji, J.; Zhang, H.L.; Jiang, L.Q.; Zhang, Y.F.; Yuan, C.Q.; Zhang, Z.B.; Chu, X.; Li, B. Seismic Behaviors of Novel Steel-Reinforced Concrete Composite Frames Prestressed with Bonding Tendons. Buildings 2023, 13, 2124. [Google Scholar] [CrossRef]
  14. Han, H.; Liao, F.Y. Study on flexural performance of concrete filled steel tubular members with spherical crown gap defects. Prog. Steel Build. Struct. 2018, 20, 67–73+102. [Google Scholar]
  15. Uenaka, K.; Mizukoshi, M. Lightweight concrete filled steel tubular beam under bending-shear. Structures 2021, 30, 659–666. [Google Scholar] [CrossRef]
  16. Ji, J.; Li, J.Q.; Jiang, L.Q.; Ren, H.G.; Wang, Q.Q.; Wang, X.; He, L.J.; Zhang, Z.B. Mechanical Behavior of Special-Shaped Reinforced Concrete Composite Columns Encased with GFRP Core Columns. Buildings 2022, 12, 1895. [Google Scholar] [CrossRef]
  17. Liu, W. Study on the Working Mechanism of Concrete Filled Steel Tube under Local Compression. Ph.D. Thesis, Fuzhou University, Fuzhou, China, 2005. [Google Scholar]
  18. Guo, X.S. Study on Mechanical Properties of Elliptical Concrete Filled Steel Tubular Short Columns under Axial Compression and Eccentric Compression. Ph.D. Thesis, Harbin Institute of Technology, Harbin, China, 2015. [Google Scholar]
  19. Wang, J.F.; Xiao, Q.; Sheng, Q.H. Axial compression performance analysis of concrete filled steel tubular short columns with CFRP wrapped with gap defects. Prog. Steel Build. Struct. 2021, 23, 44–53+70. [Google Scholar]
  20. Zhang, Y.; Wei, Y.; Bai, J.; Zhang, Y.X. Stress-strain model of an FRP-confined concrete filled steel tube under axial compression. Thin-Walled Struct. 2019, 142, 149–159. [Google Scholar] [CrossRef]
  21. Du, G.F.; Song, X.; Xu, S.P. Experimental study on axial compression performance of concrete-filled steel tubular short columns with built-in steel-reinforced composite L-shaped section. J. Build. Struct. 2013, 34, 82–89. [Google Scholar]
  22. Ji, J.; Zhang, Z.; Lin, M.; Li, L.Z.; Jiang, L.Q.; Ding, Y.; Yu, K.Q. Structural application of engineered cementitious composites (ECC): A state-of-the-art review. Constr. Build. Mater. 2023, 406, 133289. [Google Scholar] [CrossRef]
  23. Li, K.S.; Dong, Y.Y.; Du, Y.S. Study on the bending performance of elliptical concrete-filled steel tubular piers under different angle loads. Highway 2023, 68, 140–147. [Google Scholar]
  24. Ji, J.; He, L.J.; Jiang, L.Q.; Zhang, Y.F.; Liu, Y.C.; Li, Y.H.; Zhang, Z.B. Numerical study on the axial compression behavior of composite columns with steel tube SHCC flanges and honeycombed steel web. Eng. Struct. 2023, 283, 115883. [Google Scholar] [CrossRef]
  25. Mao, W.J.; Shi, Y.L.; Wang, W.D. Calculation method of axial compression bearing capacity of circular concrete-filled steel tubular members with built-in steel. Prog. Steel Build. Struct. 2021, 23, 37–46. [Google Scholar]
  26. Tokgoz, S.; Dundar, C.; Karaahmetli, S.; Ozel, R. Research on concrete-filled stainless steel tubular composite columns. Structures 2021, 33, 703–719. [Google Scholar] [CrossRef]
  27. Ji, J.; Wang, W.C.; Jiang, L.Q.; Ren, H.G.; Wang, Q.Q.; Xuan, W.Y.; Liu, Y.C. Bearing Capacity of UHPC-Filled High-Strength Elliptical Steel Tube Composite Columns with Encased High-Strength H-Shape Steel Subjected to Eccentrical Load. Buildings 2022, 12, 1272. [Google Scholar] [CrossRef]
  28. Xiao, A.L. Study on Mechanical Behavior and Design Method of Steel Reinforced High Performance Concrete Filled Steel Tube Axial Compression Composite Column. Ph.D. Thesis, Hunan University, Changsha, China, 2009. [Google Scholar]
  29. Ji, J.; Li, Y.H.; Jiang, L.Q.; Zhang, Y.F.; Liu, Y.C.; He, L.J.; Zhang, Z.B.; Wang, Y. Axial compression behavior of strength-gradient composite stub columns encased CFST with small diameter: Experimental and numerical investigation. Structures 2023, 47, 282–298. [Google Scholar] [CrossRef]
  30. Zhao, Y.; Zou, R.; Ding, T.; Xiao, J.Z. Experimental study of the shear behaviour of concrete-grout-concrete joints. J. Build. Eng. 2021, 43, 103095. [Google Scholar] [CrossRef]
  31. Nassiraei, H. Geometrical effects on the LJF of tubular T/Y-joints with doubler plate in offshore wind turbines. Ships Offshore Struct. 2022, 17, 481–491. [Google Scholar] [CrossRef]
  32. Zhu, T.; Liang, H.; Lu, Y.; Li, W.J.; Zhang, H. Axial behaviour of slender concrete-filled steel tube square columns strengthened with square concrete-filled steel tube jackets. Adv. Struct. Eng. 2020, 23, 1074–1086. [Google Scholar] [CrossRef]
  33. Luo, Y.P.; Xie, L.P.; Liao, F.Y. Research on detection method of concrete filled steel tube gap defect based on time series analysis theory. Ind. Constr. 2019, 49, 48–53. [Google Scholar]
  34. Zeng, J.J.; Liang, S.D.; Li, Y.L.; Guo, Y.C.; Shan, G.Y. Compressive behavior of FRP-confined elliptical concrete-filled high strength steel tube columns. Compos. Struct. 2021, 266, 113808. [Google Scholar] [CrossRef]
  35. Mei, S.; Wang, Y.; Zou, R.; Long, Y.P. Creep of concrete-filled steel tube considering creep-recovery of the concrete core. Adv. Struct. Eng. 2020, 23, 997–1009. [Google Scholar] [CrossRef]
  36. İpek, S.; Erdoğan, A.; Güneyisi, E.M. Compressive behavior of concrete-filled double skin steel tubular short columns with the elliptical hollow section. J. Build. Eng. 2021, 38, 102200. [Google Scholar] [CrossRef]
Figure 1. The flow chart of this paper.
Buildings 14 00350 g001
Figure 2. A sketch of GSECFST composite short columns.
Buildings 14 00350 g002
Figure 3. The secondary plastic flow constitutive model of the steel skeleton.
Buildings 14 00350 g003
Figure 4. Constitutive models of concrete with spherical-cap gap.
Buildings 14 00350 g004
Figure 5. Refined finite element model of GSECFST composite short columns.
Buildings 14 00350 g005
Figure 6. Comparison among various mesh sizes for two typical specimens.
Buildings 14 00350 g006
Figure 7. Comparisons for failure modes of specimens with different mesh sizes.
Buildings 14 00350 g007
Figure 8. Comparisons of N-Δ curves between test and simulation.
Buildings 14 00350 g008
Figure 9. Comparisons between NS and NT.
Buildings 14 00350 g009
Figure 10. Comparisons of failure modes for 12 specimens.
Buildings 14 00350 g010
Figure 11. The equivalent elastoplastic energy method.
Buildings 14 00350 g011
Figure 12. Comparison of the N-Δ curves of GSECFST composite short columns with various fty.
Buildings 14 00350 g012
Figure 13. Comparison of N-Δ curves of GSECFST composite short columns with various fsy.
Buildings 14 00350 g013
Figure 14. Comparison of N-Δ curves of GSECFST composite short columns with varied fc.
Buildings 14 00350 g014
Figure 15. Comparison of N-Δ curves of GSECFST composite short columns with varied t.
Buildings 14 00350 g015
Figure 16. The comparisons for N-Δ curves of GSECFST composite short columns with different Asy.
Buildings 14 00350 g016
Figure 17. Comparison of N-Δ curves of GSECFST composite short columns with varied a/b.
Buildings 14 00350 g017
Figure 18. Comparison of N-Δ curves of GSECFST composite short columns with varied Xsg.
Buildings 14 00350 g018
Figure 19. Comparison of N-Δ curves of GSECFST composite short columns with varied λ.
Buildings 14 00350 g019
Figure 20. Stress distribution of the concrete.
Buildings 14 00350 g020
Figure 21. Failure modes of the specimens.
Buildings 14 00350 g021
Figure 22. Deformation diagram of steel tube along the long axis.
Buildings 14 00350 g022
Figure 23. The process curves of SECT-1.
Buildings 14 00350 g023
Figure 24. Axial force distribution of each component.
Buildings 14 00350 g024
Figure 25. Stress–strain curve of concrete in the middle section of the specimens.
Buildings 14 00350 g025
Figure 26. Stress–strain curve of steel tube in the middle section of the specimens.
Buildings 14 00350 g026
Figure 27. Stress–strain curve of steel skeleton in the middle section of the specimens.
Buildings 14 00350 g027
Figure 28. GFI of the specimens.
Buildings 14 00350 g028
Figure 29. The confining status model of the GSECFST composite short columns.
Buildings 14 00350 g029
Figure 30. Comparison between NS and NT.
Buildings 14 00350 g030
Table 1. The main parameters of GSECFST composite short columns.
Specimens2a × 2b × t × L
/mm
fty
/MPa
fsy
/MPa
fcu
/MPa
t
/mm
As
/mm2
a/bdsg
/mm
Xsg
/%
λ
SECT-1400 × 200 × 6 × 800235.0235.0101.36.027002.010.02.52.0
SECT-2400 × 200 × 6 × 800335.0235.0101.36.027002.010.02.52.0
SECT-3400 × 200 × 6 × 800435.0235.0101.36.027002.010.02.52.0
SECT-4400 × 200 × 6 × 800535.0235.0101.36.027002.010.02.52.0
SECT-5400 × 200 × 6 × 800235.0335.0101.36.027002.010.02.52.0
SECT-6400 × 200 × 6 × 800235.0435.0101.36.027002.010.02.52.0
SECT-7400 × 200 × 6 × 800235.0535.0101.36.027002.010.02.52.0
SECT-8400 × 200 × 6 × 800235.0235.075.96.027002.010.02.52.0
SECT-9400 × 200 × 6 × 800235.0235.088.66.027002.010.02.52.0
SECT-10400 × 200 × 6 × 800235.0235.0113.96.027002.010.02.52.0
SECT-11400 × 200 × 4 × 800235.0235.0101.34.027002.010.02.52.0
SECT-12400 × 200 × 8 × 800235.0235.0101.38.027002.010.02.52.0
SECT-13400 × 200 × 10 × 800235.0235.0101.310.027002.010.02.52.0
SECT-14400 × 200 × 6 × 800235.0235.0101.36.031152.010.02.52.0
SECT-15400 × 200 × 6 × 800235.0235.0101.36.035202.010.02.52.0
SECT-16400 × 200 × 6 × 800235.0235.0101.36.039152.010.02.52.0
SECT-17283 × 283 × 6.4 × 800235.0235.0101.36.427001.07.12.52.0
SECT-18346 × 231 × 6.2 × 800235.0235.0101.36.227001.58.72.52.0
SECT-19447 × 179 × 5.7 × 800235.0235.0101.35.727002.511.22.52.0
SECT-20400 × 200 × 6 × 800235.0235.0101.36.027002.00.00.02.0
SECT-21400 × 200 × 6 × 800235.0235.0101.36.027002.06.01.52.0
SECT-22400 × 200 × 6 × 800235.0235.0101.36.027002.016.04.02.0
SECT-23400 × 200 × 6 × 800235.0235.0101.36.027002.010.02.51.5
SECT-24400 × 200 × 6 × 1000235.0235.0101.36.027002.010.02.52.5
SECT-25400 × 200 × 6 × 1200235.0235.0101.36.027002.010.02.53.0
Note: dsg is the gap value of the spherical cap, Xsg is the gap ratio, Xsg = (dsg/2a) × 100% [14], λ = L/2a.
Table 2. Specific parameters of the existing five specimens.
SpecimensD × t × L
/mm
As
/mm
fc
/MPa
fty
/MPa
fsy
/MPa
L0/D N u S
/kN
N u T
/kN
N u S N u T N u T × 100 %
AL Xiao [28]SC-1219 × 4.0 × 876299643.633731843984.714045.431.50
SC-2219 × 4.0 × 876357843.633730343884.164009.873.14
SC-3219 × 4.0 × 876427843.633730844455.324497.030.93
SC-5219 × 5.6 × 876357843.628930344153.654220.821.59
SC-8219 × 4.0 × 876-43.6337-43123.383114.190.30
Table 3. Specific parameters of the existing seven specimens.
Specimens2a × 2b × t × h
/mm
fy
/MPa
fcu
/MPa
dsg
/mm
χsg
/%
N u S
/kN
N u T
/kN
N u S N u T N u T × 100 %
JZ Li [10]AC2-S1-LSG10278 × 140 × 6 × 50027558.9103.62558.5592418.165.80
AC2-S1-LSG20278 × 140 × 6 × 50027558.9207.22432.162258.637.68
AC2-S1-LSG30278 × 140 × 6 × 50027558.93010.82172.912179.30.29
AC1-S2-LSG20278 × 140 × 6 × 50048730.2207.22748.8642587.726.23
AC2-S2-LSG10278 × 140 × 6 × 50048758.9103.63313.9913402.972.61
AC2-S2-LSG20278 × 140 × 6 × 50048758.9207.23153.7483103.441.62
AC2-S2-LSG30278 × 140 × 6 × 50048758.93010.83036.2643001.591.16
Table 4. Comparison between NS and NT for the 25 specimens.
Specimensfty
/MPa
fsy
/MPa
fcu
/MPa
t
/mm
As
/mm
a/bXsg
/%
N u S
/kN
N u T
/kN
N u S N u T N u T × 100 %
SECT-1235.0235.0101.36.027002.02.56585.96542.100.67
SECT-2335.0235.0101.36.027002.02.57187.327095.991.29
SECT-3435.0235.0101.36.027002.02.57821.137649.892.24
SECT-4535.0235.0101.36.027002.02.58398.568203.792.37
SECT-5235.0335.0101.36.027002.02.56883.666812.101.05
SECT-6235.0435.0101.36.027002.02.57186.767082.101.48
SECT-7235.0535.0101.36.027002.02.57477.567352.101.71
SECT-8235.0235.075.96.027002.02.55538.575480.771.1
SECT-9235.0235.088.66.027002.02.56043.076010.800.54
SECT-10235.0235.0113.96.027002.02.57148.217069.621.11
SECT-11235.0235.0101.34.027002.02.56183.66114.121.14
SECT-12235.0235.0101.38.027002.02.57064.916964.181.45
SECT-13235.0235.0101.310.027002.02.57606.217380.354.42
SECT-14235.0235.0101.36.031152.02.56696.556639.630.86
SECT-15235.0235.0101.36.035202.02.56805.296734.801.05
SECT-16235.0235.0101.36.039152.02.56913.566827.621.26
SECT-17235.0235.0101.36.427001.02.57279.837193.121.21
SECT-18235.0235.0101.36.227001.52.56675.336451.473.47
SECT-19235.0235.0101.35.727002.52.56368.846206.492.62
SECT-20235.0235.0101.36.027002.006999.896720.134.16
SECT-21235.0235.0101.36.027002.01.56713.156565.852.24
SECT-22235.0235.0101.36.027002.04.06404.996511.981.64
SECT-23235.0235.0101.36.027002.02.56788.836704.591.24
SECT-24235.0235.0101.36.027002.02.56505.706576.801.01
SECT-25235.0235.0101.36.027002.02.56394.606359.830.54
Disclaimer/Publisher’s Note: The statements, opinions and data contained in all publications are solely those of the individual author(s) and contributor(s) and not of MDPI and/or the editor(s). MDPI and/or the editor(s) disclaim responsibility for any injury to people or property resulting from any ideas, methods, instructions or products referred to in the content.

