Abstract
Prefabricated modules are being used to renovate the building envelope. However, compared to manual methods, the design and prefabricated module’s definition is time consuming. Therefore, it is necessary to improve the efficiency of the prefabricated layout definition processes by incorporating automation and computational design. The purpose of this paper is to present a semi-automated definition of the layout of the prefabricated modules with the only input of the existing building facade being the Point Cloud. In this research, a novel step-by-step workflow was developed. More precisely, an algorithm was developed that processes the coordinates of each point of the cloud and generates the layout of the prefabricated modules. To validate the workflow and the algorithm, four facades were tested, considering two parameters: (a) working time and (b) output accuracy. According to the results, it was concluded that spending more time achieving an accurate laser data acquisition can be a good strategy to obtain the primary layout with sufficient precision.
1. Introduction
The use of prefabricated modules for facade improvement, as an efficient method for building envelope renovation, has experienced remarkable growth in recent years, although it has not taken off as anticipated despite the efforts of research programs such as those of the European Commission [1]. There is general agreement among all stakeholders involved in these processes that there is a need to improve the efficiency of these processes by incorporating automation and improving safety [2,3,4,5,6,7]. Significant challenges remain in the area of building renovation based on prefabricated modules [8]. The requirement for mass customization is still present [9], but at present, manual processes using prefabricated modules are still more effective, affordable, and practical [10]. Therefore, significant effort is needed to improve and automate facade renovation processes using prefabricated modules [11,12,13,14].
Energy efficiency is considered a key issue, and it remains crucial for the industry for building under deep renovation to demonstrate plug-and-build retrofit solutions and tools suitable for mass production that achieve NZEB (Nearly Zero-Energy Building) standards. At the same time, the retrofitting time and costs of current renovation processes must be significantly reduced.
In Figure 1, all the stages are explained. It must be reminded that the prefabricated modules are supported by connectors.
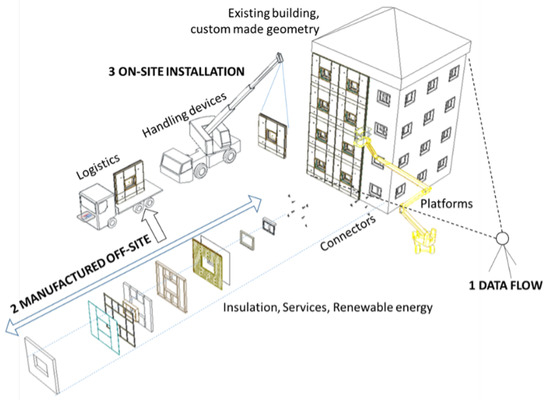
Figure 1.
Building renovation process with prefabricated panels for the envelope.
In this article, the data flow scopes the process that starts with the data acquisition of the existing facade and ends with the generation of the module’s layout. The research presented in this article seeks a semi-automated definition of the layout of the modules and its synchronization with the CAM with the only input of the existing building façade Point Cloud and its point coordinates (Figure 2). In the research in this chapter, the data acquisition was made by 3D laser scanners that generated Point Clouds.
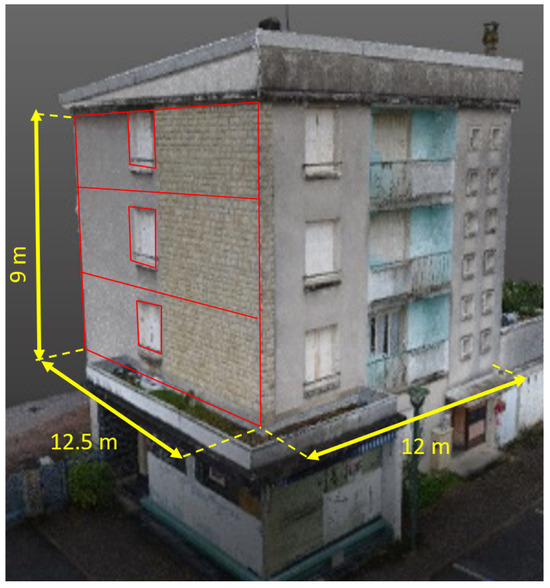
Figure 2.
Objective: generation of the layout of the prefabricated modules with the Point Cloud. Demo building of the BERTIM project in La Charitè-sur-Loire (France) with dimensions.
One of the main barriers to marketing the renovation of façades with prefabricated modules is the excessive time used for data processing and the design of the modules. Manual on-site procedures need fewer details and lower accuracy than prefabrication with modules. The upgrading of the façade using prefabricated modules requires further detailing and accuracy in the design. As a consequence, building renovation with modules requires accurate information about the building because modules need to fit into the existing building’s geometry. For the energy calculation of a building, a very accurate model is not needed. It can have tolerances. However, for the manufacturing of the modules, it is necessary to have an accurate measurement.
In addition, it is necessary to find a solution that avoids time-consuming and redundant measurement and data processing. The questions that need to be formulated are:
- Is accuracy guaranteed with an automated layout generation?
- Is the time spent in an accurate Point Cloud acquisition of the building and an automated layout generation faster and more accurate than a manual marking and data acquisition procedure and a manual design? Moreover, a secondary objective is to define the characteristics of the Point Cloud in terms of point density and accuracy.
- Which are the key points in a Point Cloud to automatically generate the layout?
The type of building facade targeted in this article is not damaged façades that present wall deviations of more than 100 mm, only facades that have a planar situation are addressed. In addition, only facades with internal window sills and jambs (the so-called inner windows) are taken into account. Regarding the facade typology being renovated presented in this article, is a very simple wall with interior windows with a healthy and rigid structure that can support the load of the modules, as shown in Figure 1.
To sum up, the overarching objective of the research presented in this article is the reduction of working hours to be more efficient than manual procedures by using prefabricated modules. It is another explicit requirement of that objective that quality and accuracy should be achieved. The novelty behind this research is, therefore, to find a semi-automated method for defining the layout of prefabricated modules with point clouds.
2. State of the Art in Data Acquisition and Processing
Preliminary approaches for data acquisition with 3D laser scanners focused on matching geometries for as-built documentation. For these cases, there was graphic documentation to compare with, meaning the CAD file. One of the preliminary studies was developed by Bosché [15] and consisted of a two-phase construction steel profile recognition by matching to a previously drafted 3D CAD. It was not an automatic procedure, as it mainly used as-built documentation. Later, automatic reconstruction of the as-built building information models from laser-scanned Point Clouds was developed [16].
The maintenance of civil engineering works and assets is also a field in which Point Cloud is relevant for inspection mainly of structures. As a difference from as-built processes, in the renovation processes, the existing building’s geometry is, in principle, unknown. Several procedures were defined to transform the Point Cloud from terrestrial laser scanner data into CAD or BIM [17,18,19]. There have been approaches in the field of bridge-column inspection [20] and the recognition of edges of these columns [21], but the accuracy was about 1 to 10 cm. Also, for aerial views, airborne laser scanning has been used to define the shape of buildings, but unfortunately the accuracy does not meet the requirements for building renovation with prefabricated modules [22,23].
To reduce the time spent on the Point Cloud processing of buildings, semi-automated methods were developed [24], in some cases, by using segmentation [25]. Regarding accuracy, there are experiences that recognized the Point Cloud for building renovation purposes, but the error was still remarkable [26]. To increase the speed of the data acquisition, mobile mapping, such as UAVs, has been used for the 3D scanning of façades [27], earthwork projects [28], and objects [29] where the accuracy depends on the range distance. Automated detection of building elements such as windows has been approached [30] by using RANSAC [31] and UAV scanners [32], but still with low accuracy for the purposes of this article. Other studies with point clouds have defined semi-automated methods for defining the facade and its elements. Some of these studies have focused on window detection in a scan-to-BIM process [33]. Moreover, there have been indoor building element definition methods with point clouds [34]. Semi-automated methods to link were also approached [35]. However, advances are being made in the field of target-oriented scanning and automatic space analysis using laser scanning and a 3D grid [36].
PCL libraries have helped in the recognition and processing of Point Clouds [37,38,39], and the segmentation of objects [40] when there is no CAD or image of the object. On the contrary, a convolutional neural network for real-time object class recognition is interesting for known objects when the 3D CAD of the object is available [41]. A polygonal surface reconstruction from point clouds using an efficient implementation of the RANSAC algorithm has been also researched [42]. Moreover, the combination of pictures and 3D laser scanner points makes it possible to recognize the main features of an object, or even façades [43], but to what extent image libraries are necessary, as well as accuracy, is still an issue.
Apart from the semantic generation of building geometries, a retrofitting potential of building envelopes based on semantic surface models derived From point clouds was also achieved, but maybe this type of research can be useful in other phases of building renovation [44].
If automation in the layout definition is required, some geometry parameters and patterns must be defined. First, approaches such as shape grammars [45] generate drawings automatically by applying certain rules with only a few input rules. The current applications are generative, and parametric designs with invalid sources are used for generating complex geometries depending on the algorithms. In that sense, fields such as urban design [46] have developed an automated layout definition depending on certain parameters. In the building renovation field, an automated primary module layout generator was already developed for existing façade geometries [9]. However, this case required previous data acquisition and a CAD drawing of the existing building.
Photogrammetry is an option for measuring façades [47]. Leberl et al. presented several methods to automate the acquisition of dimensional models of urban spaces [48]. There is also research on the detection of windows with images, but these do not offer very high accuracy. Software such as Photomodeler [49,50] offers an interesting solution with photogrammetry, but it is necessary to use targets to localize the points. There have been studies that automatically generate as-built BIM by using images [51]. Moreover, window detection in facade images is also a topic that has been researched [52,53]. A combination or hybrid method using 3D laser scanning and close-range photogrammetry for building documentation was used, but the accuracy might not be optimal for building renovation [54].
Currently, marketed software offers the possibility to define all the necessary parts of a prefabricated façade module with only the primary layout [55]. The secondary layout can then be automatically generated with software such as Dietrich’s©, which automates the design of every part of the wall once the primary layout is set up. The aforementioned software already generates the CAM for certain machines. Therefore, it is not within the scope of this research to develop a complete wall design automatically.
Moreover, software such as Dynamo™ offers the possibility to integrate algorithms in Python™ to execute commands that can process Point Clouds.
The primary layout should be generated as in a mass customization concept [56] as the development of mass manufacturing. For all these reasons, automatically obtaining the layout of the module with only the input of the gathered data should be part of the future of this workflow, as shown in Figure 3.
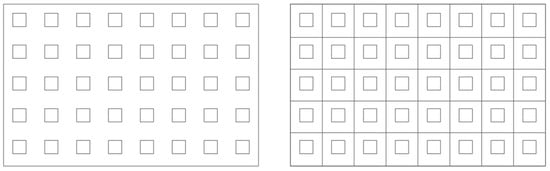
Figure 3.
Automated primary layout generation of a very simple facade. Left, existing building, Right, existing building with primary layout.
Within the BERTIM project [57], research was conducted to define the layout by using Point Clouds of existing buildings. In this project, the so-called RenoBIM software was developed (see the scheme in Figure 4). The RenoBIM concept requires the Point Cloud as initial input. The Point Cloud was used in a BIM to create the model of the existing building. This model was exported to an .ifc file that was inserted into the RenoBIM software. RenoBIM software was able to define the modules by using the size and perimeter of each of the modules. From RenoBIM, the work was exported to an .ifc file, and from there, it goes to BIM or to a parametric software such as Dietrich’s©, with which the CAM can be generated. This process was time-consuming and high effort. Moreover, drafting the BIM model from the Point Cloud required reducing the complexity of the building geometry. This caused a loss of information about the building, such as the irregular surfaces that a wall might have.
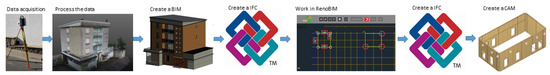
Figure 4.
Process proposed for RenoBIM in BERTIM.
As a summary of the state-of-the-art, the following points can be outlined:
- The automated data acquisition and recognition of construction objects is a topic that has been developed, but it lacks the required accuracy. There have been advances in the scanning hardware used for Digital Twins [58]. Continuous improvements have been made in order to gain accuracy [59]. However, accuracy of the Point Cloud is still a major issue.
- Recognition of known shapes is not applicable for acquiring and processing data with high accuracy.
- The automated design was based on previously drafted existing buildings.
- Regarding the boundary conditions, or tolerances, DIN 18202 [60] specifies the accuracy requirements of external walls. As a reference, in a facade of 15 m, 20 mm of deviation are accepted.
For these reasons, it was necessary to create a semi-automated process that defines the geometry of the modules by using the Point Cloud of the existing building. Another objective of the research is to decide on a semi-automated prefabricated layout definition.
3. Development of a Novel Solution
As mentioned above, the objective of the research was to create a primary layout of the modules with the coordinates (, , ) of the Point Cloud. Ideally, building data acquisition should automatically generate the necessary information for the manufacture of the modules. The research presented in this article gets as close to this goal as possible. Manually defining the primary layout accurately onto a Point Cloud is a decision-making process because the boundaries of the different construction elements are not defined by lines or surfaces, and the cloud’s appearance changes depending on the point of view. For these reasons, the process tends to be time-consuming, leading to errors (Figure 5).
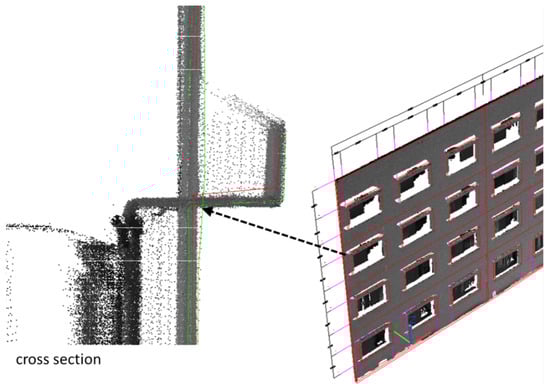
Figure 5.
Point Clouds and difficulties to determine geometries. (Left) Cross-section of a window sill. (Right) Overall view of a facade.
In comparison to previous experiences, it was necessary to simplify the process. As observed in the BERTIM project [57], defining the layout of the prefabricated modules with this procedure was a time-consuming task. For achieving such a layout semiautomatically, the acquired data needed to be processed adequately. The current techniques have been divided into subcategories (SC). This research is not about solving the issues in data acquisition (SC1.1) and data processing (SC1.2), but is focused with respect to the layout definition (SC1.3). However, SC1.1 and SC1.2, as well as the novel solutions (DNS 1.3), need to be part of a novel step-by-step workflow defined in this research. The configuration of the steps is new, although the algorithms, tools, and techniques in SC1.1 and SC1.2 are currently used. DNS1.3 is based on novel developments, as explained in Figure 6:
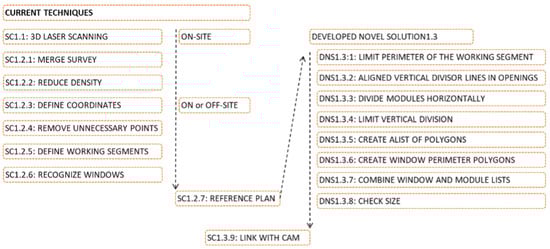
Figure 6.
Scheme of the step-by-step process.
In the next points, the steps shown in Figure 6 are explained:
- SC1.1. With current techniques, data acquisition is achieved with a 3D laser scanner, such as the one in Figure 7. Several scanning surveys might be necessary, depending on the size of the façade.
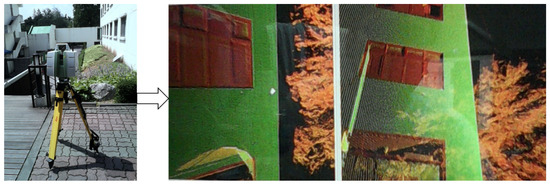 Figure 7. Data acquisition with 3D laser scanning and processing.
 - SC1.2.1. After data acquisition, these surveys can be merged with current software.
- SC1.2.2. For the application explained in this dissertation, it is recommended to reduce the point density of the Point Cloud to a grid that is manageable. In the case of 3D Point Clouds, the points to be processed could reach hundreds of millions. At this time, it can be said that this is too much data processing [61]; therefore, the density needs to be minimized. The density will depend on the processing capacity of the computer.
- SC1.2.3. After the density is reduced, the coordinates of the building origin must be defined to manage the Point Cloud more efficiently.
- SC1.2.4. The next step consists of removing the points that are not necessary, which means all the points that are out of range of the building façade.
- SC1.2.5. The next step consists of defining manageable working segments of the façades. Buildings normally have heterogeneous envelopes. Therefore, in this step, the façade segments that include these characteristics need to be isolated and defined as a manageable working segment. For this purpose, the points that include these segments should be selected.
- SC1.2.6: Recognize windows (wall openings). The building elements should be recognized for determining elements such as the walls and windows of the facade. Point Cloud processing software permits, in a semi-automated way, the categorization of points within a range of distances concerning a plan. The inner window has an outdoor sill and a jamb and can be classified separately from the façade plan. The window is placed in the interior with respect to the wall plan. The difference in depth in the x-axis facilitates the categorization of the window opening. In addition to that, the slab’s z coordinate is necessary to define the separator of the horizontal module of the primary layout. The rest of the points would be part of the solid wall.
- SC1.2.7. We select the appropriate reference plan for each of the working segments. Walls and façades have irregularities, and the Point Cloud collects these irregularities. The selection of an appropriate reference is necessary. If an inappropriate coordinate system and preference plan are selected, excessive separation and non-parallel location of the modules might occur (see where the dashed coordinate systems are exaggeratedly deviated to explain the importance of the topic). As a consequence, excessive insulation might be foreseen to cover the gap between the existing wall and the module. Due to this, the internal insulation of the module may collide during insulation. Additionally, the separation between the existing wall and the modules must also be considered, which usually depends on the insulation thickness that the modules have in the inner face. Therefore, there is a need to automatically define the points of the cloud in the coordinate system accurately. For this reason, an average plan must be determined for each manageable working segment. The Working Plan is where the primary layout is arranged. It needs to be parallel to the average façade plan, which is determined by the Point Cloud of the façade. For defining such a plan, a coordinate system must be determined.
With the processed Point Cloud shown in Figure 8 (right), the objective of the research of this article was to generate the primary layout. To reach that goal, some research gaps needed to be solved. RG1.3 refers to the lack of an automated layout of the modules. Once the data are processed and the building elements have been recognized, the primary layout should be generated automatically, depending on the given parameters, such as the minimum and maximum length of the modules. Regarding height, it must be noted that the modules, or better said, the connectors, are normally fixed to structural floor slabs, and for this reason, the slabs normally mark the division of the modules. Therefore, the strategy is to define the polygons of the module out from the coordinates of the points by using PCL libraries [37,39]. The next sub-solutions (DNS) are necessary to gather the polygons of the modules.
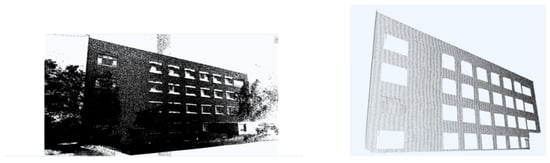
Figure 8.
(Left) Merged Point Cloud of a building and surrounding area. (Right) After processing.
Once the plan of a façade is categorized, the window is considered part of a Point Cloud that was inside or, better said, out of range of the plan. For that purpose, a Python™ script taken from the PLC libraries localizes the points that are out of the range of the plan. The recognition of the construction elements, such as windows, balconies, and floors, should permit the division of the layout of the modules. For now, only simple construction elements, such as windows, are recognized.
For that reason, the next sub-solutions (DNS) are necessary to gather the polygons of the modules:
- DNS1.3.1: Limit the perimeter of the working segment. Create the geometry of the wall by finding the outer points of the wall segment and complete the geometry of a façade if necessary. Check what happens in the corner when there is a blind spot. For that purpose, partial reconstruction is needed and suppose that the geometry follows a certain pattern.
- DNS1.3.2: Modules with aligned vertical divisor lines in openings. When upgrading a building façade, it is normally desirable to plumb the lines of the modules and the lines of the window openings, not only for aesthetic aspects but also to regularize the size of the windows and the production of the modules. Selecting the axe of the window vertical limit correctly is crucial. The strategy used in this research consisted of obtaining the outer points of the window hole.
- DNS1.3.3: Divide the modules horizontally according to the middle Z-value of the floor slab, or in other words, obtain the medium Z-value of the slab to divide the modules horizontally. Also, it is required that the horizontal module division meets with the slab of the existing building. In this way, the connector can be placed on the structural support. The importance of the primary layout lies not only in the module divisor and the openings of the windows but also in the location of the connector in the corners of the modules (see the blue squares in Figure 9).
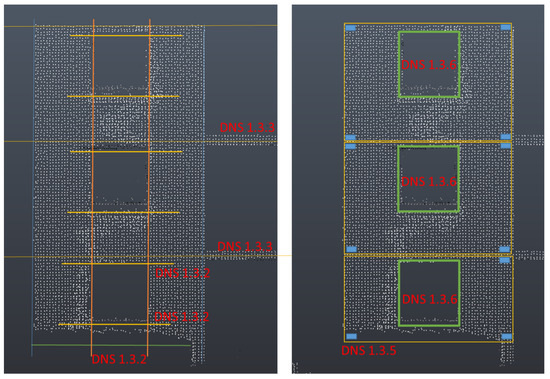 Figure 9. Definition of limits and polygons of working segments. (Left) DSN1.3.2 and 1.3.3. (Right) DNS1.3.5 and 1.3.6.
 - DNS1.3.4: Limit the vertical division of the modules according to a given width. Module size according to given parameters. When defining the module layout, it is necessary to consider the maximum and minimum sizes of the manufacturers.
- DNS1.3.5. Create a list of polygons of modules.
- DNS1.3.6: Create the window perimeter geometry segment by joining the lines generated in DNS1.3. and create a list of polygons. The window lines should be aligned.
- DNS1.3.7: Combine the window list and the module list.
- DNS1.3.8: Check that the size is correct according to the parameters given (height and width).
The steps from DNS1.3.1 to DNS1.3.8 are reflected in Figure 9.
After the polygons are defined, they should be processed to any CAD or CAM: SC1.3.9: Link with BIM (and CAM). Once the layout is obtained, it is necessary to remark that the output should be linked to the BIM file. Moreover, the primary layout should be connected and interrelated with all processes, especially with CAM for manufacturing. This primary layout should be the binding and link for the entire process, from data acquisition to robotic manufacturing and installation.
The primary layout generated in the previous step was linked with the Revit, which is a BIM by using a simple built-in node of Dynamo™ or any other parametric design software tool.
4. Tests of the Novel Process
The concept was tested using real Point Cloud data of a real building located in La Charitè-sur-Loire (France), see Figure 2. The structure in this building is reinforced concrete and facade walls made with brick and mortar. The software environments for processing the concepts were Recap™ and Dynamo™.
Dynamo™ software was used, firstly because it allows Python™ scripts to be integrated into visual computing, and second because it is connected to Revit™ (BIM) and can generate CAD output. In addition, visual programming software such as Dynamo™ facilitates visualizing the code and output during the development process. The Point Cloud used in this test was a demo-building in the BERTIM project [57]. In this research project, the layout was defined manually. The facade of this demo building is heterogeneous. Therefore, for the test, some parts of the facade needed to be selected that met the scope of this research—a simple facade with window openings in a regular grid.
The measurement of the building in the BERTIM research project was achieved with a digital theodolite (or Total Station). In parallel, we used a laser scanning device to develop the research presented in this paper. The data from the 3D laser scanner differed from the Total Station survey data, especially on the upper floors, with deviations of up to 20 cm in the corners of the windows. As can be seen in Figure 10, the lines in red refer to the perimeter lines of the windows measured by the Total Station, and the white dots refer to the Point Cloud. This is a fact that needs to be considered; the Point Cloud used was not as accurate as the points acquired within the Total Station. Therefore, the ’accuracy’ of the output is estimated to be low due to the tolerance of the Point Cloud.
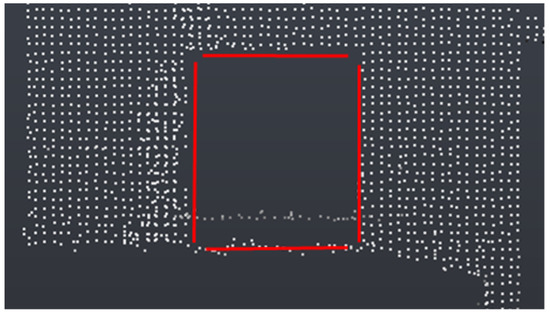
Figure 10.
Point Cloud vs. Total Station surveys.
To compare the layout defined manually with the workflow and algorithm described in this paper, the areas to arrange the primary layout corresponded with the selected facade parts shown in Figure 11.
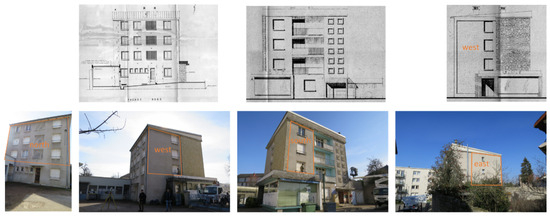
Figure 11.
Façade segments selected for the project analysis.
The scanning of the building (SC 1.1) was achieved with a Faro® Laser Scanner Focus Series X, and the merging of different stations was achieved with SCENE® from Faro® (SC 1.2.1) (these tasks were not achieved by the authors). Furthermore, this scanning was incomplete due to accessibility reasons, it was difficult to access all four façades, and some data were missing.
Recap™ was used to perform the tasks from SC1.2.2 to SC1.2.4 (Figure 12). During the opening of the Point Cloud in Recap™, two Point Cloud densities (SC 1.2.2) were tested:
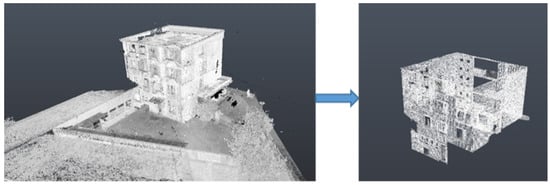
Figure 12.
(Left) Point Cloud received. (Right) Façades selected.
- A low density of points with a grid of 100 mm by 100 mm.
- A higher density of points with a grid of 20 mm by 20 mm.
Once the Point Cloud was opened in Recap™, the origin was set up (SC1.2.3), and the unnecessary points from the cloud were removed (SC 1.2.4) (Figure 12).
As a next step, four manageable working segments were defined (SC1.2.5) (Figure 13), and, for that purpose, nine parts of the segments were selected:
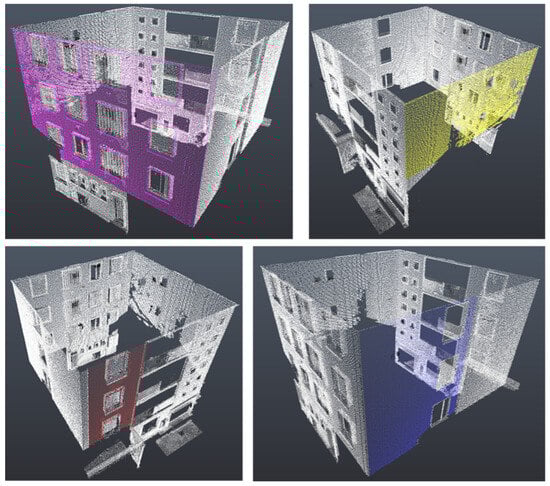
Figure 13.
Selected façade segments: (Top left) North. (Top right) East. (Bottom left) South and slabs. (Bottom right) West.
- Four manageable working façade segments without the interior of the window (SC1.2.6).
- The same four manageable façade working segments with the interior of the window (SC1.2.6).
- Slabs of a balcony used as a reference for horizontally dividing the module.
Each of the segments had a different number of points. These segments were first exported to a .pst file and then to Excel files.
Each segment was exported with two different degrees of density to check if that is a factor of influence on the final output of the modules, as can be observed in Table 1.

Table 1.
Number of points for each wall segment.
Excel files were used to perform the algorithms in Dynamo™ and to calculate the solutions from DNS1.3.1 to DNS1.3.8.
After that, the code set up in Dynamo™ was executed. A line geometry was generated, which was exported to a CAD system (it could be exported directly to the Revit BIM (Figure 14).
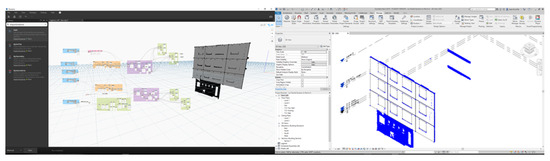
Figure 14.
Spreadsheet file list with coordinates, processing in Dynamo™, and linking with Revit 2021™.
The biggest issue was to define the perimeter of the windows. Different Point Cloud densities were tested. The point density of the wall was irrelevant. However, the density of the window hole was of special importance.
5. Results and Discussion
The two parameters, working time and output accuracy, were considered to evaluate the results.
5.1. Working Time
The test was carried out on a computer with an Intel©Core™ i7-6700K processor with 4.00 Hz and a RAM of 8.00 GB. Regarding the necessary time for processing data, with the Point Cloud with a grid of 20 mm by 20 mm (when using the Point Clouds with the grid of 100 × 100 mm, the computer took too much time for processing), time was reduced significantly to 4 h. This means that 0.0017 h were necessary per square meter (see Table 2. SC1.1 (data acquisition) is a process that requires up to 3 h. Using the algorithms to process DNS1.3.1 to DNS1.3.8. in Dynamo™, the processing time was minimized, as shown in Table 2. It must be noted that 40 h (that included the manual detailing of the materials and elements of the modules) were needed for designing the analyzed case in Chapter 4 therefore, the time reduction was significant.
Table 2.
Approximate time for each step.
5.2. Output Accuracy
As estimated due to the tolerances of the Point Cloud, overall, the accuracy of the output compared to the layout defined manually was still not as good as desired. In Figure 15, the results of the façades south, west, and east are shown. The results gathered by the 20 mm by 20 mm grid are shown in red, while the results gathered by the 100 mm by 100 mm grid are shown in blue. In Figure 15 and Figure 16, the layout of the manually defined modules is in black. As shown in Figure 15, deviations are up to 50 cm. However, due to the better Point Cloud definition in the north façade, the primary layout achieved by the novel solution had only deviations around 20 cm, as shown in Figure 16. In this figure, only the results gathered by the 100 mm by 100 mm grid are shown in blue because the results of the 20 mm by 20 mm grid are poorer. Therefore, it can be considered that for the developed DNS, the density of the Point Cloud is not as relevant as the accuracy of the Point Clouds. In addition, another topic to be considered is the corners of a module when the wall is not regular (Figure 16). The algorithms developed did not consider this situation and “errors” appeared.
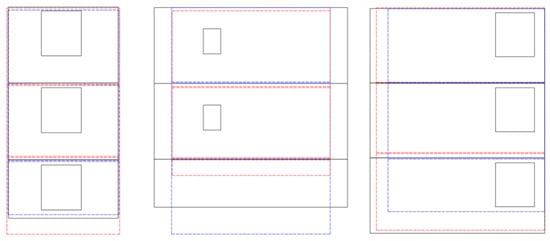
Figure 15.
Comparison of manual (black) and automated (blue and red) procedures in facades south, west, and east.
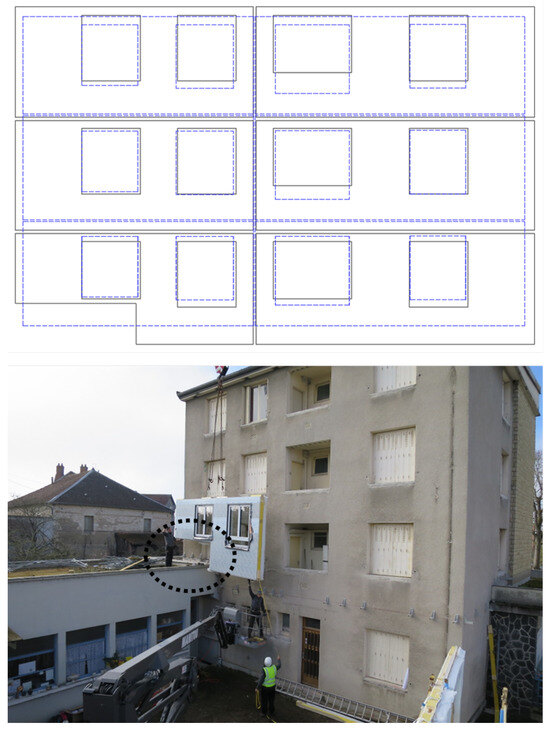
Figure 16.
(Top) Comparison of manual (black) and automated procedures (blue). (Bottom) Picture showing the corner detail.
Finally, excessive noise of the selected segments caused an issue in defining the shape of the windows. The windows were not detected by the algorithm if the definition of points around the corners of the window sills was not sufficient. That is what happened in all segments, except for the north segment. The reason for this issue might rely on the blind spots of the surveys in the east–west, south, and west (Figure 17).
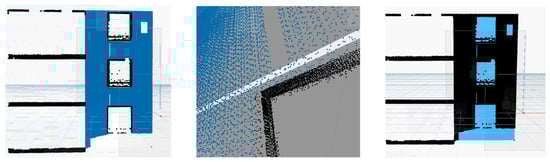
Figure 17.
Insufficient window sill definition in south segment.
6. Conclusions and Future Needs
According to the results, it was concluded that spending more time achieving an accurate 3D laser data acquisition can be a good strategy for obtaining the primary layout with sufficient precision. Existing building renovation with prefabricated modules requires accurate measurements or else problems occur. Moreover, one of the reasons for the difficulties in marketing prefabricated modules for building renovation is the time-consuming procedures for measuring the building and generating the layout of the prefabricated modules. In the research presented in this paper, Point Cloud technology was used in order to measure the building and semi-automatically generate the layout of the prefabricated modules. The results showed interesting outcomes. However, as remarked in the previous section, some future needs were detected:
- FN1.1: Accuracy of the measuring device and acquired data. The primary layout definition is dependent on the accuracy of the Point Cloud data acquisition. The limitations of the building measurement, lack of enough information, and blind spots are a major threat to putting into practice the methods explained in this article.
- FN1.3.1: Accuracy of the selected segments. The Point Cloud does not offer a surface per se. Data processing and decision making are necessary to select surfaces. Determining the working plan and section of the primary layout properly has primordial importance.
- FN1.3.3: This study is limited by the definition of the coordinates of the building slab. Without that data, it is difficult to know where to horizontally split the building module layout and where to place the connectors. In future work, thermal camera images should be considered and matched with the Point Cloud to find the slab’s position (Figure 18). There was an interesting combination of thermal images and 3D laser scanning [62]. Unfortunately, the accuracy of the solution was not defined.
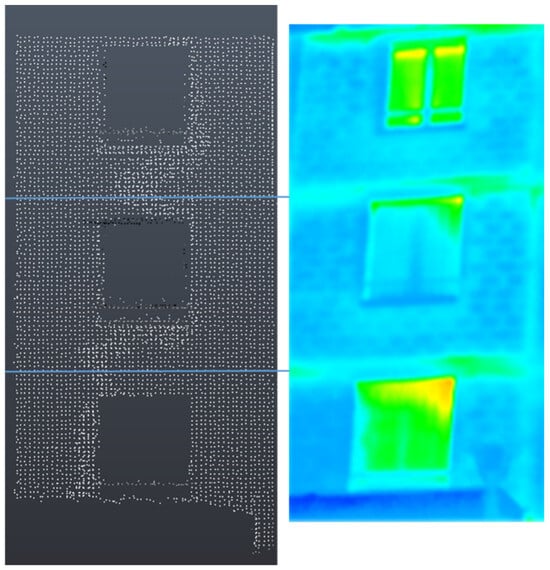 Figure 18. Thermal camera and Point Cloud combination for defining the position of the slab (Thermal picture by Dr Zaratiana Mardara, FCBA).
Apart from the FNs found to improve the research presented in this article, it must be noted that two points need to be addressed in the future:
- Define the geometry for customized fire barriers. According to the latest research on the topic, each module should define a separate fire area. This means that each module should have a fire barrier in the whole perimeter. As explained above, the walls are not plumbed and are irregular, and it is necessary to remark that the panels need to be fireproof and that the areas of each module need to be protected with barriers or cavity barriers. Fire-resistant barriers can be placed on top of the modules. Each module should be independently fireproof. Therefore, it is necessary to know the approximate thickness of the barrier to avoid gaps or excessive thickness. The depth of the perimeter varies depending on the irregularities of the wall (Figure 19).
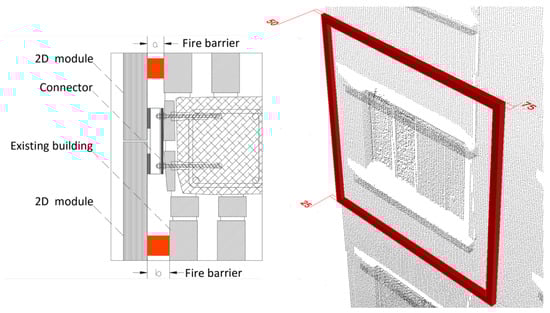 Figure 19. The fire barriers need to have a variable depth along the façade. (Left) Cross-section. (Right) View with Point Cloud.
 - Create a library to recognize objects in complex façade elements. A more complex façade typology beyond the scope of this research should be taken into account for a broader market approach. To do so, the development of different processing algorithms would be necessary.
To finalize, and regarding the limitations of the study, it can be stated that if the Point Cloud is not accurate, the solution presented in this research can not be accurate. For obtaining accurate results, accurate Point Clouds are necessary, and for that, more time on-site is necessary. Future studies should compare if the time consumed on-site for obtaining an accurate Point Cloud can be compensated by the time saved during the definition of the layout.
Author Contributions
Conceptualization, K.I., E.G., and T.B.; methodology, K.I. and T.B.; software, K.I. and E.G.; validation, K.I.; formal analysis, K.I.; investigation, K.I. and T.B.; resources, K.I.; writing—original draft preparation, K.I.; writing—review and editing, K.I. and E.G.; visualization, K.I.; supervision, T.B. and E.G.; project administration, T.B. and K.I.; funding acquisition, T.B. and K.I. All authors have read and agreed to the published version of the manuscript.
Funding
This project has received funding from the European Union’s Horizon 2020 research and innovation program under grant agreement No. 636984.
Institutional Review Board Statement
Not applicable.
Informed Consent Statement
Not applicable.
Data Availability Statement
Samples of the compounds are available from the authors.
Acknowledgments
The research presented in this paper was originally carried out in the context of the H2020 project BERTIM. BERTIM has received funding from the European Union’s Horizon 2020 research and innovation program under grant agreement No. 636984.
Conflicts of Interest
The authors declare no conflicts of interest.
Abbreviations
The following abbreviations are used in this manuscript:
| NZEB | Nearly Zero-Energy Building |
| CAM | Computer-Aided Manufacturing |
| CAD | Computer-Aided Design |
| BIM | Building Information Modeling |
| UAV | Unmanned Aerial Vehicle |
| SC | Subcategory |
| DNS | Developed Novel Solution |
| RG | Research Gap |
| PCL | Point Cloud Library |
| FN | Future Need |
References
- Sesana, M.; Salvalai, G.; Brutti, D.; Mandin, C.; Wei, W. ALDREN: A Methodological Framework to Support Decision-Making and Investments in Deep Energy Renovation of Non-Residential Buildings. Buildings 2020, 11, 3. [Google Scholar] [CrossRef]
- Rodríguez-Álvarez, J. Urban Building Energy Modelling for the Renovation Wave: A Bespoke Approach Based on EPC Databases. Buildings 2023, 13, 1636. [Google Scholar] [CrossRef]
- Iturralde, K.; Linner, T.; Bock, T. Matching kit interface for building refurbishment processes with 2D modules. Autom. Constr. 2020, 110, 103003. [Google Scholar] [CrossRef]
- Iturralde, K.; Linner, T.; Bock, T. Development of a Modular and Integrated Product-Manufacturing-Installation System Kit for the Automation of the Refurbishment Process in the Research Project BERTIM. In Proceedings of the International Symposium on Automation and Robotics in Construction (IAARC), Auburn, AL, USA, 18–21 July 2016. [Google Scholar] [CrossRef]
- Iturralde, K.; Linner, T.; Bock, T. First Monitoring and Analysis of the Manufacturing and Installation Process of Timber Based 2D Modules for Accomplishing a Future Robotic Building Envelope Upgrading. In Proceedings of the International Symposium on Automation and Robotics in Construction (IAARC), Taipei, Taiwan, 27–30 June 2017; Tribun EU, s.r.o.: Brno, Czech Republic, 2017. [Google Scholar] [CrossRef]
- Tsai, I.C.; Kim, Y.; Seike, T. Decision-making Consideration in Energy-conservation Retrofitting strategy for the Opening of Existing Building in Taiwan. AIJ J. Technol. Des. 2017, 23, 963–968. [Google Scholar] [CrossRef]
- Bock, T.; Linner, T. Site Automation; Cambridge University Press: Cambridge, UK, 2015. [Google Scholar] [CrossRef]
- Pérez-Navarro, J.; Bueso, M.C.; Vázquez, G. Drivers of and Barriers to Energy Renovation in Residential Buildings in Spain—The Challenge of Next Generation EU Funds for Existing Buildings. Buildings 2023, 13, 1817. [Google Scholar] [CrossRef]
- Barco, A.F.; Vareilles, É.; Gaborit, P.; Aldanondo, M. Building renovation adopts mass customization. J. Intell. Inf. Syst. 2016, 49, 119–146. [Google Scholar] [CrossRef]
- Doukari, O.; Seck, B.; Greenwood, D. The Creation of Construction Schedules in 4D BIM: A Comparison of Conventional and Automated Approaches. Buildings 2022, 12, 1145. [Google Scholar] [CrossRef]
- Sandberg, K.; Orskaug, T.; Andersson, A. Prefabricated Wood Elements for Sustainable Renovation of Residential Building Façades. Energy Procedia 2016, 96, 756–767. [Google Scholar] [CrossRef]
- Haslam, R.; Hide, S.; Gibb, A.; Gyi, D.; Pavitt, T.; Atkinson, S.; Duff, A. Contributing factors in construction accidents. Appl. Ergon. 2005, 36, 401–415. [Google Scholar] [CrossRef]
- Jiang, S.; Wang, M.; Ma, L. Gaps and requirements for applying automatic architectural design to building renovation. Autom. Constr. 2023, 147, 104742. [Google Scholar] [CrossRef]
- Ishikawa, T.; Seike, T.; Kim, Y.; Wakayama, A.; Hayashi, T. A Study on the Actual Situation about the Saving Energy Renovation of an Existing Apartment House by External Insulation. AIJ J. Technol. Des. 2015, 21, 35–40. [Google Scholar] [CrossRef][Green Version]
- Bosché, F. Automated recognition of 3D CAD model objects in laser scans and calculation of as-built dimensions for dimensional compliance control in construction. Adv. Eng. Inform. 2010, 24, 107–118. [Google Scholar] [CrossRef]
- Kim, C.; Son, H.; Kim, C. Fully automated registration of 3D data to a 3D CAD model for project progress monitoring. Autom. Constr. 2013, 35, 587–594. [Google Scholar] [CrossRef]
- Arayici, Y. An approach for real world data modelling with the 3D terrestrial laser scanner for built environment. Autom. Constr. 2007, 16, 816–829. [Google Scholar] [CrossRef]
- Becker, S.; Haala, N. Grammar supported facade reconstruction from mobile lidar mapping. In Proceedings of the CMRT09, Paris, France, 3–4 September 2009; IAPRS: Hannover, Germany, 2009; Volume XXXVIII. Part 3/W4. [Google Scholar]
- Pu, S.; Vosselman, G. Knowledge based reconstruction of building models from terrestrial laser scanning data. ISPRS J. Photogramm. Remote Sens. 2009, 64, 575–584. [Google Scholar] [CrossRef]
- Tang, P.; Akinci, B.; Huber, D. Quantification of edge loss of laser scanned data at spatial discontinuities. Autom. Constr. 2009, 18, 1070–1083. [Google Scholar] [CrossRef]
- Tang, P.; Huber, D.; Akinci, B.; Lipman, R.; Lytle, A. Automatic reconstruction of as-built building information models from laser-scanned point clouds: A review of related techniques. Autom. Constr. 2010, 19, 829–843. [Google Scholar] [CrossRef]
- Ostrowski, W.; Pilarska, M.; Charyton, J.; Bakuła, K. Analysis of 3D building models accuracy based on the airborne laser scanning point clouds. Int. Arch. Photogramm. Remote Sens. Spat. Inf. Sci. 2018, XLII-2, 797–804. [Google Scholar] [CrossRef]
- Awrangjeb, M. Using point cloud data to identify, trace, and regularize the outlines of buildings. Int. J. Remote Sens. 2016, 37, 551–579. [Google Scholar] [CrossRef]
- Jung, J.; Hong, S.; Jeong, S.; Kim, S.; Cho, H.; Hong, S.; Heo, J. Productive modeling for development of as-built BIM of existing indoor structures. Autom. Constr. 2014, 42, 68–77. [Google Scholar] [CrossRef]
- Macher, H.; Landes, T.; Grussenmeyer, P.; Alby, E. Semi-automatic Segmentation and Modelling from Point Clouds towards Historical Building Information Modelling. In Digital Heritage. Progress in Cultural Heritage: Documentation, Preservation, and Protection; Springer International Publishing: Berlin/Heidelberg, Germany, 2014; pp. 111–120. [Google Scholar] [CrossRef]
- Wang, C.; Cho, Y.K.; Kim, C. Automatic BIM component extraction from point clouds of existing buildings for sustainability applications. Autom. Constr. 2015, 56, 1–13. [Google Scholar] [CrossRef]
- Roca, D.; Lagüela, S.; Díaz-Vilariño, L.; Armesto, J.; Arias, P. Low-cost aerial unit for outdoor inspection of building façades. Autom. Constr. 2013, 36, 128–135. [Google Scholar] [CrossRef]
- Siebert, S.; Teizer, J. Mobile 3D mapping for surveying earthwork projects using an Unmanned Aerial Vehicle (UAV) system. Autom. Constr. 2014, 41, 1–14. [Google Scholar] [CrossRef]
- Cawood, A.J.; Bond, C.E.; Howell, J.A.; Butler, R.W.; Totake, Y. LiDAR, UAV or compass-clinometer? Accuracy, coverage and the effects on structural models. J. Struct. Geol. 2017, 98, 67–82. [Google Scholar] [CrossRef]
- Pu, S.; Vosselman, G. Extracting windows from terrestrial laser scanning. In Proceedings of the ISPRS Workshop on Laser Scanning 2007 and SilviLaser 2007, Espoo, Finland, 12–14 September 2007; ISPRS: Hannover, Germany, 2007. [Google Scholar]
- Tuttas, S.; Stilla, U. Window Detection in Sparse Point Clouds Using Indoor Points. Int. Arch. Photogramm. Remote Sens. Spat. Inf. Sci. 2013, XXXVIII-3/W22, 131–136. [Google Scholar] [CrossRef]
- Malihi, S.; Zoej, M.V.; Hahn, M.; Mokhtarzade, M. Window Detection from UAS-Derived Photogrammetric Point Cloud Employing Density-Based Filtering and Perceptual Organization. Remote Sens. 2018, 10, 1320. [Google Scholar] [CrossRef]
- Macher, H.; Roy, L.; Landes, T. Automation of Windows Detection from Geomatric and Radiometric Iinformation of Point Clouds in a Scan-to-BIM Process. Int. Arch. Photogramm. Remote Sens. Spat. Inf. Sci. 2021, XLIII-B2-2021, 193–200. [Google Scholar] [CrossRef]
- Quintana, B.; Prieto, S.; Adán, A.; Bosché, F. Door detection in 3D coloured point clouds of indoor environments. Autom. Constr. 2018, 85, 146–166. [Google Scholar] [CrossRef]
- Macher, H.; Landes, T.; Grussenmeyer, P. From Point Clouds to Building Information Models: 3D Semi-Automatic Reconstruction of Indoors of Existing Buildings. Appl. Sci. 2017, 7, 1030. [Google Scholar] [CrossRef]
- Kim, D.; Kwon, S.; Cho, C.S.; de Soto, B.G.; Moon, D. Automatic Space Analysis Using Laser Scanning and a 3D Grid: Applications to Industrial Plant Facilities. Sustainability 2020, 12, 9087. [Google Scholar] [CrossRef]
- Rusu, R.B.; Cousins, S. 3D is here: Point Cloud Library (PCL). In Proceedings of the 2011 IEEE International Conference on Robotics and Automation, Shanghai, China, 9–13 May 2011; IEEE: Piscataway, NJ, USA, 2011. [Google Scholar] [CrossRef]
- Aldoma, A.; Márton, Z.C.; Tombari, F.; Wohlkinger, W.; Potthast, C.; Zeisl, B.; Rusu, R.B.; Gedikli, S.; Vincze, M. Tutorial: Point Cloud Library: Three-Dimensional Object Recognition and 6 DOF Pose Estimation. IEEE Robot. Autom. Mag. 2012, 19, 80–91. [Google Scholar] [CrossRef]
- Point Cloud Library. PCL. Available online: https://pointclouds.org (accessed on 4 September 2023).
- Ramiya, A.M.; Nidamanuri, R.R.; Krishnan, R. Segmentation based building detection approach from LiDAR point cloud. Egypt. J. Remote Sens. Space Sci. 2017, 20, 71–77. [Google Scholar] [CrossRef]
- Garcia-Garcia, A.; Gomez-Donoso, F.; Garcia-Rodriguez, J.; Orts-Escolano, S.; Cazorla, M.; Azorin-Lopez, J. PointNet: A 3D Convolutional Neural Network for real-time object class recognition. In Proceedings of the 2016 International Joint Conference on Neural Networks (IJCNN), Vancouver, BC, Canada, 24–29 July 2016; IEEE: Piscataway, NJ, USA, 2016. [Google Scholar] [CrossRef]
- Nan, L.; Wonka, P. PolyFit: Polygonal Surface Reconstruction from Point Clouds. In Proceedings of the 2017 IEEE International Conference on Computer Vision (ICCV), Venice, Italy, 22–29 October 2017; IEEE: Piscataway, NJ, USA, 2017. [Google Scholar] [CrossRef]
- Su, H.; Jampani, V.; Sun, D.; Maji, S.; Kalogerakis, E.; Yang, M.H.; Kautz, J. SPLATNet: Sparse Lattice Networks for Point Cloud Processing. 2018. Available online: https://pointclouds.org (accessed on 4 September 2023). [CrossRef]
- Selimovic, E.; Noichl, F.; Forth, K.; Borrmann, A. Retrofitting Potential of Building envelopes Based on Semantic Surface Models Derived From Point Clouds. J. Facade Des. Eng. 2022, 10, 127–140. [Google Scholar] [CrossRef]
- Stiny, G.; Gips, J. Shape Grammars and the Generative Specification of Painting and Sculpture. In The Best Computer Papers of 1971; Auerbach: Philadelphia, PA, USA, 1972; pp. 125–135. [Google Scholar]
- Schneider, S.; Fischer, J.R.; König, R. Rethinking Automated Layout Design: Developing a Creative Evolutionary Design Method for the Layout Problems in Architecture and Urban Design. In Design Computing and Cognition ’10; Springer: Dordrecht, The Netherlands, 2011; pp. 367–386. [Google Scholar] [CrossRef]
- Ordóñez, C.; Martínez, J.; Arias, P.; Armesto, J. Measuring building façades with a low-cost close-range photogrammetry system. Autom. Constr. 2010, 19, 742–749. [Google Scholar] [CrossRef]
- Leberl, F. Automated photogrammetry for three-dimensional models of urban spaces. Opt. Eng. 2012, 51, 021117. [Google Scholar] [CrossRef]
- Neuhausen, M.; König, M. Improved Window Detection in Facade Images. In Advances in Informatics and Computing in Civil and Construction Engineering; Springer: Berlin/Heidelberg, Germany, 2018. [Google Scholar]
- Photomodeler Technologies. Photomodeler. 2020. Available online: https://www.photomodeler.com (accessed on 4 August 2023).
- Yang, J.; Shi, Z.K.; Wu, Z.Y. Towards automatic generation of as-built BIM: 3D building facade modeling and material recognition from images. Int. J. Autom. Comput. 2016, 13, 338–349. [Google Scholar] [CrossRef]
- Neuhausen, M.; Martin, A.; Mark, P.; König, M. A Cascaded Classifier Approach to Window Detection in Facade Images. In Proceedings of the 34th International Symposium on Automation and Robotics in Construction (ISARC), Taipei, Taiwan, 27–30 June 2017; Tribun EU, s.r.o.: Brno, Czech Republic, 2017. [Google Scholar] [CrossRef]
- Neuhausen, M.; Obel, M.; Martin, A.; Mark, P.; König, M. Window detection in facade images for risk assessment in tunneling. Vis. Eng. 2018, 6, 1. [Google Scholar] [CrossRef]
- Fawzy, H.E.D. 3D laser scanning and close-range photogrammetry for buildings documentation: A hybrid technique towards a better accuracy. Alex. Eng. J. 2019, 58, 1191–1204. [Google Scholar] [CrossRef]
- Technology, D. Dietrich’s. 2020. Available online: https://www.dietrichs.com/en/ (accessed on 4 September 2023).
- Pine, B. Mass Customization: The New Frontier in Business Competition; Harvard Business School Press: Boston, MA, USA, 1993. [Google Scholar]
- CORDIS European Commission. Building Energy Renovation through Timber Prefabricated Modules. 2015. Available online: https://cordis.europa.eu/project/id/636984 (accessed on 4 August 2023). [CrossRef]
- Lu, R.; Ma, Y.; Guo, L.; Thorpe, T.; Brilakis, I. An Automated Target-Oriented Scanning System for Infrastructure Applications; American Society of Civil Engineers: Reston, VA, USA, 2020. [Google Scholar] [CrossRef]
- Kulawiak, M.; Lubniewski, Z. Improving the Accuracy of Automatic Reconstruction of 3D Complex Buildings Models from Airborne Lidar Point Clouds. Remote Sens. 2020, 12, 1643. [Google Scholar] [CrossRef]
- DIN 18202:2019-07; Tolerances in Building Construction-Buildings. Beuth Verlag: Berlin, Germany, 2019. Available online: https://www.beuth.de/de/norm/din-18202/307314612 (accessed on 8 August 2023).
- Mashey, J.R. Big Data and the Next Wave of InfraStress Problems, Solutions, Opportunities. In Proceedings of the 1999 USENIX Annual Technical Conference (USENIX ATC 99), Monterey, CA, USA, 7–11 June 1999. [Google Scholar]
- Alba, M.I.; Barazzetti, L.; Scaioni, M.; Rosina, E.; Previtali, M. Mapping Infrared Data on Terrestrial Laser Scanning 3D Models of Buildings. Remote Sens. 2011, 3, 1847–1870. [Google Scholar] [CrossRef]


Disclaimer/Publisher’s Note: The statements, opinions and data contained in all publications are solely those of the individual author(s) and contributor(s) and not of MDPI and/or the editor(s). MDPI and/or the editor(s) disclaim responsibility for any injury to people or property resulting from any ideas, methods, instructions or products referred to in the content. |
© 2024 by the authors. Licensee MDPI, Basel, Switzerland. This article is an open access article distributed under the terms and conditions of the Creative Commons Attribution (CC BY) license (https://creativecommons.org/licenses/by/4.0/).