
Design and Analysis of a Novel Prefabricated Foundation for Substation Buildings

Abstract
1. Introduction
2. Experimental Program
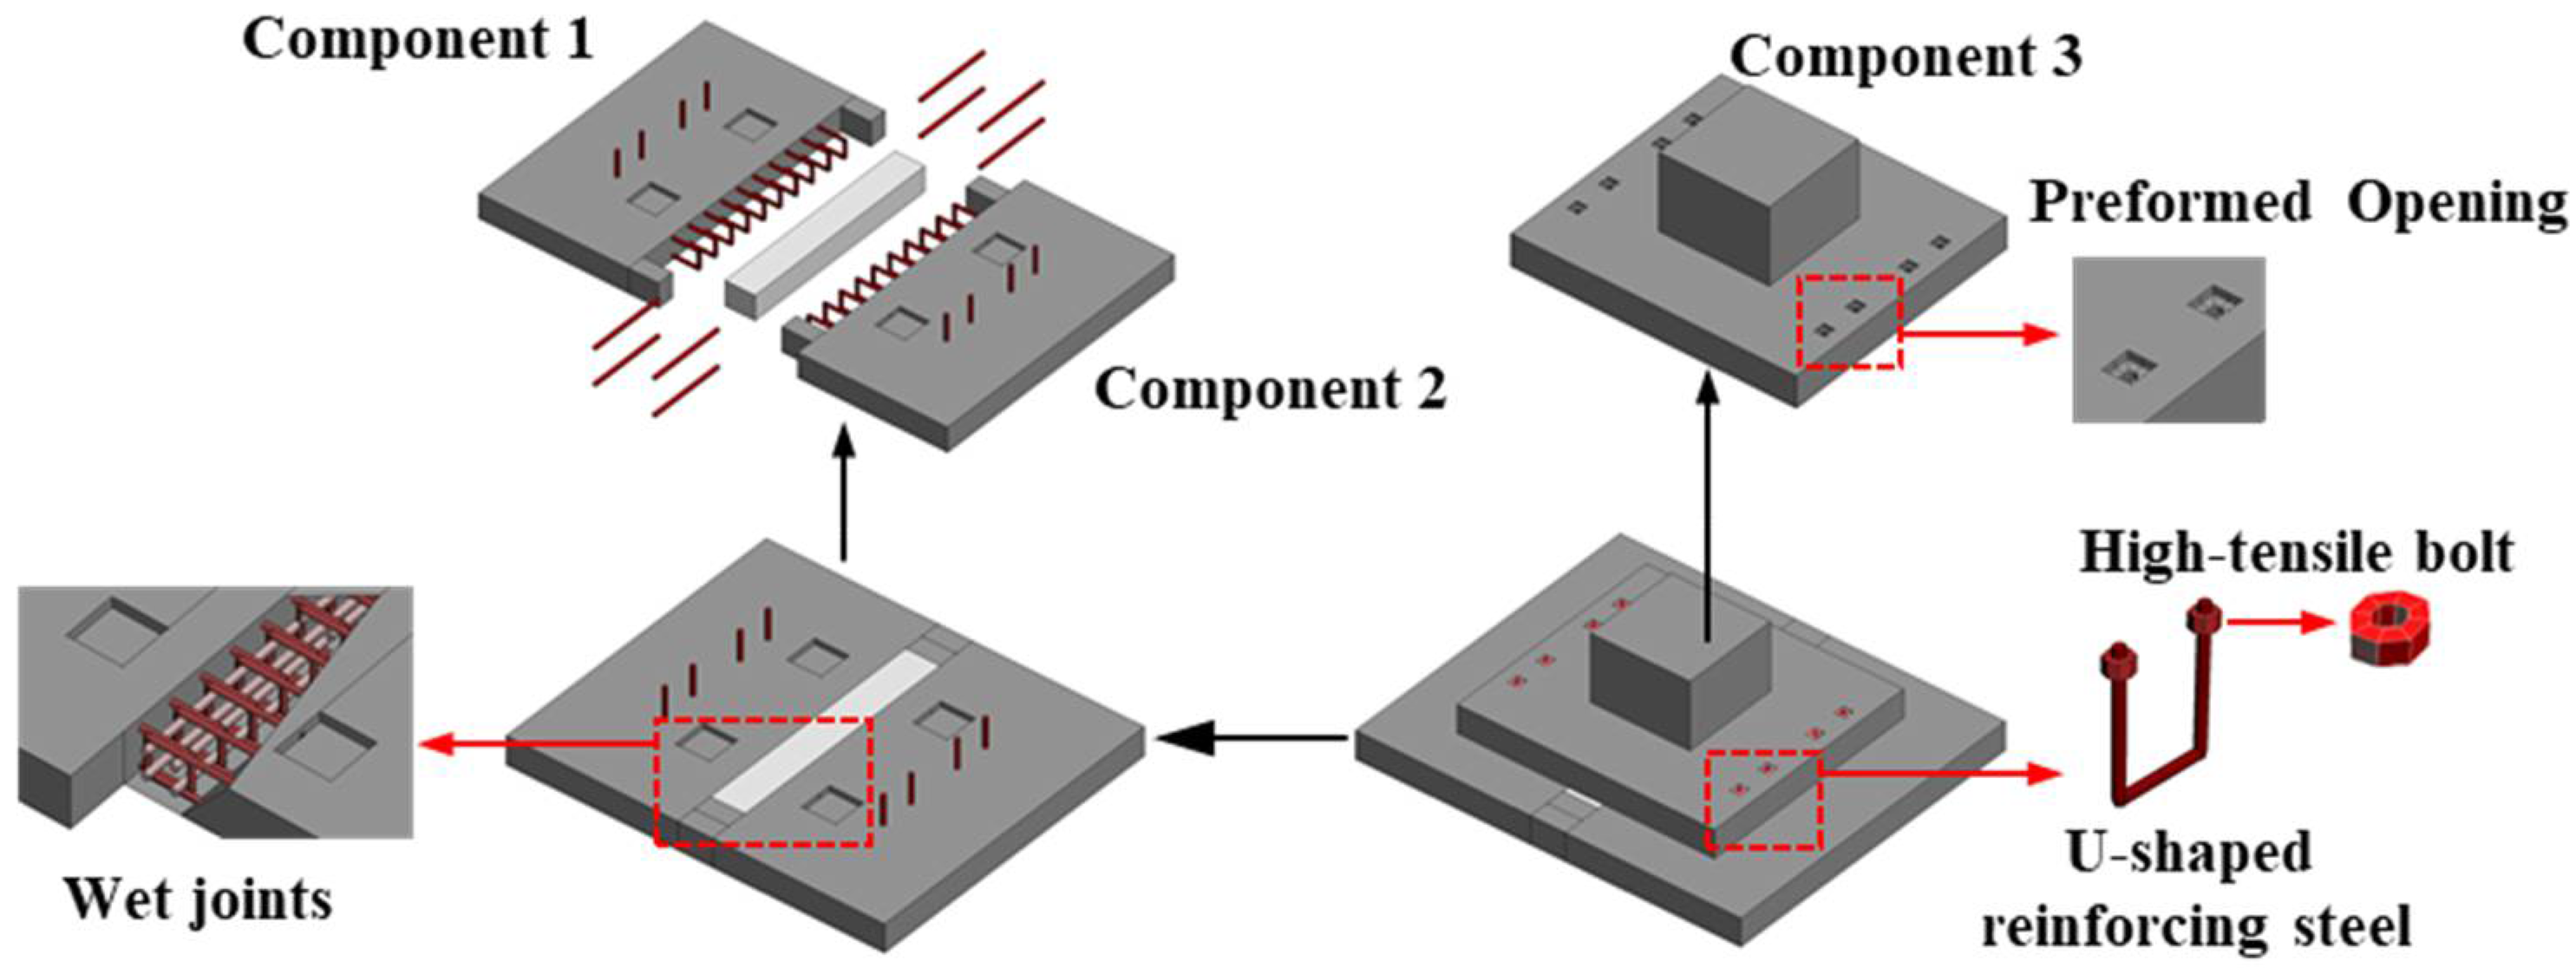
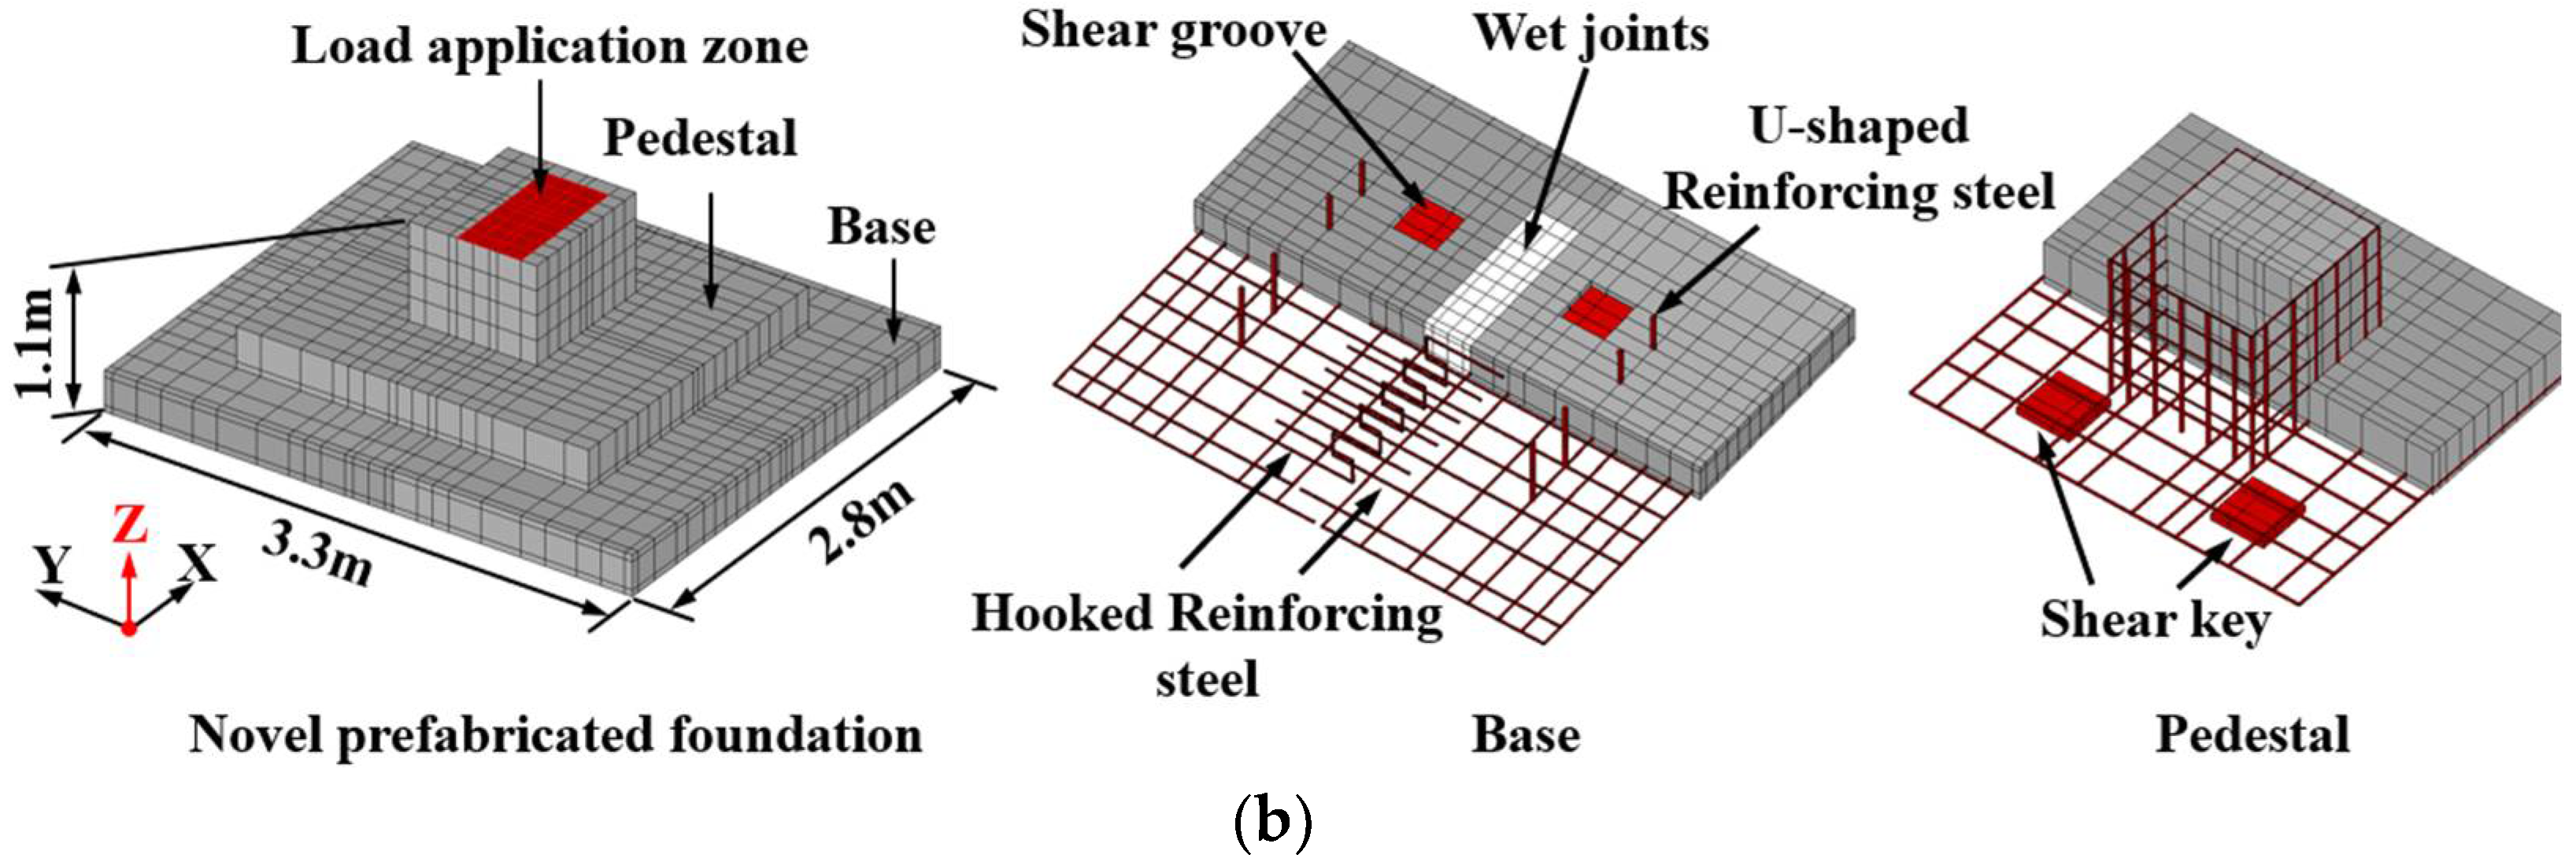
2.1. Specimen Design
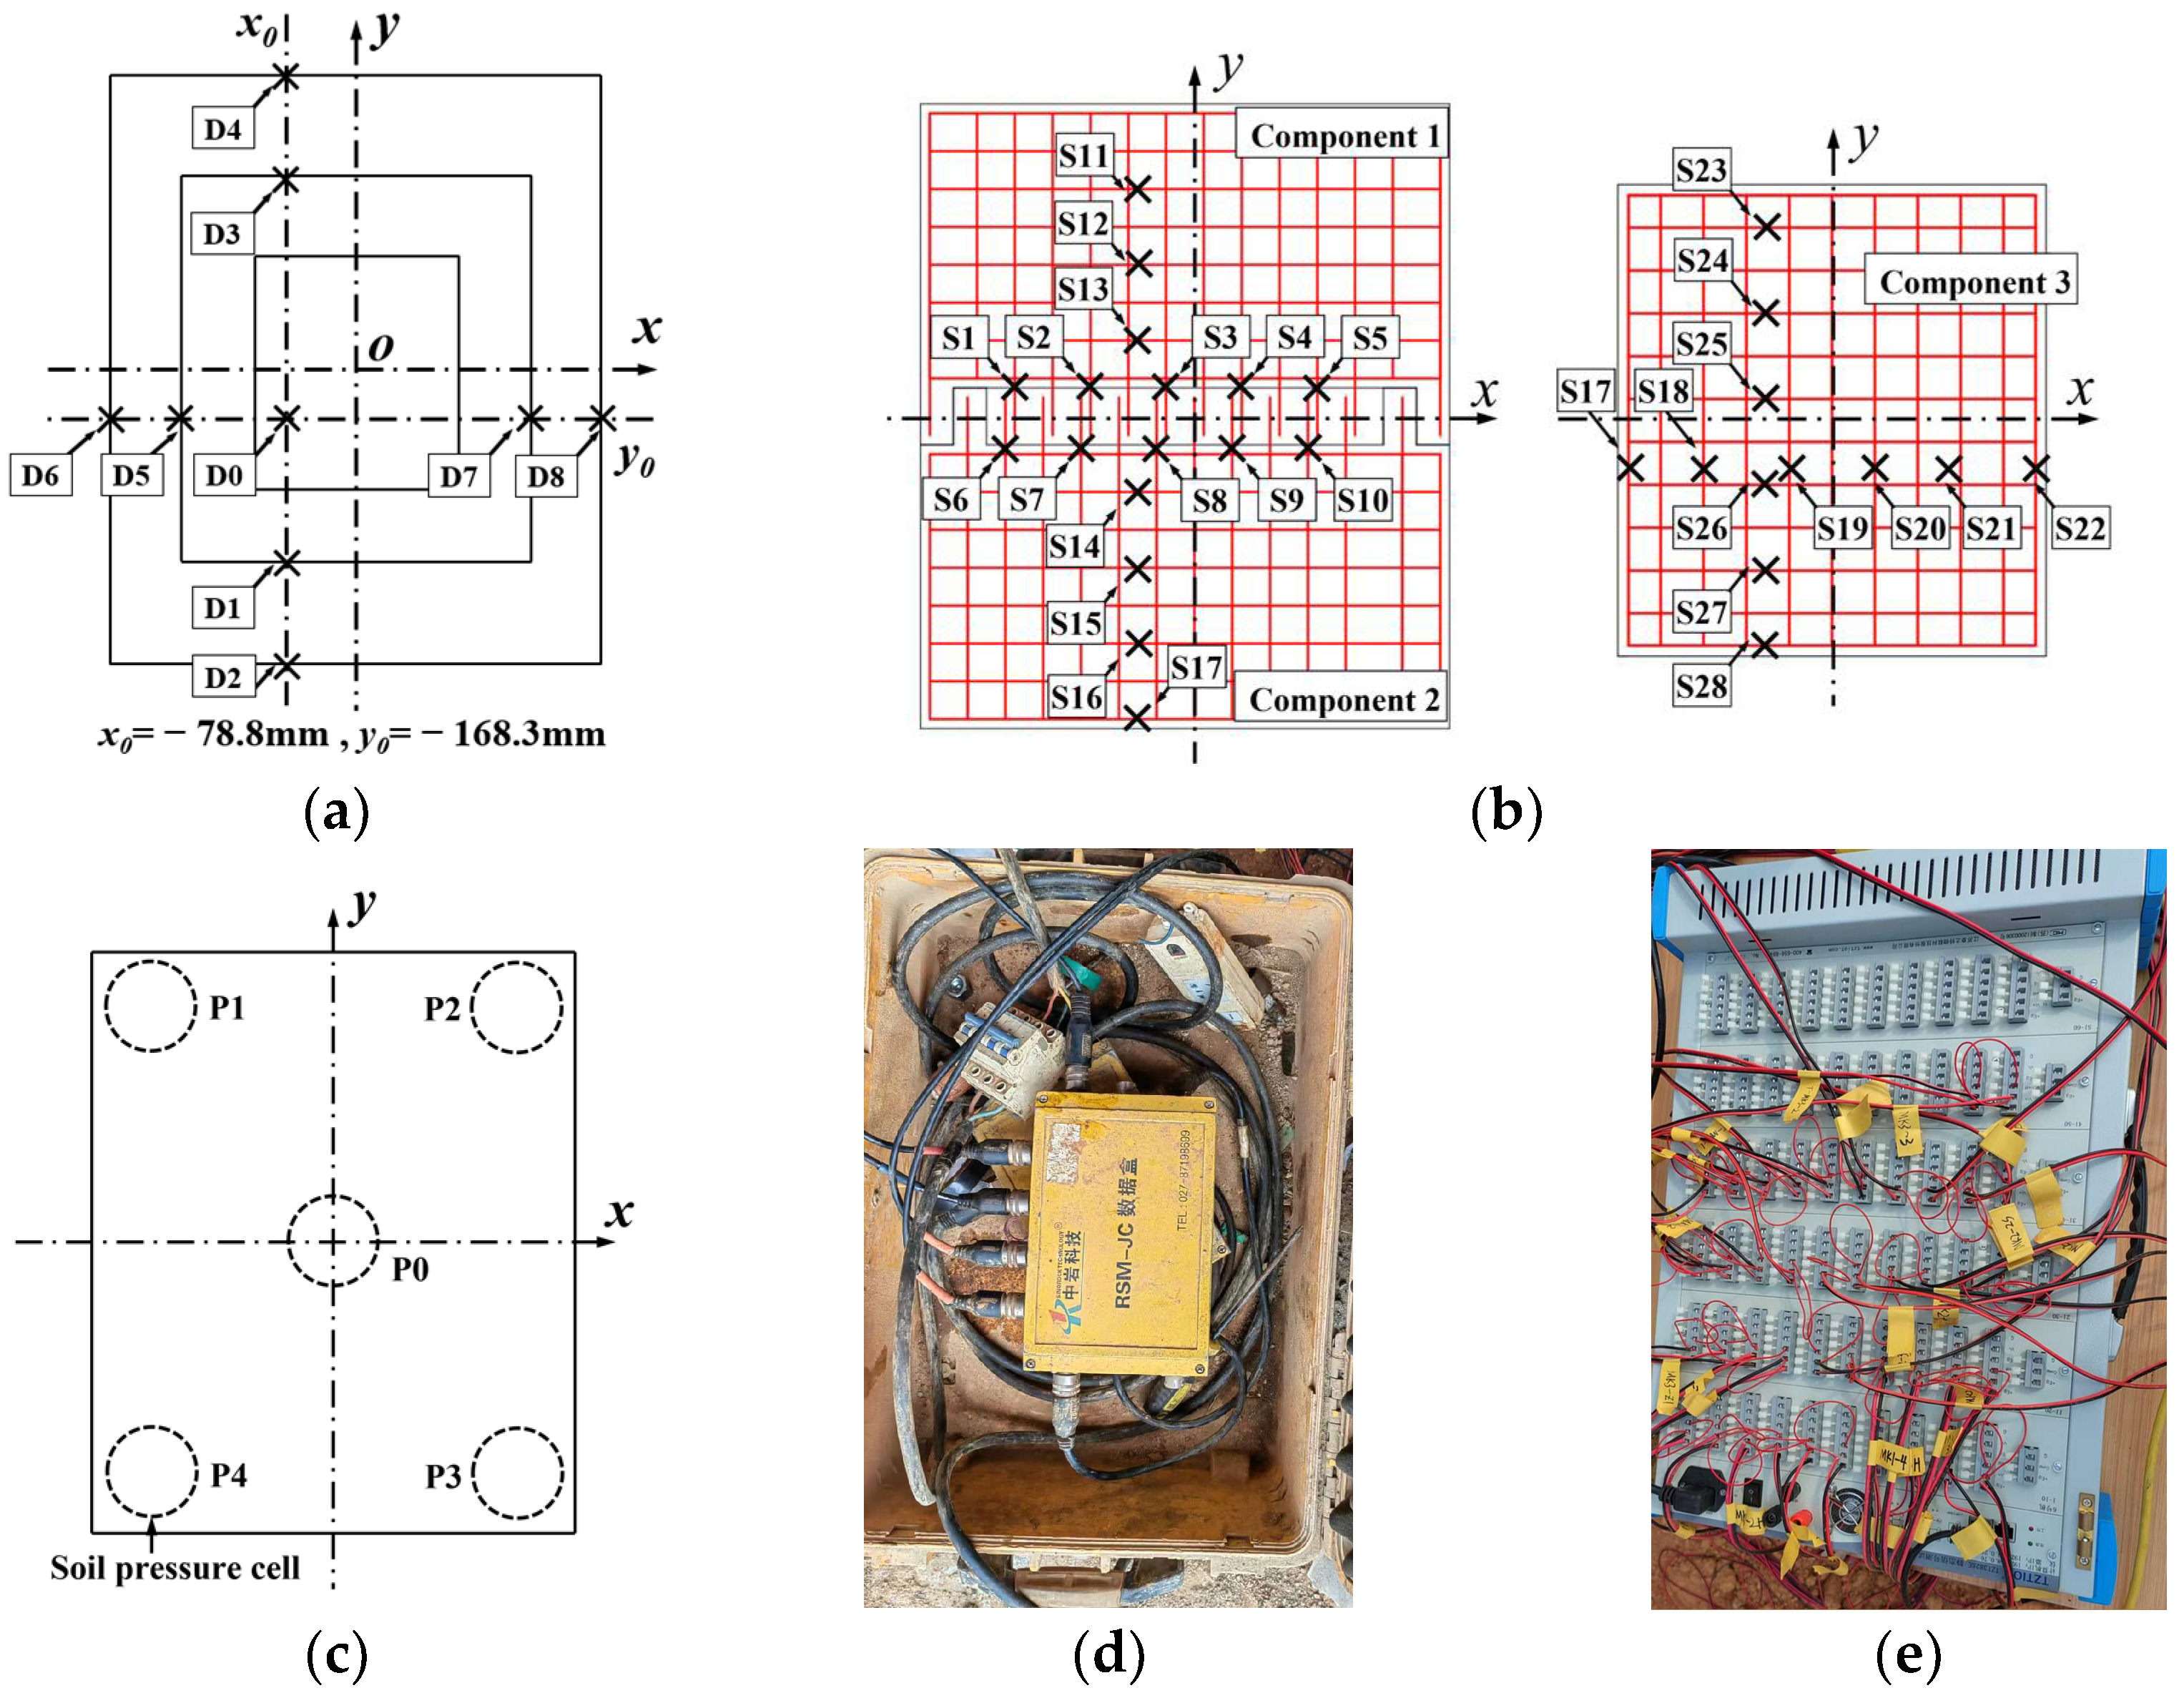
2.2. Test Setup and Instrumentation
3. Experimental Results and Discussion
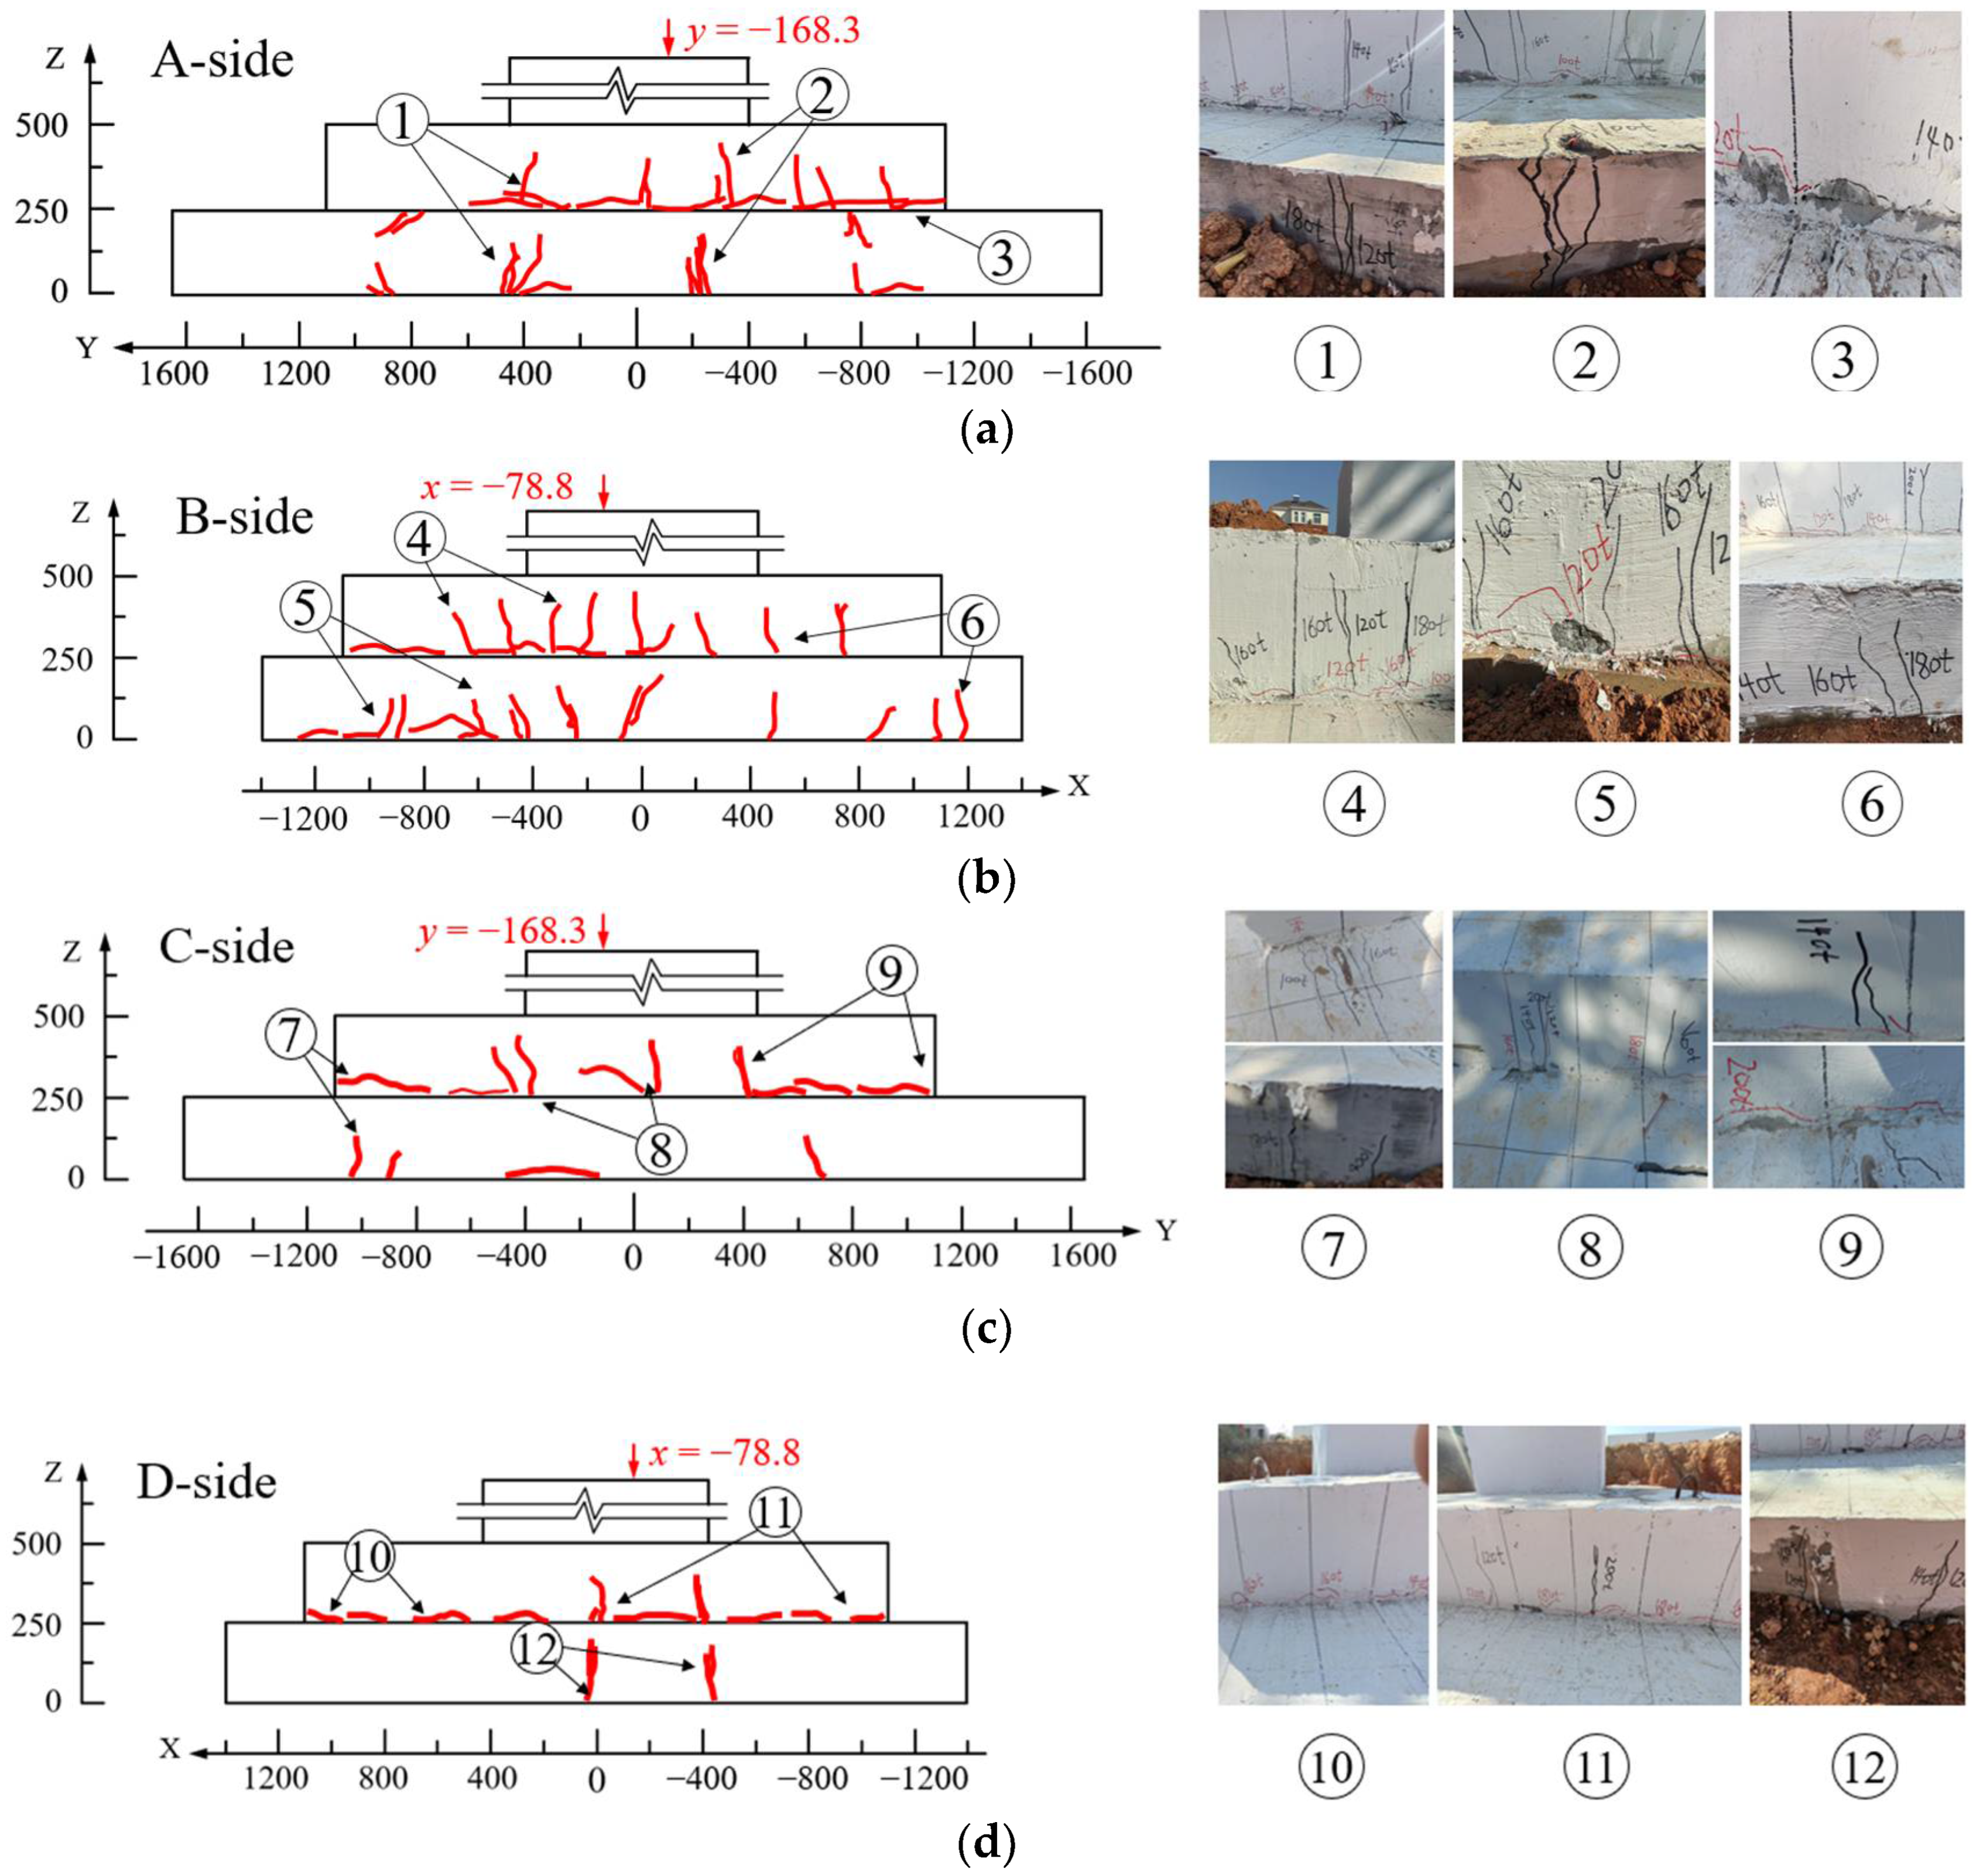
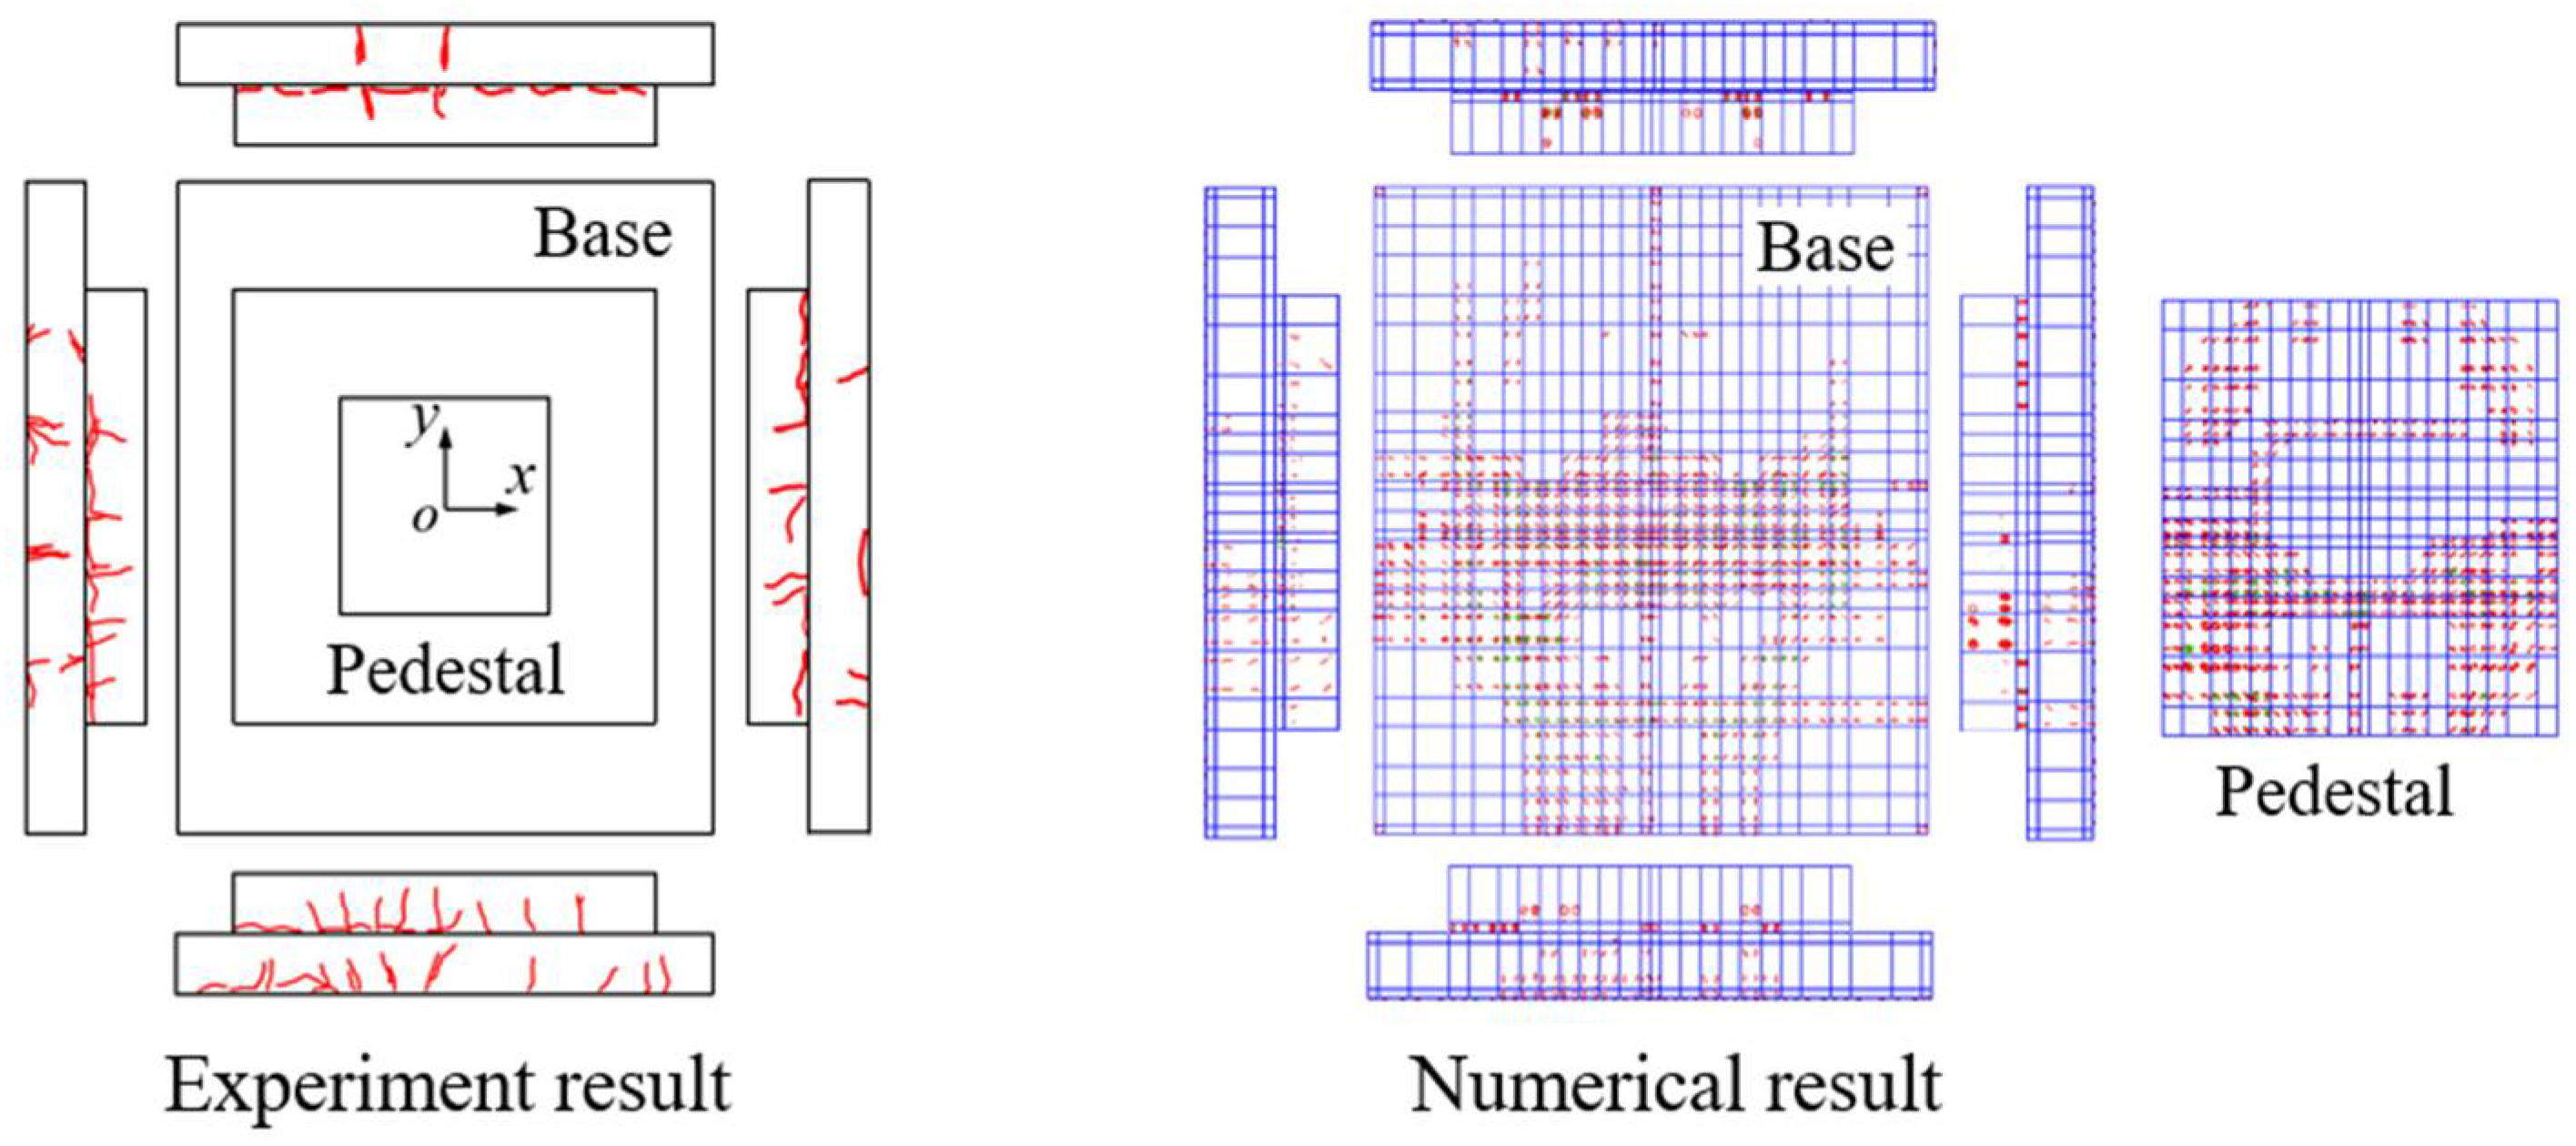
3.1. Damage Modes
3.2. Measured Strains
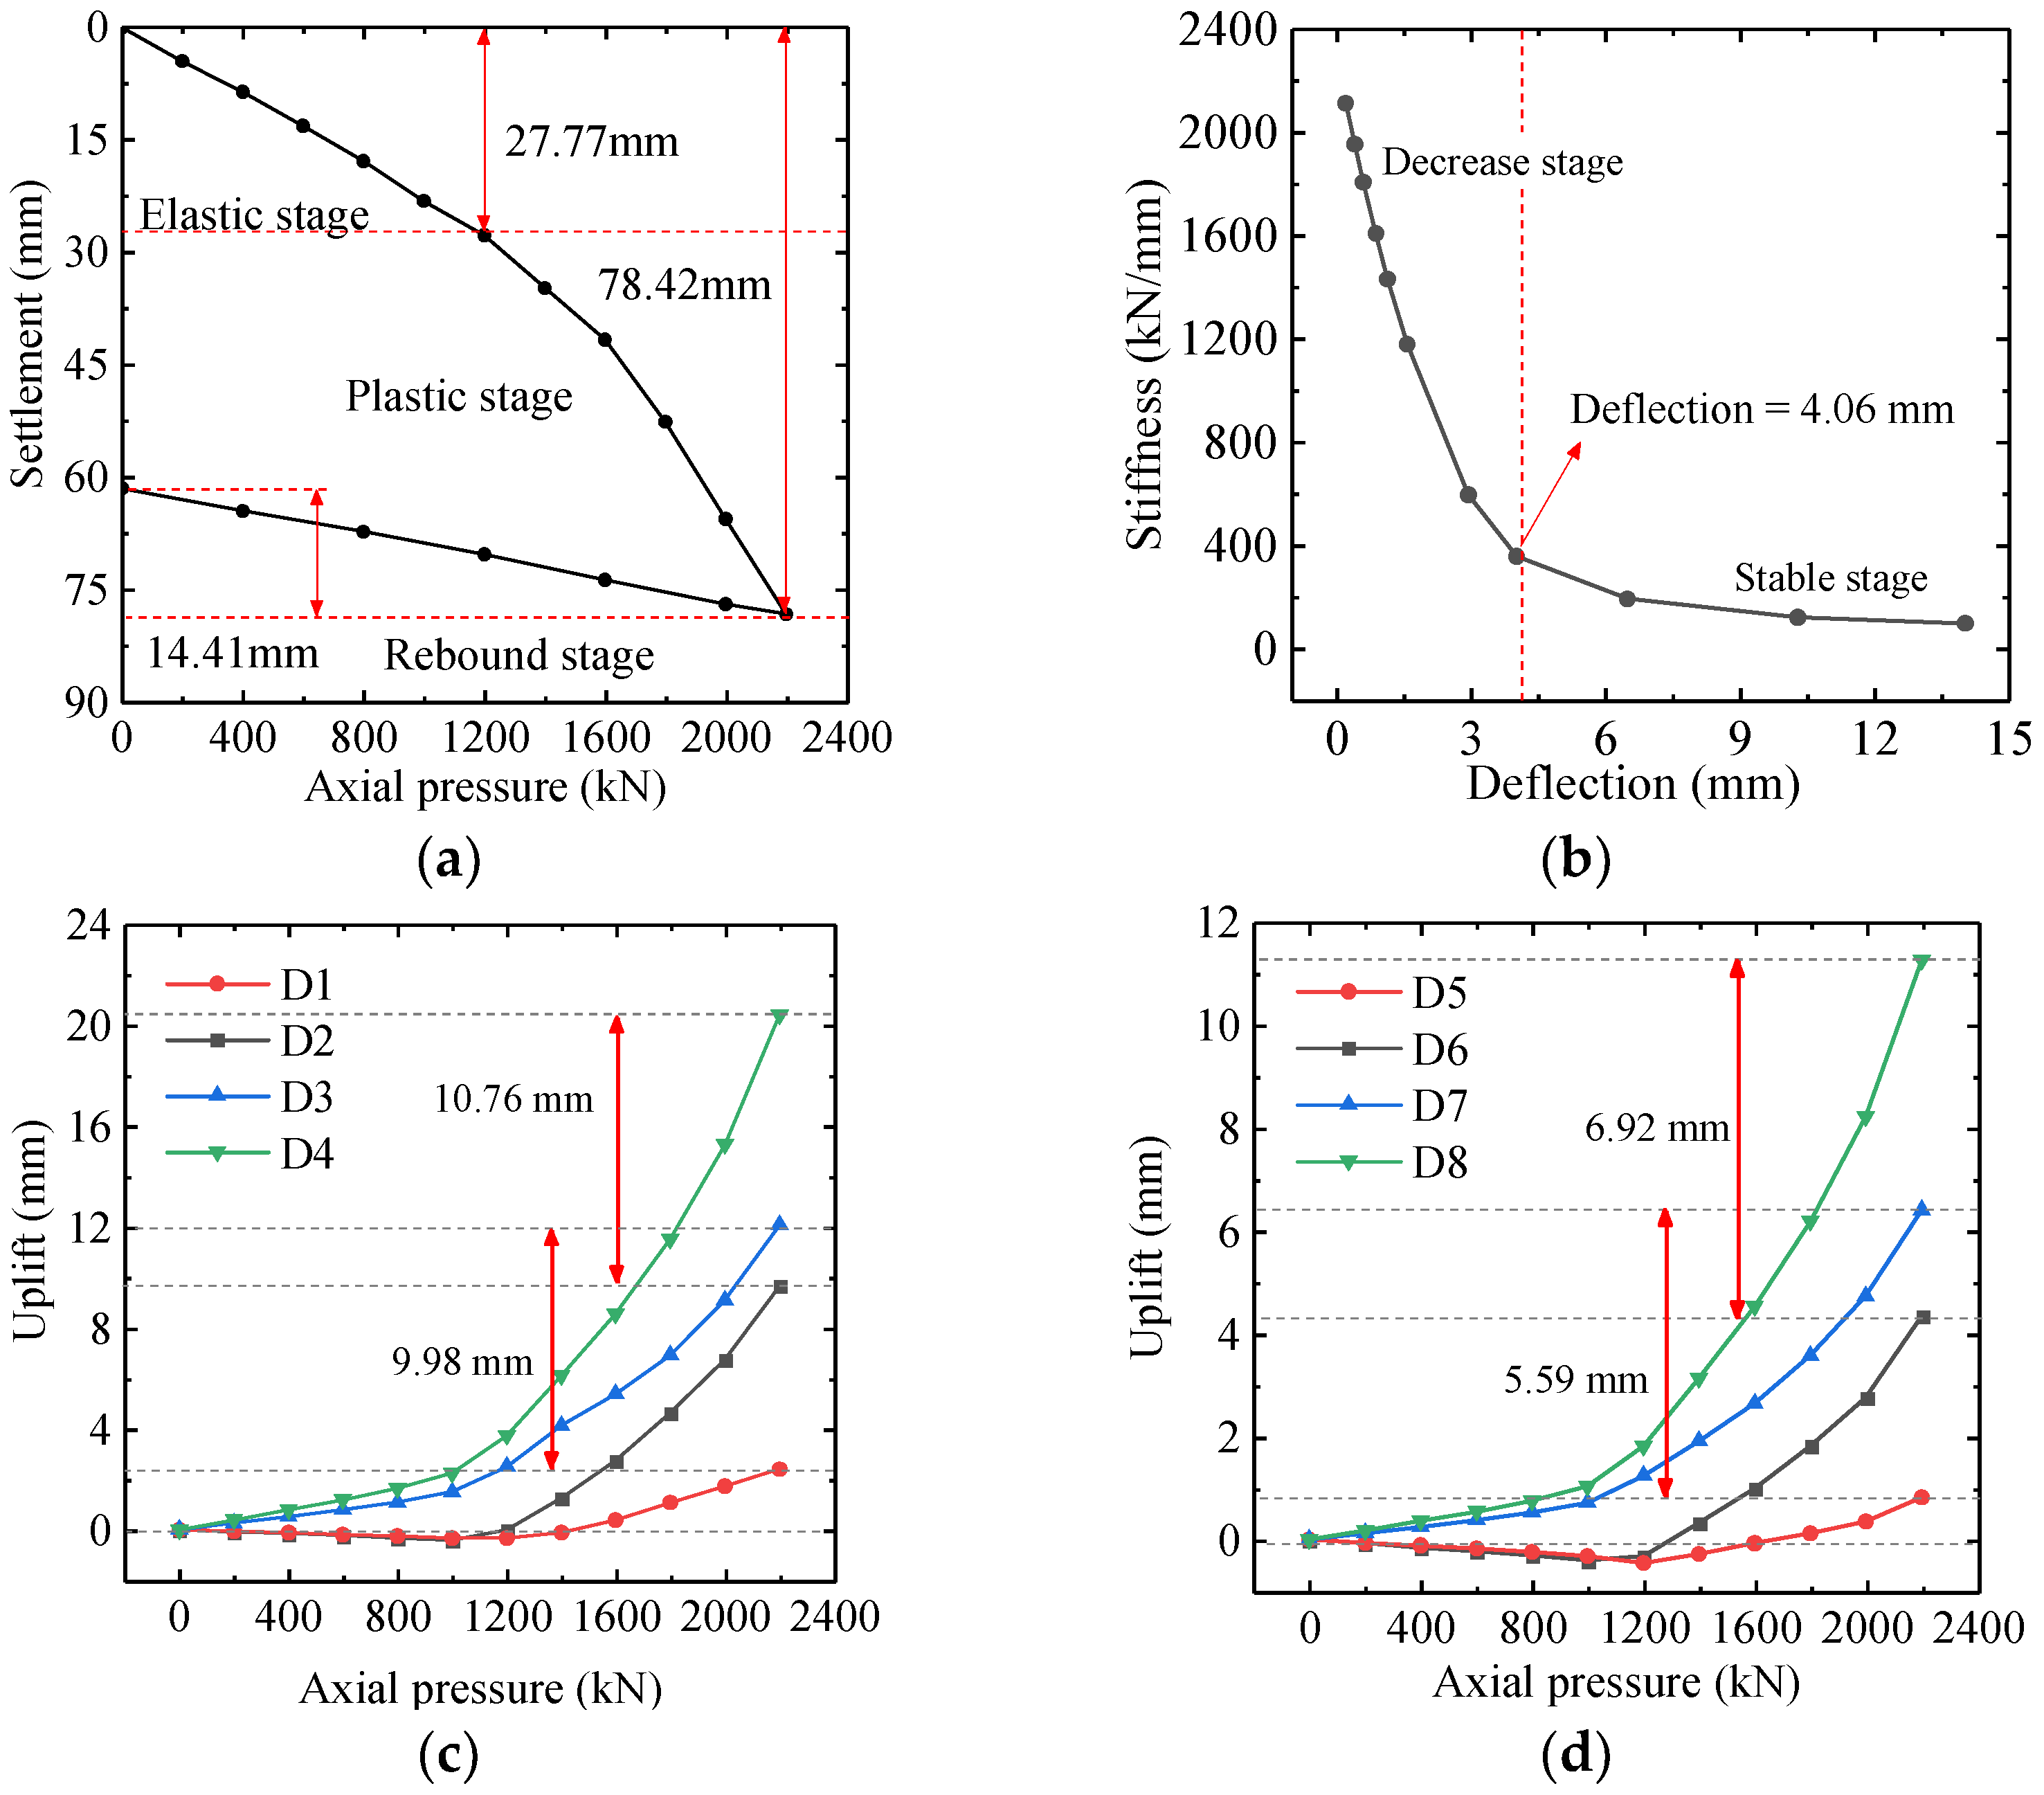
3.3. Measured Displacement
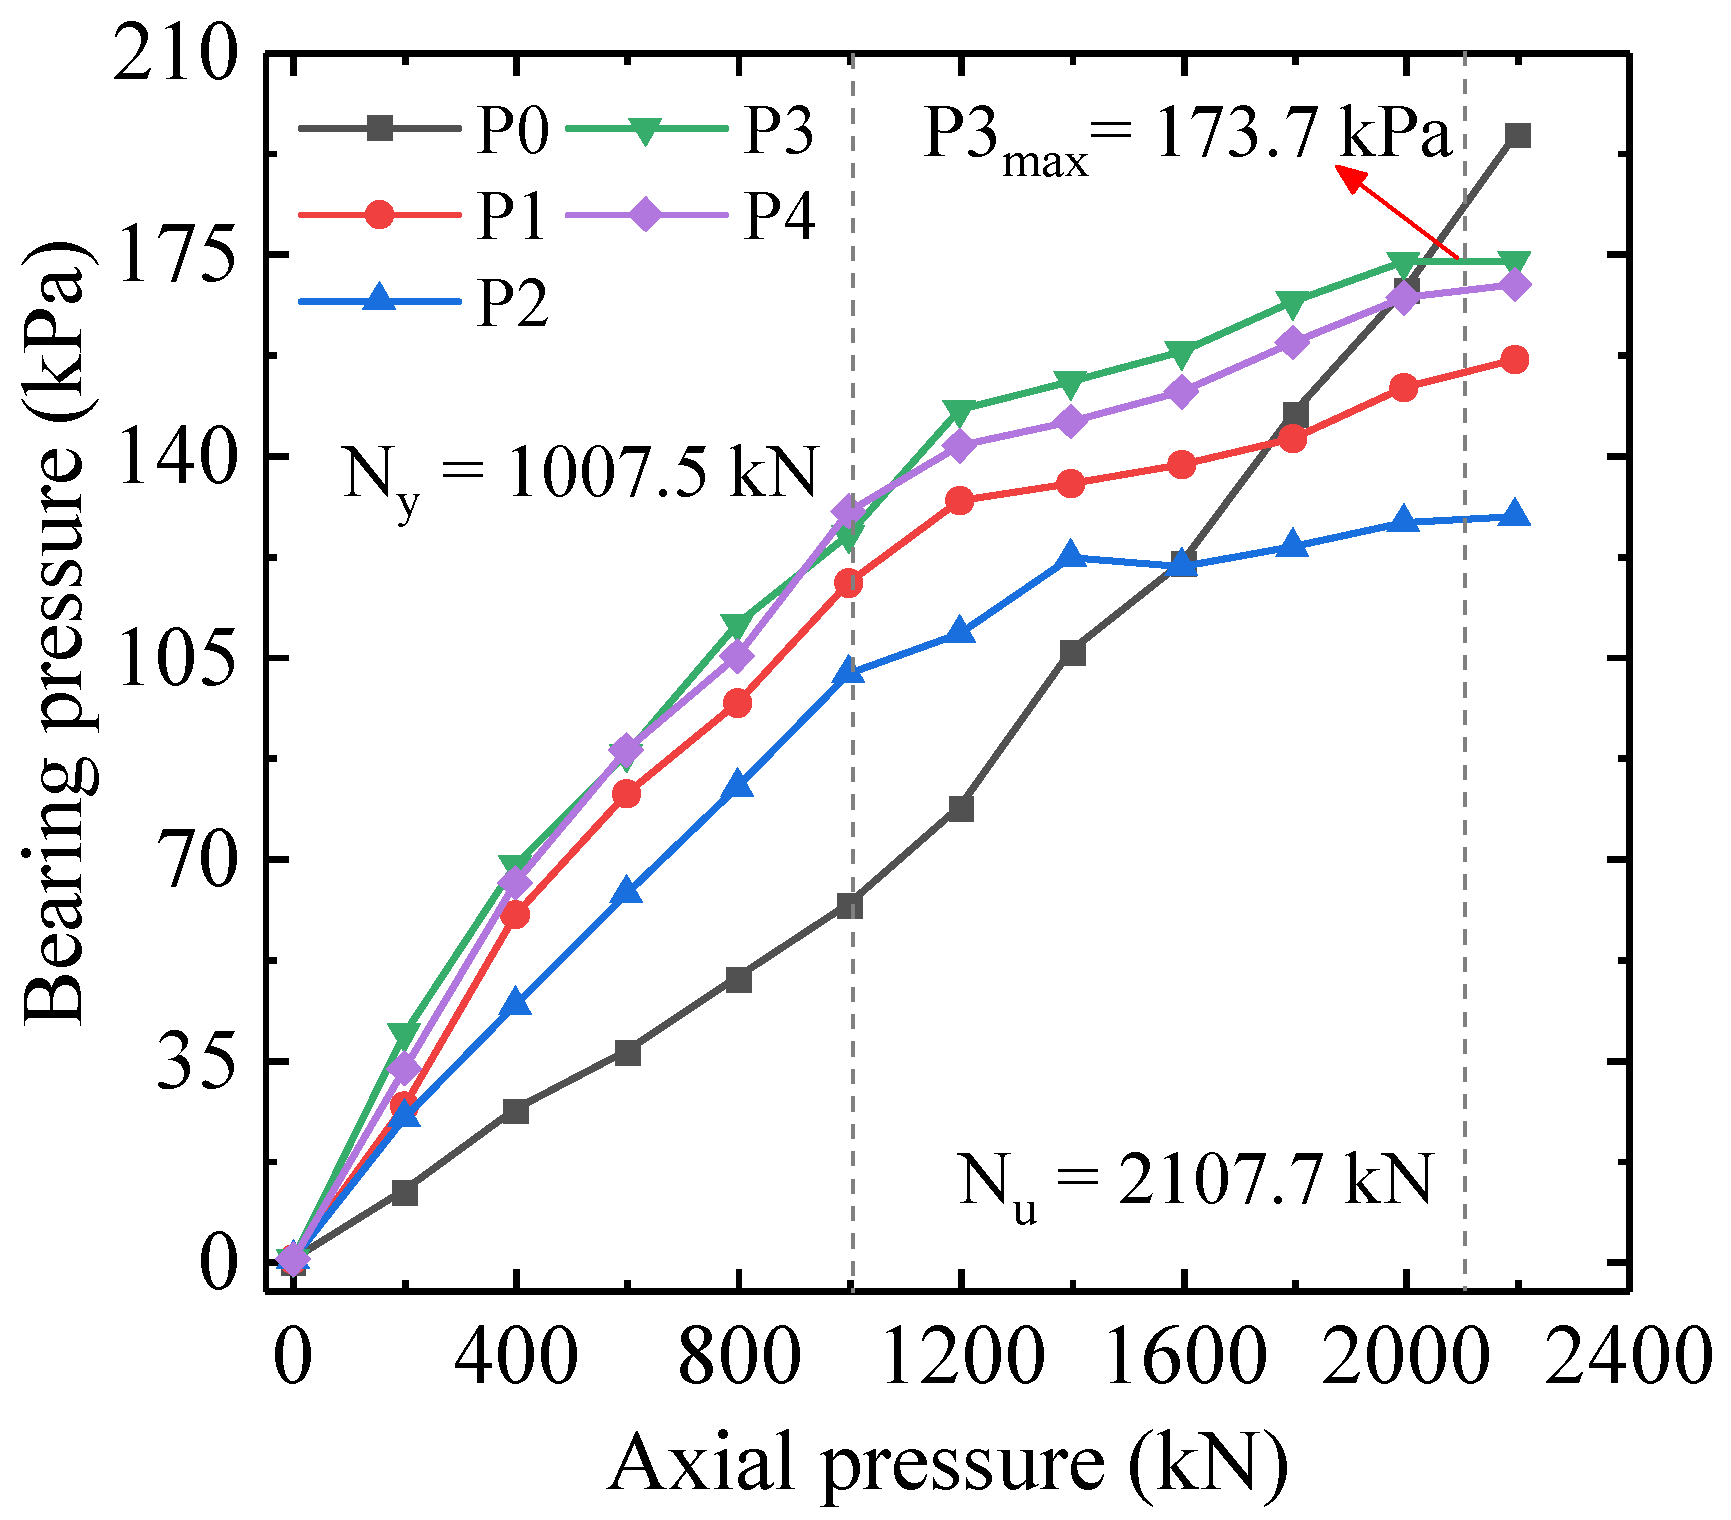
3.4. Base Pressure
4. Numerical Analysis
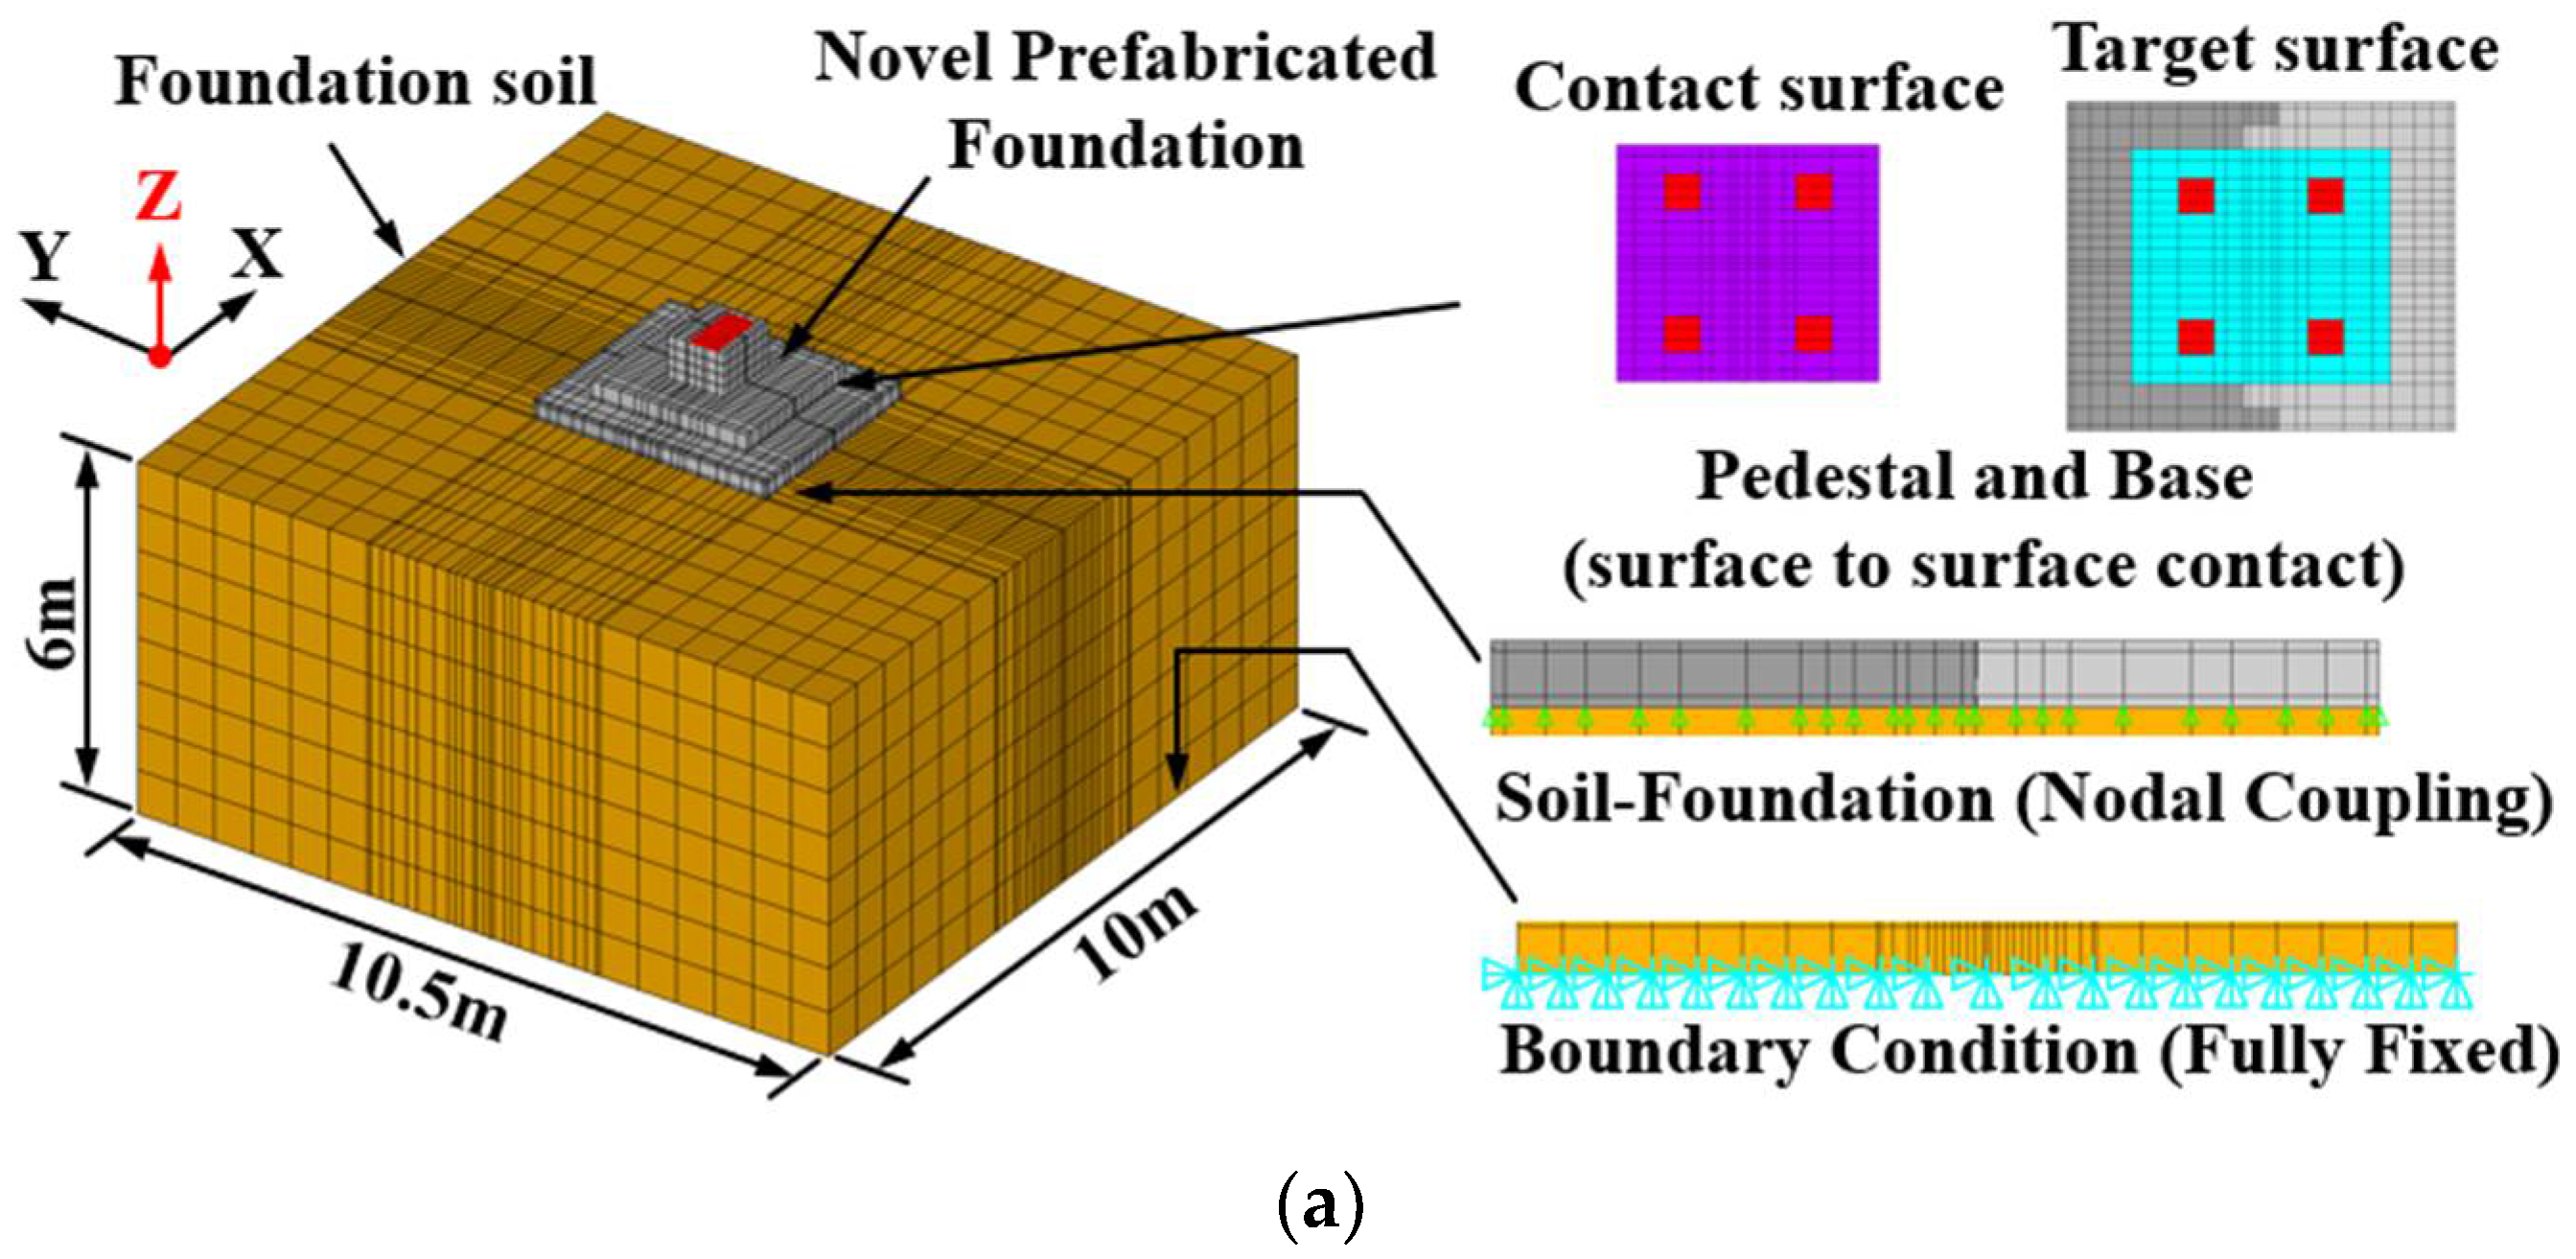
4.1. Description of 3D FE Models
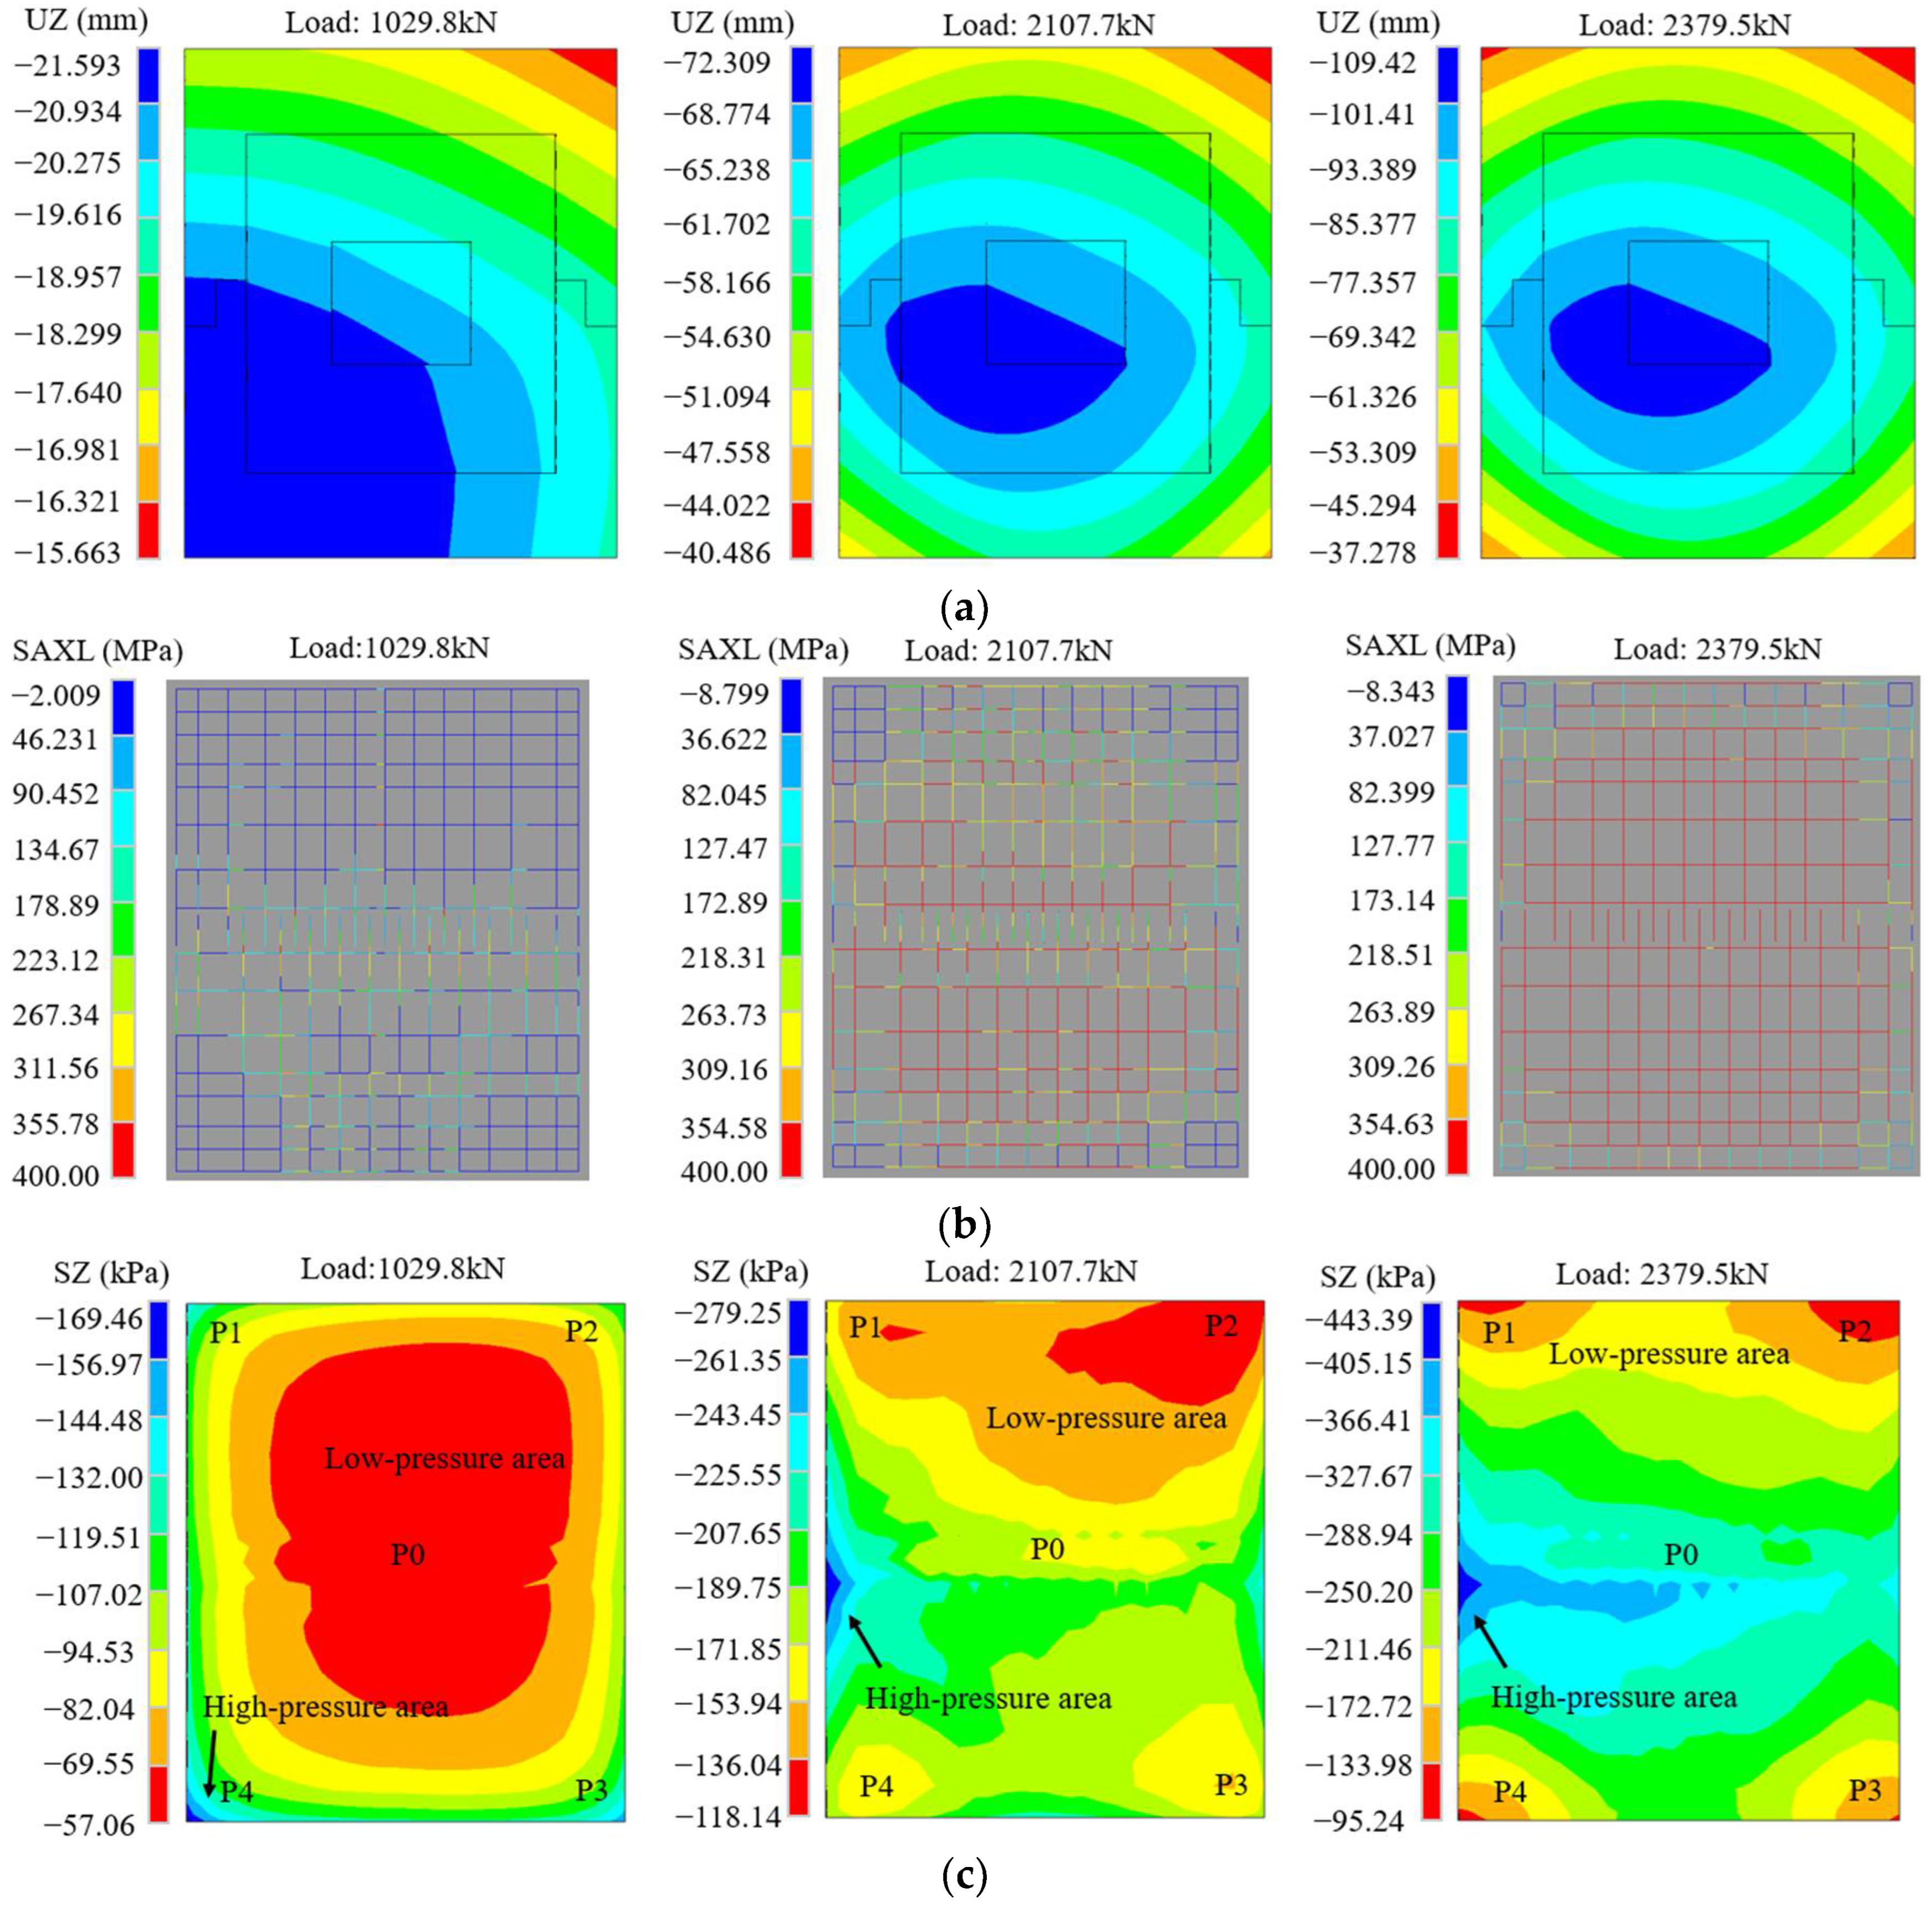
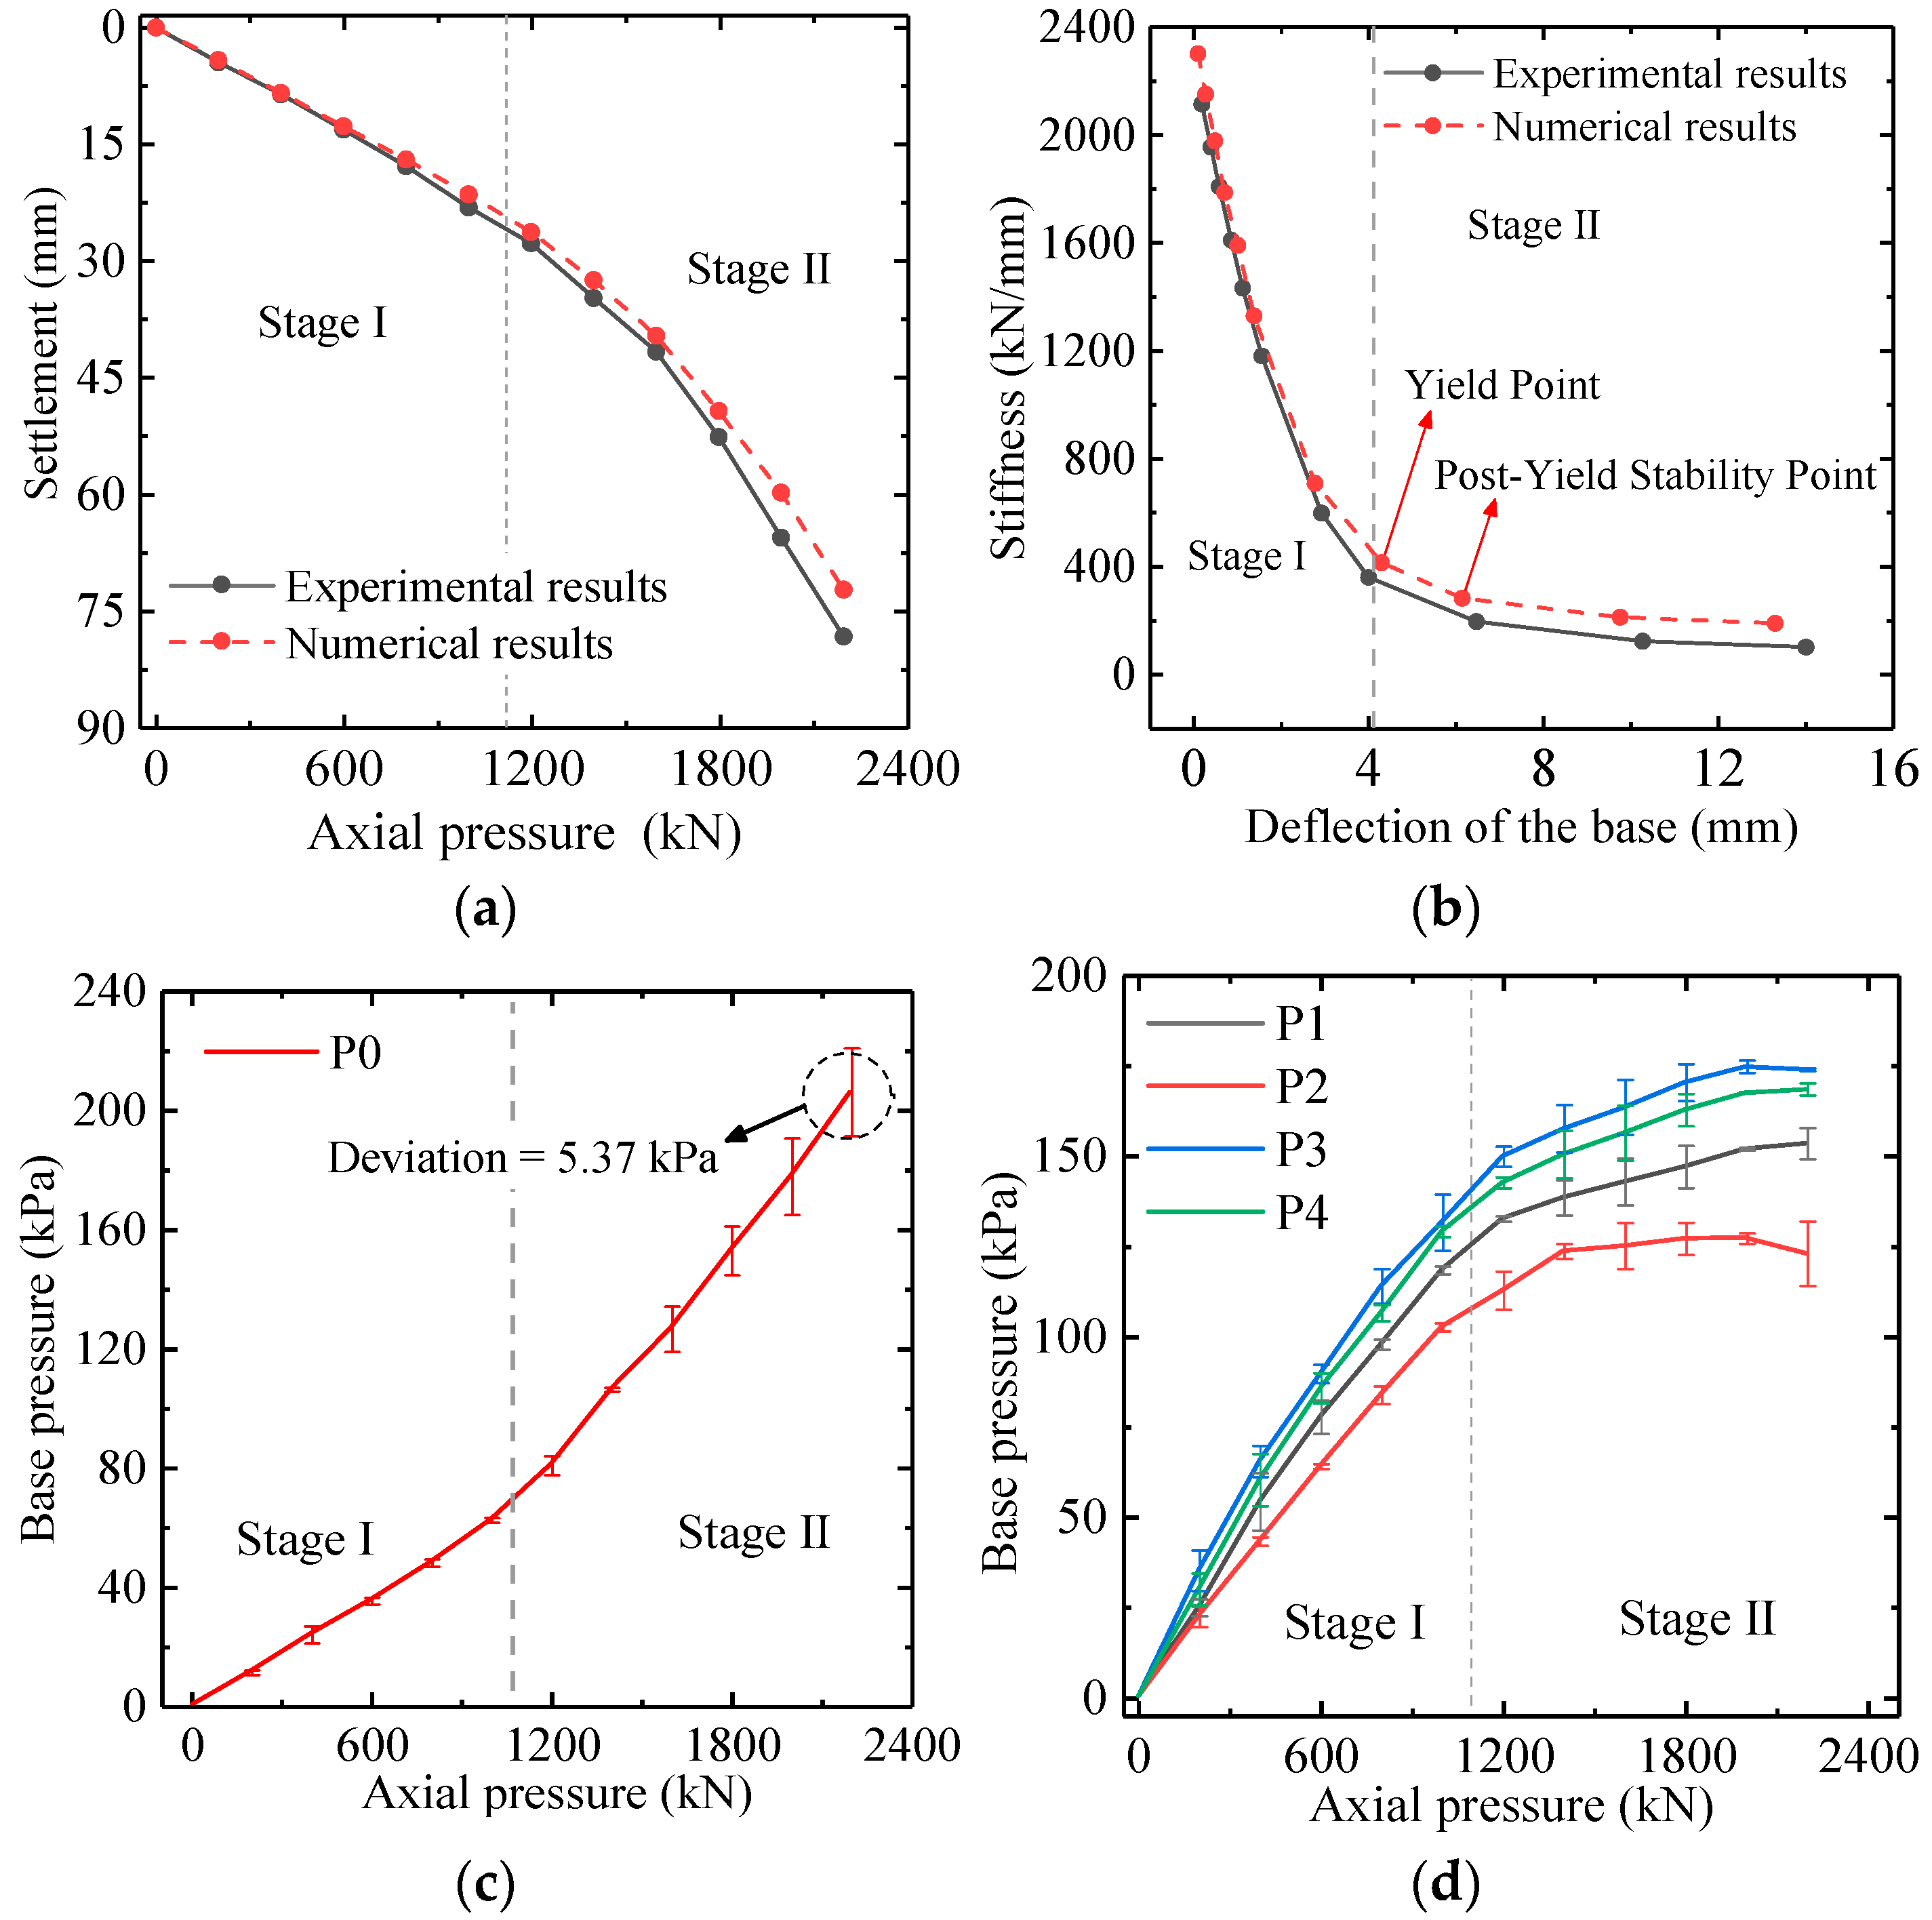
4.2. Numerical and Experimental Comparisons
5. Parametric Study
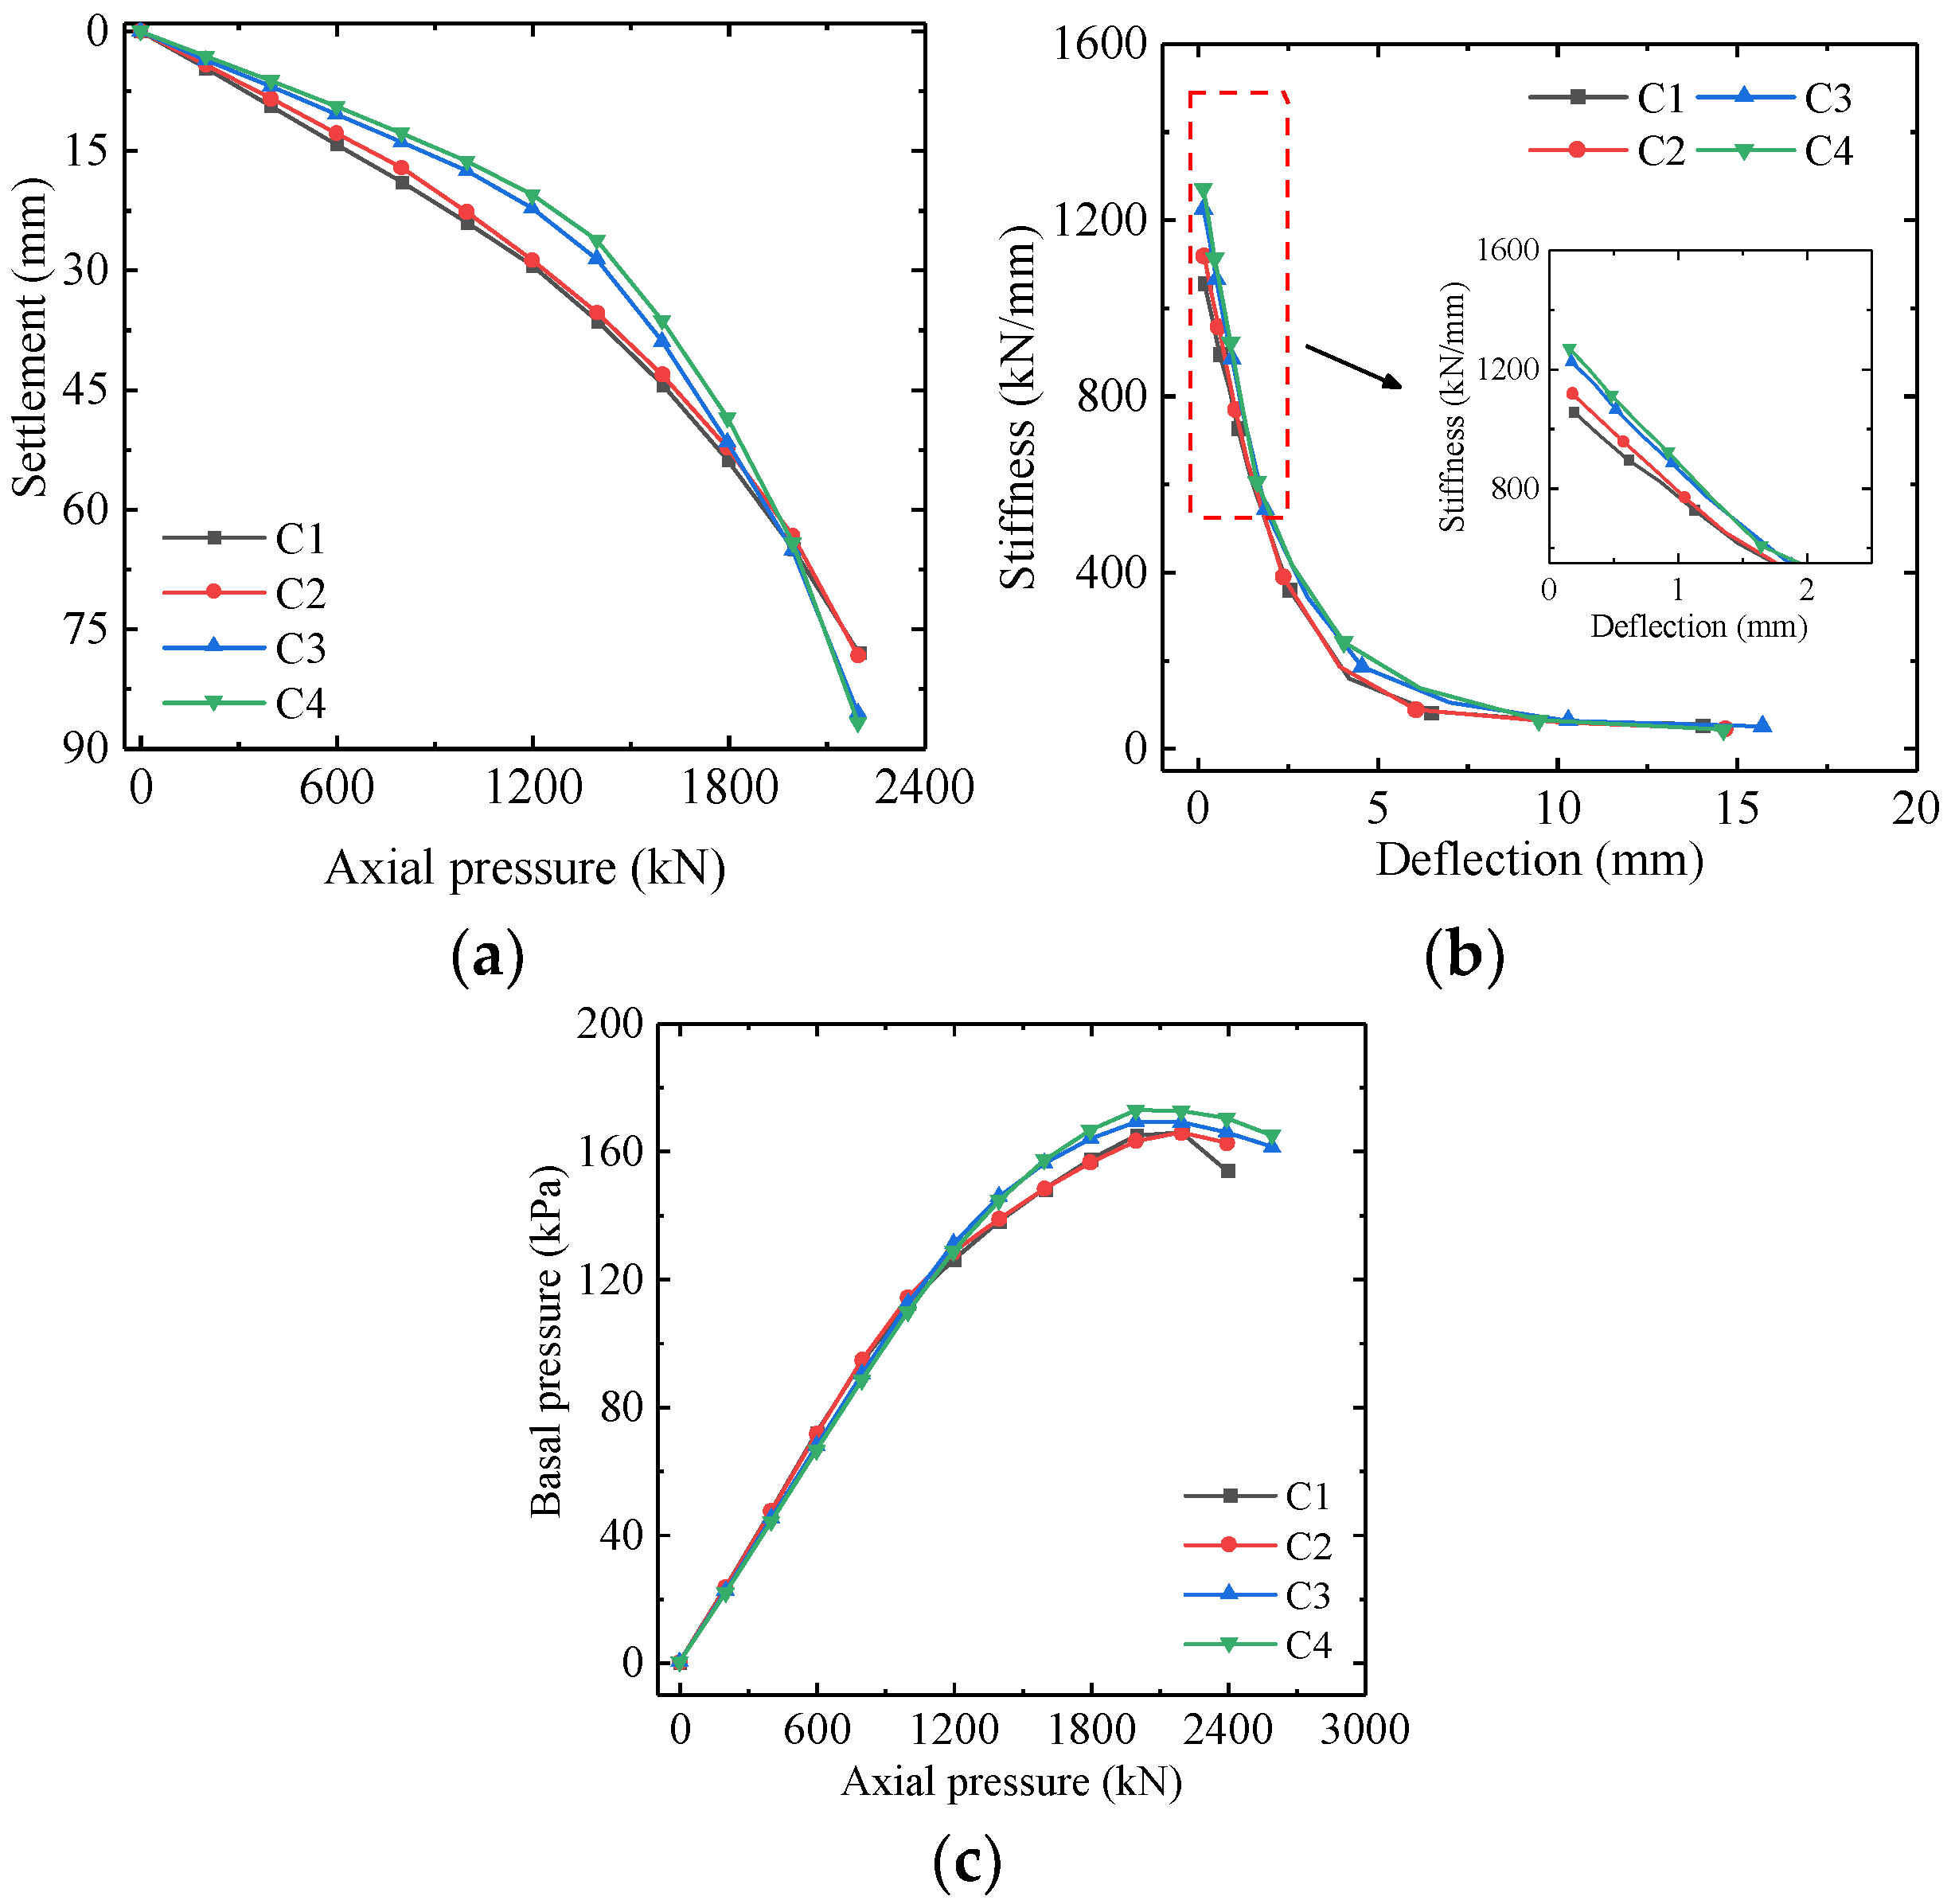
5.1. Influence of the Pedestal-to-Base Thickness Ratio
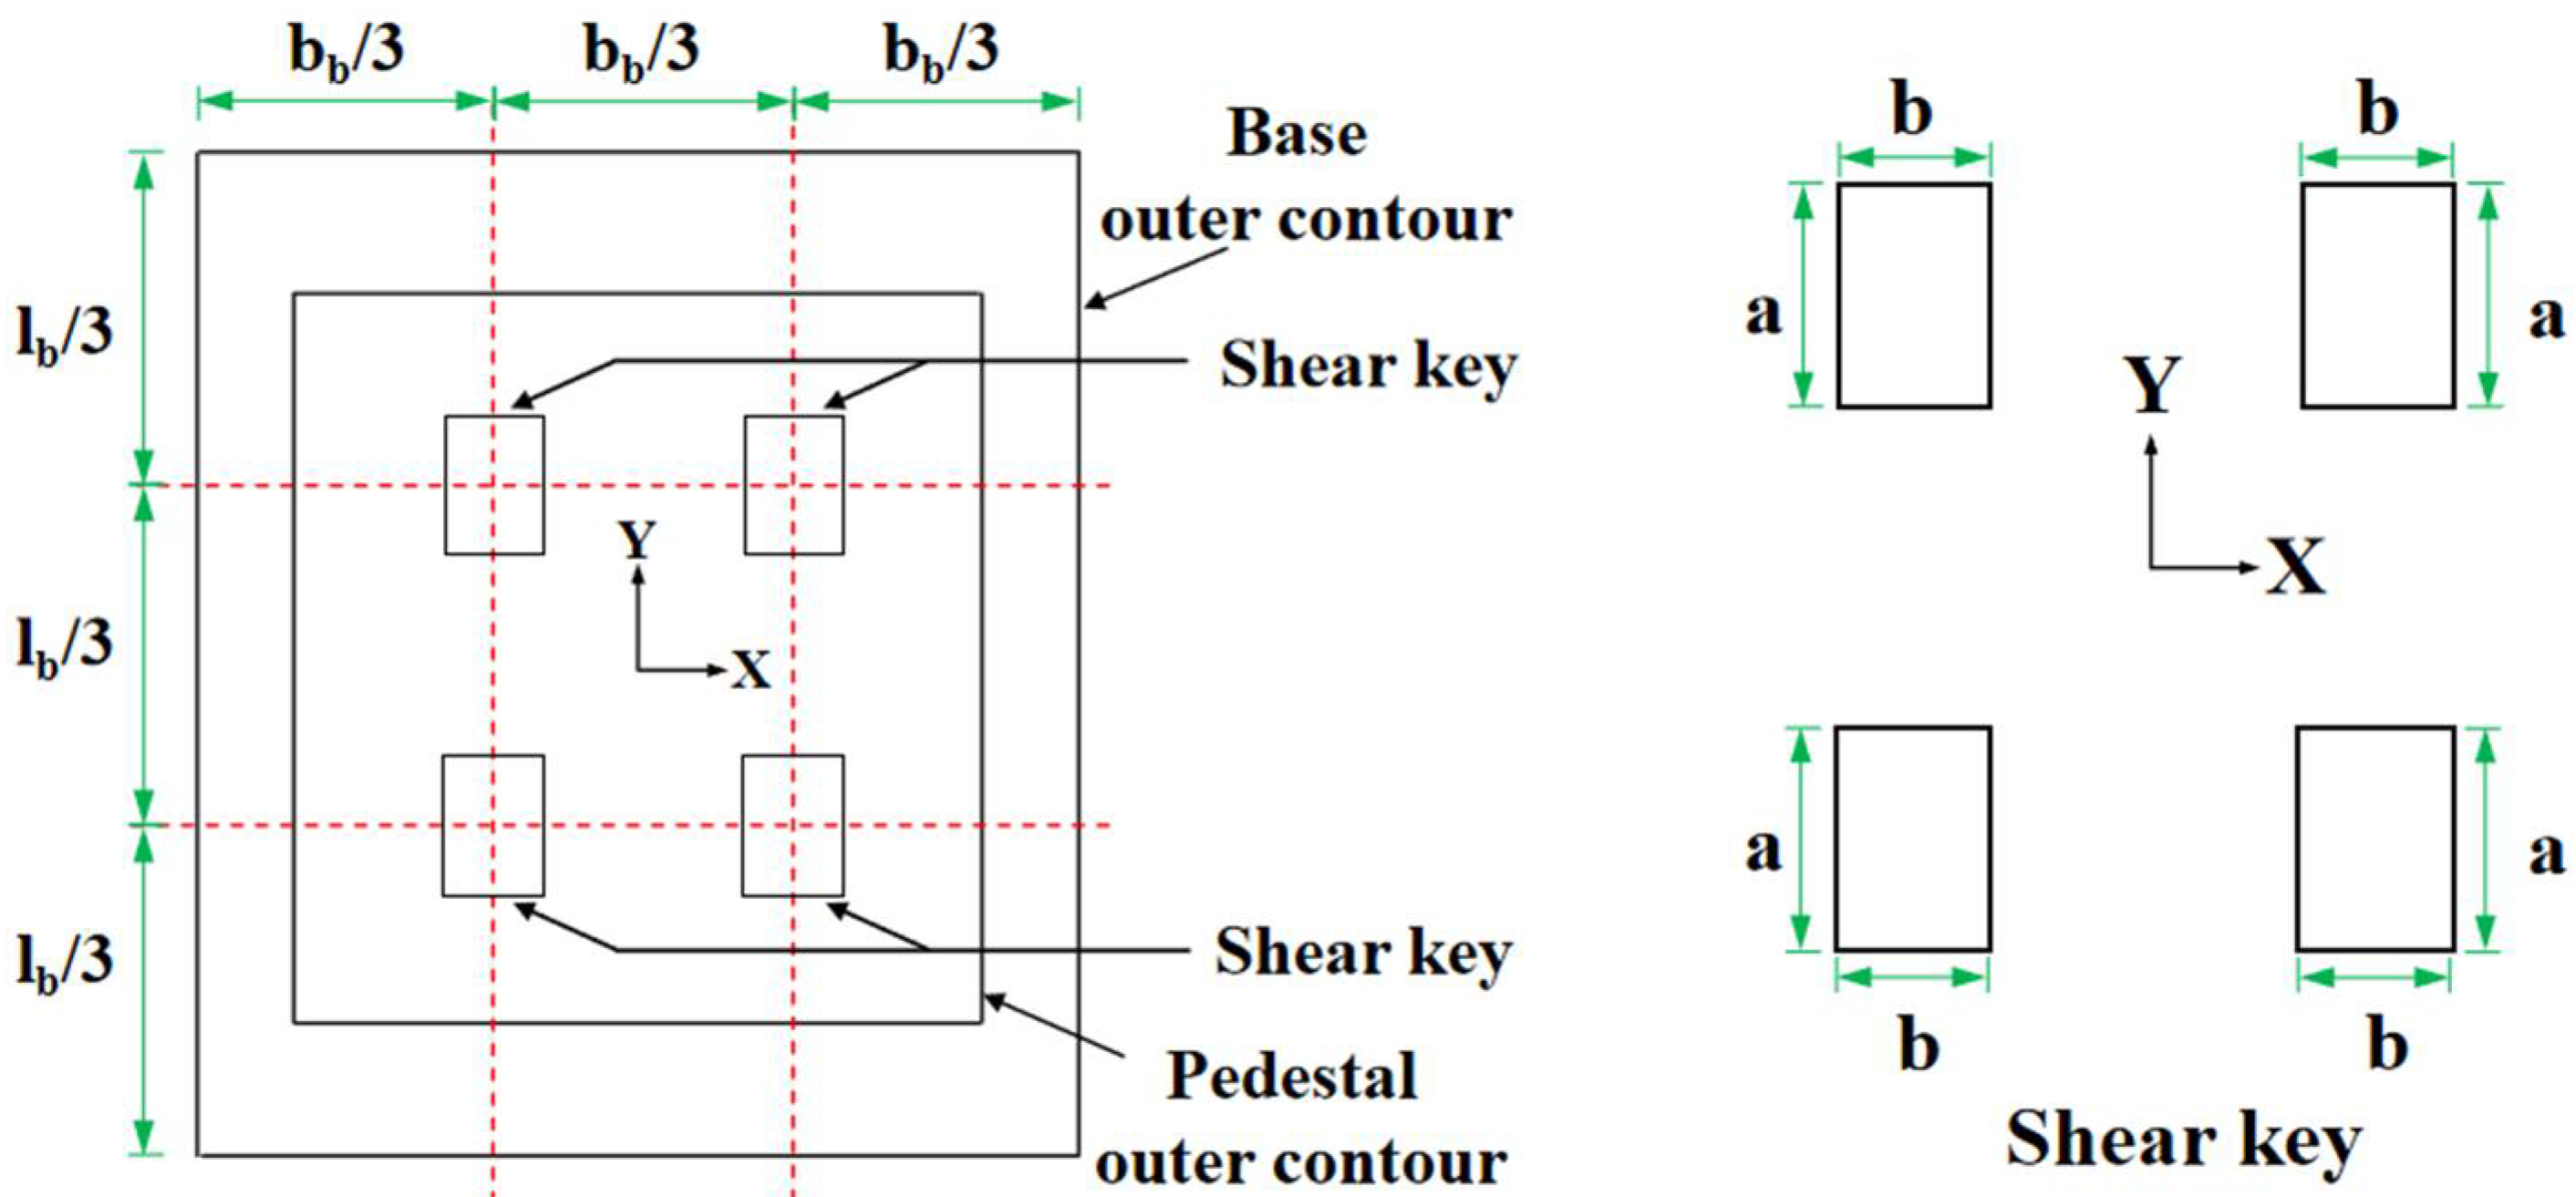
5.2. Influence of Shear Keys
5.3. Influence of the Strength of Wet Joints
6. Conclusions
- Through static load tests, this article verified the bearing capacity and settlement characteristics of the new foundation. Tests show that when the load gradually increased, the settlement of the foundation had a linear relationship with the load value. When the maximum load was reached, the foundation did not collapse, proving the feasibility of the new design.
- During the loading process, cracks appeared in the foundation, but no through-cracks were observed, indicating that the design provides a certain level of deformation resistance and that the bending resistance of the novel foundation is relatively strong.
- The finite element model established using ANSYS 17 is consistent with the experimental results and can effectively predict the strength and stiffness changes of the foundation, especially in the wet joint area.
- Parametric analysis was conducted on the foundation thickness ratio, cross-sectional dimensions of shear keys, and wet joint strength. The results show that a reasonable thickness ratio (1.0 to 1.1) can improve the bearing capacity; increasing the size of the shear key can help enhance the initial stiffness of the foundation, but the size needs to be controlled to avoid causing cracks, and the use of ultra-high-performance concrete (UHPC) as a wet joint filling material can significantly improve the settlement resistance and initial stiffness of the foundation.
Author Contributions
Funding
Data Availability Statement
Conflicts of Interest
References
- Huang, H.; Poor, H.V.; Davis, K.R.; Overbye, T.J.; Layton, A.; Goulart, A.E.; Zonouz, S. Toward Resilient Modern Power Systems: From Single-Domain to Cross-Domain Resilience Enhancement. Proc. IEEE 2024, 112, 365–398. [Google Scholar] [CrossRef]
- Chen, X.; Lou, S.H.; Liang, Y.J.; Wu, Y.W.; He, X.L. Optimal Scheduling of a Regional Power System Aiming at Accommodating Clean Energy. Sustainability 2021, 13, 2169. [Google Scholar] [CrossRef]
- Borthwick, A.G.L. Marine Renewable Energy Seascape. Engineering 2016, 2, 69–78. [Google Scholar] [CrossRef]
- Cranmer, A.; Baker, E.; Liesiö, J.; Salo, A. A Portfolio Model for Siting Offshore Wind Farms with Economic and Environmental Objectives. Eur. J. Oper. Res. 2018, 267, 304–314. [Google Scholar] [CrossRef]
- Kim, C.; Jang, S.; Kim, T.Y. Site Selection for Offshore Wind Farms in the Southwest Coast of South Korea. Renew. Energy 2018, 120, 151–162. [Google Scholar] [CrossRef]
- Li, G.S.; Tan, L.H.; Yang, B.; Che, T.; Feng, G.C.; Ljungqvist, F.C.; Luo, Y.; Du, H.; Zhao, H.; Zhang, Y.; et al. Site Selection of Desert Solar Farms Based on Heterogeneous Sand Flux. npj Clim. Atmos. Sci. 2024, 7, 61. [Google Scholar] [CrossRef]
- Bandira, P.N.A.; Tan, M.L.; Teh, S.Y.; Samat, N.; Shaharudin, S.M.; Mahamud, M.A.; Tangang, F.; Liew, J.; Xiang, C.J.; Samsudin, M.S. Optimal Solar Farm Site Selection in the George Town Conurbation Using Gis-Based Multi-Criteria Decision Making (MCDM) and NASA POWER Data. Atmosphere 2022, 13, 2105. [Google Scholar] [CrossRef]
- Agyekum, E.B.; Amjad, F.; Aslam, F.; Ali, A. Application of Weighted Linear Combination Approach in a Geographical Information System Environment for Nuclear Power Plant Site Selection: The Case of Ghana. Ann. Nucl. Energy 2021, 162, 108491. [Google Scholar] [CrossRef]
- Al-Shetwi, A.Q. Sustainable Development of Renewable Energy Integrated Power Sector: Trends, Environmental Impacts, and Recent Challenges. Sci. Total Environ. 2022, 822, 153645. [Google Scholar] [CrossRef]
- Bradley, T.; Rosencranz, A. Solar Revolution: The Economic Transformation of the Global Energy Industry. Glob. Environ. Politics 2007, 7, 147–148. [Google Scholar] [CrossRef]
- Faber, T. Tower and Foundation. In Wind Power Technology: An Introduction; Schaffarczyk, A.P., Ed.; Springer International Publishing: Cham, Switzerland, 2023; pp. 291–318. [Google Scholar]
- Asif, M.; Imran Khan, M.; Pandey, A. Navigating the Inclusive and Sustainable Energy Transitions in South Asia: Progress, Priorities and Stakeholder Perspectives. Energy Convers. Manag. 2024, 313, 118589. [Google Scholar] [CrossRef]
- Yuan, J.; Kang, J.; Yu, C.; Hu, Z. Energy Conservation and Emissions Reduction in China—Progress and Prospective. Renew. Sustain. Energy Rev. 2011, 15, 4334–4347. [Google Scholar] [CrossRef]
- Pujadas-Gispert, E.; Sanjuan-Delmás, D.; Josa, A. Environmental Analysis of Building Shallow Foundations: The Influence of Prefabrication, Typology, and Structural Design Codes. J. Clean. Prod. 2018, 186, 407–417. [Google Scholar] [CrossRef]
- Xin, H.; Yih, C.H. Environmental Sustainability of Off-Site Manufacturing: A Literature Review. Eng. Constr. Archit. Manag. 2019, 28, 332–350. [Google Scholar]
- Cao, X.; Li, X.; Zhu, Y.; Zhang, Z. A Comparative Study of Environmental Performance Between Prefabricated and Traditional Residential Buildings in China. J. Clean. Prod. 2015, 109, 131–143. [Google Scholar] [CrossRef]
- Pan, Z.H.; Si, Q.; Zhu, Y.Z.; Ying, H.; Wang, X.X.; Du, D.F. Seismic Performance of Prefabricated Semi-Rigid RCS Structures. Structures 2022, 43, 1369–1379. [Google Scholar] [CrossRef]
- Wu, K.; Lin, S.Q.; Liu, X.Y.; Mao, F.S.; Zhai, J.P. Experimental Study on Mechanical Behavior of Prefabricated PEC Composite Beams Under Cyclic Loading. Int. J. Steel Struct. 2020, 20, 725–741. [Google Scholar] [CrossRef]
- Wang, M.F.; Wu, X. Experimental and Numerical Investigation on Seismic Behavior of an Innovative Superimposed Concrete Shear Wall. Structures 2021, 33, 4286–4298. [Google Scholar] [CrossRef]
- Yang, J.; Wang, Y.Q.; Xu, X.C.; Fang, Y.Z.; Sun, B. Experimental Investigation on Seismic Behavior of the Precast Shear Wall Systems with Different Connection Methods Under the Coupling Action of Axial Tension and Cyclic Horizontal Load. Structures 2023, 57, 105152. [Google Scholar] [CrossRef]
- Pul, S.; Senturk, M.; Ilki, A.; Hajirasouliha, I. Experimental and Numerical Investigation of a Proposed Monolithic-Like Precast Concrete Column-Foundation Connection. Eng. Struct. 2021, 246, 113090. [Google Scholar] [CrossRef]
- Yu, H.T.; Al-Hussein, M.A.; Nasseri, R.N.; Cheng, R.J.C.J. Sustainable Precast Concrete Foundation System for Residential Construction. Can. J. Civ. Eng. 2008, 35, 190–199. [Google Scholar] [CrossRef]
- Li, X.Y.; Hao, H.G.; Wang, H.J.; Zhang, L.Y.; Guo, Y.H.; Lian, J.J.; Du, Y.; Wang, X.; Zeng, C. Design and Analysis of a New Prefabricated Foundation for Onshore Wind Turbines. Buildings 2024, 14, 193. [Google Scholar] [CrossRef]
- Wang, R.; Zhang, D.L.; Wu, X.G.; Wang, F.; Li, T.H.; Fu, K.; Zhao, C.; Zhou, Z.; Zhu, H.B.; Zhang, M.Y.; et al. Behaviors of Assembly Gravity Expansion Foundation for Onshore Wind Turbines Under Extreme Load Conditions. In Proceedings of the 6th International Conference on Civil Engineering and Architecture, Bali Island, Indonesia, 16–18 December 2023; Springer Nature: Singapore, 2024; Volume 2. [Google Scholar]
- Li, X.S.; Zhang, J.Q.; Xu, H.X.; Shi, Z.W.; Gao, Q.F. Static Load Test and Numerical Analysis of Influencing Factors of the Ultimate Bearing Capacity of PHC Pipe Piles in Multilayer Soil. Sustainability 2021, 13, 13166. [Google Scholar] [CrossRef]
- Zhu, J.S.; Liu, Z.Q.; Liu, X.X.; Li, L.J.; Li, Y.Z. Bending Performance of Wet Joints in Negative Moment Zone of Prefabricated Small-Box Girder Bridges: Experimental and Numerical Study. Structures 2024, 62, 106103. [Google Scholar] [CrossRef]
- Dong, A.; Li, Z.Y.; Rong, B.; Wang, C.X.; Wang, Z.M.; Xu, H. Flexural Behavior of wet Panel-To-Panel Groove-And-Tongue Joints Provided with Lapped U-Bars. Eng. Struct. 2024, 299, 117053. [Google Scholar] [CrossRef]
- Zhou, X.Y.; Nie, X.; Ding, R. Experimental and Analytical Studies on Interfacial Shear Behavior of Socket Connections with Shear Keys. J. Build. Eng. 2024, 89, 109265. [Google Scholar] [CrossRef]
- GB 50007-2011; Code for Design of Building Foundation. China Architecture & Building Press: Beijing, China, 2011.
- Wang, Y.X.; Li, S.; Gao, C.S.; Cheng, Z.; Wang, J.Q.; Hu, Y.Q. Experimental and Numerical Study on Cyclic Behavior of Precast Segmental Railway Bridge Columns with Lap-Spliced Rebar Connections Using UHPC Wet Joints. Eng. Struct. 2024, 319, 118818. [Google Scholar] [CrossRef]
- Deng, S.W.; Yan, B.F.; Shen, L.; Yuan, J.L.; Li, H.H. Experimental Investigations on the Flexural Behavior of UHPC Wet Joints for UHPC Light-Weight Rigid Frame Arch Bridges. Constr. Build. Mater. 2024, 446, 137994. [Google Scholar] [CrossRef]
- Yan, B.F.; Li, C.Y.; Qiu, M.H.; Zhu, Y.P.; Hu, M.Y. Flexural Performance of Transverse Wet Joint in Steel-UHPC Composite Beam Under Negative Bending Moments. J. Constr. Steel Res. 2024, 223, 109029. [Google Scholar] [CrossRef]
- Zhu, J.S.; Tong, X.Y.; Li, Y.Z.; Li, L.J. Research on Flexural Behavior and Design Method of Formwork Free UHPC Wet Joint in Prefabricated Small Box Girder Bridges. Structures 2024, 69, 107333. [Google Scholar] [CrossRef]
- Wang, H.; Wang, N.; Liu, X.G.; Yue, Q.R.; Yan, B.F.; Zhang, Y. Effects of UHPC Shear Key on Strengthening Shear Performances of Wet Joint in Prefabricated Composite Beams. Eng. Struct. 2024, 299, 117130. [Google Scholar] [CrossRef]
- Deng, E.F.; Zhang, Z.; Zhang, C.X.; Tang, Y.; Wang, W.; Du, Z.J.; Gao, J.P. Experimental Study on Flexural Behavior of UHPC Wet Joint in Prefabricated Multi-Girder Bridge. Eng. Struct. 2023, 275, 115314. [Google Scholar] [CrossRef]
- Yin, Y.S.; Yi, F.; Yang, J.; Su, Q.T.; Zhang, G.H. Numerical Calculation and Analysis of Mechanical Properties of UHPC Wet Joint Interface of Prefabricated Segmental Beams. Case Stud. Constr. Mater. 2022, 17, e1426. [Google Scholar] [CrossRef]
- Jia, J.F.; Ren, Z.D.; Bai, Y.L.; Li, J.; Li, B.; Sun, Y.G.; Zhang, Z.X.; Zhang, J.X. Tensile Behavior of UHPC Wet Joints for Precast Bridge Deck Panels. Eng. Struct. 2023, 282, 115826. [Google Scholar] [CrossRef]


| Name | Thickness (m) | Density (kg/m3) | Internal Friction Angle (°) | Cohesion Force (kPa) | Elastic Modulus (MPa) |
|---|---|---|---|---|---|
| Soft clay | 6.7 | 1800 | 25 | 11 | 8.58 |
| Load Combination | Axial Pressure (kN) | Bending Moment 1 (kN·m) | Bending Moment 2 (kN·m) |
|---|---|---|---|
| Characteristic Combination | 1100.0 | 185.1 | 86.7 |
| Fundamental Combination | 1485.0 | 207.3 | 97.1 |
| Test Combination | 2200.0 | 370.2 | 173.4 |
| Load Grade | Current Stage Load (kN) | Cumulative Load (kN) | Load Duration (min) | Load Grade | Current Stage Load (kN) | Cumulative Load (kN) | Load Duration (min) |
|---|---|---|---|---|---|---|---|
| 1 | 200 | 200 | 60 | 10 | 200 | 2000 | 60 |
| 2 | 200 | 400 | 60 | 11 | 200 | 2200 | 60 |
| 3 | 200 | 600 | 60 | 12 | −200 | 2000 | 120 |
| 4 | 200 | 800 | 60 | 13 | −400 | 1600 | 120 |
| 5 | 200 | 1000 | 60 | 14 | −400 | 1200 | 120 |
| 6 | 200 | 1200 | 60 | 15 | −400 | 800 | 120 |
| 7 | 200 | 1400 | 60 | 16 | −400 | 400 | 120 |
| 8 | 200 | 1600 | 60 | 17 | −400 | 0 | 120 |
| 9 | 200 | 1800 | 60 | 18 | 0 | 0 | 180 |
| Element | Simulation Element | Material Constitutive Model | Basic Parameters | |||
|---|---|---|---|---|---|---|
| E (MPa) | ν | εuc | εut | |||
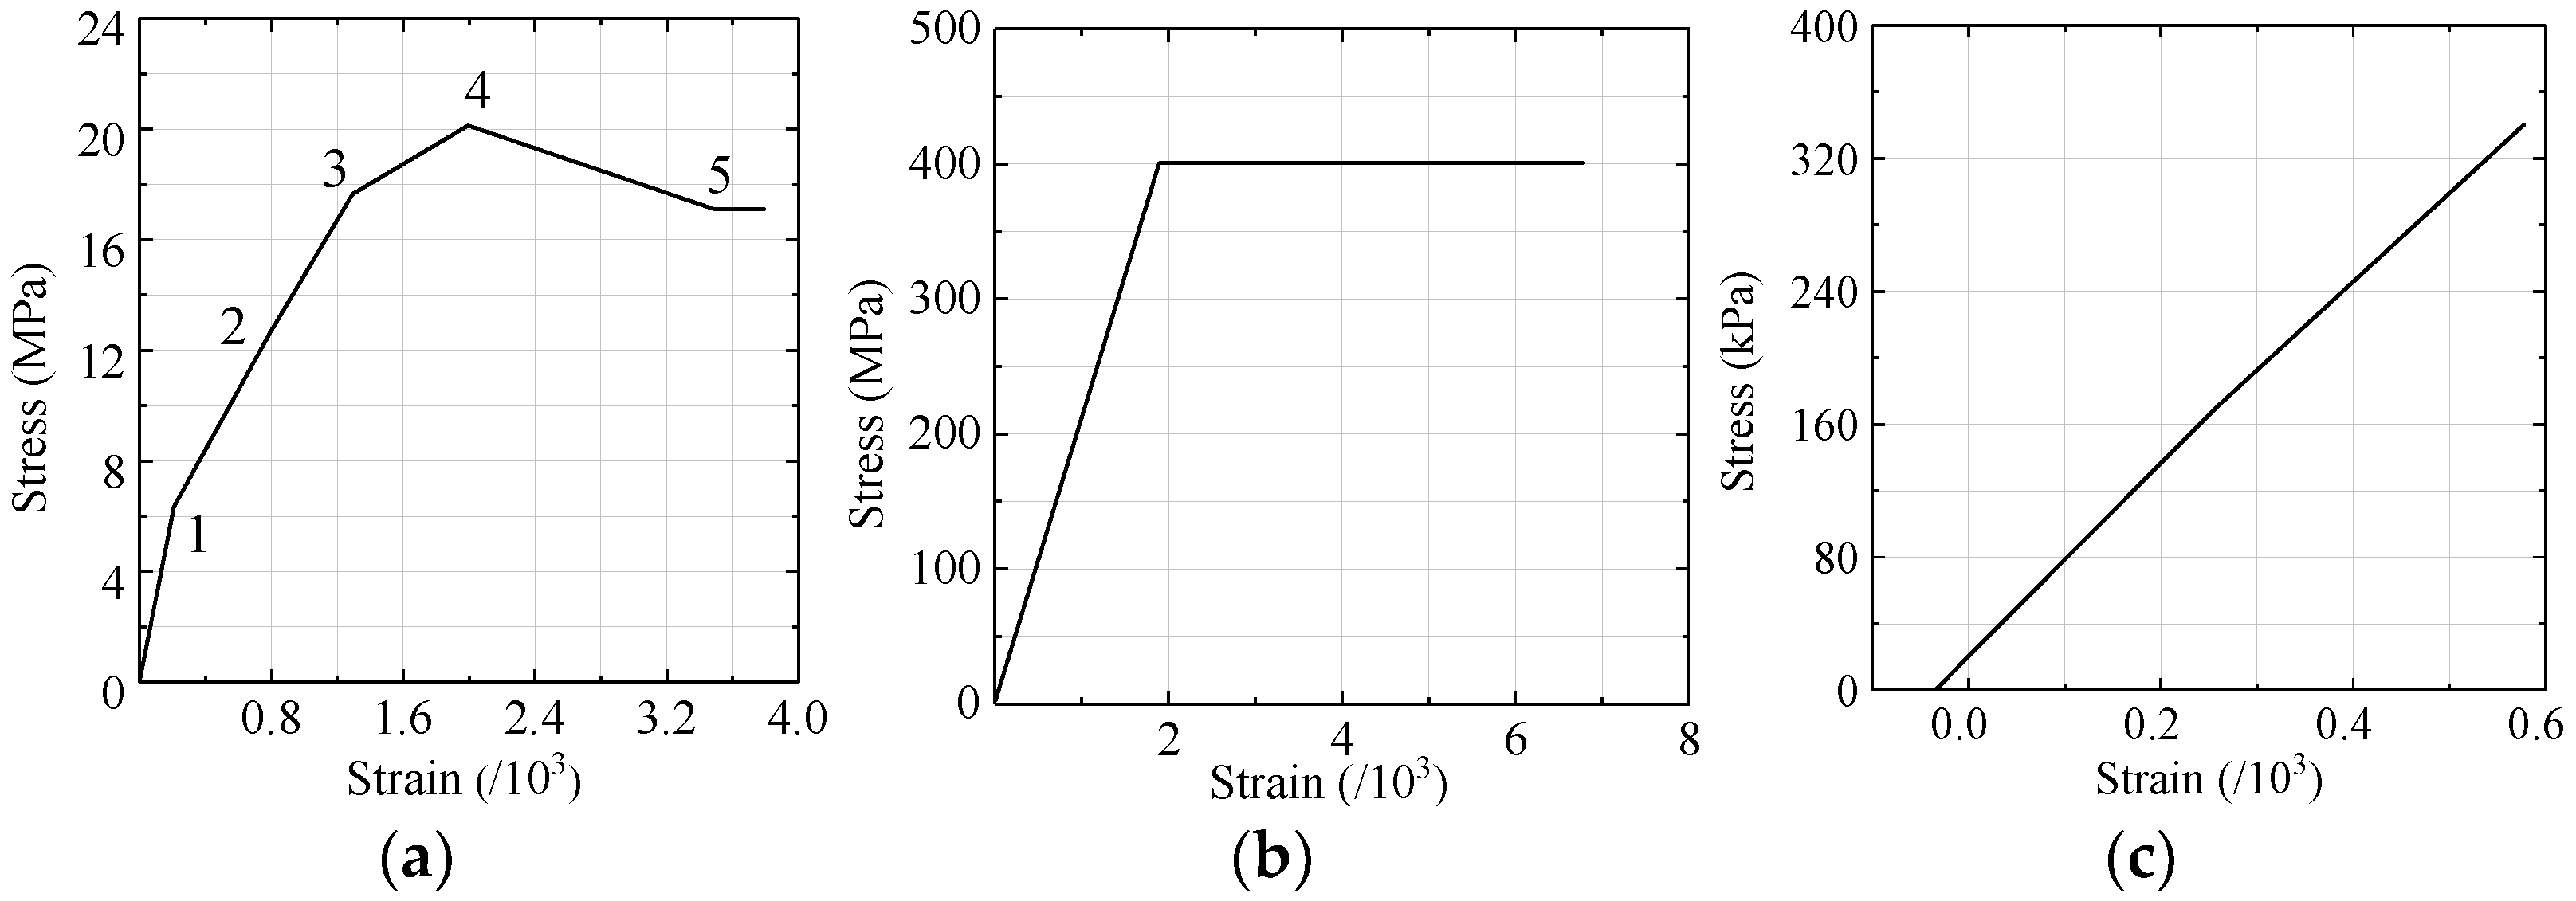
| Concrete | SOLID65 | Multilinear kinematic hardening model | 20,000 | 0.25 | 0.0035 | 0.0005 |
| Reinforcing steels | LINK8 | Bilinear isotropic hardening model | 200,000 | 0.25 | 0.0020 | 0.0020 |
| Foundation soil | SOLID45 | Drucker–Prager model | 8.58 | 0.40 | / | / |
| Condition | λ | P (kN) | Settlement (mm) | Deflection (mm) |
|---|---|---|---|---|
| Yield/Ultimate | Yield/Ultimate | Yield/Ultimate | ||
| C1 | 0.8 | 846.40/2001.10 | 25.41/78.90 | 4.82/16.54 |
| C2 | 0.9 | 936.50/2101.60 | 24.69/71.07 | 4.49/15.99 |
| C3 | 1.0 | 1029.80/2107.70 | 24.79/68.45 | 4.06/13.43 |
| C4 | 1.1 | 1132.00/2089.40 | 23.62/62.84 | 3.61/13.98 |
| C5 | 1.2 | 1087.40/1976.80 | 21.90/53.76 | 4.32/14.98 |
| Condition | a × b (mm × mm) | P (kN) | Settlement (mm) | Deflection (mm) |
|---|---|---|---|---|
| Yield/Ultimate | Yield/Ultimate | Yield/Ultimate | ||
| C1 | 450 × 300 | 1057.30/2124.60 | 22.95/70.36 | 4.17/13.54 |
| C2 | 600 × 300 | 1072.50/2053.10 | 20.12/64.01 | 4.23/13.08 |
| C3 | 300 × 300 | 1029.80/2107.70 | 24.79/68.45 | 4.06/13.43 |
| C4 | 300 × 450 | 1045.10/1964.00 | 22.00/71.76 | 4.12/12.52 |
| C5 | 300 × 600 | 980.40/1867.30 | 19.16/62.88 | 3.87/11.90 |
| Condition | Material | P (kN) | Settlement (mm) | Deflection (mm) |
|---|---|---|---|---|
| Yield/Ultimate | Yield/Ultimate | Yield/Ultimate | ||
| C1 | C40 | 1029.80/2107.70 | 24.79/68.45 | 4.06/13.43 |
| C2 | C50 | 1105.40/2136.10 | 25.11/67.72 | 4.35/14.16 |
| C3 | UHPC80 | 1242.70/2056.20 | 21.86/67.10 | 4.89/15.77 |
| C5 | UHPC100 | 1290.20/2060.50 | 21.32/66.29 | 5.08/15.98 |
Disclaimer/Publisher’s Note: The statements, opinions and data contained in all publications are solely those of the individual author(s) and contributor(s) and not of MDPI and/or the editor(s). MDPI and/or the editor(s) disclaim responsibility for any injury to people or property resulting from any ideas, methods, instructions or products referred to in the content. |
© 2024 by the authors. Licensee MDPI, Basel, Switzerland. This article is an open access article distributed under the terms and conditions of the Creative Commons Attribution (CC BY) license (https://creativecommons.org/licenses/by/4.0/).
Share and Cite
Tian, W.; Li, Z.; Wan, H. Design and Analysis of a Novel Prefabricated Foundation for Substation Buildings. Buildings 2024, 14, 4073. https://doi.org/10.3390/buildings14124073
Tian W, Li Z, Wan H. Design and Analysis of a Novel Prefabricated Foundation for Substation Buildings. Buildings. 2024; 14(12):4073. https://doi.org/10.3390/buildings14124073
Chicago/Turabian StyleTian, Weicong, Zhan Li, and Hongxia Wan. 2024. "Design and Analysis of a Novel Prefabricated Foundation for Substation Buildings" Buildings 14, no. 12: 4073. https://doi.org/10.3390/buildings14124073
APA StyleTian, W., Li, Z., & Wan, H. (2024). Design and Analysis of a Novel Prefabricated Foundation for Substation Buildings. Buildings, 14(12), 4073. https://doi.org/10.3390/buildings14124073