Article

Stability of Non-Uniform Soils Slope with Tension Cracks Under Unsaturated Flow Conditions

1
College of Geosciences and Engineering, North China University of Water Resources and Electric Power, Zhengzhou 450046, China
2
Institute of Natural Resources Monitoring and Comprehensive Land Improvement of Henan Province, Zhengzhou 450016, China
3
Faculty of Engineering, China University of Geosciences, Wuhan 430074, China
*
Author to whom correspondence should be addressed.
Buildings 2025, 15(12), 2123; https://doi.org/10.3390/buildings15122123
Submission received: 6 May 2025 / Revised: 9 June 2025 / Accepted: 16 June 2025 / Published: 18 June 2025
(This article belongs to the Special Issue Solid Mechanics as Applied to Civil Engineering)

Abstract

:
The soil slopes in nature are normally unsaturated, heterogeneous, and even carry cracks. In order to assess the stability of slope with crack under steady unsaturated flow and non-uniform conditions, this work proposes a novel discretization-based method to generate the rotational failure mechanism in the context of the kinematic limit analysis. A point-to-point strategy is used to generate the potential failure surface of the failure mechanism. The failure surface consists of a series of log-spiral segments instead of linear segments employed in previous studies. Two kinds of cracks—open cracks and formation cracks—are considered in the stability analysis. The maximum depth of the vertical crack is modified by considering the effect of the unsaturated properties of soils. According to the work–energy balance equation, the explicit expression about the slope factor safety for different crack types is obtained, which is formulated as a multivariate nonlinear optimization problem optimized by an intelligent optimization algorithm. Numerical results for different unsaturated parameters and non-uniform distribution of soil strength are calculated and presented in the form of graphs for potential use in practical engineering. Then, a sensitivity analysis is conducted to find more insights into the effect of unsaturation and heterogeneity on the crack slopes.

1. Introduction

Crack slopes are widely present and it is susceptible to many adverse factors, such as unsaturated flow and heterogeneity. Consequently, the stability of slopes remains of great significance in the field of geotechnical engineering. Currently, the primary approaches addressing slope stability issues include numerical methods and theoretical analyses. Among numerical techniques, Matsui and San [1] introduced the strength reduction method within the framework of finite element analysis to assess slope stability. Zheng et al. [2] developed a unified numerical model based on differential equations that enables the identification of critical slip surfaces without assuming their geometrical configuration. Theoretical methods include limit equilibrium and limit analysis approaches. The limit equilibrium method evaluates slope stability by assuming the stress distribution along the slip surface and establishing limit equilibrium equations. Alkasawneh et al. [3] investigated the influence of different slip surface search techniques on the slope factor safety calculated by the limit equilibrium method. However, the upper bound limit analysis method addresses slope stability by constructing kinematically admissible velocity fields and establishing work rate balance conditions [4]. This approach avoids the stress assumptions and complicated process of static equilibrium analysis. Due to the clarity of concept and convenience of application, the upper bound limit analysis method has been widely used in recent decades as a robust and efficient tool in geotechnical stability analysis [5,6,7,8].
The soil’s slope in nature presents various characteristics under different geological and hydrological conditions. The existing investigations mainly analyze the slope stability either in totally dry or saturated soils. However, the unsaturated properties are a common phenomenon for the most natural slopes which cannot be ignored in geotechnical engineering [9]. Considering this soil’s property, Fredlund et al. [10] researched the unsaturated shear strength of soils and exposed the shear strength variation with space based on the soil–water characteristic curve [11]. With the development of unsaturated soil mechanics, many scholars estimated the earth pressure of retaining walls considering the effect of unsaturated flow [12,13,14]. Regarding the stability of the tunnel face, many contributions have been made considering the effect of the unsaturated flow [15,16,17]. Moreover, the analysis of unsaturated slopes has been also highly concerned. Zhang et al. [18] proposed three kinds of calculation models of rainfall infiltrability for unsaturated slopes considering the rainfall infiltration rate of unsaturated slopes during each rainfall event. Huang et al. [19] analyzed the stability of an infinite slope under rainfall based on the log-spiral failure mechanism. They stated that the slope was prone to translational collapse with the increase in filtration depth and the enhancing effect induced by matric suction applied on the soil strength. Tang et al. [20] introduced the random rainfall pattern produced by random cascade mode into the analysis of unsaturated slopes using numerical methods. They found that the time to reach the extreme point of the safe factor was strongly related to the rainfall intensity. These studies all encompass slope stability under the unsaturated seepage induced by rainfall, which confirms that unsaturated slope stability remains a hot research issue in geotechnical engineering.
In practice, the crack is a common occurrence in soil slopes due to the absence of tensile stress. The aforementioned studies are based on the classic Mohr–Coulomb criterion, which only considers the compressive strength of soil under a limited state. However, in cracked soil slopes, the tensile strength of the soil should be taken into account. Meyerhof [21] considered that the tensile strength of soil is negligible accounting for the potential failure of soil under tensile stress. Therefore, in limit analysis, it is necessary to reduce the tensile stress by introducing a tensile strength cut-off, typically at a tensile stress limit of zero. Utili [22] first proposed a limit analysis framework for evaluating the stability of slopes with varying crack depths and locations, considering both dry and water-filled cracks. Michalowski [23] incorporated the presence of cracks into stability assessment based on the kinematic approach of limit analysis; a single vertical crack is introduced to modify the rotational failure mechanism. Some scholars extended this failure mechanism to more complicated external adverse conditions. Li and Yang [24] combined the nonlinearity property of soils and the pore water pressure to estimate the stability of the slope with crack. Yang and Zhang [25] analyzed the stability of cracked slopes reinforced by the piles. Rao et al. [26] also employed the upper bound limit analysis method to investigate the stability of cracked slopes under the influence of pore water pressure. In addition to stability analyses of cracked slopes, a number of contributions have been made focusing on tensile zones in soils observed in slope and retaining walls [27,28,29,30]. The consideration of cracks and tensile zones in soils has enriched the theoretical framework of limit analysis in geotechnical engineering.
In addition to the unsaturated characteristics and the potential presence of cracks, the inherent heterogeneity of soils is an important characteristic. Considering the variation in soil parameters with depth, Qin and Chian [31] assessed the stability of saturated nonhomogeneous slopes and generated the discretized failure mechanism, obtaining a better upper-bound solution. Sun et al. [32] investigated the stability of heterogeneous slopes considering the water drawdown. With the development of computer science and machine learning, Gu et al. attempted to predict the slope stability using an interpretable machine learning method which greatly increased the computation efficiency and accuracy [33,34,35].
According to the above discussion, natural slopes are often subject to unsaturated conditions, heterogeneity, and the presence of cracks. These features do not always appear separately; they may appear simultaneously and have a coupled effect on slope stability. Previous studies have not considered these issues comprehensively. In this study, within the framework of the upper bound method of limit analysis, the coupled effects of these factors on slope stability are investigated by simultaneously accounting for the following: (1) the influence of unsaturated soil properties above a groundwater table located below the slope toe, (2) the presence of vertical open cracks and formation cracks within the slope, and (3) the heterogeneity of strength parameters such as cohesion and internal friction angle varying with depth. The main contributions of this study include the investigation of the combined effects of matric suction and spatially varying strength parameters and the incorporation of cracks as part of the failure mechanism.

2. Problem Description and Methodology

2.1. Suction Stress Distribution

Many scholars have investigated the nonlinear infiltration problem, Asgari and Bagheripour [36] applied the exp-function method to the Richards equation, reaching a more generalized solution to the infiltration problem. The soil water content at any time and depth can be determined in a semi-infinite and unsaturated porous medium. By introducing the suction stress characteristic curve, Lu and Likos [37] obtained a more general expression to describe the effective stress of soils, which is applicable to both saturated and unsaturated soils.
σ = σ u a σ s
where σ denotes the effective stress, σ represents the total stress, and u a and σ s represent the pore air pressure and suction stress, respectively. The relationship between the suction stress σ s and matric suction u a u w ( u w denotes the pore water pressure) can be expressed as follows (Lu et al. [38]; Vahedifard et al. [39]):
σ s = u a u w ,                                                                             u a u w 0 u a u w 1 + α u a u w n n 1 / n ,                 u a u w > 0
where n and α are two fitting parameters. The parameter α is the inverse of air entry pressure and typically falls in the range 0.001–0.5 kPa−1, and the parameter n is the pore size distribution parameter and typically lies in the range 1.1–8.5. It is important to note that the upper of the Equation (2) is for the saturated case, which is Terzaghi’s effective stress expression, and the lower of the Equation (2) is for the unsaturated case.
Combining Darcy’s law and Gardner’s (1958) model and in conjunction with the conditions of zero suction at the water table, the matric suction profile along with depth above the water table can be estimated as follows (Lu et al. [38]; Vahedifard et al. [39]; Griffith and Lu [40]):
u a u w = 1 α ln 1 + q k s e γ w α z q k s
where q represents the vertical discharge, k s is the saturated hydraulic conductivity, γ w is the unit weight of water, and z is the height above the water table. In Equation (3), q < 0 stands for the case of infiltration, q = 0 corresponds to no flow case, and q > 0 represents the evaporation. By substituting Equation (3) into Equation (2), a closed-form expression about z under steady unsaturated seepage conditions can be obtained:
σ s = 1 α ln 1 + q k s e γ w α z q k s 1 + ln 1 + q k s e γ w α z q k s n n 1 / n
From Equation (4), it can be found that the suction stress is determined by four new parameters, three of which are related to soil types ( n , α , k s ), and the other is related to the flow conditions. According to values suggested by Vaheadifard et al. [14,39], four typical soils were selected for analysis, and their hydrological and shear strength parameters are listed in Table 1. Table 2 provides three typical flow velocity scenarios for steady-state unsaturated flow. The parameter analysis will be conducted revolving around the values of the parameters given in Table 1 and Table 2.

2.2. Upper-Bound Theorem of Limit Analysis

Limit analysis, which includes the lower-bound and upper-bound theorems, has long been recognized as a fundamental and effective method for evaluating stability issues in geotechnical engineering (Chen [41]; Donald and Chen [42]; Yang [43]; Pan and Dias [44]). Of the two, the upper-bound theorem is more commonly applied due to its conceptual and computational simplicity, primarily because it eliminates the need to determine the exact stress distribution within the soil mass. This theorem asserts that, for any failure mechanism that is kinematically permissible, one can derive an upper estimate of the true collapse load by equating the work of external forces with the internal energy dissipated along the failure surface. As a result, when the kinematic method is employed, the calculated failure load of the slope provides a conservative approximation—that is, its value will not exceed the actual failure load. Furthermore, the term “admissible” refers to velocity fields that adhere to prescribed boundary conditions, maintain kinematic compatibility, and comply with the associative flow rule. When using the Mohr–Coulomb criterion, this flow rule leads to the following formulation:
v n = v t tan φ
where φ is the internal friction angle of shearing resistance, v n and v t denote normal and tangential velocity along the slip surface, respectively.

3. Kinematic Analysis of Slope Stability

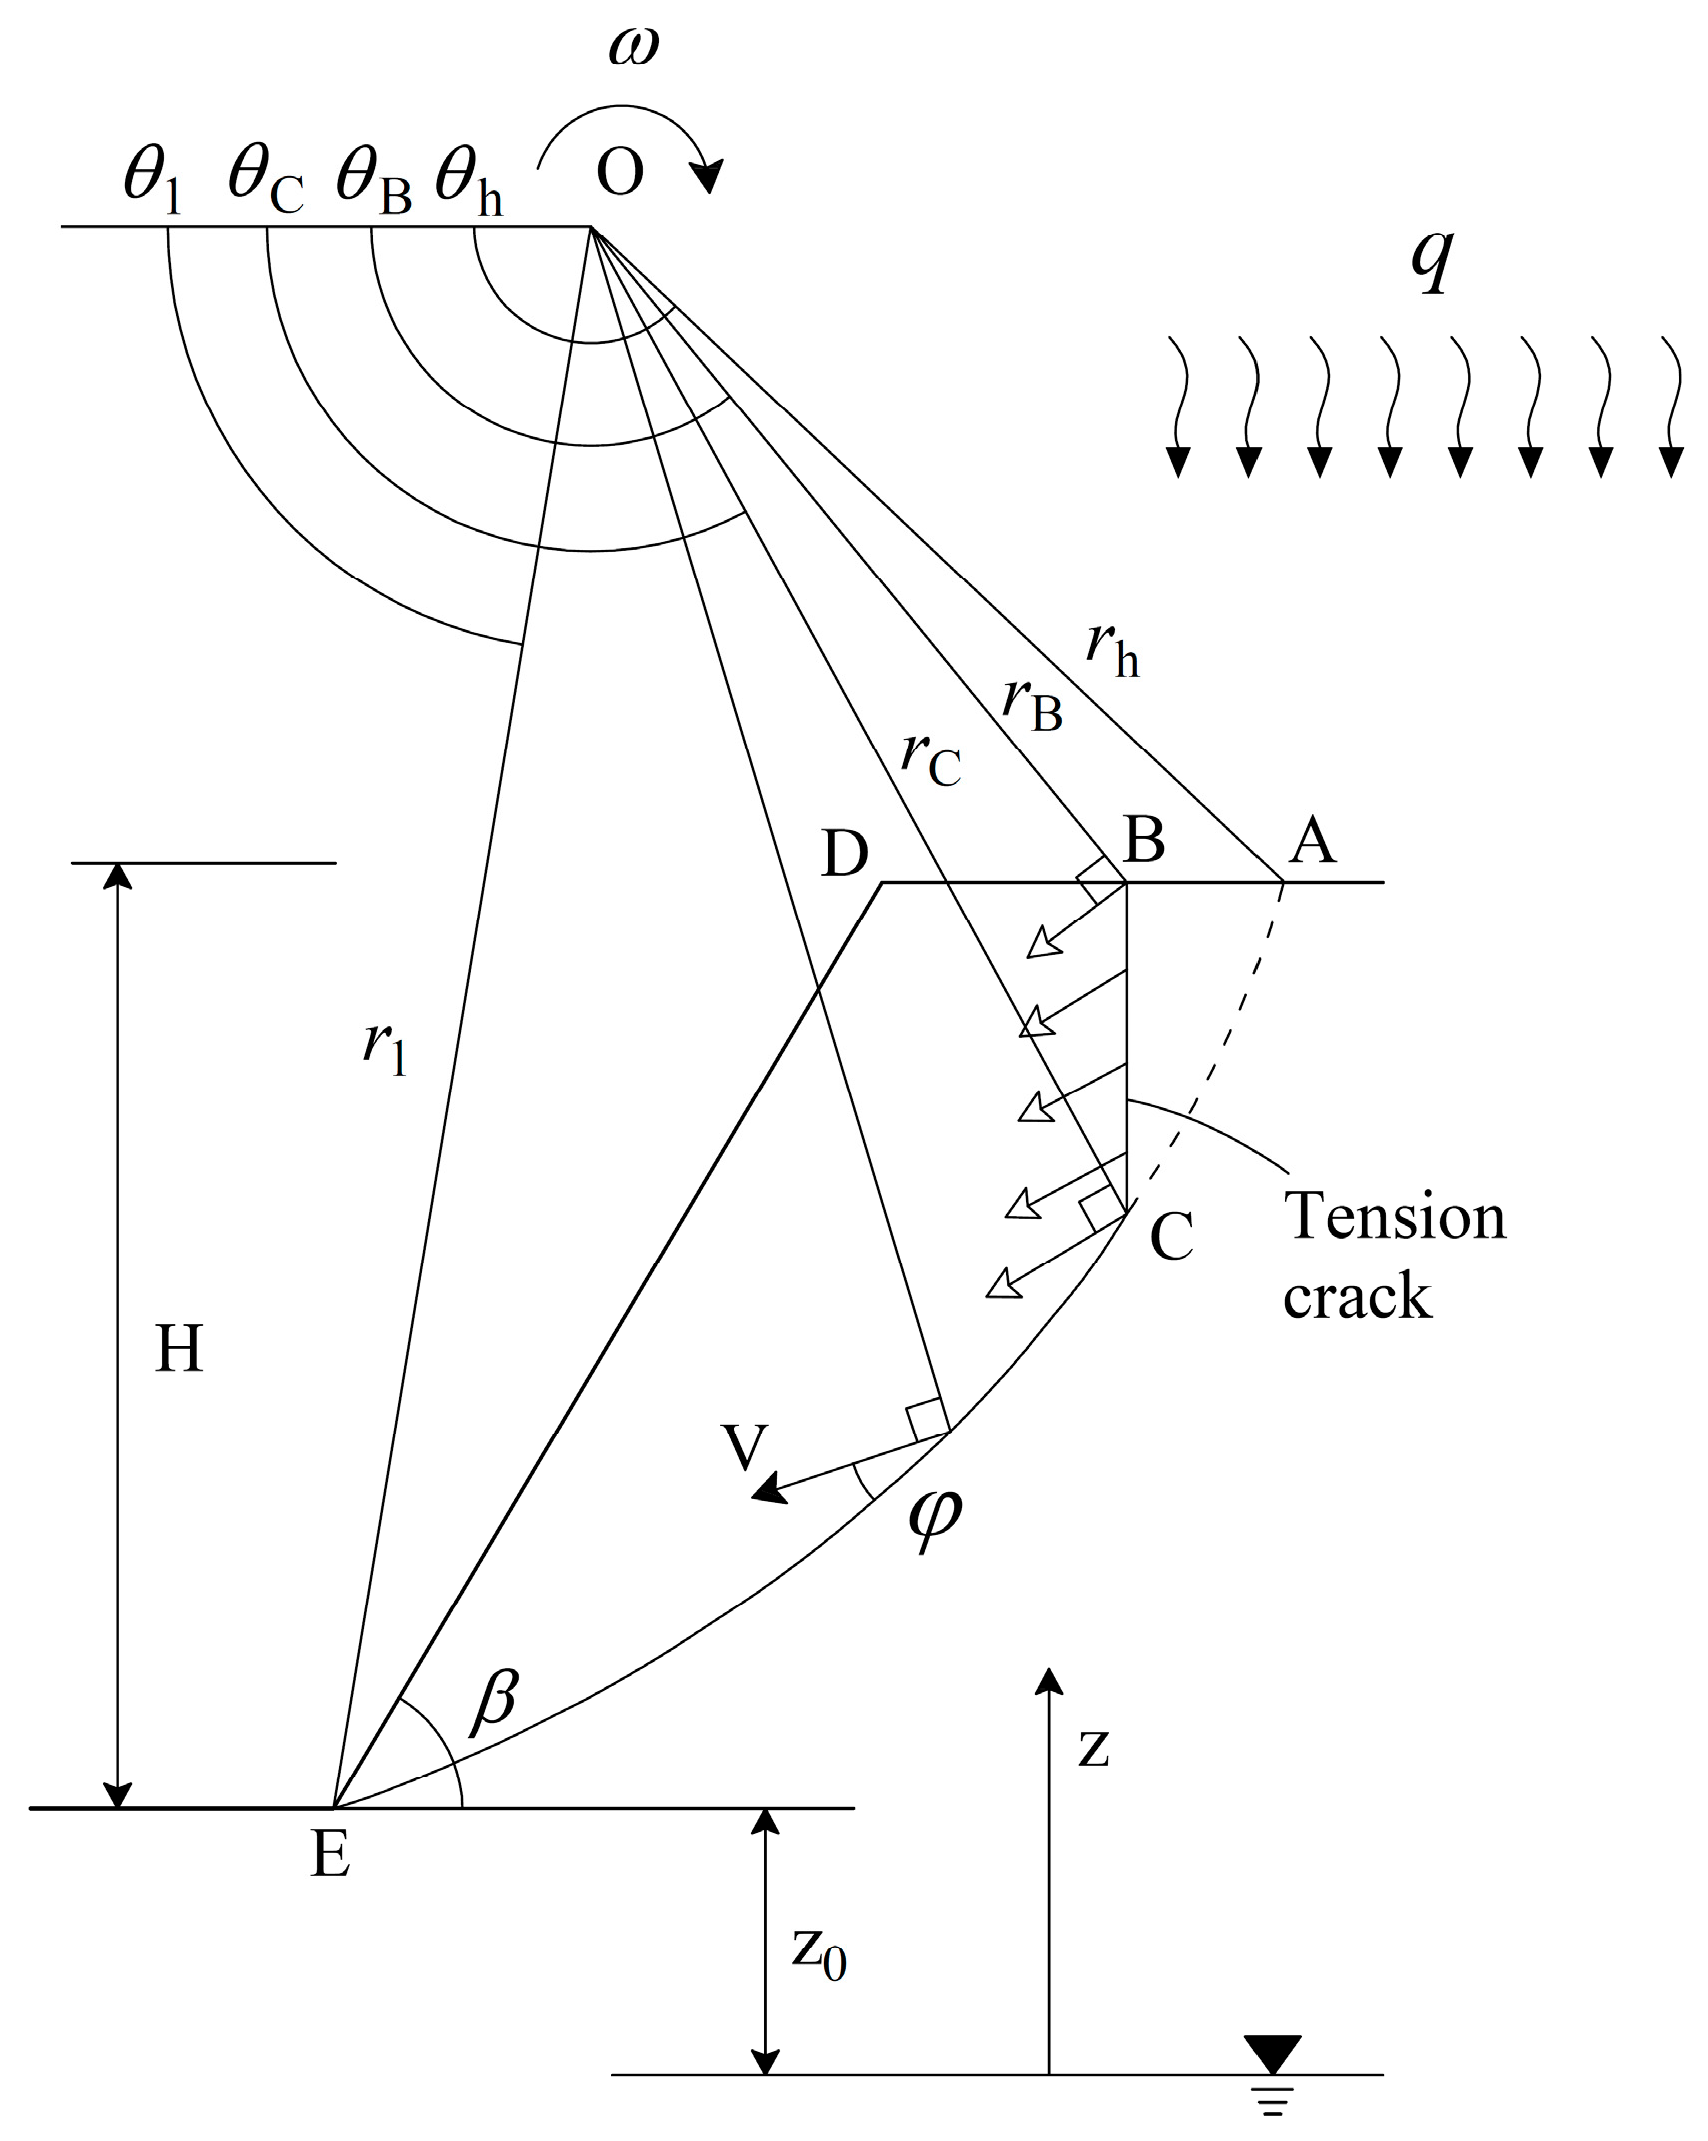
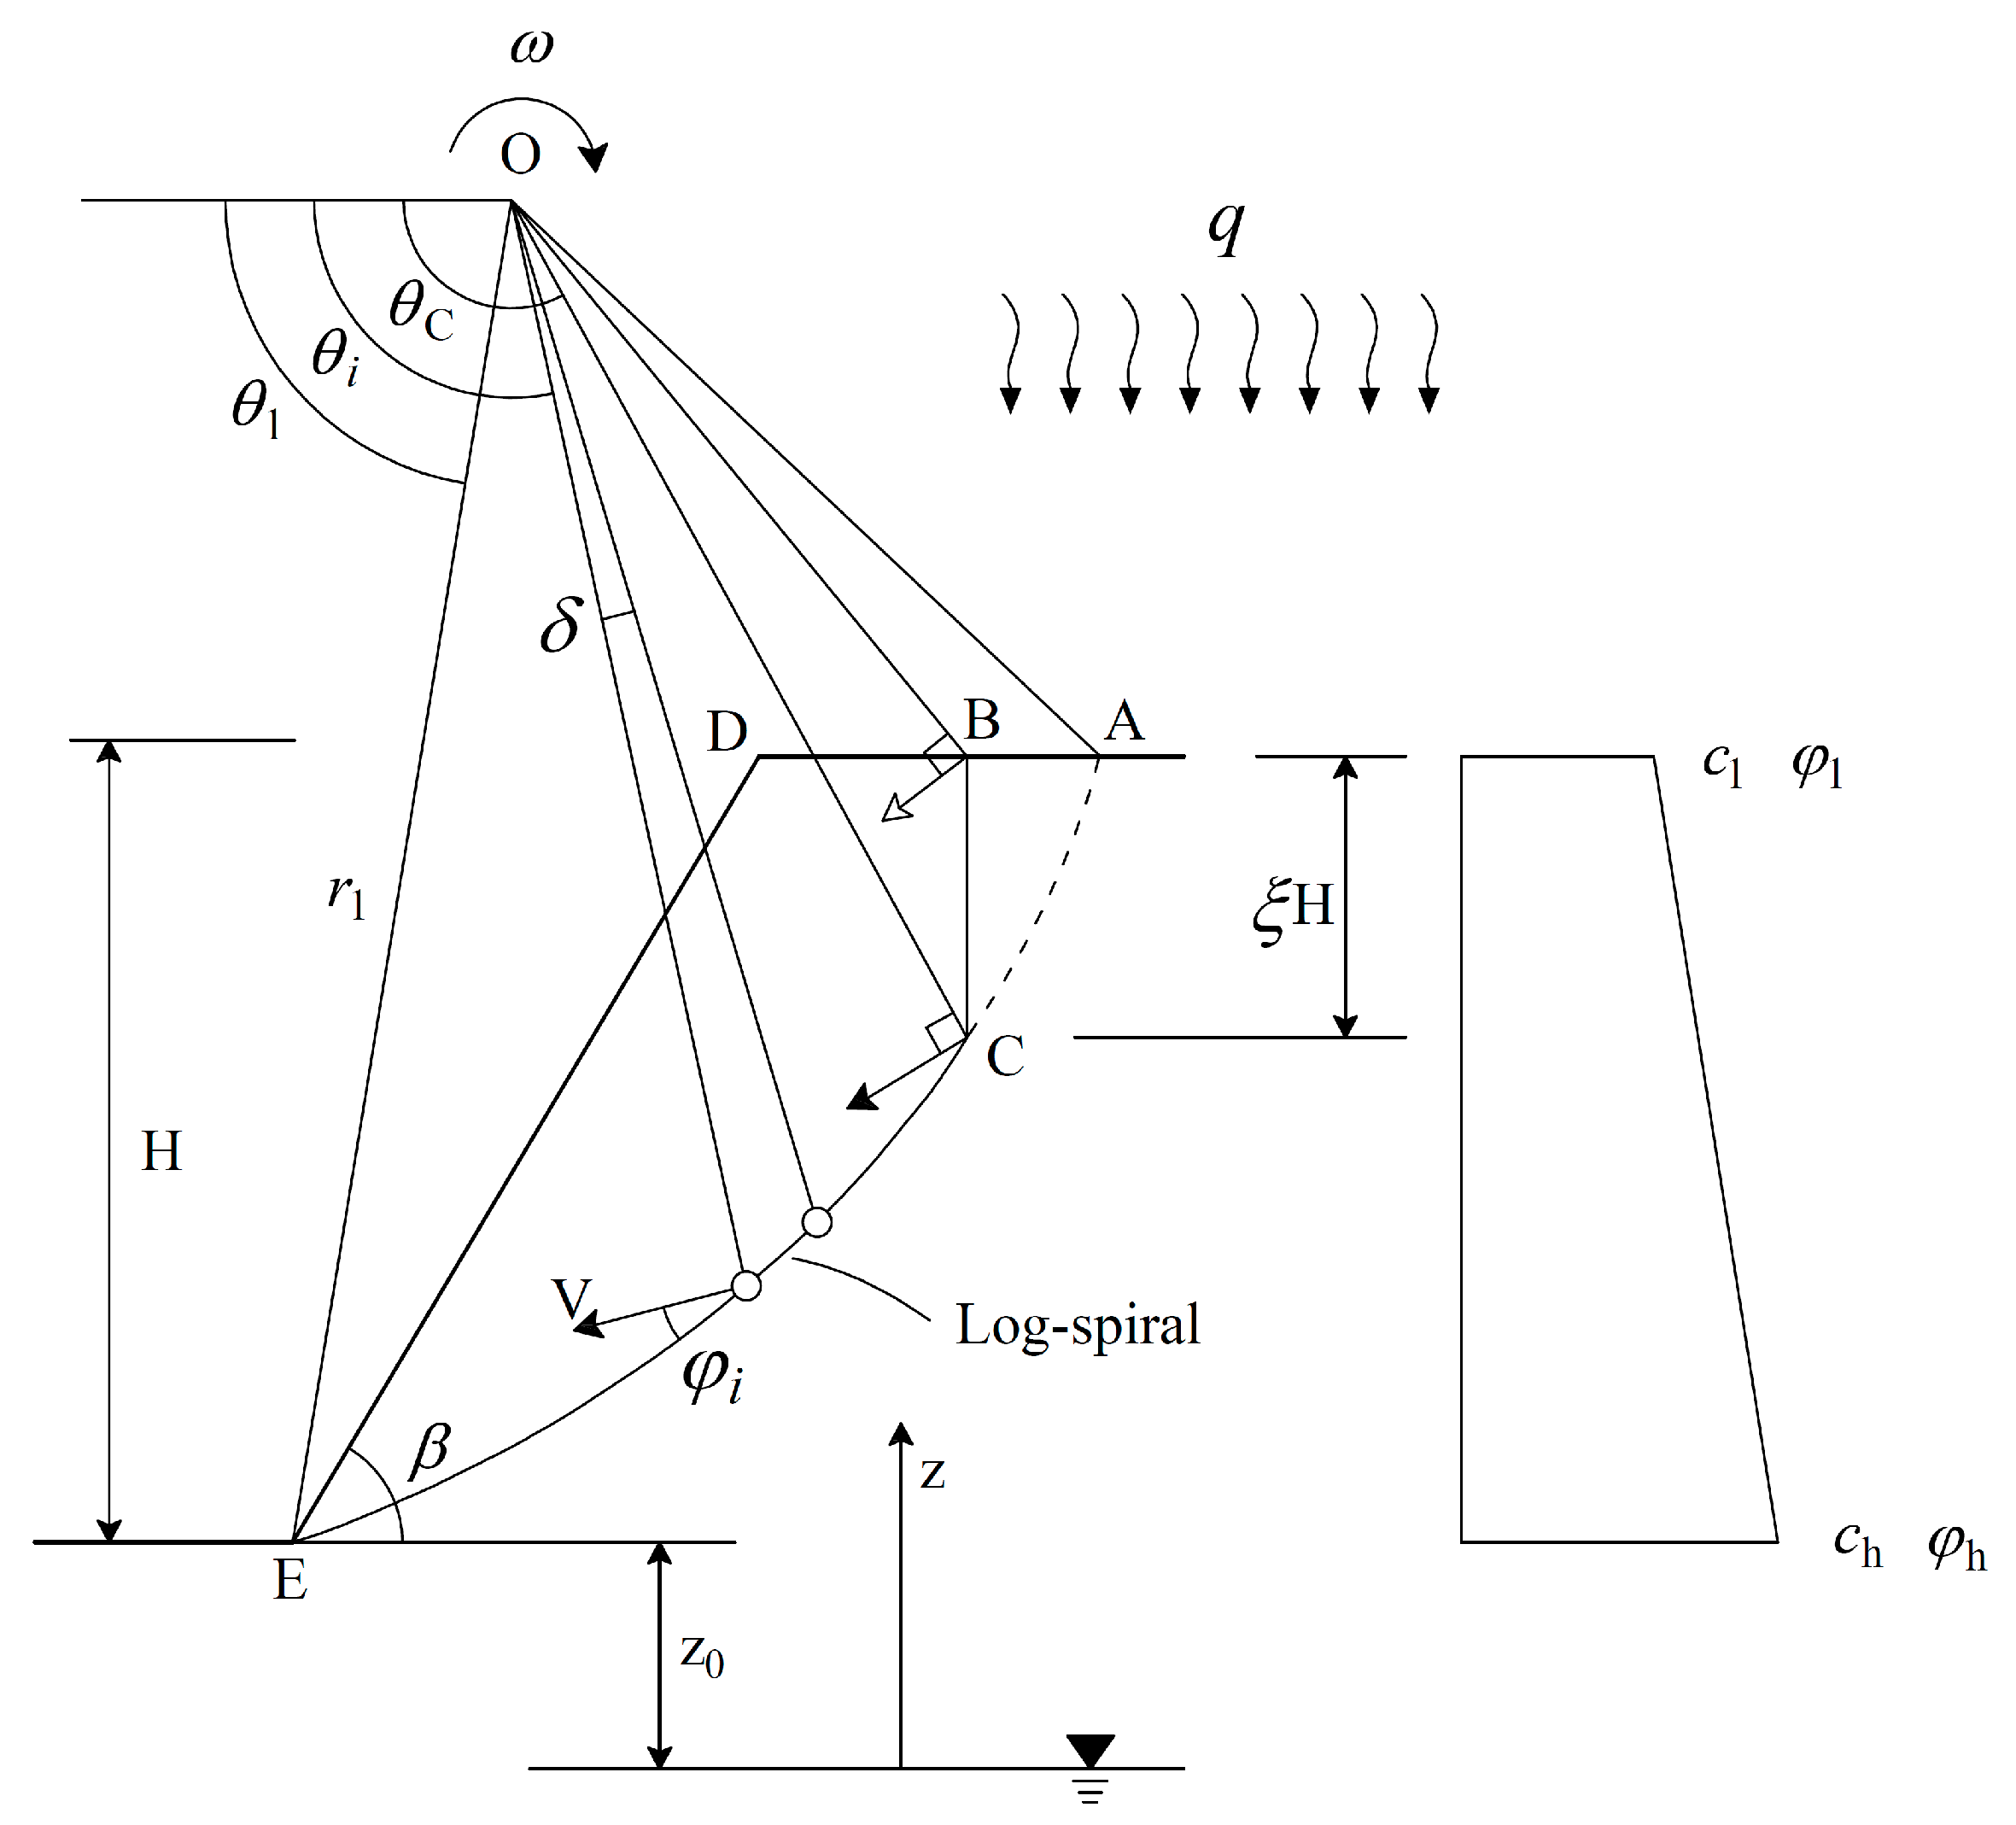
3.1. Failure Mechanism of Nonuniform Slope with Cracks

This section attempts to construct a spatially discretized failure mechanism of the nonuniform soil slope with tension cracks. The failure mechanism of the slope with vertical cracks was initially proposed by Michalowski [23], and then extended by Li and Yang [27] to assess pressures on retaining structures. As illustrated in Figure 1, a crack slope of height H and inclined angle β is considered in this paper. The crack starts from point B of the slope crest and ends at point C of the sliding surface. Two kinds of cracks, namely formation cracks and pre-existing cracks are considered in this work. The position of the crack is defined by the angular variable θ c whose specified value depends on the requirement that the appearance of the crack results in the most adverse impact on the slope stability.
It is assumed that the underground water table is located at a distance of z 0 below the slope toe and the area above the groundwater level is in an unsaturated steady flow state.
The whole failure mechanism rotates around the fixed axis passing through point O as a rigid block with angular velocity ω . The sliding surface of the slope is log-spiral according to the investigation of Chen [41]. For uniform soils whose friction angle is constant, the sliding surface can be expressed as a complete log-spiral curve in the polar coordinate, which usually takes the form of
r = r 1 e θ θ 1 tan φ
where r represents the polar radius of the log-spiral; θ represents the polar angle; r 1 and θ 1 represent the initial polar radius and polar angle.
However, for the nonuniform soil, the friction angle is variable along the depth; thus, the failure mechanism should be modified to adapt to the variation in friction angle. Figure 2 illustrates the schematic diagram of the spatial discretization of the slope failure mechanism. Prior to the introduction of the discretization strategy, it is assumed that soil strength parameters remain constant ( c 1 , φ 1 ) within the depth range of cracks and then linearly increase from the bottom of the crack to the slope toe ( c h , φ h ). In order to account for the variation in friction angle, the sliding surface CE is discretized into N segments with an equal polar angle δ . Each segment is a log-spiral, and the shear strength parameters within each segment can be considered constant when the number of segments is large enough.
The first discretized point is located at the slope toe, namely ( r 1 , θ 1 ). The slope surface EC is discretized and the angular increment between successive radial lines is δ . Given the polar coordinates of the ith discretized point ( r i , θ i ), the polar coordinate of the i + 1th point is expressed as
r i + 1 = r i e θ i + 1 θ i tan φ i = r 1 e δ k = 1 i tan φ k
where φ i represents the friction angle at the ith discretized point; θ i + 1 θ i = δ . The number of discretized points n is calculated by ( θ c θ 1 ) / δ .
The friction angle φ i of the ith point can be calculated by the following iterative formula:
φ i = φ h φ h φ 0 r 1 sin θ 1 r i sin θ i H
In analogy, the cohesion of the ith point can be calculated from:
c i = c h c h c 0 r 1 sin θ 1 r i sin θ i H
It is noted that the whole failure mechanism is determined by three independent variables, θ 1 and r 1 governing the logarithmic spiral AE, θ C governing the position of crack. These three variables will be treated as the variables to be optimized in the search for the critical slope height.
For the convenience of later calculation, some geometrical relations and certain angles are derived from Figure 2.
H = r 1 sin θ 1 r C e θ h θ C tan φ 0 sin θ h
L = r 1 sin β θ 1 + r h sin θ h β sin β
ξ H = r C sin θ C r h sin θ h
L L = r C cos θ C r h cos θ h
where ξ H represents the depth of crack with ξ being the crack depth coefficient; L and L denote the lengths of the AD and BD. According to the geometrical relationship shown in Figure 2, angles θ B and θ D can be calculated using the following explicit expressions:
θ B = arccos r C cos θ C r h sin θ h 2 + r C cos θ C 2
θ D = arccos r h cos θ h + L r h sin θ h 2 + r h cos θ h + L 2

3.2. Maximum Depth of Cracks

This section aims to introduce the maximum depth of a vertical crack. Note from Figure 1 that the vertical crack to some extent can be considered as a slope face of a vertical slope. Therefore, there exists a maximum constraint on the crack depth, beyond which the new slope profile left after failure cannot keep stable.
In the case of dry soils, the maximum depth coefficient of cracks takes the form of
ξ max = 3.83 c 0 γ H tan π 4 + φ 2
However, Equation (16) is no longer applicable for unsaturated soils. The maximum depth of vertical cracks needs to be re-derived considering the unsaturated effect. The eventual formula of the maximum depth coefficient of cracks is given herein, and the specific derivation process of the maximum depth of cracks is presented in Appendix A. The maximum depth coefficient of cracks considering the unsaturated flow is expressed as
ξ max = c 0 γ H g 5 g 1 g 2 g 3 1 / α γ H g 4 g 1 g 2 g 3 sin θ C e θ h θ C tan φ 0 sin θ h
where g 1 g 5 are dimensionless functions which can be found in Appendix A. The geometrical conditions below must be followed to ensure that the failure mechanism is valid
s . t .       0 < θ C < θ B < θ h < π

3.3. Work–Energy Balance Equation

Based on the above failure mechanism, the factor of safety (FS) of slope can be obtained by the work–energy balance equation. In this work, the FS is defined as
F S = D c + D t W γ + W σ s
where W γ is the work rate due to the soil self-weight; γ is the soil unit weight; W σ s is the work rate; σ s is the suction stress; D c and D t are the rates of internal energy dissipated along the crack BC and the log-spiral surface CE, respectively.
As presented in Figure 2, the work rate of the soil weight of the sliding block B-C-D-E can be calculated by integrating in angular range θ B < θ θ D and θ D < θ θ E , respectively:
W γ = ω γ i = 1 N θ i θ i + 1 r s r ρ 2 cos θ   d ρ d θ + ω γ θ C θ A r s r ρ 2 cos θ   d ρ d θ
where rs represents the polar radius of the upper contour of the slope, rs, in two distinct regions, and BD and DE are expressed as:
r s = r h sin θ h sin θ ,   θ D < θ θ B r 1 sin θ 1 tan β cos θ 1 sin θ tan β cos θ ,   θ E < θ θ D
The polar coordinate of vertical crack BC reads
r c = r C cos θ C cos θ       θ C < θ θ B
The work rate induced by the suction stress can be calculated by the sum of the dot product of the suction stress and the velocity of the element, which is presented as
W σ s = ω 1 / α r 1 2 f 1 + f 2
where S c and S t denote the area of the crack and the sliding surface; f 1 and f 2 denote dimensionless functions relating to the crack BC and the sliding surface CE, respectively, and are given in Appendix B.
The external work rate can be calculated based on the above derivation. Now, the internal energy dissipation rate will be derived from the subsequent content. Due to the rigid block assumption to the failure block, the internal energy solely happens along the crack and sliding surface. For the pre-existing crack, no energy is used; however, during the formation of a crack, there is internal energy dissipated along the crack. As stated by Michalowski [23], the formula for calculating the internal energy dissipation rate along the crack can expressed as
D c = S c v f c 1 sin η 2 + f t sin η sin φ 0 1 sin φ 0 d S c
where f c and f t are the one-dimensional compressive and tensile strength, respectively, and v is the magnitude of the velocity along the crack BC. It is recognized that the linear Mohr–Coulomb (MC) yield criterion will overestimate the tensile strength of most soils (Michalowski [23]; Abd and Utili [45]). To overcome this shortcoming, Michalowski [23] modified the linear MC criterion by introducing a circular arc to replace the part of envelope, as shown in Figure 3. For clarity, a reduction coefficient μ ( 0 μ 1 ) is introduced to express the tension after reduction, and then f c and f t can be calculated as
f c = 2 c 0 cos φ 0 1 sin φ 0
f t = μ 2 c 0 cos φ 0 1 + sin φ 0
It can be seen from Equation (26) that μ = 0 is for the tension cut-off case, 0 < μ < 1 is for the case of limit tension strength, and μ = 1 is for the case of full tensile strength. Consequently, Equation (24) can be rewritten as follows:
D c = ω c 0 r 1 2 f 3
The rate of internal energy along the sliding surface CE is presented as
D t = ω r 1 2 i = 1 N f 4
where f 3 and f 4 are dimensionless functions relating to the energy dissipation rate along the crack and sliding surface, respectively; the detailed expressions are given in Appendix B.

3.4. Factor of Safety
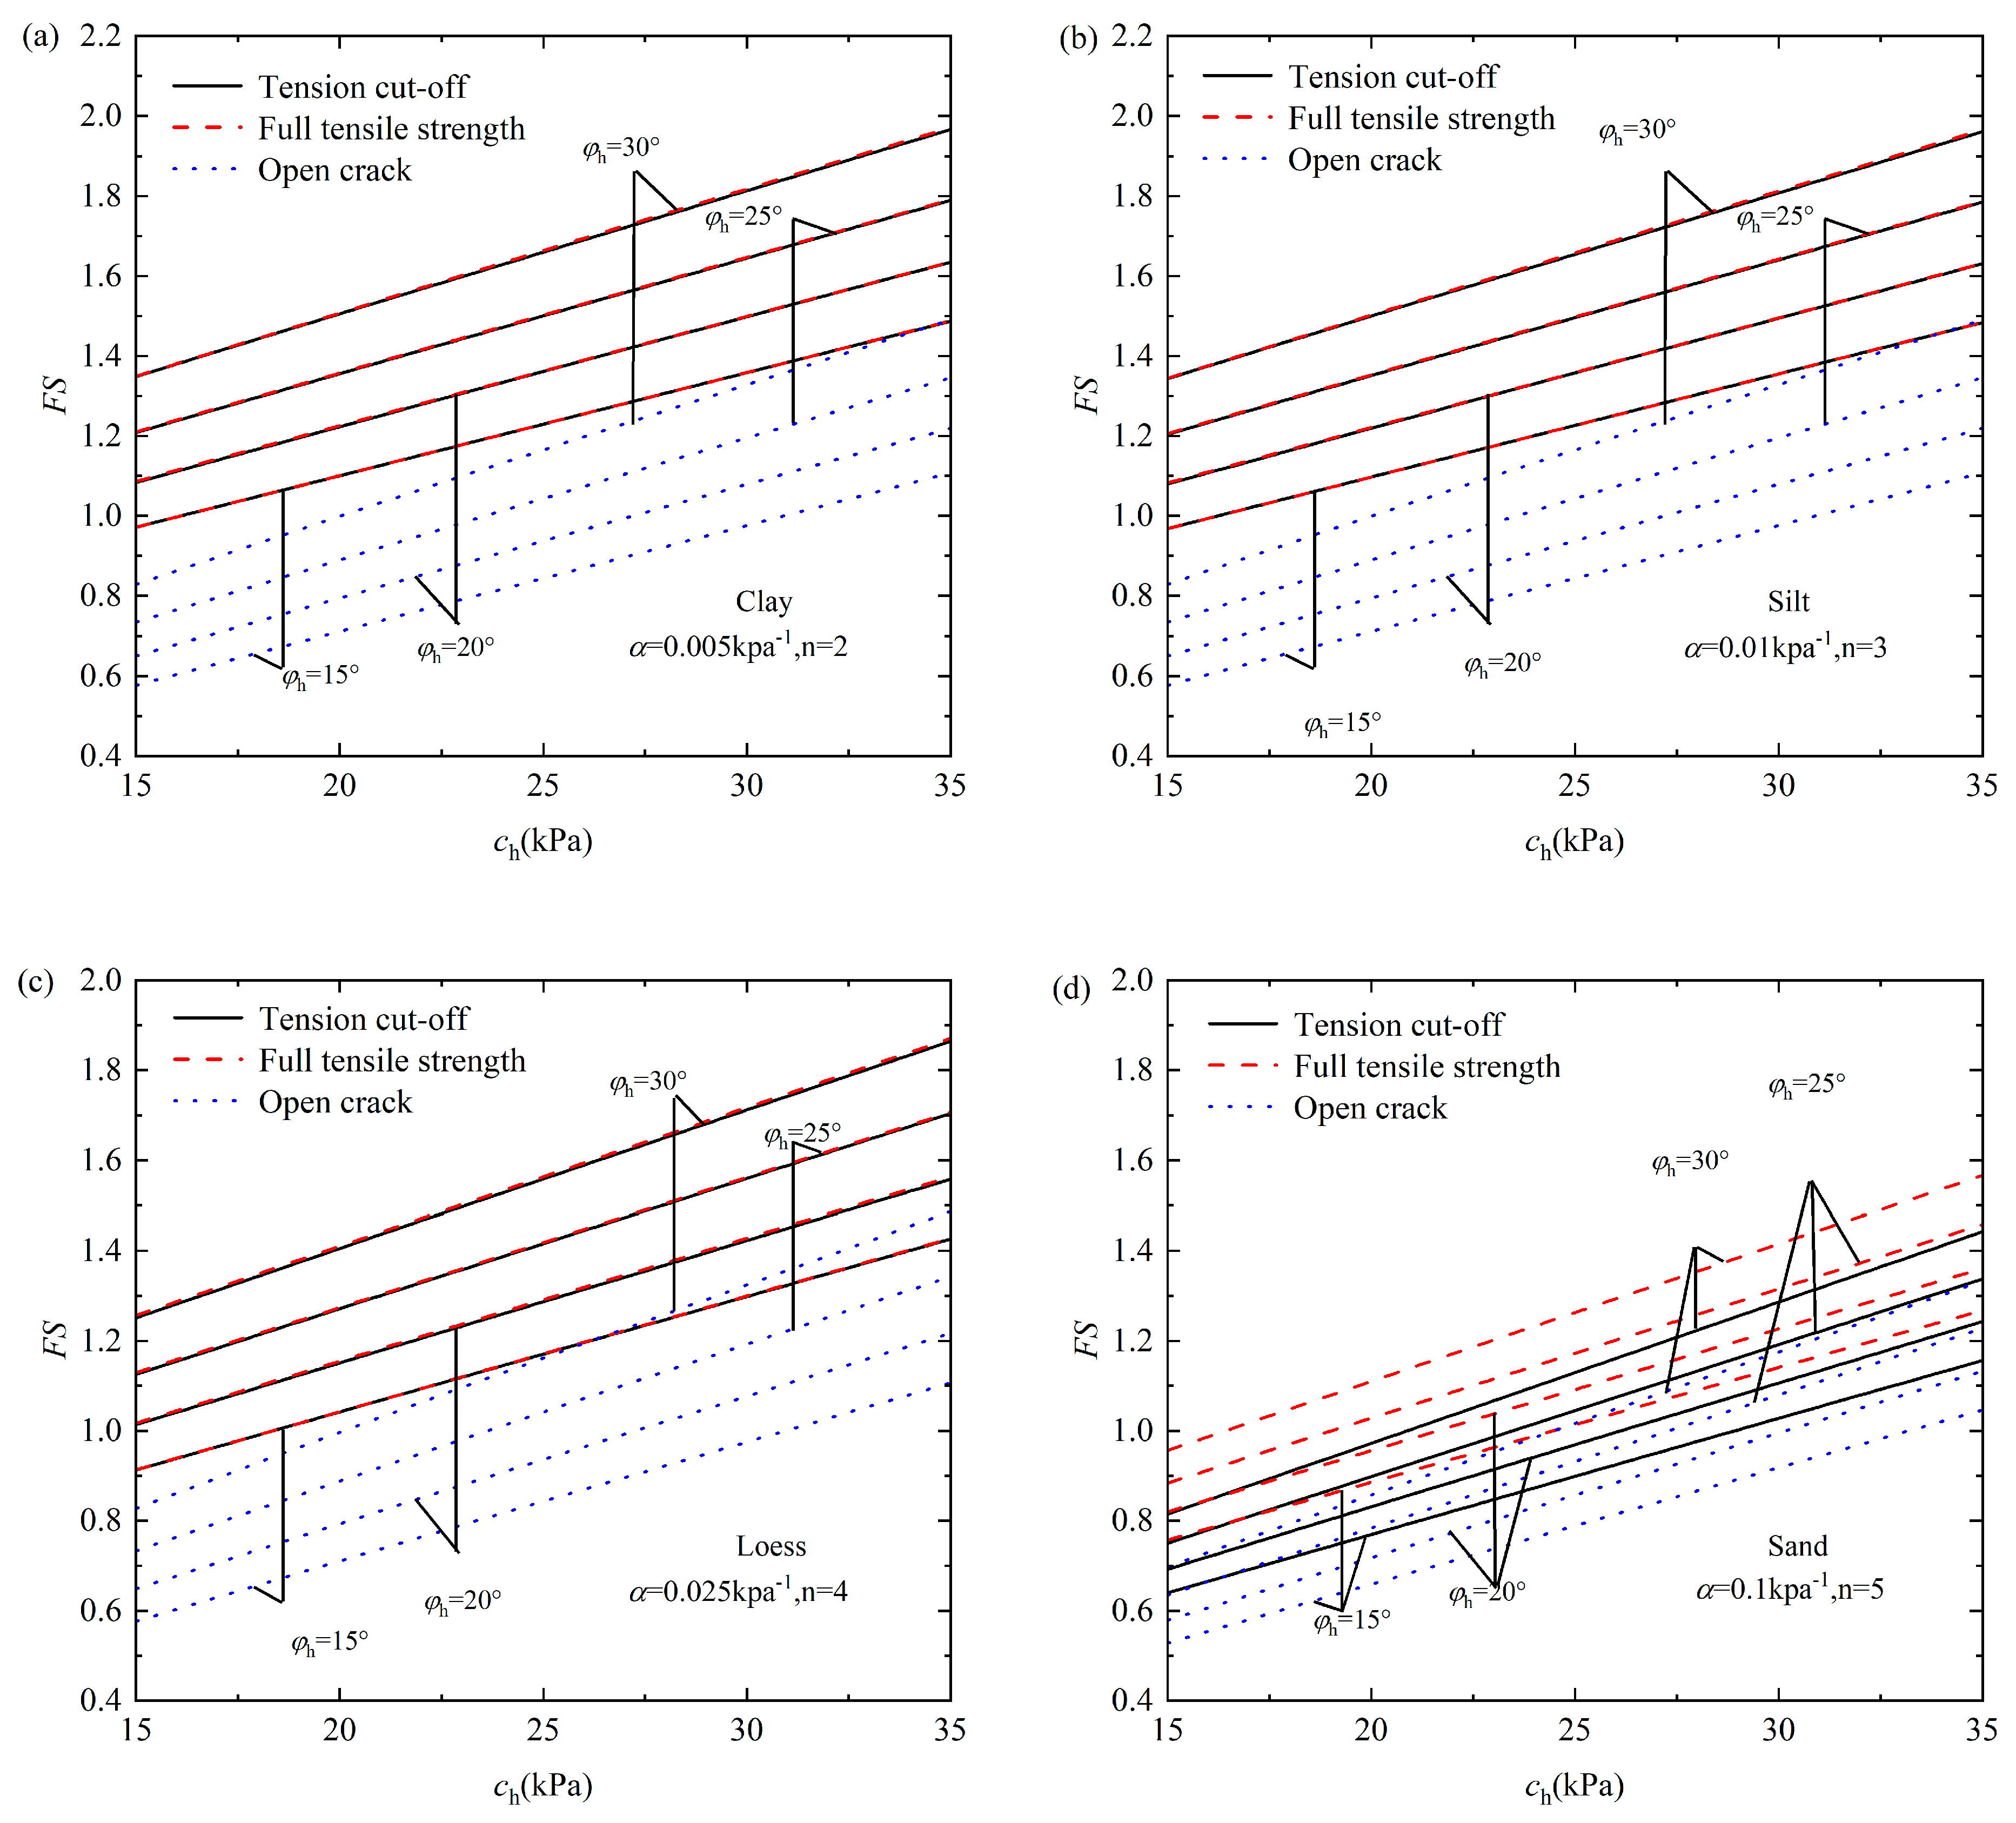
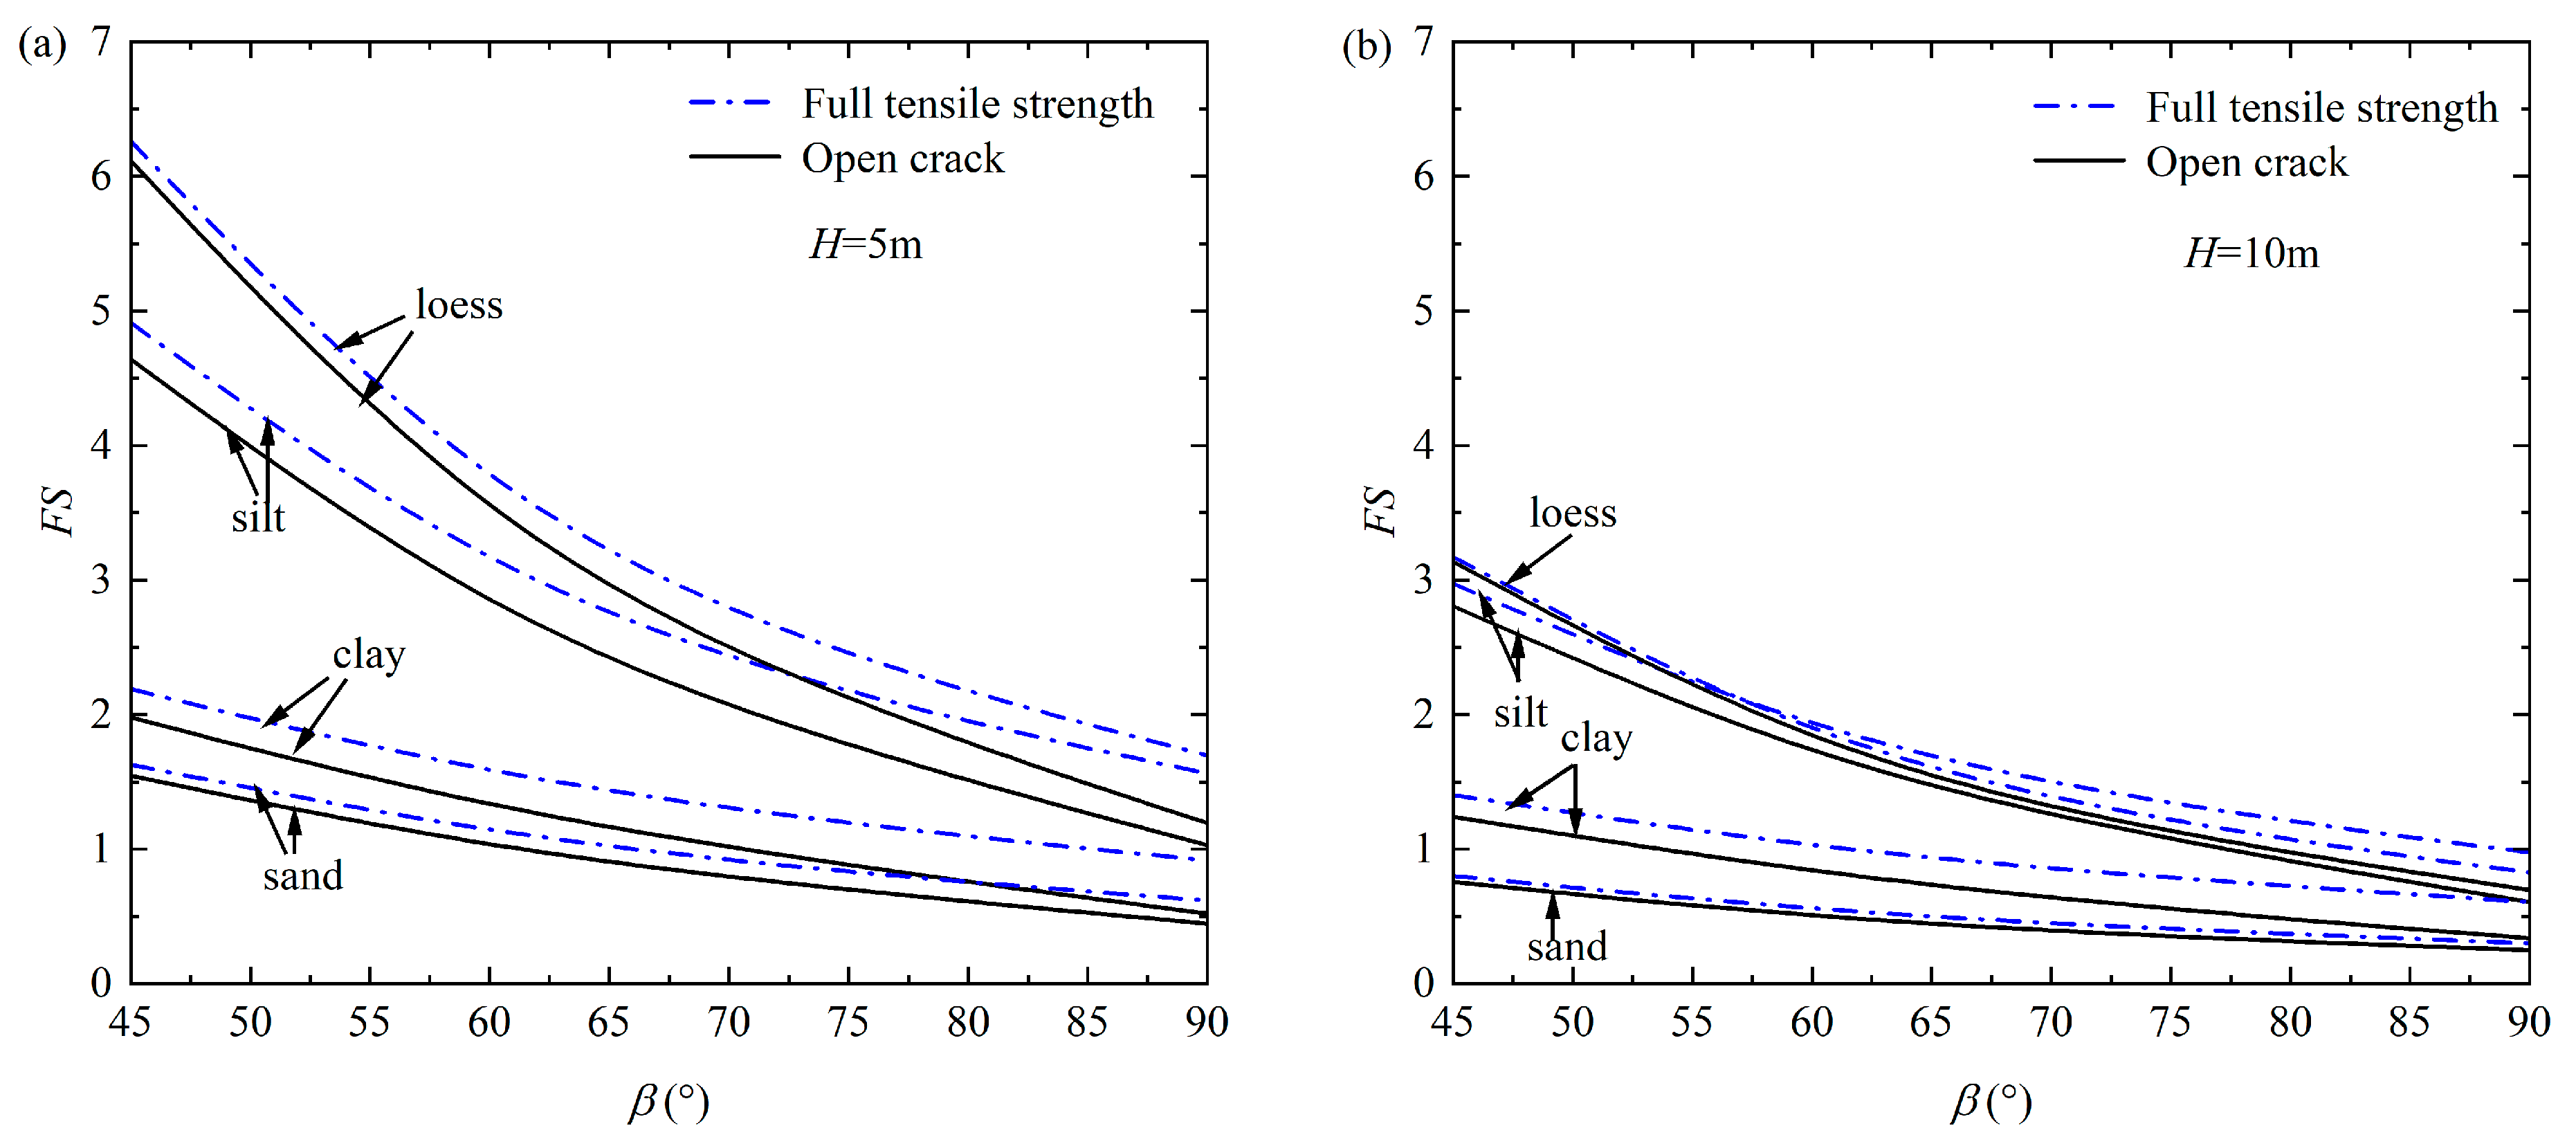
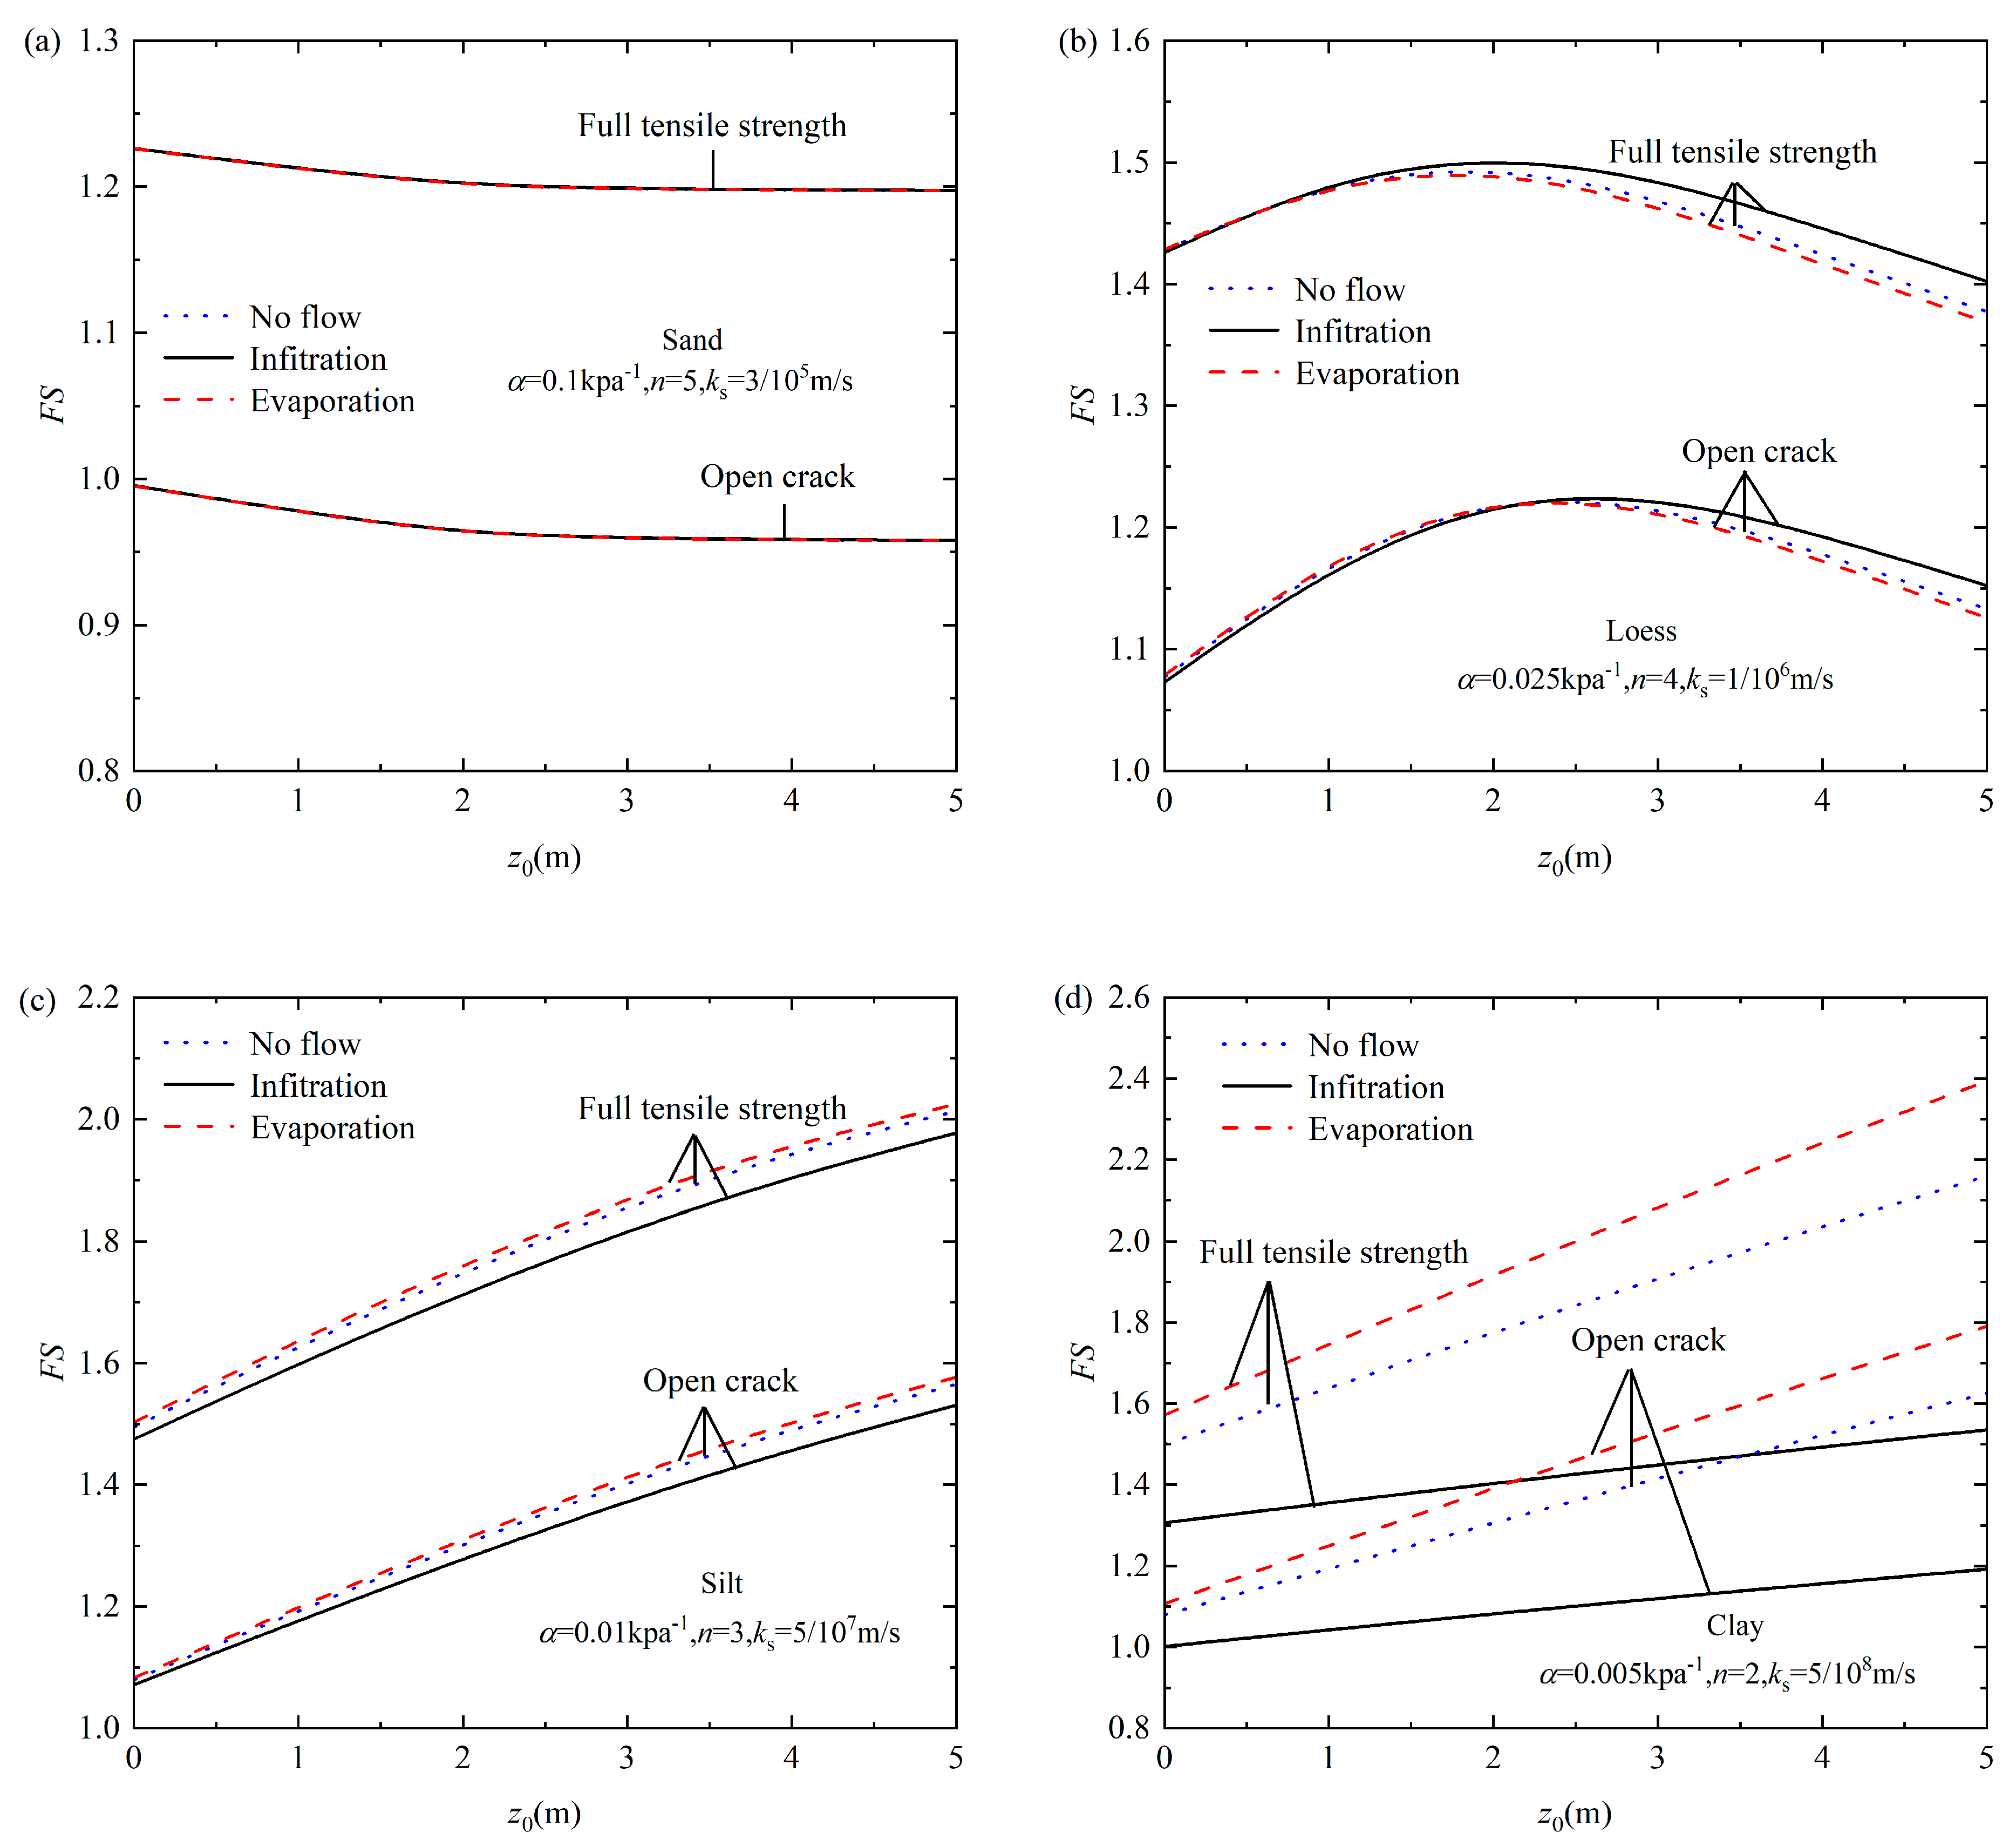
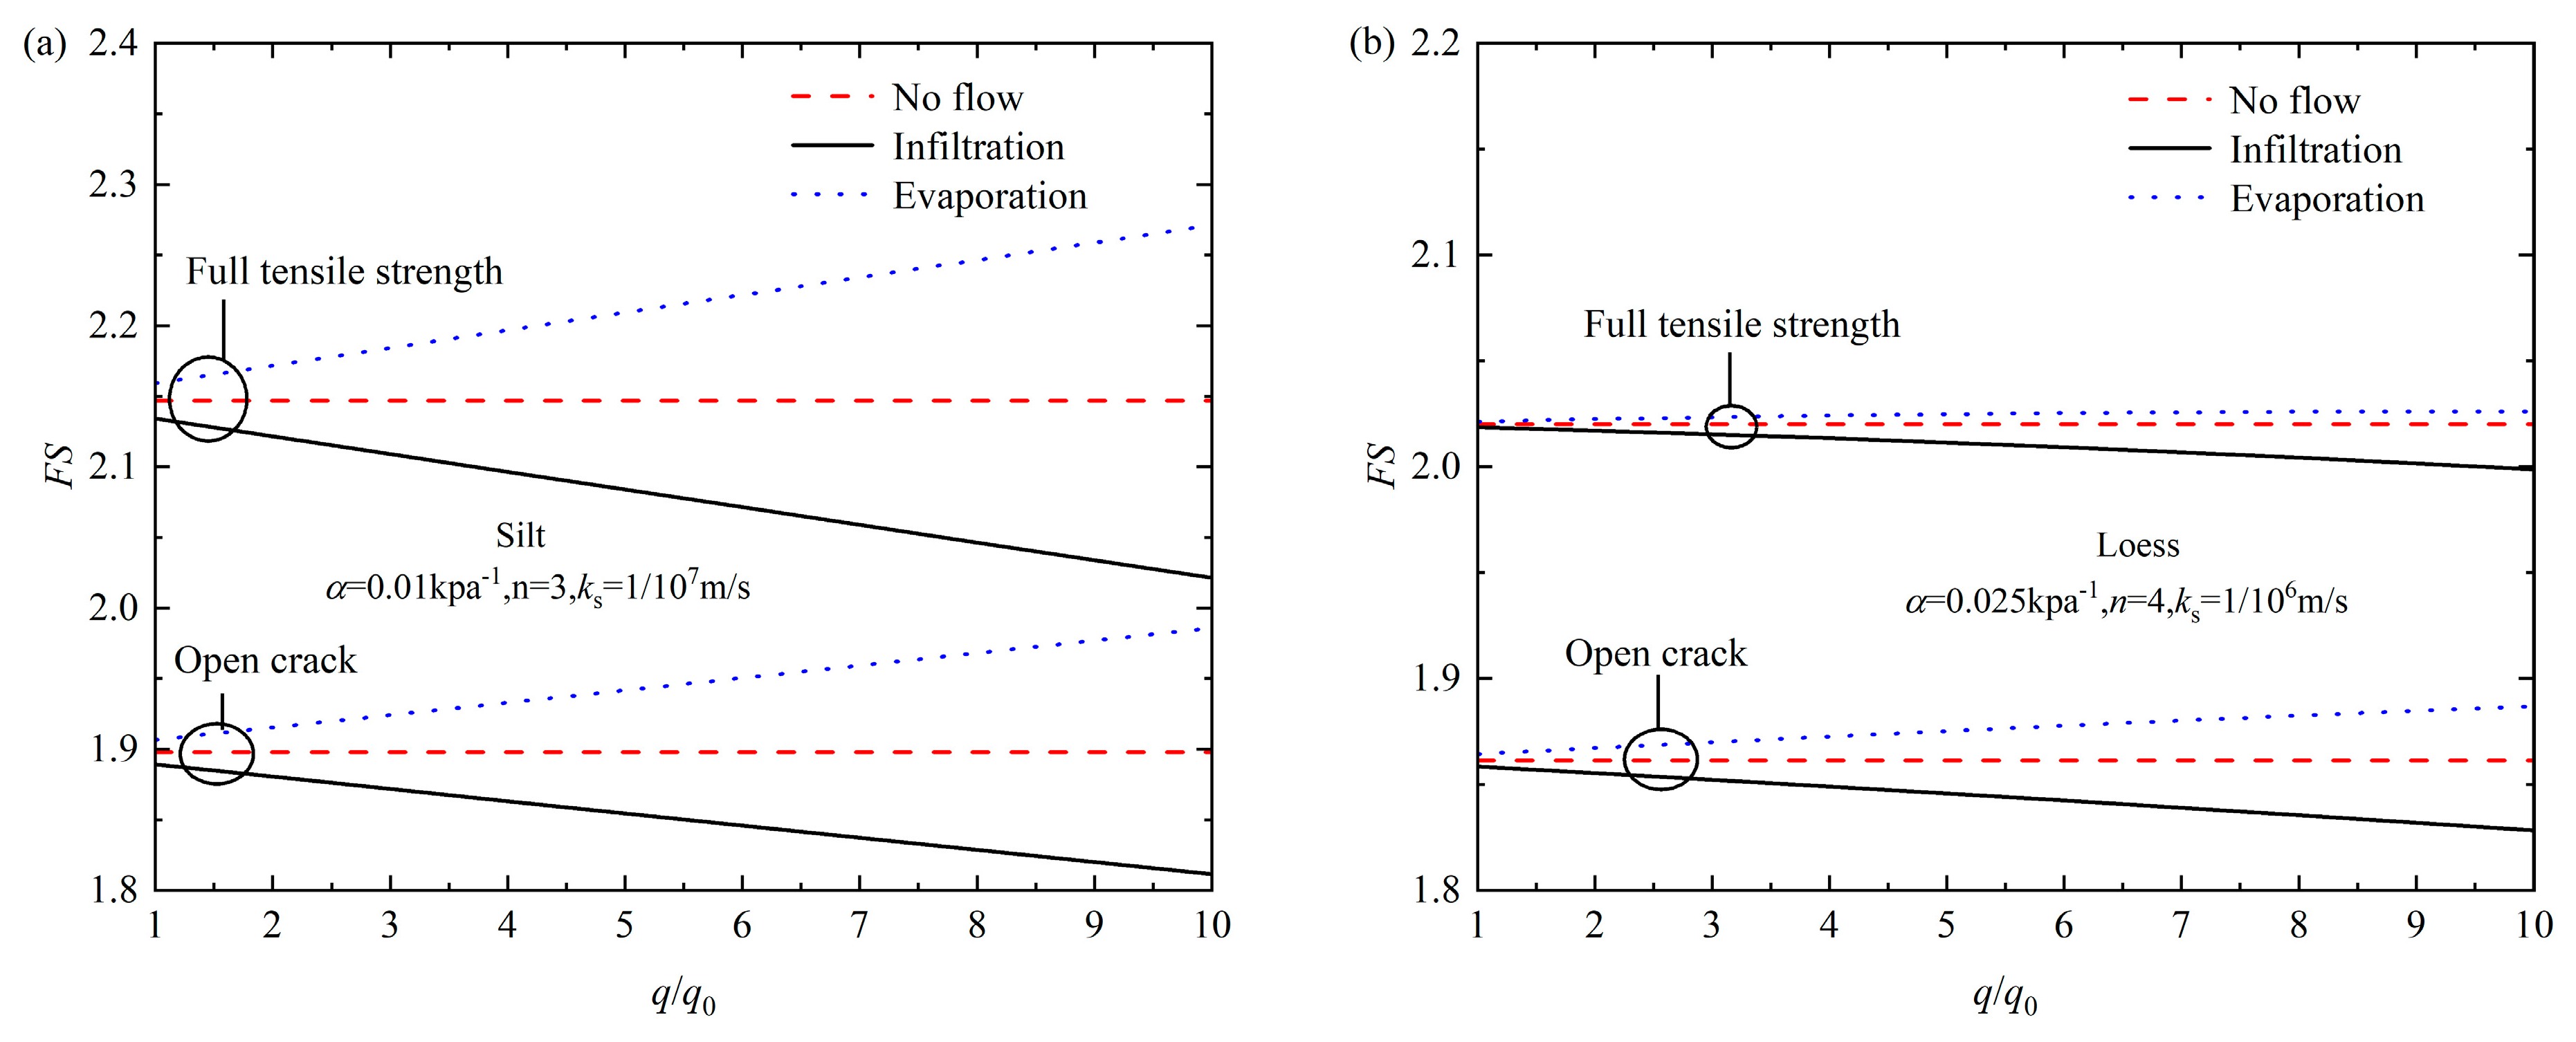
For the pre-existing crack, the work rate of suction stress and the internal energy dissipation along the crack are equal to zero. Therefore, two dimensionless functions f 1 and f 3 do not exist. By substituting the work items into the work–energy balance equation, the following expressions about the slope factor safety for the formation of a crack are captured:
F S = c 0 r 1 2 f 3 r 1 2 i = 1 N f 4 γ i = 1 N θ i θ i + 1 r s r ρ 2 cos θ   d ρ d θ + γ θ C θ A r s r ρ 2 cos θ   d ρ d θ + 1 / α r 1 2 f 1 + f 2
Letting the dimensionless function f 1 and f 3 be zero, one can obtain FS in the case of a pre-existing crack.
The following geometrical constraints should be followed to ensure that the failure mechanism is kinematically admissible:
s . t .       0 < θ 0 < θ C < θ h < π θ 0 θ B θ D < θ h ξ ξ max
Given a random setting of the optimized variables, the kinematic admissible mechanism is determined; based on Equation (29), one can obtain FS, among which the least results of FS will be the desired FS.

4. Parametric Study

Before parameter analysis, Table 3 lists the comparison results with the existing results by Michalowski [23]. Under the condition where unsaturated effects are not considered, substituting the critical slope height from Michalowski into the proposed model theoretically yields a safety factor value of 1. From Table 1, it is noted that the FS is close to 1, indicating that the proposed method is correct. Some minor discrepancies may arise due to differences in the algorithms employed. Based on the parameters c 1 = 10   kPa , γ = 20   kN / m 3 , φ 1 = 15 ° and μ = 0.5 , Figure 4, Figure 5, Figure 6 and Figure 7 investigated the influence of soil non-uniformity on the safety factor of slope under different unsaturated soil types.
Figure 4 illustrates the influence of the non-uniformity of effective internal friction angle and cohesion, as well as slope height, on the safety factor. In this context, higher values of c h and φ h indicate greater non-uniformity in cohesion and internal friction angle. From the results, it can be obviously seen that the FS increases as the increase in the non-uniformity of cohesion and internal friction angle. In the case of full tensile strength, the value of F S is highest, followed by the results considering the tension cut-off, with the smallest under open crack conditions. This is because there is no internal energy dissipation in the open crack, and the internal energy dissipation of full tension strength is obviously greater than that of tension cut-off. For different soil types, the impact of cracks and unsaturated conditions varies significantly. For clay, silt, and loess, the value of F S under tension cut-off and full strength conditions are very close. However, in sand, there is a noticeable decrease in F S after considering the tension cut-off. Also, the difference in F S under open crack conditions compared to the other two scenarios of sand is the smallest among the four types of soil. As c h increases for different types of soil, the spacing between curves under different crack types widens. Additionally, as the internal friction angle φ h increases, for the same crack conditions, the rate of increase in the curve with rising c h becomes greater.
Figure 5 illustrates the influence of the slope angle under the formation of a crack with full tension and open crack conditions on the safety factor. Owing to the values of F S for cracks with full tensile strength and tension cut-off being very close, only open cracks and formation cracks with full tension strength are considered. It can be precisely seen that the value of F S gradually decreases to a steady state as β increases for all types of soils. The changes in loess and silt are relatively pronounced, while those in clay and sand are more gradual. This trend suggests a higher risk of failure as the slope becomes steeper, especially in loess slopes and silt slopes. Under the full tensile strength condition, the value of F S is consistently higher than those under the open crack condition for each soil type. The difference in F S between the two conditions is less pronounced in soils such as loess and more marked in soils like sand. It is evident that an increase in H from 5 m to 10 m generally leads to a lower F S for the same soil type and condition. The degree of decline is also greater compared to the other two in loess and silt slopes. As β increases, the spacing between the curves under the same crack conditions becomes narrower. In soils with full tensile strength, this spacing is still larger than that in open crack conditions. Additionally, loess seems to maintain a relatively higher F S , which is more than 1 across a broader range of β regardless of the crack condition, suggesting better stability under tensile stress conditions compared to other soils.
Figure 6 presents the influence of the distance z 0 between the groundwater level and the bottom of the slope under full tensile crack and open crack conditions and different seepage conditions on the safety factor. The value of the F S increases as the z 0 increases for silt slope and clay slope and this trend is nearly linear in clay slopes, while this trend is the opposite for sand slopes. It exhibits a trend of first rising and then falling with the change in F S versus varying z 0 and the peak value occurs at different z 0 under the open crack and full tensile strength conditions. The influence of seepage, both infiltration and evaporation, does not significantly alter the value of the influence of seepage, both infiltration and evaporation, and does not significantly alter FS in sand slopes while the impact of seepage conditions is most significant in clay. This conclusion demonstrates that sand may supply a minimal hydrological response under unsaturated conditions, while clay is notably susceptible to moisture variations. The influence of seepage conditions on F S is consistent across three soil types, with infiltration slightly reducing F S and evaporation increasing it.
Figure 7 shows the influence of distance 1 / α under different n on the safety factor. The value decreases to a gradually constant state as the 1 / α increases with a given value of n . The variation in magnitude is relatively less pronounced when the value of n is either large or small. The interval between curves for different crack states decreases as 1 / α increases under the same conditions. The overall value of F S decreases as the slope height increases, and this interval also correspondingly reduces. This suggests that the sensitivity of F S is greatly influenced by slope height and that suction stress effects are more pronounced for a lower slope. When the value of n is high, the curves for the open crack condition increasingly approximate a horizontal line as 1 / α increases. This indicates that the impact of the unsaturated parameter n and 1 / α on F S varies the type of cracks.
Figure 8 depicts the influence of q / q 0 under the formation of a crack with full tensile strength and open crack conditions on the safety factor of silt slopes and loess slopes. It should be noted that the value of q 0 is equal to 1 × 10⁻⁸ m/s under evaporation and −1 × 10⁻⁸ m/s under infiltration while infinity under no flow condition. The purpose of the parameter setting is to simulate the impact of changes in flow rates during infiltration and evaporation. For the corresponding increase in flow rates, under evaporation conditions, the value of F S shows a linear increase, whereas under infiltration conditions, it exhibits a linear decrease. Meanwhile, in loess, these trends tend to be more gradual. For both types of soil, evaporation typically results in an increasing value of F S , while infiltration leads to a decrease. This indicates that an increase in moisture content generally lowers soil stability, whereas a reduction in moisture content has the opposite effect. Additionally, in silt slopes, as q / q 0 varies, the gap between the F S under open crack and full tensile strength conditions remains stable, suggesting that changes in flow rate do not affect F S in silt regardless of the presence of cracks. In loess, under evaporation conditions, the curve under intact conditions is similar to the no-flow condition and tends to be horizontal, indicating that the impact of flow rate on F S is minimal under evaporation. However, under open crack conditions in evaporation, the curve changes more noticeably with changing q / q 0 , and as q / q 0 increases, the gap between the F S under open crack and intact conditions gradually decreases. This shows that in specific evaporation conditions, the sensitivity of F S to q / q 0 in loess slopes is influenced by the presence of cracks.

5. Conclusions

This paper develops an analytical framework for evaluating the stability of unsaturated slopes by incorporating the coupled effects of matric suction, spatially variable strength parameters, and multiple types of cracks under steady seepage conditions. A closed-form equation is adopted to estimate the suction stress. Two types of cracks including the open crack and forming crack are included in the analysis. On the basis of a kinematically admissible failure mechanism including vertical cracks, the rate of work enacted by external forces and the rate of energy dissipated within the system are calculated. The influence of heterogeneity in cohesion and internal friction angle with depth is fully integrated into the failure mechanism. This study extends previous works by coupling suction-induced strength enhancement with spatial variability in material parameters and explicitly modeling crack geometry in the failure surface.
A numerical study is performed across a range of geometric and unsaturated parameters, and the results are presented in graphical form to guide engineering practice. Based on the analysis, the following conclusions can be drawn.
(1) The values of safety factors are highly dependent on the soil properties and slope geometries. The increase in the slope’s height and angle will reduce the stability of the slope. Meanwhile, the increase in the non-uniformity of cohesion and friction angle both play a positive role in the stability of the slope. The increase in friction angle from 15° to 30° can lead to an increase in the safety factor within the range of approximately 0.7–0.8. The FS increases as the increase in the non-uniformity of cohesion and internal friction angle.
(2) The crack types have significant effects on the stability of the slope. The safety factor under open crack conditions is always greater than that for forming cracks. In addition, the influence of unsaturated soil parameters on slope stability exhibits different behavioral patterns depending on the presence and type of cracks. Moreover, the factor of safety becomes more sensitive to variations in slope geometry in the presence of forming cracks.
(3) The coupled influence of crack conditions and unsaturated soil parameters on slope stability varies across different soil types. For instance, the response to changes in groundwater table depth differs depending on the soil properties. In the case of loess, the critical groundwater level—at which the factor of safety reaches its peak—differs between the forming crack and open crack conditions. Additionally, under varying flow velocities, loess exhibits differences in the factor of safety between crack types only under evaporation conditions. Under different seepage conditions, the stability results of clay slopes exhibit significant differences. When a groundwater table is present, conservative estimates must be made during construction design.

Author Contributions

Conceptualization and methodology, J.D.; software, validation, and analysis, J.Z.; investigation and discussion, J.D. and J.Z.; resources, J.Z.; writing—review and editing, Y.Z., Y.W. and Y.C.; supervision and project administration, J.D. All authors have read and agreed to the published version of the manuscript.

Funding

The research was supported by the Refined Investigation Pilot Project in Henan Province (Lingbao City, Huixian City).

Data Availability Statement

Data will be made available on request.

Conflicts of Interest

The authors declare no conflicts of interest.

Appendix A. Calculation of Maximum Depth of Cracks

The maximum depth of cracks considering the unsaturated effect can be obtained from the energy equilibrium equation, which is presented as
W γ + W σ s = D
where W γ is the work rate due to the soil self-weight of region A-B-C, W σ s is the work rate due to σ s , and D is the rate of internal energy dissipated along the sliding surface AC.
The external work rate due to the soil self-weight of the region A-B-C has been calculated in the previous section, which can be expressed as
W γ = ω γ r h 3 g 1 g 2 g 3
where g 1 g 3 are dimensionless functions given below.
g 1 = 1 3 1 + 9 tan 2 φ 0 3 tan φ 0 cos θ C + sin θ C e 3 θ h θ C tan φ 0 + 3 tan φ 0 cos θ h sin θ h
g 2 = 1 6 L L r h 2 cos θ h + L L r h sin θ h
g 3 = 1 3 ξ c H r h cos 2 θ C e 2 θ h θ C tan φ 0
The work rate of the suction stress σ s on log-spiral AC can be calculated by
W σ s = S AC σ s v n d S AC = ω 1 / α r h 2 g 4
where g 4 is a dimensionless function, which can be expressed as follows
g 4 = tan φ 0 θ C θ h ln 1 + q k s e γ w α z q k s 1 + ln 1 + q k s e γ w α z q k s n n 1 / n e 2 θ θ C tan φ 0 d θ
In Equation (A4), z is calculated by
z = r C sin θ C r C e θ θ C tan φ 0 sin θ + z 0 + 1 ξ max H
The rate of internal energy dissipated along the sliding surface AC can be calculated as
D = S AC c 0 v cos φ 0 d S AC = ω c 0 r h 2 g 5
where g 5 is a dimensionless function given as follows
g 5 = 1 2 tan φ 0 e 2 θ h θ C tan φ 0 1

Appendix B. Some Equations

The following dimensionless equations originating from the calculations of internal energy dissipation rate and external work rate are provided, which are
f 1 = r C 2 cos 2 θ C θ C θ B ln 1 + q k s e γ w α z q k s 1 + ln 1 + q k s e γ w α z q k s n n 1 / n sin θ cos 3 θ d θ
In Equation (A11), z can be calculated from following expression
z = r 1 sin θ 1 r C cos θ C tan θ + z 0             θ C θ < θ B
where z0 is the vertical distance from the groundwater table to the slope toe, as shown in Figure 2; the polar radius of point C reads
r C = r 1 e δ k = 1 N tan φ k
f 2 = i = 1 N tan φ i θ i θ i + 1 ln 1 + q k s e γ w α z q k s 1 + ln 1 + q k s e γ w α z q k s n n 1 / n r i 2 e 2 θ θ i tan φ i d θ
In Equation (A14), z can be calculated from following expression
z = r 1 sin θ 1 r i e θ θ i tan φ i sin θ + z 0             θ 1 θ θ C
where ri is the polar radius of the ith discretized point, reads
r i = r 1 e δ k = 1 i 1 tan φ k
f 3 = e 2 δ k = 1 N tan φ k cos θ C 2 cos φ 0 1 sin φ 0 θ C θ B 1 sin θ cos 3 θ d θ + 2 μ cos φ 0 θ C θ B sin θ sin φ 0 cos 3 θ d θ
f 4 = c i 2 tan φ i e 2 δ k = 1 i 1 tan φ k e 2 δ tan φ i 1

References

  1. Matsui, T.; San, K.C. Finite element slope stability analysis by shear strength reduction technique. Soils Found. 1992, 32, 59–70. [Google Scholar] [CrossRef]
  2. Zheng, H.; Tham, L.G.; Liu, D. On two definitions of the factor of safety commonly used in the finite element slope stability analysis. Comput. Geotech. 2006, 33, 188–195. [Google Scholar] [CrossRef]
  3. Alkasawneh, W.; Malkawi, A.I.H.; Nusairat, J.H. A comparative study of various commercially available programs in slope stability analysis. Comput. Geotech. 2008, 35, 428–435. [Google Scholar] [CrossRef]
  4. Yang, X.L.; Li, L.; Yin, J.H. Seismic and static stability analysis for rock slopes by a kinematical approach. Geotechnique 2004, 54, 543–549. [Google Scholar] [CrossRef]
  5. Yang, X.L.; Huang, F. Collapse mechanism of shallow tunnel based on nonlinear Hoek-Brown failure criterion. Tunn. Undergr. Space Technol. 2011, 26, 686–691. [Google Scholar] [CrossRef]
  6. Sloan, S.W. Geotechnical stability analysis. Géotechnique 2003, 63, 531–571. [Google Scholar] [CrossRef]
  7. Yang, X.L.; Du, D.C. Upper bound analysis for bearing capacity of nonhomogeneous and anisotropic clay foundation. KSCE J. Civ. Eng. 2016, 20, 2702–2710. [Google Scholar] [CrossRef]
  8. Pan, Q.; Dias, D. Upper-bound analysis on the face stability of a non-circular tunnel. Tunn. Undergr. Space Technol. 2017, 62, 96–102. [Google Scholar] [CrossRef]
  9. Sorbino, G.; Nicotera, M.V. Unsaturated soil mechanics in rainfall-induced flow landslides. Eng. Geol. 2013, 165, 105–132. [Google Scholar] [CrossRef]
  10. Fredlund, D.G.; Morgenstern, N.R.; Widger, R.A. The shear strength of unsaturated soils. Can. Geotech. J. 1978, 15, 313–321. [Google Scholar] [CrossRef]
  11. Fredlund, D.G.; Xing, A.; Fredlund, M.D.; Barbour, S.L. The relationship of the unsaturated soil shear to the soil-water characteristic curve. Can. Geotech. J. 1996, 33, 440–448. [Google Scholar] [CrossRef]
  12. Li, Z.W.; Yang, X.L. Three-dimensional active earth pressure for retaining structures in soils subjected to steady unsaturated seepage effects. Acta Geotech. 2020, 15, 2017–2029. [Google Scholar] [CrossRef]
  13. Vo, T.; Russell, A.R. Slip line theory applied to a retaining wall–unsaturated soil interaction problem. Comput. Geotech. 2014, 55, 416–428. [Google Scholar] [CrossRef]
  14. Vahedifard, F.; Leshchinsky, B.A.; Mortezaei, K. Active earth pressures for unsaturated retaining structures. J. Geotech. Geoenviron. 2015, 141, 04015048. [Google Scholar] [CrossRef]
  15. Li, Z.W.; Yang, X.L.; Li, T.Z. Face stability analysis of tunnels under steady unsaturated seepage conditions. Tunn. Undergr. Space Technol. 2017, 93, 103095. [Google Scholar] [CrossRef]
  16. Li, T.Z.; Dias, D.; Li, Z.W. Failure potential of a circular tunnel face under steady-state unsaturated flow condition. Comput. Geotech. 2020, 117, 103231. [Google Scholar] [CrossRef]
  17. Wu, H.; Liao, H.; Wu, C. Stability of 3D tunnel face under steady unsaturated seepage coupled multi-layer soil suction head distributions. Alex. Eng. J. 2025, 117, 609–623. [Google Scholar] [CrossRef]
  18. Zhang, G.R.; Qian, Y.J.; Wang, Z.C.; Zhao, B. Analysis of rainfall infiltration law in unsaturated soil slope. Sci. World J. 2014, 2014, 567250. [Google Scholar] [CrossRef]
  19. Huang, W.; Leong, E.C.; Rahardjo, H. Upper-bound limit analysis of unsaturated soil slopes under rainfall. J. Geotech. Geoenviron. 2018, 144, 04018066. [Google Scholar] [CrossRef]
  20. Tang, G.; Huang, J.; Sheng, D.; Sloan, S.W. Stability analysis of unsaturated soil slopes under random rainfall patterns. Eng. Geol. 2018, 245, 322–332. [Google Scholar] [CrossRef]
  21. Meyerhof, G.G. The ultimate bearing capacity of foundations on slopes. Int. Conf. Soil Mech. Found. Eng. 1957, 1, 384–386. [Google Scholar]
  22. Utili, S. Investigation by limit analysis on the stability of slopes with cracks. Geotechnique 2013, 63, 140–154. [Google Scholar] [CrossRef]
  23. Michalowski, R.L. Stability assessment of slopes with cracks using limit analysis. Can. Geotech. J. 2013, 50, 1011–1021. [Google Scholar] [CrossRef]
  24. Li, Y.X.; Yang, X.L. Stability analysis of crack slope considering nonlinearity and water pressure. KSCE J. Civ. Eng. 2016, 20, 2289–2296. [Google Scholar] [CrossRef]
  25. Yang, X.L.; Zhang, S. Stability analysis of 3D cracked slope reinforced with piles. Comput. Geotech. 2020, 122, 103544. [Google Scholar] [CrossRef]
  26. Rao, P.; Wu, J.; Chen, Q.; Nimbalkar, S. Three-dimensional assessment of cracked slopes with pore water pressure using limit analysis. Environ. Earth Sci. 2021, 80, 645. [Google Scholar] [CrossRef]
  27. Li, Z.W.; Yang, X.L. Active earth pressure for soils with tension cracks under steady unsaturated flow conditions. Can. Geotech. J. 2018, 55, 1850–1859. [Google Scholar] [CrossRef]
  28. Li, T.Z.; Yang, X.L. Three-dimensional face stability of shallow-buried tunnels with tensile strength cut-off. Comput. Geotech. 2019, 110, 82–93. [Google Scholar] [CrossRef]
  29. Li, T.Z.; Yang, X.L. Stability of plane strain tunnel headings in soils with tensile strength cut-off. Tunn. Undergr. Space Technol. 2020, 95, 103138. [Google Scholar] [CrossRef]
  30. Hou, C.T.; Yang, X.L. Seismic stability of 3D tunnel face considering tensile strength cut-off. KSCE J. Civ. Eng. 2020, 24, 2232–2243. [Google Scholar] [CrossRef]
  31. Qin, C.; Chian, S.C. Bearing capacity analysis of a saturated non-uniform soil slope with discretization-based kinematic analysis. Comput. Geotech. 2018, 96, 246–257. [Google Scholar] [CrossRef]
  32. Sun, Z.; Shu, X.; Dias, D. Stability analysis for nonhomogeneous slopes subjected to water drawdown. J. Cent. South Univ. 2019, 26, 1719–1734. [Google Scholar] [CrossRef]
  33. Guardiani, C.; Enrico, S.; Wu, W. Time-dependent reliability analysis of unsaturated slopes under rapid drawdown with intelligent surrogate models. Acta Geotech. 2022, 17, 1071–1096. [Google Scholar] [CrossRef]
  34. Waris, K.A.; Basha, B.M.; Alluri, H.R.; Munwar, B. Pseudo-static slope stability analysis using explainable machine learning techniques. Nat. Hazards. 2025, 121, 485–517. [Google Scholar] [CrossRef]
  35. Waris, K.A.; Basha, B.M. Detection and prediction of slope stability in unsaturated finite slopes using interpretable machine learning. Model. Earth Syst. Environ. 2025, 11, 273. [Google Scholar] [CrossRef]
  36. Asgari, A.; Bagheripour, M.H.; Mollazadeh, M. A generalized analytical solution for a nonlinear infiltration equation using the exp-function method. Sci. Iran. 2011, 18, 28–35. [Google Scholar] [CrossRef]
  37. Lu, N.; Likos, W.J. Suction stress characteristic curve for unsaturated soil. J. Geotech. Geoenviron. 2006, 132, 131–142. [Google Scholar] [CrossRef]
  38. Lu, N.; Godt, J.W.; Wu, D.T. A closed-form equation for effective stress in unsaturated soil. Water Resour. Res. 2010, 46, 567–573. [Google Scholar] [CrossRef]
  39. Vahedifard, F.; Leshchinsky, D.; Mortezaei, K.; Lu, N. Effective stress-based limit equilibrium analysis for homogeneous unsaturated slopes. Int. J. Geomech. 2016, 16, D4016003. [Google Scholar] [CrossRef]
  40. Griffiths, D.V.; Lu, N. Unsaturated slope stability analysis with steady infiltration or evaporation using elasto-plastic finite elements. Int. J. Numer. Anal. Methods 2005, 29, 249–267. [Google Scholar] [CrossRef]
  41. Chen, W.F. Limit Analysis and Soil Plasticity; Elsevier: Amsterdam, The Netherlands, 1957. [Google Scholar]
  42. Donald, I.B.; Chen, Z. Slope stability analysis by the upper bound approach: Fundamentals and methods. Can. Geotech. J. 1997, 34, 853–862. [Google Scholar] [CrossRef]
  43. Yang, X.L. Upper bound limit analysis of active earth pressure with different fracture surface and nonlinear yield criterion. Theor. Appl. Fract. Mech. 2007, 47, 46–56. [Google Scholar] [CrossRef]
  44. Pan, Q.; Dias, D. The effect of pore water pressure on tunnel face stability. Int. J. Numer. Anal. Methods 2016, 40, 2123–2136. [Google Scholar] [CrossRef]
  45. Abd, A.; Utili, S. Design of geosynthetic-reinforced slopes in cohesive backfills. Geotext. Geomembr. 2017, 45, 627–641. [Google Scholar] [CrossRef]
Figure 1. Kinematic mechanism of nonuniform slope with crack.
Buildings 15 02123 g001
Figure 2. Spatially discretized failure mechanism of nonuniform slope with crack.
Buildings 15 02123 g002
Figure 3. Tension cutoff of the linear Mohr–Coulomb strength envelope.
Buildings 15 02123 g003
Figure 4. F S versus c h for different φ h values with H = 5   m , z 0 = 0   m , β = 90 ° and q = 0 : (a) clay, (b) silt, (c) loess, and (d) sand.
Buildings 15 02123 g004
Figure 5. F S versus β for different H values with c h = 20   kPa , z 0 = 0   m , φ h = 25 ° and q = 0 of four types of soils: (a) H = 5   m (b) H = 10   m .
Buildings 15 02123 g005
Figure 6. F S versus z 0 under different seepage conditions with H = 5   m , c h = 20   kPa , β = 90 ° , φ h = 25 ° of four types of soils: (a) clay, (b) silt, (c) loess, and (d) sand.
Buildings 15 02123 g006
Figure 7. F S versus 1 / α for different n values with c h = 20   kPa , z 0 = 0   m , φ h = 25 ° and q = 0 of four types of soils: (a) H = 5   m (b) H = 10   m .
Buildings 15 02123 g007
Figure 8. F S versus q / q 0 for different seepage conditions with c h = 20   kPa , z 0 = 0   m , φ h = 25 ° , H = 5   m and β = 60 ° of four types of soils: (a) silt (b) loess.
Buildings 15 02123 g008
Table 1. Hydrological and shear strength parameters of four typical soils (Vaheadifard et al. [14,39]).
Soil Typeα (kPa−1)nks (m/s)c/γDφ(°)
Sand0.153 × 10−5030
Loess0.02541 × 10−60.00128
Silt0.0135 × 10−70.0325
Clay0.00525 × 10−80.0530
Table 2. Typical flow velocities under three steady-state unsaturated flow conditions (Lu and Likos [36]).
Flow Stateq (mm/day)q (m/s)
High infiltration−2.73−3.14 × 10⁻⁸
No flow00
High evaporation1.001.15 × 10−8
Table 3. FS Comparison with the results of Michalowski [23].
Critical Height by Michalowski [23]Safety Factor by This Work
Open CrackTensile Cut-OffOpen CrackTensile Cut-Off
φ = 10 ° , β = 45 ° 8.5249.1211.0021.001
φ = 20 ° , β = 45 ° 15.28315.9061.0041.002
φ = 10 ° , β = 60 ° 6.2336.9711.0051.007
φ = 20 ° , β = 60 ° 9.21210.0731.0061.008
Disclaimer/Publisher’s Note: The statements, opinions and data contained in all publications are solely those of the individual author(s) and contributor(s) and not of MDPI and/or the editor(s). MDPI and/or the editor(s) disclaim responsibility for any injury to people or property resulting from any ideas, methods, instructions or products referred to in the content.

