


Employing Neural Networks, Fuzzy Logic, and Weibull Analysis for the Evaluation of Recycled Brick Powder in Concrete Compositions

 ,
, 
 ,
,  and
and
Abstract
1. Introduction
1.1. Research Background
1.2. Artificial Neural Networks (ANN), Fuzzy Logic (FL), and Weibull Distribution
1.3. Significance of the Research
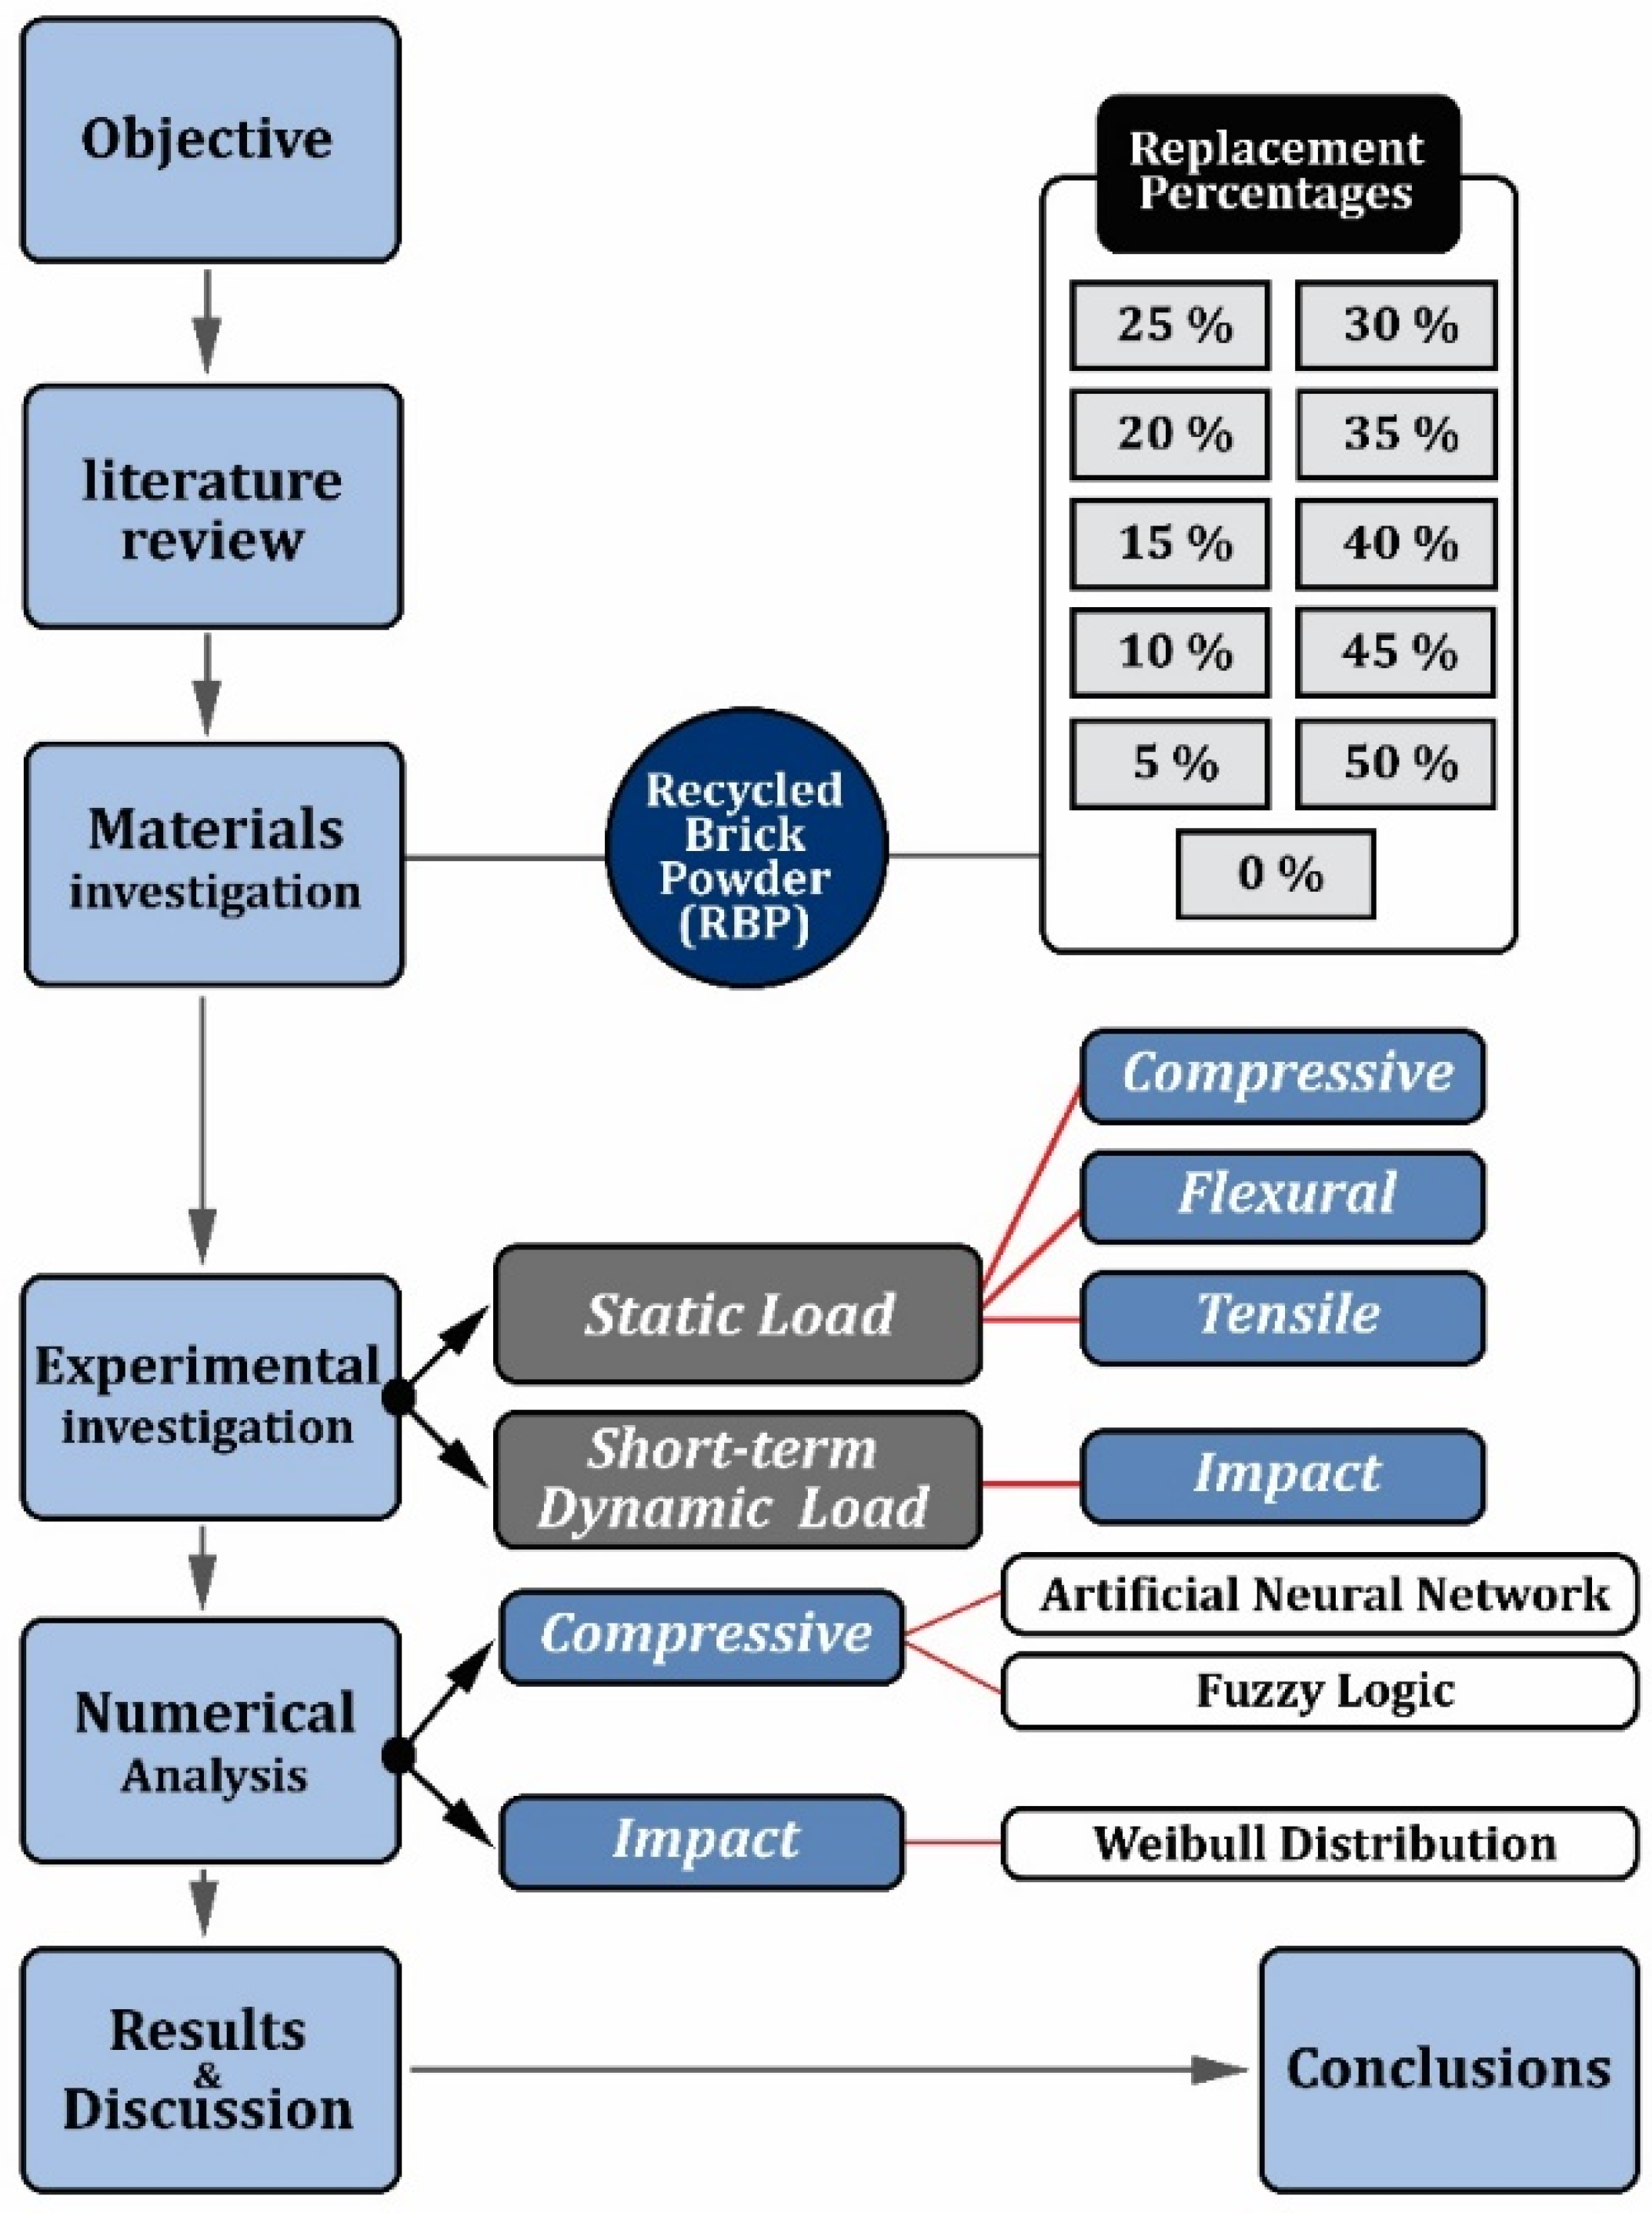
2. Experimental Program
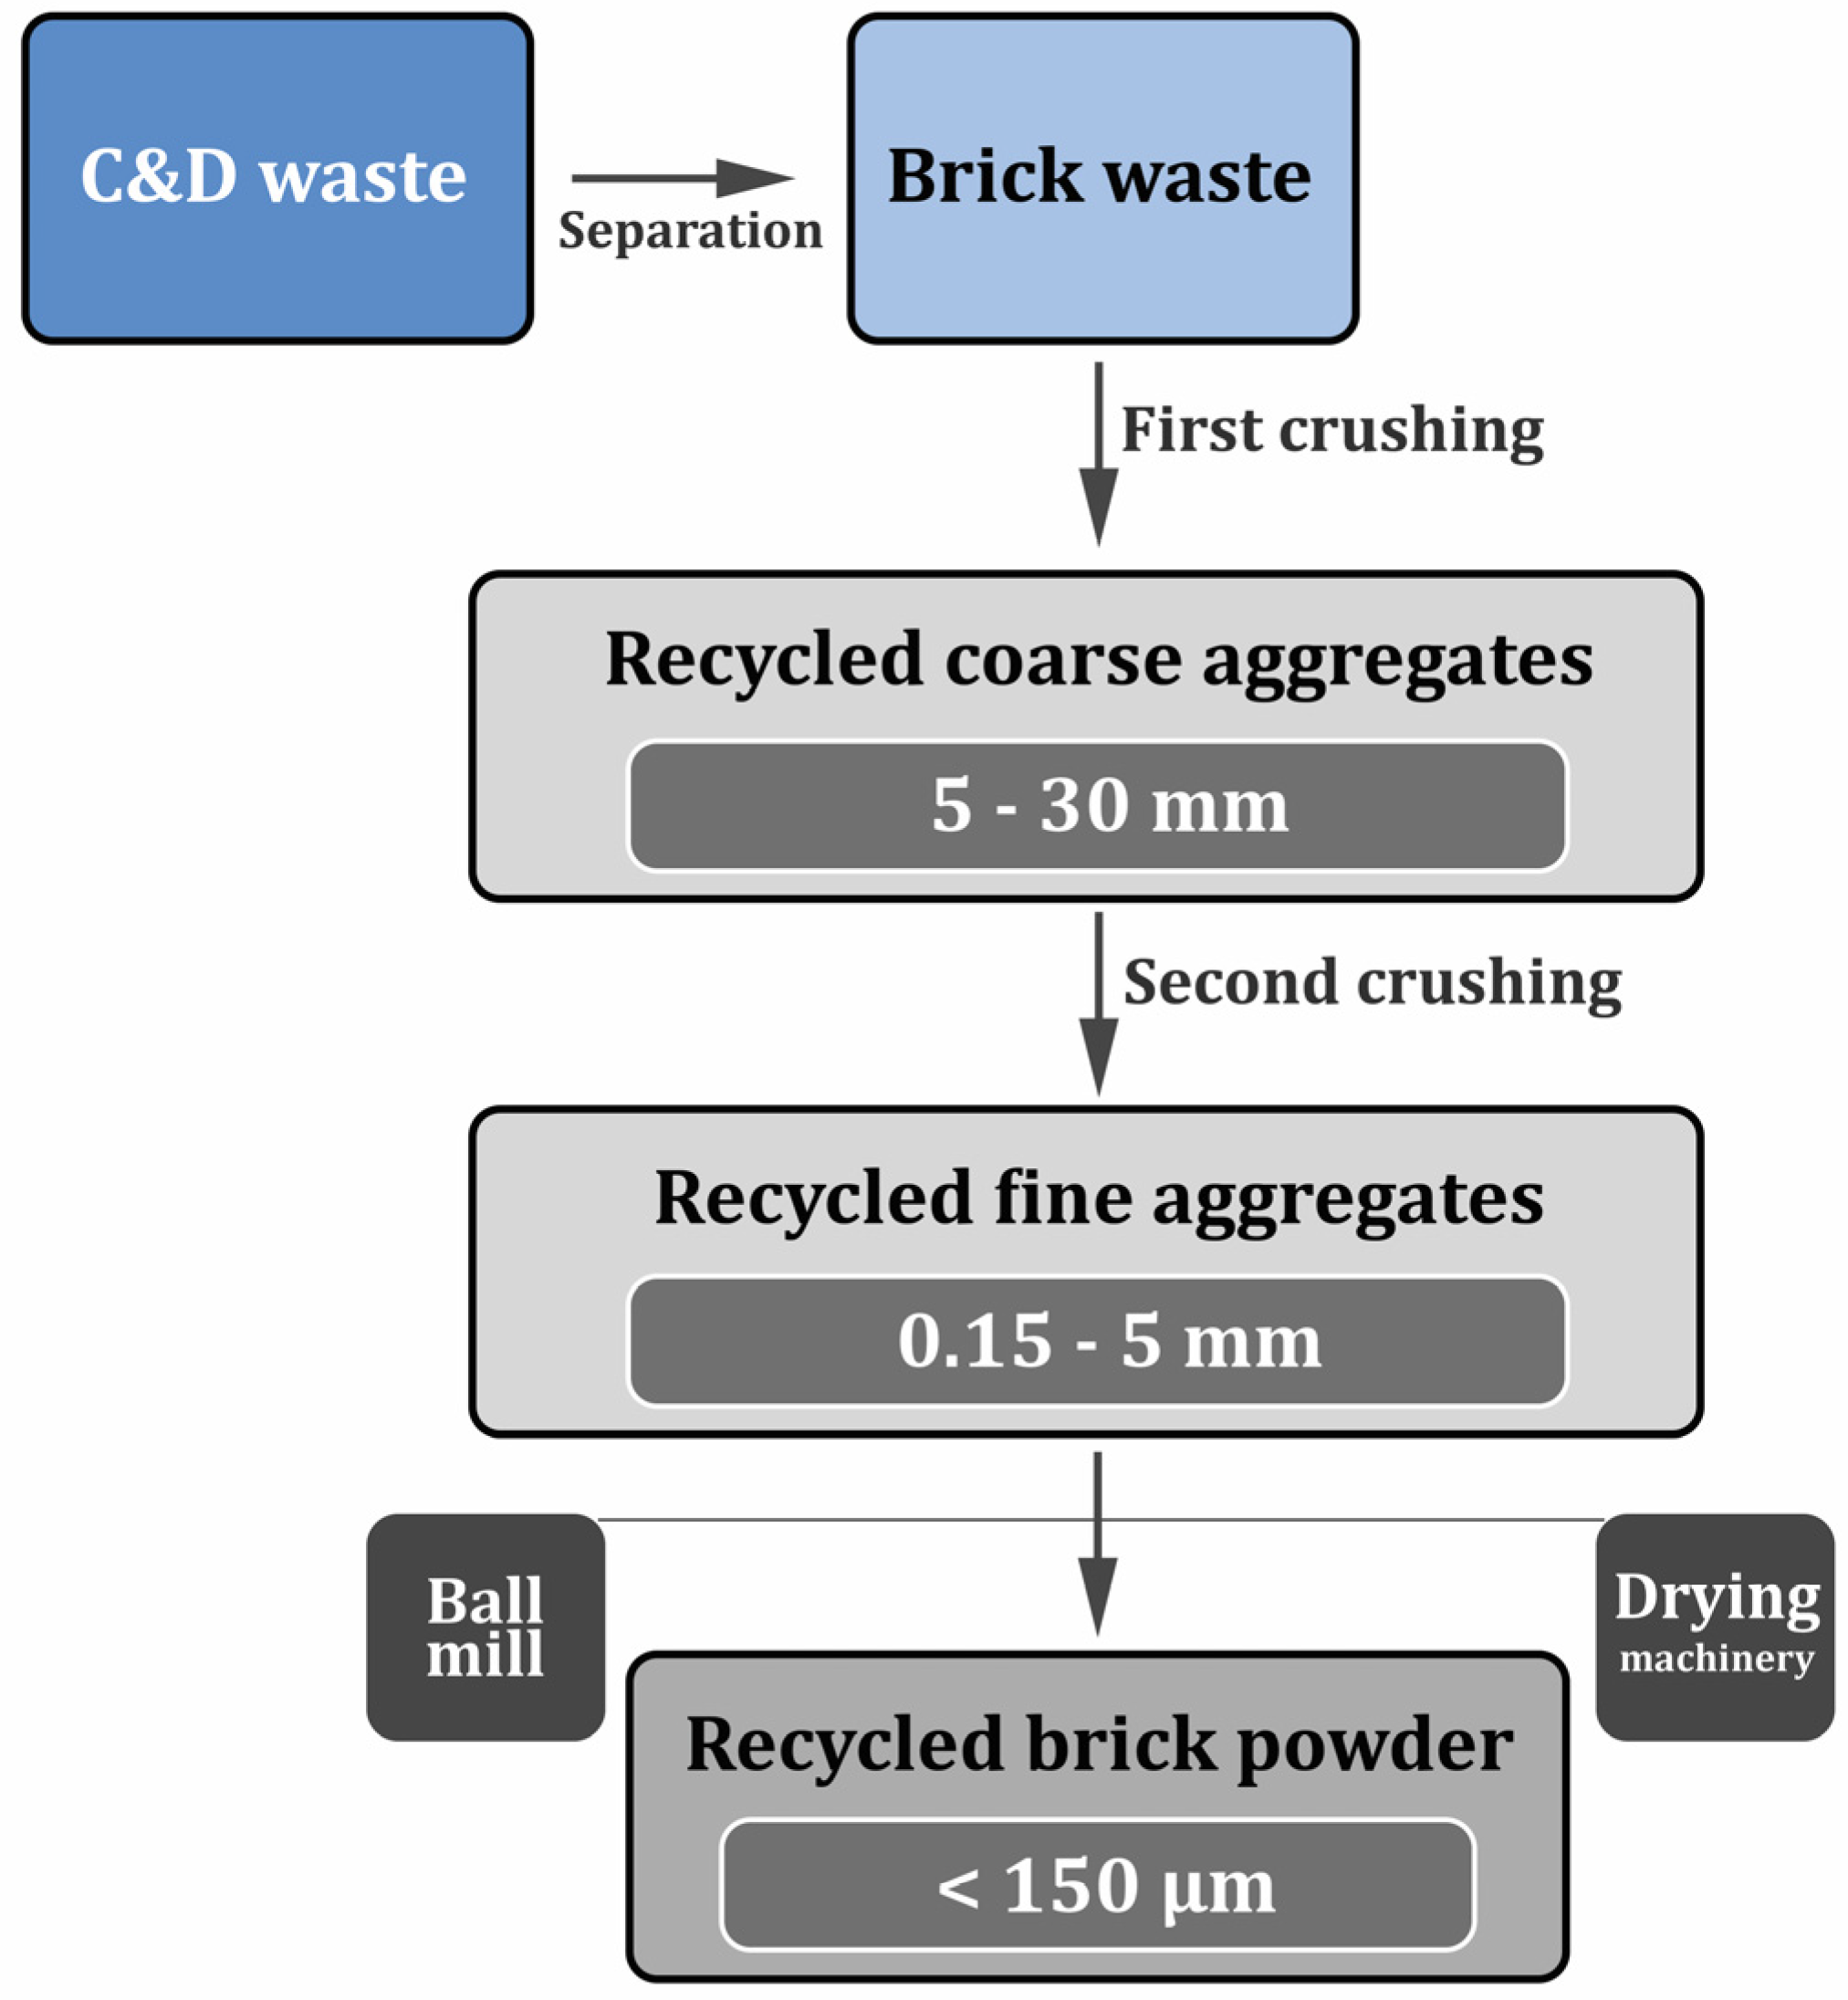
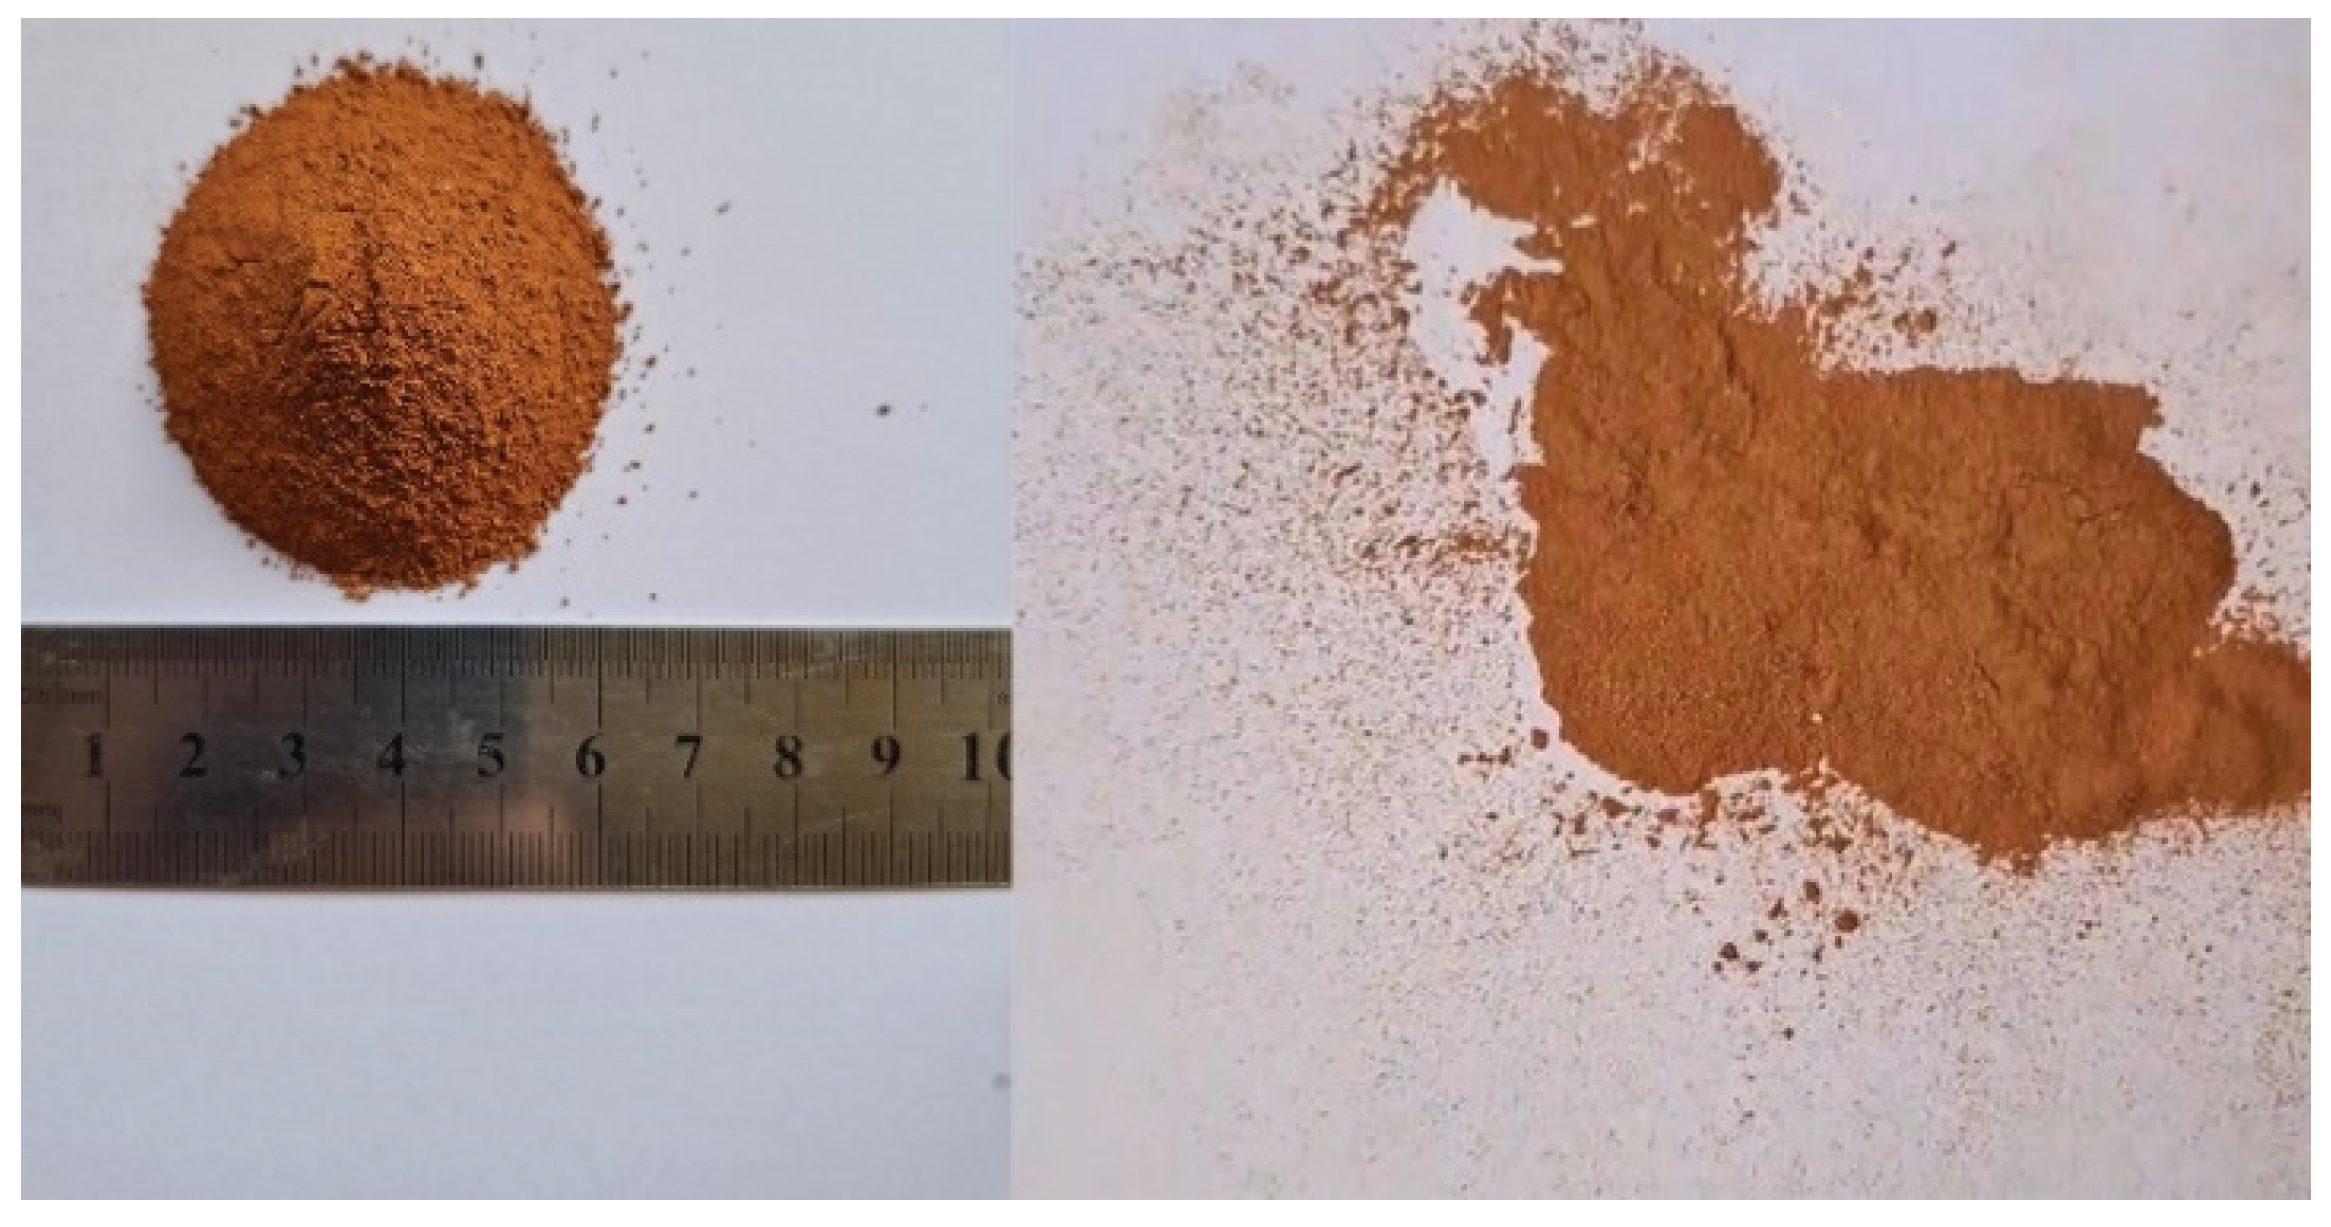
2.1. Materials
2.2. Mix Designs
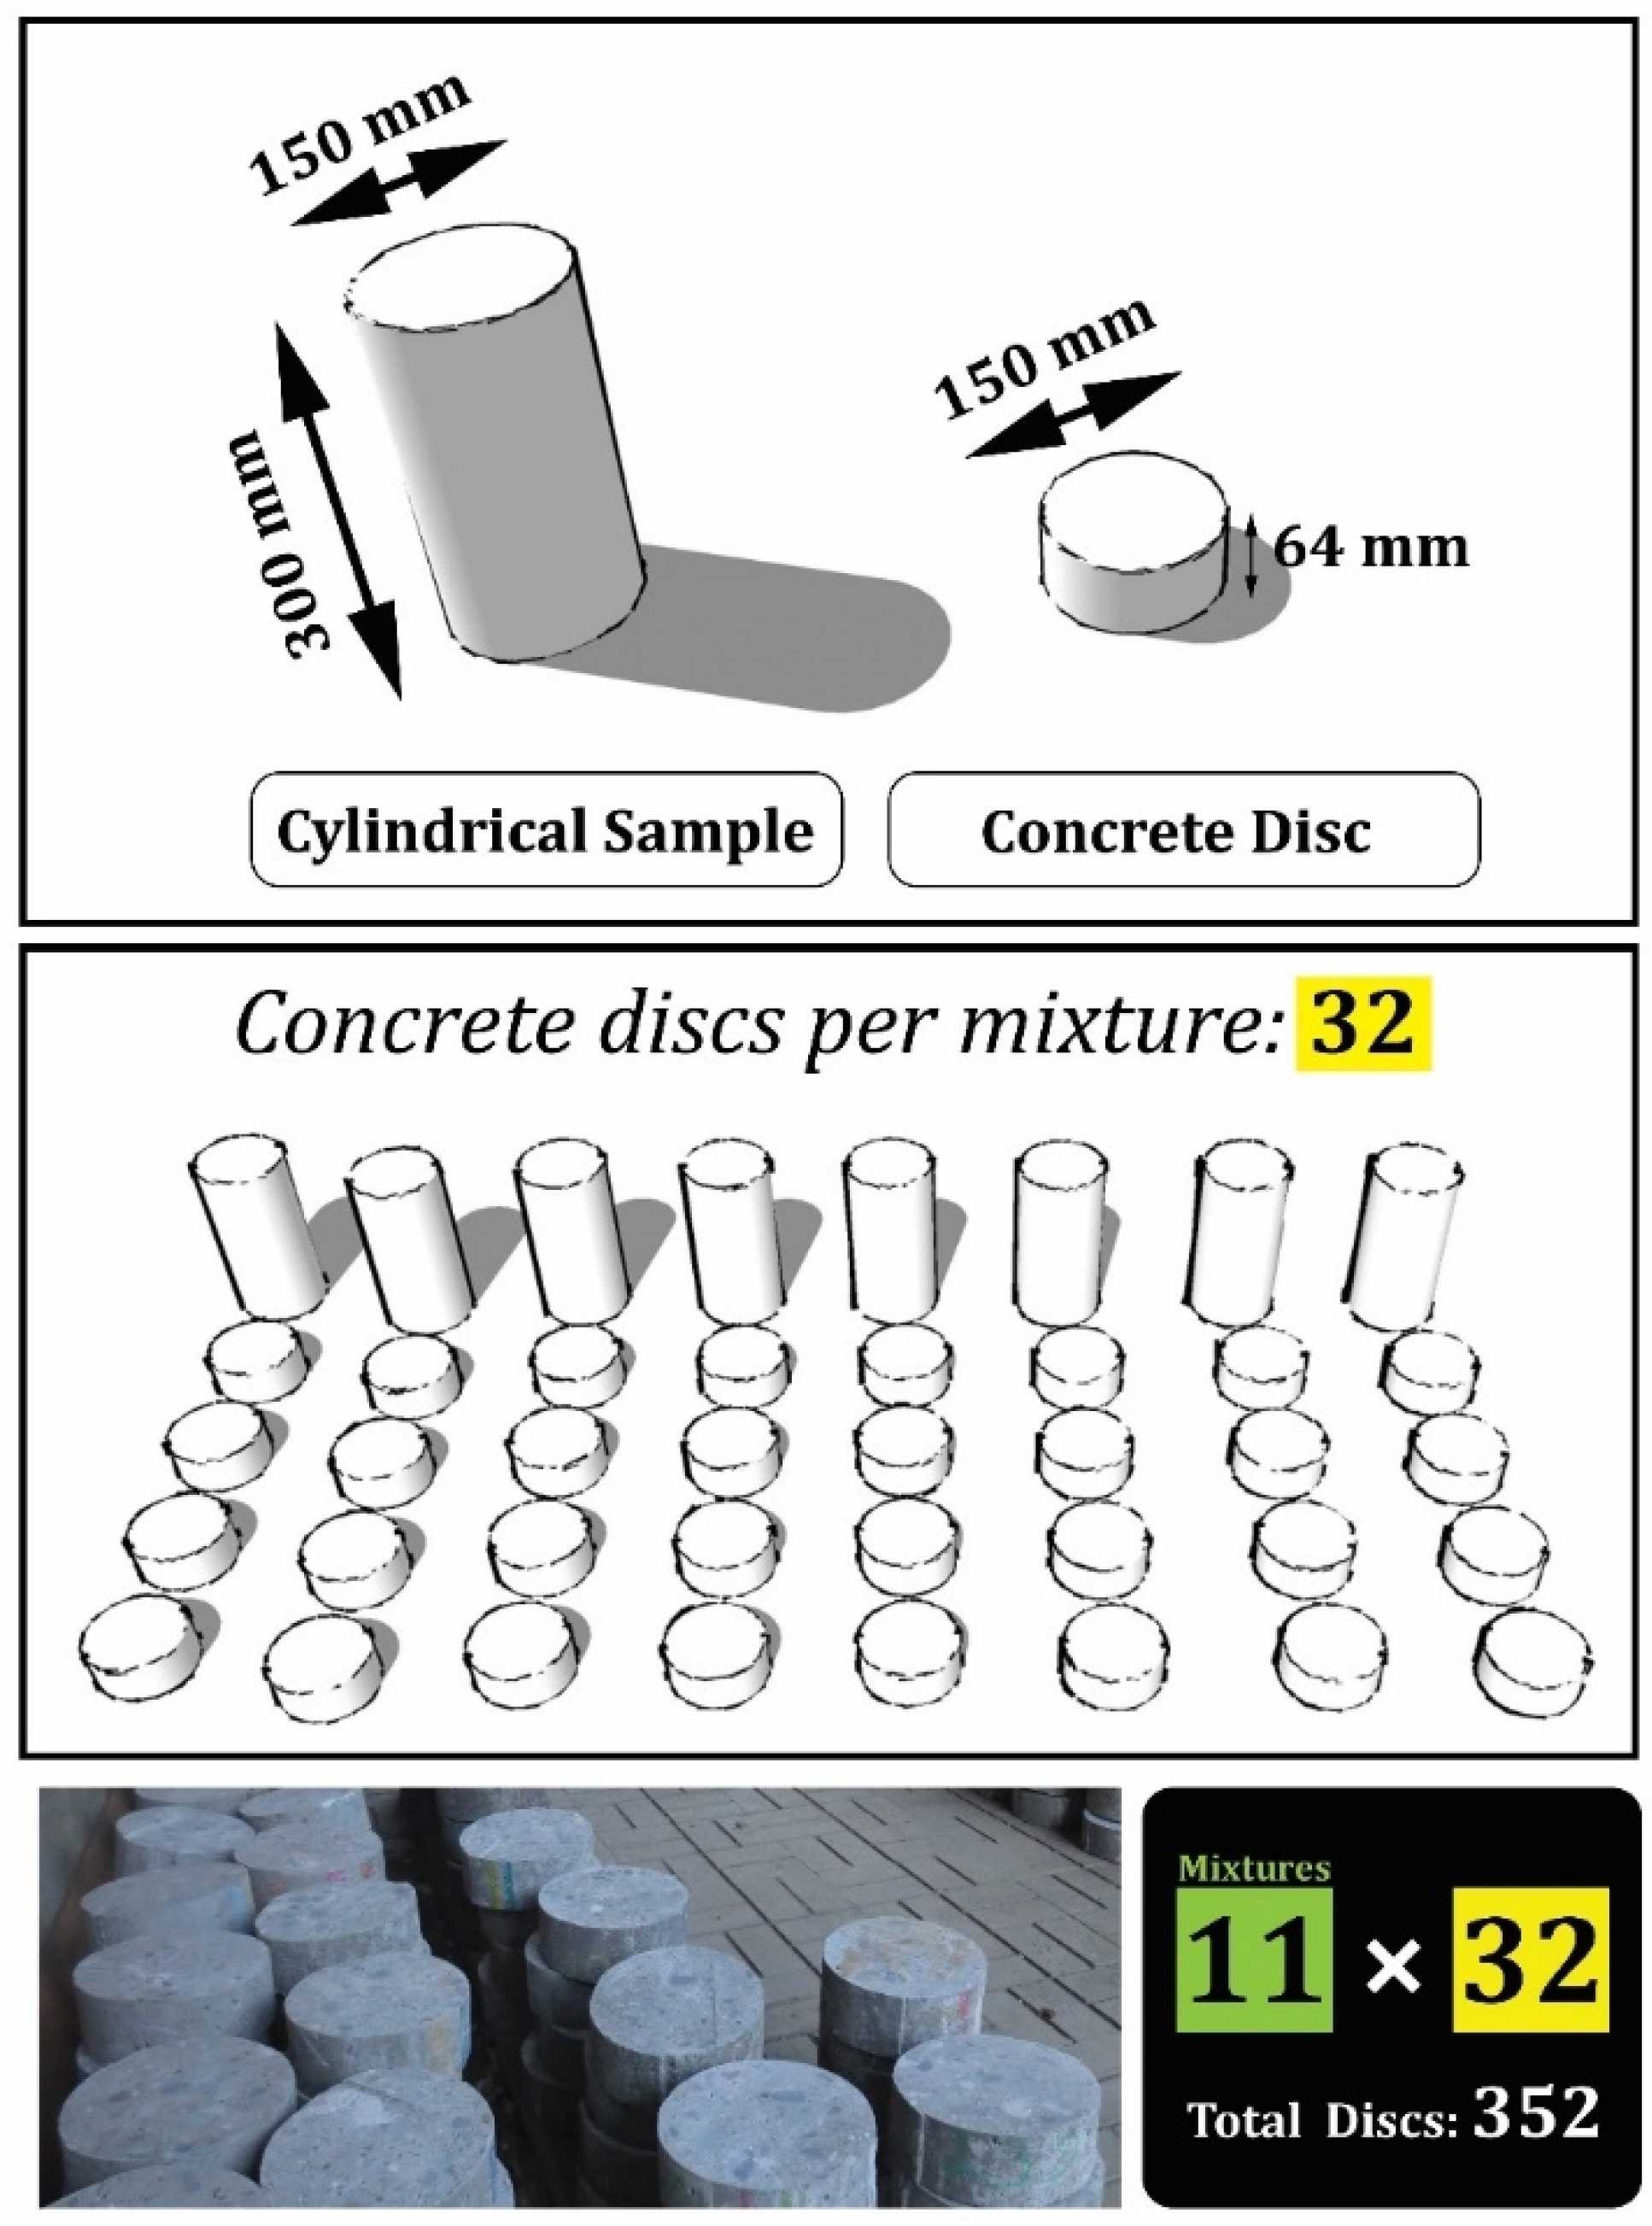
2.3. Sample Preparation
2.4. Test Methods
3. Prediction Models
4. Discussion and Results
4.1. Experimental Investigation
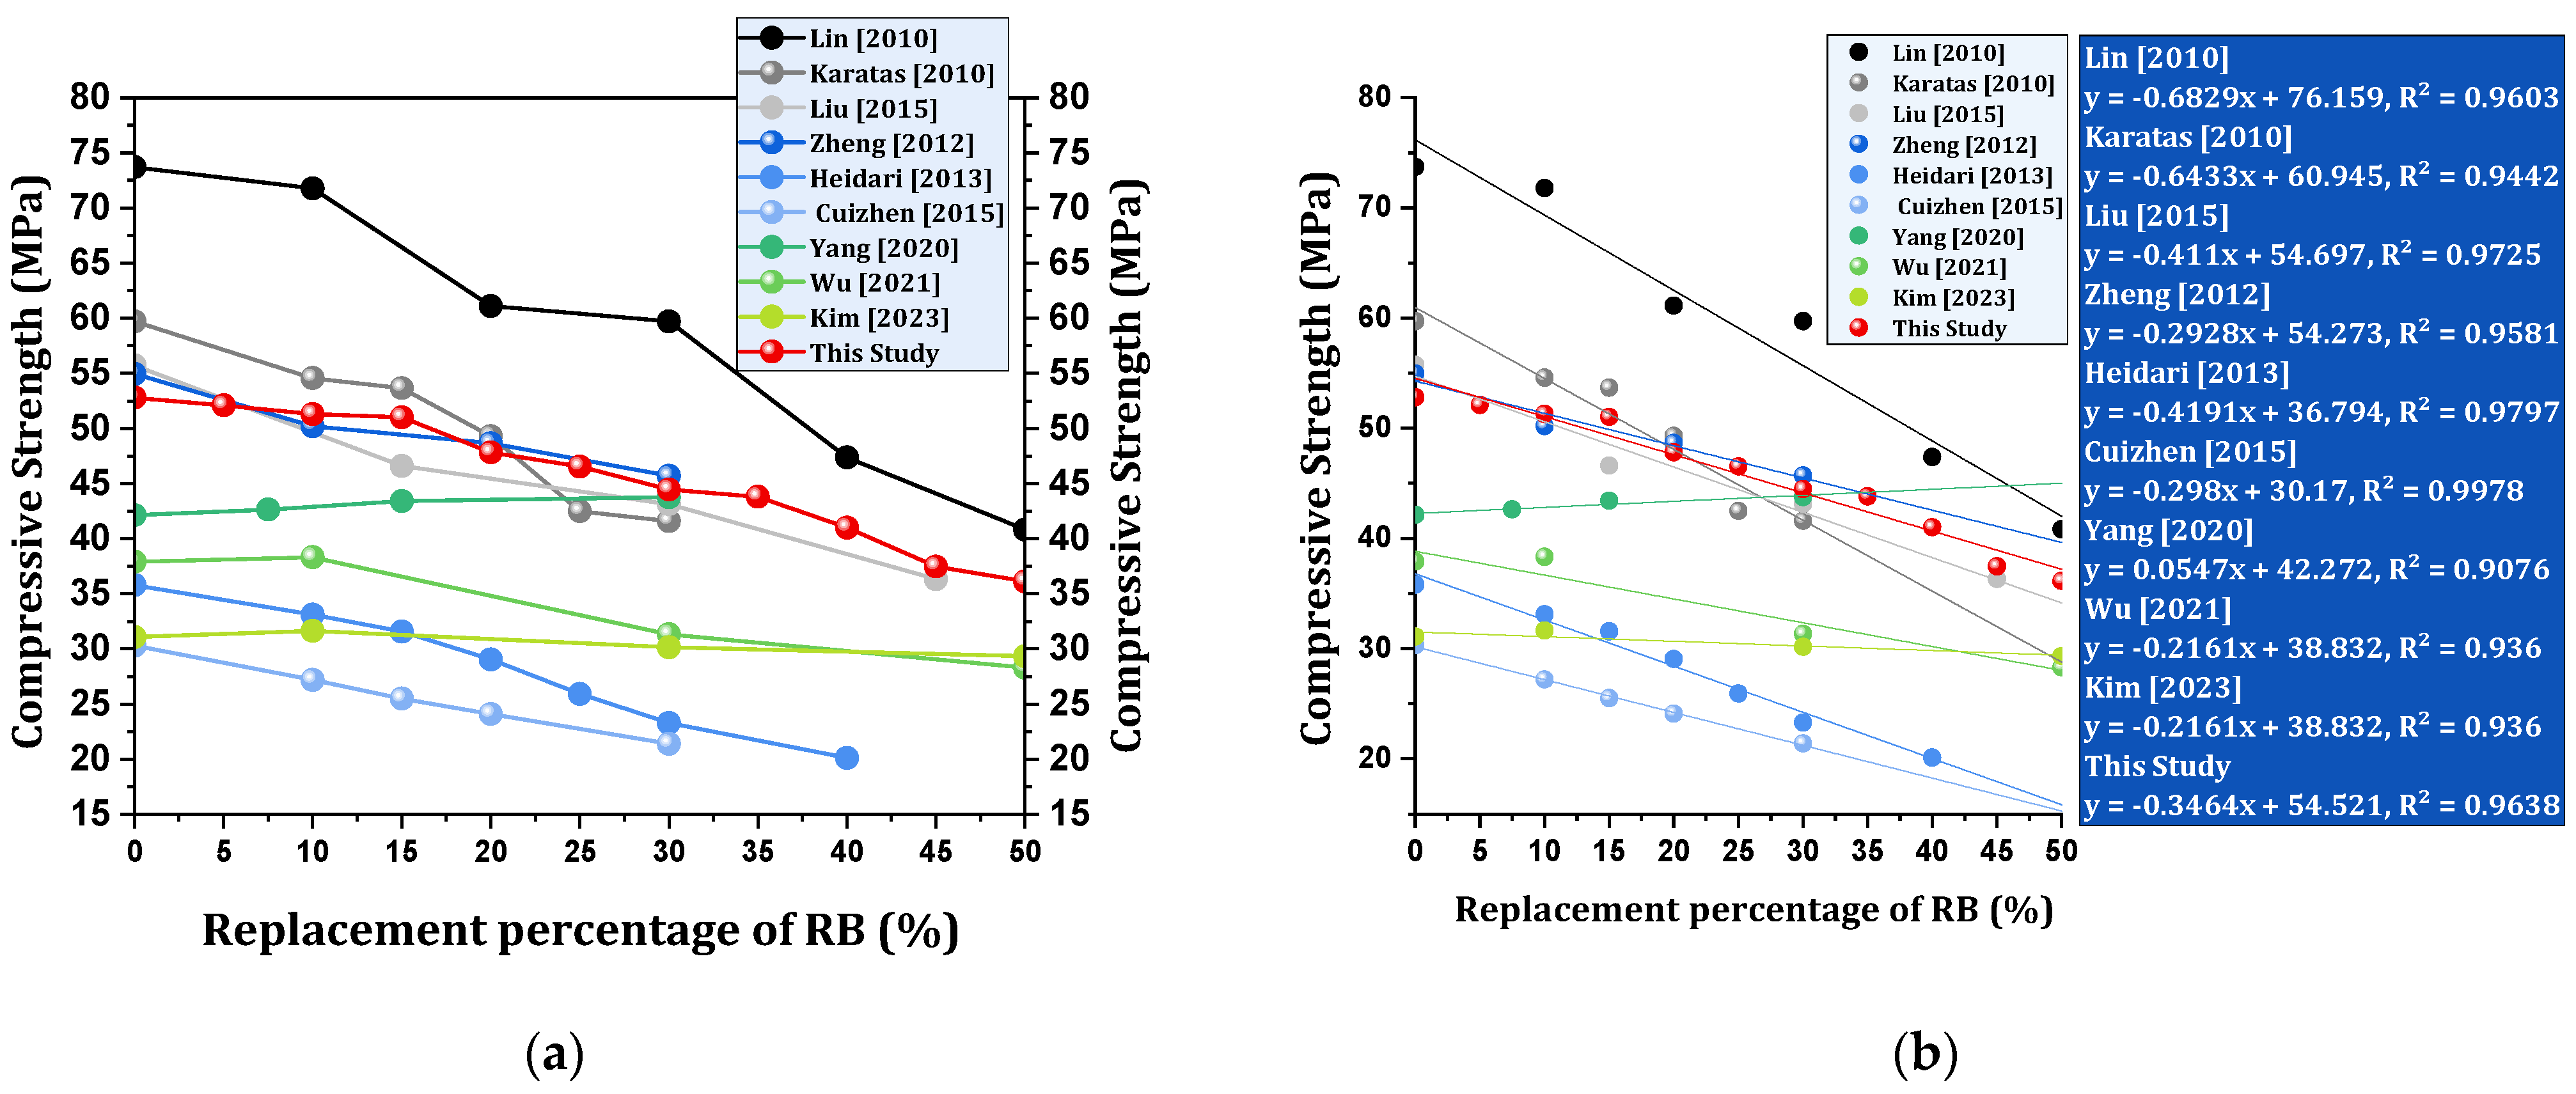
4.1.1. Compressive Strength
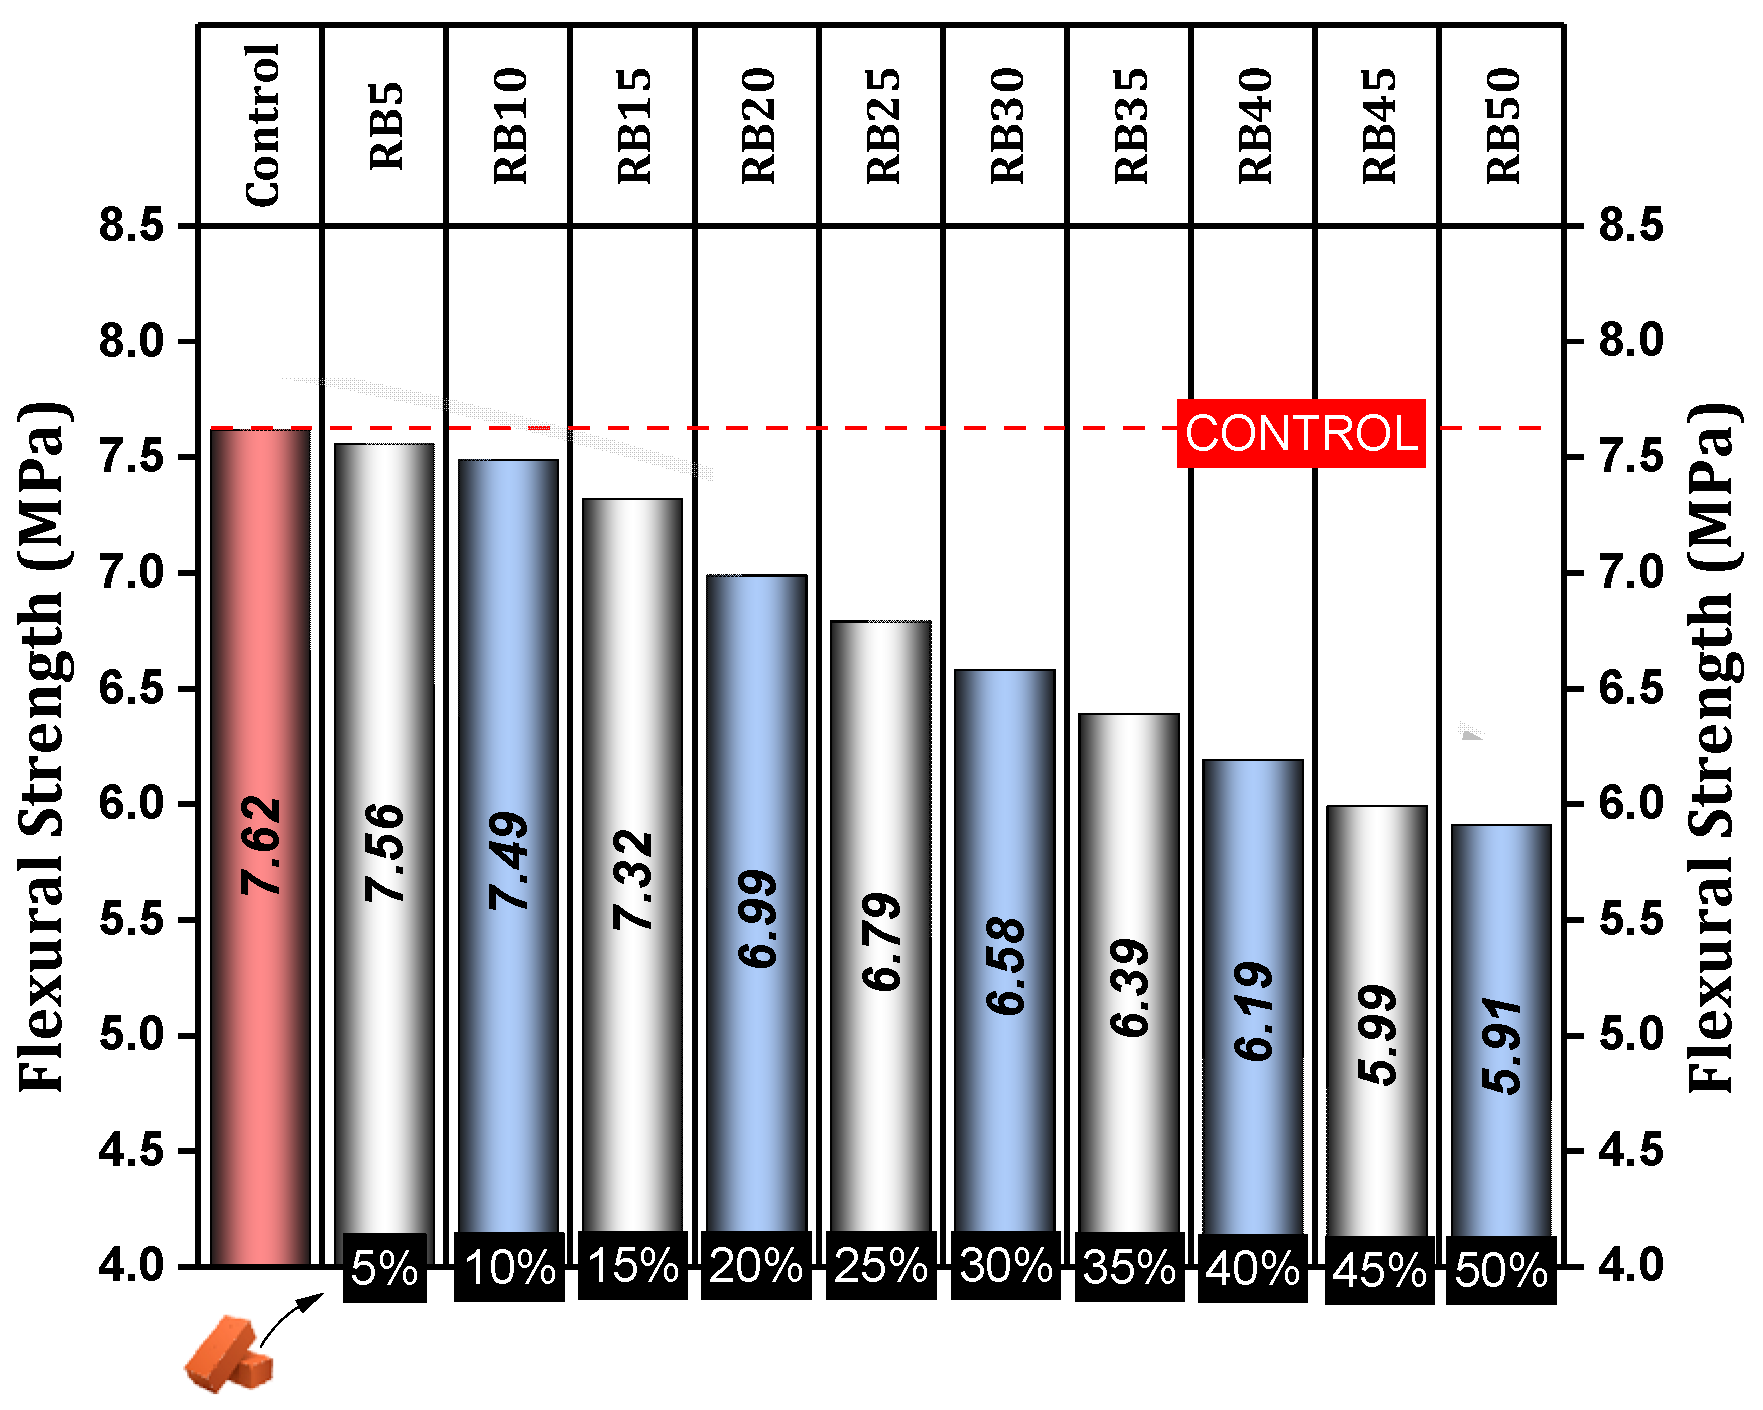
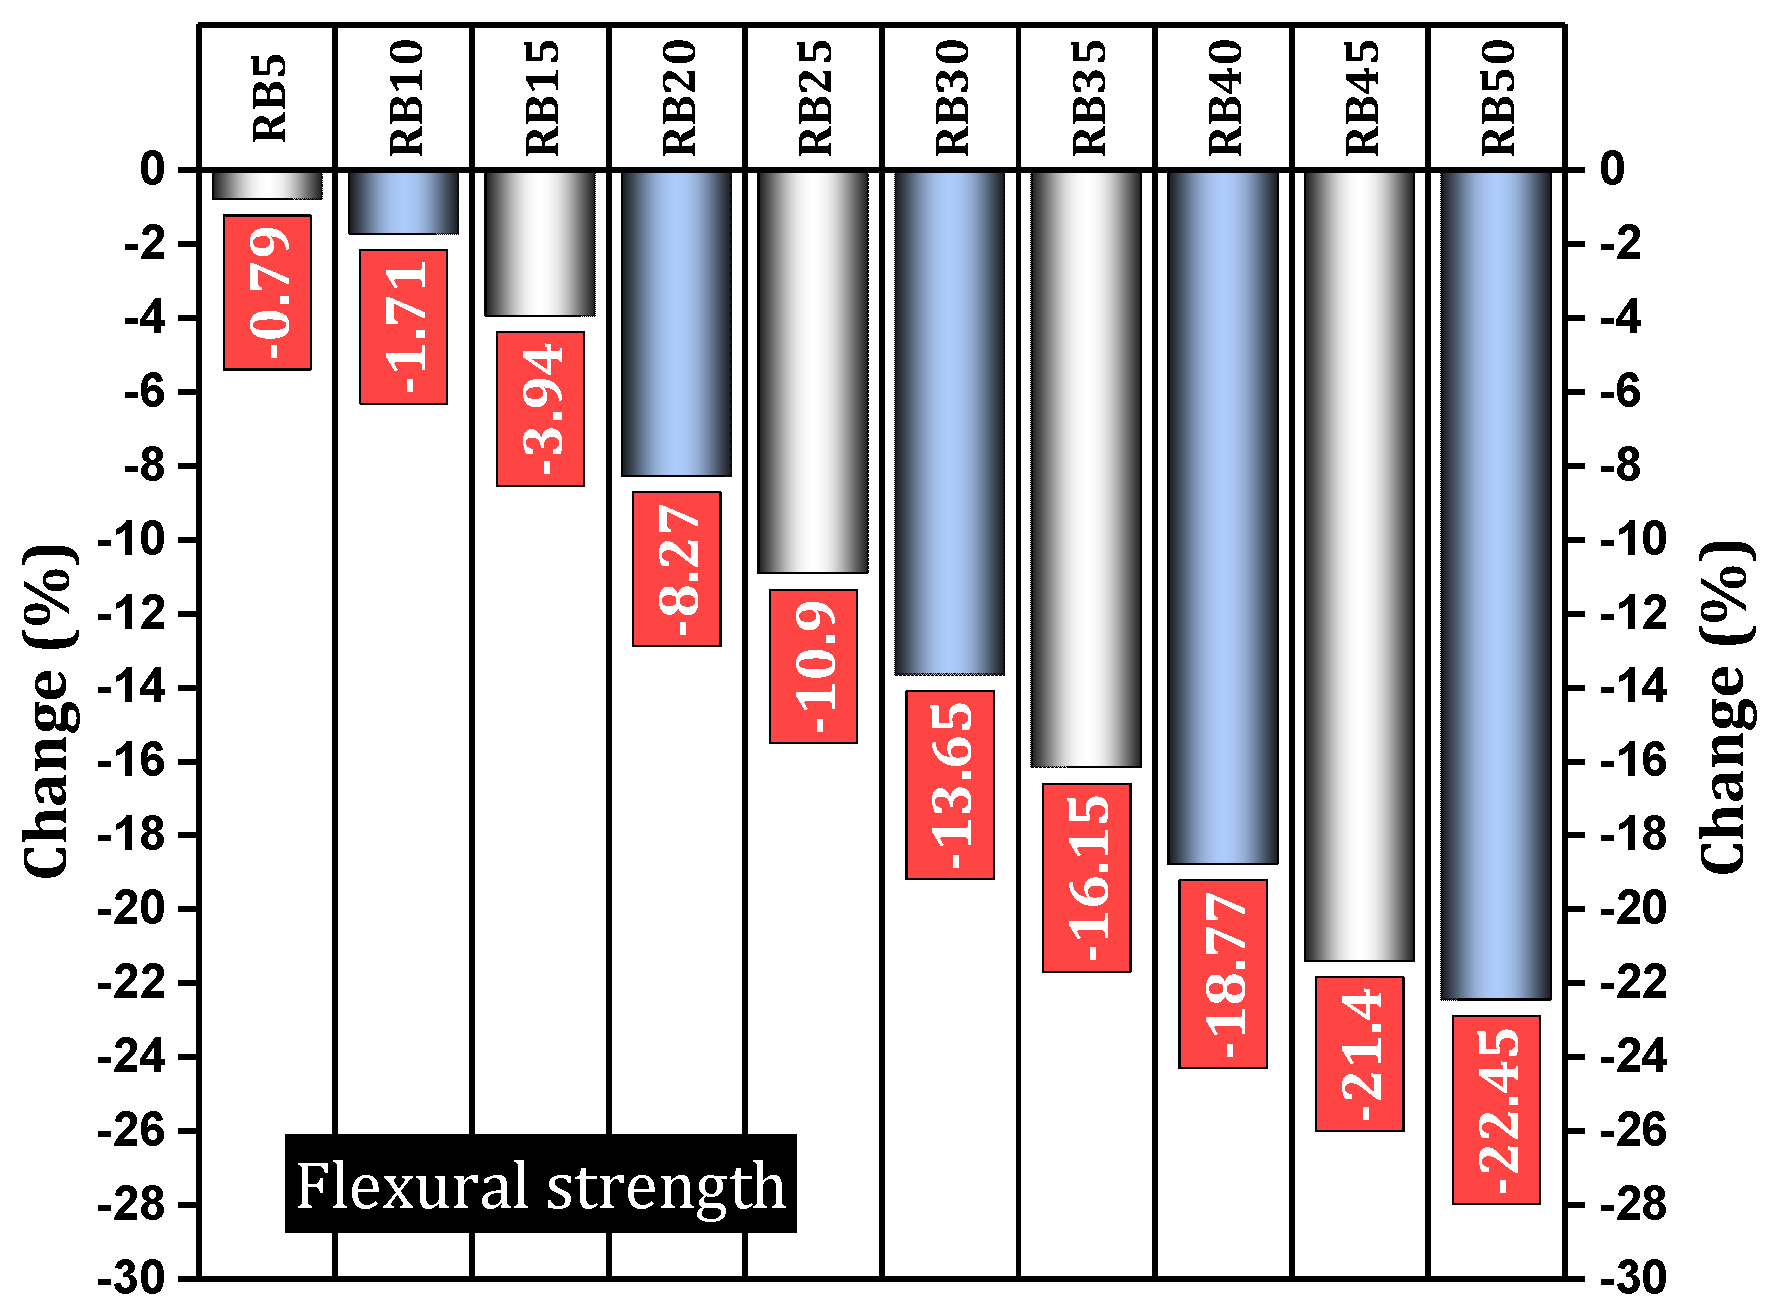
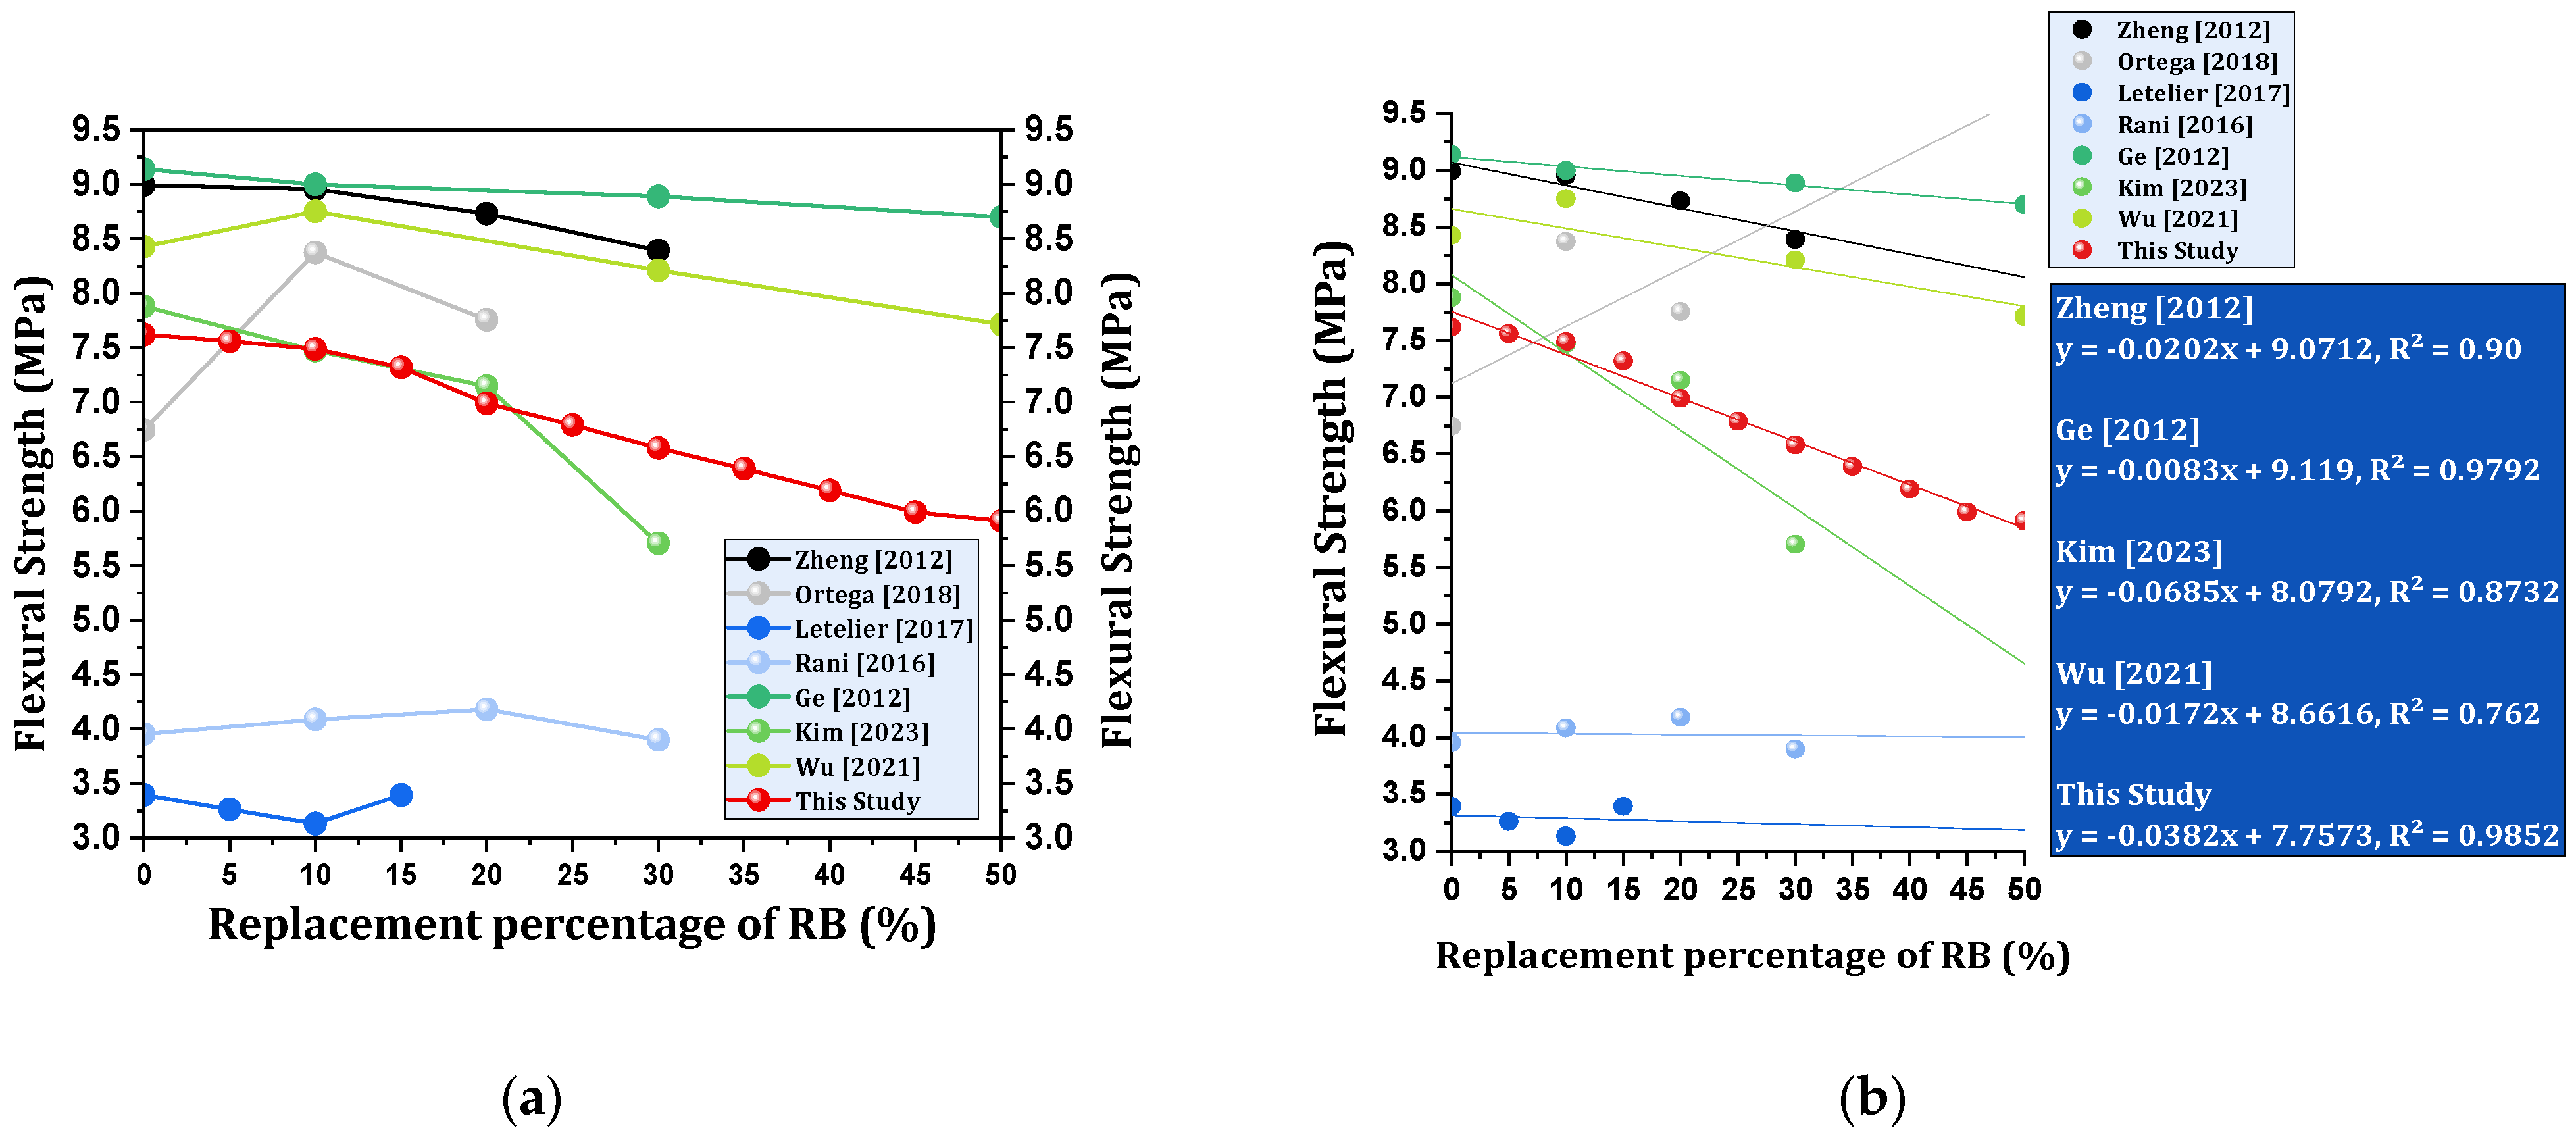
4.1.2. Flexural Strength
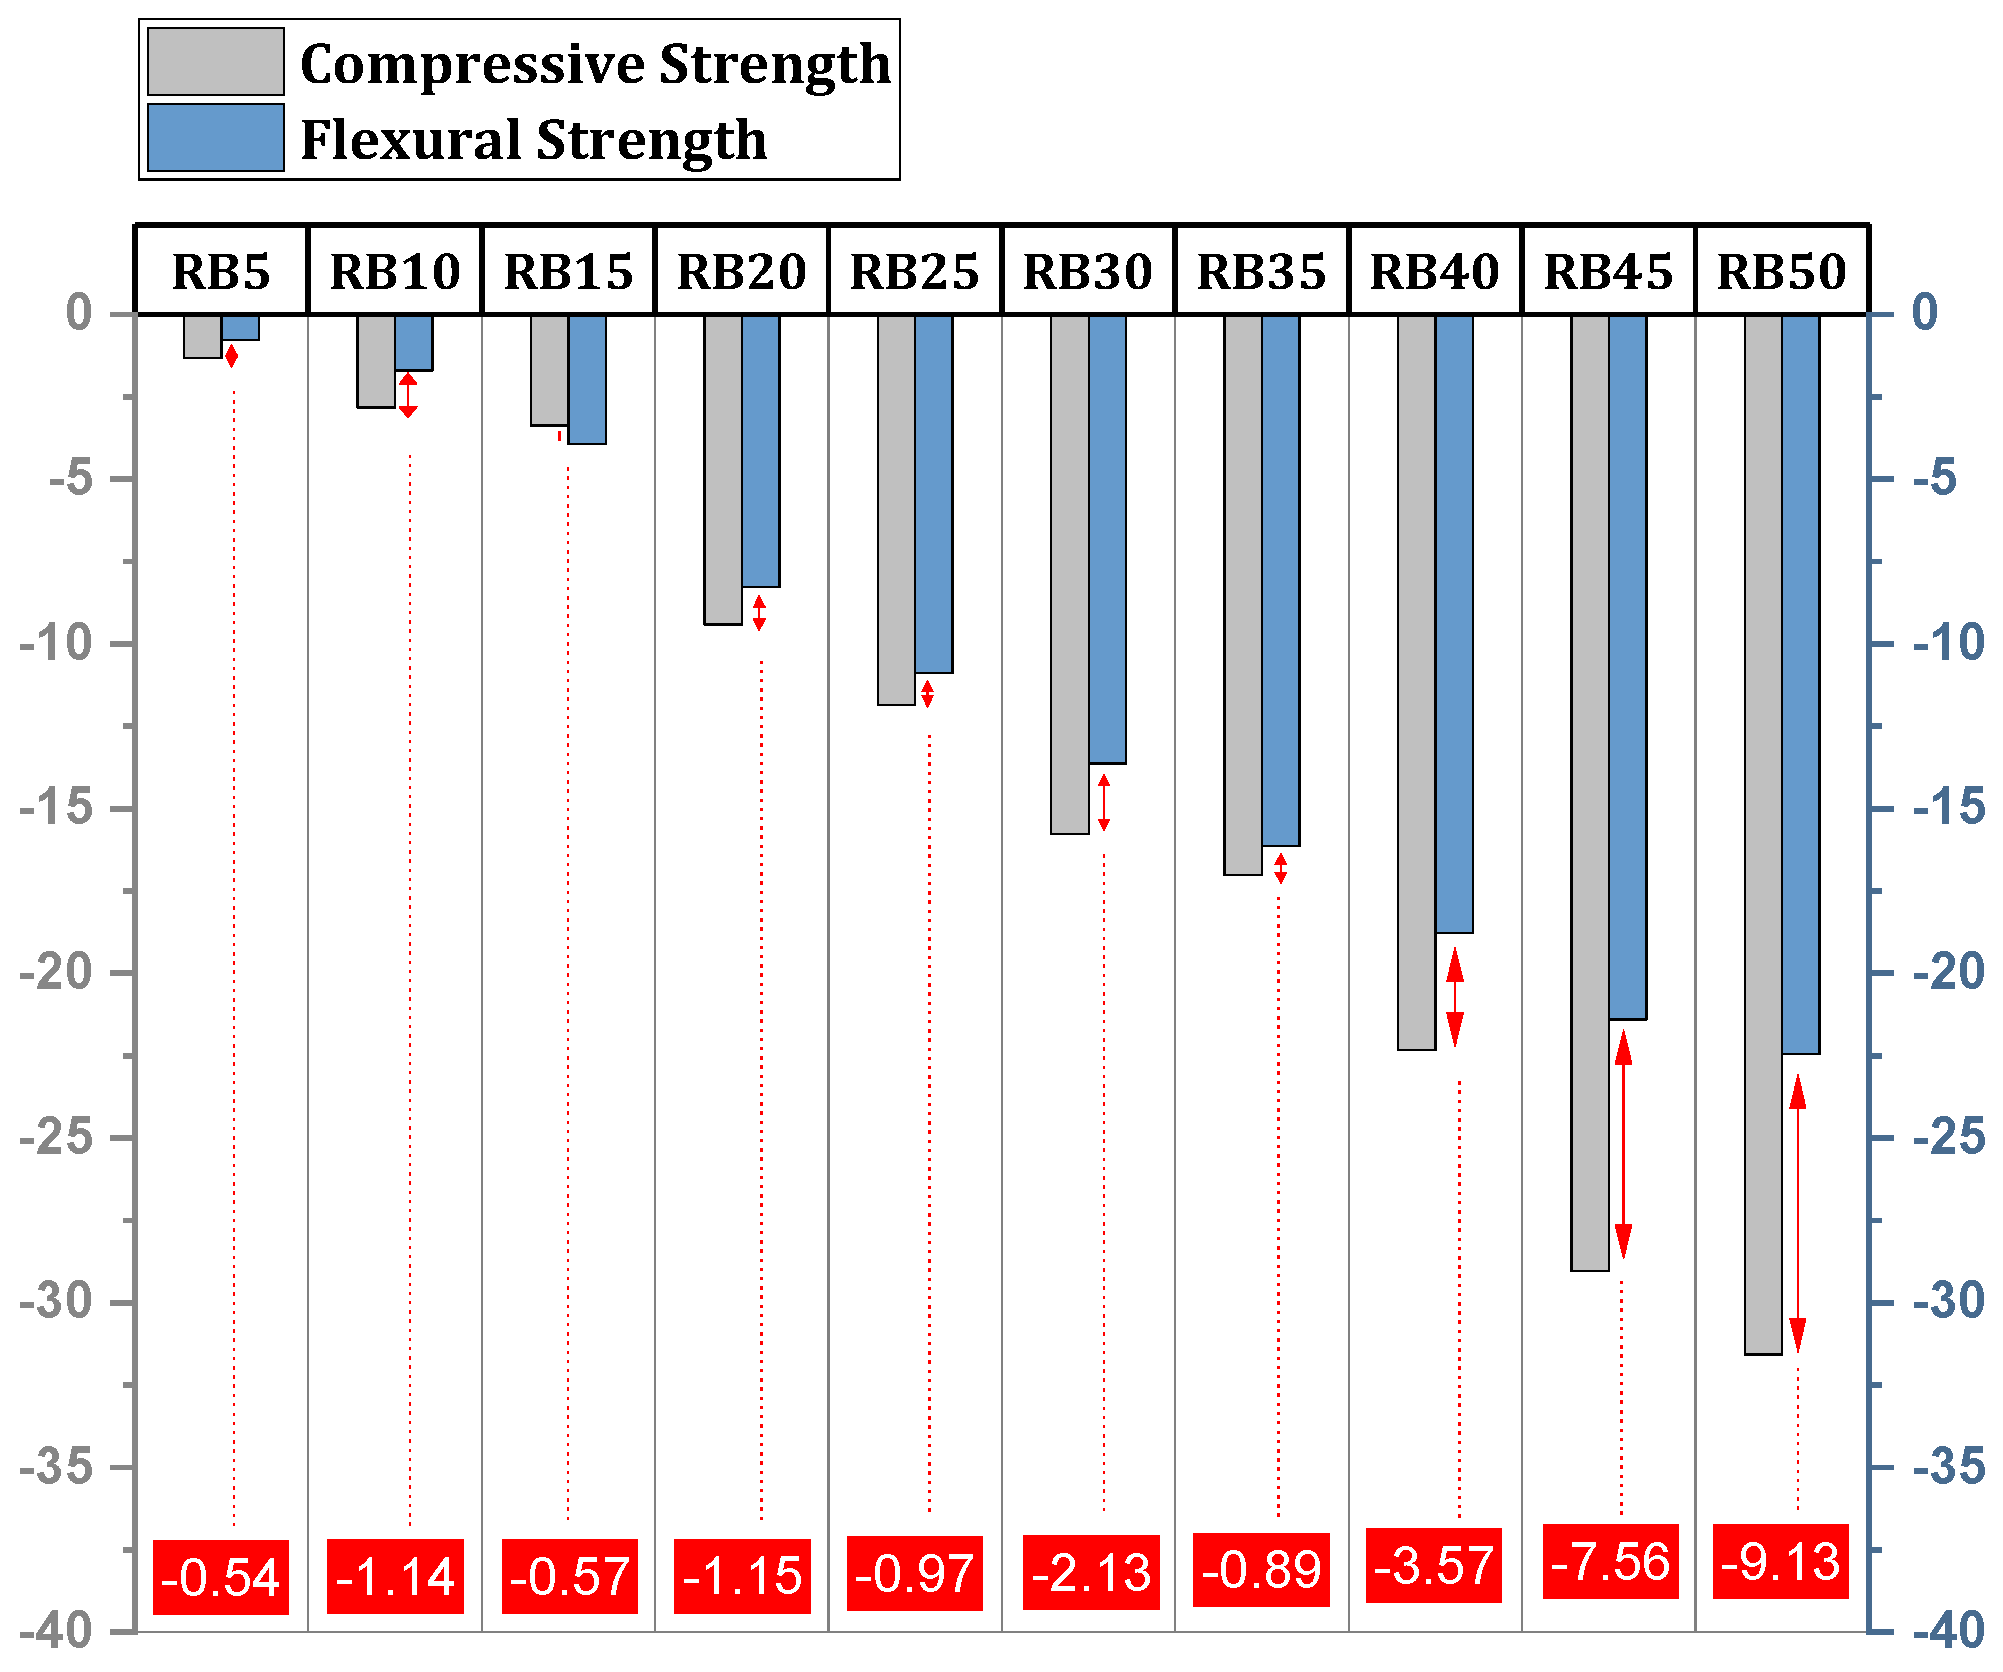
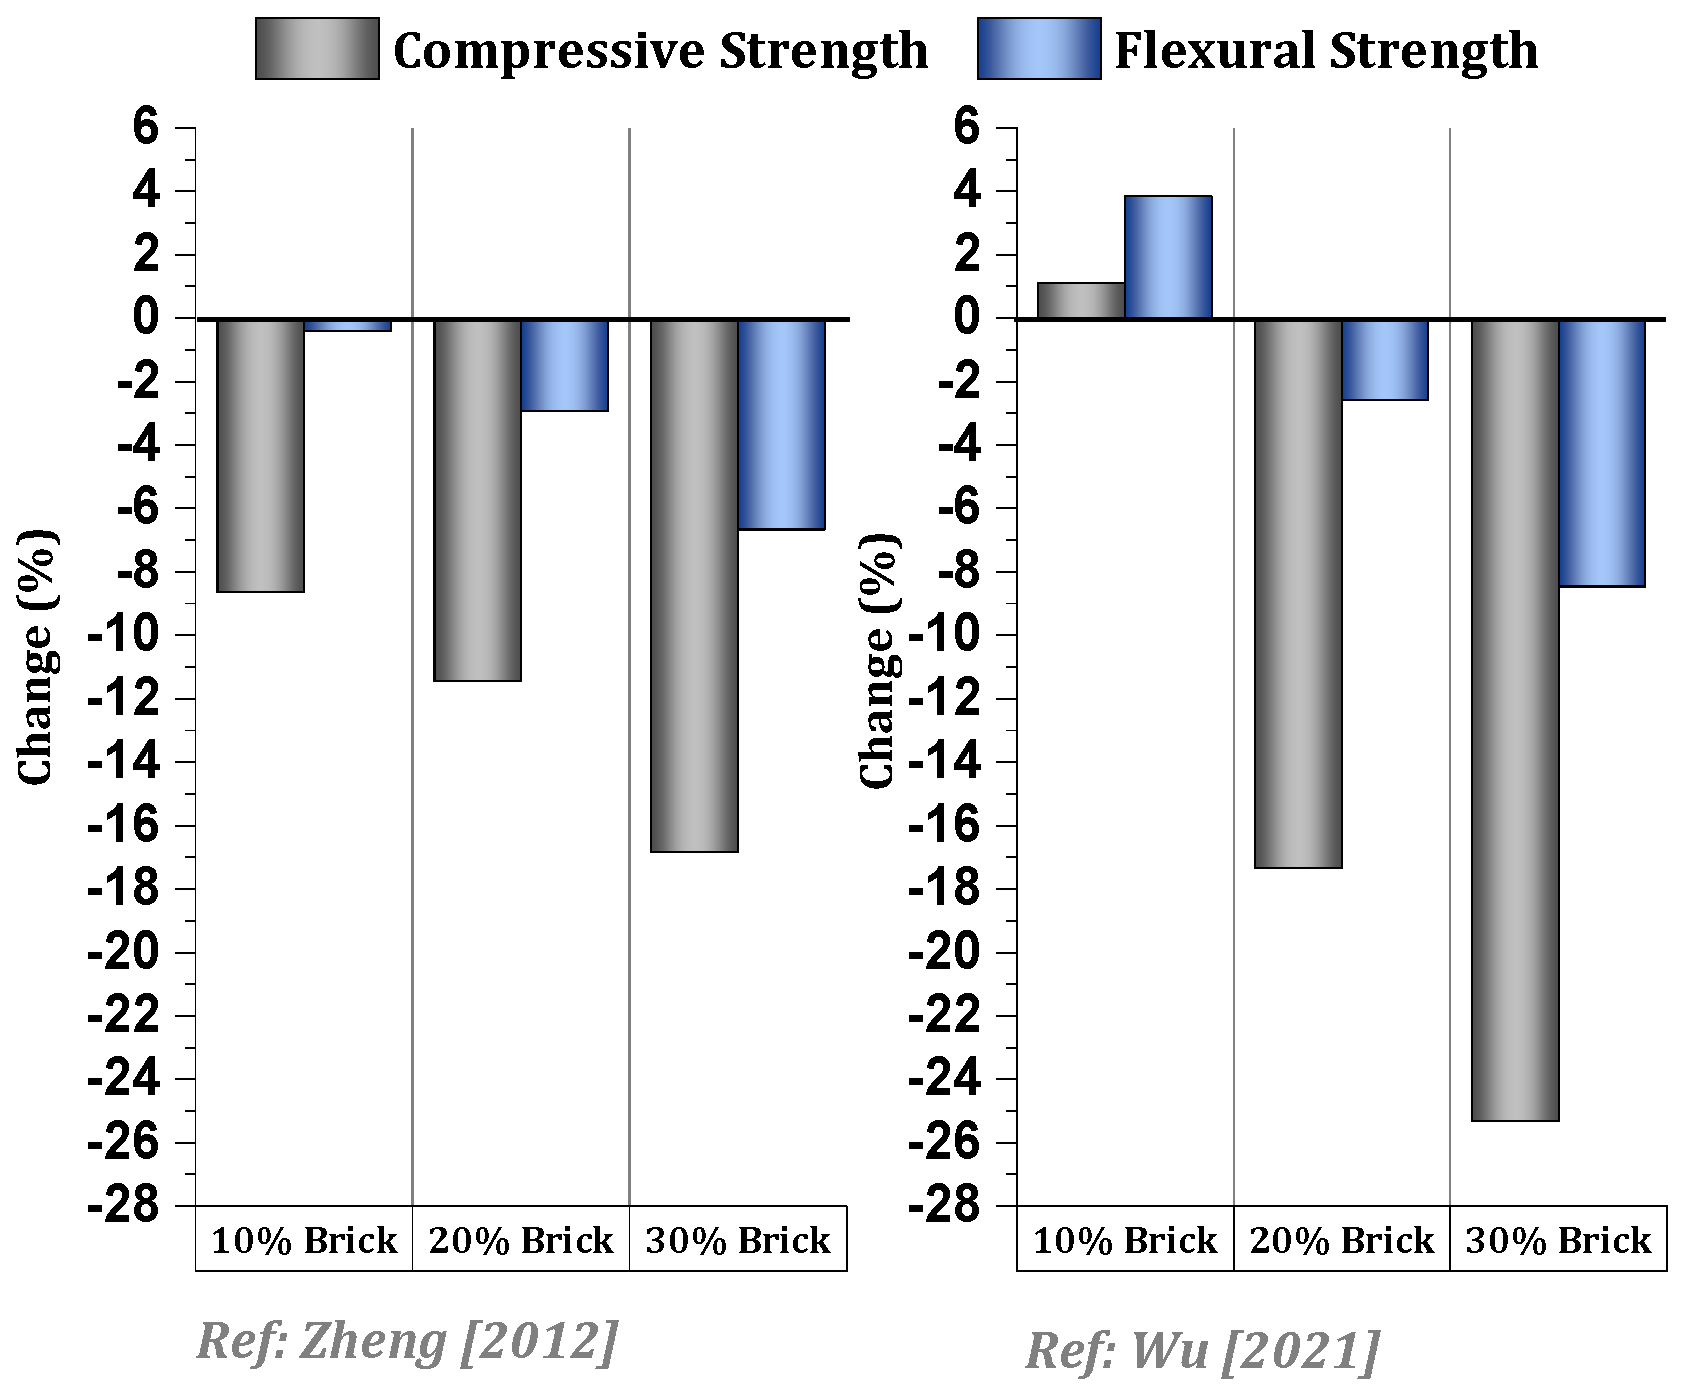
4.1.3. Comparative Analysis of Compressive and Flexural Strength Changes
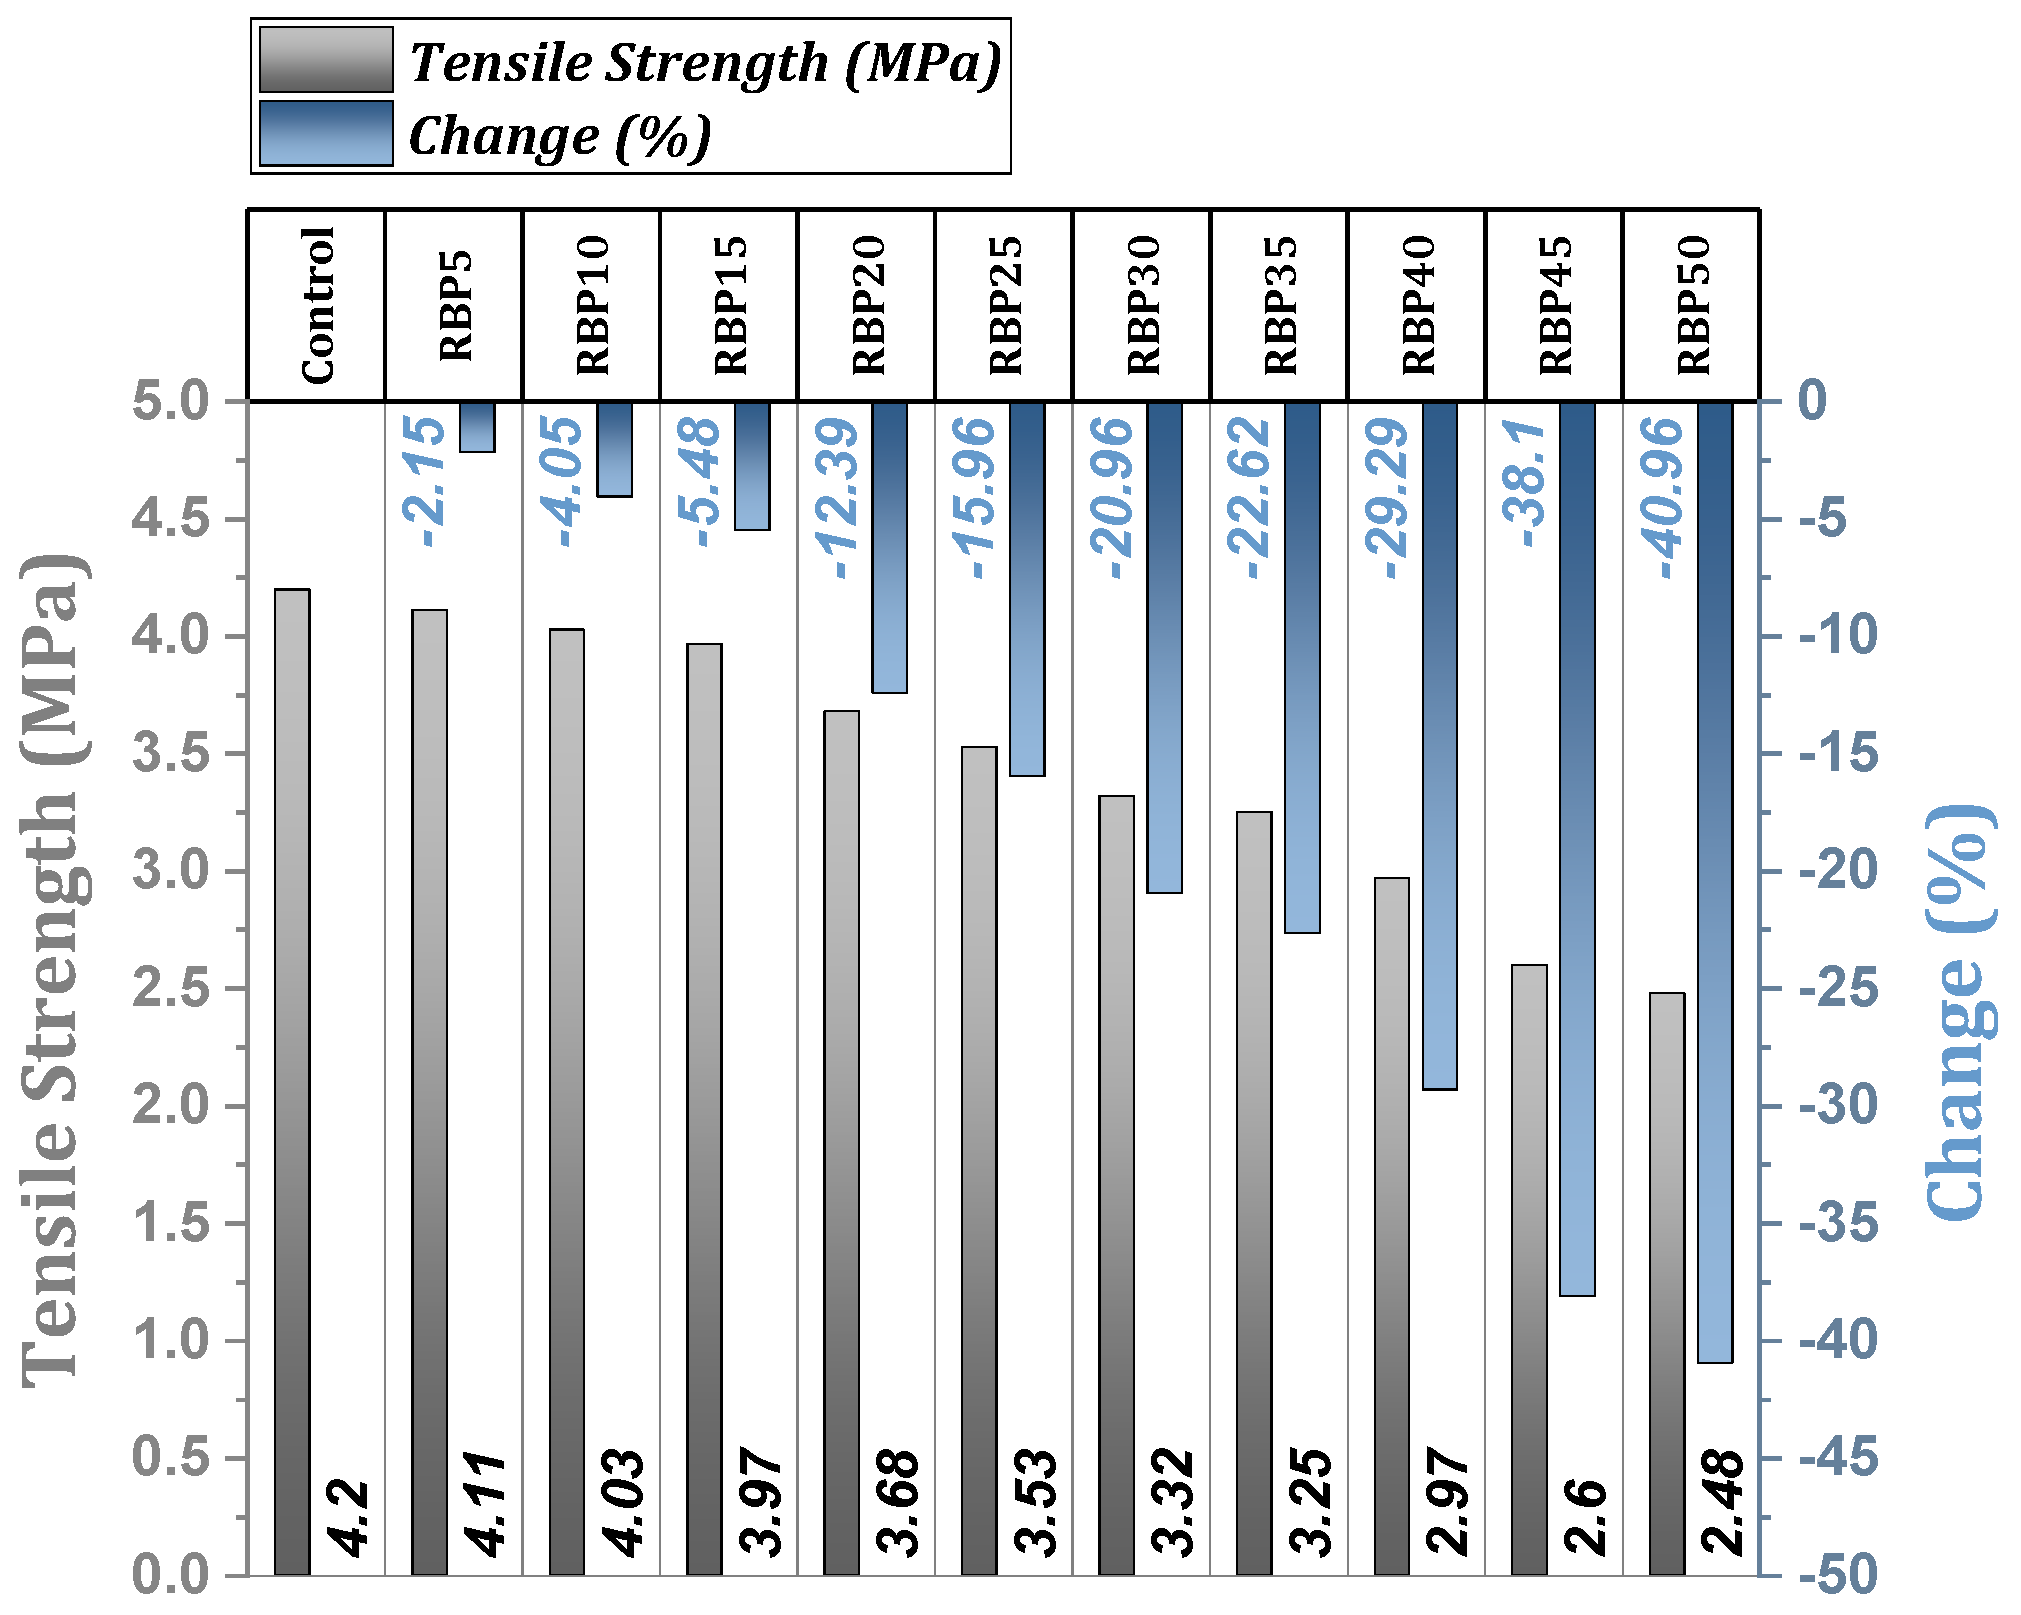
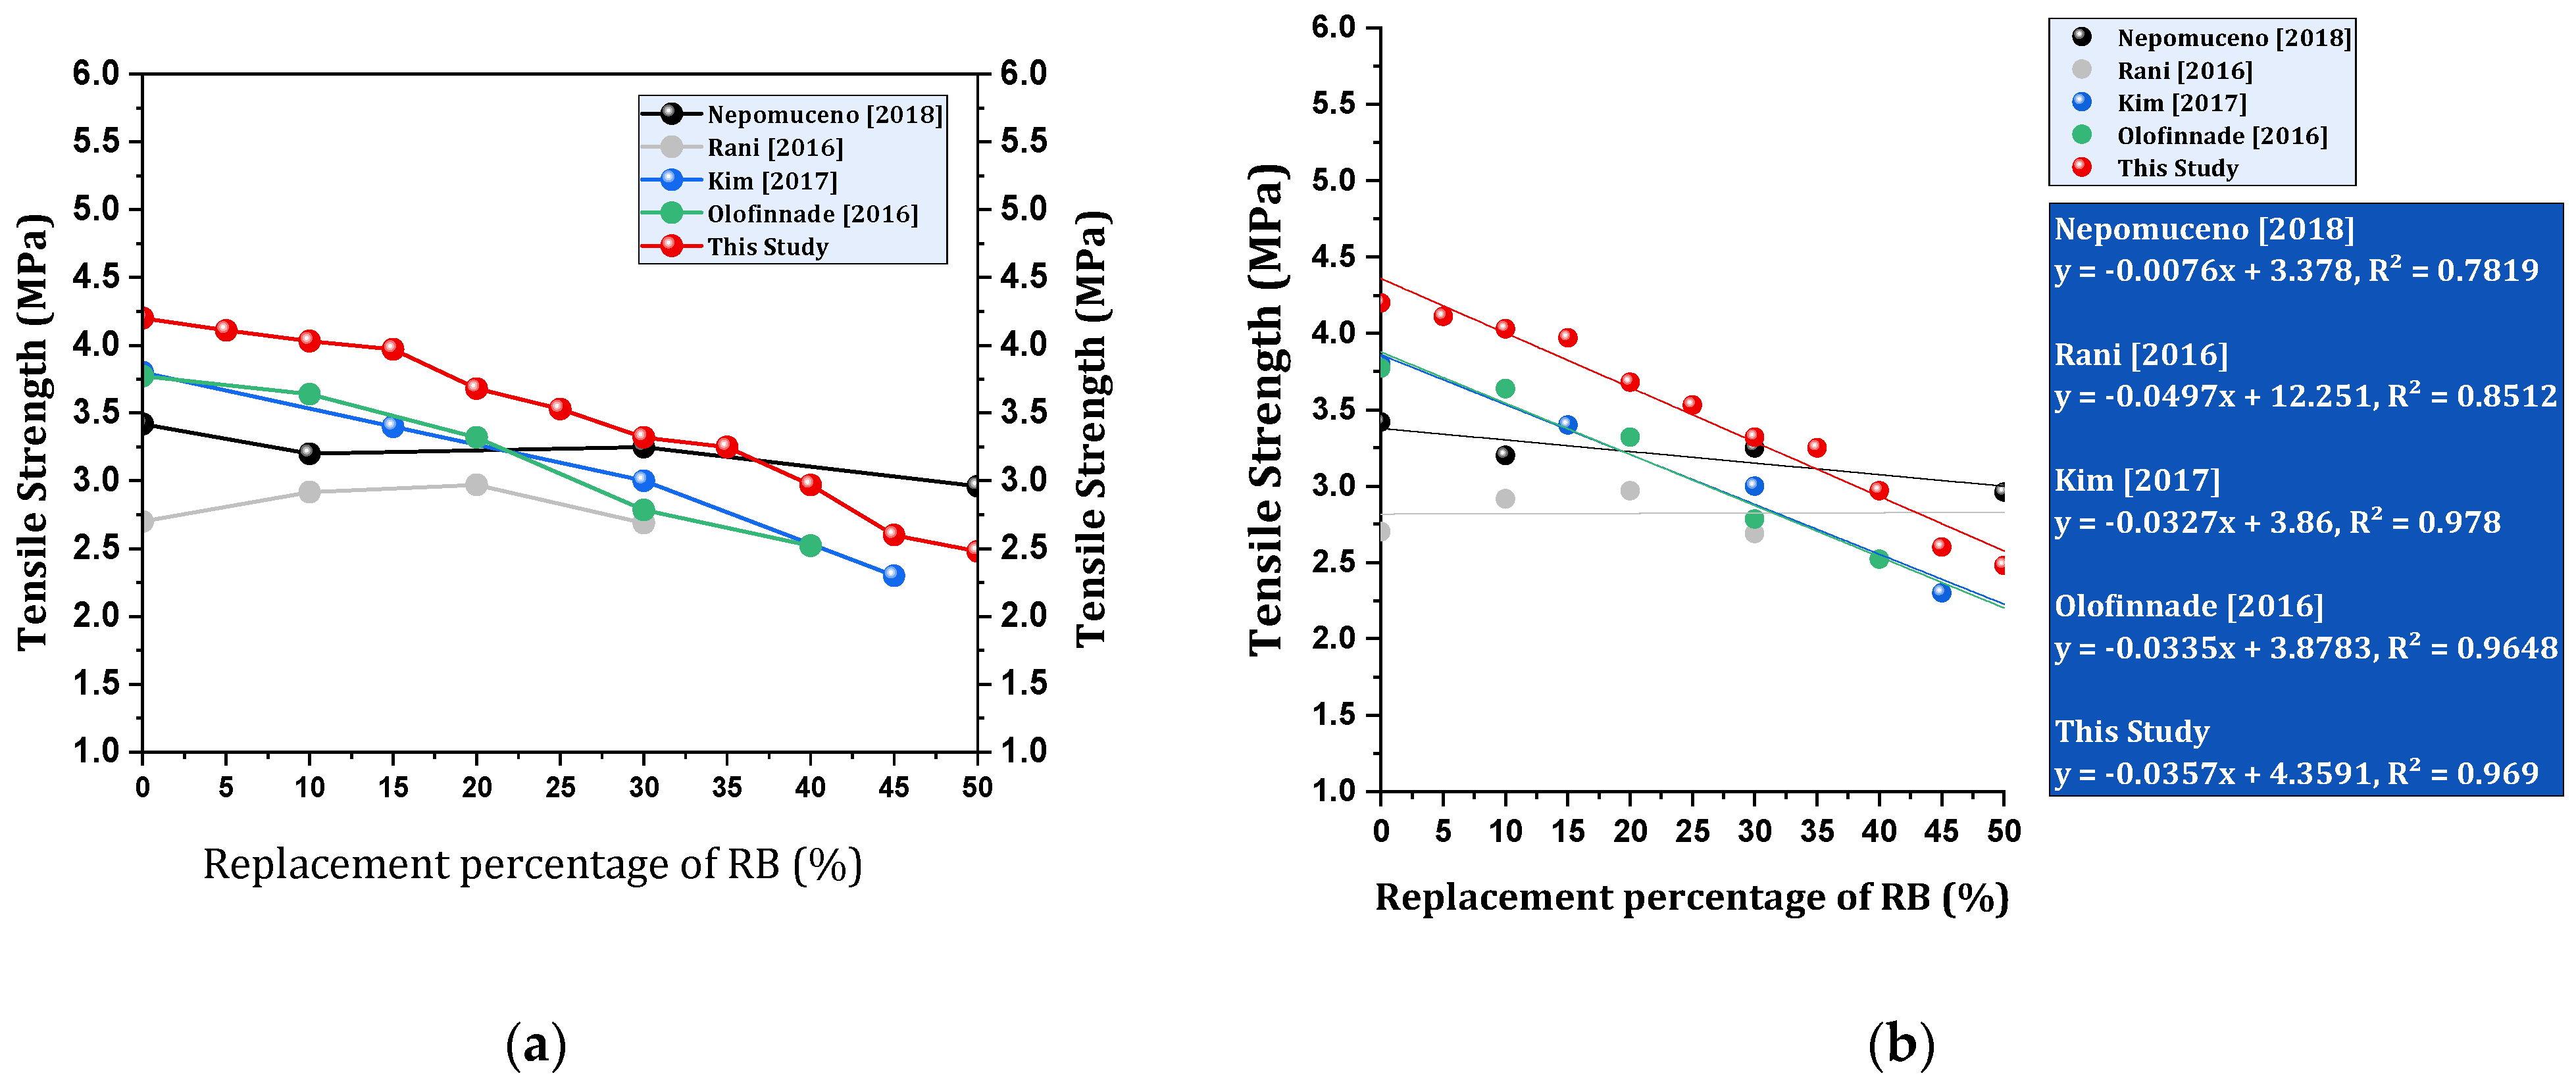
4.1.4. Tensile Strength
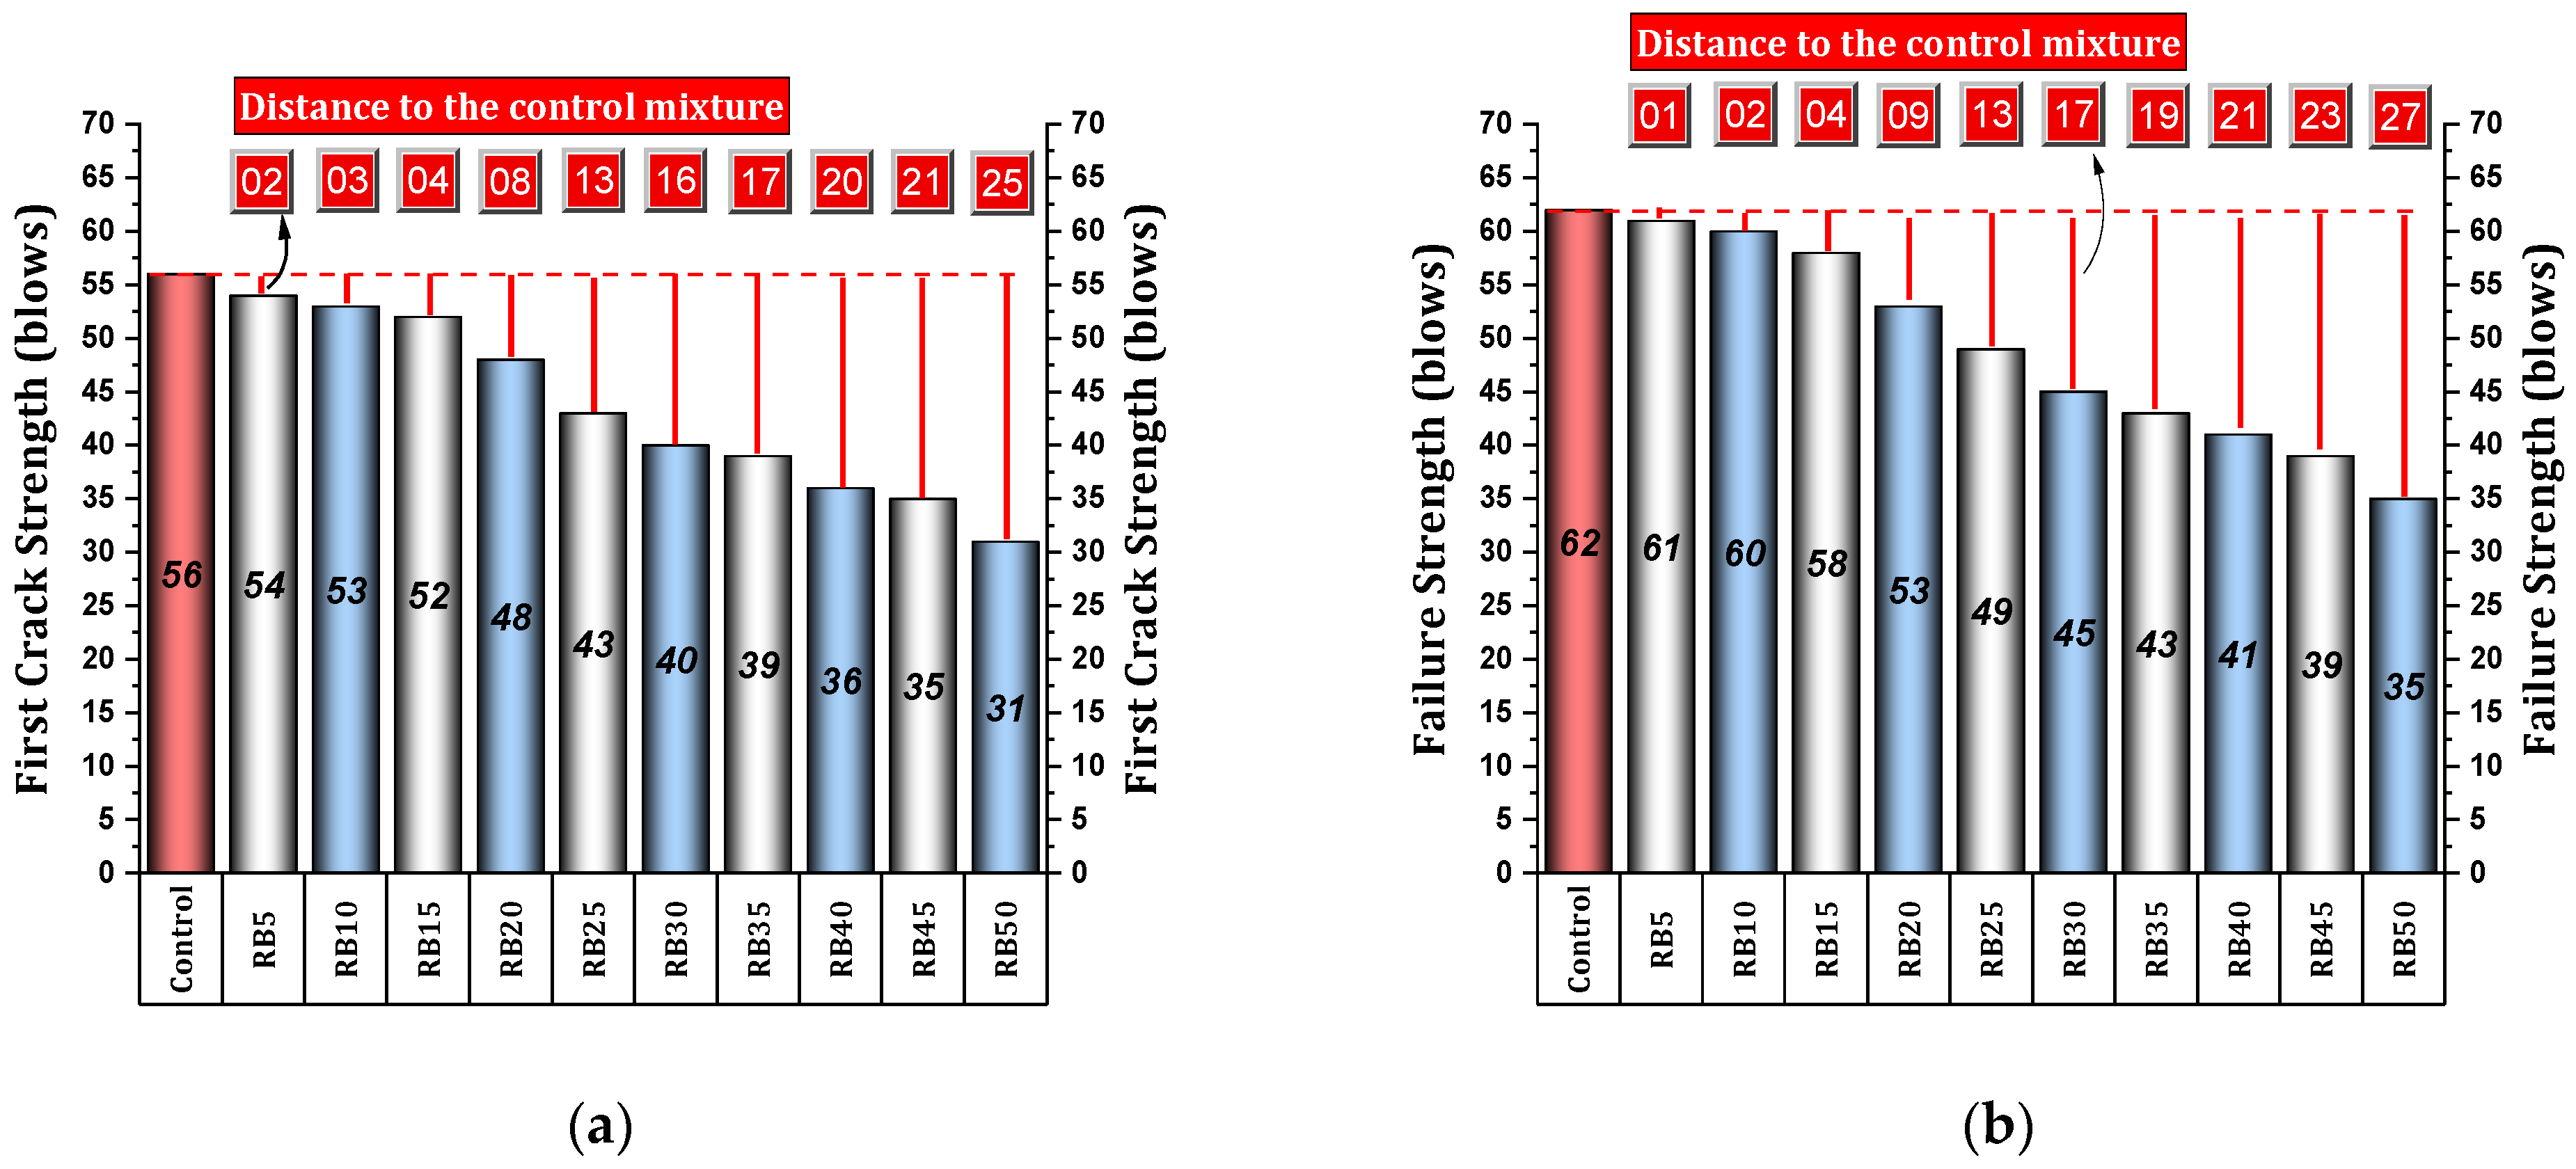
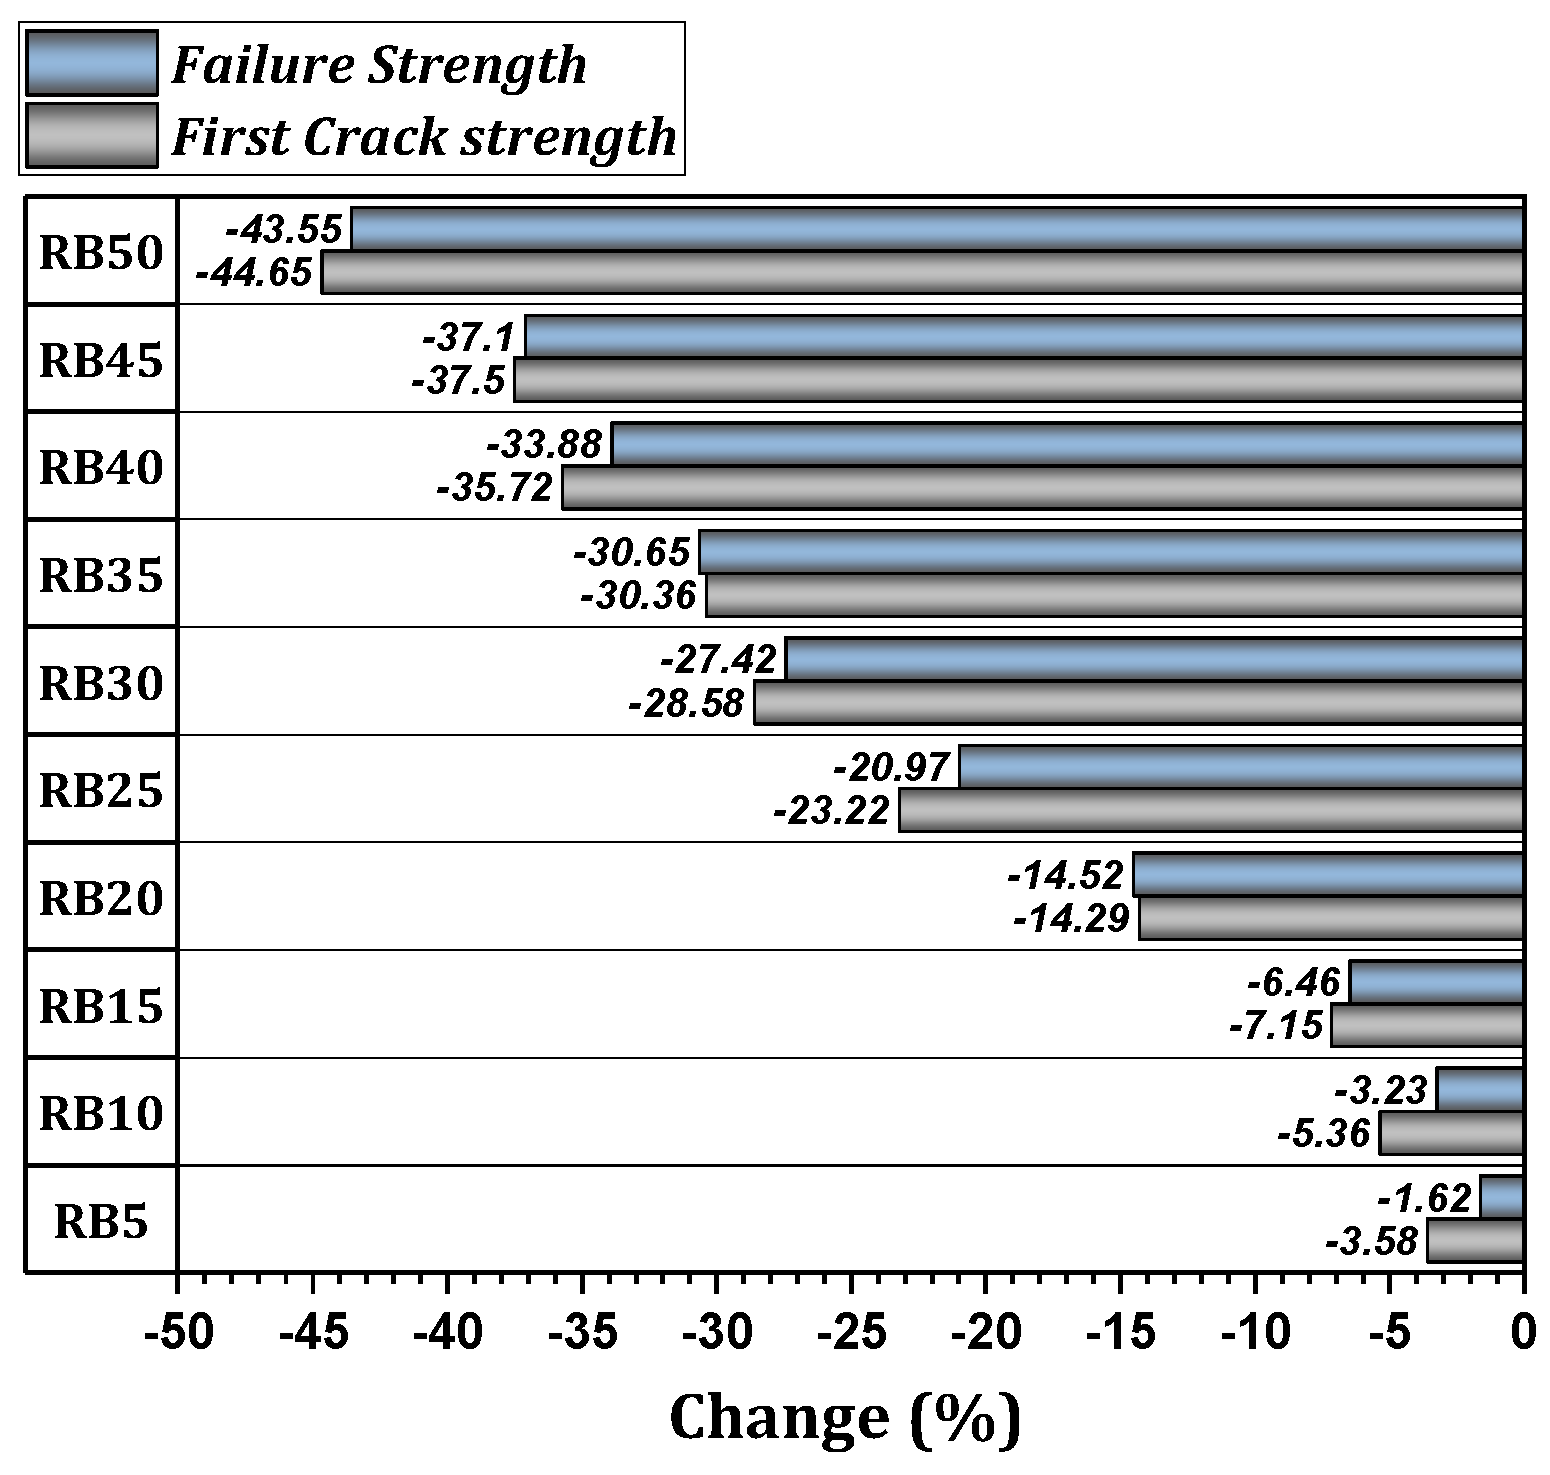
4.1.5. Impact Strength—First Crack Strength & Failure Strength
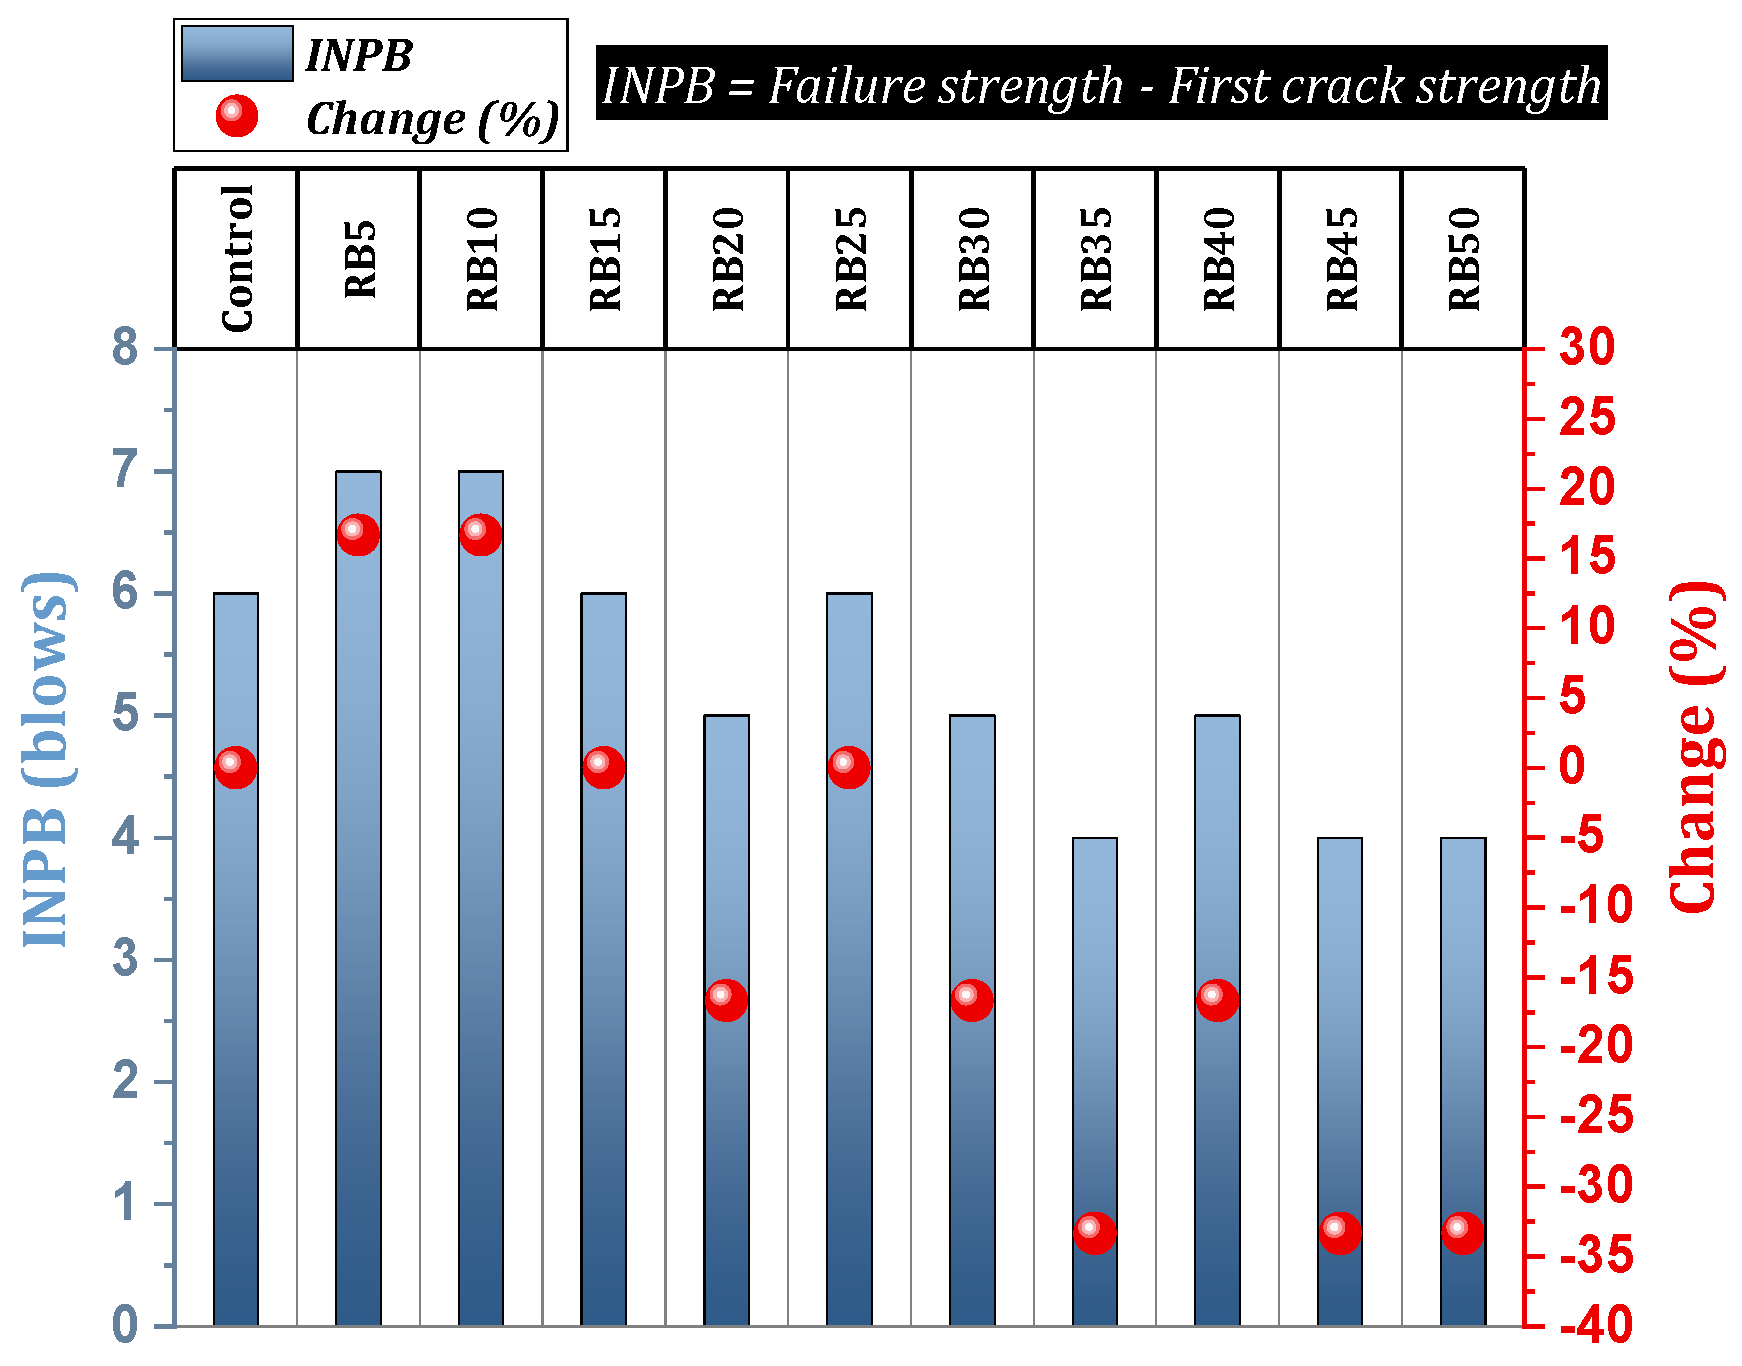
4.1.6. Impact Strength—INPB, Impact Energy, and Ductility Index
4.2. Numerical Analysis
4.2.1. Prediction of Compressive Strength (By ANN and FL)
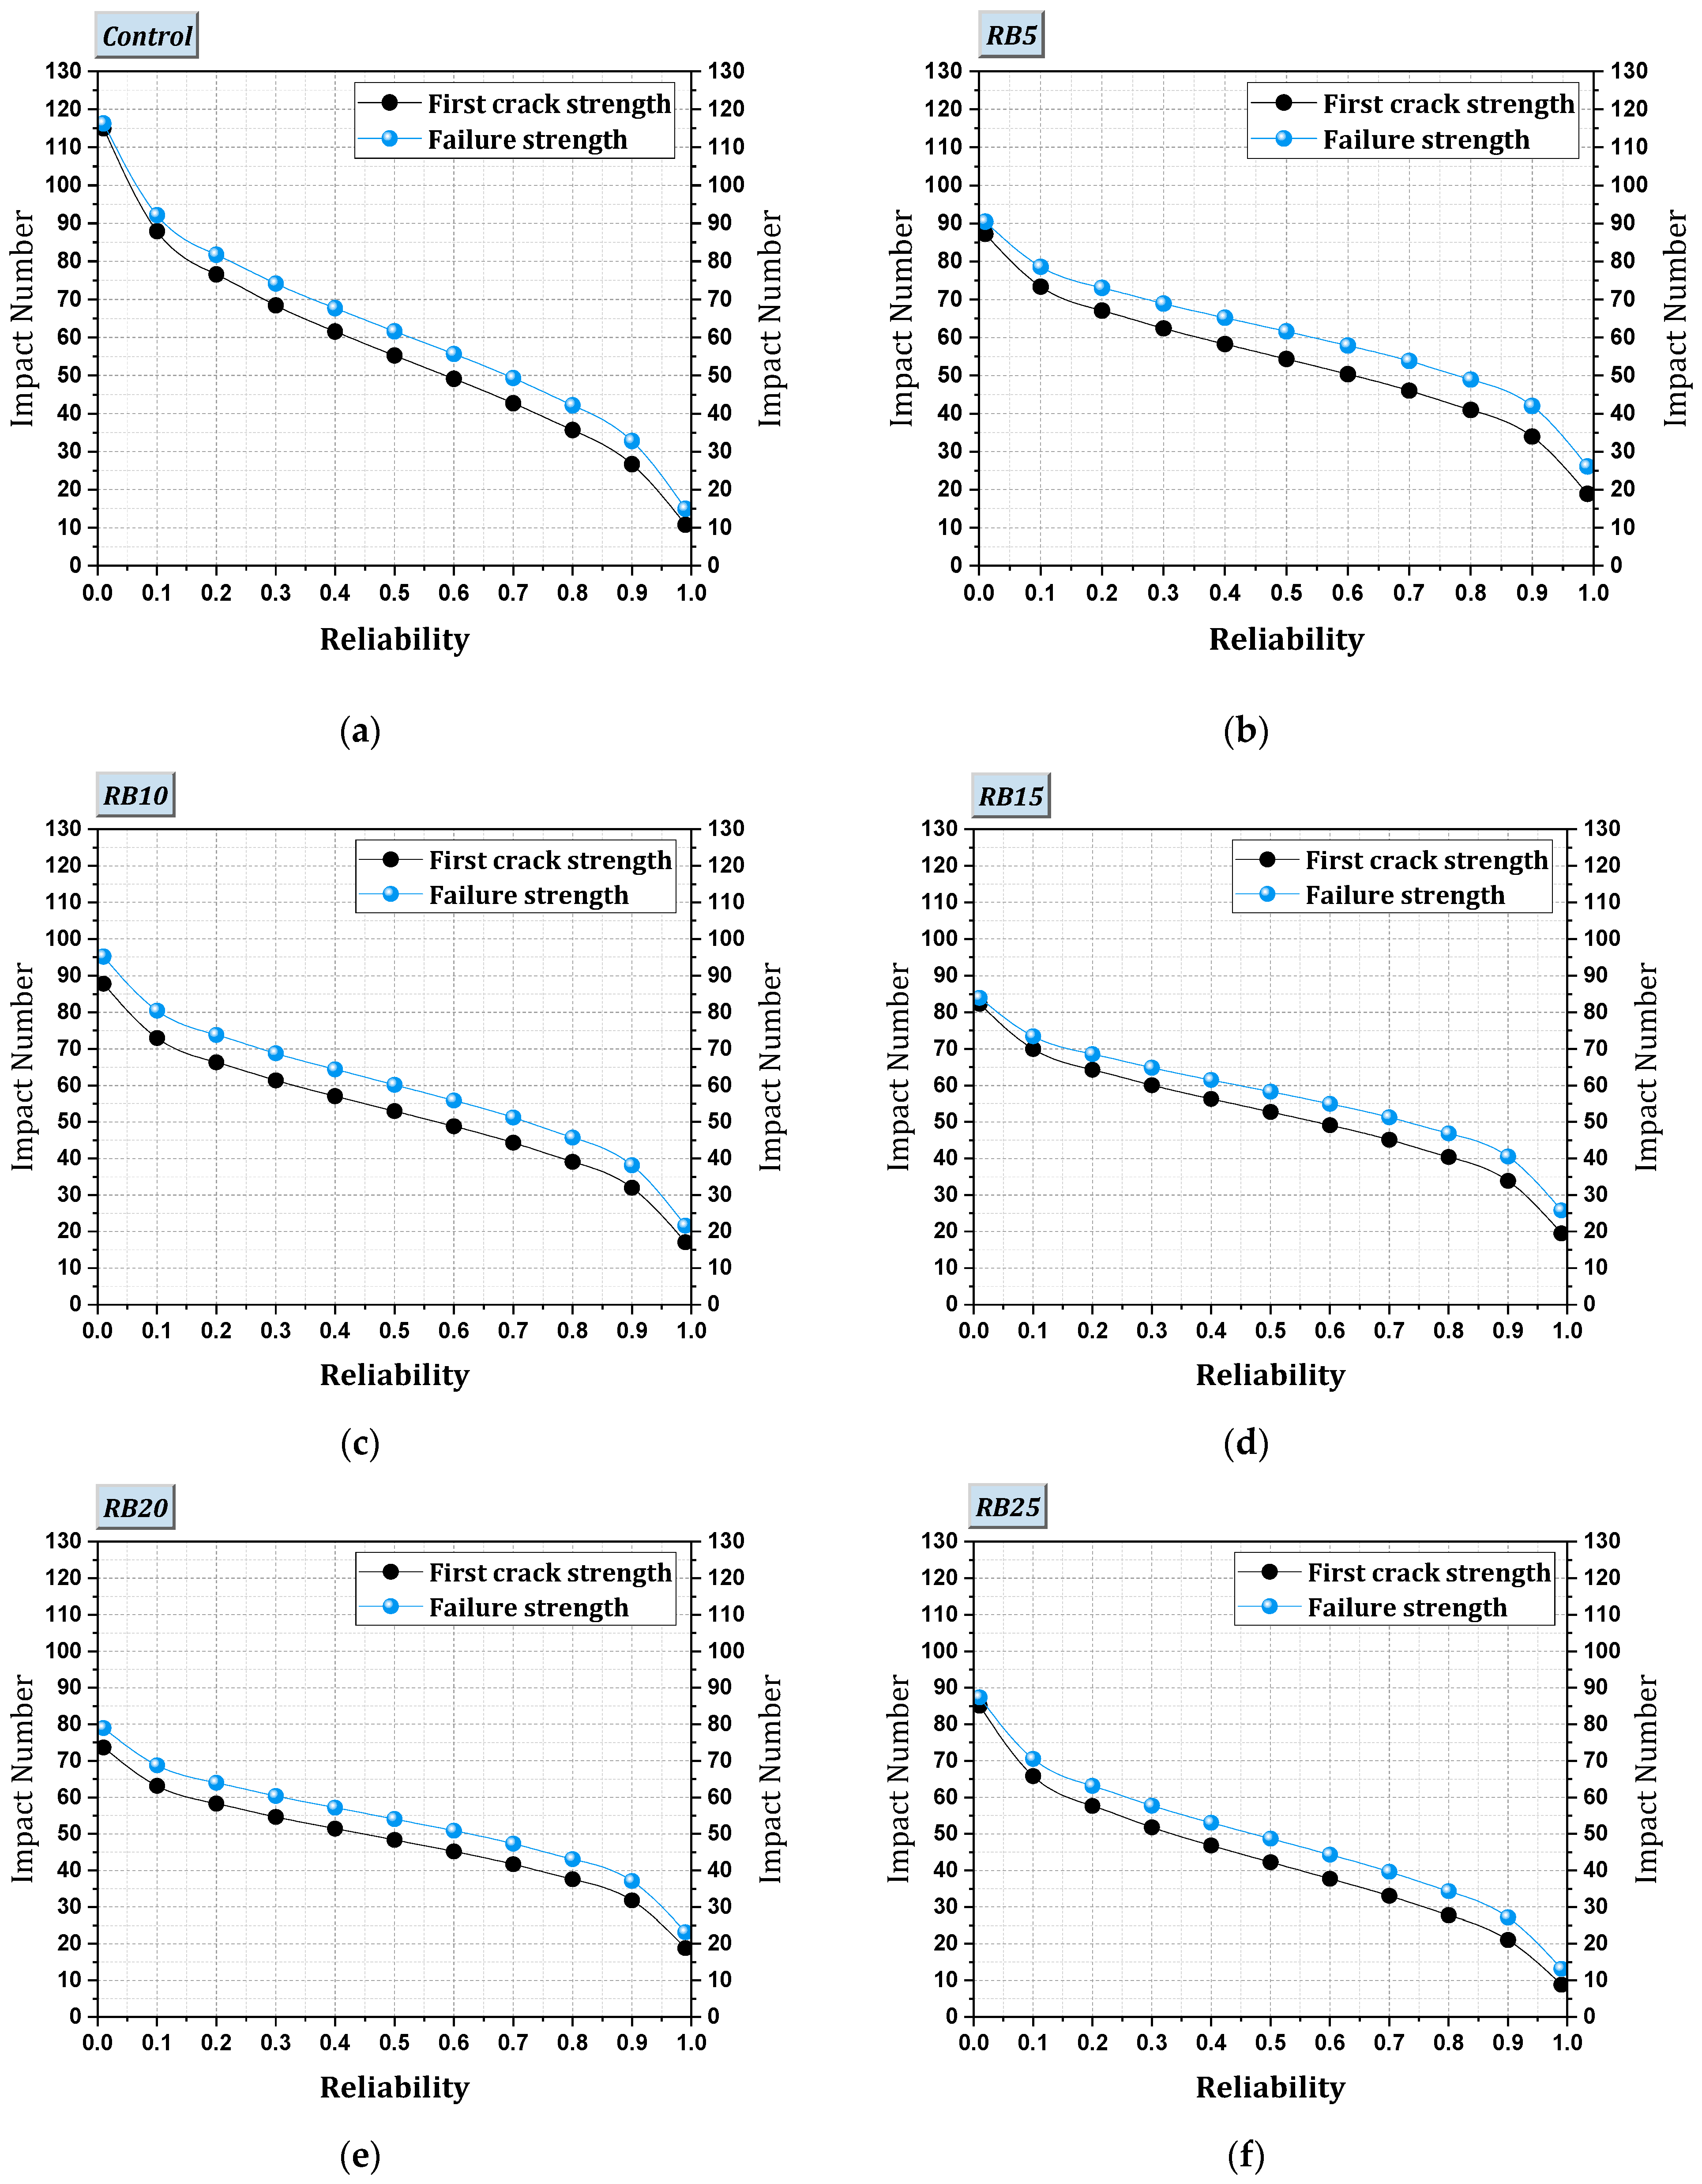
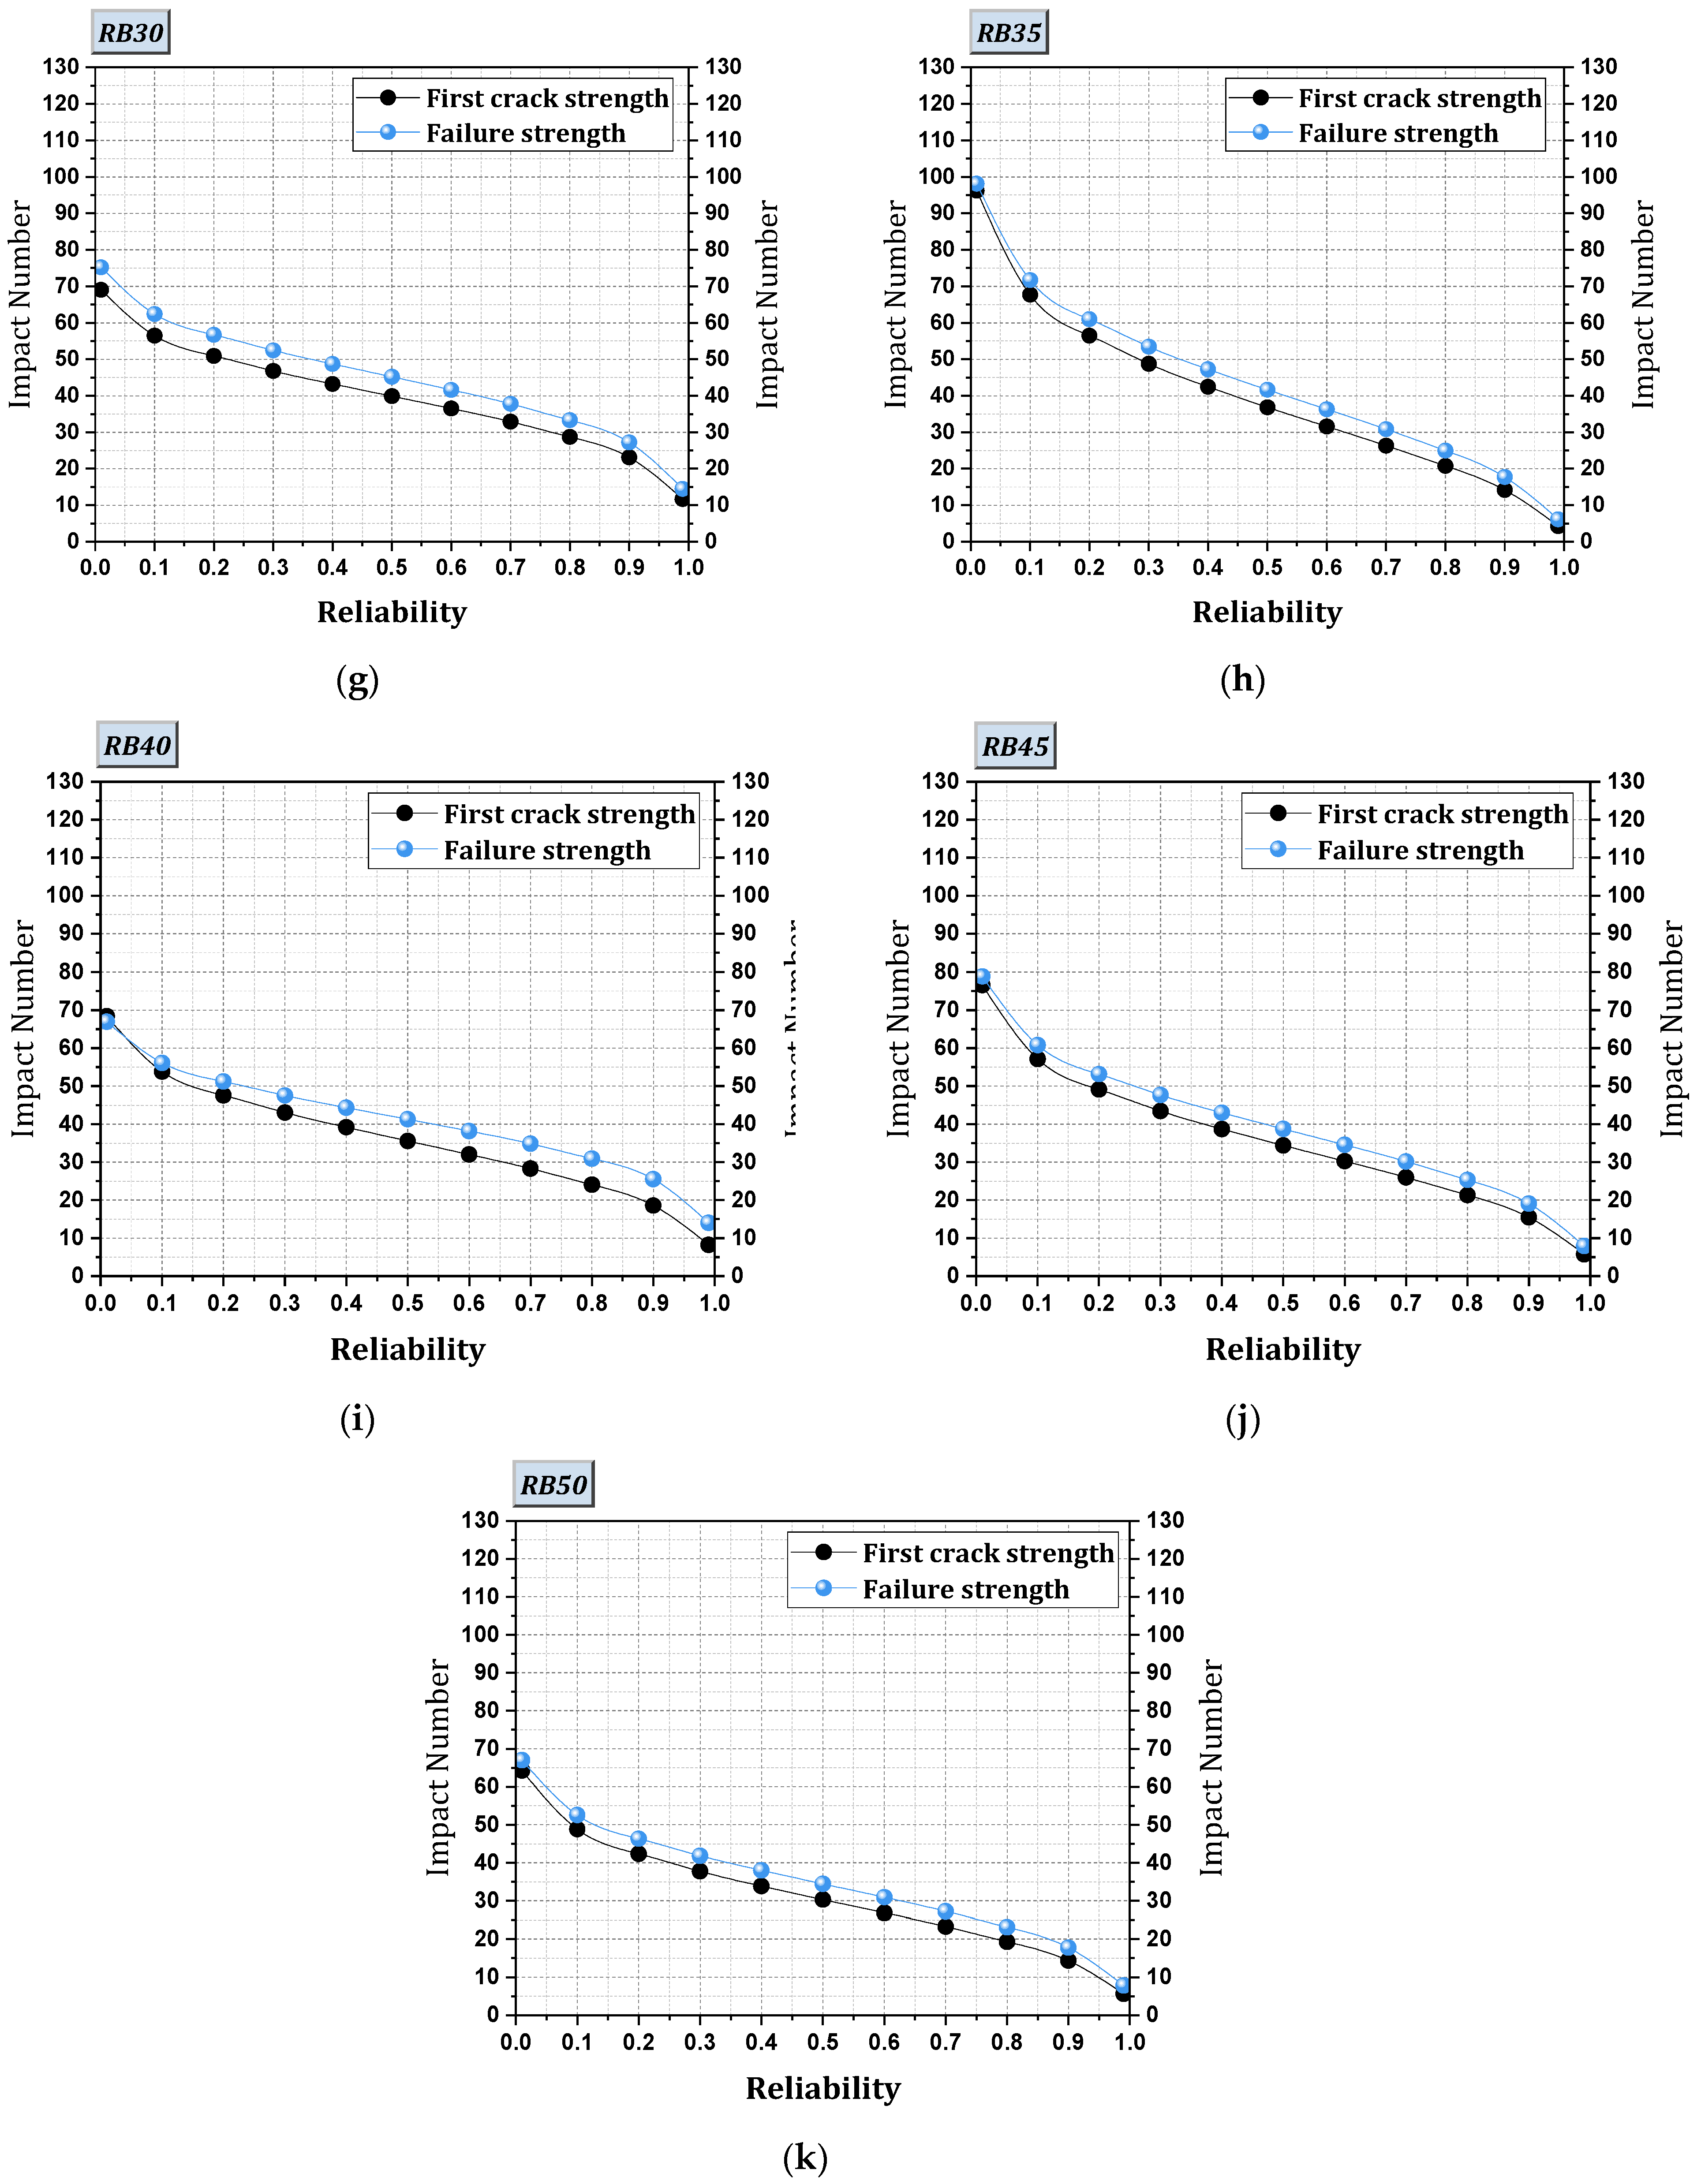
4.2.2. Statistical Analysis of Impact Data (By Weibull Distribution)
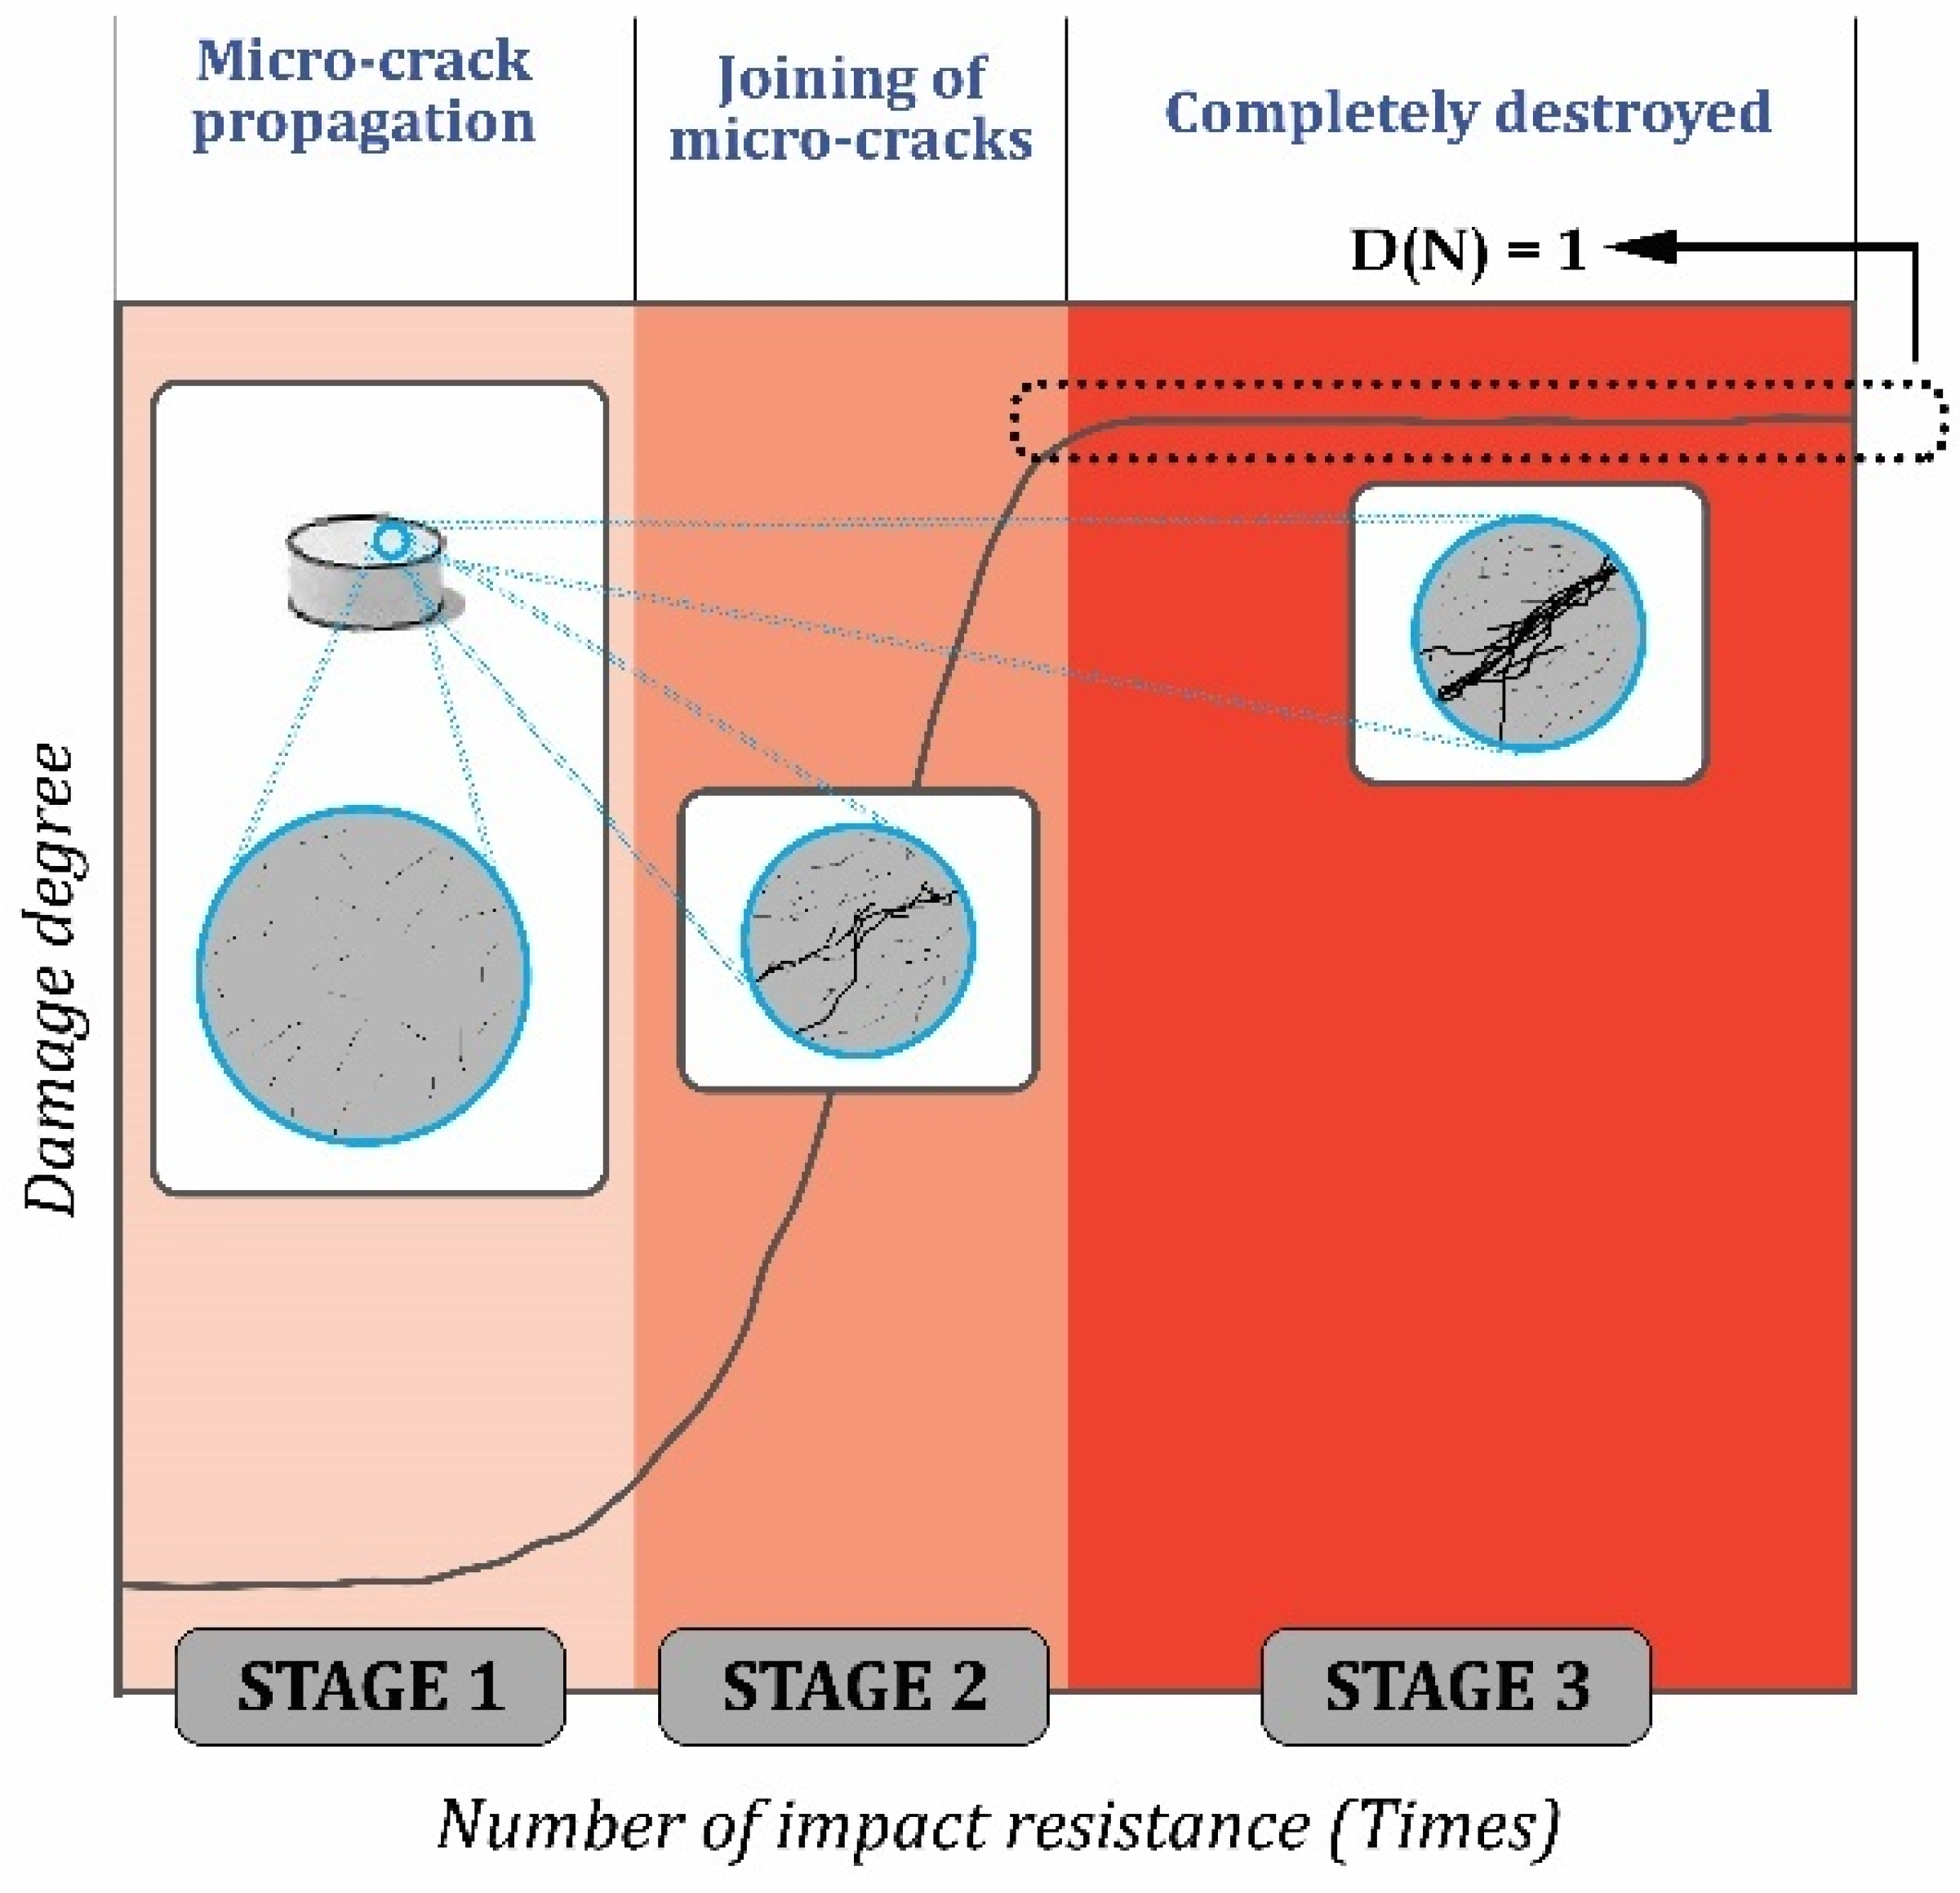
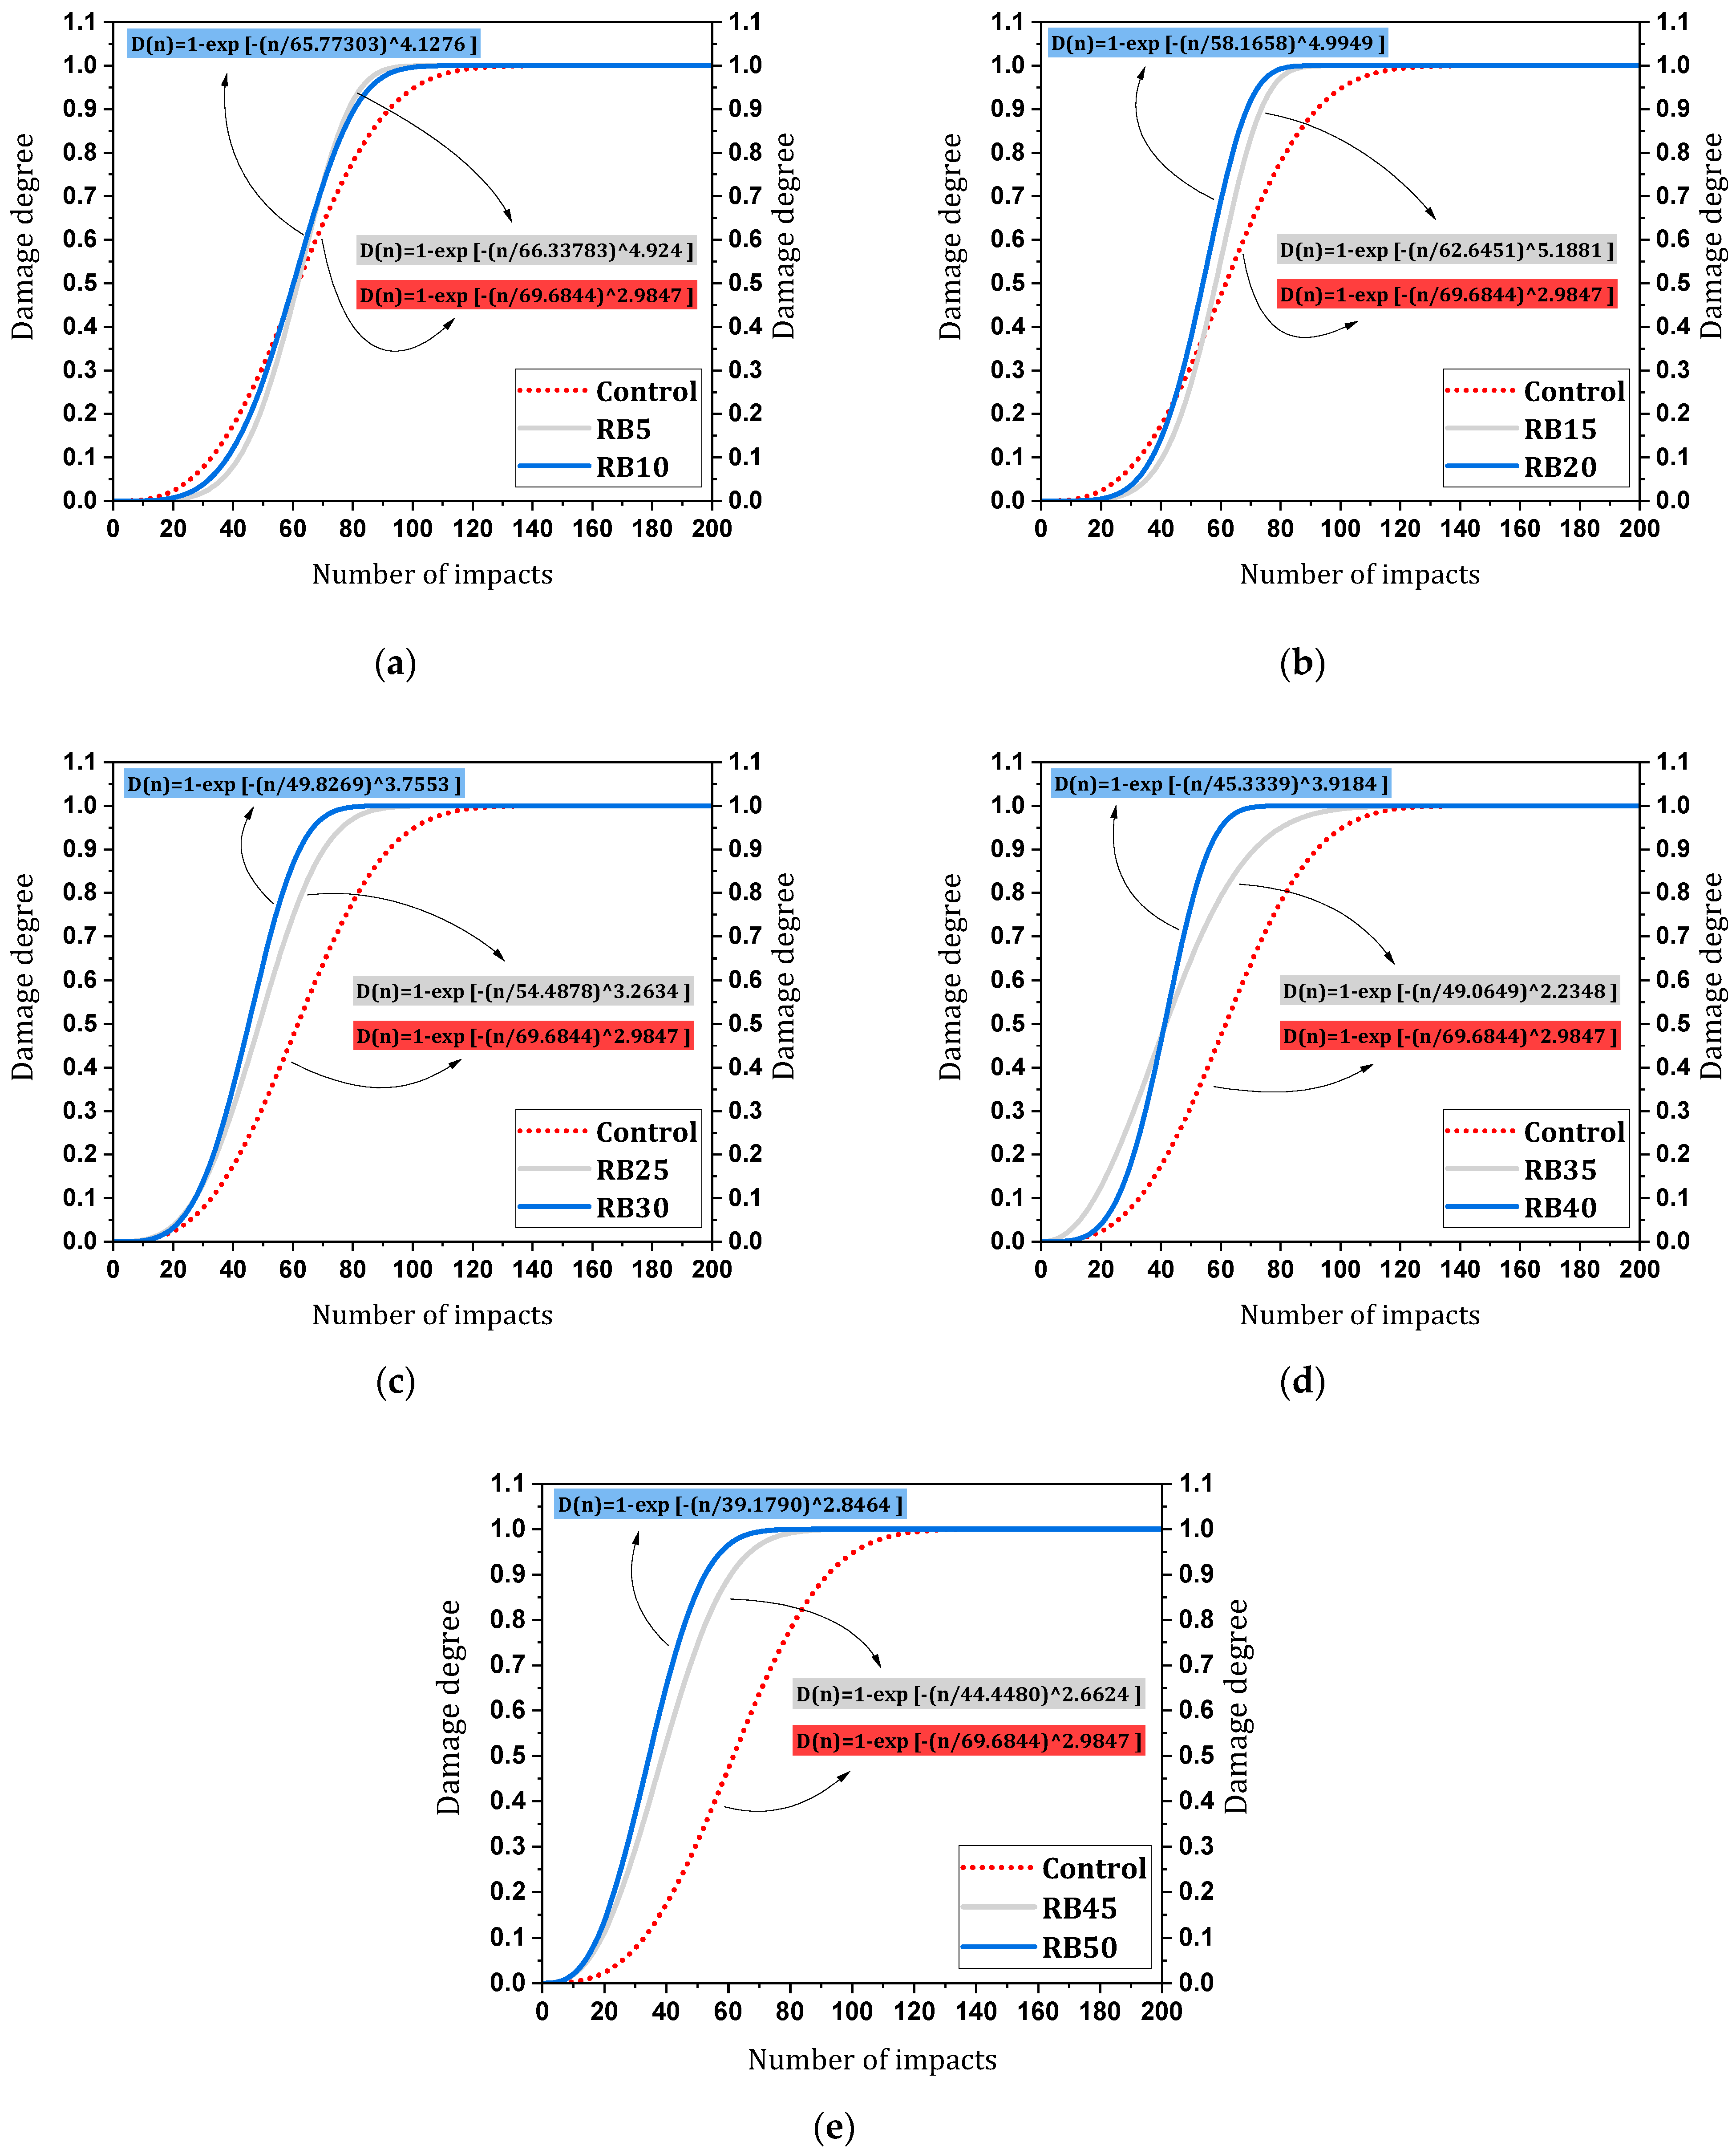
4.2.3. Impact–Damage Analysis
5. Conclusions
- Compressive strength is negatively affected by brick powder substitution. Mixtures with up to 15% brick powder maintain strength, with a slight decline of 1.33% to 3.38%. Beyond this threshold, the decrease in compressive strength becomes significant, exceeding 30% for 50% brick powder replacement.
- Flexural strength remains acceptable with up to 15% brick powder replacement, experiencing a maximum reduction of 3.94%. However, substituting 25% of cement with brick powder results in a reduction exceeding 10%. Higher proportions lead to a significant decline, reaching 22.45% at a 50% replacement rate.
- Tensile strength decreases with brick powder substitution. Replacing 5%, 10%, and 15% of cement with brick powder results in reductions of 2.15%, 4.05%, and 5.48%, respectively. A decrease of over 10% occurs at a 20% replacement level, with reductions of 30–41% noted at 40–50% substitution.
- Impact strength shows a noticeable decline with increased brick powder content. Substituting up to 15% of cement results in a reduction of slightly less than 10% in the first crack strength. Higher ratios (20% to 30%) lead to reductions of 14.29% to 28.57%, with a significant decrease of 44.65% for 50% replacement. Mixtures containing 5%, 10%, and 15% brick powder exhibit a slight decrease (1% to 6%) in the failure strength while mixtures exceeding 20% result in a reduction of 14.52%. Notably, the reduction increases significantly within the 40% to 50% range, reaching 33.88% to 43.55%.
- Substituting 5% to 10% of cement with brick powder improves INPB by nearly 17%. Replacements of 5% to 15% slightly decrease energy absorption by about 7%. Higher substitution rates significantly reduce energy absorption by 30% to 44%, while brick powder notably increases the mixture’s ductility index.
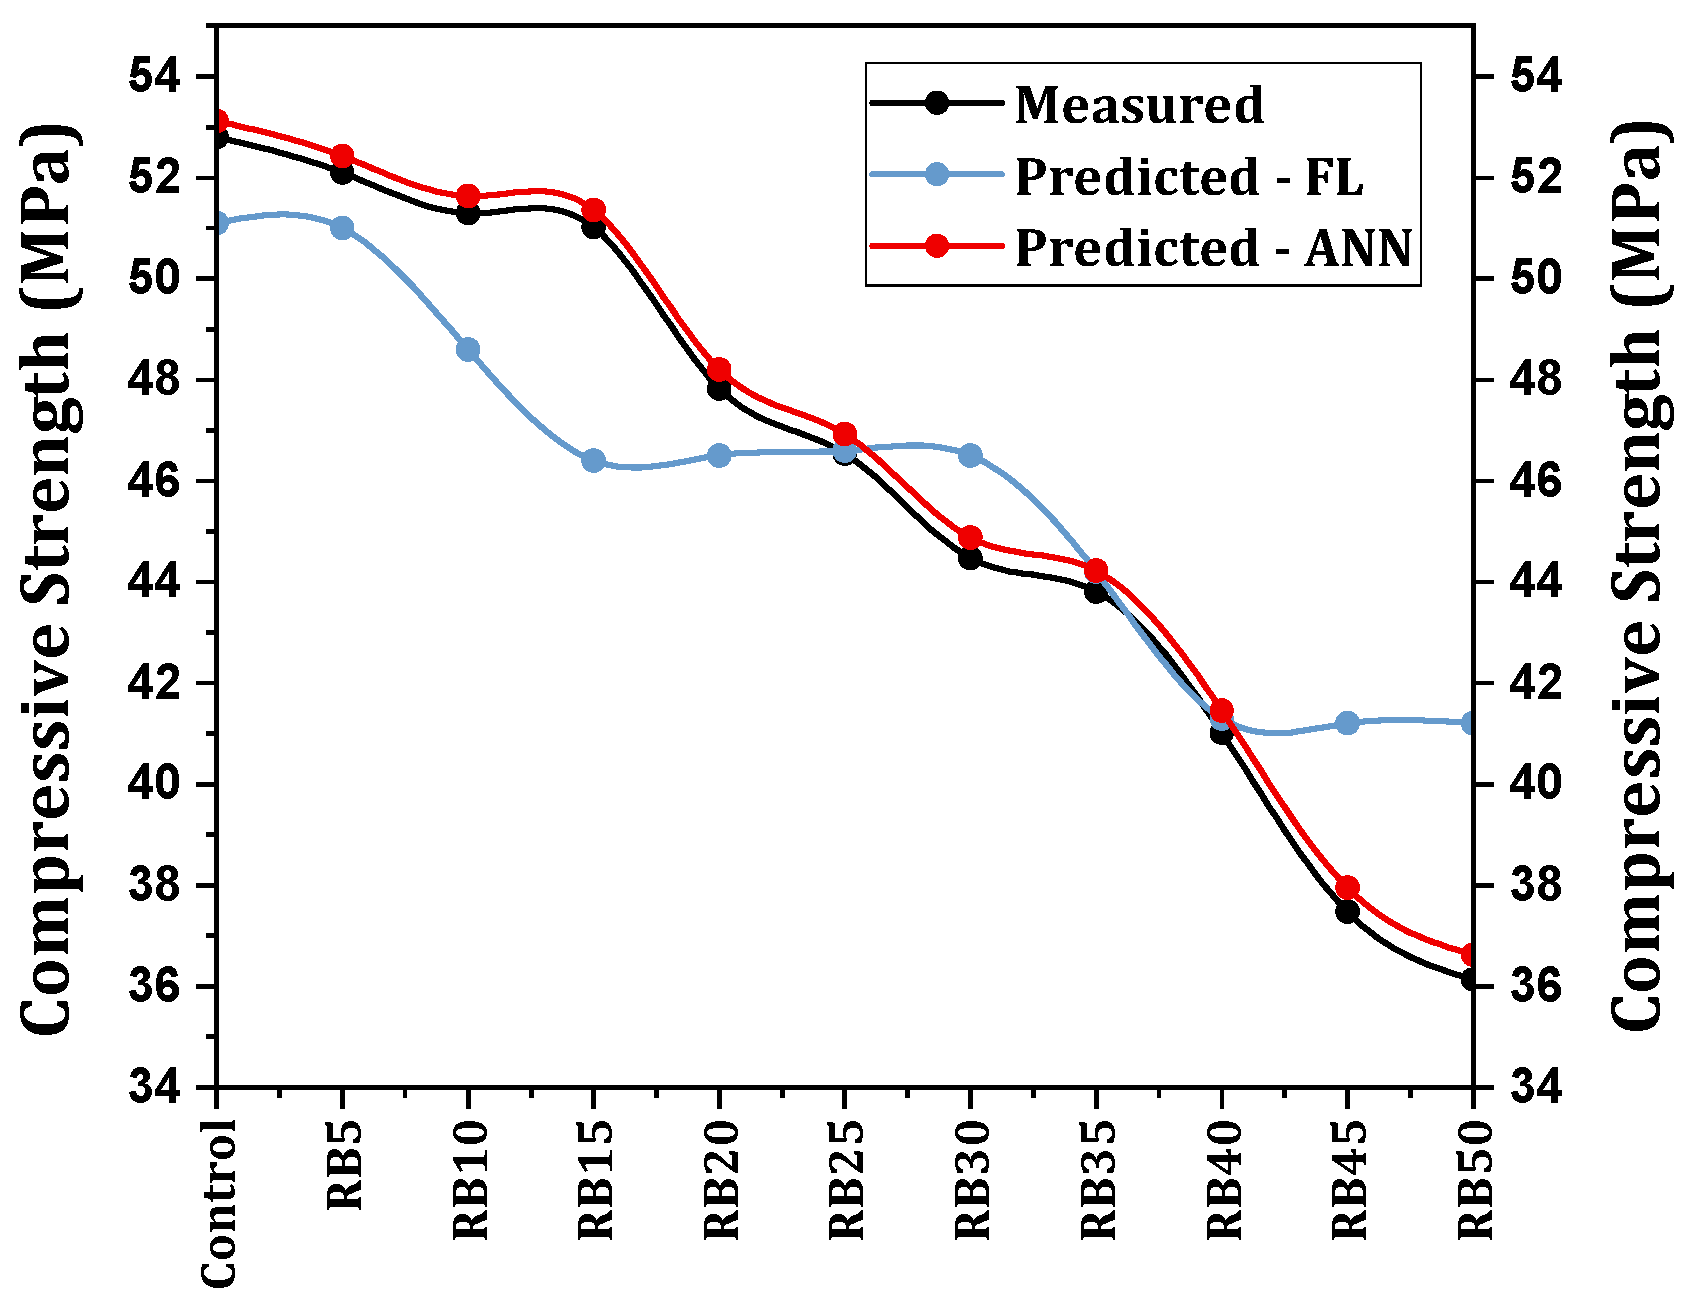
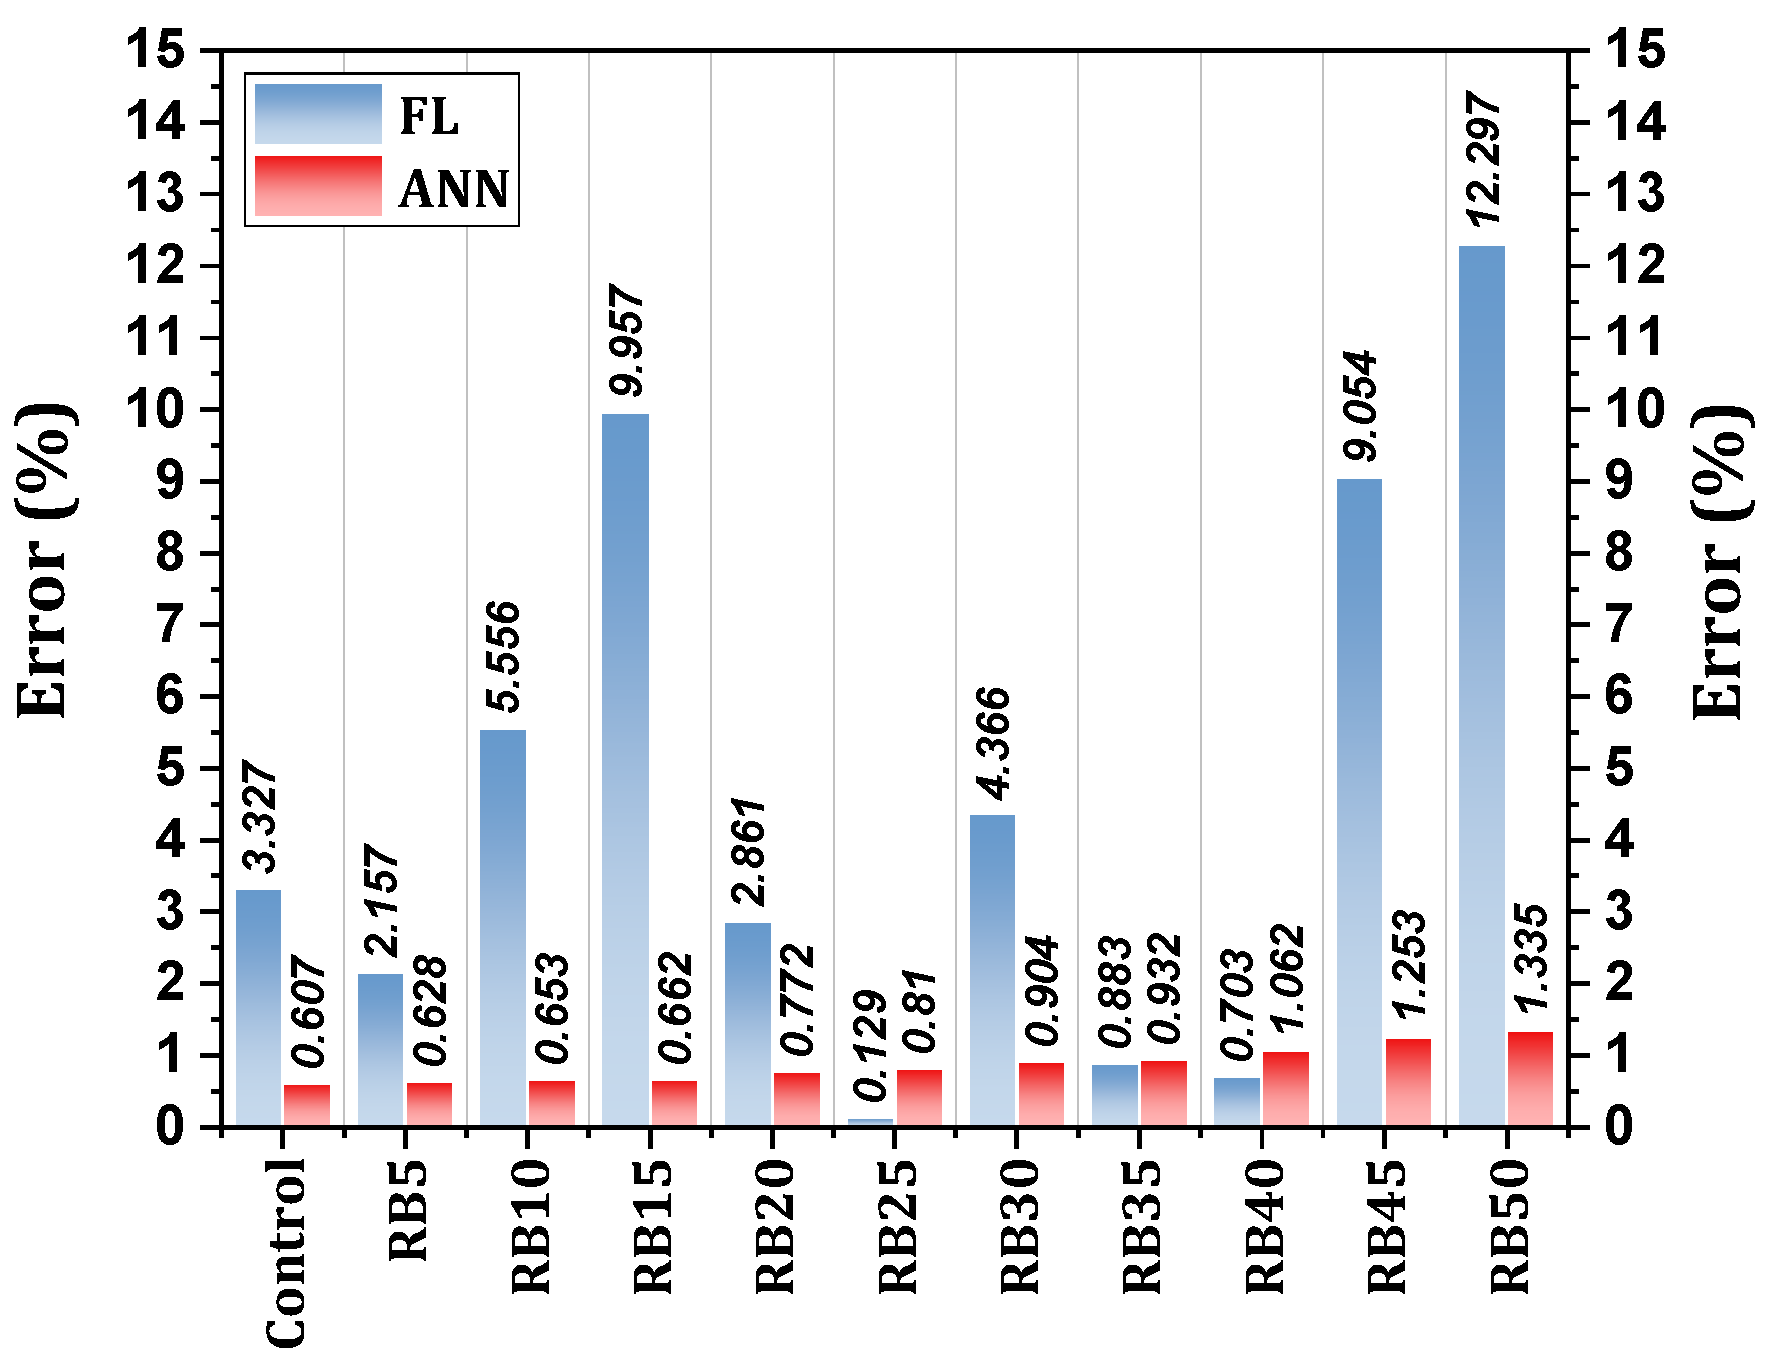
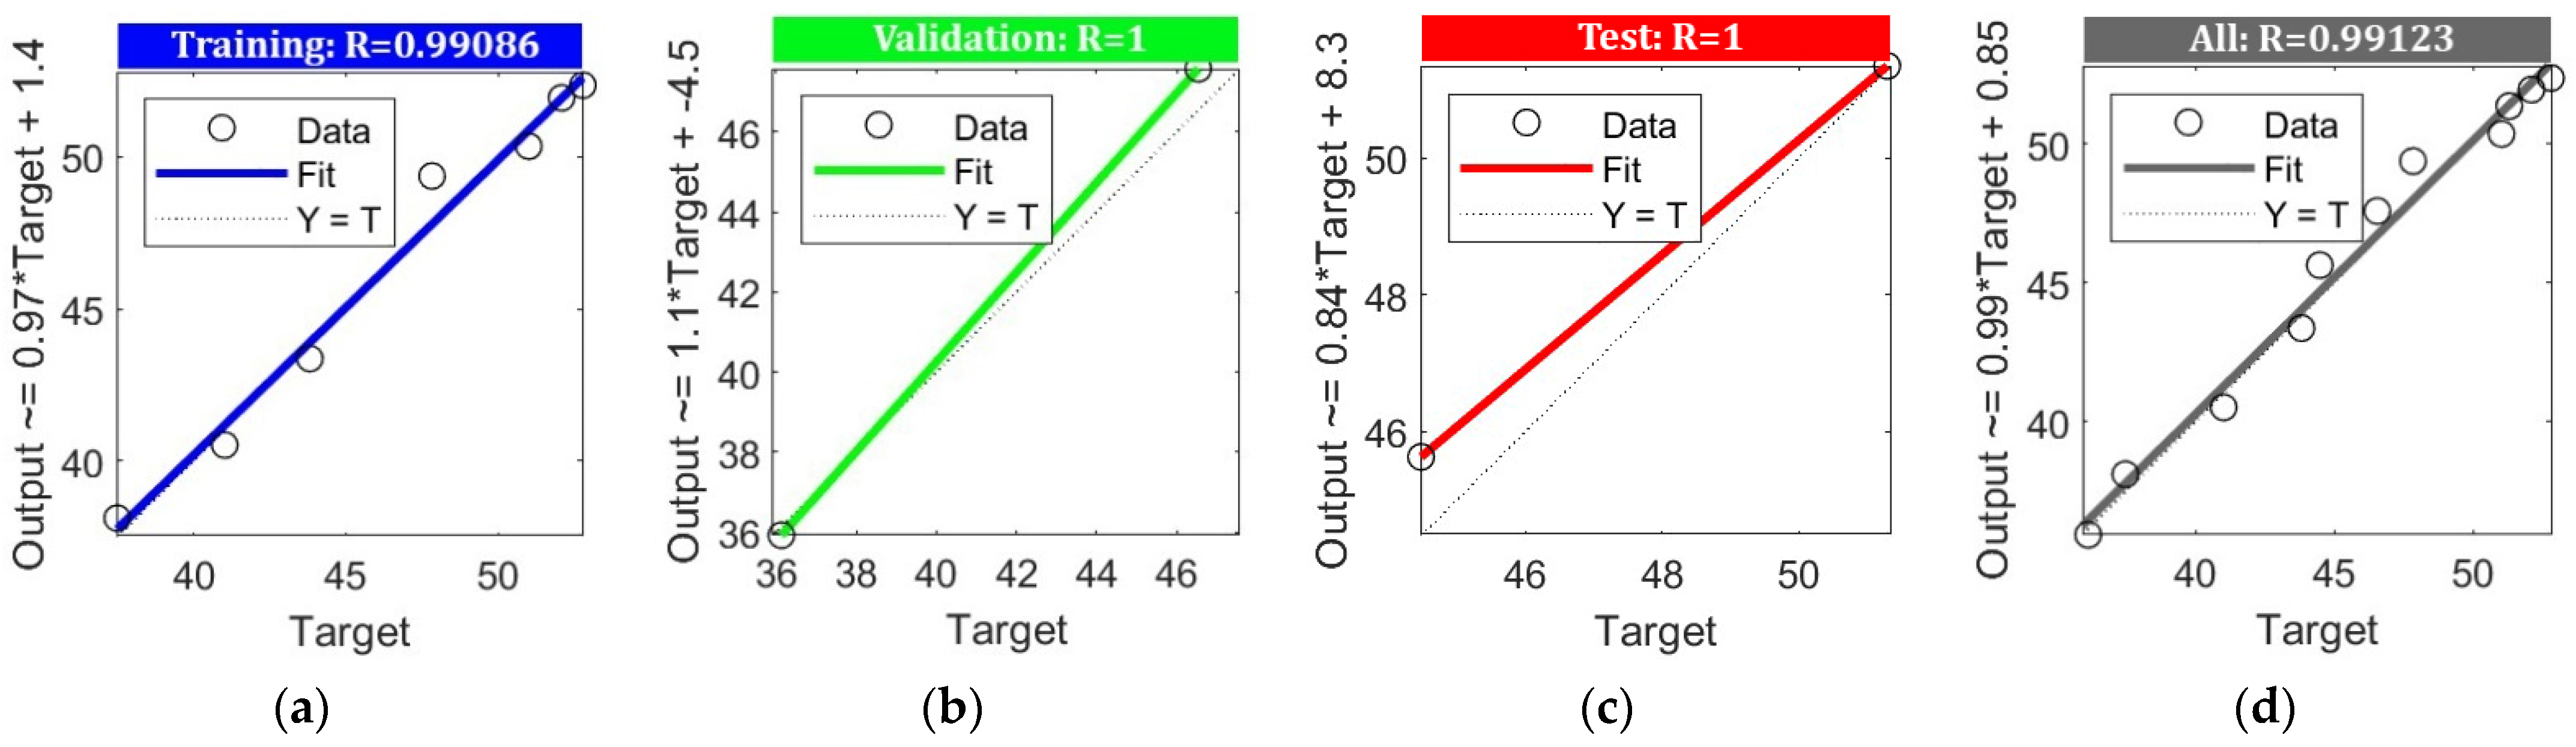
- The ANN model accurately forecasts compressive strength, achieving an average error of only 0.87%. In contrast, the FL model has a larger average error of 4.66%. The strong relationship between the predictions made by the ANN model and the actual results is reflected in its regression coefficient, which exceeds 0.98, demonstrating the model’s effectiveness in predicting experimental results.
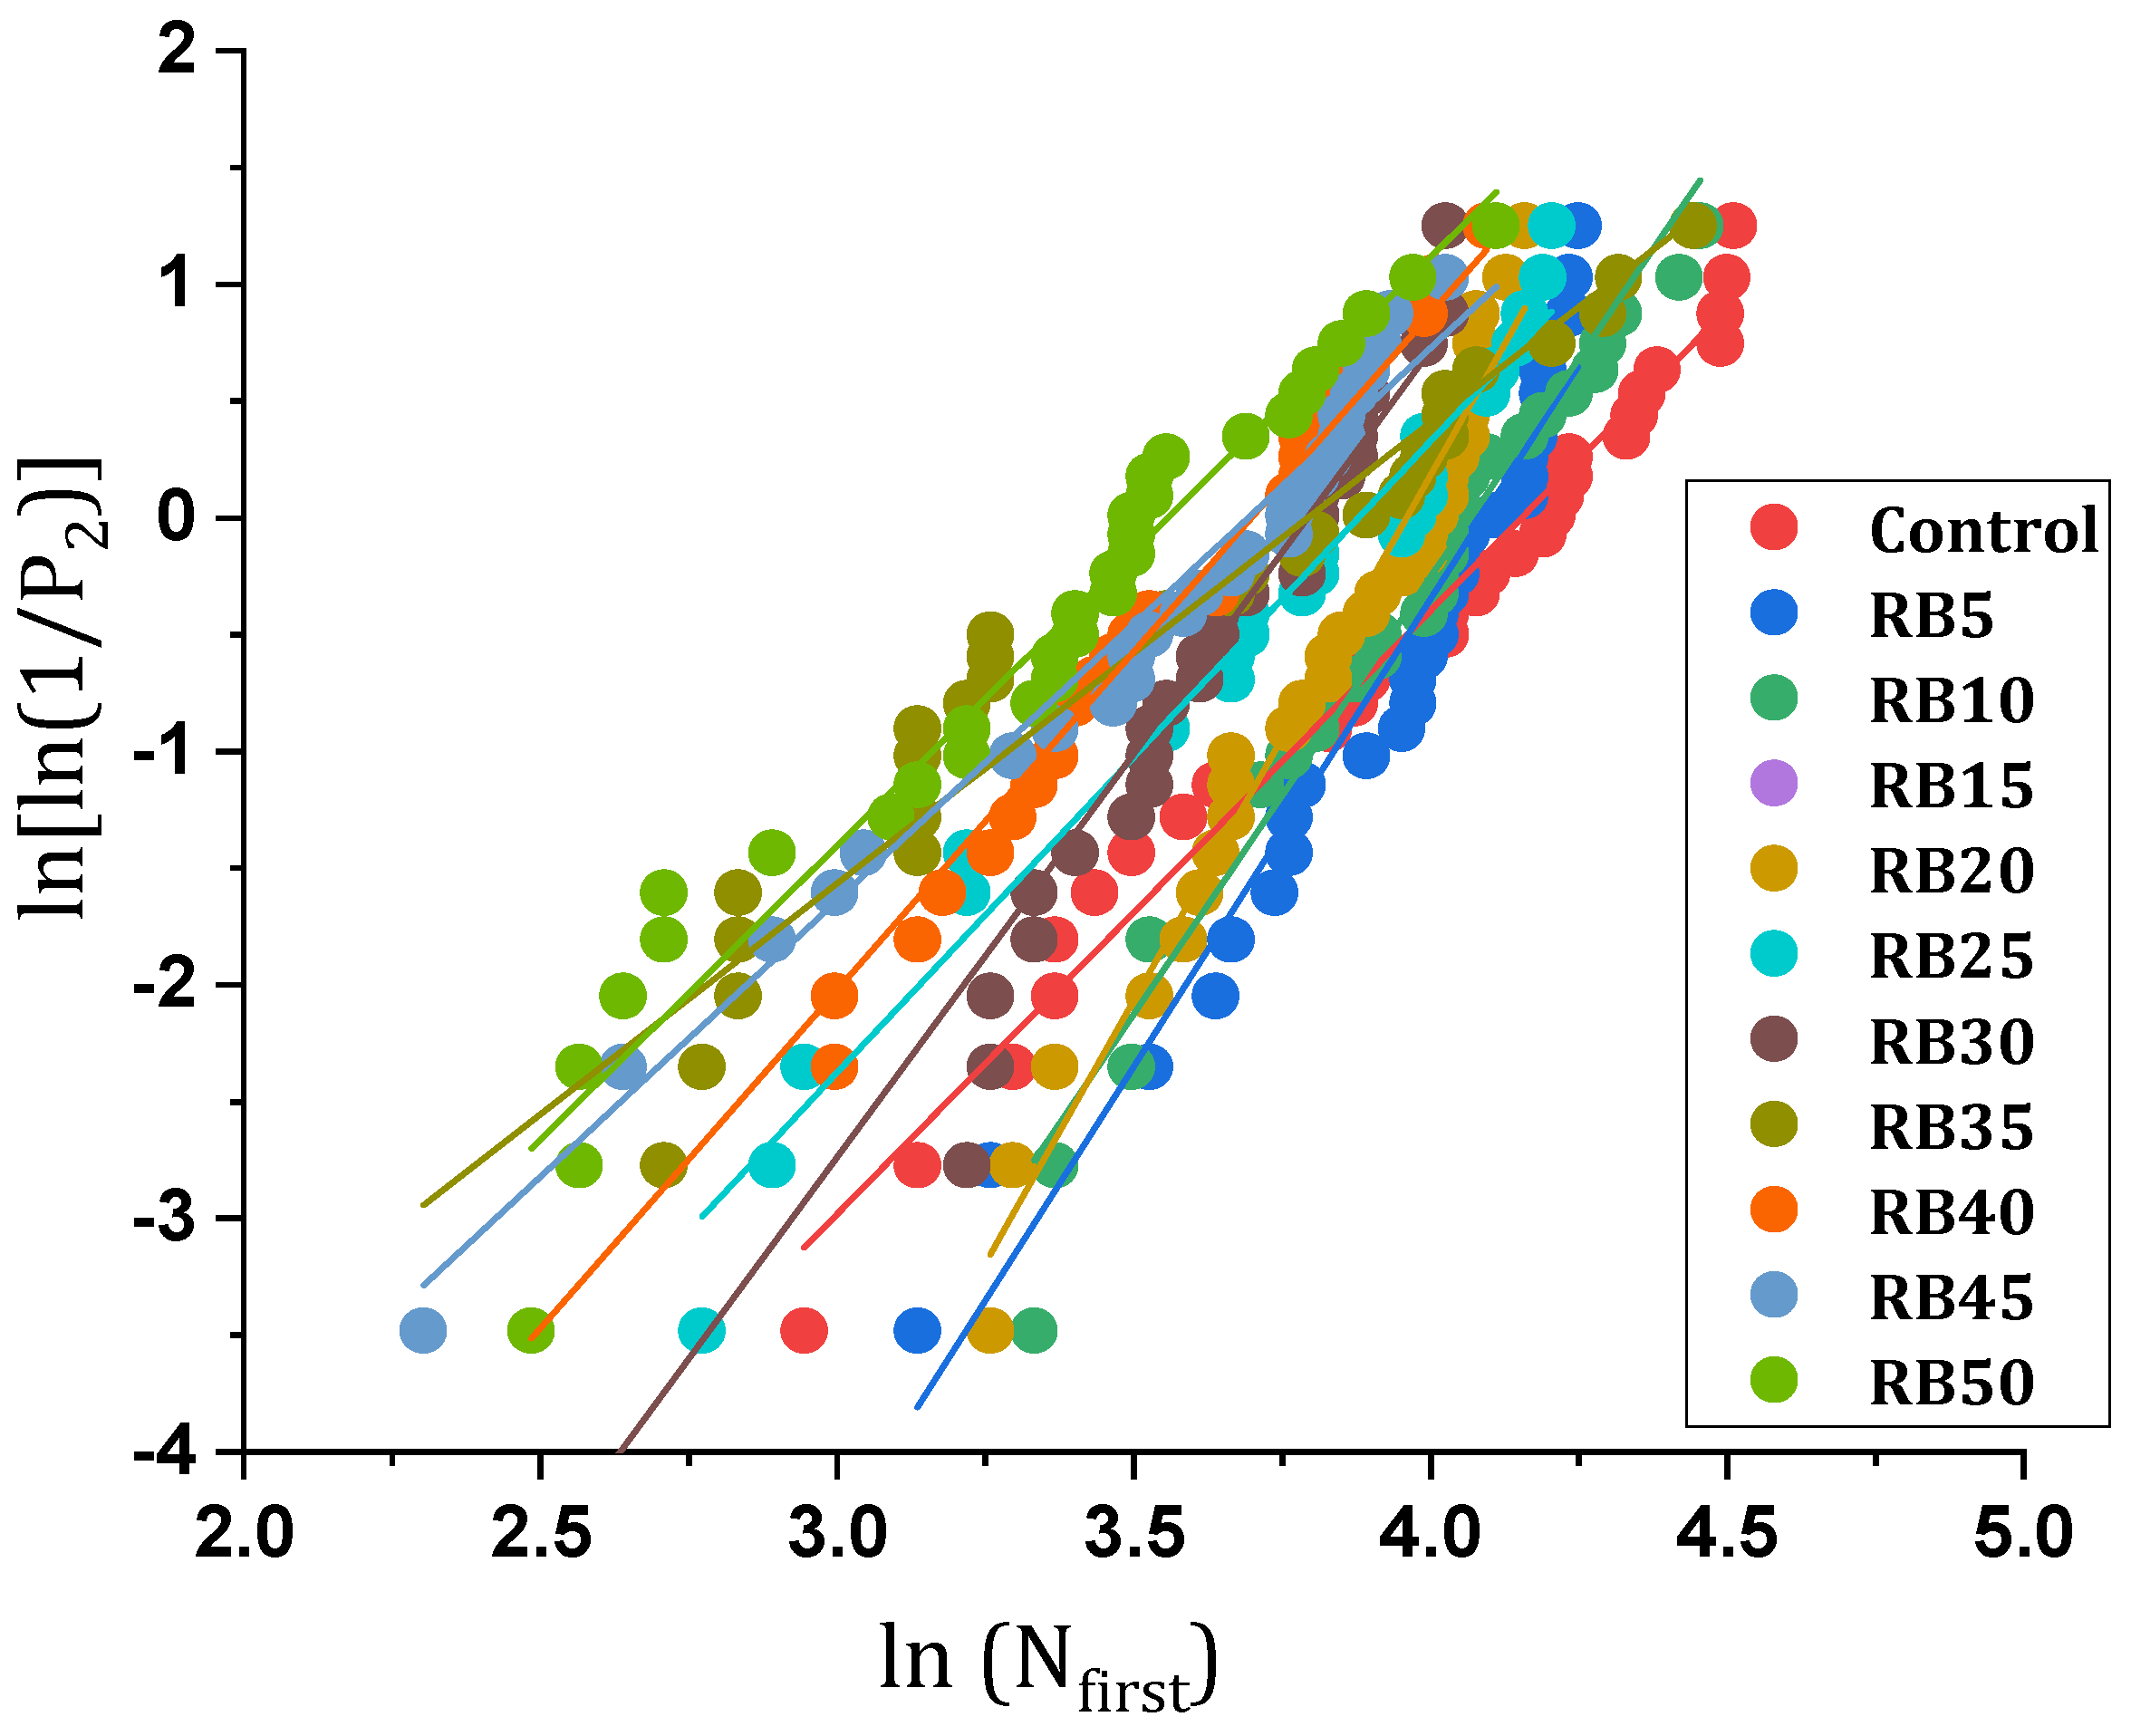
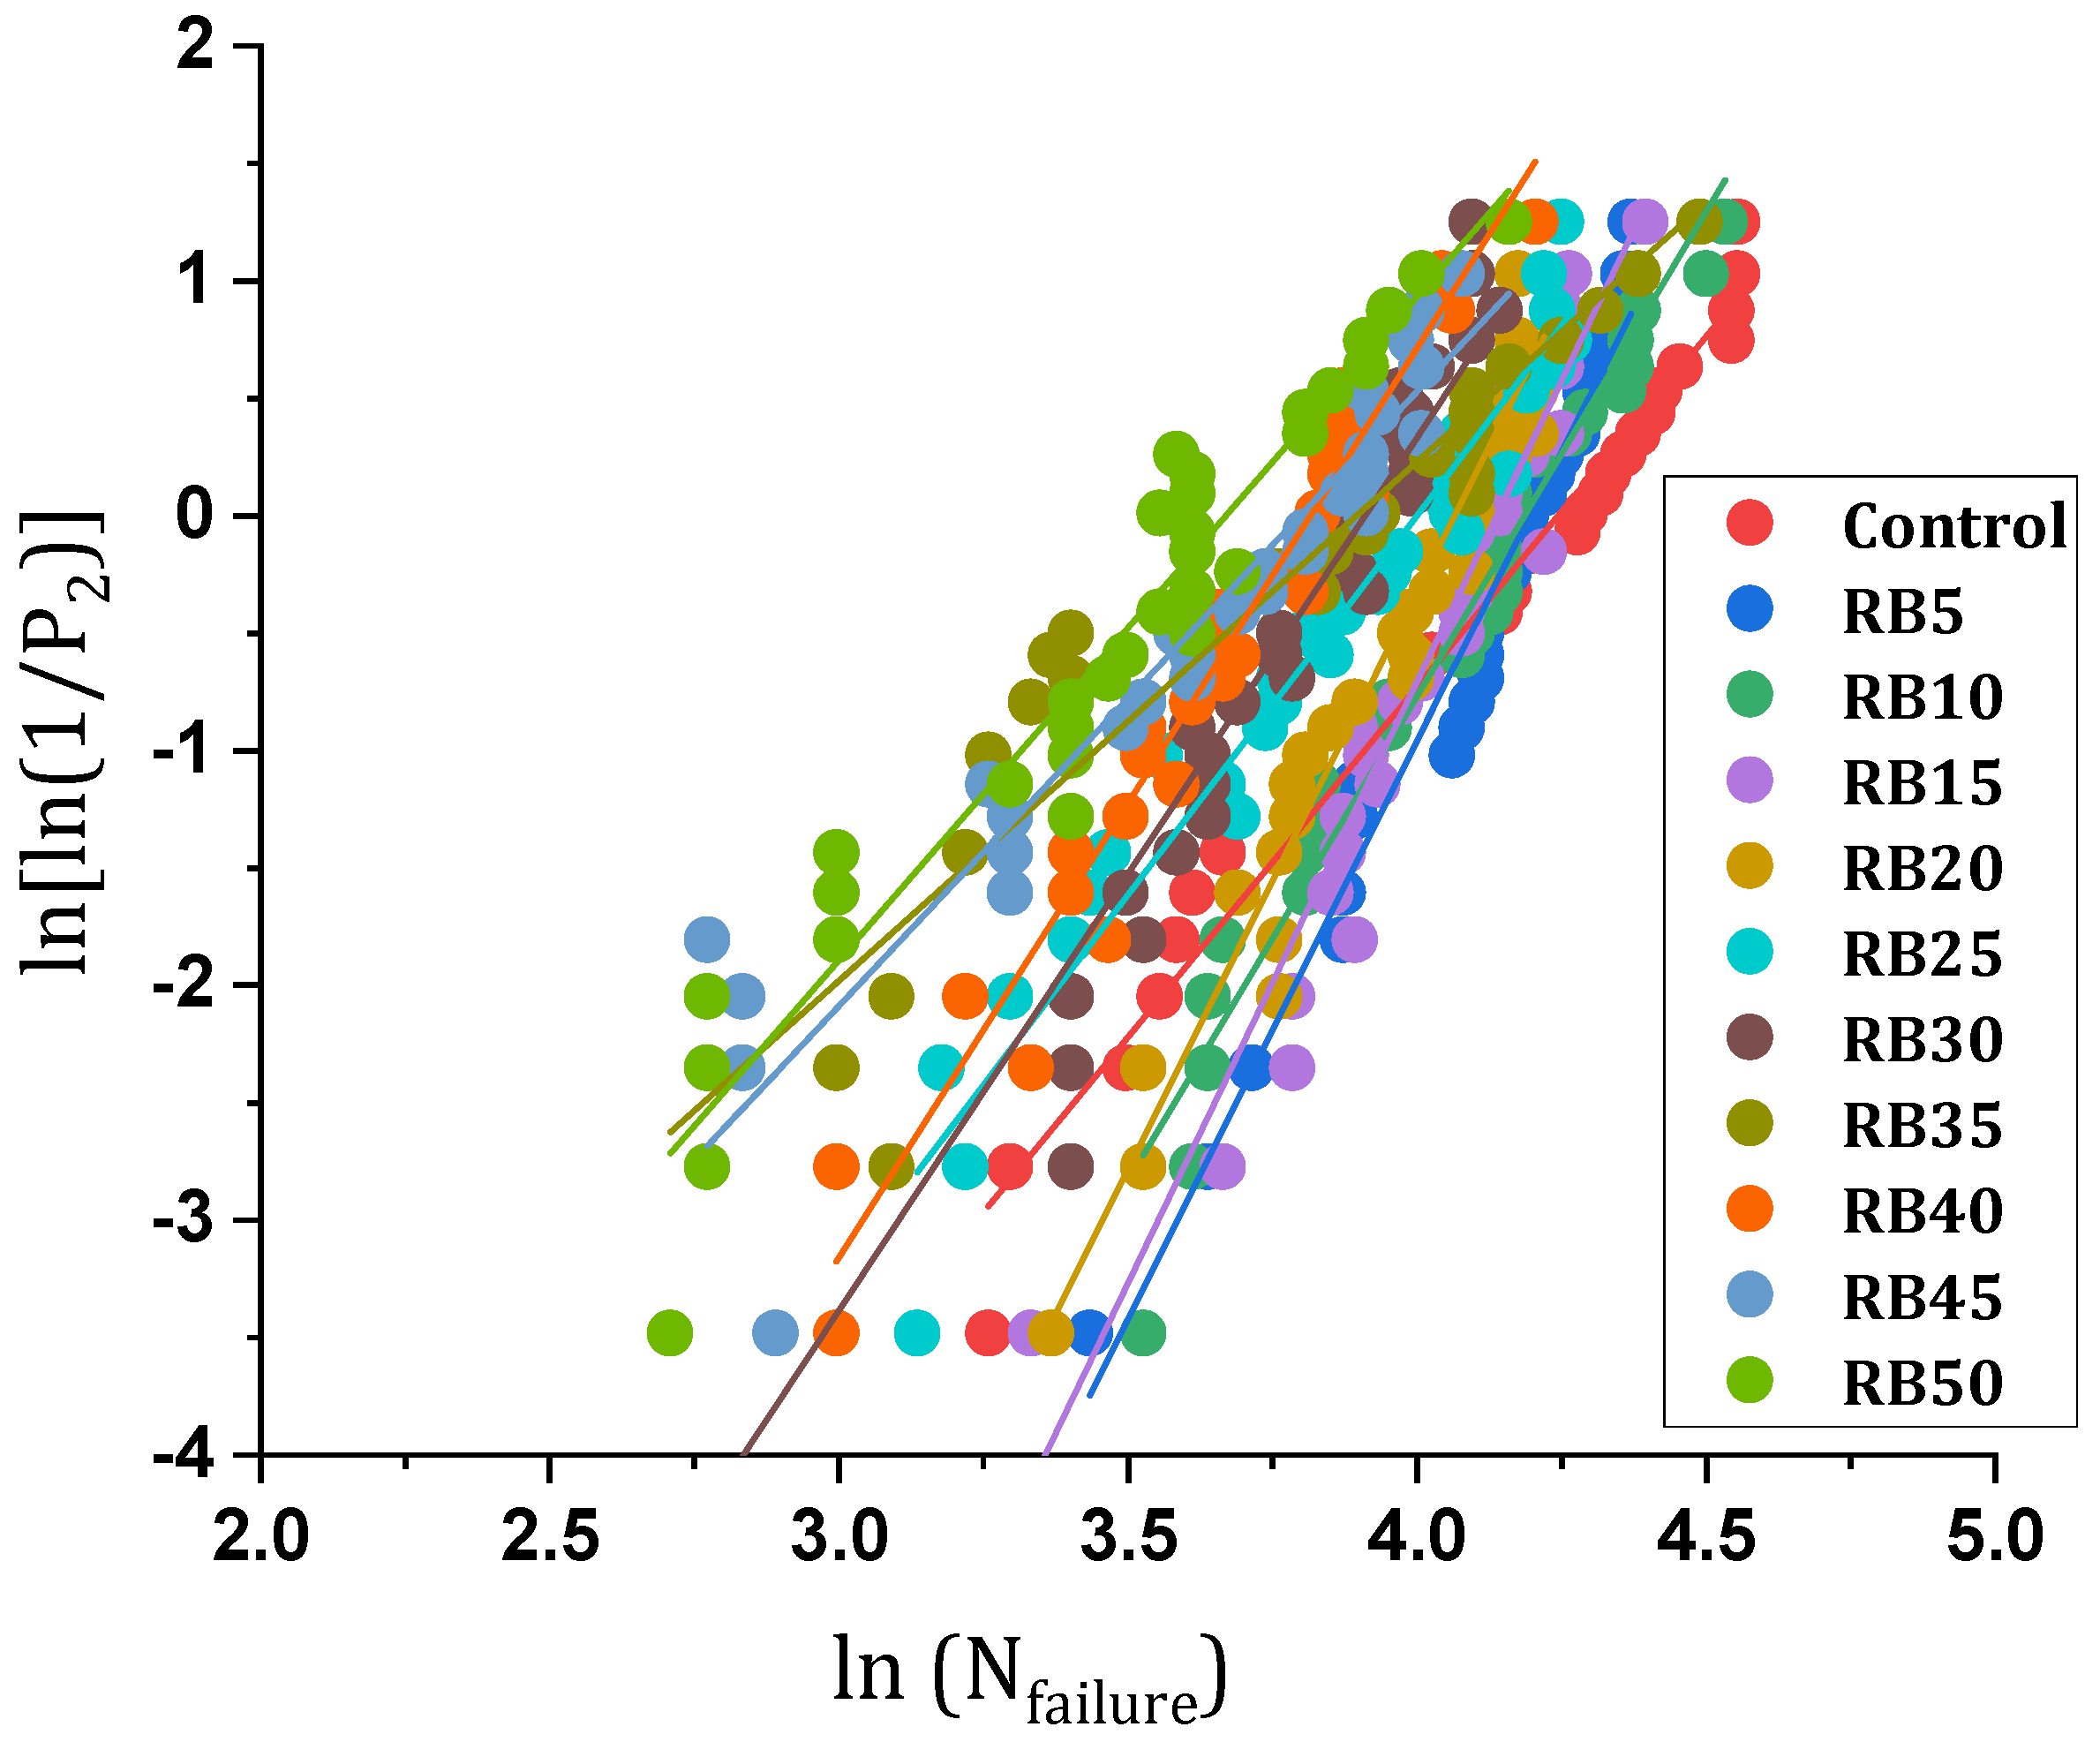
- RDWI test outcomes for brick powder mixtures align with the two-parameter Weibull distribution. An equation based on this model accurately predicts impact damage evolution, correlating well with experimental data and confirming the model’s dependability in detailing damage progression under repeated impacts.
6. Limitations and Guide for Future Studies
Author Contributions
Funding
Data Availability Statement
Conflicts of Interest
Abbreviations
| ACI | American Concrete Institute |
| ASTM | American Society for Testing and Materials |
| ANN | Artificial neural network |
| C&D | Construction and demolition |
| CO2 | Carbon dioxide |
| CH4 | Methane |
| D(n) | Damage degree |
| dij | Desired output of the network for sample i in processed element j |
| E | Energy absorption |
| FL | Fuzzy logic |
| F-gases | Fluorinated gases |
| F(Np) | Cumulative distribution function |
| g | Gravitation acceleration |
| GHG | Global greenhouse gas |
| G20 | Group of twenty |
| h | Height of drop |
| i | Number of concrete discs |
| IDI | Impact ductility index |
| INPB | Increase in the number of post-first crack blows |
| ITZ | Interfacial transition zone |
| MSE | Mean squared error |
| m | Mass of hammer |
| N | Impact life |
| N2O | Nitrous oxide |
| N0 | Minimum life parameter |
| Na | Characteristic life parameters |
| Nfirst | First visual crack |
| Nfailure | ultimate crack |
| SD. | Standard deviation |
| P2 | Survival rate |
| P1 | Different failure probabilities |
| PF(n) | Failure probability |
| RP | Recycled powder |
| RDWI | Repeated drop weight impact |
| RPC | Reactive powder concrete |
| RBP | Recycled brick powder |
| RCP | Recycled concrete powder |
| R2 | Coefficient of determination |
| t | Total number of concrete discs |
| X0 | Location parameters |
| y | Actual values |
| ŷ | Predicted values |
| ỹ | Average values |
| yij | Network output for sample i in processed element j |
| β | Shape factor |
References
- Crippa, M.; Guizzardi, D.; Pagani, F.; Banja, M.; Muntean, M.; Schaaf, E.; Becker, W.; Monforti-Ferrario, F.; Quadrelli, R.; Risquez Martin, A.; et al. GHG Emissions of All World Countries; European Commission: Luxembourg, 2023. [Google Scholar]
- Sun, X.; Li, Z.; Cheng, X.; Guan, C.H.; Han, M.; Zhang, B. Global Anthropogenic CH4 Emissions from 1970 to 2018: Gravity Movement and Decoupling Evolution. Resour. Conserv. Recycl. 2022, 182, 106335. [Google Scholar] [CrossRef]
- Mohammad Nezhad Ayandeh, M.H.; Ghodousian, O.; Mohammad Nezhad, H.; Mohtasham Moein, M.; Saradar, A.; Karakouzian, M. Steel Slag and Zeolite as Sustainable Pozzolans for UHPC: An Experimental Study of Binary and Ternary Pozzolan Mixtures under Various Curing Conditions. Innov. Infrastruct. Solut. 2024, 9, 265. [Google Scholar] [CrossRef]
- Oxford Economics. Oxford Economics Future of Construction: A Global Forecast for Construction to 2030; Oxford Economics: London, UK, 2021. [Google Scholar]
- Statista. Statista Construction Industry Spending Globally 2025; Statista: Hamburg, Germany, 2019. [Google Scholar]
- Tajasosi, S.; Saradar, A.; Barandoust, J.; Mohtasham Moein, M.; Zeinali, R.; Karakouzian, M. Multi-Criteria Risk Analysis of Ultra-High Performance Concrete Application in Structures. CivilEng 2023, 4, 1016–1035. [Google Scholar] [CrossRef]
- Heyran Najafi, M.R.; Saradar, A.; Mohtasham Moein, M.; Karakouzian, M. Investigation Mechanical Characteristics and Permeability of Concrete with Pozzolanic Materials: A Sustainable Approach. In Multiscale and Multidisciplinary Modeling, Experiments and Design; Springer: Berlin/Heidelberg, Germany, 2024. [Google Scholar] [CrossRef]
- Alyaseen, A.; Poddar, A.; Kumar, N.; Haydar, K.; Khan, A.; Sihag, P.; Lee, D.; Kumar, R.; Singh, T. Influence of Silica Fume and Bacillus Subtilis Combination on Concrete Made with Recycled Concrete Aggregate: Experimental Investigation, Economic Analysis, and Machine Learning Modeling. Case Stud. Constr. Mater. 2023, 19, e02638. [Google Scholar] [CrossRef]
- Mohtasham Moein, M.; Rahmati, K.; Saradar, A.; Moon, J.; Karakouzian, M. A Critical Review Examining the Characteristics of Modified Concretes with Different Nanomaterials. Materials 2024, 17, 409. [Google Scholar] [CrossRef]
- Tam, V.W.Y.; Soomro, M.; Evangelista, A.C.J. A Review of Recycled Aggregate in Concrete Applications (2000–2017). Constr. Build. Mater. 2018, 172, 272–292. [Google Scholar] [CrossRef]
- Saradar, A.; Rezakhani, Y.; Rahmati, K.; Johari Majd, F.; Mohtasham Moein, M.; Karakouzian, M. Investigating the Properties and Microstructure of High-Performance Cement Composites with Nano-Silica, Silica Fume, and Ultra-Fine TiO2. Innov. Infrastruct. Solut. 2024, 9, 84. [Google Scholar] [CrossRef]
- Mousavinejad, S.H.G.; Saradar, A.; Jabbari, M.; Moein, M.M. Evaluation of Fresh and Hardened Properties of Self-Compacting Concrete Containing Different Percentages of Waste Tiles. J. Build. Pathol. Rehabil. 2023, 8, 81. [Google Scholar] [CrossRef]
- Nabighods, K.; Saradar, A.; Mohtasham Moein, M.; Mirgozar Langaroudi, M.A.; Byzyka, J.; Karakouzian, M. Evaluation of Self-Compacting Concrete Containing Pozzolan (Zeolite, Metakaolin & Silica Fume) and Polypropylene Fiber against Sulfate Attacks with Different PH: An Experimental Study. Innov. Infrastruct. Solut. 2023, 9, 1. [Google Scholar] [CrossRef]
- Tavakoli, D.; Hashempour, M.; Heidari, A. Use of Waste Materials in Concrete: A Review. Pertanika J. Sci. Technol. 2018, 26, 499–522. [Google Scholar]
- Tavakoli, D.; Sakenian Dehkordi, R.; Divandari, H.; de Brito, J. Properties of Roller-Compacted Concrete Pavement Containing Waste Aggregates and Nano SiO2. Constr. Build. Mater. 2020, 249, 118747. [Google Scholar] [CrossRef]
- Mansoori, A.; Mohtasham Moein, M.; Mohseni, E. Effect of Micro Silica on Fiber-Reinforced Self-Compacting Composites Containing Ceramic Waste. J. Compos. Mater. 2020, 1, 95–107. [Google Scholar] [CrossRef]
- Wu, H.; Zuo, J.; Zillante, G.; Wang, J.; Yuan, H. Construction and Demolition Waste Research: A Bibliometric Analysis. Archit. Sci. Rev. 2019, 62, 354–365. [Google Scholar] [CrossRef]
- Yue, G.; Ma, Z.; Liu, M.; Liang, C.; Ba, G. Damage Behavior of the Multiple ITZs in Recycled Aggregate Concrete Subjected to Aggressive Ion Environment. Constr. Build. Mater. 2020, 245, 118419. [Google Scholar] [CrossRef]
- He, Z.; Shen, A.; Wu, H.; Wang, W.; Wang, L.; Yao, C.; Wu, J. Research Progress on Recycled Clay Brick Waste as an Alternative to Cement for Sustainable Construction Materials. Constr. Build. Mater. 2021, 274, 122113. [Google Scholar] [CrossRef]
- Tang, Q.; Ma, Z.; Wu, H.; Wang, W. The Utilization of Eco-Friendly Recycled Powder from Concrete and Brick Waste in New Concrete: A Critical Review. Cem. Concr. Compos. 2020, 114, 103807. [Google Scholar] [CrossRef]
- Wong, C.L.; Mo, K.H.; Alengaram, U.J.; Yap, S.P. Mechanical Strength and Permeation Properties of High Calcium Fly Ash-Based Geopolymer Containing Recycled Brick Powder. J. Build. Eng. 2020, 32, 101655. [Google Scholar] [CrossRef]
- Luo, X.; Gao, J.; Liu, X.; Li, S.; Zhao, Y. Hydration and Microstructure Evolution of Recycled Clay Brick Powder-Cement Composite Cementitious Materials. J. Therm. Anal. Calorim. 2022, 147, 10977–10989. [Google Scholar] [CrossRef]
- Yang, D.; Liu, M.; Ma, Z. Properties of the Foam Concrete Containing Waste Brick Powder Derived from Construction and Demolition Waste. J. Build. Eng. 2020, 32, 101509. [Google Scholar] [CrossRef]
- Sharmin, S.; Sarker, P.K.; Biswas, W.K.; Abousnina, R.M.; Javed, U. Characterization of Waste Clay Brick Powder and Its Effect on the Mechanical Properties and Microstructure of Geopolymer Mortar. Constr. Build. Mater. 2024, 412, 134848. [Google Scholar] [CrossRef]
- Castillo, M.; Hernández, K.; Rodriguez, J.; Eyzaguirre, C. Low Permeability Concrete for Buildings Located in Marine Atmosphere Zone Using Clay Brick Powder. In Proceedings of the IOP Conference Series: Materials Science and Engineering, Chennai, India, 16–17 September 2020; Volume 758. [Google Scholar]
- Wu, H.; Xiao, J.; Liang, C.; Ma, Z. Properties of Cementitious Materials with Recycled Aggregate and Powder Both from Clay Brick Waste. Buildings 2021, 11, 119. [Google Scholar] [CrossRef]
- Zheng, L.; Ge, Z.; Yao, Z.; Gao, Z. Mechanical Properties of Mortar with Recycled Clay-Brick-Powder. In Proceedings of the ICCTP 2011: Towards Sustainable Transportation Systems. In Proceedings of the 11th International Conference of Chinese Transportation Professionals, Nanjing, China, 14–17 August 2011. [Google Scholar]
- Liu, Q.; Li, B.; Xiao, J.; Singh, A. Utilization Potential of Aerated Concrete Block Powder and Clay Brick Powder from C&D Waste. Constr. Build. Mater. 2020, 238, 117721. [Google Scholar] [CrossRef]
- Yoon, Y.S.; Yoo, D.Y. Influence of Steel Fibers and Fiber-Reinforced Polymers on the Impact Resistance of One-Way Concrete Slabs. J. Compos. Mater. 2014, 48, 695–706. [Google Scholar] [CrossRef]
- Mohtasham Moein, M.; Mousavi, S.Y.; Madandoust, R.; Naser Saeid, H.N.S. The Impact Resistance of Steel Fiber Reinforcement Concrete under Different Curing Conditions: Experimental and Statistical Analysis. J. Civil. Environ. Eng. 2019, 49, 109–121. [Google Scholar] [CrossRef]
- Murali, G.; Ramprasad, K. A Feasibility of Enhancing the Impact Strength of Novel Layered Two Stage Fibrous Concrete Slabs. Eng. Struct. 2018, 175, 41–49. [Google Scholar] [CrossRef]
- Mohtasham Moein, M.; Saradar, A.; Rahmati, K.; Hatami Shirkouh, A.; Sadrinejad, I.; Aramali, V.; Karakouzian, M. Investigation of Impact Resistance of High-Strength Portland Cement Concrete Containing Steel Fibers. Materials 2022, 15, 7157. [Google Scholar] [CrossRef]
- Al-Jabri, K.S.; Hago, A.W.; Tavakoli, D.; Waris, M.B.; Hassan, H.F.; Mohamedzein, Y. Investigating Thermal Cracking in Mass Concrete of a Bridge Abutment: Field Measurements and Numerical Modelling. Aust. J. Civil. Eng. 2022, 22, 146–162. [Google Scholar] [CrossRef]
- Moein, M.M.; Saradar, A.; Rahmati, K.; Rezakhani, Y.; Ashkan, S.A.; Karakouzian, M. Reliability Analysis and Experimental Investigation of Impact Resistance of Concrete Reinforced with Polyolefin Fiber in Different Shapes, Lengths, and Doses. J. Build. Eng. 2023, 69, 106262. [Google Scholar] [CrossRef]
- Al-Tayeb, M.M.; Al Daoor, I.; Wafi, S.R.; Tayeh, B. Ultimate Failure Resistance of Concrete with Partial Replacements of Sand by Polycarbonate Plastic Waste Under Impact Load. Civil. Environ. Res. 2020, 12, 42–49. [Google Scholar] [CrossRef]
- Akçaözoǧlu, S.; Atiş, C.D.; Akçaözoǧlu, K. An Investigation on the Use of Shredded Waste PET Bottles as Aggregate in Lightweight Concrete. Waste Manag. 2010, 30, 285–290. [Google Scholar] [CrossRef] [PubMed]
- Sharma, A.P.; Khan, S.H.; Velmurugan, R. Effect of through Thickness Separation of Fiber Orientation on Low Velocity Impact Response of Thin Composite Laminates. Heliyon 2019, 5, e02706. [Google Scholar] [CrossRef]
- Abid, S.R.; Abdul-Hussein, M.L.; Ayoob, N.S.; Ali, S.H.; Kadhum, A.L. Repeated Drop-Weight Impact Tests on Self-Compacting Concrete Reinforced with Micro-Steel Fiber. Heliyon 2020, 6, e03198. [Google Scholar] [CrossRef] [PubMed]
- Abid, S.R.; Shamkhi, M.S.; Mahdi, N.S.; Daek, Y.H. Hydro-Abrasive Resistance of Engineered Cementitious Composites with PP and PVA Fibers. Constr. Build. Mater. 2018, 187, 168–177. [Google Scholar] [CrossRef]
- Rahmati, K.; Saradar, A.; Mohtasham Moein, M.; Sardrinejad, I.; Bristow, J.; Yavari, A.; Karakouzian, M. Evaluation of Engineered Cementitious Composites (ECC) Containing Polyvinyl Alcohol (PVA) Fibers under Compressive, Direct Tensile, and Drop-Weight Test. Multiscale Multidiscip. Model. Exp. Des. 2022, 6, 147–164. [Google Scholar] [CrossRef]
- Abid, S.R.; Abdul Hussein, M.L.; Ali, S.H.; Kazem, A.F. Suggested Modified Testing Techniques to the ACI 544-R Repeated Drop-Weight Impact Test. Constr. Build. Mater. 2020, 244, 118321. [Google Scholar] [CrossRef]
- Song, P.S. Statistical Analysis of Impact Strength and Strength Reliability of Steel—Polypropylene Hybrid Fiber-Reinforced Concrete. Constr. Build. Mater. 2005, 19, 1–9. [Google Scholar] [CrossRef]
- Rahmani, T.; Kiani, B.; Shekarchi, M.; Safari, A. Statistical and Experimental Analysis on the Behavior of Fiber Reinforced Concretes Subjected to Drop Weight Test. Constr. Build. Mater. 2012, 37, 360–369. [Google Scholar] [CrossRef]
- Zhu, P.; Mao, X.; Qu, W.; Li, Z.; Ma, Z.J. Investigation of Using Recycled Powder from Waste of Clay Bricks and Cement Solids in Reactive Powder Concrete. Constr. Build. Mater. 2016, 113, 246–254. [Google Scholar] [CrossRef]
- Likes, L.; Markandeya, A.; Haider, M.M.; Bollinger, D.; McCloy, J.S.; Nassiri, S. Recycled Concrete and Brick Powders as Supplements to Portland Cement for More Sustainable Concrete. J. Clean. Prod. 2022, 364, 132651. [Google Scholar] [CrossRef]
- Liu, S.; Dai, R.; Cao, K.; Gao, Z. The Role of Sintered Clay Brick Powder during the Hydration Process of Cement Pastes. Iran. J. Sci. Technol.-Trans. Civil. Eng. 2017, 41. [Google Scholar] [CrossRef]
- Kim, J.; Lee, D.; Sičáková, A.; Kim, N. Utilization of Different Forms of Demolished Clay Brick and Granite Wastes for Better Performance in Cement Composites. Buildings 2023, 13, 159–165. [Google Scholar] [CrossRef]
- Letelier, V.; Tarela, E.; Moriconi, G. Mechanical Properties of Concretes with Recycled Aggregates and Waste Brick Powder as Cement Replacement. Procedia Eng. 2017, 171, 627–632. [Google Scholar] [CrossRef]
- Nepomuceno, M.C.S.; Isidoro, R.A.S.; Catarino, J.P.G. Mechanical Performance Evaluation of Concrete Made with Recycled Ceramic Coarse Aggregates from Industrial Brick Waste. Constr. Build. Mater. 2018, 165, 284–294. [Google Scholar] [CrossRef]
- Olofinnade, O.M.; Ede, A.N.; Ndambuki, J.M.; Bamigboye, G.O. Structural Properties of Concrete Containing Ground Waste Clay Brick Powder as Partial Substitute for Cement. Mater. Sci. Forum 2016, 866, 63–67. [Google Scholar] [CrossRef]
- Xue, C.; Shen, A.; Guo, Y.; He, T. Utilization of Construction Waste Composite Powder Materials as Cementitious Materials in Small-Scale Prefabricated Concrete. Adv. Mater. Sci. Eng. 2016, 2016, 8947935. [Google Scholar] [CrossRef]
- Mohtasham Moein, M.; Rahmati, K.; Mohtasham Moein, A.; Rigby, S.E.; Saradar, A.; Karakouzian, M. Utilizing Construction and Demolition Waste in Concrete as a Sustainable Cement Substitute: A Comprehensive Study on Behavior Under Short-Term Dynamic and Static Loads via Laboratory and Numerical Analysis. J. Build. Eng. 2024, 97, 110778. [Google Scholar] [CrossRef]
- Moein, M.M.; Soliman, A. Predicting the Compressive Strength of Alkali-Activated Concrete Using Various Data Mining Methods. In Proceedings of the Canadian Society of Civil Engineering Annual Conference, Moncton, NB, Canada, 24–27 May 2023; pp. 317–326. [Google Scholar]
- Saradar, A.; Nemati, P.; Paskiabi, A.S.; Moein, M.M.; Moez, H.; Vishki, E.H. Prediction of Mechanical Properties of Lightweight Basalt Fiber Reinforced Concrete Containing Silica Fume and Fly Ash: Experimental and Numerical Assessment. J. Build. Eng. 2020, 32, 101732. [Google Scholar] [CrossRef]
- Tahmouresi, B.; Nemati, P.; Asadi, M.A.; Saradar, A.; Mohtasham Moein, M. Mechanical Strength and Microstructure of Engineered Cementitious Composites: A New Configuration for Direct Tensile Strength, Experimental and Numerical Analysis. Constr. Build. Mater. 2021, 269, 121361. [Google Scholar] [CrossRef]
- al-Swaidani, A.M.; Khwies, W.T.; al-Baly, M.; Lala, T. Development of Multiple Linear Regression, Artificial Neural Networks and Fuzzy Logic Models to Predict the Efficiency Factor and Durability Indicator of Nano Natural Pozzolana as Cement Additive. J. Build. Eng. 2022, 52, 104475. [Google Scholar] [CrossRef]
- Golafshani, E.M.; Behnood, A.; Arashpour, M. Predicting the Compressive Strength of Normal and High-Performance Concretes Using ANN and ANFIS Hybridized with Grey Wolf Optimizer. Constr. Build. Mater. 2020, 232, 117266. [Google Scholar] [CrossRef]
- Liu, K.; Alam, M.S.; Zhu, J.; Zheng, J.; Chi, L. Prediction of Carbonation Depth for Recycled Aggregate Concrete Using ANN Hybridized with Swarm Intelligence Algorithms. Constr. Build. Mater. 2021, 301, 124382. [Google Scholar] [CrossRef]
- Prasad, N.; Murali, G. Exploring the Impact Performance of Functionally-Graded Preplaced Aggregate Concrete Incorporating Steel and Polypropylene Fibres. J. Build. Eng. 2021, 35, 102077. [Google Scholar] [CrossRef]
- Huang, X.Y.; Wu, K.Y.; Wang, S.; Lu, T.; Lu, Y.F.; Deng, W.C.; Li, H.M. Compressive Strength Prediction of Rubber Concrete Based on Artificial Neural Network Model with Hybrid Particle Swarm Optimization Algorithm. Materials 2022, 15, 3934. [Google Scholar] [CrossRef] [PubMed]
- Kandiri, A.; Sartipi, F.; Kioumarsi, M. Predicting Compressive Strength of Concrete Containing Recycled Aggregate Using Modified Ann with Different Optimization Algorithms. Appl. Sci. 2021, 11, 485. [Google Scholar] [CrossRef]
- Heidari, A.; Hashempour, M.; Tavakoli, D. Using of Backpropagation Neural Network in Estimation of Compressive Strength of Waste Concrete. J. Soft Comput. Civil. Eng. 2017, 1, 48040. [Google Scholar] [CrossRef]
- Srinivas, M.; Sucharitha, G.; Matta, A. Machine Learning Algorithms and Applications; CRC Press: Boca Raton, FL, USA, 2021. [Google Scholar]
- Mehrotra, K.; Mohan, C.; Ranka, S. Elements of Artificial Neural Networks; MIT Press: Cambridge, MA, USA, 2019. [Google Scholar]
- Mohtasham Moein, M.; Saradar, A.; Rahmati, K.; Ghasemzadeh Mousavinejad, S.H.; Bristow, J.; Aramali, V.; Karakouzian, M. Predictive Models for Concrete Properties Using Machine Learning and Deep Learning Approaches: A Review. J. Build. Eng. 2023, 63, 105444. [Google Scholar] [CrossRef]
- Zadeh, L.A. Fuzzy Sets. Inf. Control 1965, 8, 338–353. [Google Scholar] [CrossRef]
- Mohd Adnan, M.R.H.; Sarkheyli, A.; Mohd Zain, A.; Haron, H. Fuzzy Logic for Modeling Machining Process: A Review. Artif. Intell. Rev. 2015, 43, 345–379. [Google Scholar] [CrossRef]
- Uplenchwar, K.B.; Kokate, R.S. Application of Fuzzy Logic: A Review. Int. Res. J. Eng. Technol. 2020, 7, 2097–2100. [Google Scholar]
- Serrano-Guerrero, J.; Romero, F.P.; Olivas, J.A. Fuzzy Logic Applied to Opinion Mining: A Review. Knowl. Based Syst. 2021, 222, 107018. [Google Scholar] [CrossRef]
- Soltanifar, M.; Sharafi, H.; Hosseinzadeh Lotfi, F.; Pedrycz, W.; Allahviranloo, T. Introduction to Fuzzy Logic. In Studies in Systems, Decision and Control; MIT Press: Cambridge, MA, USA, 2023; Volume 471. [Google Scholar]
- Zadeh, L.A. Is There a Need for Fuzzy Logic? Inf. Sci. 2008, 178, 2751–2779. [Google Scholar] [CrossRef]
- Abbas, Y.M.; Iqbal Khan, M. Prediction of Compressive Stress–Strain Behavior of Hybrid Steel–Polyvinyl-Alcohol Fiber Reinforced Concrete Response by Fuzzy-Logic Approach. Constr. Build. Mater. 2023, 379, 131212. [Google Scholar] [CrossRef]
- Güler, K.; Demir, F.; Pakdamar, F. Stress-Strain Modelling of High Strength Concrete by Fuzzy Logic Approach. Constr. Build. Mater. 2012, 37, 680–684. [Google Scholar] [CrossRef]
- Weibull, W. A Statistical Theory of the Strength of Materials. Generalstabens Litografiska Anstalts Förlag, Stockholm. Gen. Litografiska Anst. Förlag 1939, 151, 189–206. [Google Scholar]
- Jung, C.; Schindler, D. Wind Speed Distribution Selection—A Review of Recent Development and Progress. Renew. Sustain. Energy Rev. 2019, 114, 109290. [Google Scholar] [CrossRef]
- Wais, P. Two and Three-Parameter Weibull Distribution in Available Wind Power Analysis. Renew. Energy 2017, 103, 15–29. [Google Scholar] [CrossRef]
- Gerhards, C.; Schramm, M.; Schmid, A. Use of the Weibull Distribution Function for Describing Cleaning Kinetics of High Pressure Water Jets in Food Industry. J. Food Eng. 2019, 253, 21–26. [Google Scholar] [CrossRef]
- Idiapho, O.K.; Odinikuku, W.E.; Akusu, O.M. Reliability Assessment of a Cement Industry by Application of Weibull Method. J. Eng. Res. Rep. 2019, 7, 1–11. [Google Scholar] [CrossRef]
- Shah, K.; Khurshid, H.; Haq, I.U.; Ali Shah, S.; Ali, Z. Forecasting Machine Failure Using DMG and Weibull Analysis in an Automotive Industry: A Case Study. Mehran Univ. Res. J. Eng. Technol. 2021, 40, 435–442. [Google Scholar] [CrossRef]
- Abirami, T.; Loganaganandan, M.; Murali, G.; Fediuk, R.; Vickhram Sreekrishna, R.; Vignesh, T.; Januppriya, G.; Karthikeyan, K. Experimental Research on Impact Response of Novel Steel Fibrous Concretes under Falling Mass Impact. Constr. Build. Mater. 2019, 222, 447–457. [Google Scholar] [CrossRef]
- Swaminathan, P.; Karthikeyan, K.; Subbaram, S.R.; Sudharsan, J.S.; Abid, S.R.; Murali, G.; Vatin, N.I. Experimental and Statistical Investigation to Evaluate Impact Strength Variability and Reliability of Preplaced Aggregate Concrete Containing Crumped Rubber and Fibres. Materials 2022, 15, 5156. [Google Scholar] [CrossRef] [PubMed]
- Murali, G.; Asrani, N.P.; Ramkumar, V.R.; Siva, A.; Haridharan, M.K. Impact Resistance and Strength Reliability of Novel Two-Stage Fibre-Reinforced Concrete. Arab. J. Sci. Eng. 2019, 44, 4477–4490. [Google Scholar] [CrossRef]
- ASTM C33/C33M-16; Standard Specification for Concrete Aggregates. ASTM International: West Conshohocken, PA, USA, 2016.
- Ma, Z.; Li, W.; Wu, H.; Cao, C. Chloride Permeability of Concrete Mixed with Activity Recycled Powder Obtained from C&D Waste. Constr. Build. Mater. 2019, 199, 652–663. [Google Scholar] [CrossRef]
- Xiao, J.; Ma, Z.; Sui, T.; Akbarnezhad, A.; Duan, Z. Mechanical Properties of Concrete Mixed with Recycled Powder Produced from Construction and Demolition Waste. J. Clean. Prod. 2018, 188, 720–731. [Google Scholar] [CrossRef]
- Ahmed, J.K.; Atmaca, N.; Khoshnaw, G.J. Building a Sustainable Future: An Experimental Study on Recycled Brick Waste Powder in Engineered Geopolymer Composites. Case Stud. Constr. Mater. 2024, 20, e02863. [Google Scholar] [CrossRef]
- ASTM C618; Standard Specification for Coal Fly Ash and Raw or Calcinated Natural Pozzolan for Use in Concrete. Annual Book of ASTM Standards; ASTM International: West Conshohocken, PA, USA, 2005; Volume 1479.
- ASTM C192/C192M-19; Standard Practice for Making and Curing Concrete Test Specimens in the Laboratory. ASTM International: West Conshohocken, PA, USA, 2019.
- Ge, Z.; Gao, Z.; Sun, R.; Zheng, L. Mix Design of Concrete with Recycled Clay-Brick-Powder Using the Orthogonal Design Method. Constr. Build. Mater. 2012, 31, 289–293. [Google Scholar] [CrossRef]
- BS EN 12390-3:2019; Testing Hardened Concrete Part 3: Compressive Strength of Test Specimens. British Standards Institution; BSI Standards Publication: London, UK, 2019.
- ASTM C348-21; Standard Test Method for Flexural Strength of Hydraulic-Cement Mortars. ASTM International: West Conshohocken, PA, USA, 2021; Volume 4.
- ASTM C 496M-02 C496-96; Standard Test Method for Splitting Tensile Strength of Cylindrical Concrete. ASTM International: West Conshohocken, PA, USA, 2002; Volume 4.
- ACI Committee 544. State-of-the-Art Report on Fiber Reinforced Concrete. ACI Committee 544 Report 544,1R-96. In ACI Committee 544; American Concrete Institute: Detroit, MI, USA, 1996. [Google Scholar]
- Figueiredo, M.; Gomide, F.; Rocha, A.; Yager, R. Comparison of Yager’s Level Set Method for Fuzzy Logic Control with Mamdani’s and Larsen’s Methods. IEEE Trans. Fuzzy Syst. 1993, 1, 156–159. [Google Scholar] [CrossRef]
- Blej, M.; Azizi, M. Comparison of Mamdani-Type and Sugeno-Type Fuzzy Inference Systems for Fuzzy Real Time Scheduling. Int. J. Appl. Eng. Res. 2016, 11. [Google Scholar]
- Mada, G.S.; Dethan, N.K.F.; Maharani, A.E.S.H. The Defuzzification Methods Comparison of Mamdani Fuzzy Inference System in Predicting Tofu Production. J. Varian 2022, 5, 11071–11075. [Google Scholar] [CrossRef]
- Santhosh, A.M.; Thomas, A. Experimental Studies on Brick Powder Replaced Concrete Exposed to Elevated Temperature. In Lecture Notes in Civil Engineering; Springer: Berlin/Heidelberg, Germany, 2020; Volume 46. [Google Scholar]
- Sallı Bideci, Ö.; Bideci, A.; Ashour, A. Utilization of Recycled Brick Powder as Supplementary Cementitious Materials—A Comprehensive Review. Materials 2024, 17, 637. [Google Scholar] [CrossRef] [PubMed]
- Bertelsen, I.M.G.; Kahr, S.A.; Kunther, W.; Ottosen, L.M. Clay Brick Powder as Partial Cement Replacement. In RILEM Bookseries; Springer: Berlin/Heidelberg, Germany, 2023; Volume 44. [Google Scholar]
- Mangngi, P.; Tjaronge, M.W.; Caronge, M.A. Durability Assessment of Concrete Containing Recycled Coarse Refractory Brick Aggregate. Innov. Infrastruct. Solut. 2024, 9, 144. [Google Scholar] [CrossRef]
- Kim, Y.J. Quality Properties of Self-Consolidating Concrete Mixed with Waste Concrete Powder. Constr. Build. Mater. 2017, 135, 177–185. [Google Scholar] [CrossRef]
- Rani, M.U.; Jenifer, J.M. Mechanical Properties of Concrete with Partial Replacement of Portland Cement by Clay Brick Powder. IJERT—Int. J. Eng. Res. Technol. 2016, 5, 2181–2278. [Google Scholar]
- Lin, K.L.; Wu, H.H.; Shie, J.L.; Hwang, C.L. An Cheng Recycling Waste Brick from Construction and Demolition of Buildings as Pozzolanic Materials. Waste Manag. Res. 2010, 28, 653–659. [Google Scholar] [CrossRef]
- Karatas, M.; Acikgenc, M.; Ulucan, Z.C. Effects of Elazig Region Waste Brick and Limestone Powder on Engineering Properties of Self-Compacting Mortar. Pamukkale Univ. J. Eng. Sci. 2013, 19, 249–255. [Google Scholar] [CrossRef]
- Heidari, A.; Hasanpour, B. Effects of Waste Bricks Powder of Gachsaran Company as a Pozzolanic Material in Concrete. Asian J. Civil. Eng. 2013, 14, 755–763. [Google Scholar]
- Xue, C.Z.; Shen, A.Q.; Chang, Y.T.; Liang, D. The Study of the Construction Waste Brick Powder’s Activity. Adv. Mat. Res. 2014, 1079–1080, 309–311. [Google Scholar] [CrossRef]
- Ayaz Khan, M.N.; Liaqat, N.; Ahmed, I.; Basit, A.; Umar, M.; Khan, M.A. Effect of Brick Dust on Strength and Workability of Concrete. In Proceedings of the IOP Conference Series: Materials Science and Engineering, Melbourne, Australia, 15–16 September 2018; Volume 414. [Google Scholar]
- Ortega, J.M.; Letelier, V.; Solas, C.; Moriconi, G.; Climent, M.Á.; Sánchez, I. Long-Term Effects of Waste Brick Powder Addition in the Microstructure and Service Properties of Mortars. Constr. Build. Mater. 2018, 182, 691–702. [Google Scholar] [CrossRef]
- Beshkari, M.; Amani, B.; Rahmati, K.; Mohtasham Moein, M.; Saradar, A.; Karakouzian, M. Synergistic Effects of Pozzolan and Carbon Fibers on the Performance of Self-Consolidating Concrete under Plastic Shrinkage and Dynamic Loading. Innov. Infrastruct. Solut. 2024, 9, 160. [Google Scholar] [CrossRef]
- Ismail, M.K.; Hassan, A.A.A.; Lachemi, M. Performance of Self-Consolidating Engineered Cementitious Composite under Drop-Weight Impact Loading. J. Mater. Civil. Eng. 2019, 31, 04018400. [Google Scholar] [CrossRef]
- Gupta, T.; Sharma, R.K.; Chaudhary, S. Impact Resistance of Concrete Containing Waste Rubber Fiber and Silica Fume. Int. J. Impact Eng. 2015, 83, 76–87. [Google Scholar] [CrossRef]
- Nataraja, M.C.; Dhang, N.; Gupta, A.P. Statistical Variations in Impact Resistance of Steel Fiber-Reinforced Concrete Subjected to Drop Weight Test. Cem. Concr. Res. 1999, 29, 989–995. [Google Scholar] [CrossRef]
- Song, P.S.; Wu, J.C.; Hwang, S.; Sheu, B.C. Assessment of Statistical Variations in Impact Resistance of High-Strength Concrete and High-Strength Steel Fiber-Reinforced Concrete. Cem. Concr. Res. 2005, 35, 393–399. [Google Scholar] [CrossRef]
- Chen, X.Y.; Ding, Y.N.; Azevedo, C. Combined Effect of Steel Fibres and Steel Rebars on Impact Resistance of High Performance Concrete. J. Cent. South Univ. 2011, 18, 1677–1684. [Google Scholar] [CrossRef]
- Murali, G.; Abid, S.R.; Mugahed Amran, Y.H.; Abdelgader, H.S.; Fediuk, R.; Susrutha, A.; Poonguzhali, K. Impact Performance of Novel Multi-Layered Prepacked Aggregate Fibrous Composites under Compression and Bending. Structures 2020, 28, 1502–1515. [Google Scholar] [CrossRef]
- Meng, J.; Xu, Z.; Liu, Z.; Chen, S.; Wang, C.; Zhao, B.; Zhou, A. Experimental Study on the Mechanics and Impact Resistance of Multiphase Lightweight Aggregate Concrete. Sustainability 2022, 14, 9606. [Google Scholar] [CrossRef]


| N.O. | Characteristic | Recommended Dosages and Effects | Ref. | |
|---|---|---|---|---|
| 1 | Mechanical properties | Compressive strength | [15%] (28 days) = 16.36% ↓ [30%] (28 days) = 22.58% ↓ [45%] (28 days) = 34.80% ↓ | [46] |
| 2 | [10%] (28 days) = 1.012% ↑ [30%] (28 days) = 17.35% ↓ [50%] (28 days) = 25.34% ↓ | [26] | ||
| 3 | [10%] (28 days) = 1.763% ↑ [30%] (28 days) = 3.007% ↓ [50%] (28 days) = 5.656% ↓ | [47] | ||
| 4 | Flexural strength | [ 5% ] (28 days) = 3.863% ↓ [10%] (28 days) = 7.726% ↓ [15%] (28 days) = 0.000% ↓ | [48] | |
| 5 | [10%] (28 days) = 1.531% ↓ [30%] (28 days) = 2.735% ↓ [50%] (28 days) = 4.814% ↓ | [49] | ||
| 6 | [10%] (28 days) = 5.165% ↓ [20%] (28 days) = 9.289% ↓ [30%] (28 days) = 27.61% ↓ | [47] | ||
| 7 | Tensile strength | [10%] (28 days) = 6.432% ↓ [30%] (28 days) = 4.970% ↓ [50%] (28 days) = 13.45% ↓ | [49] | |
| 8 | [10%] (28 days) = 3.530% ↓ [20%] (28 days) = 11.95% ↓ [30%] (28 days) = 26.15% ↓ [40%] (28 days) = 33.14% ↓ | [50] | ||
| 9 | Impact strength | Examining exclusively brick powder instead of cement = Research gap | --- | |
| 10 | Durability performance | Chloride diffusivity | [5%] = 1.067% ↓ [25%] = 1.779% ↓ [30%] = 80.42% ↑ | [25] |
| 11 | [20%] = 30.95% ↓ [30%] = 42.85% ↓ [40%] = 38.09% ↓ | [51] | ||
| 12 | [10%] = 24.08% ↓ [30%] = 68.70% ↓ [50%] = 85.00% ↓ | [26] | ||
| 13 | Microstructure | The products of cement paste hydration by RB mainly consist of C-S-H gel, ettringite, and Ca(OH)2, laying the foundation for the creation of a more compact structure. | [46] | |
| 14 | The interfacial transition zone (ITZ) between the RB particle and cement hydration products is compact with no apparent loose material in this area. | [28] | ||
| Chemical Properties | Physical Properties | |||
|---|---|---|---|---|
| SiO2 | 21.27 | Compressive strength (kgf/cm2) | 3 days | 205 |
| Al2O3 | 4.95 | 7 days | 288 | |
| Fe2O3 | 4.03 | 28 days | 411 | |
| CaO | 62.95 | Setting time | Initial | 154 |
| MgO | 1.55 | Final | 195 | |
| SO3 | 2.26 | Longitudinal expansion | 1.5 mm—0.08% | |
| Na2O | 0.49 | |||
| K2O | 0.65 | Special surface (cm2/gr) | 2910 | |
| C3A | 6.30 | |||
| Technical Features | |
|---|---|
| Generation | 3 |
| Physical State | Liquid |
| Color | Opaque green |
| Specific weight | 1.2 ± 0.02 kg/lit |
| Chlorides (PPM) | 500 max |
| Chemical Base | Modified polycarboxylate ether |
| Fine | Coarse | Sieve Size | ||
|---|---|---|---|---|
| This Study | ASTM C33 [83] | This Study | ASTM C33 [83] | |
| 100 | --- | 100 | 100 | 25 mm |
| 100 | --- | 92 | 90–100 | 19 mm |
| 100 | 100 | 50.12 | 20–55 | 9.5 mm |
| 99.94 | 95–100 | 6.558 | 0–10 | 4.75 mm |
| 92.67 | 80–100 | 0.262 | 0–5 | 2.36 mm |
| 74.23 | 50–85 | --- | --- | 1.18 mm |
| 53.51 | 25–60 | --- | --- | 600 mm |
| 20.43 | 10–30 | --- | --- | 300 mm |
| 3.61 | 2–10 | --- | --- | 150 mm |
| Chemical Properties | |||||||||||||
|---|---|---|---|---|---|---|---|---|---|---|---|---|---|
| L.O.I. | Fe2O3 | CaO | SO3 | TiO2 | P2O5 | K2O | MnO | SiO2 | Na2O | MgO | Al2O3 | Ref. | |
| 0.73 | 7.36 | 2.02 | 0.929 | 0.43 | 0.194 | 1.05 | 0.072 | 60.43 | 1.04 | 3.04 | 12.79 | This study | |
| 0.42 | 8.26 | 17.29 | 0.34 | --- | 0.11 | 1.19 | 0.18 | 30.82 | 0.02 | 3.37 | 13.17 | [86] | |
| --- | 4.8 | 1.3 | --- | --- | --- | --- | --- | 76.1 | --- | 1.7 | 11.8 | [26] | |
| --- | 5.15 | 46.78 | --- | --- | --- | 2.77 | --- | 53.8 | 0.65 | 2.58 | 13.2 | [44] | |
| ASTM C618 [87] | |||||||||||||
| This Study | Permissible range | Parameter | |||||||||||
| 80.58 | >70 | SiO2 +Al2O3 +Fe2O3 | |||||||||||
| 0.929 | <0.3 | SO3 | |||||||||||
| 0.73 | <10 | L.O.I. | |||||||||||
| 0.12 | <0.8 | Autoclave expansion | |||||||||||
| 0.5 | <3.0 | Moisture content | |||||||||||
| Mix No. | Mix Code | Cement | Brick Powder | Water | Aggregates | SP | |
|---|---|---|---|---|---|---|---|
| Fine | Coarse | ||||||
| 1 | Control | 400 | 0 | 160 | 848.91 | 1021.90 | 1.2 |
| 2 | RB5 | 380 | 20 | 160 | 397.00 | 1594.90 | 1.6 |
| 3 | RB10 | 360 | 40 | 160 | 397.84 | 1598.26 | 2 |
| 4 | RB15 | 340 | 60 | 160 | 398.89 | 1602.48 | 2 |
| 5 | RB20 | 320 | 80 | 160 | 399.51 | 1604.99 | 2.8 |
| 6 | RB25 | 300 | 100 | 160 | 400.56 | 1609.20 | 2.8 |
| 7 | RB30 | 280 | 120 | 160 | 401.40 | 1612.57 | 3.2 |
| 8 | RB35 | 260 | 140 | 160 | 402.23 | 1615.93 | 3.6 |
| 9 | RB40 | 240 | 160 | 160 | 403.28 | 1620.14 | 3.6 |
| 10 | RB45 | 220 | 180 | 160 | 404.12 | 1623.50 | 4 |
| 11 | RB50 | 200 | 200 | 160 | 404.96 | 1626.87 | 4.4 |
| Shape | Number of Samples | Dimension (cm) | Curing | Standard | Test | N.O. | |||
|---|---|---|---|---|---|---|---|---|---|
| c | b | a | |||||||
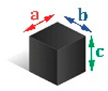 | Cube | 33 | 15 | 15 | 15 | 28 | BS EN 12390-3 [90] | Compressive strength | 1 |
 | Prism | 33 | 4 | 4 | 16 | 28 | ASTM C348 [91] | Flexural strength | 2 |
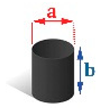 | Cylinder | 33 | --- | 30 | 15 | 28 | ASTM 496 [92] | Tensile strength | 3 |
| Cylinder | 88 (352 discs) | --- | 30 | 15 | 28 | ACI 544 [93] | Impact strength | 4 | |
| Statistical Characteristic | Input | Output | ||
|---|---|---|---|---|
| Cement | Brick Powder | Superplasticizer | Compressive Strength | |
| Min. | 200 | 0 | 1.2 | 36.13 |
| Max. | 400 | 200 | 4.4 | 52.80 |
| Mean. | 300 | 100 | 2.836 | 45.86 |
| SD. | 66.3 | 66.3 | 1.035 | 5.85 |
| R | MSE | RMSE | MAE | SI | OBJ |
|---|---|---|---|---|---|
| 0.99 | 0.15 | 0.39 | 0.39 | 0.86 | 0.39 |
| No. | Concrete Type | Discs | Statistical Technique | Ref. |
|---|---|---|---|---|
| 1 | Steel fiber-reinforced concrete | 15 | -Normal Probability | [112] |
| 2 | Fiber-reinforced concrete | 32 | -Normal Probability -Kolmogorov–Smirnov test -Kruskal–Wallis test | [43] |
| 3 | High strength fiber-reinforced concrete | 32 | -Normal Probability -Kolmogorov–Smirnov test -Kruskal–Wallis test | [32] |
| 4 | High strength fiber-reinforced concrete | 48 | -Normal Probability -Kolmogorov–Smirnov test | [113] |
| 5 | Hybrid fiber-reinforced concrete | 48 | -Normal Probability -Kolmogorov–Smirnov test | [42] |
| 6 | Steel fiber-reinforced concrete | 6 | -Two-parameter Weibull distribution | [114] |
| 7 | Multi-layered prepacked aggregate fibrous composite | 6 | [115] | |
| 8 | Multiphase lightweight aggregate concrete | 6 | [116] | |
| 9 | High-performance cement composites with pozzolan | 8 | [11] | |
| 10 | Self-compacting concrete containing waste tiles | 12 | [109] | |
| 11 | Two-stage fiber-reinforced concrete | 15 | [82] | |
| 12 | Polyolefin fiber-reinforced concrete | 32 | [34] |
| First Crack Strength | |||||
|---|---|---|---|---|---|
| R2 | Intercept | Scale parameter, η | Shape parameter, β | Mix Code | N.O. |
| 0.9805 | −10.734 | 63.6693 | 2.5842 | Control | 1 |
| 0.9542 | −16.36 | 59.557 | 4.003 | RB5 | 2 |
| 0.971 | −15.219 | 58.4114 | 3.7416 | RB10 | 3 |
| 0.9357 | −17.23 | 57.497 | 4.2525 | RB15 | 4 |
| 0.9724 | −17.802 | 52.4321 | 4.496 | RB20 | 5 |
| 0.9722 | −10.489 | 48.3444 | 2.7045 | RB25 | 6 |
| 0.9332 | −13.098 | 44.3749 | 3.4535 | RB30 | 7 |
| 0.946 | −7.49 | 44.397 | 1.9746 | RB35 | 8 |
| 0.98 | −10.714 | 40.3686 | 2.8972 | RB40 | 9 |
| 0.9745 | −8.7304 | 40.1488 | 2.3643 | RB45 | 10 |
| 0.9591 | −8.9609 | 35.0543 | 2.5193 | RB50 | 11 |
| Failure strength | |||||
| R2 | Intercept | Scale parameter, η | Shape parameter, β | Mix Code | N.O. |
| 0.9804 | −12.667 | 69.6844 | 2.9847 | Control | 1 |
| 0.9736 | −20.655 | 66.3378 | 4.924 | RB5 | 2 |
| 0.9612 | −17.279 | 65.773 | 4.1276 | RB10 | 3 |
| 0.9637 | −21.459 | 62.6451 | 5.1881 | RB15 | 4 |
| 0.9731 | −20.296 | 58.1658 | 4.9949 | RB20 | 5 |
| 0.9718 | −13.047 | 54.4878 | 3.2634 | RB25 | 6 |
| 0.9329 | −14.678 | 49.8296 | 3.7553 | RB30 | 7 |
| 0.9275 | −8.7004 | 49.0649 | 2.2348 | RB35 | 8 |
| 0.9822 | −14.945 | 45.3339 | 3.9184 | RB40 | 9 |
| 0.9532 | −10.102 | 44.448 | 2.6624 | RB45 | 10 |
| 0.9525 | −10.441 | 39.179 | 2.8464 | RB50 | 11 |
Disclaimer/Publisher’s Note: The statements, opinions and data contained in all publications are solely those of the individual author(s) and contributor(s) and not of MDPI and/or the editor(s). MDPI and/or the editor(s) disclaim responsibility for any injury to people or property resulting from any ideas, methods, instructions or products referred to in the content. |
© 2024 by the authors. Licensee MDPI, Basel, Switzerland. This article is an open access article distributed under the terms and conditions of the Creative Commons Attribution (CC BY) license (https://creativecommons.org/licenses/by/4.0/).
Share and Cite
Mohtasham Moein, M.; Rahmati, K.; Mohtasham Moein, A.; Saradar, A.; Rigby, S.E.; Akhavan Tabassi, A. Employing Neural Networks, Fuzzy Logic, and Weibull Analysis for the Evaluation of Recycled Brick Powder in Concrete Compositions. Buildings 2024, 14, 4062. https://doi.org/10.3390/buildings14124062
Mohtasham Moein M, Rahmati K, Mohtasham Moein A, Saradar A, Rigby SE, Akhavan Tabassi A. Employing Neural Networks, Fuzzy Logic, and Weibull Analysis for the Evaluation of Recycled Brick Powder in Concrete Compositions. Buildings. 2024; 14(12):4062. https://doi.org/10.3390/buildings14124062
Chicago/Turabian StyleMohtasham Moein, Mohammad, Komeil Rahmati, Ali Mohtasham Moein, Ashkan Saradar, Sam E. Rigby, and Amin Akhavan Tabassi. 2024. "Employing Neural Networks, Fuzzy Logic, and Weibull Analysis for the Evaluation of Recycled Brick Powder in Concrete Compositions" Buildings 14, no. 12: 4062. https://doi.org/10.3390/buildings14124062
APA StyleMohtasham Moein, M., Rahmati, K., Mohtasham Moein, A., Saradar, A., Rigby, S. E., & Akhavan Tabassi, A. (2024). Employing Neural Networks, Fuzzy Logic, and Weibull Analysis for the Evaluation of Recycled Brick Powder in Concrete Compositions. Buildings, 14(12), 4062. https://doi.org/10.3390/buildings14124062