Article

Advanced Ensemble Machine-Learning Models for Predicting Splitting Tensile Strength in Silica Fume-Modified Concrete

by
Nadia Moneem Al-Abdaly
1,
Mohammed E. Seno
2,
Mustafa A. Thwaini
3,
Hamza Imran
4,*,
Krzysztof Adam Ostrowski
5,* and
Kazimierz Furtak
5
1
Construction and Building Engineering Technologies Department, Najaf Engineering Technical Colleges, Al-Furat-Al-Awsat Technical University, Najaf 54003, Iraq
2
Department of Computer Science, Al-Maarif University College (AUC), Ramadi 31001, Iraq
3
Department of Civil Engineering, College of Engineering, Islamic Azad University, Isfahan (Khorasgan) Branch, Isfahan 81551-39998, Iran
4
Department of Environmental Science, College of Energy and Environmental Science, Al-Karkh University of Science, Baghdad 10081, Iraq
5
Faculty of Civil Engineering, Cracow University of Technology, Warszawska 24, 31-155 Cracow, Poland
*
Authors to whom correspondence should be addressed.
Buildings 2024, 14(12), 4054; https://doi.org/10.3390/buildings14124054
Submission received: 19 November 2024 / Revised: 9 December 2024 / Accepted: 17 December 2024 / Published: 20 December 2024
(This article belongs to the Section Building Materials, and Repair & Renovation)

Abstract

The splitting tensile strength of concrete is crucial for structural integrity, as tensile stresses from load and environmental changes often lead to cracking. This study investigates the effectiveness of advanced ensemble machine-learning models, including LightGBM, GBRT, XGBoost, and AdaBoost, in accurately predicting the splitting tensile strength of silica fume-enhanced concrete. Using a robust database split into training (80%) and testing (20%) sets, we assessed model performance through R2, RMSE, and MAE metrics. Results demonstrate that GBRT and XGBoost achieved superior predictive accuracy, with R2 scores reaching 0.999 in training and high precision in testing (XGBoost: R2 = 0.965, RMSE = 0.337; GBRT: R2 = 0.955, RMSE = 0.381), surpassing both LightGBM and AdaBoost. This study highlights GBRT and XGBoost as reliable, efficient alternatives to traditional testing methods, offering substantial time and cost savings. Additionally, SHapley Additive exPlanations (SHAP) analysis was conducted to identify key input features and to elucidate their influence on splitting tensile strength, providing valuable insights into the predictive behavior of silica fume-enhanced concrete. The SHAP analysis reveals that the water-to-binder ratio and curing duration are the most critical factors influencing the splitting tensile strength of silica fume concrete.

1. Introduction

Climate change poses a critical global challenge, with rising greenhouse gas emissions significantly impacting all sectors, including construction. The construction sector accounts for 37% of global CO 2 emissions, with cement production alone contributing approximately 9% [1]. Portland cement, a significant source of CO 2 emissions, utilizes about 3 billion tons of raw materials and 4700 MJ/tons of energy, and its use is expected to increase by 4% annually [2].
One effective approach to reducing emissions in concrete production is the use of supplementary cementitious materials (SCMs) [3]. Among these, silica fume (SF), a byproduct of the ferrosilicon industry, has gained attention for its ability to enhance concrete properties. The benefits of SF in concrete production have been widely confirmed in the literature. Based on analysis [4], it is recommended to use 5% to 12.5% SF in relation to the total mass of the concrete mixture to achieve optimal mechanical parameters. The particle diameter of SF is approximately 0.1–0.5 µm, making it a material that is ten times finer than cement, which has an average particle size of about 10–15 µm. Menéndez et al. [5] analyzed the impact of the addition of coarse SF and limestone on the microstructure, mineralogical composition, and setting time of Portland cement. The use of cement CEM I 42.5 R, SF with a coarse particle size of 238 µm, and ground limestone as a clinker substitute in various proportions (3%, 5%, and 7% SF) improved the cement microstructure through pozzolanic reactions and the filling effect, leading to an increase in the density of the cement paste. The use of these additives also reduced the carbon footprint of cement by reducing the use of clinker, supporting the goals related to the decarbonization of the cement industry. From an environmental perspective, Wang et al. [6] confirmed that the use of SF instead of cement reduces CO 2 emissions, but it is also associated with higher mix costs. Silica fume is the most commonly used component in high-strength concrete due to its properties that improve rheology and mechanical strength.
In structural design, especially when dealing with SF concrete, both compressive and tensile strengths play a pivotal role. Although the importance of compressive strength is universally acknowledged, tensile strength becomes particularly crucial in the case of structures such as paving slabs and airport runways, which are designed primarily to withstand bending and are thus subject to tensile forces. Furthermore, for non-reinforced concrete structures such as dams, tensile strength is essential to counteract shear forces during seismic events. In these cases, the considerations of tensile strength often outweigh those of compressive strength. The tensile strength of concrete structures is also essential when it comes to their durability and integrity. Tensile strength can be crucial, especially in the management of stresses caused by reinforcement corrosion, to prevent the cracking that follows [7]. Although traditional concrete design may not directly prioritize tensile strength, it still plays a crucial role in the development of cracks and the stress behavior of the material. Therefore, it is essential to understand and test the tensile strength, including the tensile strength of the SF concrete splitting, both in academic and practical engineering applications. This underscores that tensile strength is just as significant as compressive strength in the construction of long-lasting building structures. Thus, developing a smart model that leverages historical experimental results to forecast splitting tensile strength based on specific mix inputs could dramatically reduce the need for extensive experimental work and associated costs.
The most direct approach to examining the durability performance of SF concrete is through experimentation, which is both expensive and time-consuming. While numerical and analytical techniques are useful, they still face challenges in accurately reproducing the properties of SF concrete. The two previously mentioned methods are known as traditional approaches. Recently, within the field of civil engineering, Machine-Learning (ML) techniques have significantly enhanced safety, efficiency, quality, and upkeep in construction projects [8,9,10]. They have also been instrumental in modeling and forecasting the mechanical properties of SF concrete [11,12,13,14,15,16,17]. The field of ML for predicting concrete strength is evolving rapidly, opening up numerous new research avenues that have the potential to improve prediction accuracy and testing efficiency. Some of the key areas of study that are likely to shape the future application of ML in predicting concrete strength are Explainable and interpretable models [18], Sustainability and environmental impact [19], Transfer learning [20], and Real-time monitoring and quality control [21]. Compared to traditional methods, Utilizing ML for predicting these properties can lead to reductions in laboratory time, minimize the waste of concrete materials, save energy, and cut costs [22,23]. Moreover, ML is capable of processing vast amounts of data and delivering highly accurate predictions of SF concrete mechanical properties [24,25,26]. Despite the abundance of studies for building prediction models for SF mechanical behavior, there were fewer studies that mainly focused on the splitting tensile strength of concrete with only SF replacement. For example, ref. [27] utilized M5P, linear regression, and gene expression programming to predict concrete’s compressive and tensile strengths with SF, highlighting M5P’s superior accuracy. Data analysis revealed SF and water/binder ratio’s impact on strength properties, demonstrating SF’s effectiveness in improving concrete’s mechanical characteristics. Another study by [13] explored the use of MLPNN, ANFIS, and GEP for predicting compressive and split tensile strengths of SF concrete, highlighting the absence of models for compressive strength estimation of SFC. A comprehensive database from the literature review supported model evaluation through statistical measures (R2, MAE, RMSE, RMSLE), showcasing all models’ capability for accurate predictions. GEP outperformed other models in accuracy, providing a new mathematical equation for future predictions. Sensitivity analysis identified water and cement as crucial for compressive strength models but less so for tensile strength. Further research utilizing artificial neural networks and fuzzy logic methods demonstrated remarkable accuracy in forecasting the compressive and splitting tensile strengths of recycled aggregate concretes enhanced with SF across multiple timeframes [28]. These methods exhibited exceptionally low error margins and high predictive reliability, underscoring their effectiveness in assessing concrete properties. The research mentioned above has focused on predicting the SF concrete splitting strength using ML models. While these models are more accurate and functional than traditional empirical ones, it can be challenging to create an optimal ML model due to uncertainties. In general, it is difficult to create a model that excels in all metrics, so a new strategy has emerged called ensemble learning [29]. Ensemble learning involves synthesizing several models to create a superior, more holistic model. The goal of ensemble learning is to mitigate the impact of errors from weaker models through the corrective predictions of others. Ensemble learning can be divided into two categories: bagging and boosting. Bagging is a parallel method that involves training multiple models on randomly sampled data and aggregating their predictions for a final result. Boosting is a sequential approach that focuses on sequentially training models where each is influenced by its predecessor’s performance, culminating in a unified prediction. The choice between bagging and boosting depends on the specific needs: bagging typically reduces variance and enhances generalization, whereas boosting aims to minimize both bias and variance, therefore efficiently reducing overall model errors. Ensemble learning has proven to be superior in performance over both individual ML models and conventional empirical approaches in concrete engineering, and its adoption has grown [30,31,32].
As previously mentioned, there has been a noticeable lack of research specifically addressing the prediction of splitting tensile strength in concrete where SF partially replaces cement. Furthermore, most of the few models developed in the literature have relied on single-learner machine-learning methods such as ANFIS, neural networks, and GEP. The breakthrough of this study lies in its novel application of ensemble learning techniques to accurately predict the splitting tensile strength of SF concrete—a topic that has not been thoroughly explored in previous research. The selection of GBRT, XGBoost, LightGBM, and AdaBoost in our research was driven by their proven effectiveness as ensemble methods, which combine the strengths of multiple models to enhance predictive accuracy and robustness. This work not only fills a critical gap in the literature but also introduces an innovative approach that could lead to more efficient and cost-effective methods for predicting concrete properties.
The paper is structured as follows: First, we present a detailed review of existing literature on the use of SF in concrete and the application of machine-learning models in predicting concrete properties. Next, we describe the methodology employed in this study, including the selection of GBRT, XGBoost, LightGBM, and AdaBoost as the ensemble models, and the process of data collection and preprocessing. The results section then presents the performance evaluation of these models, benchmarked against individual machine-learning approaches. Feature importance analyses using the SHAP methodology are conducted to determine the significance of various input variables. Finally, the paper concludes with a discussion of the implications of the findings, the limitations of the study, and suggestions for future research. This comprehensive approach ensures that the potential of ensemble learning in predicting SF concrete’s splitting tensile strength is fully explored and documented.

2. Research Significance

Ensemble machine-learning techniques offer a powerful approach to predicting concrete properties, enhancing both accuracy and reliability. This study examines which of the tested ensemble models—GBRT, XGBoost, LightGBM, and AdaBoost—provides the most accurate predictions of the splitting tensile strength in silica fume-enhanced concrete. Correct prediction of tensile strength supports the efficient design of durable and sustainable concrete structures, reducing the time required to select optimal materials and minimizing the resources spent on costly experimental tests and repairs. This predictive approach enables civil engineers to leverage data-driven insights for the smart design of materials that meet both performance and environmental goals, thus contributing to a more sustainable construction industry.

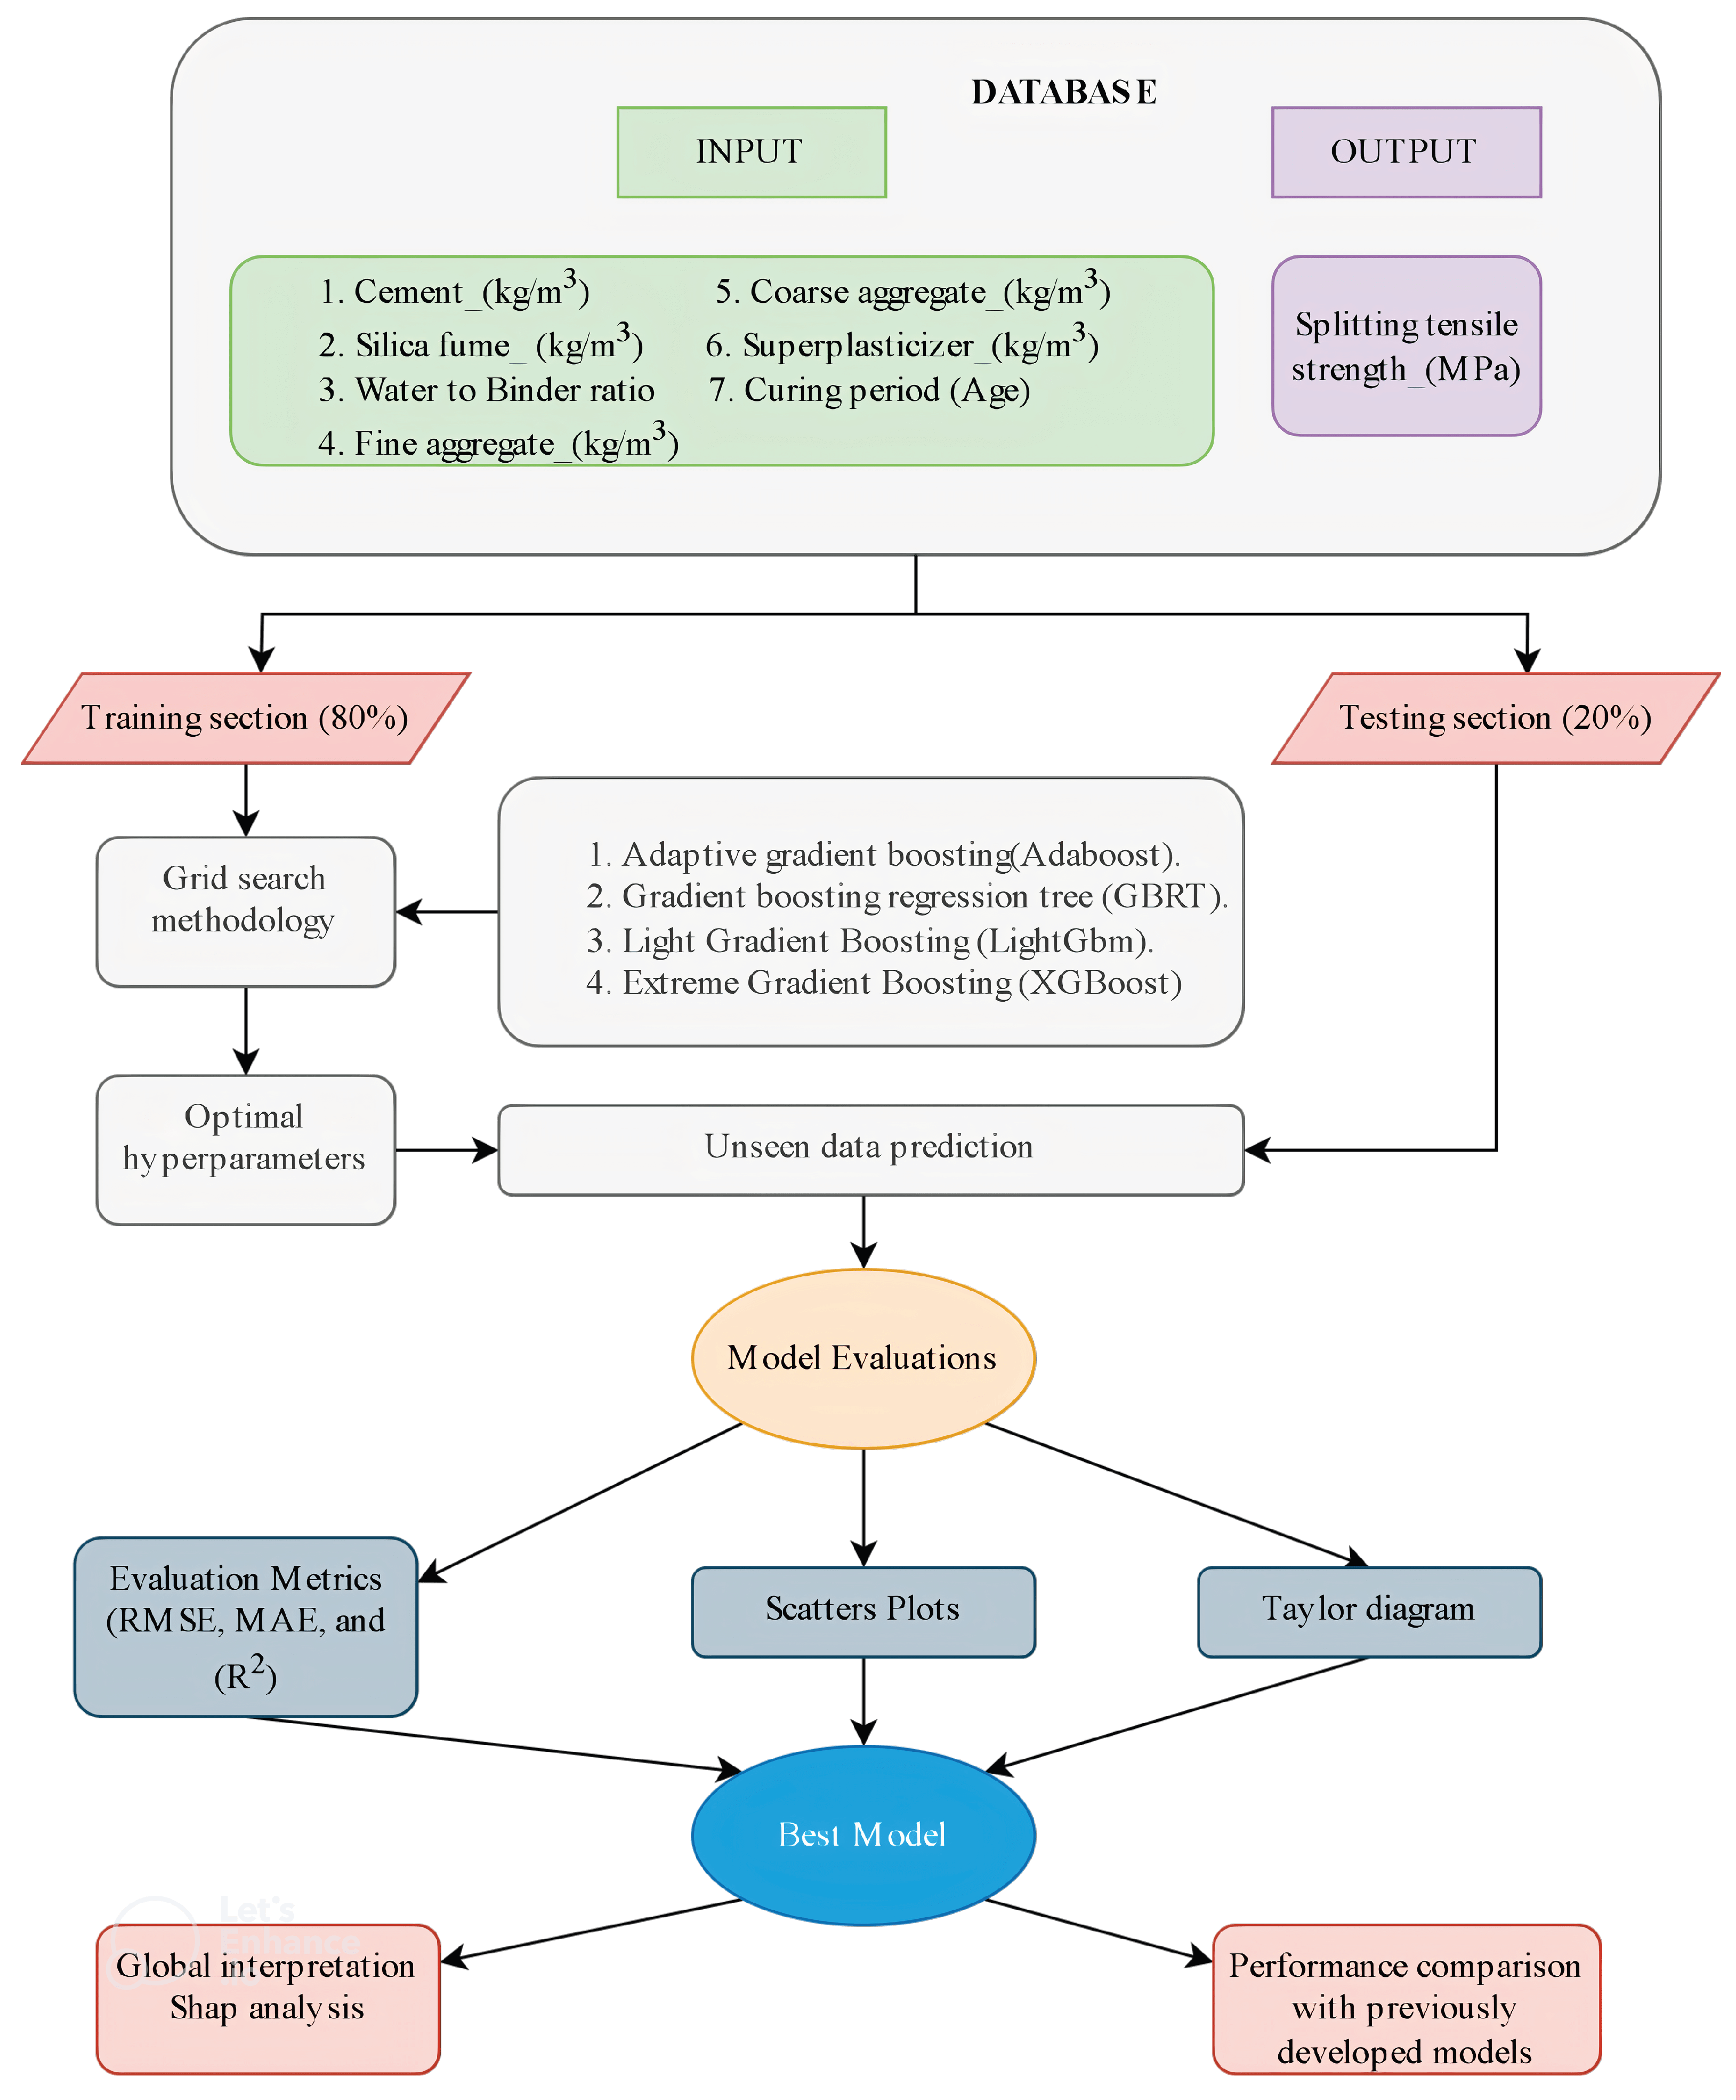
3. Materials and Methods

3.1. Research Methodology

This research outlines its investigative methodology in three primary phases, as illustrated in Figure 1. Initially, raw data sourced from various studies is processed to create a refined database consisting of 158 samples where each sample consists of 7 input variables such as Cement content, SF content, Water-to-Binder ratio, Fine aggregate content, Coarse aggregate content, Curing period, and 1 output variable, which is splitting tensile strength. Next, the database is segmented into two categories: 80% of the total entries are allocated for the training phase and 20% for the testing phase, as per reference according to [33]. Four ensemble ML algorithms, including AdaBoost, XGBoost, GBRT, and LightGBM, are employed for training. This phase evaluates the performance of these ML algorithms using three metrics, including R2, RMSE, and MAE. To ensure model reliability, a validation technique involving 5-fold Cross-Validation is applied. The ML algorithms demonstrating the highest accuracy and reliability are then advanced to the third phase. In the third step, the splitting tensile strength is forecasted using the most effective ML models, with the analysis presented through a Taylor diagram. Global interpretation of tensile strength predicted by ML models is carried out by Shapley Additive Explanations. Finally, the performance of the best ML model is compared with the previously developed model to determine its superiority in terms of accuracy, therefore highlighting advancements in predictive modeling for the specific application area.

3.2. Overview of the Suggested ML Models

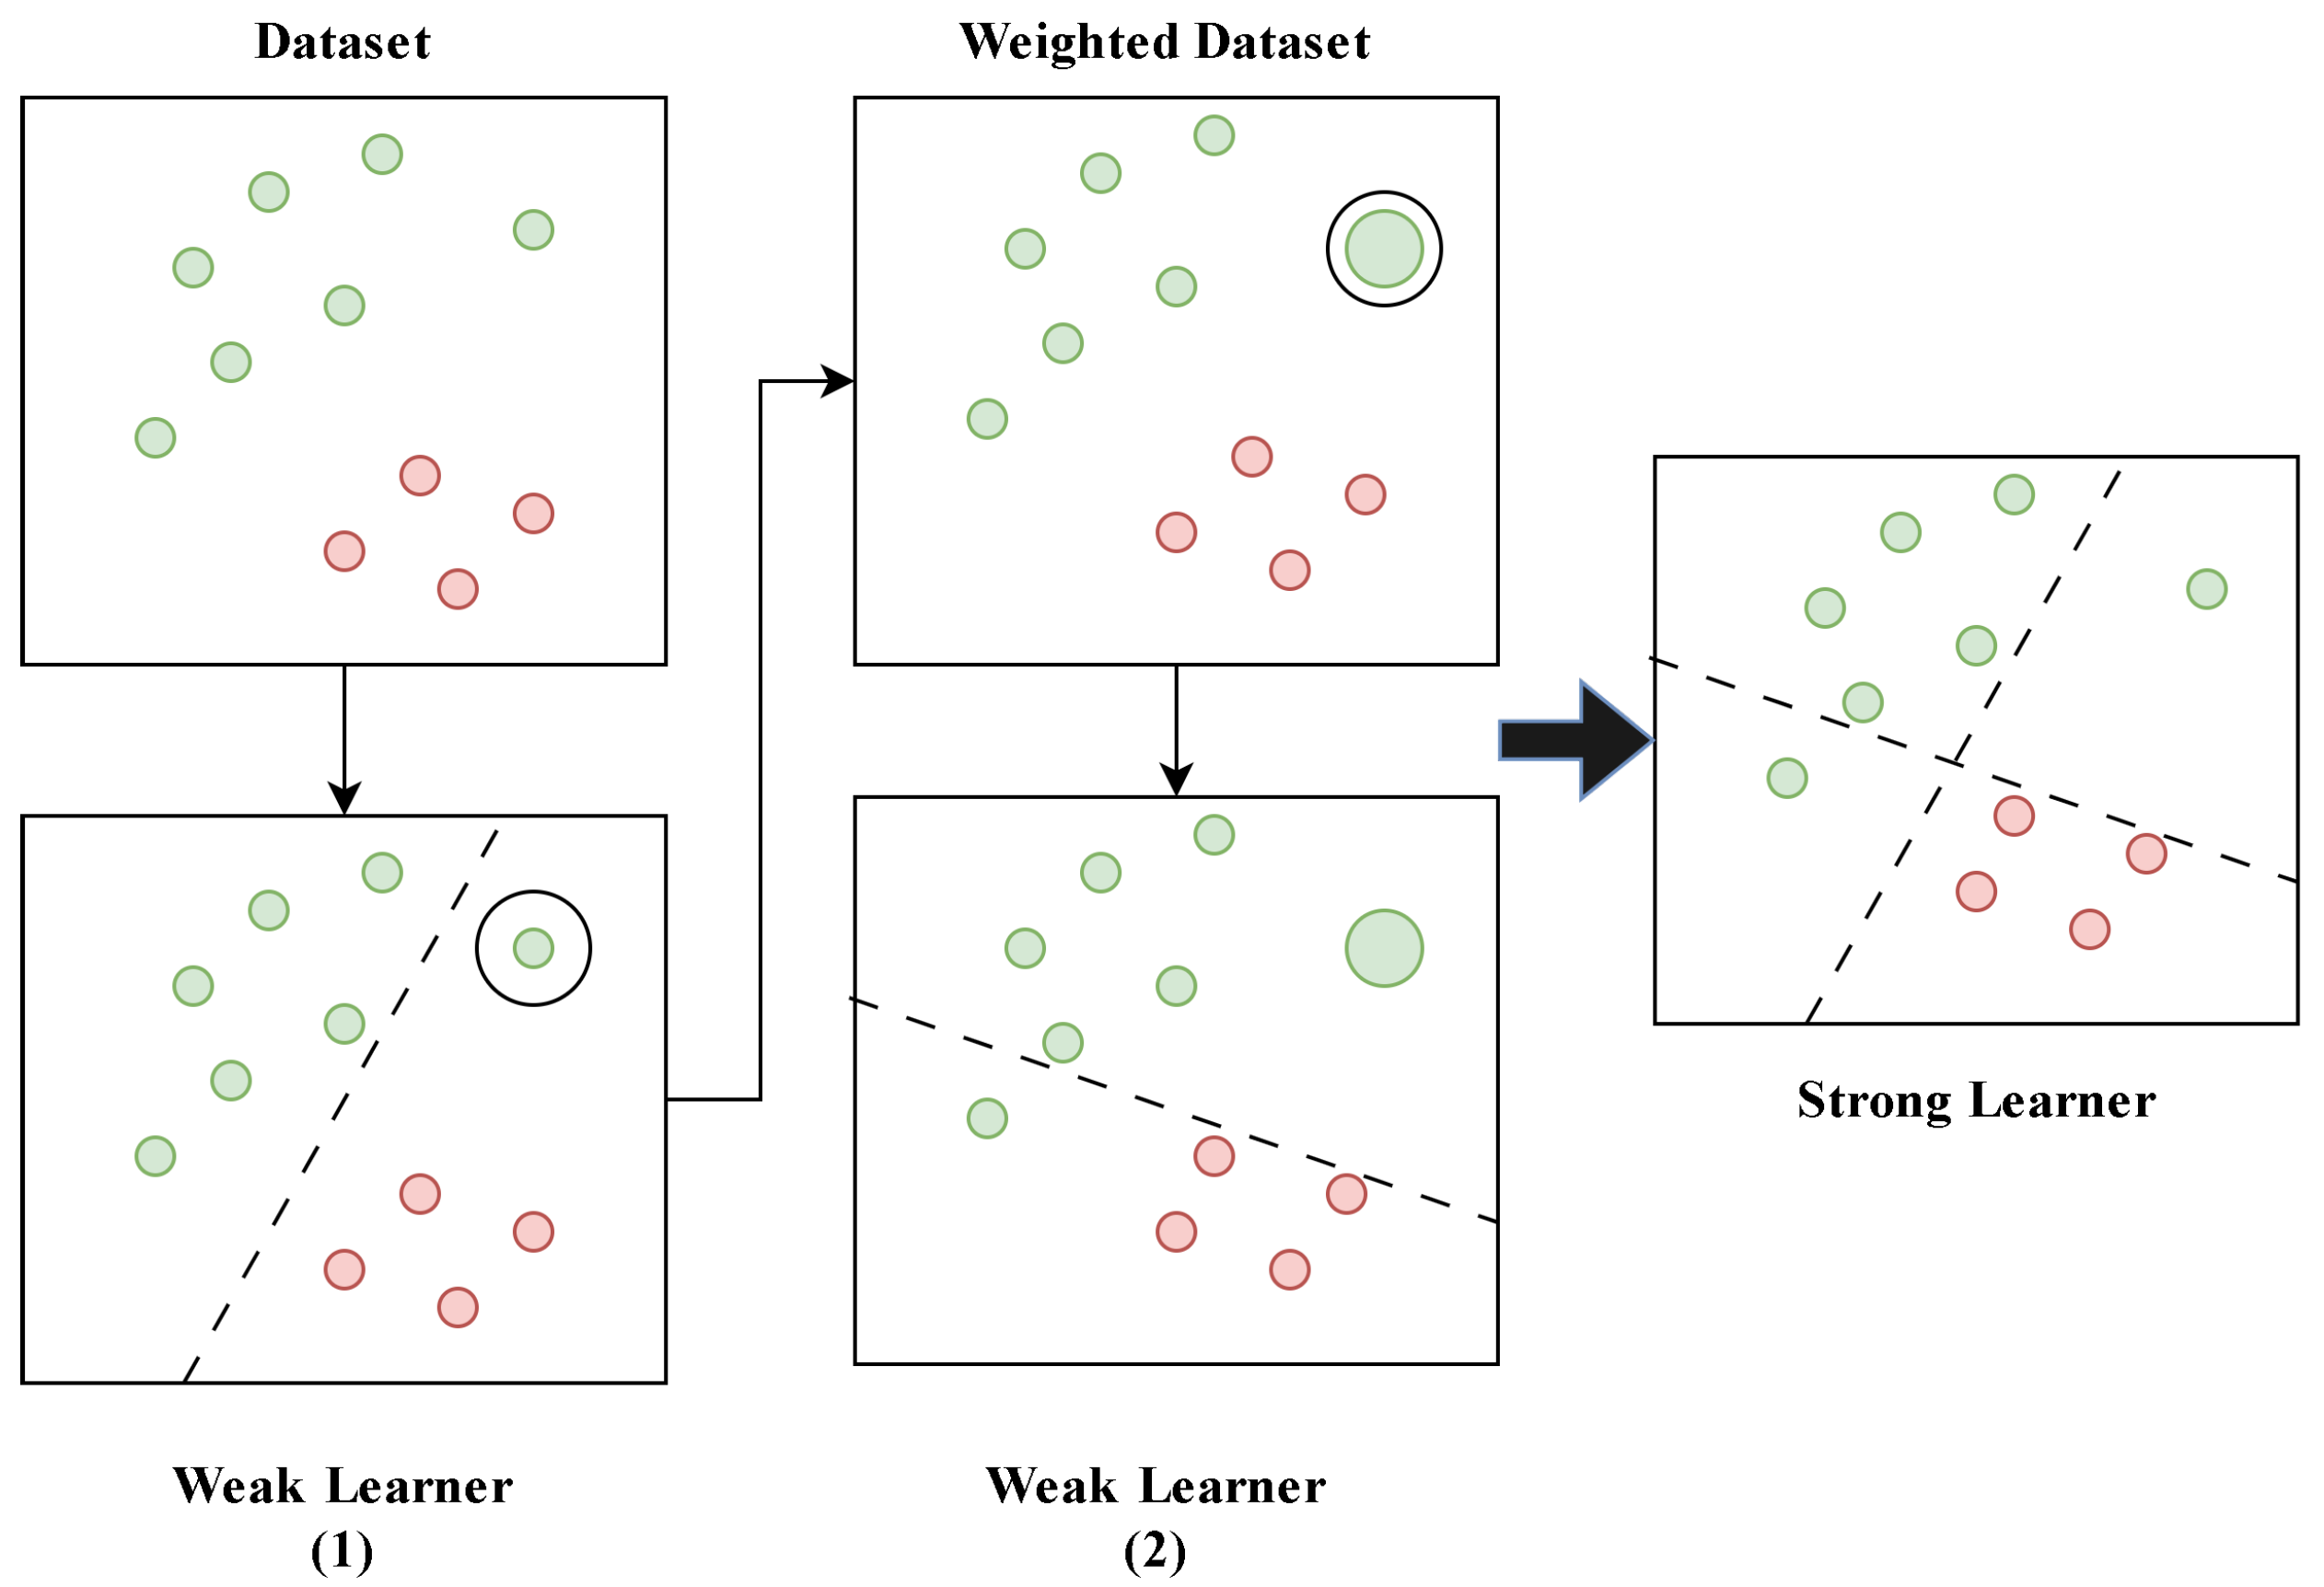
3.2.1. Adaptive Gradient Boosting (AdaBoost)

Freund and Schapire [34] introduced the AdaBoost method in 1997, highlighting it as a prominent boosting technique. This method employs ensemble learning to unite multiple weak classifiers in a sequence, forming a robust classifier. Each weak classifier aims to improve on the errors made by its predecessor, therefore improving the accuracy of the model with the addition of more classifiers, although with the risk of overfitting and reduced generalization capability [35,36]. It works by applying a series of weak learners to the data. Each weak learner is associated with adjusted weights based on the previous learner’s effectiveness, with the emphasis typically being put on the tougher cases by giving them higher weights for greater attention. Figure 2 shows the AdaBoost classifier in action on a dataset with two features and two classes, illustrating how one weak learner improves upon the mistakes of another to produce a stronger decision boundary.

3.2.2. Gradient Boosting Regression Tree (GBRT)

Gradient Boosting Regression Tree (GBRT) is a powerful ensemble machine-learning method that works well for both regression and classification applications. It effectively reduces bias and prevents overfitting. When managing complex and large data sets, data scientists often use GBRT due to its outstanding reliability and accuracy. Figure 3 outlines the framework of the GBRT algorithm. As a supervised optimization algorithm, GBRT iteratively adjusts new models to new data, enhancing the precision of the predicted results. It incrementally merges multiple weak learners to form a robust learner [37]. The algorithm is versatile, accommodating various loss functions, and focuses on reducing the loss at each gradient descent iteration by aggregating the residuals from the previous model to refine the next learner [38]. For a deeper understanding of the underlying concepts and mathematical foundations of GBRT, references [39,40] are recommended.

3.2.3. Light Gradient Boosting (LightGBM)

Unlike traditional gradient boosting algorithms that develop trees level by level, LightGBM advances by expanding the tree leafwise, employing a histogram-based method to split leaf nodes, which leads to substantial improvements in efficiency and memory usage [41]. The leafwise growth strategy, while enhancing the model’s complexity, often yields superior accuracy improvements per algorithm iteration. However, this approach also carries the risk of overfitting, which is addressed through the application of regularization techniques. LightGBM can achieve its high speed, efficiency, and dependability using gradient-based one-side sampling (GOSS) and exclusive feature bundle (EFB) [42]. GOSS selectively retains samples with higher gradients, those that offer more information gain, while discarding those with lower gradients during training. This selective sampling drastically reduces the time needed for calculations compared to traditional full-data traversal methods like decision trees (DT), random forests (RF), and gradient-boosted decision trees (GBDT). Concurrently, EFB combines exclusive features in a sparse feature space, effectively reducing dimensionality and further enhancing computational efficiency. This makes LightGBM, especially when integrated with EFB, far more efficient and scalable than conventional models such as RF, DT, and GBDT, significantly speeding up the computation process and reducing memory demands without sacrificing accuracy.

3.2.4. Extreme Gradient Boosting (XGBoost)

Introduced in 2016 by [43], the XGBoost algorithm represents a significant advancement in the gradient boosting framework by incorporating model complexity directly into the objective function via a regularization term, effectively managing the bias-variance dilemma. The algorithm minimizes an objective function for each iteration, combining the training loss, denoted by L ( θ ) , with a regularization component, Ω ( θ ) , to avoid overfitting, as we can see in Equation (1). The loss function can vary, with squared error Equation (2) being a common choice. The regularization term Ω ( θ ) is elaborated in Equation (3) to include both the number of tree leaves (T) and the sum of squared leaf scores ω i 2 , aiming to control the complexity and overfitting of the model.
Obj = L ( θ ) + Ω ( θ )
L = ( y i y ^ i ) 2
Ω = γ T + 1 2 λ ω i 2
The core of the algorithm involves optimizing the weights through the second-order Taylor expansion of the cost function, leading to the derivation of optimal weight values that minimize the objective function (Equations (4)–(6)). However, given the computational intensity of evaluating all possible tree configurations, XGBoost employs a greedy search method. It calculates a “gain” (Equation (7)) value for different splits, selecting the split that maximizes this gain as the criterion for tree branching, diverging from traditional metrics like Gini impurity or mean squared error. This methodical approach enables the efficient identification of the most effective model structure for a given dataset.
Obj = 1 2 j = 1 T G j 2 H j + λ + γ T
G j = i I j y ^ ( t 1 ) L y i , y ^ i ( t 1 )
H j = i I j y ^ i ( t 1 ) 2 L y i , y ^ i ( t 1 )
Gain = 1 2 G L 2 H L + λ + G R 2 H R + λ ( G L + G R ) 2 H L + H R + λ γ

3.3. Data Splitting and Normalization

Facilitating ML models involved randomly splitting the dataset into two separate sets. To ensure that there were no biases in the selection process, the dataset was shuffled randomly before the split. This approach helps maintain the integrity of the data and ensures that both the training and testing sets are representative of the overall dataset. The 80/20 split is a commonly accepted practice in machine learning because it allows enough data to train the model while reserving a meaningful portion for testing to evaluate its performance [12,44,45,46]. This split helps to ensure that the model generalizes well to new unseen data.
In addition, to ensure optimal model performance, it was essential to prepare the data before training the Ensemble models. This preparation involved normalizing the features (data points) to prevent a small number of high-value features from dominating the training process. In this study, the widely used Min-Max normalization method was applied. This technique scales all data to fall within the range of (0, 1). The following formula was used to achieve this:
x = x min ( x ) max ( x ) min ( x )

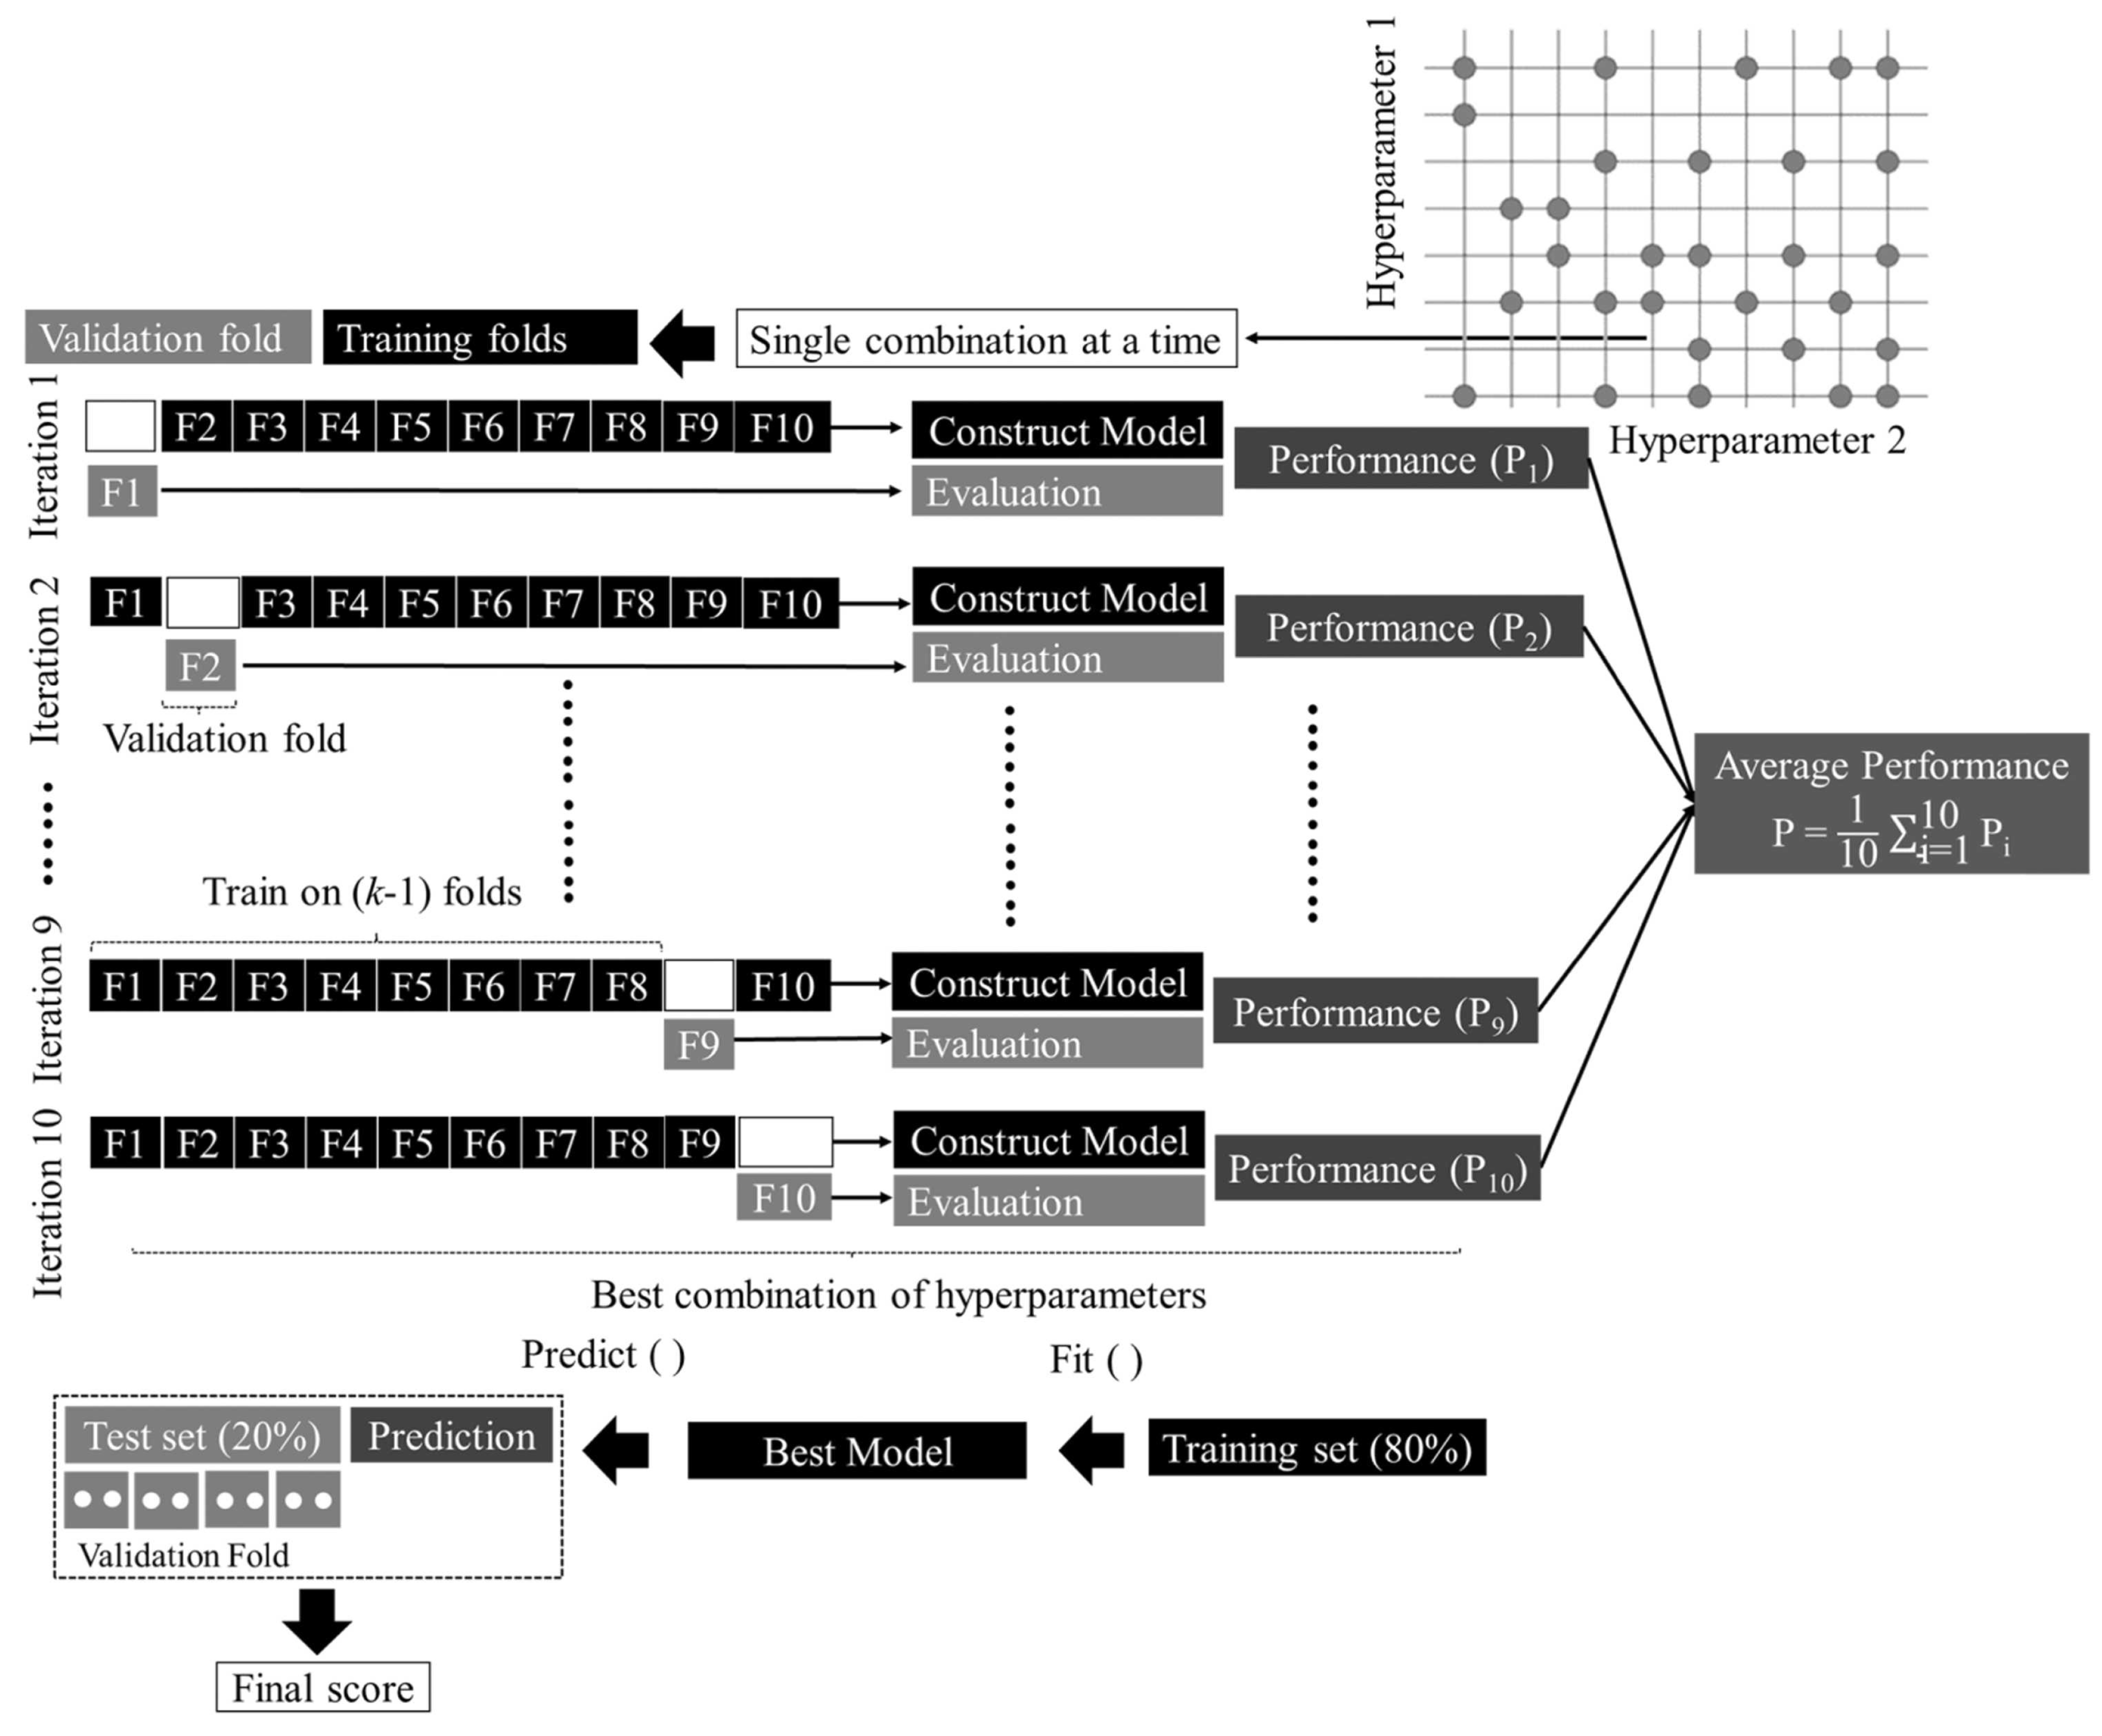
3.4. ML Model Development

Hyperparameter tuning is crucial for the development of machine-learning models. This process optimizes model performance by adjusting key parameters within the ML algorithm. The most popular method of optimizing hyperparameters is grid search [47]. It identifies the parameter combination that delivers the best model performance in terms of RMSE by systematically evaluating all possible parameter combinations. For our ensemble ML algorithms used in this research, critical parameters such as the number of trees (n_estimators), learning rate, and the maximum depth of the tree were identified for optimization. The ranges for these parameters were set as [1, 20, 100, 500, 1000] for the number of trees, [0.02, 0.05, 0.1, 0.2] for the learning rate, and [2, 5, 10, 20] for the maximum tree depth.
To further ensure robust performance and avoid overfitting, the dataset was split into an 80/20 ratio, with 80% allocated for training and 20% for testing. The training dataset was then subjected to 5-fold cross-validation during the grid search process. In this method, the training dataset was divided into five equal-sized subsets. The model was trained on four subsets and validated on the remaining one. This process was repeated five times, with each subset serving as the validation set once. The average performance across these five iterations provided a reliable estimate of the model’s generalization ability, offering a more accurate representation of how the models might perform on unseen data. This approach is depicted in Figure 4. After completing the grid search and cross-validation, the set of hyperparameters that yielded the best performance metrics was selected as the optimal set for each model. These optimal values, which include the number of estimators, learning rate, and maximum depth for each model, are documented in Table 1. For example, for the GBRT model, the optimal hyperparameters were found to be a learning rate of 0.01, a maximum depth of 3, and 600 estimators. Finally, to ensure the reproducibility and consistency of our experiments, a specific ‘random state’ parameter was applied to each machine-learning model using the Python scikit-learn library (3.7). This parameter controls the shuffling of the data before splitting it into training and testing sets, ensuring that the same samples are selected each time the code is executed. By fixing the random state, we guarantee that the division of data is consistent across different runs, which is crucial for accurately comparing model performance and validating results. This approach not only enhances the reliability of our findings but also allows other researchers to replicate our experiments with the same dataset and achieve identical results.

3.5. Performance Metrics
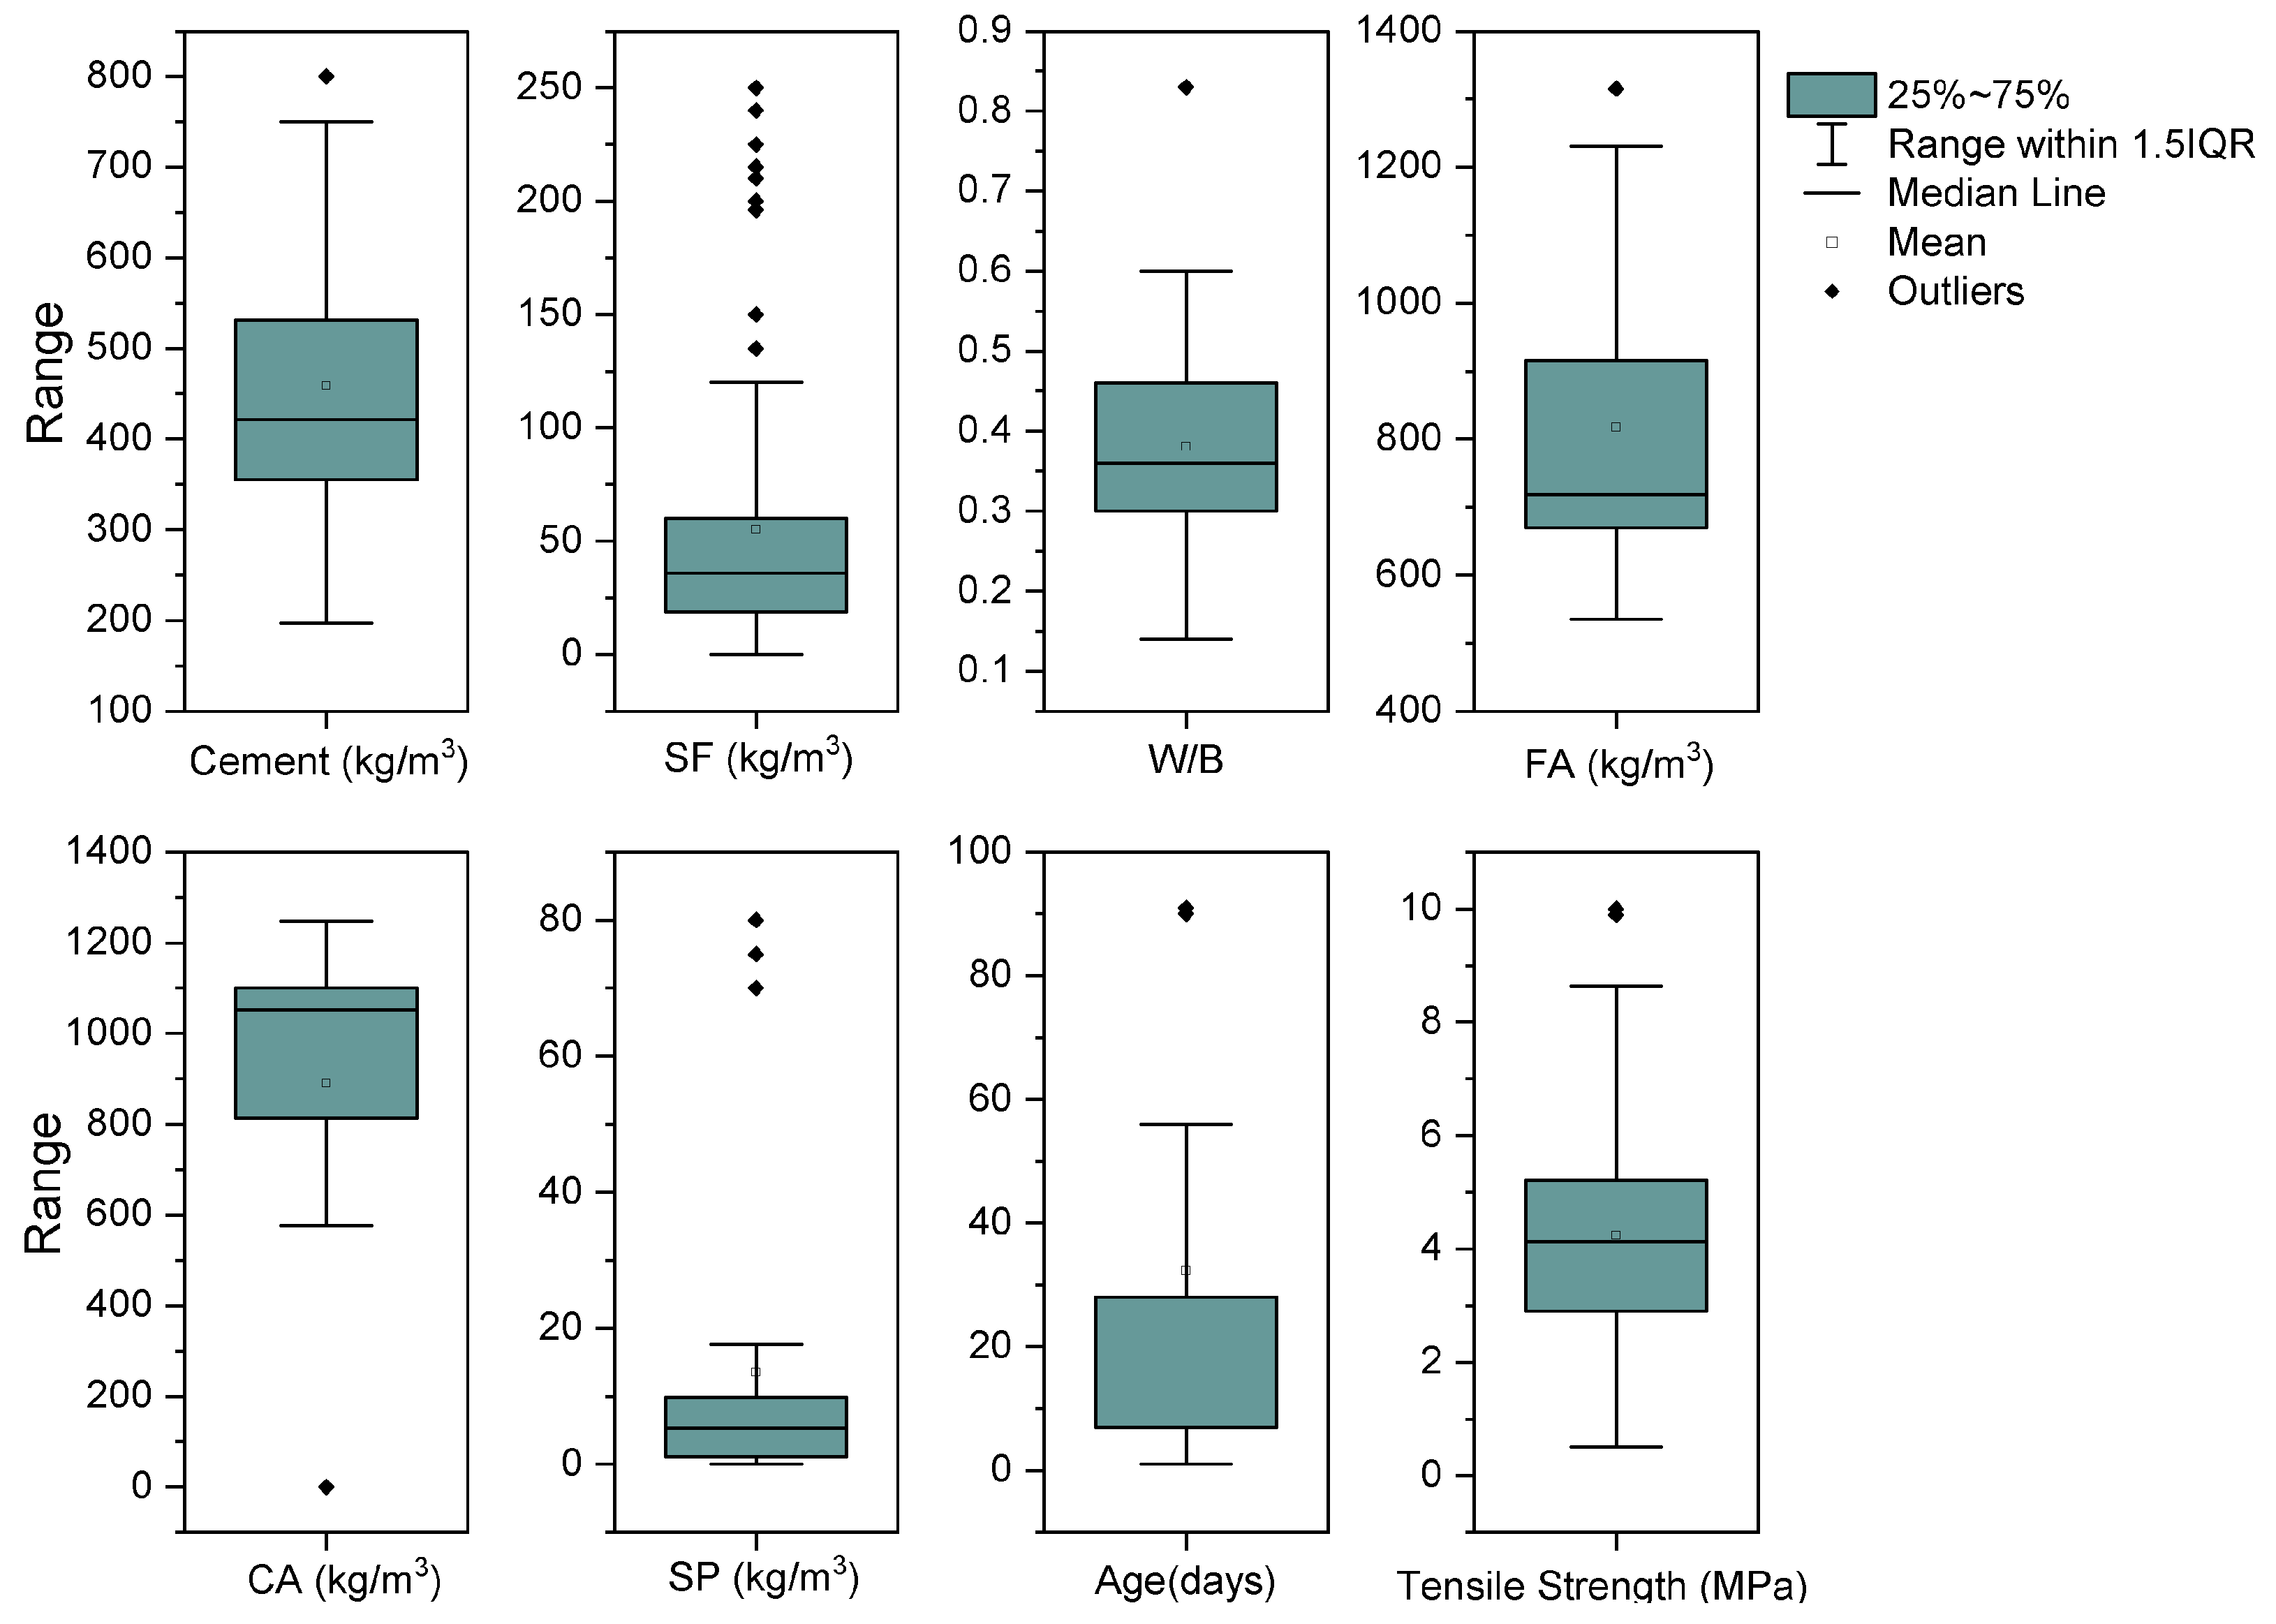
The effectiveness of the four ensemble ML models suggested is evaluated using various statistical metrics. The indicators used most frequently to assess performance, as identified in the existing literature and applied in this research, include the mean square error (RMSE), the coefficient of determination R2, and the mean absolute error (MAE). The formulas for these three statistical metrics are provided below:
Root mean squared error (RMSE):
RMSE = 1 n i = 1 n ( y i y ˜ i ) 2
Correlation of determination ( R 2 ):
R 2 = 1 i = 1 n ( y i y ˜ i ) 2 i = 1 n ( y i y ¯ ) 2
Mean absolute error (MAE):
MAE = 1 n i = 1 n | y i y ˜ i |
where y i represents the actual observed value, y ˜ i denotes the predicted value from the model, y ¯ is the mean of the observed values, and n is the number of observations. Values of RMSE and MAE nearing zero signify strong model performance. Similarly, R2 values approaching 1 denote optimal predictive model accuracy.

4. Database Used

The dataset used to build our predictive models is collected from previous research [27]. This dataset is enriched by 158 experiments, presenting a comprehensive range of values for each predictive factor. As indicated in Table 2, the dataset features considerable variability in its measurements. The specifics include Cement content varying from 197 kg/m3 to 800 kg/m3, silica fume (SF) from 0 kg/m3 to 250 kg/m3, Water/Binder ratio (W/B) from 0.14 to 0.83, Fine Aggregate (FA) content from 535 kg/m3 to 1315 kg/m3, Coarse Aggregate (CA) from 0 kg/m3 to 1248 kg/m3, Superplasticizer (SP) from 0 kg/m3 to 80 kg/m3, curing Age from 1 day to 91 days, and tensile strength from 0.51 MPa to 10.00 MPa. The splitting tensile, which is the target variable in MPa, also shows significant fluctuation, starting at a minimum of 0.51 MPa and reaching a maximum of 10.00 MPa.
This statistical overview provides a basis for understanding the variability and distribution of the factors that affect the splitting tensile strength. Furthermore, it reinforces our predictive model for the tensile strength of SF concrete, which improves our ability to forecast the performance of construction materials more accurately.
Figure 5 shows the statistical distribution of the components that influence the tensile strength of SF concrete. The data are represented through a series of box plots. After analyzing these plots, it is observed that the variables such as Cement, SF (SF), Water-to-Binder ratio (W/B), Fine Aggregate (FA), Coarse Aggregate (CA), Superplasticizer (SP), and Age display expected variations, and some outliers. This indicates that the dataset consists of diverse compositions and curing conditions. Specifically, the concentrations of Cement and FA show a relatively small number of outliers, which suggests that their values are consistent and clustered tightly around the median. This indicates that there is consistency in the batching of concrete mix design. On the other hand, the W/B ratio and SP content exhibit more variability, with outliers suggesting instances of typical mix proportions. SF (SF) content has multiple outliers, reflecting the varied use of SF in different concrete mixes, although its spread within the interquartile range is modest. The CA content follows a similar pattern to Cement and FA, with fewer outliers suggesting standardization in aggregate sizing. The Age of curing shows a constrained range with some deviation, indicating that most samples were tested within a common timeframe. However, a few samples were cured for extended or reduced periods. The tensile strength of the concrete, which is the primary performance metric, demonstrates a broader dispersion of values. This implies a wide variation in the mechanical properties of the concrete, potentially due to the diversity in mix designs and curing times. The mean tensile strength is affected by outliers, which might be the result of particular mix compositions or testing anomalies. Therefore, it highlights the need for rigorous sampling and testing procedures to ensure reliable predictive modeling.
Figure 6 shows the Pearson Correlation Coefficients (PCCs) that demonstrate the connections between various mix design factors and the resulting tensile strength in SF concrete. PCC values range from −1 to 1, where 1 represents a perfect positive correlation, −1 is a perfect negative correlation, and 0 indicates no correlation. The Cement (C) content displays a strong positive correlation with tensile strength, indicating that an increase in cement content is typically associated with an increase in tensile strength. On the other hand, the Water-to-Binder ratio (W/B) exhibits a notable negative correlation with tensile strength, suggesting that higher water ratios may lead to a decrease in strength. The heatmap also represents the connections between mixed design elements themselves. For example, there is a strong negative correlation between the Water-to-Binder ratio (W/B) and cement (C), which could signify that mixes with less water relative to binders tend to have a higher cement content. The Fine Aggregate (FA) and Superplasticizer (SP) exhibit a negative correlation, indicating that as the use of superplasticizers increases, the proportion of fine aggregates tends to decrease. Inter-correlations between mix design variables, such as the negative correlation between Coarse Aggregate (CA) and Superplasticizer (SP), may indicate compensatory adjustments in mix designs to achieve desired workability and strength properties. Additionally, the positive correlation between Cement (C) and Superplasticizer (SP) suggests that mixes with higher cement content may also employ more superplasticizers to maintain workability. These correlations provide valuable insights into the complex interactions that govern the material properties of SF concrete. They are critical for optimizing concrete formulations for enhanced tensile strength and overall performance.
According to Figure 6, all the variables have correlation coefficients lower than 0.95, which means that their relationships are not linear. This can pose a challenge for empirical fitting methods that rely on experimental data to account for the nonlinear interdependencies among influencing factors. However, AI-driven ML algorithms are known for their predictive capabilities precisely because they can take into account and analyze the nonlinear interactions between all variables within the model [49,50].

5. Model Results

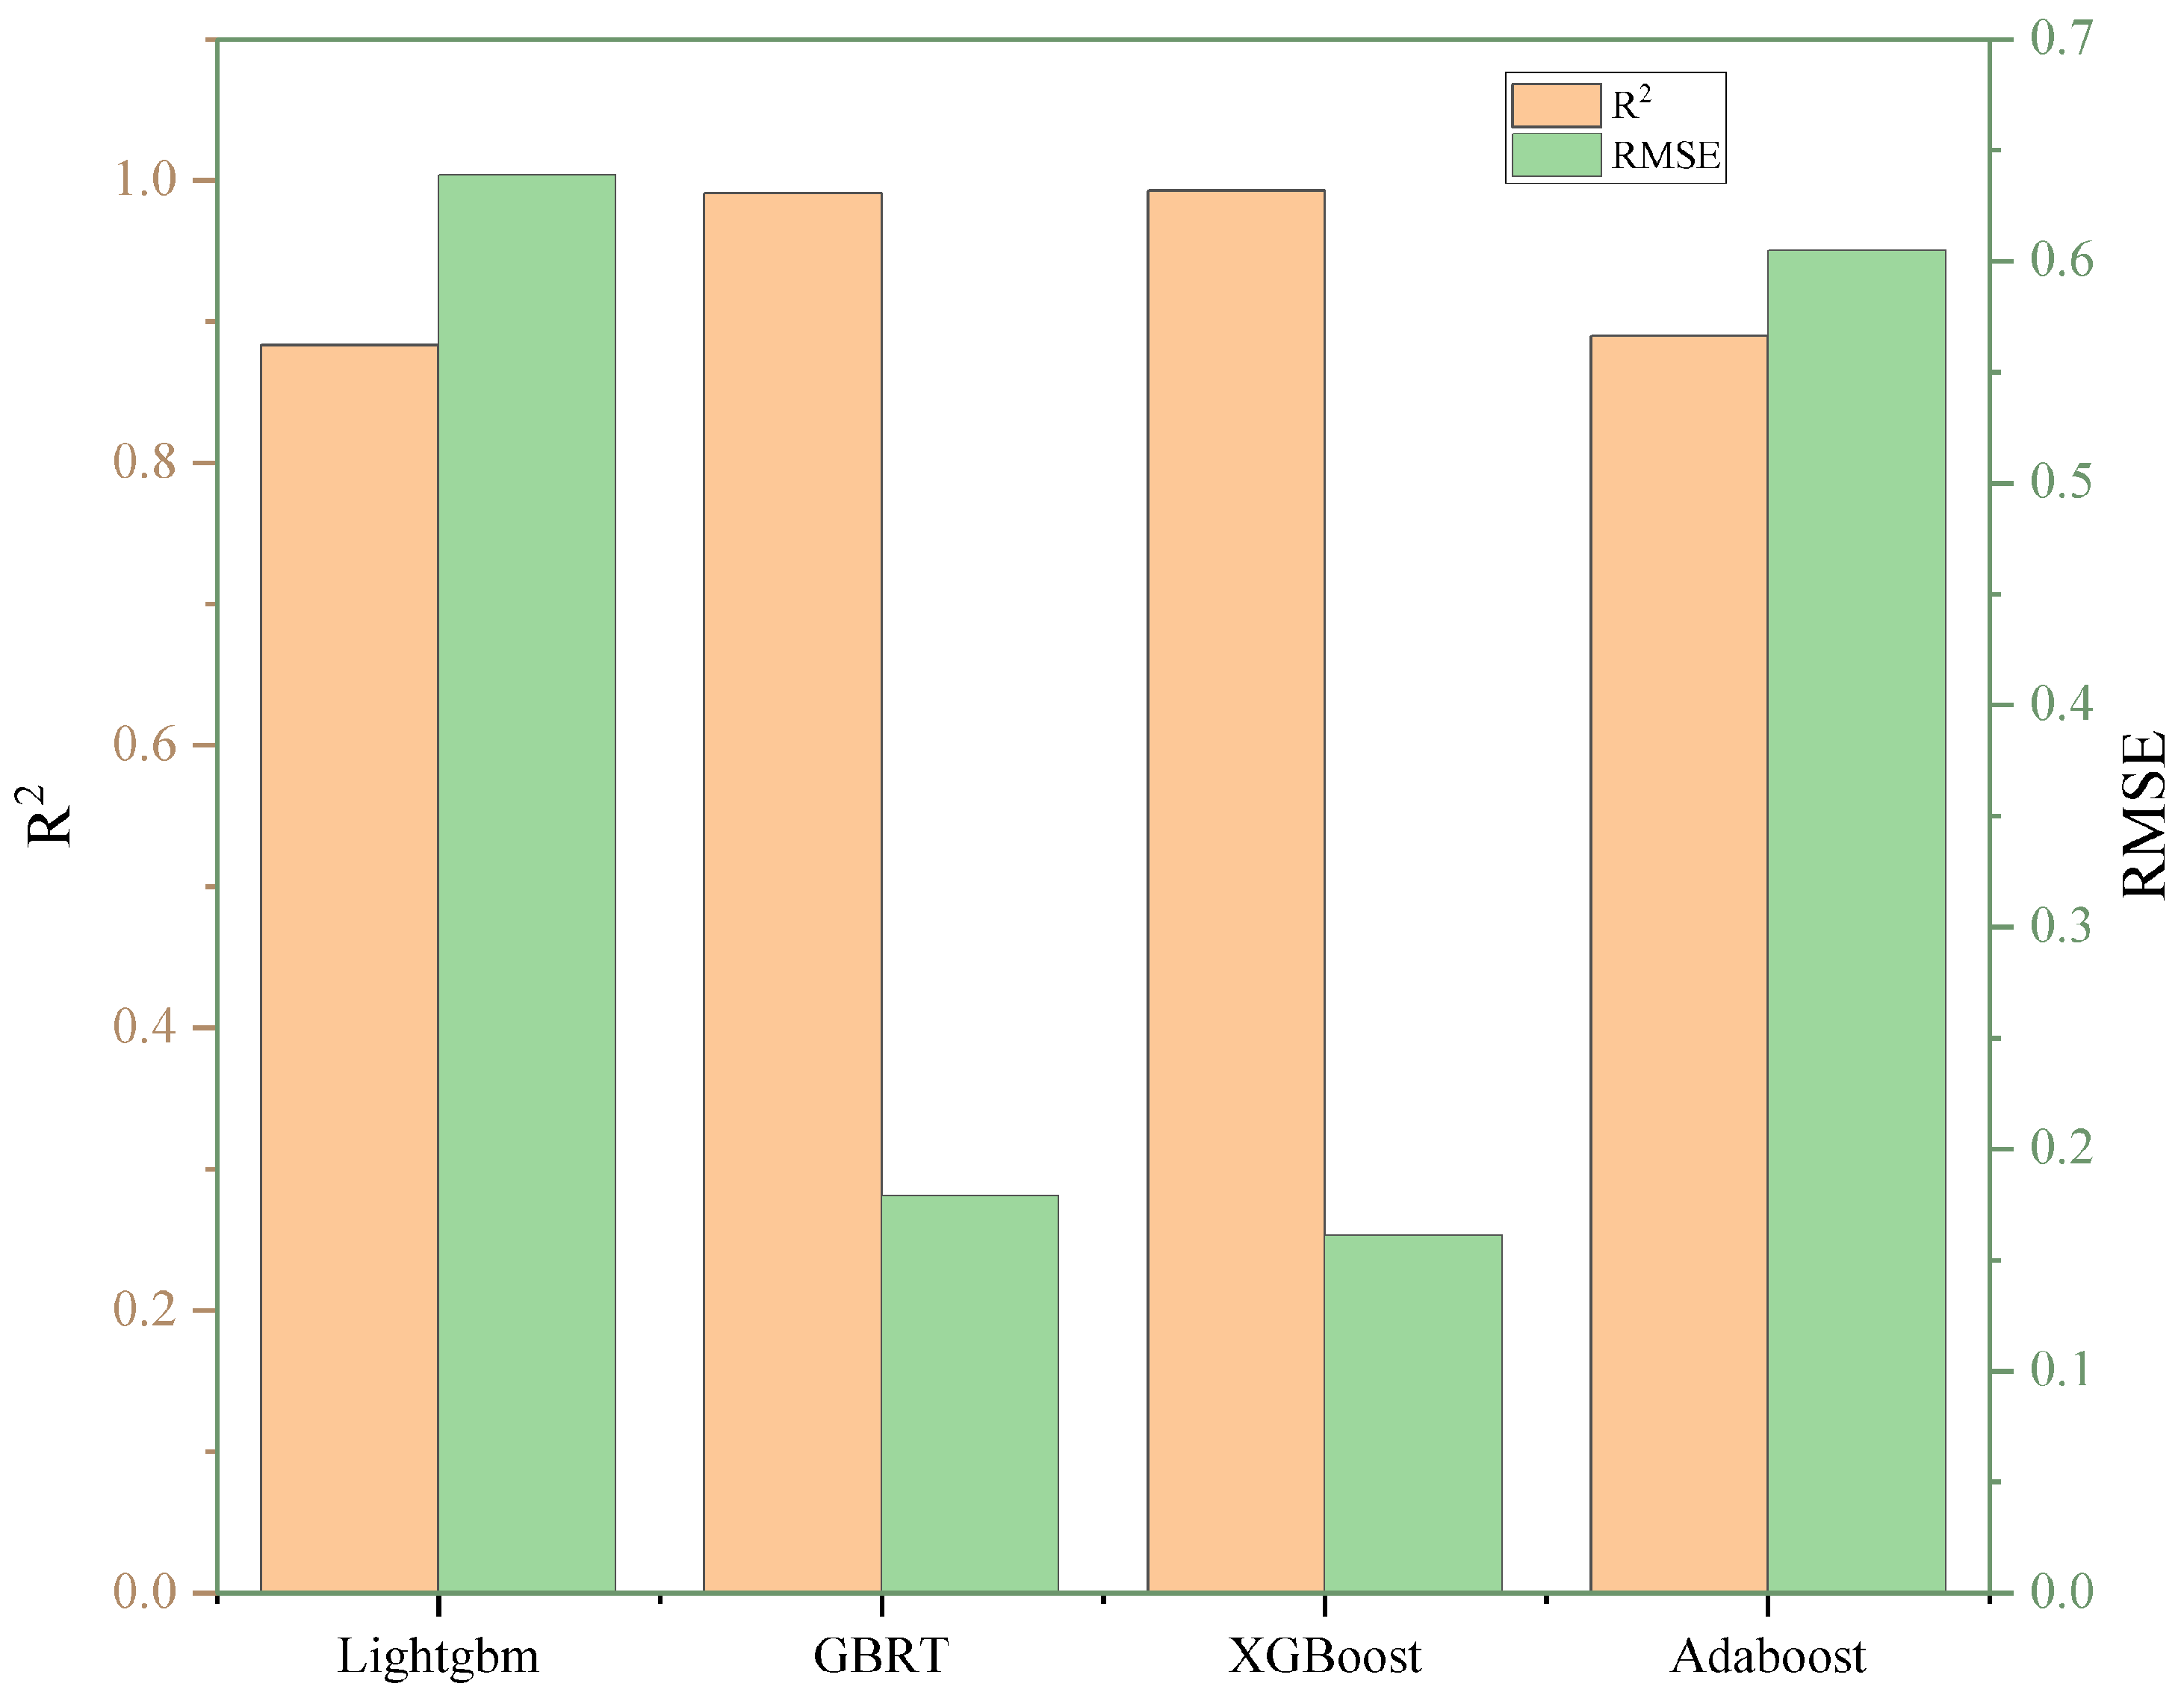
5.1. Statistical Assessment of Models
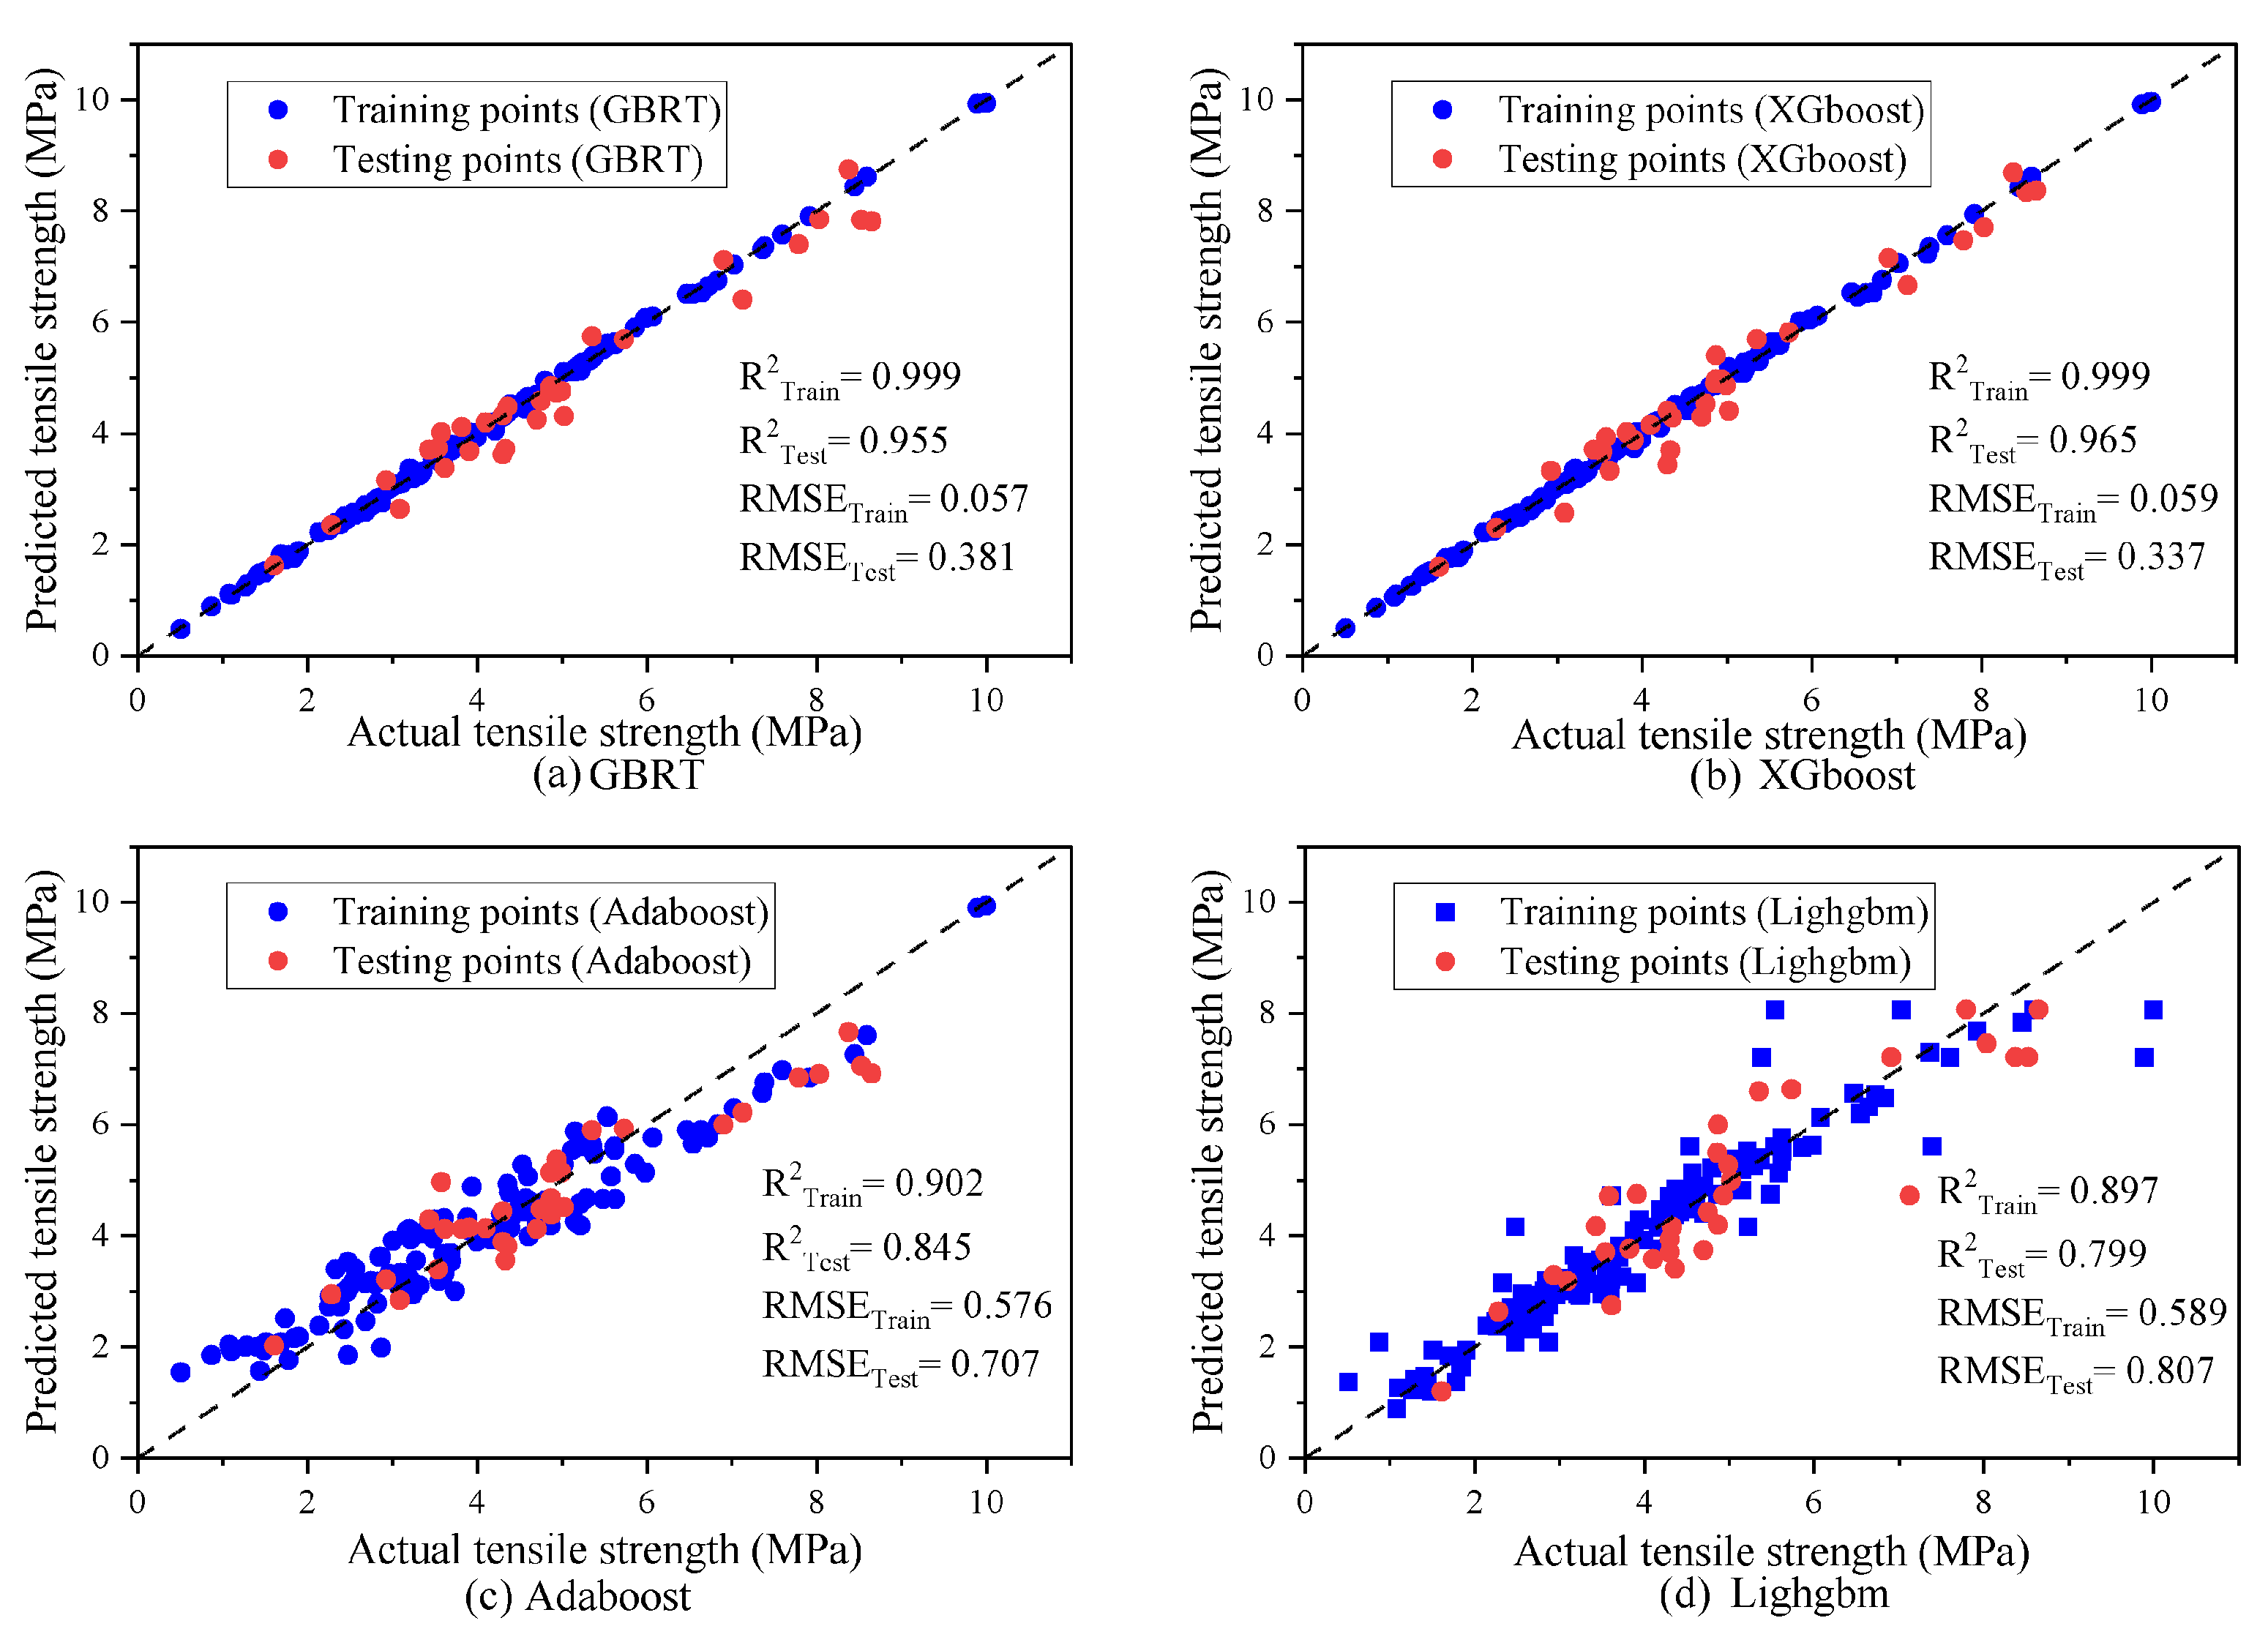
Statistical assessment of models is presented in Table 3. As we can notice, the GBRT and XGBoost models showed superior performance, maintaining nearly perfect R2 scores of 0.999 during training and impressive scores above 0.955 in testing, indicating their high accuracy in both phases. LightGBM and AdaBoost, while slightly lagging behind, still demonstrated robust performances with R2 scores of 0.897 and 0.902, respectively, in training and 0.799 and 0.845 in testing. The RMSE and MAE values further illustrate the models’ precision, with GBRT and XGBoost showcasing remarkably low error rates across all phases; RMSE values as low as 0.057 and 0.059 in training and 0.179 and 0.161 in the total evaluation highlight their efficiency in minimizing prediction errors. In contrast, LightGBM and AdaBoost exhibited higher errors in all total phases yet maintained a competitive stance with MAE scores like 0.416 for LightGBM and closely matched RMSE scores such as 0.605 for AdaBoost in the same phase. This analysis suggests a clear performance hierarchy: GBRT XGBoost > LightGBM > AdaBoost , underscored across metrics like R2, RMSE, and MAE, and different evaluation stages (Training, Testing, All). GBRT and XGBoost’s near-perfect accuracy rates suggest a potential overfitting to the training data, but their strong testing phase performance indicates a good generalization ability. In his study, ref. [51] emphasized that to avoid the problem of overfitting, the difference in R2 between the training and testing phases should be less than 0.05, a criterion that was met by the GBRT and XGBoost models. Figure 7 visually represents the precision of each developed model across the overall phase, showcasing their effectiveness through R2 and RMSE metrics and distinctly emphasizing the superior forecasting accuracy of the GBRT and XGBoost models.

5.2. Cross-Plot

In these scatter plots, model-predicted data points are plotted against actual experimental data along a diagonal line representing a one-to-one prediction ratio, often referred to as the 45-degree line, originating from the plot’s axis intersection. The precision and validity of the models are indicated by how closely the data points align with this diagonal line. The aggregation of data points near this line signifies a higher accuracy of the model. As demonstrated in Figure 8, a graphical analysis using these plots was conducted to evaluate the trustworthiness of the model predictions made in this research. The scatter plots from Figure 8a–d reveal that all four models, which were formulated to predict the splitting tensile strength, are reliable and accurate, as demonstrated by the strong correlation between the predicted and actual values. A closer examination of Figure 8a,b reveals that the XGBoost and GBRT models are particularly effective at predicting splitting tensile strength, outperforming the other models. Similarly, Figure 8c,d indicates that the AdaBoost model has a comparable level of accuracy to the LightGBM model, showcasing its suitable performance.

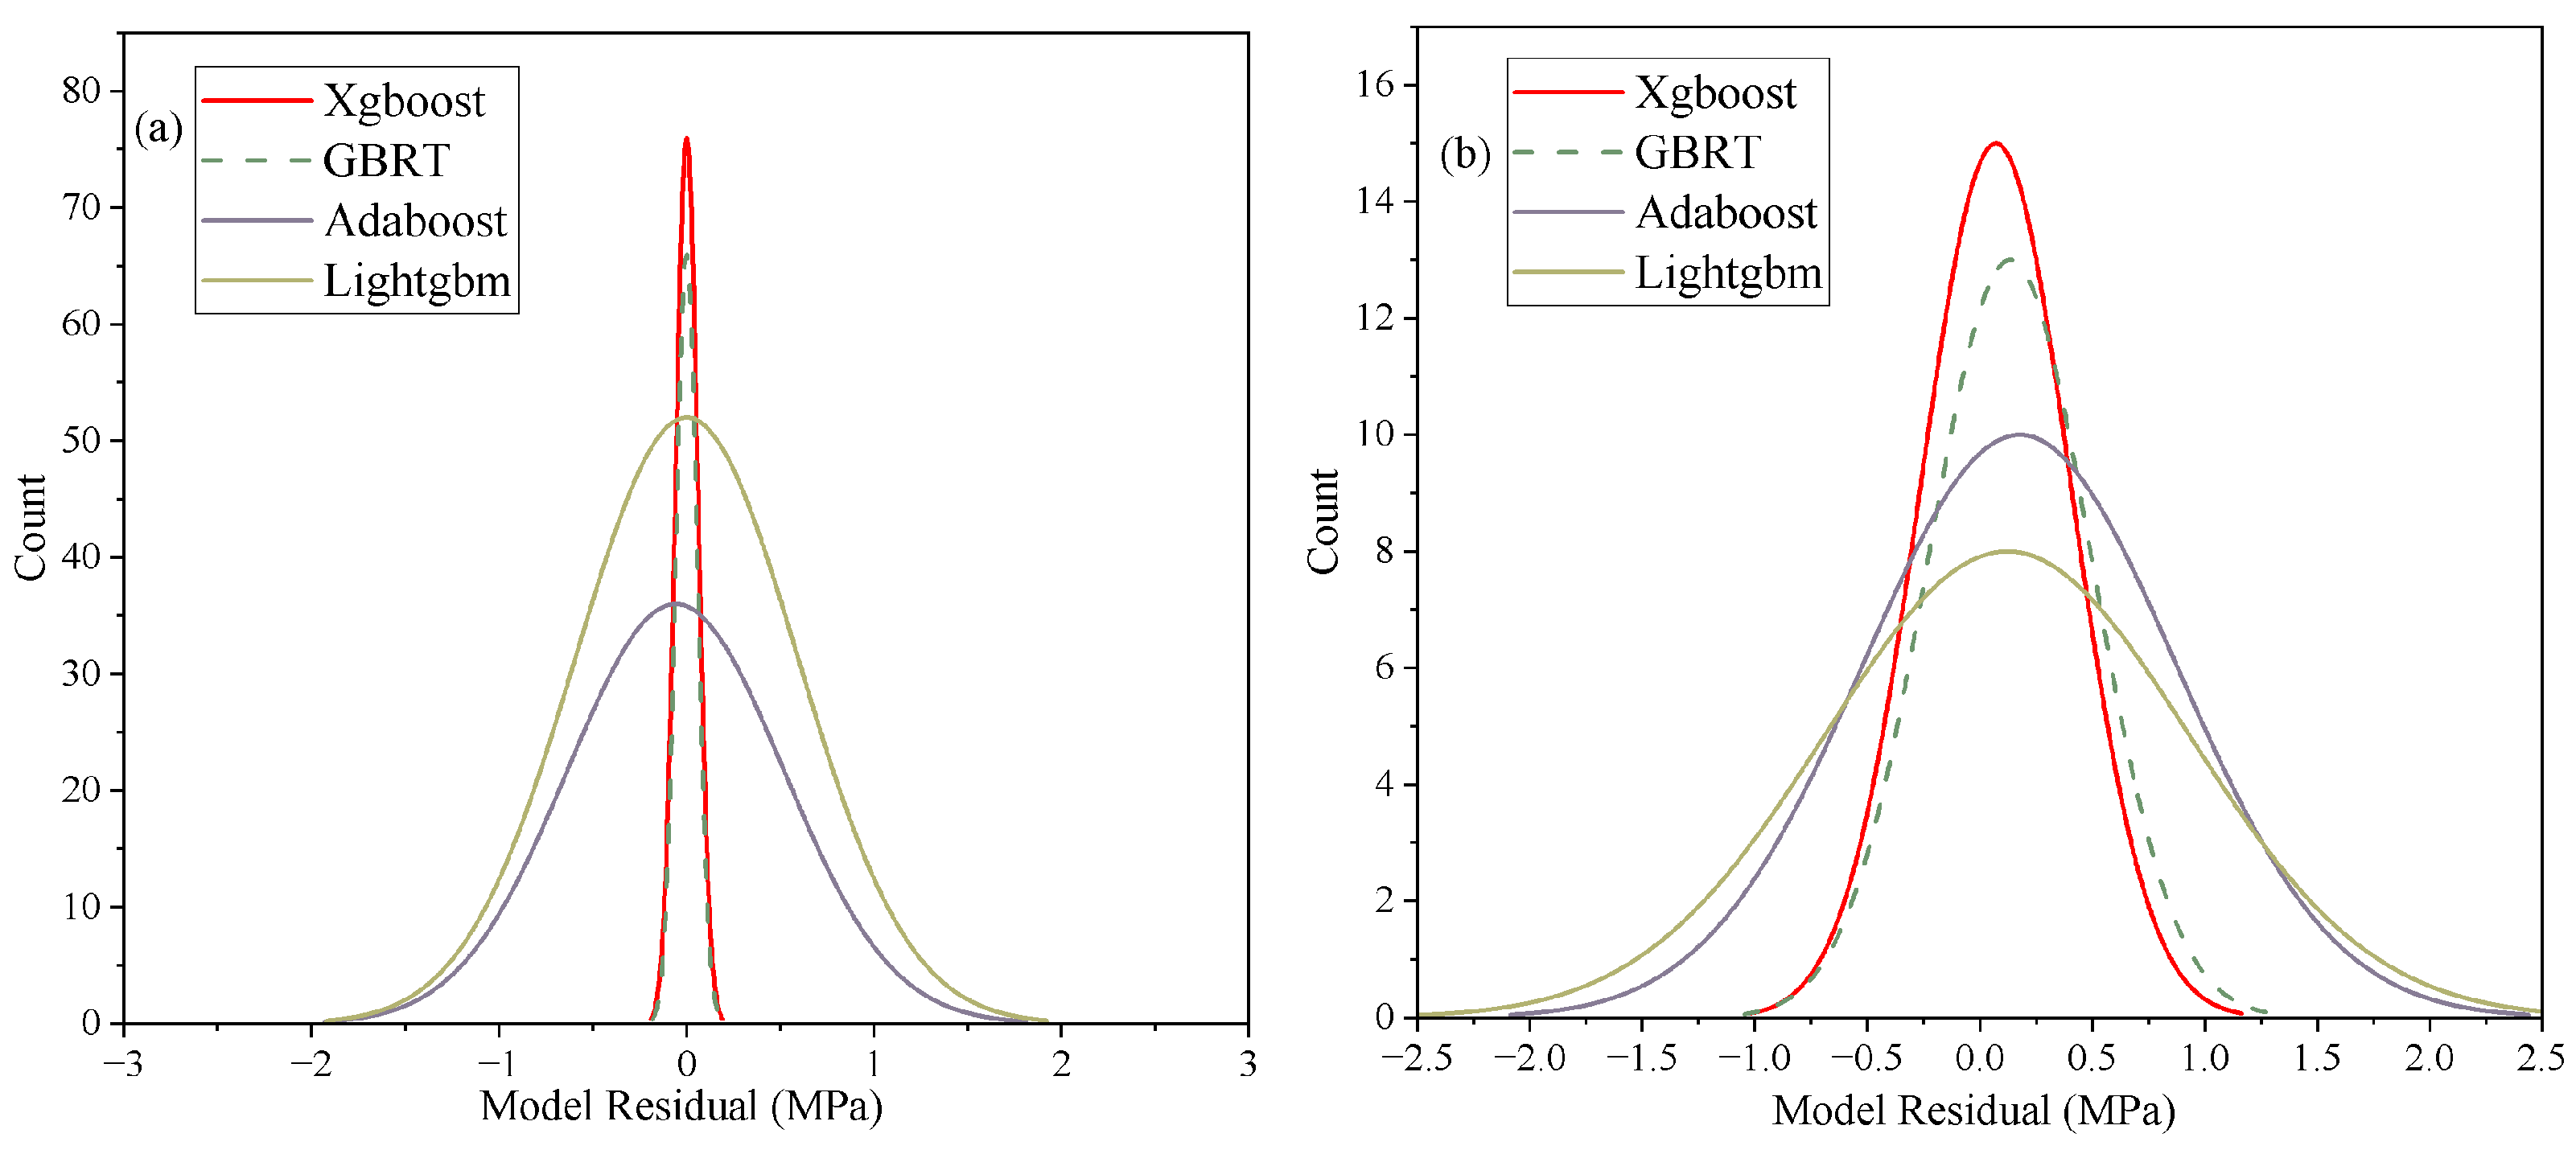
5.3. Histogram of Model Residual Distribution

The histogram analysis (Figure 9) comparing the residual distributions of four distinct ML models—XGBoost, GBRT, AdaBoost, and LightGBM—highlights several key findings pertinent to their application. XGBoost and GBRT demonstrate superior fit to the training data, as demonstrated by residuals densely packed around zero, signifying high accuracy and robust model fit. In comparison, AdaBoost and LightGBM show reasonable performance with slightly broader residual distributions, indicating a marginally weaker fit. When considering generalization capability, as inferred from test dataset performance, XGBoost and GBRT maintain good precision, highlighting its excellent adaptability and accurate prediction of new, unseen data. This contrasts with the other models, whose wider spread in residuals may signal a decline in predictive performance on the test dataset, raising concerns about their generalizability. Overall, the analysis suggests XGBoost and GBRT as optimal models for the application at hand, given their tight residual distribution and consistent performance across both training and test datasets, affirming their capability to balance training data fit with generalization to new data effectively. In contrast, AdaBoost and LightGBM exhibit slightly broader residual distributions. The wider residual distributions imply that the predictions made by these models are more variable, leading to a higher likelihood of errors.

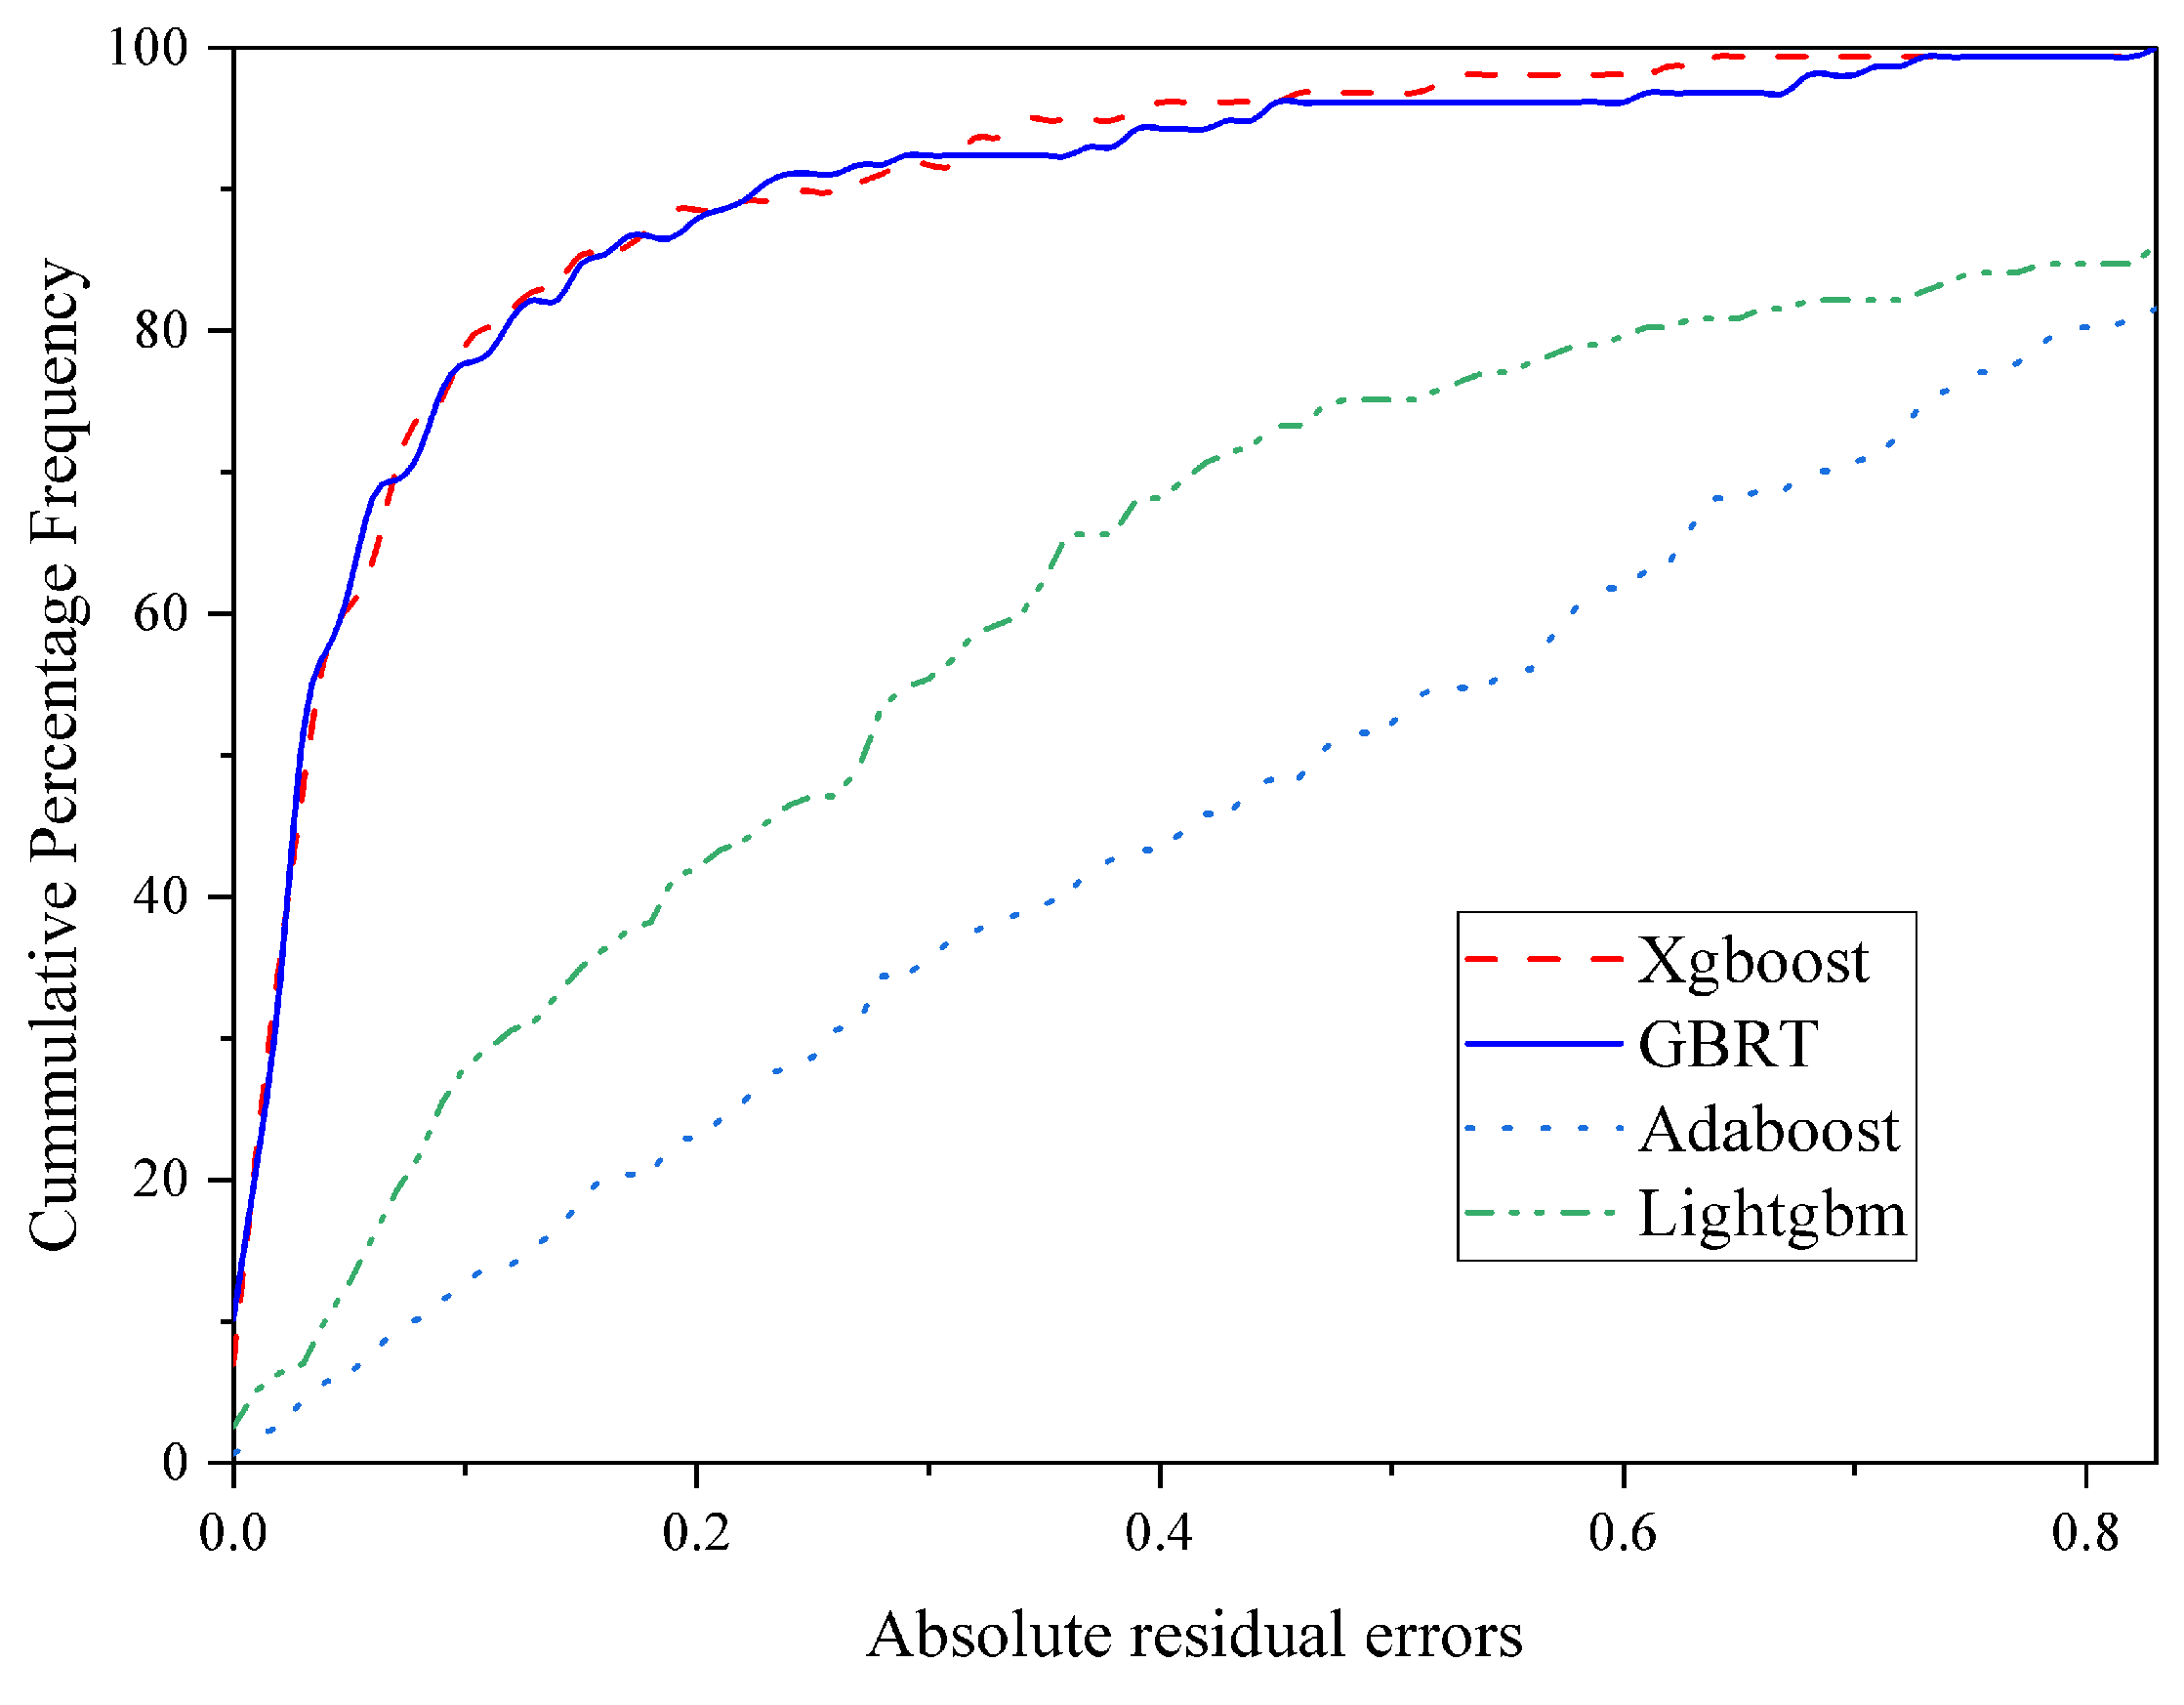
5.4. Cumulative Frequency Plot
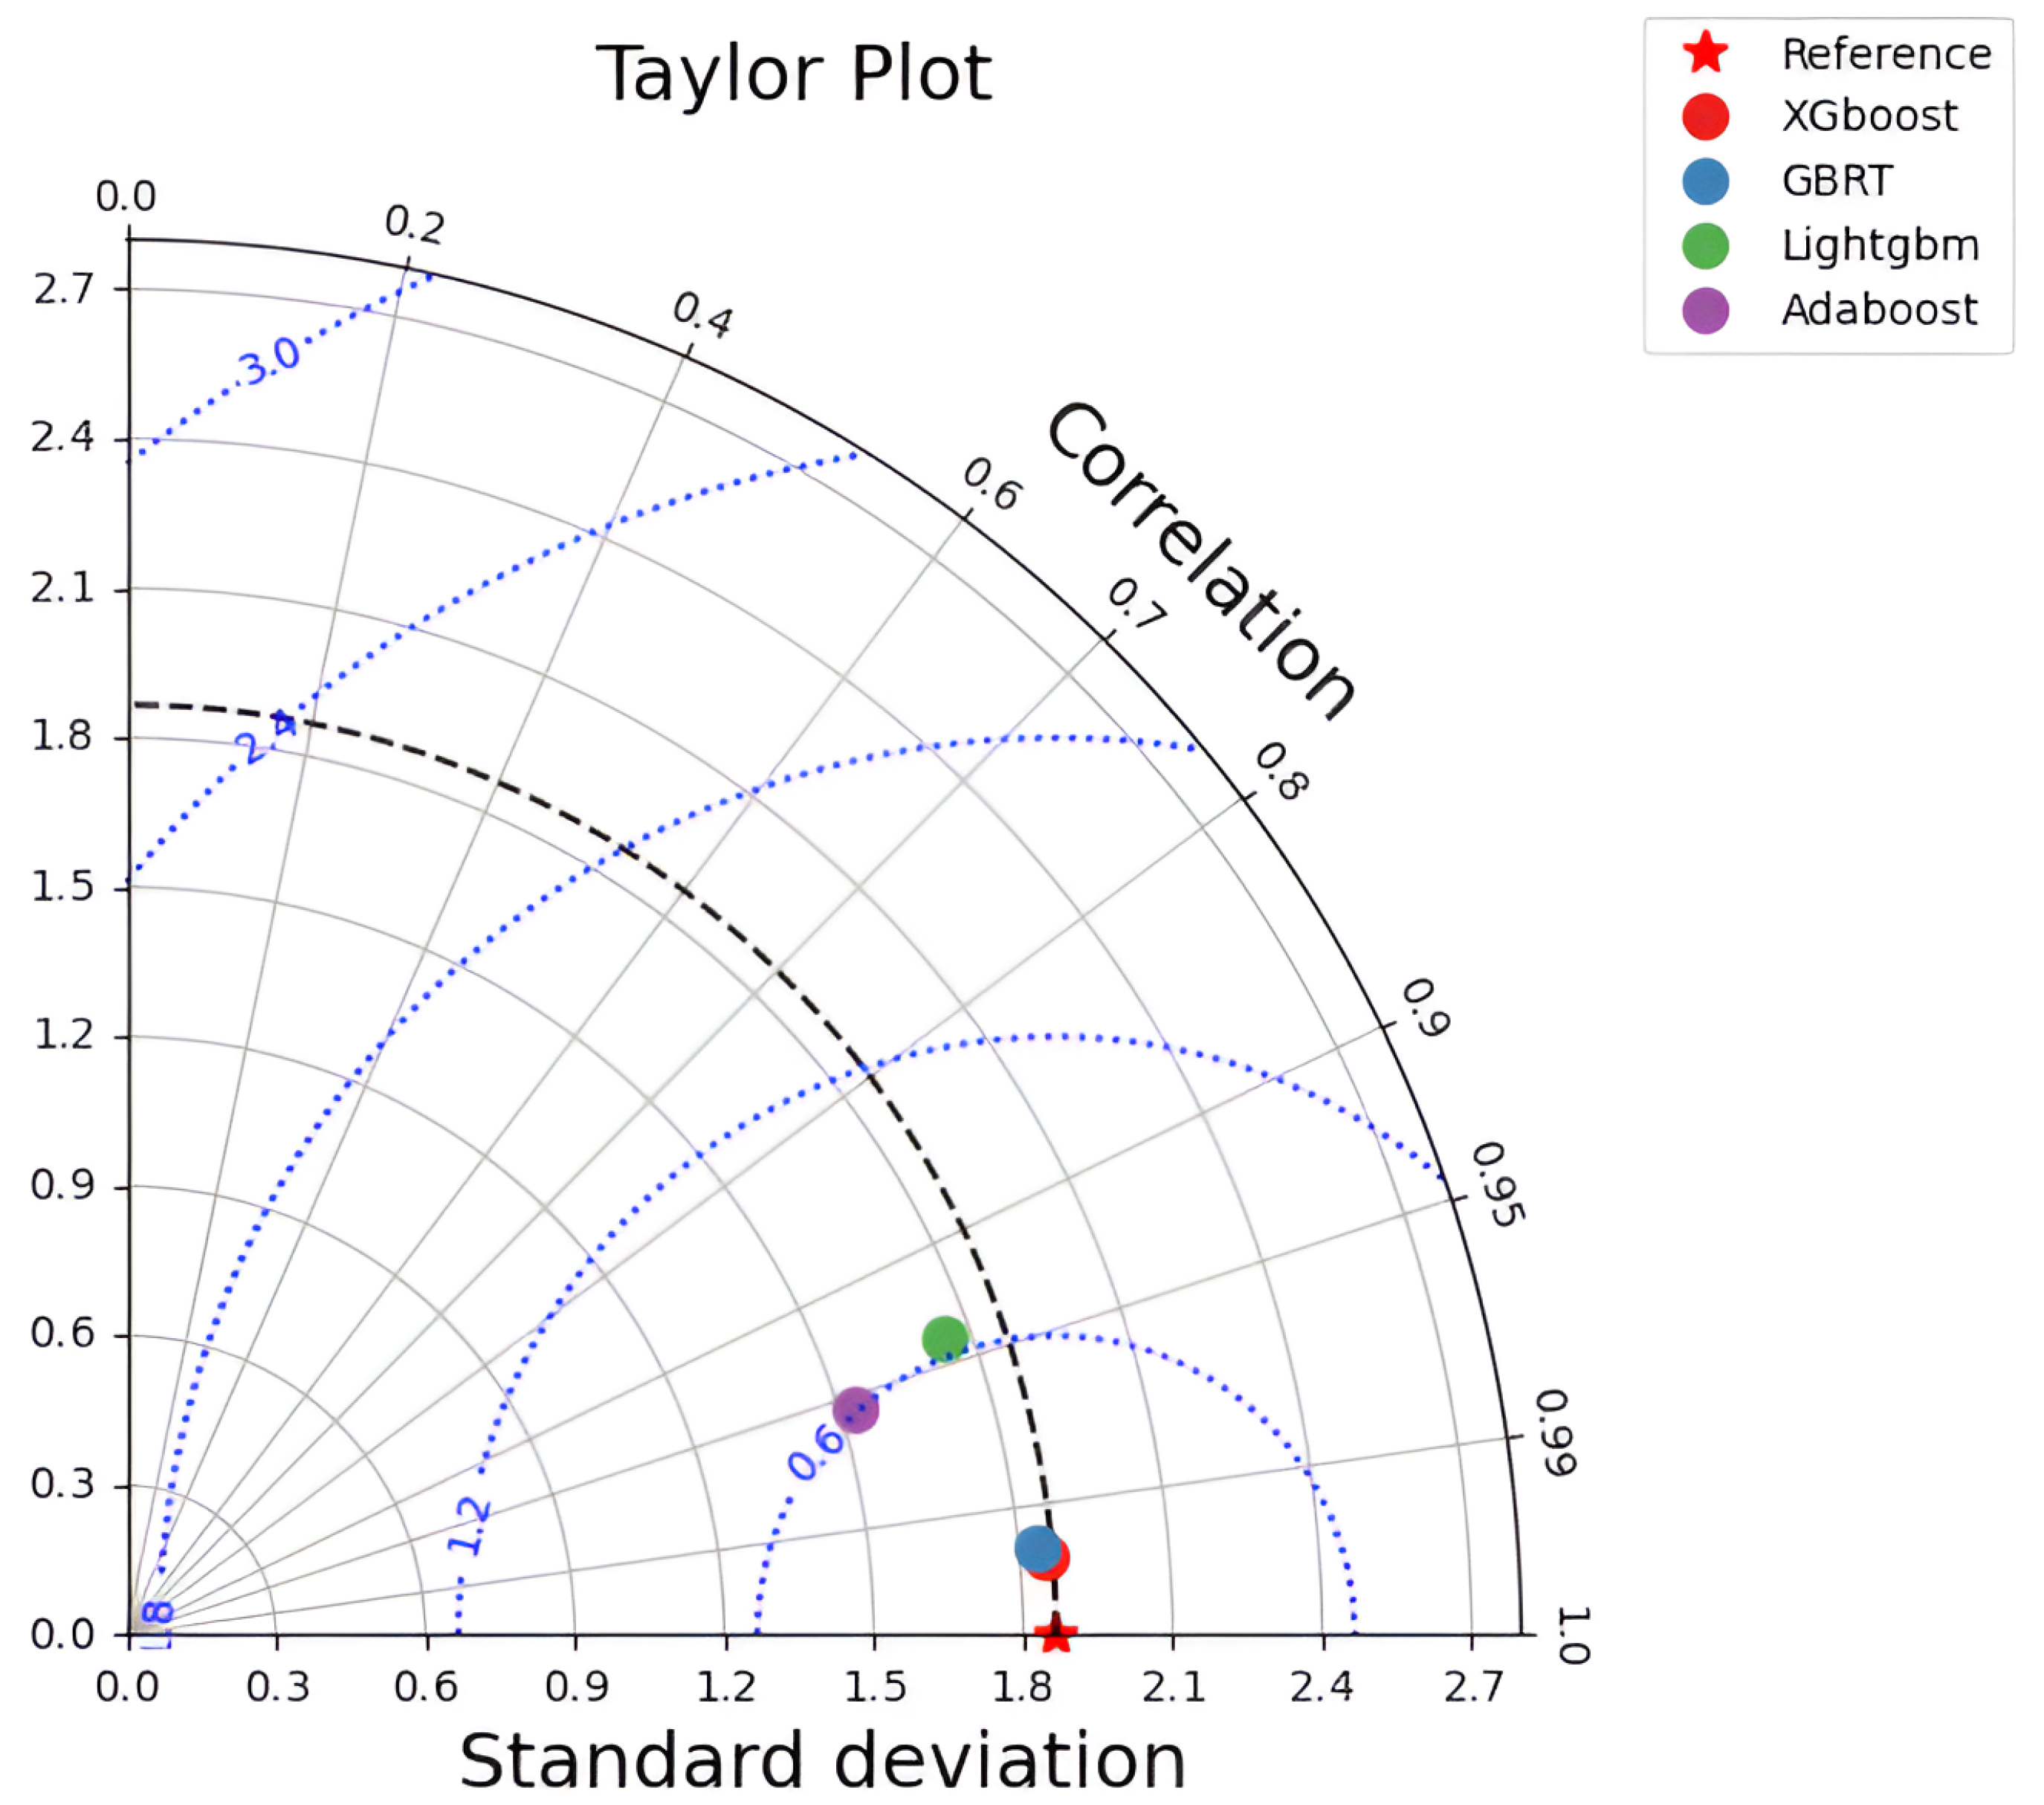
Figure 10 shows the relationship between absolute errors and the percentage of cumulative frequency in all the models introduced in this study. It is apparent that a minimal percentage of predictions made by the LightGBM model are within the minimal absolute error margin of 0 to 0.2. The graph shows that more than 90% of the predictions from the XGBoost and GBRT models have an absolute error close to 0.2. Moreover, the trajectory of these models reaches a cumulative frequency percentage of 100, representing the entirety of data points, more quickly than its counterparts, indicating that a considerable number of predictions by those models maintain an absolute error below 0.8. Consequently, the illustration suggests a superior predictive capability of the GBRT and XGBoost models compared to the others featured in this analysis.

5.5. Taylor Diagram

Figure 11 illustrates a widely used method for comparing multiple models through a two-dimensional graphic, which incorporates three statistical metrics: SD, RMSE, and R. In the Taylor diagram, each model is denoted by a distinctively colored dot. A “star symbol” located on the x-axis represents the statistical values associated with the experimental data (SD = 1.87, RMSE = 0, and R = 1). The proximity of each model to this reference point indicates its performance. The blue arcs in the diagram represent the lines of constant RMSE radiating from the reference point. Constant SD lines are shown as black arcs originating from the center of the diagram and intersecting the axes, while black lines extending from the center depict lines of constant R values. The positioning of a model relative to the reference point suggests its effectiveness, with the LightGBM and XGBoost models identified as the least and most effective, respectively, in predicting the splitting tensile strength.

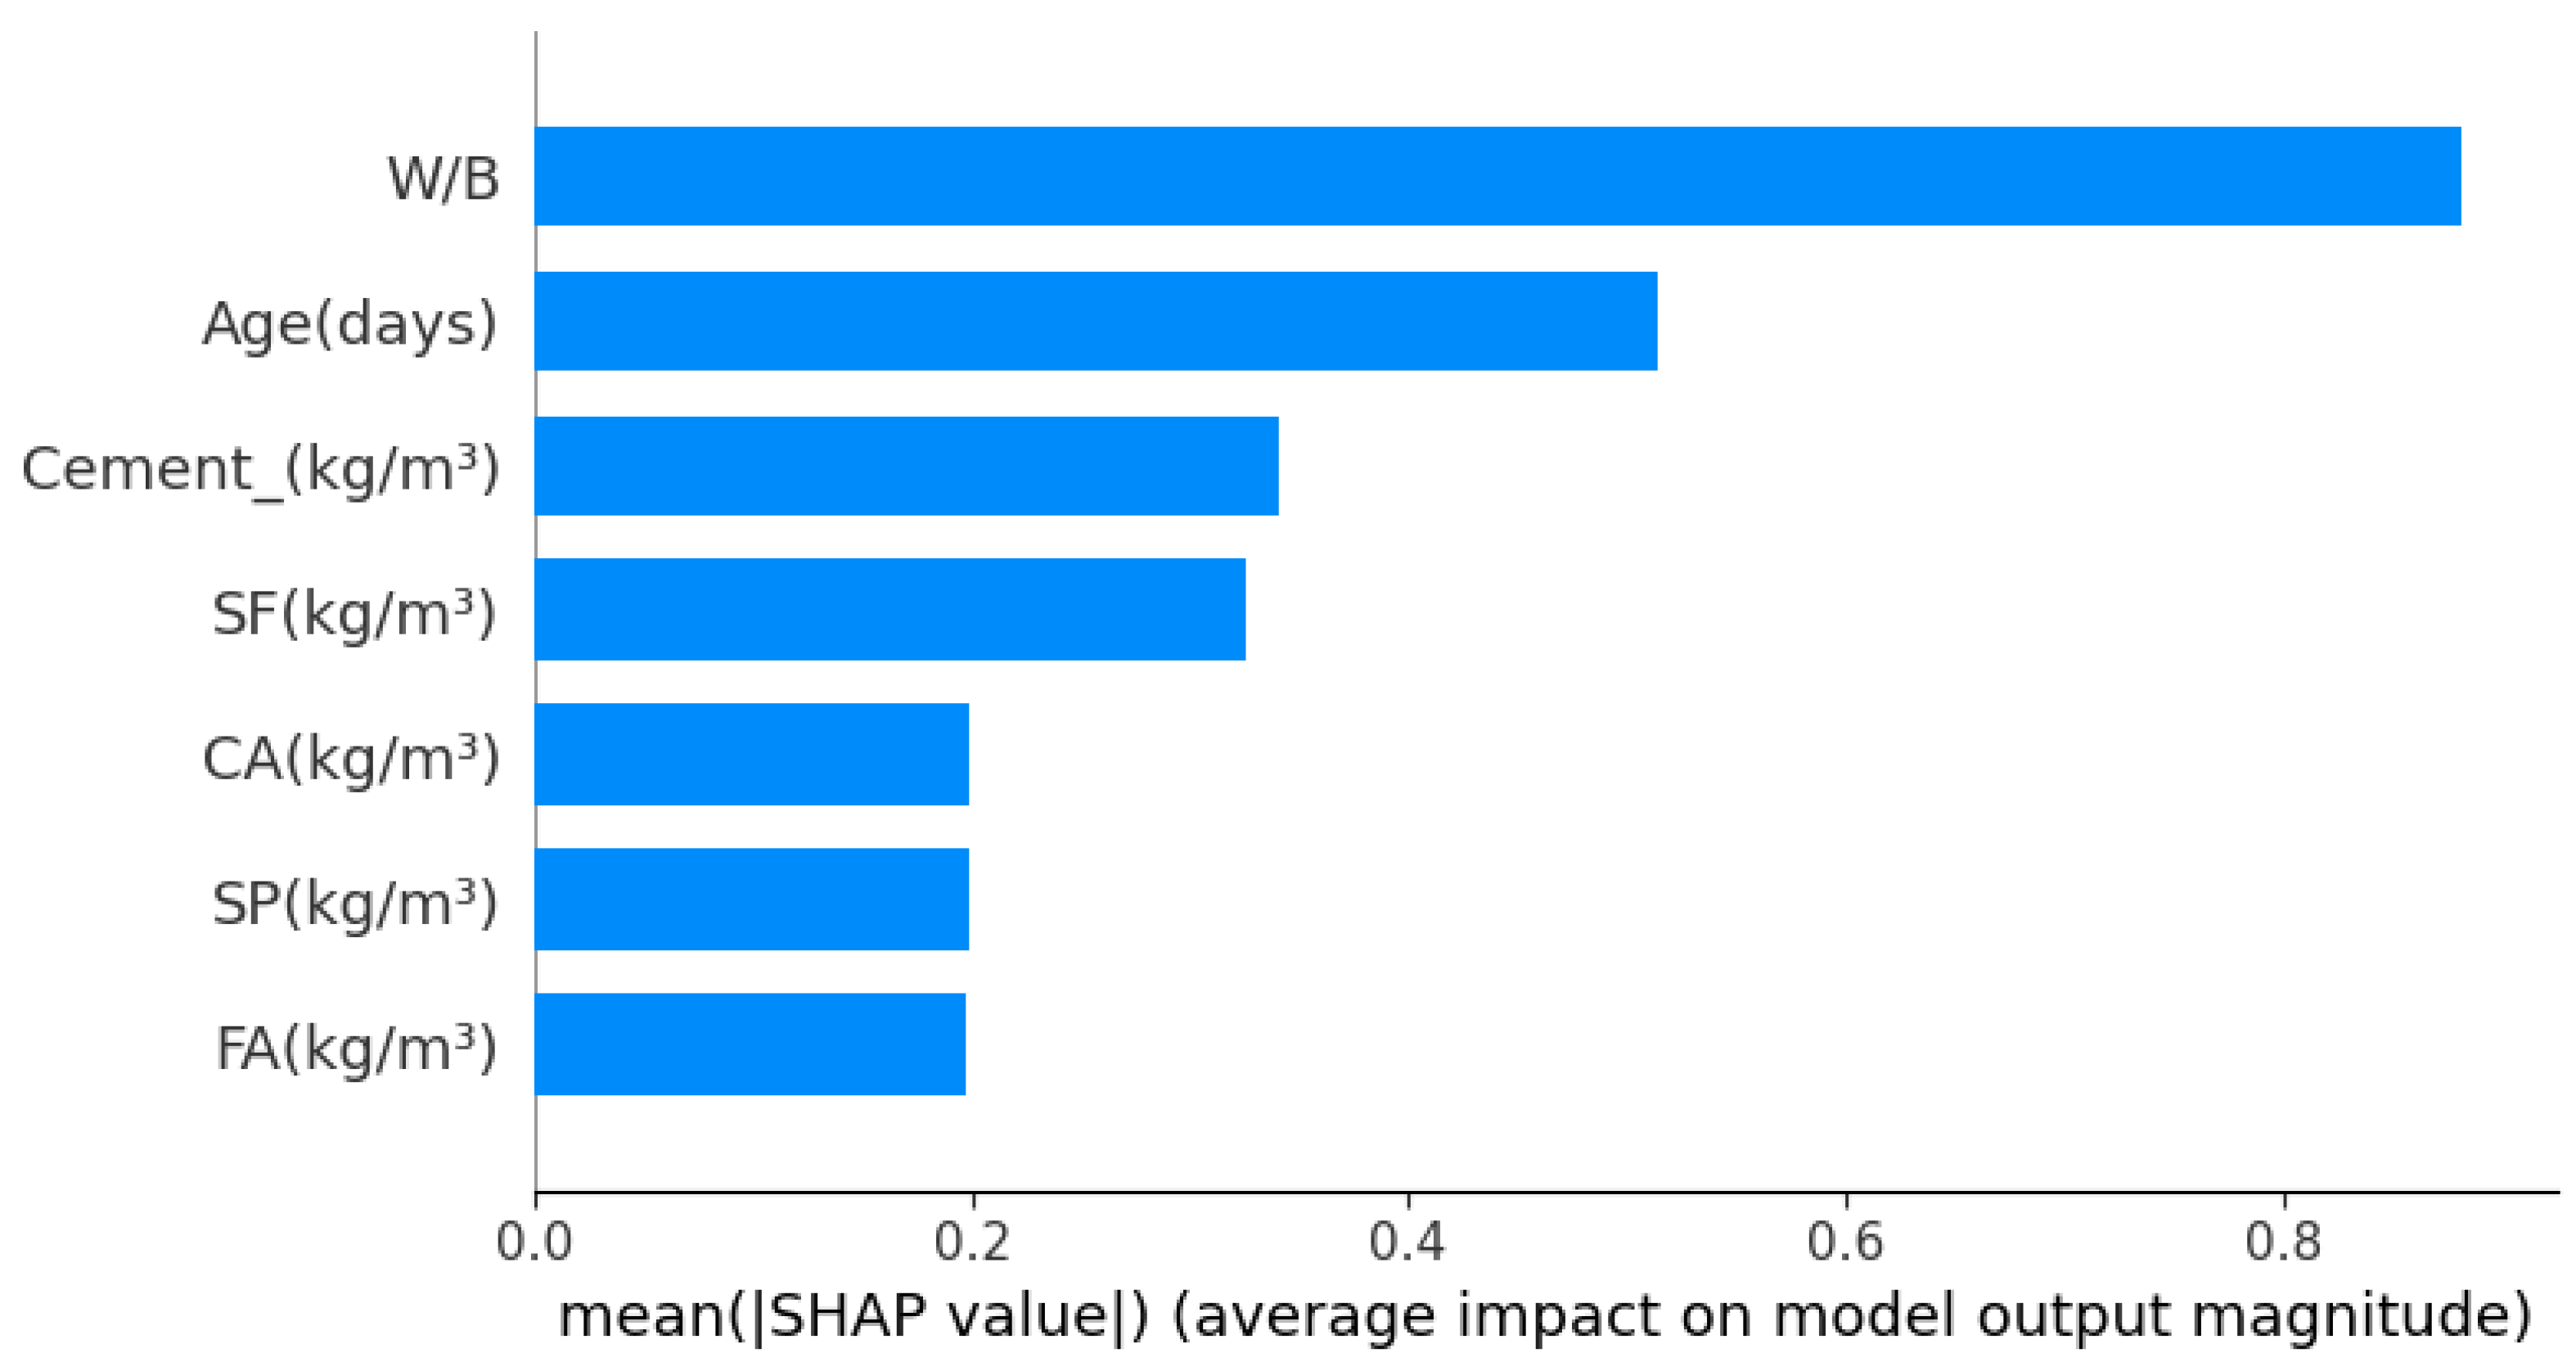
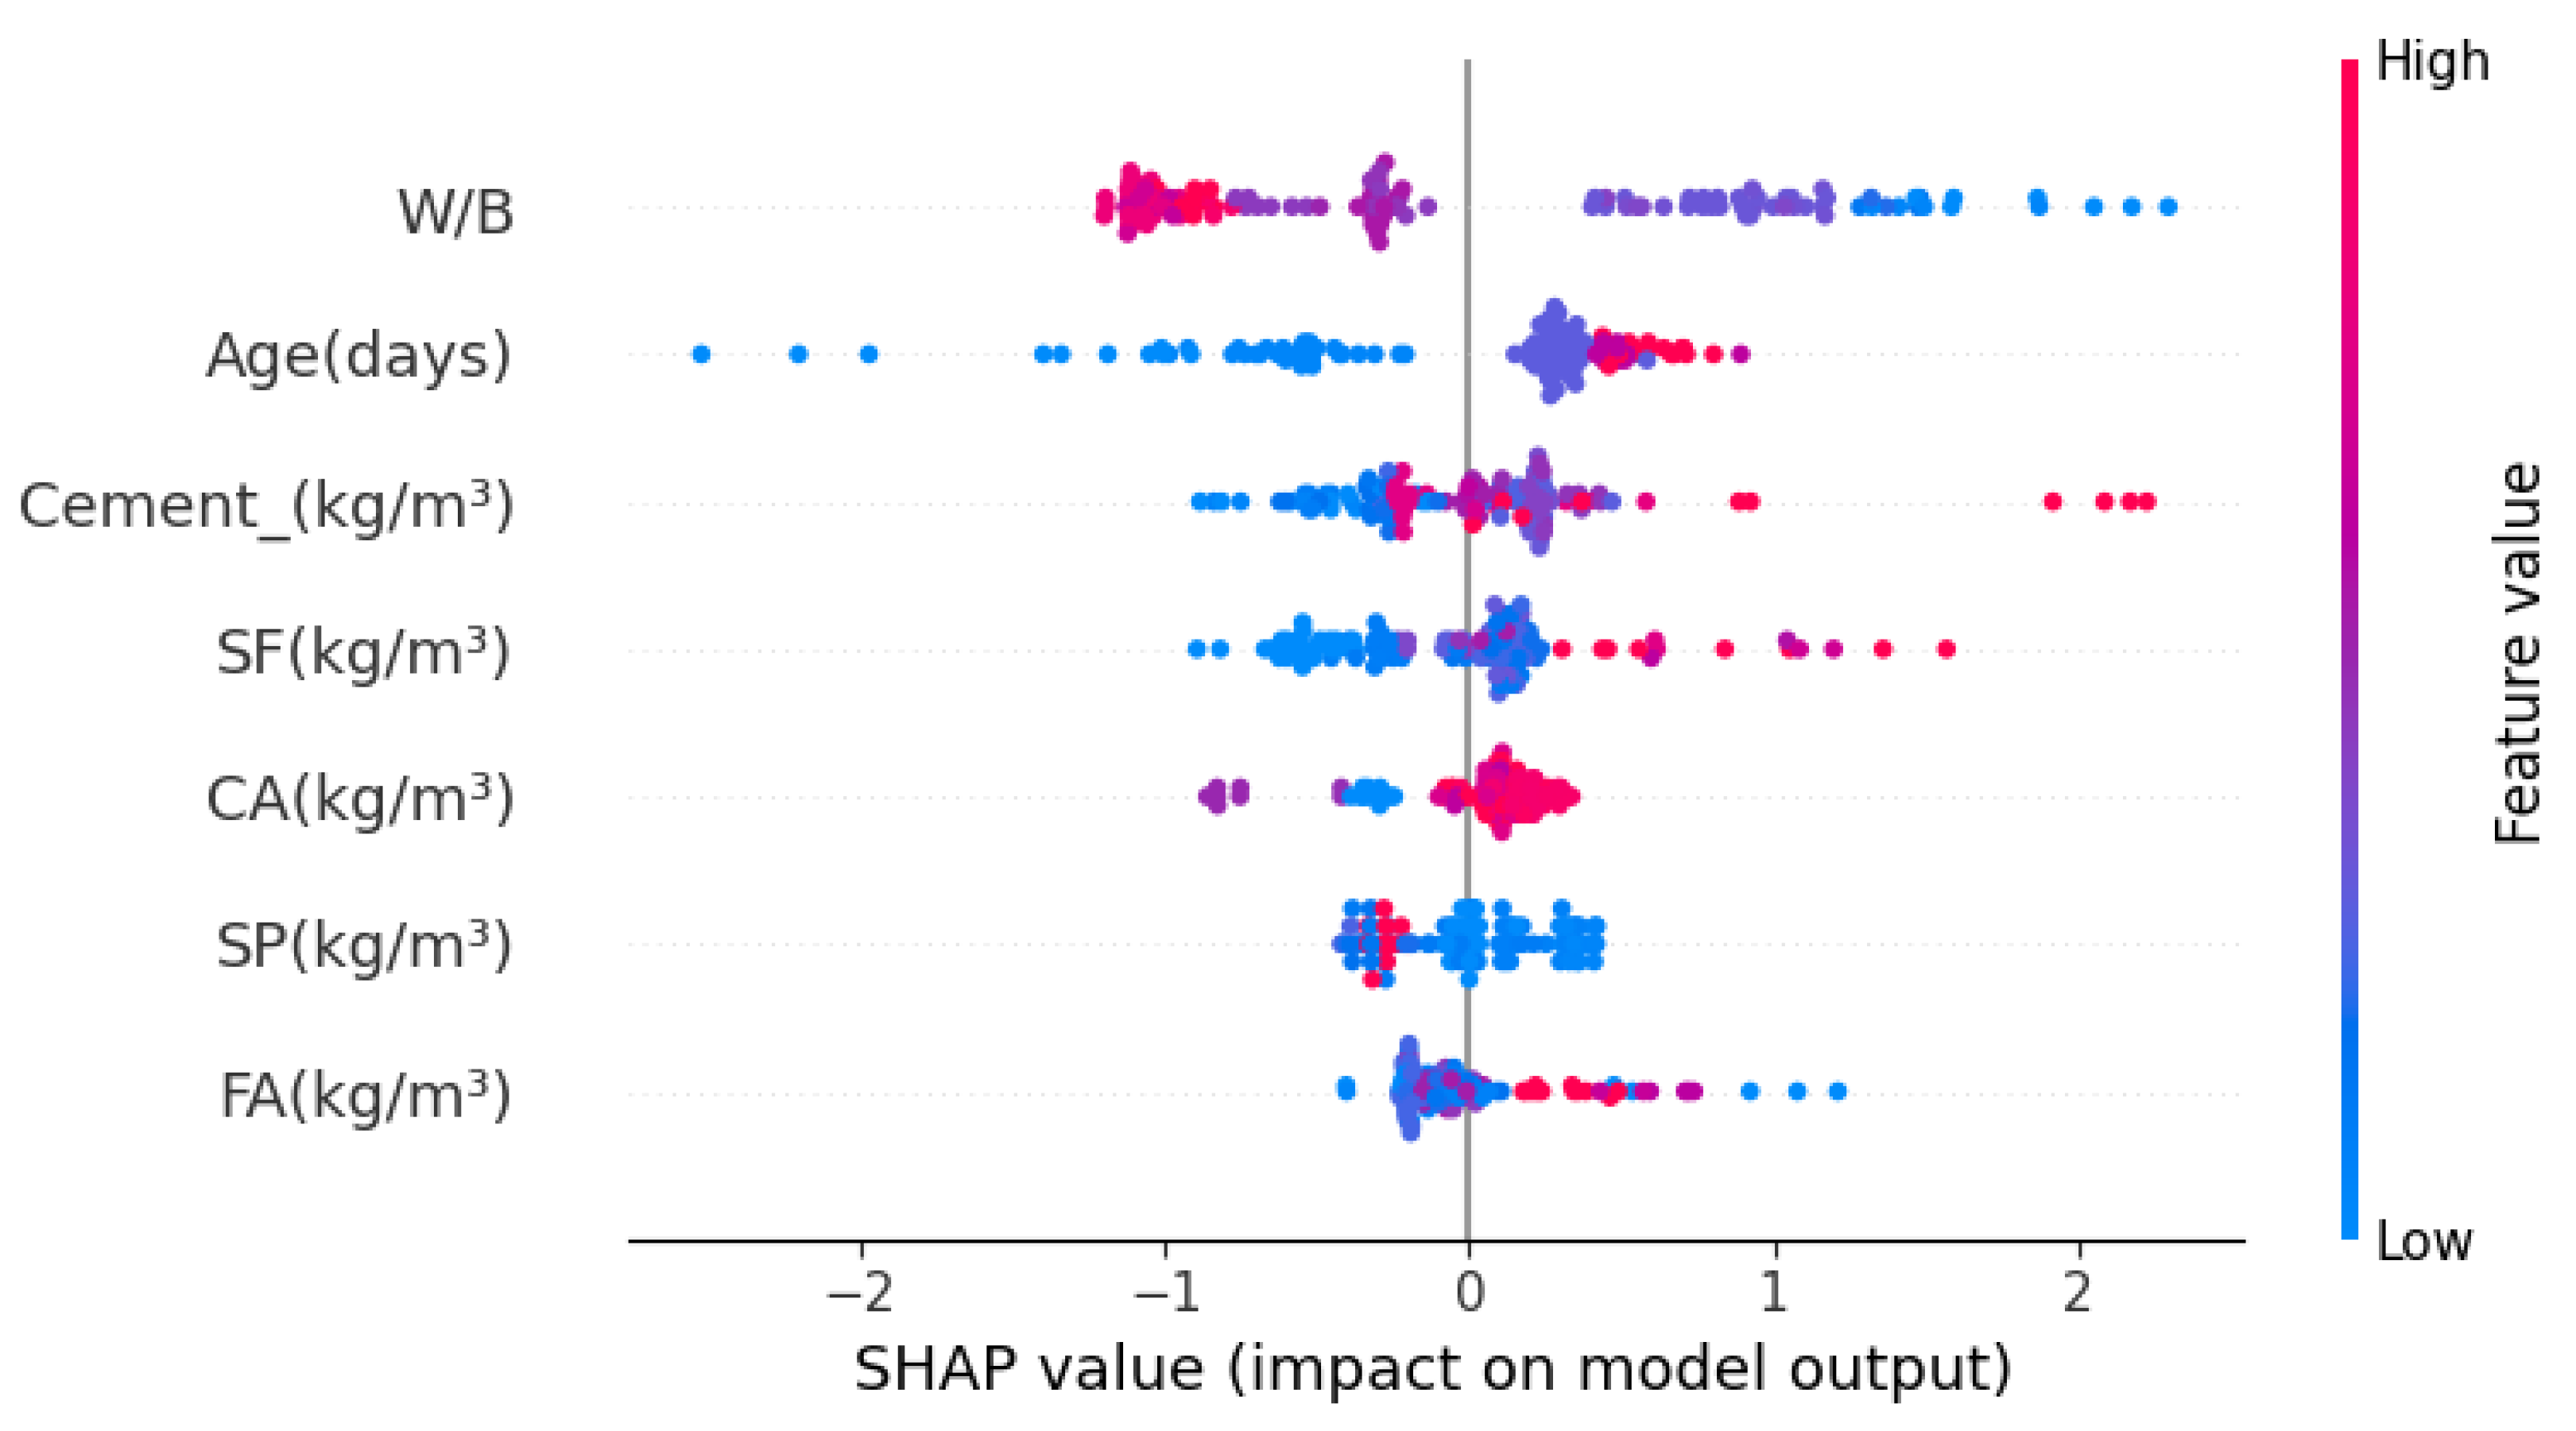
5.6. Feature Importance Analysis

The best model for predicting the splitting tensile strength, the XGBoost model, has been identified. It is useful to know how much each input contributes to the splitting tensile strength to help optimize the mix ratios of SF concrete, thus enhancing the concrete’s tensile strength. This research adopts the SHapley Additive exPlanations (SHAP) approach to thoroughly examine the significance of features. Utilizing calculations of SHAP values, this method offers a detailed assessment of how each feature influences the model’s outcome. The SHAP approach accounts for the cooperative dynamics among features, methodically determining the SHAP value for each one, therefore precisely evaluating their effect on specific forecasts and breaking down their contributions. Equation (11) outlines the calculation procedure for SHAP:
ϕ i = S N { i } | S | ! ( | N | | S | 1 ) ! | N | ! f ( S { i } ) f ( S )
Let N be the set of all features, and S a subset of N that excludes a specific feature i. The cardinality of S, | S | , represents the number of features in S, while | N | denotes the total number of features. The function f ( S ) gives the prediction model’s output with only S’s features. Similarly, f ( S { i } ) provides the output when i is included in S. The SHAP value, ϕ i , quantifies the average contribution of i across all combinations of features. In the SHAP summary plot (Figure 12), W/B and Age are shown as the most significant variables in predicting the splitting tensile strength of concrete, with substantial impact as indicated by their SHAP values. The performance of other variables—Cement, SF (SF), Coarse Aggregate (CA), Superplasticizer (SP), and Fine Aggregate (FA)—is also depicted, ranked by their influence on the model’s output.
Figure 13 displays the positive and negative effects of various components on splitting tensile strength. Accordingly, features such as Age, cement, SF, fine aggregate, and coarse aggregate contribute positively to tensile strength. In contrast, the W/B ratio and superplasticizer negatively impact tensile strength. These results are consistent with the findings presented in existing studies [13,27].

5.7. Comparative Analysis of the XGBoost Model

Earlier studies have utilized ML techniques to forecast the splitting tensile strength of SF concrete. This current research contrasts the outcomes of the XGBoost method with the Multilayer perceptron neural networks (MLPNN), adaptive neural fuzzy detection systems (ANFIS), and genetic programming are all used (GEP) by [13]. The XGBoost approach demonstrated superior accuracy in predicting the tensile strength of SF concrete, surpassing the MLPNN, ANFIS, and GEP models with an impressive R2 score of 0.993, as shown in Table 4.
The superior performance of XGBoost in predicting tensile strength may be due to its robustness against noisy data and anomalies. XGBoost is engineered to focus on correctly classifying difficult instances, therefore reducing its susceptibility to the effects of outliers and noise-laden data points. Relative to MLPNN and ANFIS models, XGBoost is likely to be more resilient to overfitting in the context of noisy datasets. Moreover, XGBoost can capture complicated nonlinear relationships between predictors and responses by combining many simple models, a feature that MLPNN and ANFIS models may not possess to the same degree in all scenarios. Furthermore, it operates with greater computational efficiency than MLPNN and ANFIS models, which often require more complex architectures and protracted training time. This computational thriftiness may make XGBoost a permissible choice for resource-limited applications as well. A contributing factor may also come from the different sets of input variables employed, which may help to explain why XGBoost outperforms MLPNN and ANFIS models. The ability of XGBoost to manage noisy datasets and model complex nonlinear interactions, combined with its computational expediency, establishes it as a powerful tool for predicting tensile strength.

6. Recommendations for Future Research

The dataset is a crucial component in the development of machine-learning models. One of the study’s limitations is the small number of data samples available for constructing the ensemble models. As a result, the models developed in this study are only applicable within the specific range of input parameters provided. Naturally, increasing the number of data samples would help expand the range of input parameters, ultimately leading to the development of a more reliable and robust model. Also, this study suggests several areas for model refinement and optimization. While grid search was employed in this study to fine-tune the hyperparameters of the models, future research could explore alternative and potentially more efficient techniques for hyperparameter optimization, such as Bayesian optimization. The application of these advanced machine-learning models in predicting concrete properties could provide significant benefits to the construction industry by enabling more accurate and efficient material selection, therefore reducing costs and enhancing structural safety. Additionally, it could contribute to the concrete market by facilitating the development of high-performance concrete mixes that are optimized for specific applications.

7. Conclusions

The conclusion synthesizes the outcomes of a detailed investigation into the efficacy of various machine-learning models—namely Gradient Boosting Regression Trees (GBRT), Extreme Gradient Boosting (XGBoost), LightGBM, and AdaBoost—for predicting the splitting tensile strength of SF concrete. It distills the comprehensive analysis into key findings:
  • The XGBoost and GBRT models demonstrated superior predictive accuracy for SF concrete, with R2 values over 0.955 during testing and low RMSE and MAE values across all phases. They outperformed LightGBM and AdaBoost, with tighter residual distributions and closer alignment to actual data, establishing a clear hierarchy in model performance. Despite being slightly behind in predictive accuracy, LightGBM and AdaBoost still exhibited robust performance, with R2 scores of 0.799 and 0.845 during testing, showcasing their effectiveness in specific scenarios.
  • The XGBoost model outperformed previous models like MLPNN, ANFIS, and GEP in predicting SF concrete tensile strength, achieving a superior R2 score of 0.993. This improved accuracy is due to XGBoost’s resilience to noisy data, its ability to capture complex nonlinear relationships, and its computational efficiency.
  • The feature importance analysis using SHAP values revealed that the water-to-binder ratio (W/B) and the age of the concrete were the most significant factors influencing the splitting tensile strength.
The findings of this research underscore the effectiveness of ensemble models in accurately predicting the splitting tensile strength of SF concrete, offering valuable insights for optimizing concrete mix designs. The superior performance of these models, particularly in comparison to those used in previous studies, highlights the potential for further advancements in the application of machine-learning techniques in civil engineering.

Author Contributions

Conceptualization, N.M.A.-A. and M.A.T.; methodology, M.E.S.; software, H.I.; validation, K.A.O. and M.A.T.; formal analysis, K.F. and M.A.T.; investigation, N.M.A.-A.; resources, K.A.O.; data curation, M.E.S.; writing—original draft preparation, N.M.A.-A.; writing—review and editing, M.A.T., K.A.O. and K.F.; visualization, H.I.; supervision, K.F. and K.A.O.; project administration, H.I.; funding acquisition, K.A.O. All authors have read and agreed to the published version of the manuscript.

Funding

The APC was funded by Cracow University of Science and Technology.

Data Availability Statement

The original contributions presented in the study are included in the article, further inquiries can be directed to the corresponding authors.

Conflicts of Interest

The authors declare no conflicts of interest.

References

  1. Singh, R.P.; Vanapalli, K.R.; Cheela, V.R.S.; Peddireddy, S.R.; Sharma, H.B.; Mohanty, B. Fly ash, GGBS, and silica fume based geopolymer concrete with recycled aggregates: Properties and environmental impacts. Constr. Build. Mater. 2023, 378, 131168. [Google Scholar] [CrossRef]
  2. Qureshi, L.A.; Ali, B.; Ali, A. Combined effects of supplementary cementitious materials (silica fume, GGBS, fly ash and rice husk ash) and steel fiber on the hardened properties of recycled aggregate concrete. Constr. Build. Mater. 2020, 263, 120636. [Google Scholar] [CrossRef]
  3. Siddique, R. Utilization of silica fume in concrete: Review of hardened properties. Resour. Conserv. Recycl. 2011, 55, 923–932. [Google Scholar] [CrossRef]
  4. Shelote, K.M.; Bala, A.; Gupta, S. An overview of mechanical, permeability, and thermal properties of silica fume concrete using bibliographic survey and building information modelling. Constr. Build. Mater. 2023, 385, 131489. [Google Scholar] [CrossRef]
  5. Menéndez, E.; Sanjuán, M.Á.; Recino, H. Study of Microstructure, Crystallographic Phases and Setting Time Evolution over Time of Portland Cement, Coarse Silica Fume, and Limestone (PC-SF-LS) Ternary Portland Cements. Crystals 2023, 13, 1289. [Google Scholar] [CrossRef]
  6. Wang, Y.S.; Cho, H.K.; Wang, X.Y. Mixture optimization of sustainable concrete with silica fume considering CO2 emissions and cost. Buildings 2022, 12, 1580. [Google Scholar] [CrossRef]
  7. Biswas, R.K.; Iwanami, M.; Chijiwa, N.; Uno, K. Effect of non-uniform rebar corrosion on structural performance of RC structures: A numerical and experimental investigation. Constr. Build. Mater. 2020, 230, 116908. [Google Scholar] [CrossRef]
  8. Bai, S.; Li, M.; Kong, R.; Han, S.; Li, H.; Qin, L. Data mining approach to construction productivity prediction for cutter suction dredgers. Autom. Constr. 2019, 105, 102833. [Google Scholar] [CrossRef]
  9. Ayhan, B.U.; Tokdemir, O.B. Safety assessment in megaprojects using artificial intelligence. Saf. Sci. 2019, 118, 273–287. [Google Scholar] [CrossRef]
  10. Tang, Y.; Wang, Y.; Wu, D.; Liu, Z.; Zhang, H.; Zhu, M.; Chen, Z.; Sun, J.; Wang, X. An experimental investigation and machine learning-based prediction for seismic performance of steel tubular column filled with recycled aggregate concrete. Rev. Adv. Mater. Sci. 2022, 61, 849–872. [Google Scholar] [CrossRef]
  11. Nafees, A.; Amin, M.N.; Khan, K.; Nazir, K.; Ali, M.; Javed, M.F.; Aslam, F.; Musarat, M.A.; Vatin, N.I. Modeling of mechanical properties of silica fume-based green concrete using machine learning techniques. Polymers 2021, 14, 30. [Google Scholar] [CrossRef]
  12. Tanyildizi, H.; Şengür, A.; Akbulut, Y.; Şahin, M. Deep learning model for estimating the mechanical properties of concrete containing silica fume exposed to high temperatures. Front. Struct. Civ. Eng. 2020, 14, 1316–1330. [Google Scholar] [CrossRef]
  13. Nafees, A.; Javed, M.F.; Khan, S.; Nazir, K.; Farooq, F.; Aslam, F.; Musarat, M.A.; Vatin, N.I. Predictive modeling of mechanical properties of silica fume-based green concrete using artificial intelligence approaches: MLPNN, ANFIS, and GEP. Materials 2021, 14, 7531. [Google Scholar] [CrossRef]
  14. Zhang, J.; Huang, Y.; Ma, G.; Nener, B. Mixture optimization for environmental, economical and mechanical objectives in silica fume concrete: A novel frame-work based on machine learning and a new meta-heuristic algorithm. Resour. Conserv. Recycl. 2021, 167, 105395. [Google Scholar] [CrossRef]
  15. Al-Saraireh, M.A. Predicting compressive strength of concrete with fly ash, metakaolin and silica fume by using machine learning techniques. Lat. Am. J. Solids Struct. 2022, 19, e454. [Google Scholar] [CrossRef]
  16. Tiwari, N.; Rondinella, F.; Satyam, N.; Baldo, N. Experimental and Machine Learning Approach to Investigate the Mechanical Performance of Asphalt Mixtures with Silica Fume Filler. Appl. Sci. 2023, 13, 6664. [Google Scholar] [CrossRef]
  17. Zaman, A.; Alyami, M.; Shah, S.; Rehman, M.F.; Hakeem, I.Y.; Farooq, F. Forecasting the strength of micro/nano silica in cementitious matrix by machine learning approaches. Mater. Today Commun. 2023, 37, 107066. [Google Scholar] [CrossRef]
  18. Zhao, W.; Feng, S.; Liu, J.; Sun, B. An explainable intelligent algorithm for the multiple performance prediction of cement-based grouting materials. Constr. Build. Mater. 2023, 366, 130146. [Google Scholar] [CrossRef]
  19. Qin, X.; Kaewunruen, S. Eco-friendly design and sustainability assessments of fibre-reinforced high-strength concrete structures automated by data-driven machine learning models. Sustainability 2023, 15, 6640. [Google Scholar] [CrossRef]
  20. Pak, H.; Paal, S.G. Evaluation of transfer learning models for predicting the lateral strength of reinforced concrete columns. Eng. Struct. 2022, 266, 114579. [Google Scholar] [CrossRef]
  21. Kumar, P.; Batchu, S.; Kota, S.R. Real-time concrete damage detection using deep learning for high rise structures. IEEE Access 2021, 9, 112312–112331. [Google Scholar] [CrossRef]
  22. Maherian, M.F.; Baran, S.; Bicakci, S.N.; Toreyin, B.U.; Atahan, H.N. Machine learning-based compressive strength estimation in nano silica-modified concrete. Constr. Build. Mater. 2023, 408, 133684. [Google Scholar] [CrossRef]
  23. Shariati, M.; Armaghani, D.J.; Khandelwal, M.; Zhou, J.; Khorami, M. Assessment of longstanding effects of fly ash and silica fume on the compressive strength of concrete using extreme learning machine and artificial neural network. J. Adv. Eng. Comput. 2021, 5, 50–74. [Google Scholar] [CrossRef]
  24. Nagaraju, T.V.; Mantena, S.; Azab, M.; Alisha, S.S.; El Hachem, C.; Adamu, M.; Murthy, P.S.R. Prediction of high strength ternary blended concrete containing different silica proportions using machine learning approaches. Results Eng. 2023, 17, 100973. [Google Scholar] [CrossRef]
  25. Annlin Jebitha, D.; Ramesh Kannan, M. Numerical Optimization of Mix Proportioning of Self-Compacting Concrete with Silica Fume—A Machine Learning Perspective. In Sustainable Construction Materials: Select Proceedings of ACMM 2021; Springer: Singapore, 2021; pp. 461–468. [Google Scholar]
  26. Babajanzadeh, M.; Azizifar, V. Compressive strength prediction of self-compacting concrete incorporating silica fume using artificial intelligence methods. Civ. Eng. J. 2018, 4, 1542. [Google Scholar]
  27. Shah, H.A.; Nehdi, M.L.; Khan, M.I.; Akmal, U.; Alabduljabbar, H.; Mohamed, A.; Sheraz, M. Predicting Compressive and Splitting Tensile Strengths of Silica Fume Concrete Using M5P Model Tree Algorithm. Materials 2022, 15, 5436. [Google Scholar] [CrossRef]
  28. Topçu, İ.B.; Sarıdemir, M. Prediction of mechanical properties of recycled aggregate concretes containing silica fume using artificial neural networks and fuzzy logic. Comput. Mater. Sci. 2008, 42, 74–82. [Google Scholar] [CrossRef]
  29. Polikar, R. Ensemble learning. Ensemble Mach. Learn. Methods Appl. 2012, 1–34. [Google Scholar]
  30. Feng, D.C.; Cetiner, B.; Azadi Kakavand, M.R.; Taciroglu, E. Data-driven approach to predict the plastic hinge length of reinforced concrete columns and its application. J. Struct. Eng. 2021, 147, 04020332. [Google Scholar] [CrossRef]
  31. Naser, M. Observational analysis of fire-induced spalling of concrete through ensemble machine learning and surrogate modeling. J. Mater. Civ. Eng. 2021, 33, 04020428. [Google Scholar] [CrossRef]
  32. Soleimani, F. Analytical seismic performance and sensitivity evaluation of bridges based on random decision forest framework. Structures 2021, 32, 329–341. [Google Scholar] [CrossRef]
  33. Kang, M.C.; Yoo, D.Y.; Gupta, R. Machine learning-based prediction for compressive and flexural strengths of steel fiber-reinforced concrete. Constr. Build. Mater. 2021, 266, 121117. [Google Scholar] [CrossRef]
  34. Freund, Y.; Schapire, R.E. A decision-theoretic generalization of on-line learning and an application to boosting. J. Comput. Syst. Sci. 1997, 55, 119–139. [Google Scholar] [CrossRef]
  35. Misra, S.; Li, H.; He, J. Machine Learning for Subsurface Characterization; Gulf Professional Publishing: Houston, TX, USA, 2019. [Google Scholar]
  36. Ying, C.; Qi-Guang, M.; Jia-Chen, L.; Lin, G. Advance and prospects of AdaBoost algorithm. Acta Autom. Sin. 2013, 39, 745–758. [Google Scholar]
  37. Natekin, A.; Knoll, A. Gradient boosting machines, a tutorial. Front. Neurorobot. 2013, 7, 21. [Google Scholar] [CrossRef]
  38. Wen, L.; Li, Y.; Zhao, W.; Cao, W.; Zhang, H. Predicting the deformation behaviour of concrete face rockfill dams by combining support vector machine and AdaBoost ensemble algorithm. Comput. Geotech. 2023, 161, 105611. [Google Scholar] [CrossRef]
  39. Chen, Y.; Jia, Z.; Mercola, D.; Xie, X. A gradient boosting algorithm for survival analysis via direct optimization of concordance index. Comput. Math. Methods Med. 2013, 2013, 873595. [Google Scholar] [CrossRef] [PubMed]
  40. Friedman, J.H. Stochastic gradient boosting. Comput. Stat. Data Anal. 2002, 38, 367–378. [Google Scholar] [CrossRef]
  41. Liang, M.; Chang, Z.; Wan, Z.; Gan, Y.; Schlangen, E.; Šavija, B. Interpretable Ensemble-Machine-Learning models for predicting creep behavior of concrete. Cem. Concr. Compos. 2022, 125, 104295. [Google Scholar] [CrossRef]
  42. Lin, P.; Ding, F.; Hu, G.; Li, C.; Xiao, Y.; Tse, K.T.; Kwok, K.; Kareem, A. Machine learning-enabled estimation of crosswind load effect on tall buildings. J. Wind Eng. Ind. Aerodyn. 2022, 220, 104860. [Google Scholar] [CrossRef]
  43. Chen, T.; Guestrin, C. Xgboost: A scalable tree boosting system. In Proceedings of the 22nd Acm Sigkdd International Conference on Knowledge Discovery and Data Mining, San Francisco, CA, USA, 13–17 August 2016; pp. 785–794. [Google Scholar]
  44. Moayedi, H.; Kalantar, B.; Foong, L.K.; Tien Bui, D.; Motevalli, A. Application of three metaheuristic techniques in simulation of concrete slump. Appl. Sci. 2019, 9, 4340. [Google Scholar] [CrossRef]
  45. Liu, K.; Zou, C.; Zhang, X.; Yan, J. Innovative prediction models for the frost durability of recycled aggregate concrete using soft computing methods. J. Build. Eng. 2021, 34, 101822. [Google Scholar] [CrossRef]
  46. Tien Bui, D.; Abdullahi, M.M.; Ghareh, S.; Moayedi, H.; Nguyen, H. Fine-tuning of neural computing using whale optimization algorithm for predicting compressive strength of concrete. Eng. Comput. 2021, 37, 701–712. [Google Scholar] [CrossRef]
  47. Alhakeem, Z.M.; Jebur, Y.M.; Henedy, S.N.; Imran, H.; Bernardo, L.F.; Hussein, H.M. Prediction of ecofriendly concrete compressive strength using gradient boosting regression tree combined with GridSearchCV hyperparameter-optimization techniques. Materials 2022, 15, 7432. [Google Scholar] [CrossRef]
  48. Wakjira, T.G.; Kutty, A.A.; Alam, M.S. A novel framework for developing environmentally sustainable and cost-effective ultra-high-performance concrete (UHPC) using advanced machine learning and multi-objective optimization techniques. Constr. Build. Mater. 2024, 416, 135114. [Google Scholar] [CrossRef]
  49. Kuang, F.; Long, Z.; Kuang, D.; Liu, X.; Guo, R. Application of back propagation neural network to the modeling of slump and compressive strength of composite geopolymers. Comput. Mater. Sci. 2022, 206, 111241. [Google Scholar] [CrossRef]
  50. Peng, Y.; Unluer, C. Analyzing the mechanical performance of fly ash-based geopolymer concrete with different machine learning techniques. Constr. Build. Mater. 2022, 316, 125785. [Google Scholar] [CrossRef]
  51. Zhang, K.; Zhang, K.; Bao, R.; Liu, X. A framework for predicting the carbonation depth of concrete incorporating fly ash based on a least squares support vector machine and metaheuristic algorithms. J. Build. Eng. 2023, 65, 105772. [Google Scholar] [CrossRef]
Figure 1. Research methodology.
Buildings 14 04054 g001
Figure 2. Structure of Adaboost.
Buildings 14 04054 g002
Figure 3. Structure of Gradient boosting procedure.
Buildings 14 04054 g003
Figure 4. Grid search cv methodology [48].
Buildings 14 04054 g004
Figure 5. Box Plot Distribution of Mix design components and the Tensile Strength of SF Concrete.
Buildings 14 04054 g005
Figure 6. Heat map between predictors and target variables.
Buildings 14 04054 g006
Figure 7. The visual comparison of RMSE and R2 metrics across various suggested models.
Buildings 14 04054 g007
Figure 8. Comparative scatter plots for predictive models of splitting tensile.
Buildings 14 04054 g008
Figure 9. Error Distribution Histograms for Predicted Splitting tensile by Different Models: (a) Training; (b) Testing.
Buildings 14 04054 g009
Figure 10. Cumulative frequency error comparison of intelligent models used in research.
Buildings 14 04054 g010
Figure 11. Taylor Diagram Representation for Model Predictions of splitting tensile strength.
Buildings 14 04054 g011
Figure 12. Overview of the impact of each feature on splitting tensile strength.
Buildings 14 04054 g012
Figure 13. Negative and positive impact of the features on splitting tensile strength.
Buildings 14 04054 g013
Table 1. Hyperparameters of Different Models.
ModelLearning RateMax DepthNumber of Estimators
GBRT3.06000.01
AdaboostNaN500.50
XGBoost3.05000.01
LightGBMNaN6000.20
Table 2. Statistical Summary of Input Predictors for SF Concrete and Its Tensile Strength.
PredictorCement (kg/m3)SF (kg/m3)W/BFA (kg/m3)CA (kg/m3)SP (kg/m3)Age (Days)Tensile Strength (MPa)
Minimum197.000.000.14535.000.000.001.000.51
Maximum800.00250.000.831315.001248.0080.0091.0010.00
Average458.1354.170.38815.96893.7913.1632.084.23
Table 3. Statistical metrics for LightGBM, GBRT, XGBoost, and AdaBoost models.
PhaseCriteriaLightGBMGBRTXGBoostAdaBoost
TrainingR20.8970.9990.9990.902
RMSE0.5890.0570.0590.576
MAE0.3570.0410.0430.483
TestingR20.7990.9550.9650.845
RMSE0.8070.3810.3370.707
MAE0.6450.3010.2670.575
AllR20.8830.9910.9930.890
RMSE0.6390.1790.1610.605
MAE0.4160.0940.0890.502
Table 4. Comparison of Statistical Metrics for Models.
Statistical ParameterThis Study
(XGBoost)
Nafees et al. [13]
(MLPNN)
Nafees et al. [13]
(ANFIS)
Nafees et al. [13]
(GEP)
R20.9930.900.920.93
RMSE0.160.510.400.31
MAE0.0890.410.260.31
Disclaimer/Publisher’s Note: The statements, opinions and data contained in all publications are solely those of the individual author(s) and contributor(s) and not of MDPI and/or the editor(s). MDPI and/or the editor(s) disclaim responsibility for any injury to people or property resulting from any ideas, methods, instructions or products referred to in the content.

