Article

A Unified Deflection Theory Model for Multi-Tower Self-Anchored Suspension Bridges with Different Tower–Girder and Cable–Girder Connections

1
China Construction Third Bureau First Engineering Co., Ltd., Wuhan 430040, China
2
School of Civil Engineering and Architecture, Wuhan University of Technology, Wuhan 430070, China
3
School of Civil Engineering & Hydraulic, Huazhong University of Science & Technology, Wuhan 430074, China
*
Author to whom correspondence should be addressed.
Buildings 2024, 14(12), 3945; https://doi.org/10.3390/buildings14123945
Submission received: 30 October 2024 / Revised: 3 December 2024 / Accepted: 9 December 2024 / Published: 11 December 2024

Abstract

This study presents a unified analytical model for multi-tower self-anchored suspension bridges integrating tower–girder connections (TGCs) and cable–girder connections (CGCs) within the framework of deflection theory. The connections are modeled as horizontal springs, and governing equations are derived based on force equilibrium and compatibility conditions. A comparison with a nonlinear finite element analysis under various live load scenarios confirms the accuracy of the proposed model. A parametric analysis reveals that increasing the CGC stiffness reduces girder deflection, decreasing the maximum vertical deflection by nearly 42.3% when the stiffness is increased from 0 to infinity and moving the maximum displacement from the mid-span section to the mid-tower section. Additionally, CGCs modify the load distribution between the main cable and the girder, limiting the longitudinal displacement of the tower in which the mid-tower displacement is reduced by 45.50%. Tower–girder connections improve the anchoring of the side cable to the tower. When connection stiffness is low, side- and middle-tower stiffness significantly reduce girder deflection, though this effect decreases with increasing stiffness. Enhancing mid-tower stiffness similarly reduces its longitudinal displacement regardless of the tower–girder connection. In longitudinal floating systems, mid-tower displacement rises with increasing side-tower stiffness. Establishing a unified analysis model reveals the key parameters in the structural analysis of suspension bridges, enabling an easier and faster analysis of multi-tower self-anchored suspension bridges.

1. Introduction

Self-anchored suspension bridges are increasingly recognized as a competitive solution for urban and soft-soil regions due to their combination of the esthetic appeal of traditional suspension bridges and the absence of large anchorages [1,2]. The adaptation of multi-tower configurations, initially explored in earth-anchored suspension bridges [3,4,5], has led to the successful implementation of several multi-tower self-anchored suspension bridges. Notable examples include the Luozhou Bridge [6], the Binhe Yellow River Bridge [7,8], and the Phoenix Yellow River Bridge [9], among others. However, self-anchored suspension bridges differ fundamentally from earth-anchored designs as they operate as self-balancing systems. A key distinction lies in the horizontal compressive force transmitted from the main cable to the girder, which does not occur in earth-anchored bridges. Additionally, the interactions between the tower, cable, and girder significantly influence the force distribution within the structure, thereby affecting its static and dynamic performance. Investigating these interdependencies is essential to further promote the application and optimization of multi-tower self-anchored suspension bridges.
Multi-tower suspension bridges have different issues than standard double-tower suspension bridges because of the mid-tower effect [10,11], which affects the structure’s stability and force distribution. The maximum deflection-to-span ratio and the saddle’s sliding resistance criteria under live loads must be met according to current studies and design guidelines [12]. Several design techniques have been put forth to lessen the mid-tower effect. To improve the mid-tower section’s lateral stiffness, for example, λ -shaped [13] and triangle tower [14] designs have been proposed. Chai et al. [15] suggested a double-cable system with different sag-to-span ratios to enhance performance in addition to geometric adjustments. Gimsing [16] and Collings [1] added more cables to the top of towers, which helped to further limit tower displacements. These structural changes, however, have the potential to greatly raise the complexity and expense of building. Frictional alterations have been investigated from the saddle design point of view to increase sliding resistance. Horizontal friction plates were proposed by Hasegawa et al. [17] as a means of stabilizing the main wire. To further improve structural stability, Zhang et al. [18,19] expanded on this idea by including vertical friction plates, which increase the frictional resistance between cables and saddles.
The tower–girder connection (TGC) and cable–girder connection (CGC) are important components in suspension bridge engineering that may be used to improve both static and dynamic performance and change the force transfer relationship between parts [16,20], as mentioned by Wang et al. and Gimsing and Georgakis. Many studies and better variants have evolved since the 1950s. The New Tacoma Bridge, as noted by Viola et al. [21], employed a stiff triangular truss to link the cable and girder. For example, Xu et al. [22] found that for the Siduhe Bridge, three pairs of flexible center buckles and stiff central buckles are recommended. Additionally, according to Gimsing and Georgakis [16], the Bisan Seto Bridge installed several slanted cables to limit the relative displacement between the main cable and the girder. Furthermore, Guo et al. [23] created a novel kind of CGC for a long-span suspension bridge that consists of a viscous damper and a brace that is constrained by buckling. In a similar vein, Gimsing and Georgakis reported that the April Bridge [16] directly linked the main cable to the top flange of the girder. Li et al. [24] used the influence lines technique to investigate the impact of the TGC and CGC on multi-tower suspension bridges. The mid-tower elastic cable, a kind of TGC, has been shown by Liang et al. [25] to improve the structural performance of multi-tower suspension bridges. Zhang et al. [4,26] conducted a comparative analysis and found that a multi-tower self-anchored suspension bridge with TGC performs better seismically than one using a longitudinal floating system (LFS). Additionally, Shao et al. [9] looked into the effects of CGC and TGC on multi-tower self-anchored suspension bridges’ dynamic properties.
In conclusion, earlier studies have shown that the use of tower–girder connections (TGC) and cable–girder connections (CGC) can enhance the structural performance of suspension bridges. Nonetheless, the majority of research uses the finite element technique (FEM) to examine how different connection shapes affect wind resistance and dynamic properties. Consequently, elucidating the mechanisms of the CGC and TGC is challenging and requires substantial modeling effort [13,27,28]. Given these drawbacks, various mathematical models for self-anchored suspension bridges have surfaced in recent years. For example, Chen et al. [29] created a static analytical technique based on the deflection theory for multi-tower self-anchored suspension bridges, where the stiffening girder is thought of as a continuous beam without longitudinal connections. An analytical model for three-tower self-anchored bridges was also presented by Liu et al. [30]. Longitudinal TGCs were included in the model, which they then used to investigate three-tower self-anchored suspension bridges’ dimensionless mid-tower rigidity [31]. Based on the deflection theory, we provide a unified analytical model in this paper for multi-tower suspension bridges with both TGCs and CGCs. The suggested model is used to investigate multi-tower suspension bridges’ static performances under live loads while taking different connection stiffness levels into account. This study’s following sections are arranged as follows: In Section 2, the analytical model that takes into account TGCs and CGCs is derived, and the resolution process is shown. In Section 3, the analytical model is validated against nonlinear FEM using a standard multi-tower self-anchored suspension bridge equipped with TGCs and CGCs. The impact of altering the TGC and CGC stiffness on the static response of multi-tower self-anchored suspension bridges is examined in Section 4 using the suggested model. Section 5 summarizes the primary findings of this study.

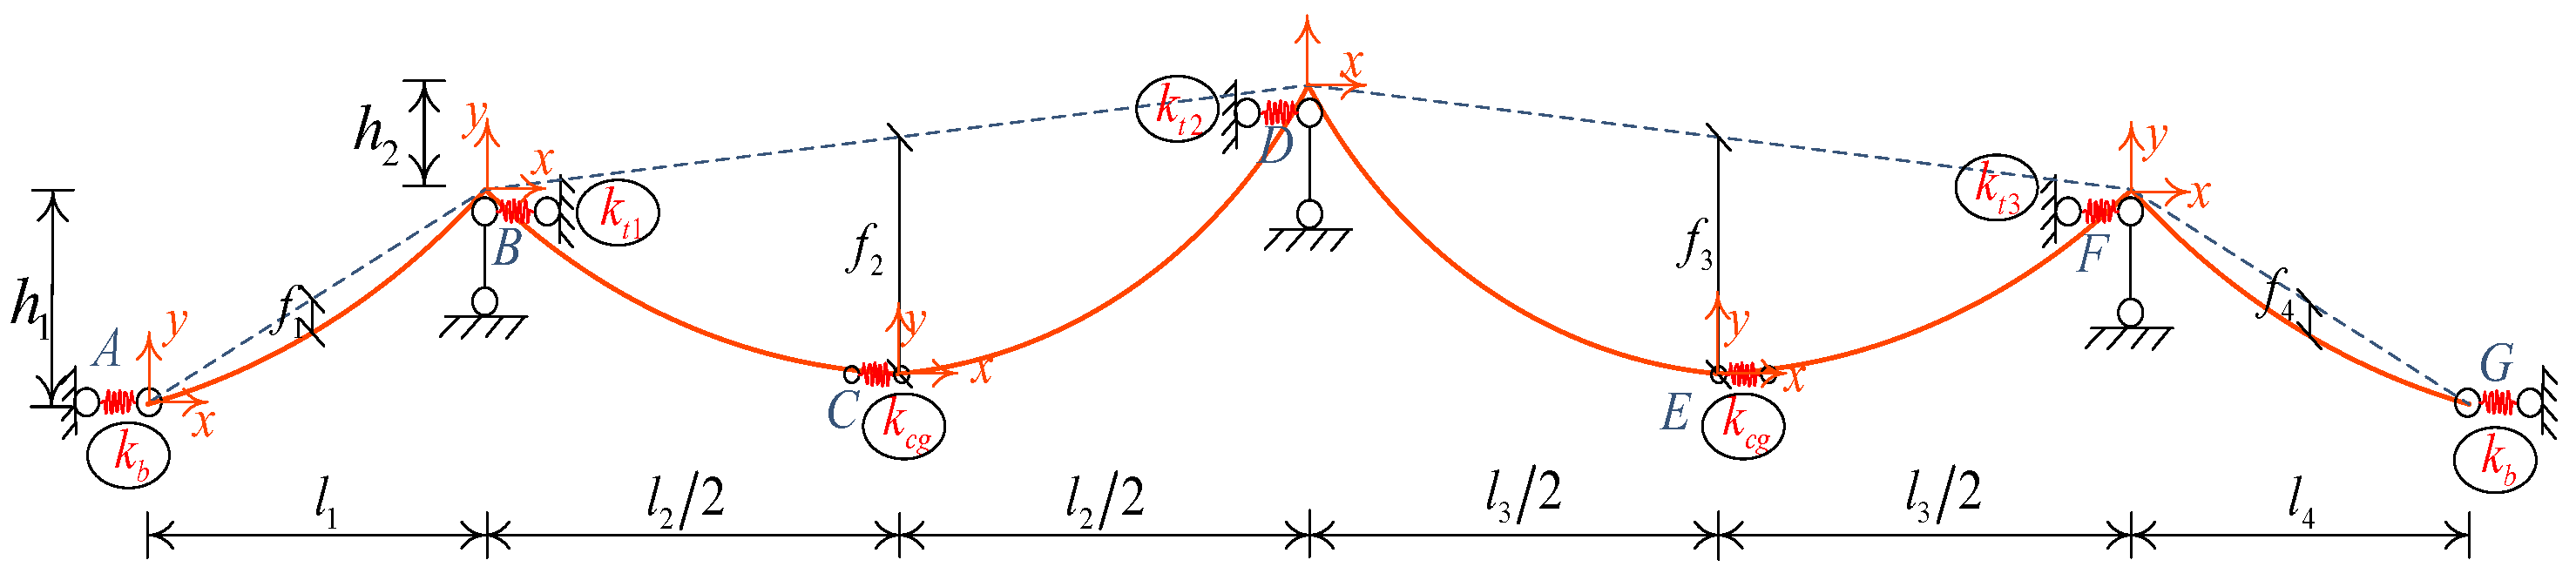
2. Analytical Model for Multi-Tower Suspension Bridges

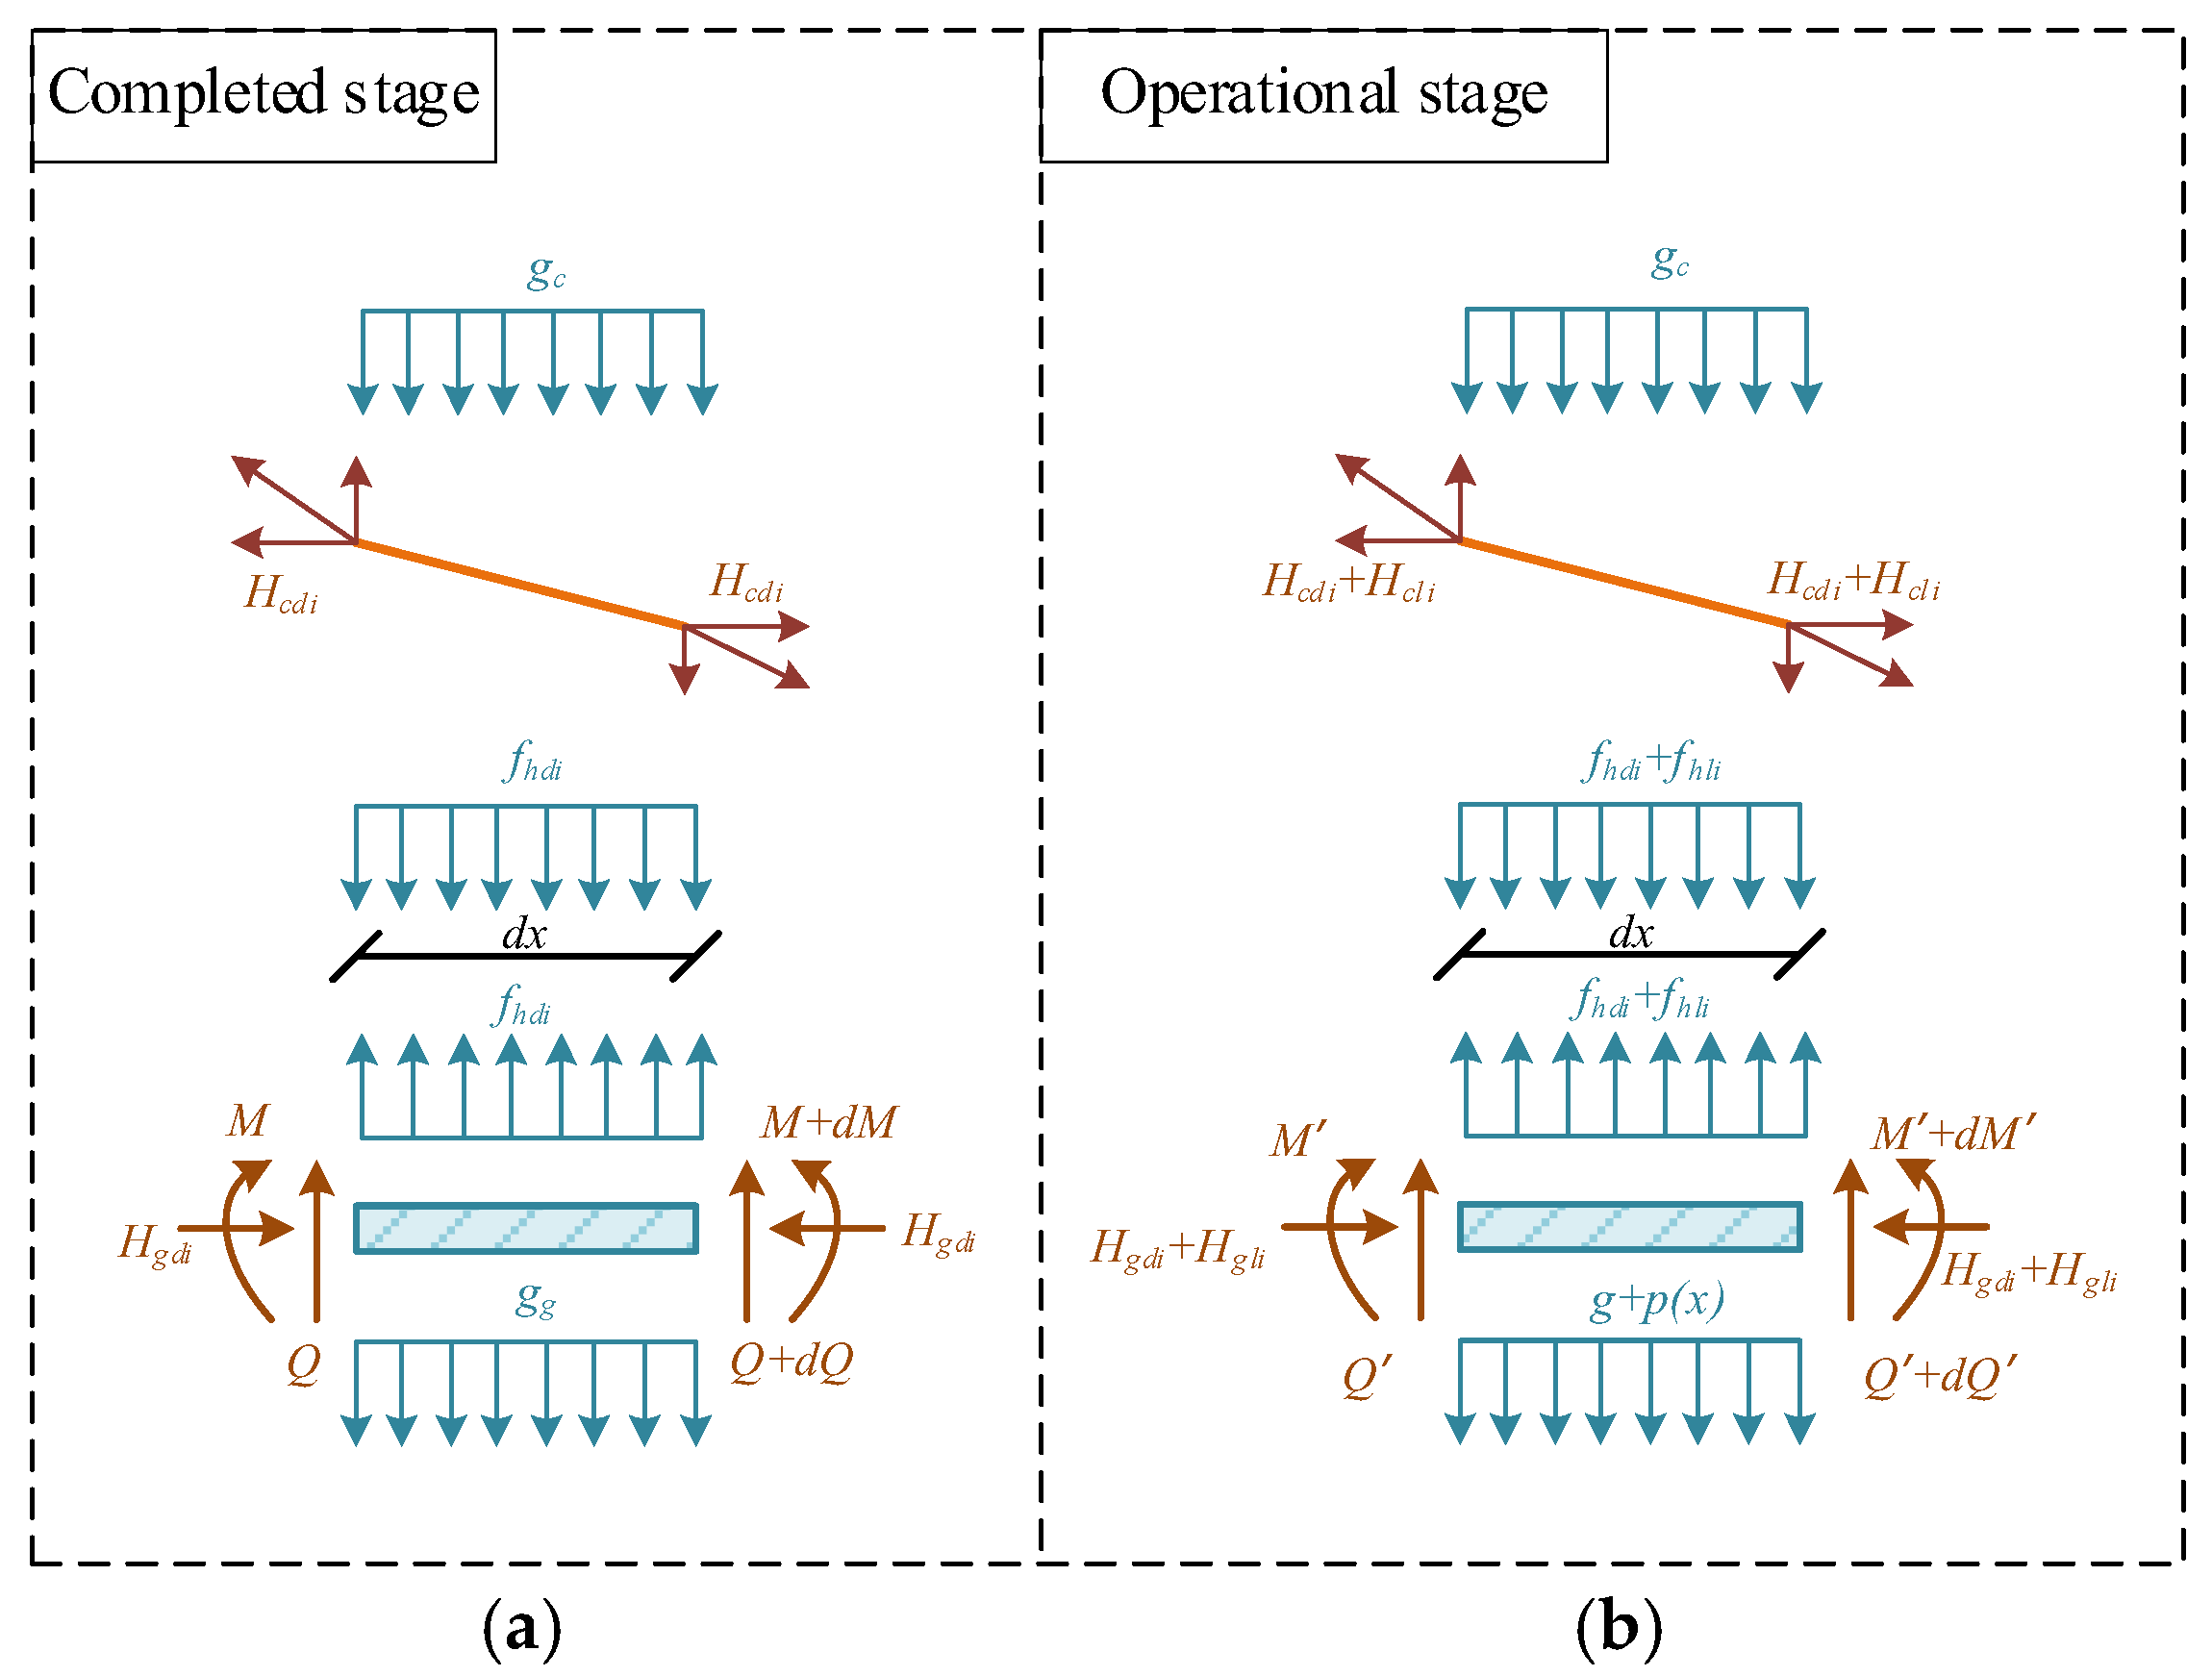
2.1. The Equilibrium Equation of the Main Cable and Girder

Figure 1 depicts the cable system of a conventional multi-tower self-anchored suspension bridge, with cable-guided connections (CGCs) segmenting the two primary spans into four sections. Figure 2 shows the actual structure of CGCs utilized in suspension bridges [32]. The CGC is frequently employed in conventional double-tower suspension bridges to enhance both static and dynamic performance, particularly regarding aerodynamic properties. Two horizontal springs are employed to replicate the constraining effect of the CGC on the relative horizontal displacement between the main cable and the girder, with the horizontal stiffness given by k c g . Three horizontal springs are used to represent the restraining effect of the relative horizontal displacement between the main cables and the bridge tower saddles, with a horizontal stiffness of k t 1 ~ k t 3 . The elastic constraint stiffness at the anchorage of the main cable to the main beam is expressed in terms of two horizontal springs k b . Based on the premise that the suspension cable’s design under a dead load is parabolic, the equation for the arrangement of each segment of the cable [33,34], with the origin positioned at the left ends of each segment, is as follows:
AB : y 1 = 2 f 1 l 1 2 x 2 x l 1 + h 1 2 f 1 l 1 x 0 x l 1 BC : y 2 = 2 f 2 l 2 2 x 2 x l 2 + h 2 2 f 2 l 2 x 0 x l 2 / 2 CD : y 3 = 2 f 2 l 2 2 x 2 x l 2 + h 2 + 2 f 2 l 2 x 0 x l 2 / 2 DE : y 4 = 2 f 3 l 3 2 x 2 x l 3 + h 2 2 f 3 l 3 x 0 x l 3 / 2 EF : y 5 = 2 f 3 l 3 2 x 2 x l 3 + h 2 + 2 f 3 l 3 x 0 x l 3 / 2 FG : y 6 = 2 f 4 l 4 2 x 2 x l 4 h 1 + 2 f 4 l 4 x 0 x l 4
In this context, y i represents the ordinate of the i t h segment of the cable. f i and l i denote the relative sag of the cable and the span length. h 1 denotes the vertical distance between the anchor and the lateral tower. h 2 denotes the vertical distance between the side tower and the mid tower.
In the finalized phase of the bridge, the load supported by the main cable consists of the dead load g c and the corresponding uniform load f h d i conveyed by the hangers, where f h d i contains the internal force of the hangers and its deadweight. As seen in Figure 3a, the equilibrium equation for the principal cable in each segment is expressed as follows: The dead load denotes the static weight of the bridge structure and its permanent fasteners. The corresponding uniform load denotes the uniformly distributed force exerted by the hangers onto the main cable.
H c d i d 2 y i d x 2 = g c + f h d i i = 1   ~   6
where H c d i is the horizontal part of the tension force on the cable.
Utilizing the equilibrium formula for the cable, Equation (3) can be used to characterize the vertical movement of the cable, η i , under the live load, p ( x ) .
H c d i + H c l i d 2 y i d x 2 + d 2 η i d x 2 = g c + f h d i + f h l i   i = 1 ~ 6
In this equation, H c l i is the horizontal part of the cable tension force caused by the live load, and f h l i is the hanger’s gradual tension under the live load.
As seen in Figure 3a,b, the girder, unlike earth-anchored suspension bridges, is also in charge of absorbing the axial forces, H g d i and H g l i , that are conveyed by the main cable. The axial deformation of the main girder is expressed as d x + d d x . Thus, using the initial camber z ( x ) , the following describes the equilibrium equation for the beam under a dead load:
E g I g i d 4 z d x 4 + H g d i d 2 z d x 2 = g g i f h d i i = 1   ~   6
where E g I g i is the i t h part’s main girder’s bending stiffness, and g g i is its dead load. Under a dead load, H g d i represents the axial force in the i t h element of the girder.
The girder’s equilibrium equation under both dead and live loads results in
E g I g i d 4 z d x 4 + d 4 η i d x 4 + H g d i + H g l i d 2 z d x 2 + d 2 η i d x 2 = g b i + p i x f h d i f h l i i = 1 ~ 6
where H g l i is the increase in horizontal force as the live load moves along the i t h main beam.
In addition, by inserting Equations (2) and (4) into Equation (5), the differential equation of static equilibrium for the girder under a live load gives rise to the following expressions:
E g I g i d 4 η i d x 4 + H g l i d 2 z d x 2 H c l i d 2 y i d x 2 + H g d i + H g l i H c l i H c d i d 2 η i d x 2 = p i x i = 1 ~ 6
The tower is in a purely compressed state when the bridge is finished. The main cable’s horizontal forces, H c d 1 H c d 6 , under the dead load stay the same because of this. H g d i = H c d i also indicates that the girder’s axial force under the dead load equals the main cable’s horizontal component force. Consequently, Equation (6) may be reformulated as
E g I g i d 4 η i d x 4 = p i x H g l i d 2 z d x 2 + H c l i d 2 y i d x 2 + H c l i H g l i d 2 η i d x 2 i = 1 ~ 6
Due to the main tower’s longitudinal stiffness, when the live load is given to the girder, the horizontal forces acting on each span will be different from the dead load situation. Furthermore, the girder’s axial forces, which are a consequence of the live load in each span, will change, and the amounts of these changes are affected by the TGCs and CGCs.

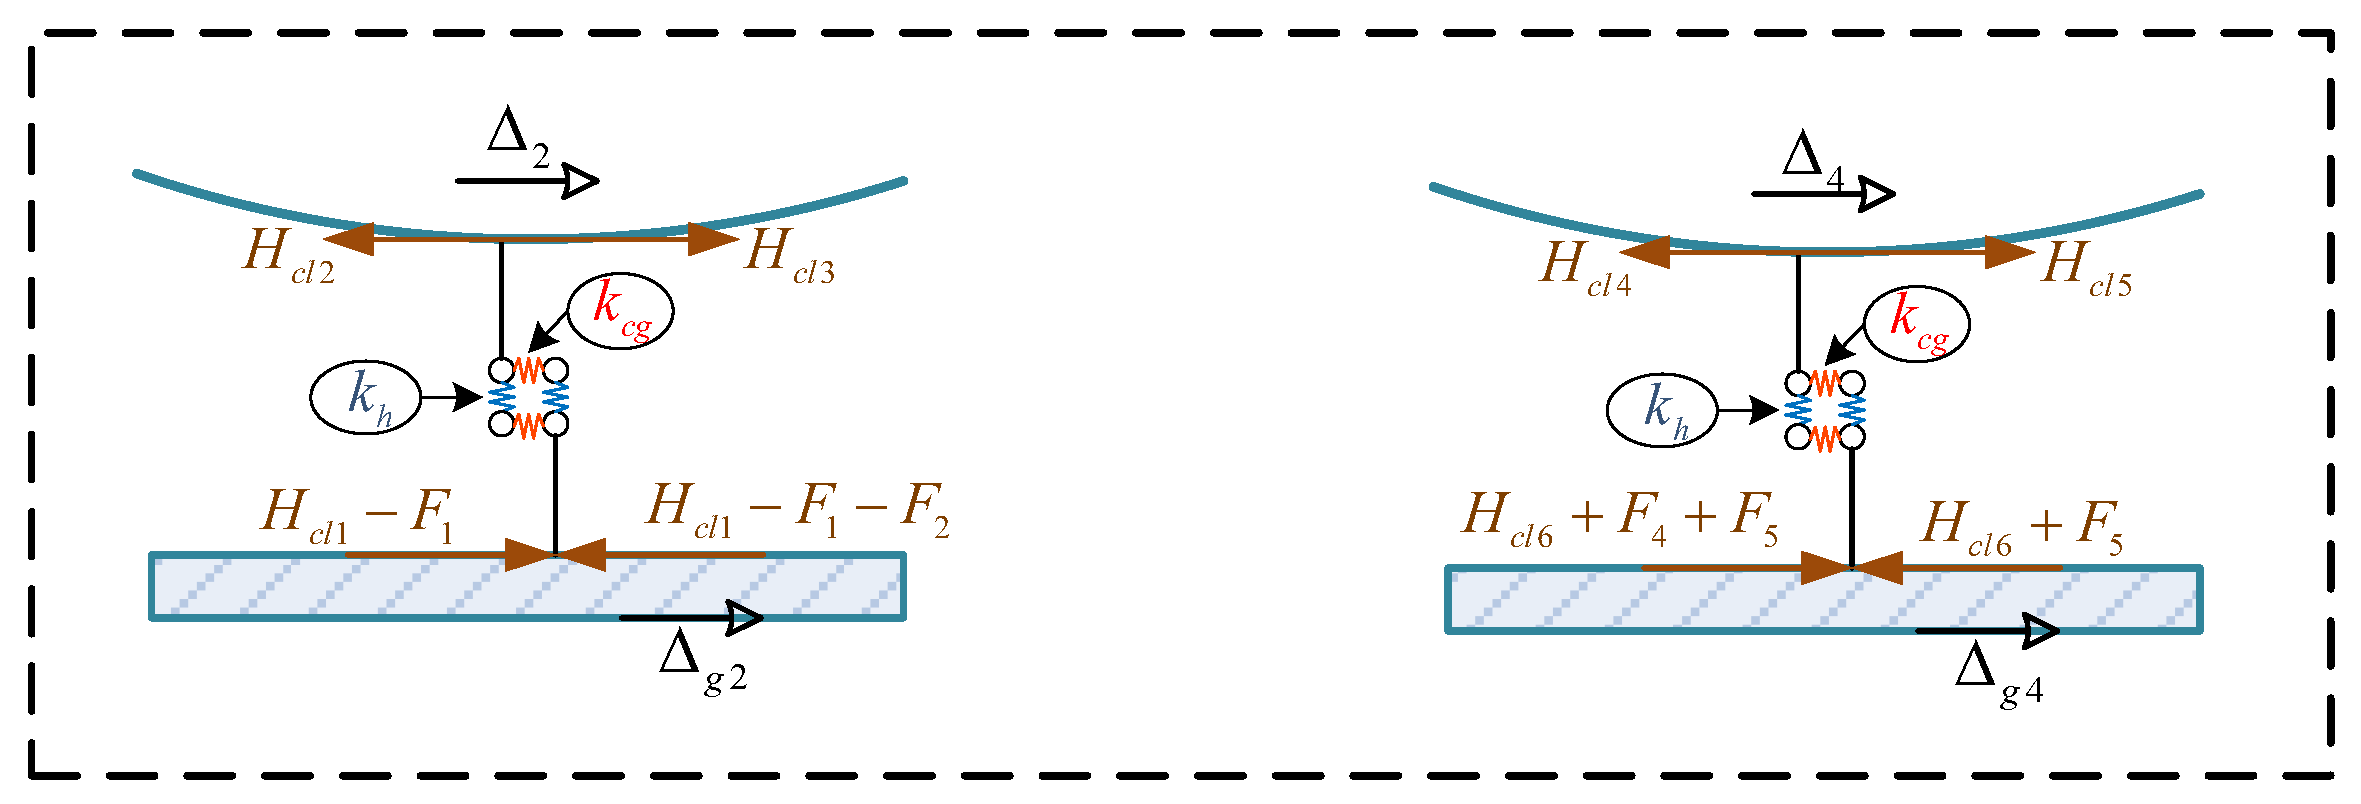
2.2. Consideration of the TGC and CGC

The connection stiffness along the longitudinal direction of the bridge between the main girder and the bridge tower of the suspension bridge is represented by three springs, namely k t g 1 ~ k t g 3 , while the interaction of the connection between the main girder and the main cable is denoted by two springs named k c g . The bridge has three towers and is self-anchored. Figure 4 shows that the horizontal forces exerted by these springs when subjected to a live load may be represented by the variables F 1 ~ F 5 .
The following equation holds true regardless of whether the main girder is under a dead or live load, taking into account its horizontal balance:
H g l 1 H g l 6 F 1 F 2 F 3 F 4 F 5 = 0
Thus, the following formulas describe the axial force acting on the girder at each part:
H g l 1 = H c l 1 H g l 2 = H c l 1 F 1 H g l 3 = H c l 1 F 1 F 2 H g l 4 = H c l 6 + F 4 + F 5 H g l 5 = H c l 6 + F 5 H g l 6 = H c l 6
Applying the girder’s compatibility conditions in a horizontal direction leads to eight equations for the six pieces from left to right.
Δ g 0 = Δ 0 H g l 1 l 1 E g A g 1 ± α b Δ t b l 1 = Δ 0 Δ g 1 H g l 2 l 2 2 E g A g 2 ± α b Δ t b l 2 2 = Δ g 1 Δ g 2 H g l 3 l 2 2 E g A g 2 ± α b Δ t b l 2 2 = Δ g 2 Δ g 3 H g l 4 l 3 2 E g A g 3 ± α b Δ t b l 3 2 = Δ g 3 Δ g 4 H g l 5 l 3 2 E g A g 3 ± α b Δ t b l 3 2 = Δ g 4 Δ g 5 H g l 6 l 4 E g A g 4 ± α b Δ t b l 4 = Δ g 5 Δ 6 Δ g 6 = Δ 6
The i t h component’s main girder’s temperature fluctuation ( Δ t b i ), cross-sectional area ( A g i ), and coefficient of thermal expansion ( α b i ) are denoted, respectively. Δ 0 and Δ 6 show how far apart the two anchors are moving horizontally. Δ g i shows how much the girder moves horizontally at the anchor and link points of the TGC and CGC.
Figure 5 illustrates a mechanical diagram of a suspension bridge with CGCs. The horizontal stiffness of the CGCs, k h , can be considered as rigid. As a result of the external load, the CGCs’ horizontal stiffness ( k c g ) will limit the relative displacement of the main cable and girder, and the following formulas characterize the horizontal forces acting on them:
F 2 = k c g Δ g 2 Δ 2 = H c l 2 H c l 3 F 4 = k c g Δ g 4 Δ 4 = H c l 4 H c l 5
Figure 6 shows that the TGC-equipped suspension bridge tower is similar to a cantilever girder that has an elastic support at the joints. The tower’s top and the link points move longitudinally in the following ways:
Δ t i = H c l 2 i H c l 2 i 1 k t i B h i 2 3 B i B h i 2 B i 3 + F 2 i - 1 k t i B h i B i 3 Δ 2 i 1 = H c l 2 i H c l 2 i 1 k t i + F 2 i - 1 k t i B h i 2 3 B i B h i 2 B i 3 i = 1 ~ 3
The above present the i t h tower’s overall height, B h i , and its height below the connection, B i , respectively.
The three TGCs’ horizontal forces, F ( 2 i 1 ) , due to the live load, may be determined by
F 2 i 1 = k t g i Δ g 2 i 1 Δ t i i = 1 ~ 3
where the girder’s longitudinal displacement at the TGC is denoted by Δ g 2 i - 1 , and the tower’s longitudinal displacement at the TGC is denoted by Δ t i .
A total of 28 equations and 34 variables make up Equations (8) through (13): F 1 ~ F 5 , Δ t 1 ~ Δ t 3 , Δ g 0 ~ Δ g 6 , Δ 0 ~ Δ 6 , H g l 1 ~ H g l 6 , and H c l 1 ~ H c l 6 . If H c l 1 ~ H c l 6 are treated as known variables, every one of the next 18 variables may be stated directly as by H c l 1 ~ H c l 6 .
A multi-tower self-anchored suspension bridge under a live load has equilibrium differential equations for each span girder by substituting Equation (11) into Equation (7),
E g I g 1 d 4 η 1 d x 4 = p 1 x H c l 1 d 2 z d x 2 + H c l 1 d 2 y 1 d x 2 E g I g 2 d 4 η 2 d x 4 = p 2 x H c l 1 F 1 d 2 z d x 2 + H c l 2 d 2 y 2 d x 2 + H c l 2 H c l 1 + F 1 d 2 η 2 d x 2 E g I g 3 d 4 η 3 d x 4 = p 3 x H c l 1 F 1 F 2 d 2 z d x 2 + H c l 3 d 2 y 3 d x 2 + H c l 2 H c l 1 + F 1 d 2 η 3 d x 2 E g I g 4 d 4 η 4 d x 4 = p 4 x H c l 6 + F 4 + F 5 d 2 z d x 2 + H c l 4 d 2 y 4 d x 2 + H c l 5 H c l 6 F 5 d 2 η 4 d x 2 E g I g 5 d 4 η 5 d x 4 = p 5 x H c l 6 + F 5 d 2 z d x 2 + H c l 5 d 2 y 5 d x 2 + H c l 5 H c l 6 F 5 d 2 η 5 d x 2 E g I g 6 d 4 η 6 d x 4 = p 6 x H c l 6 d 2 z d x 2 + H c l 6 d 2 y 6 d x 2
In Equation (14), F 1 F 5 can be expressed by H c l 1 ~ H c l 6 , as discussed above. H c l 1 ~ H c l 6 and η 1 ~ η 6 are 2 of the 12 dependent variables. Therefore, in order to find all the variables, six more compatibility equations are required.

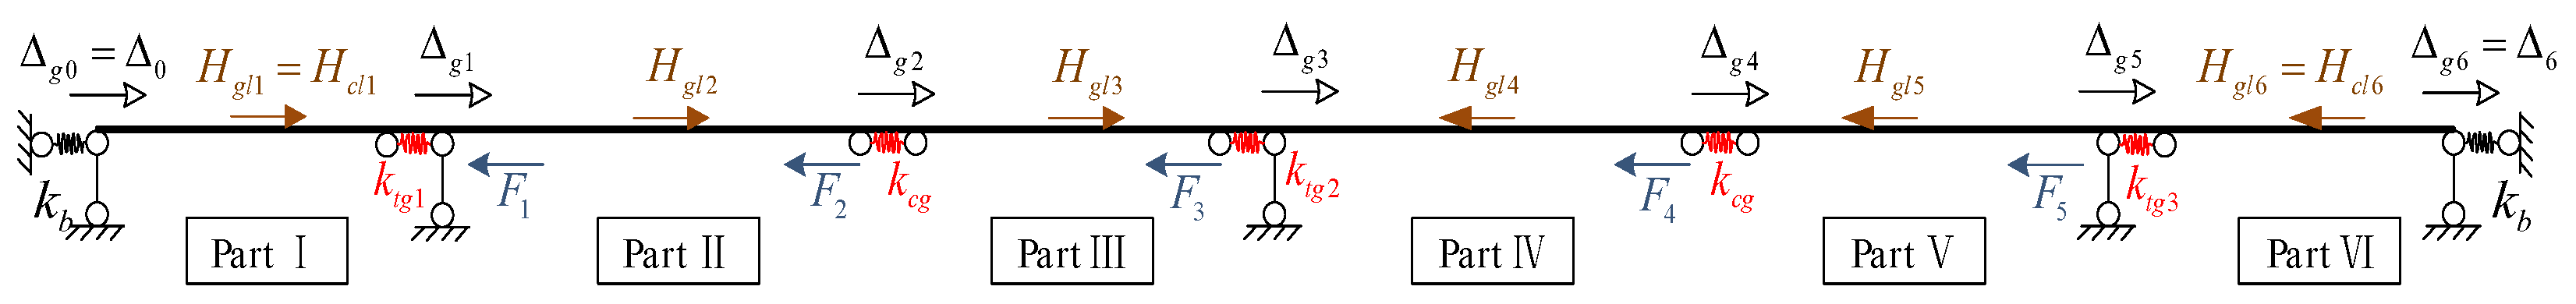
2.3. Compatibility Conditions

The primary cable is fastened to the girder ends as opposed to the earth-anchored suspension bridges. With each span, the main cable’s horizontal projection will vary because of elastic deformation caused by changes in the girder’s horizontal force under a live load. Therefore, there are six additional compatibility equations:
H c l 1 E c A c 0 l 1 d x cos 3 θ ± α c Δ t c 0 l 1 d x cos 2 θ 0 l 1 d y 1 d x d η 1 = Δ 1 Δ 0 H c l 2 E c A c 0 l 2 / 2 d x cos 3 θ ± α c Δ t c 0 l 2 / 2 d x cos 2 θ 0 l 2 / 2 d y 2 d x d η 2 = Δ 2 Δ 1 H c l 3 E c A c 0 l 2 / 2 d x cos 3 θ ± α c Δ t c 0 l 2 / 2 d x cos 2 θ 0 l 2 / 2 d y 3 d x d η 3 = Δ 3 Δ 2 H c l 4 E c A c 0 l 3 / 2 d x cos 3 θ ± α c Δ t c 0 l 3 / 2 d x cos 2 θ 0 l 3 / 2 d y 4 d x d η 4 = Δ 4 Δ 3 H c l 5 E c A c 0 l 3 / 2 d x cos 3 θ ± α c Δ t c 0 l 3 / 2 d x cos 2 θ 0 l 3 / 2 d y 5 d x d η 5 = Δ 5 Δ 4 H c l 6 E c A c 0 l 4 d x cos 3 θ ± α c Δ t c 0 l 4 d x cos 2 θ 0 l 4 d y 6 d x d η 6 = Δ 6 Δ 5
where E c , A c , and α c represent the main cable’s elastic modulus, cross-sectional area, and thermal expansion coefficient, respectively. The primary cable’s temperature fluctuation is represented by Δ t c . The three towers’ peak horizontal displacements are Δ 1 , Δ 3 , and Δ 5 , correspondingly.
Particularly, if the bridge is only configured with TGCs and does not have CGCs, this leads to H c l 2 = H c l 3 ; additionally, H c l 4 = H c l 5 . In this case, the dimension of Equation (14) is reduced to 8, and Equation (15) can be rewritten as
H c l 1 E c A c 0 l 1 d x cos 3 θ ± α c Δ t c 0 l 1 d x cos 2 θ 0 l 1 d y 1 d x d η 1 = Δ 1 Δ 0 i = 2 3 H c l i E c A c 0 l 2 2 d x cos 3 θ ± α c Δ t c 0 l 2 2 d x cos 2 θ 0 l 2 2 d y i d x d η i = Δ 3 Δ 1 i = 4 5 H c l i E c A c 0 l 3 2 d x cos 3 θ ± α c Δ t c 0 l 3 2 d x cos 2 θ 0 l 3 2 d y i d x d η i = Δ 5 Δ 3 H c l 6 E c A c 0 l 4 d x cos 3 θ ± α c Δ t c 0 l 4 d x cos 2 θ 0 l 4 d y 6 d x d η 6 = Δ 6 Δ 5
Moreover, when the bridge with CGCs adopts the longitudinal fully floating system, H c l 1 = H c l 6 , H c l 2 = H c l 3 , and H c l 4 = H c l 5 . The following is the degradation of Equation (15) and the reduction in the dimension of Equations (14) to (7):
H c l 1 E c A c 0 l 1 d x cos 3 θ ± α c Δ t c 0 l 1 d x cos 2 θ 0 l 1 d y 1 d x d η 1 + H c l 6 E c A c 0 l 4 d x cos 3 θ ± α c Δ t c 0 l 4 d x cos 2 θ 0 l 4 d y 6 d x d η 6 = Δ 1 Δ 0 + Δ 6 Δ 5 i = 2 3 H c l i E c A c 0 l 2 2 d x cos 3 θ ± α c Δ t c 0 l 2 2 d x cos 2 θ 0 l 2 2 d y i d x d η i = Δ 3 Δ 1 i = 4 5 H c l i E c A c 0 l 3 2 d x cos 3 θ ± α c Δ t c 0 l 3 2 d x cos 2 θ 0 l 3 2 d y i d x d η i = Δ 5 Δ 3

2.4. Solution Procedure

An example of a three-span continuous beam that experiences an axial force in the middle spans and uniform loads throughout its length is shown in Figure 7a. Equation (14) is comparable to these flexural differential equations. The inclusion of a CGC does not cause a break in the continuity of equal axial forces between the two primary spans ( H c l 2 H g l 2 = H c l 3 H g l 3 ; H c l 4 H g l 4 = H c l 5 H g l 5 ) because of the connection between the main girder’s axial force and the main cable’s horizontal force (Equation (9)) and the interaction between CGCs (Equation (11)). Because the primary girder is statically indetermined, three uncertain support moments M i p ( M i H c l i ) must be added, as seen in Figure 7b,c. The standard equations for the computation of the superfluous bending moments M i p and M i H c l i using the force technique are
δ 11 M 1 + δ 12 M 2 + δ 13 M 3 + Δ 1 L = 0 δ 21 M 1 + δ 22 M 2 + δ 23 M 3 + Δ 2 L = 0 δ 31 M 1 + δ 32 M 2 + δ 33 M 3 + Δ 3 L = 0
Applying the procedure of diagram multiplication yields the values of δ i j and Δ i L . The beam in the earth-anchored suspension bridge is always under tension. In the self-anchored suspension bridge, on the other hand, the force acting on the beam can be either compression or tension based on H c l 2 H c l 1 + F 1 and H c l 5 H c l 6 F 5 . Based on the extensive literature on simply supported beams under tension [35], Table 1 only displays the formulae for calculations involving simply supported beams under compression.
Besides that, before assessing the girder’s deflection, one must ascertain the horizontal force, H c l i , of the primary cable in order to assess the equations in Table 1. The steps for fixing H c l 1 ~ H c l 6 are listed below, and they are performed one after the other:
Step 1: Include the live load p i ( x ) and the convergence limit ε in the inputs for the structural design parameters.
Step 2: Assume the primary cable’s initial horizontal force H c l 1 0 ~ H c l 6 0 , which is brought on by the active load at each span.
Step 3: Calculate the interaction forces F 1 ~ F 5 and other displacement and internal forces, Δ t 1 ~ Δ t 3 , Δ g 0 ~ Δ g 6 , Δ 0 ~ Δ 6 , and H g l 1 ~ H g l 6 , utilizing Equations (8)–(13).
Step 4: Find out how big H c l 2 H c l 1 + F 1 and H c l 5 H c l 6 F 5 are, respectively. When the value is greater than zero, a simply supported beam with tension is utilized for the subsequent calculation; when the value is less than zero, the simply supported beam with compression is utilized, as shown in Table 1; and for the rest of the cases, a simply supported beam is utilized for further calculations.
Step 5: Find the distributed load of each span and the bending moments M 1 p ~ M 3 p and M 1 y i " H c l i ~ M 3 y i " H c l i under a live load p i x using the diagram multiplication approach, as illustrated in Figure 7b,c.
Step 6: Determine the amount that M 1 p ~ M 3 p and M 1 y i " H c l i ~ M 3 y i " H c l i deflect at each span.
Step 7: To find fresh H c l 4 n e w ~ H c l 4 n e w values, plug η i into Equation (15).
Step 8: If the ending condition i = 1 4 H c l i H c l i n e w 2 ε is not met, go back to Step 2.

3. Validation and Discussions

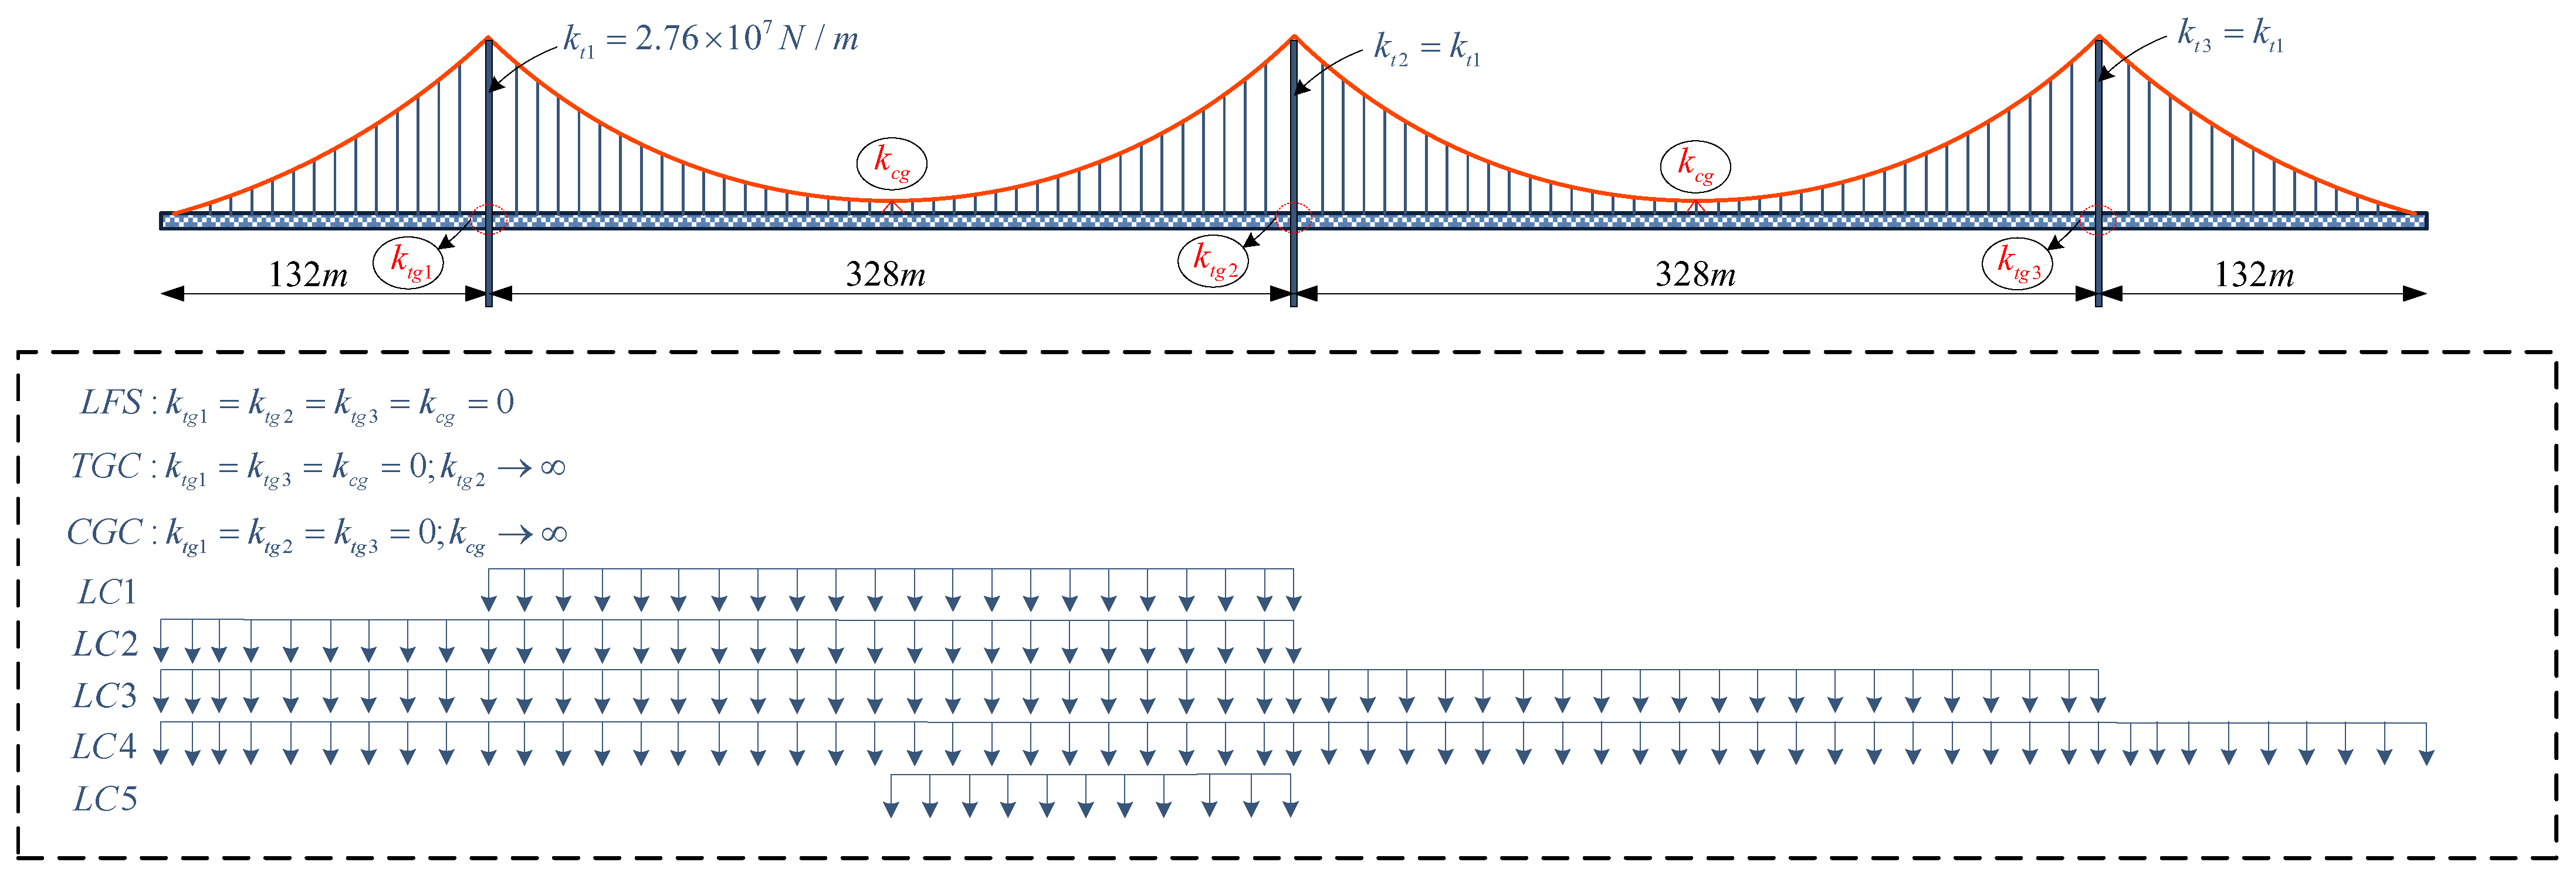
3.1. Numerical Model

The multi-tower self-anchored bridge used in this study has a span of (132 + 328 + 328 + 132) m. This is used to confirm the correctness of the suggested analytical model. Figure 8 illustrates the elevation plan of the bridge as well as the primary design parameters, while Table 2 provides a summary of the remaining data. Midas/Civil is used to build the comparison model, which takes geometric nonlinearity and gravity stiffness into account. Elements such as catenary cables and beams are utilized in the finite element model to represent the cable and hanger and the girder and tower, respectively. In the model, the main girder is established with beam element types and divided into 920 elements. The main cable is simulated by 100 tension-only cable elements, the hangers are simulated by 96 tension-only cable elements, and a bridge tower is simulated by 107 beam elements. The dead load, q , is made up of the girder’s weight, the main cable’s weight, the hangers’ weight, and the secondary loading. According to JTG-D60-2015 [12], the value of p is found for eight-lane traffic after looking at the five load cases shown in Figure 8. The bridge is depicted in Figure 8, with three distinct types of TGCs and CGCs consisting of the longitudinal floating system (LFS), with the exception of the middle tower, which only has a TGC ( k t g 1 = k t g 3 = k c g = 0 ; k t g 2 ), and both of the major spans, which include the CGC ( k t g 1 = k t g 2 = k t g 3 = 0 ; k c g ).

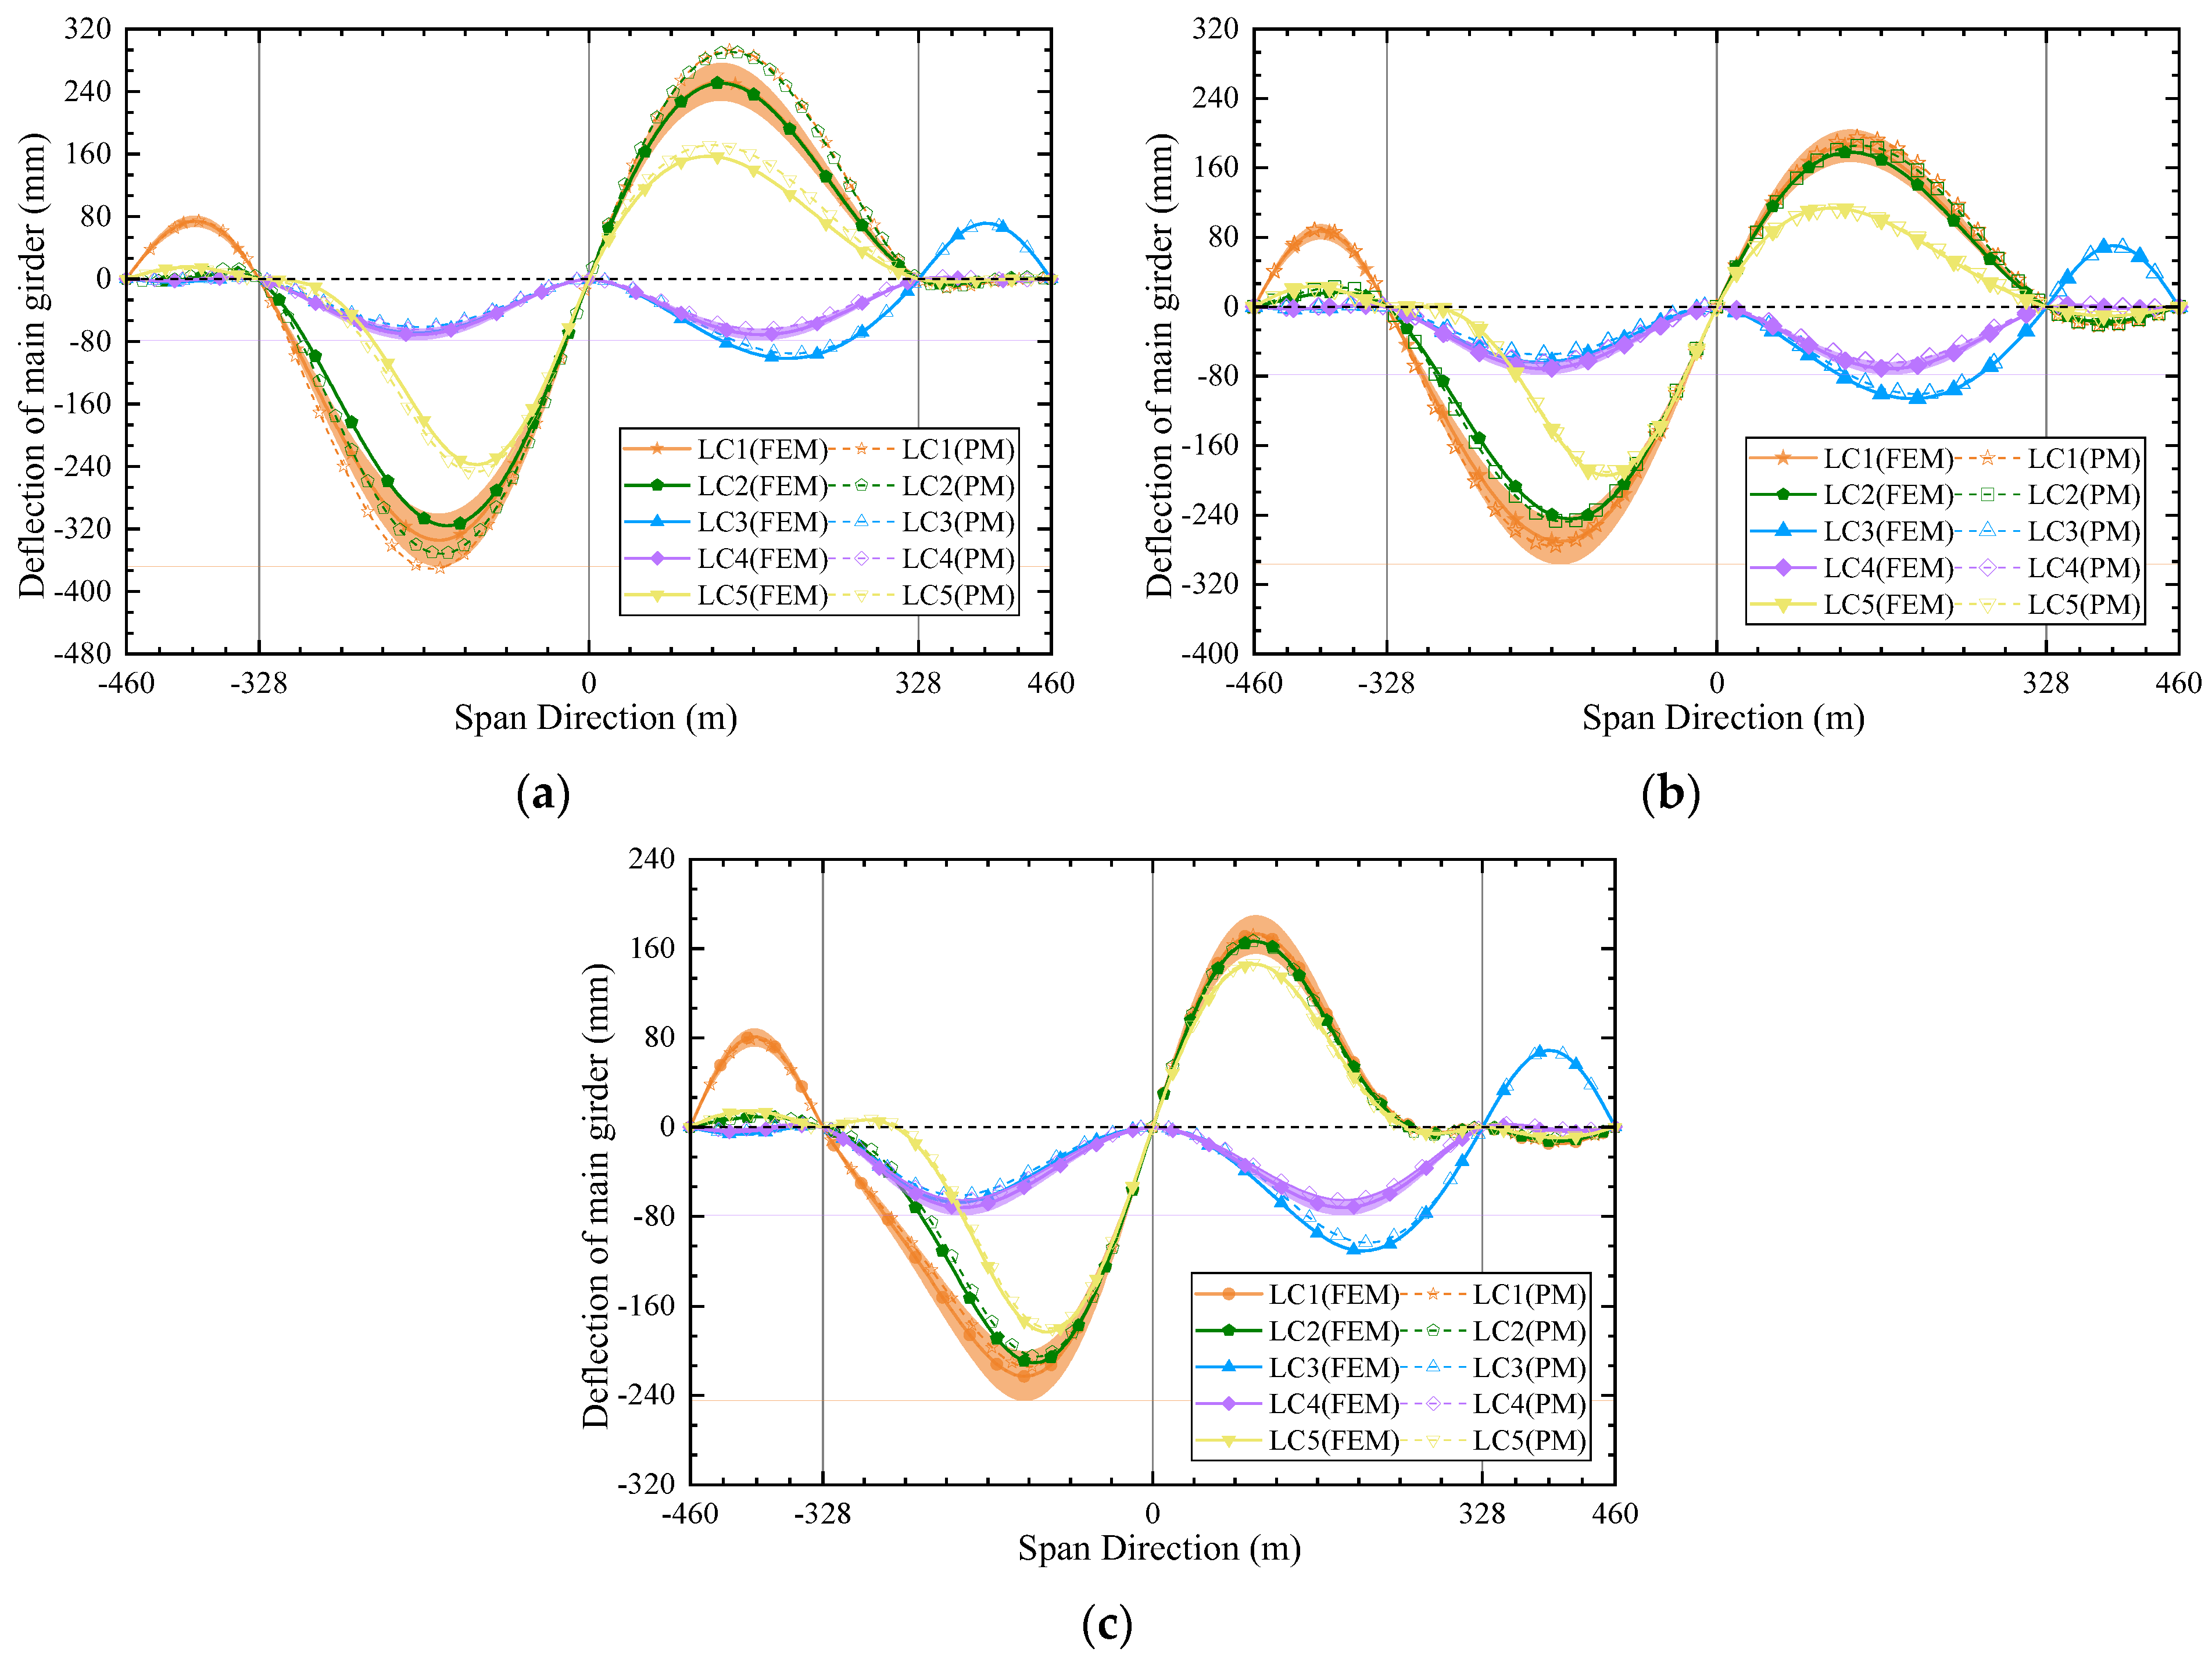
3.2. Deflections of Girder

Figure 9 presents a comparative examination of girder deflection for the multi-tower self-anchored suspension bridge utilizing three distinct TGCs and CGCs (as seen in Figure 8), derived from both the finite element method (FEM) and the proposed model (PM) for load cases LC1 to LC5. The displacement curves illustrate that the results from the two approaches show good agreement with each other. Under LC1 and LC4, the deflection curves’ 10% relative error threshold is depicted by the color ribbon. With the maximum error being less than error limit, the PM can reliably forecast bridge displacement reactions. The values for load case LC1 in LFS are just above the 10% error limit. This is mostly because the hangers are tilted when they are under a live load. Further evidence that CGC and TGC measures can limit the relative movement of the main cable and girder is provided by this. For all three structural systems, a full-length live load working on a single main span is the worst load situation, as shown by the girder’s greatest displacement in Figure 9. Under load case LC1, the LFS achieves a maximum displacement of 335 mm, which is 1.5 times more than CGC and roughly 1.24 times greater than TGC. This suggests that the main girder’s mechanical performance can be enhanced by the TGC and CGC.

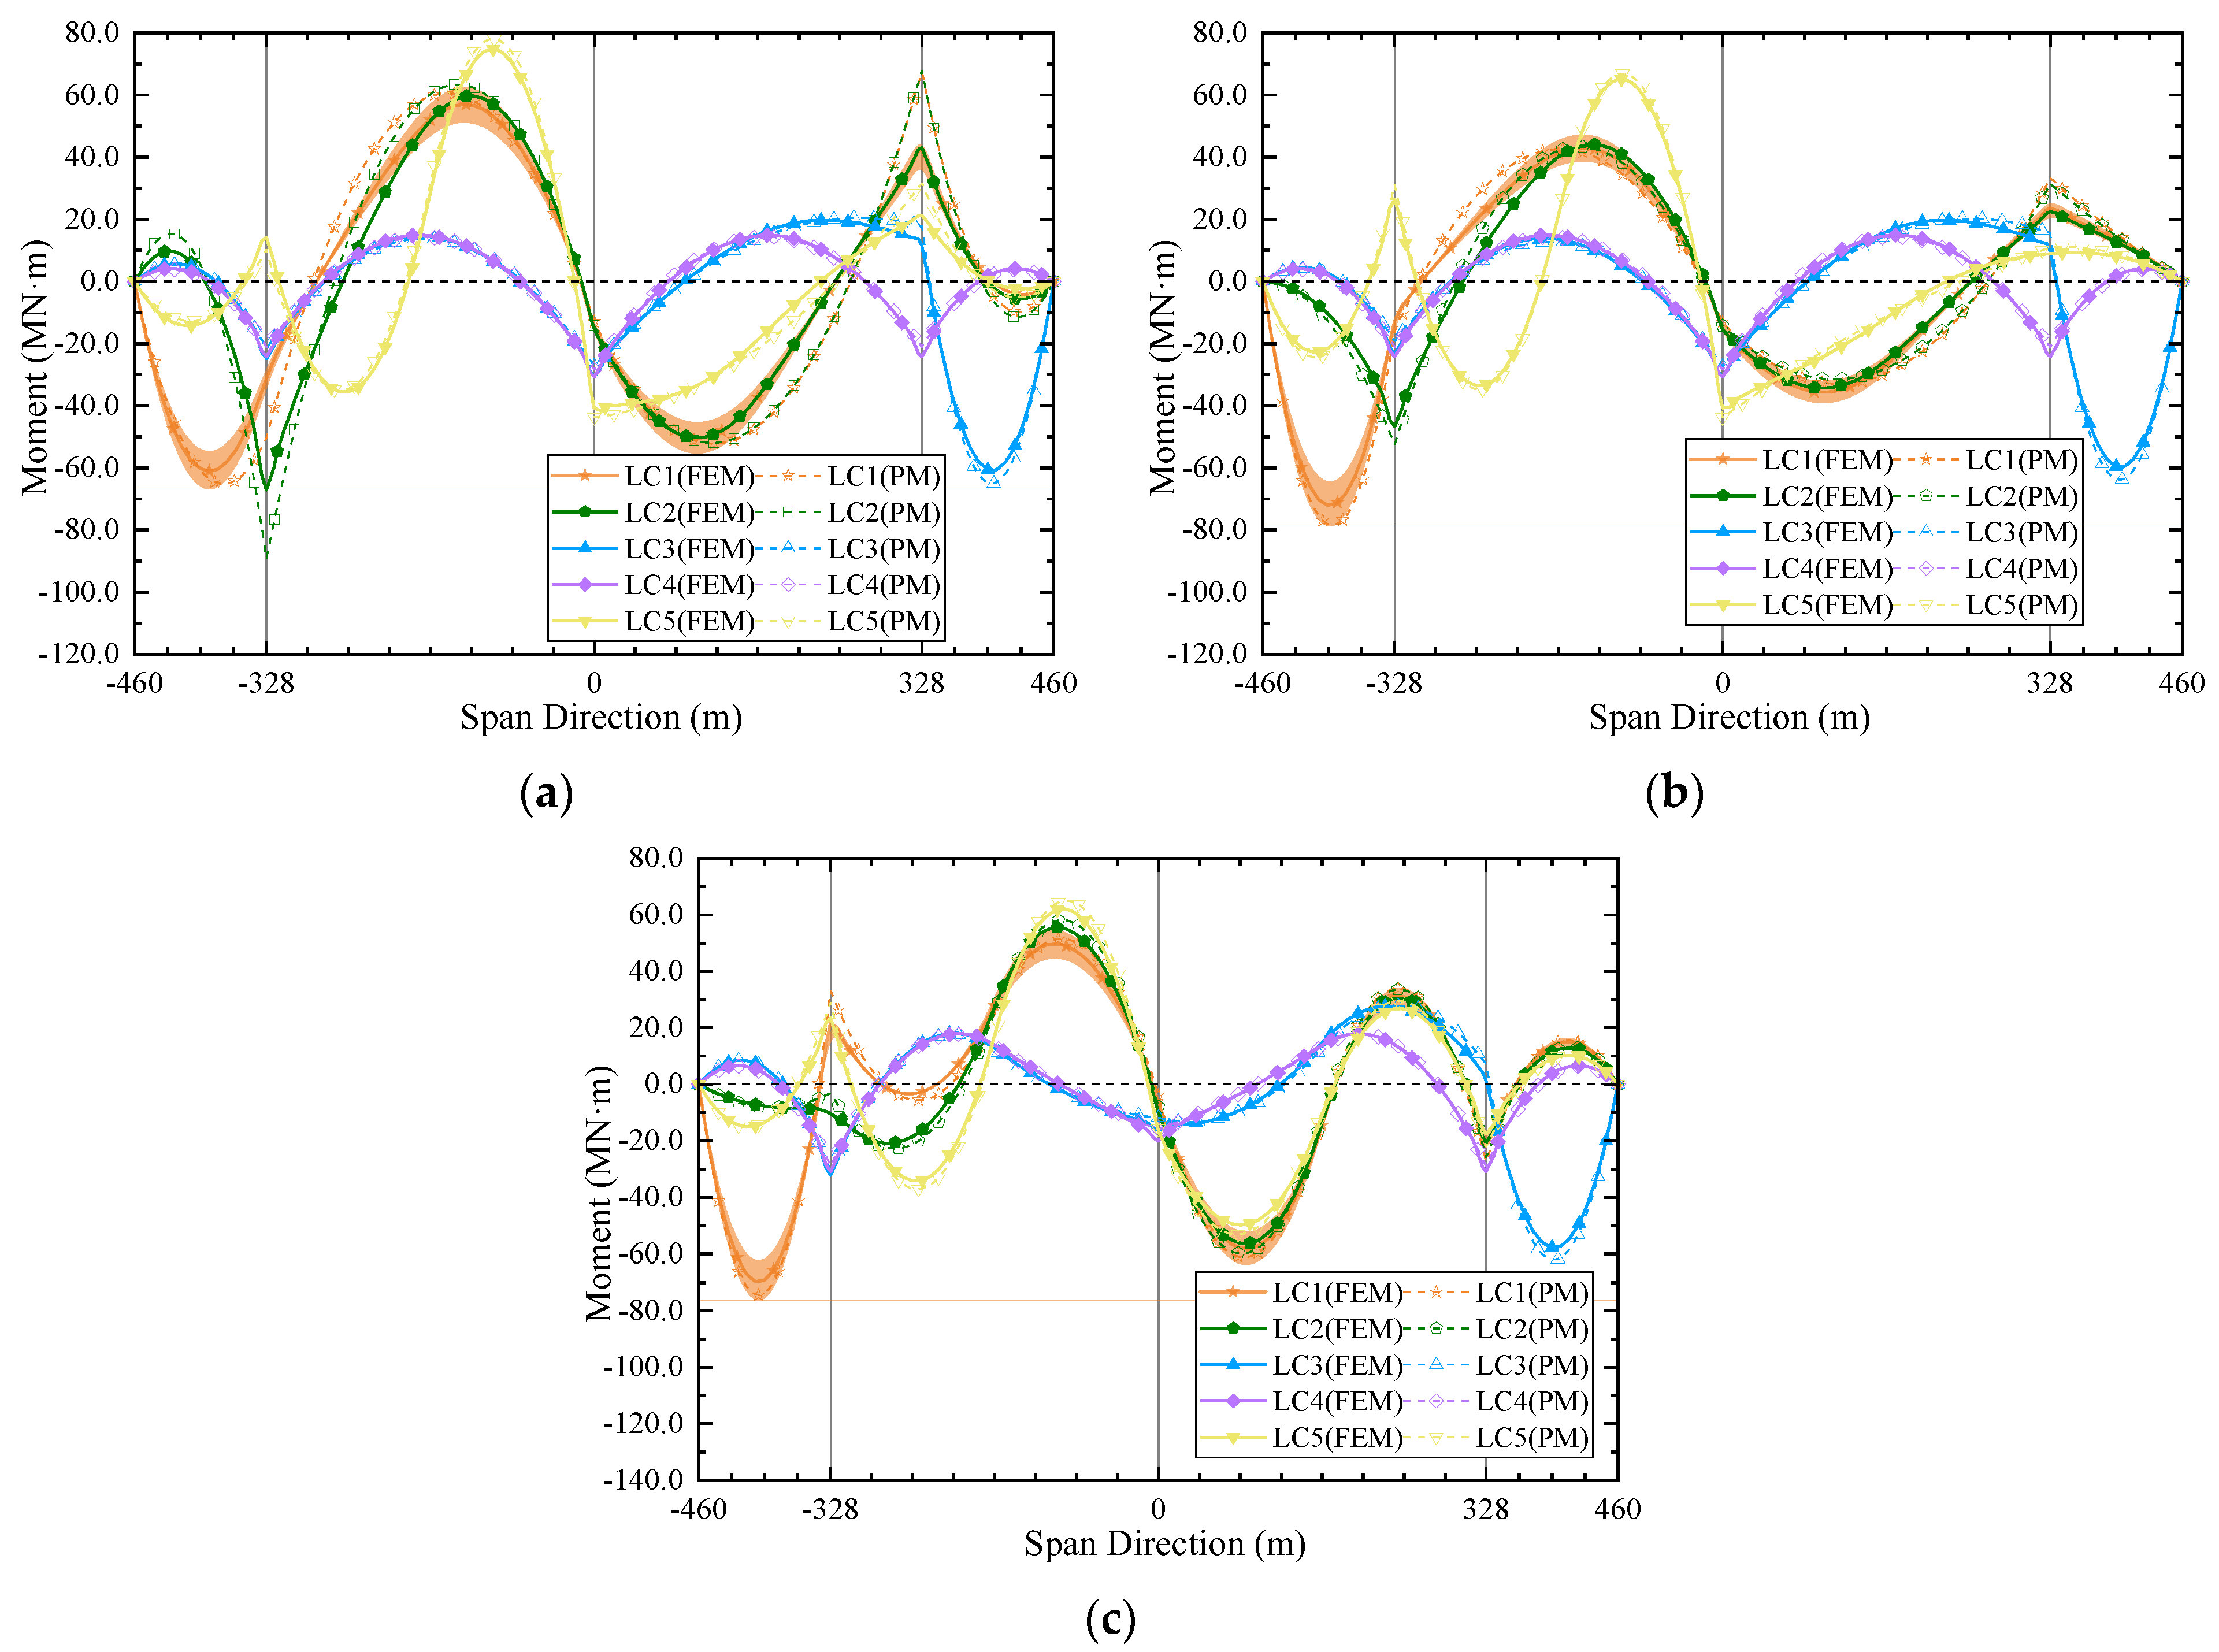
3.3. Moment Distributions of Girder

The designer of a self-balancing system, which includes the self-anchored suspension bridge, must pay close attention to the stress on the main girder. Figure 10 shows a diagram of the girder’s bending moment using the FE and PM methods, obtained for LC1~LC5. With the exception of the location close to the supports, the bending moments obtained by the PM and the nonlinear FEM are in good agreement. The greatest bending moment occurs in the LFS analogous to the deformation behavior. Nonetheless, the most adverse load situation occurs at LC5 for all three structural systems, which differs from the unfavorable load case concerning girder deflection.

3.4. Longitudinal Displacement of Tower

An important part of the saddle’s anti-slip design is how much the tower moves along its length when it is under a live load. Table 3 shows the differences between the PM and FE methods for calculating displacement from the LFS to the CGC. Under the load scenarios LC1 and LC2, the results of the LFS reveal that the relative errors of the longitudinal tower displacement acquired by the PM are greater than the 10% error restriction that the FE method allows for. The reason is that the asymmetric load causes unequal horizontal forces at the anchor points, leading to the inclination of the hangers, and the analytical model assumes that the horizontal forces on both sides are always equal in the LFS. For the TGC and CGC system, the relative errors of the longitudinal tower displacement are all within the 10% error restriction regardless of the load cases. The CGC and TGC left-side tower displacements are 37.22% and 71.45% smaller under LC1 than they are with the LFS method. The CGC leads to a 45.50% reduction for the mid-tower section, while the TGC at the mid-tower section leads to an 11.15% increase. These results demonstrate that the reasonable use of the CGC and TGC can improve the stress condition of the towers.

4. Parametric Studies

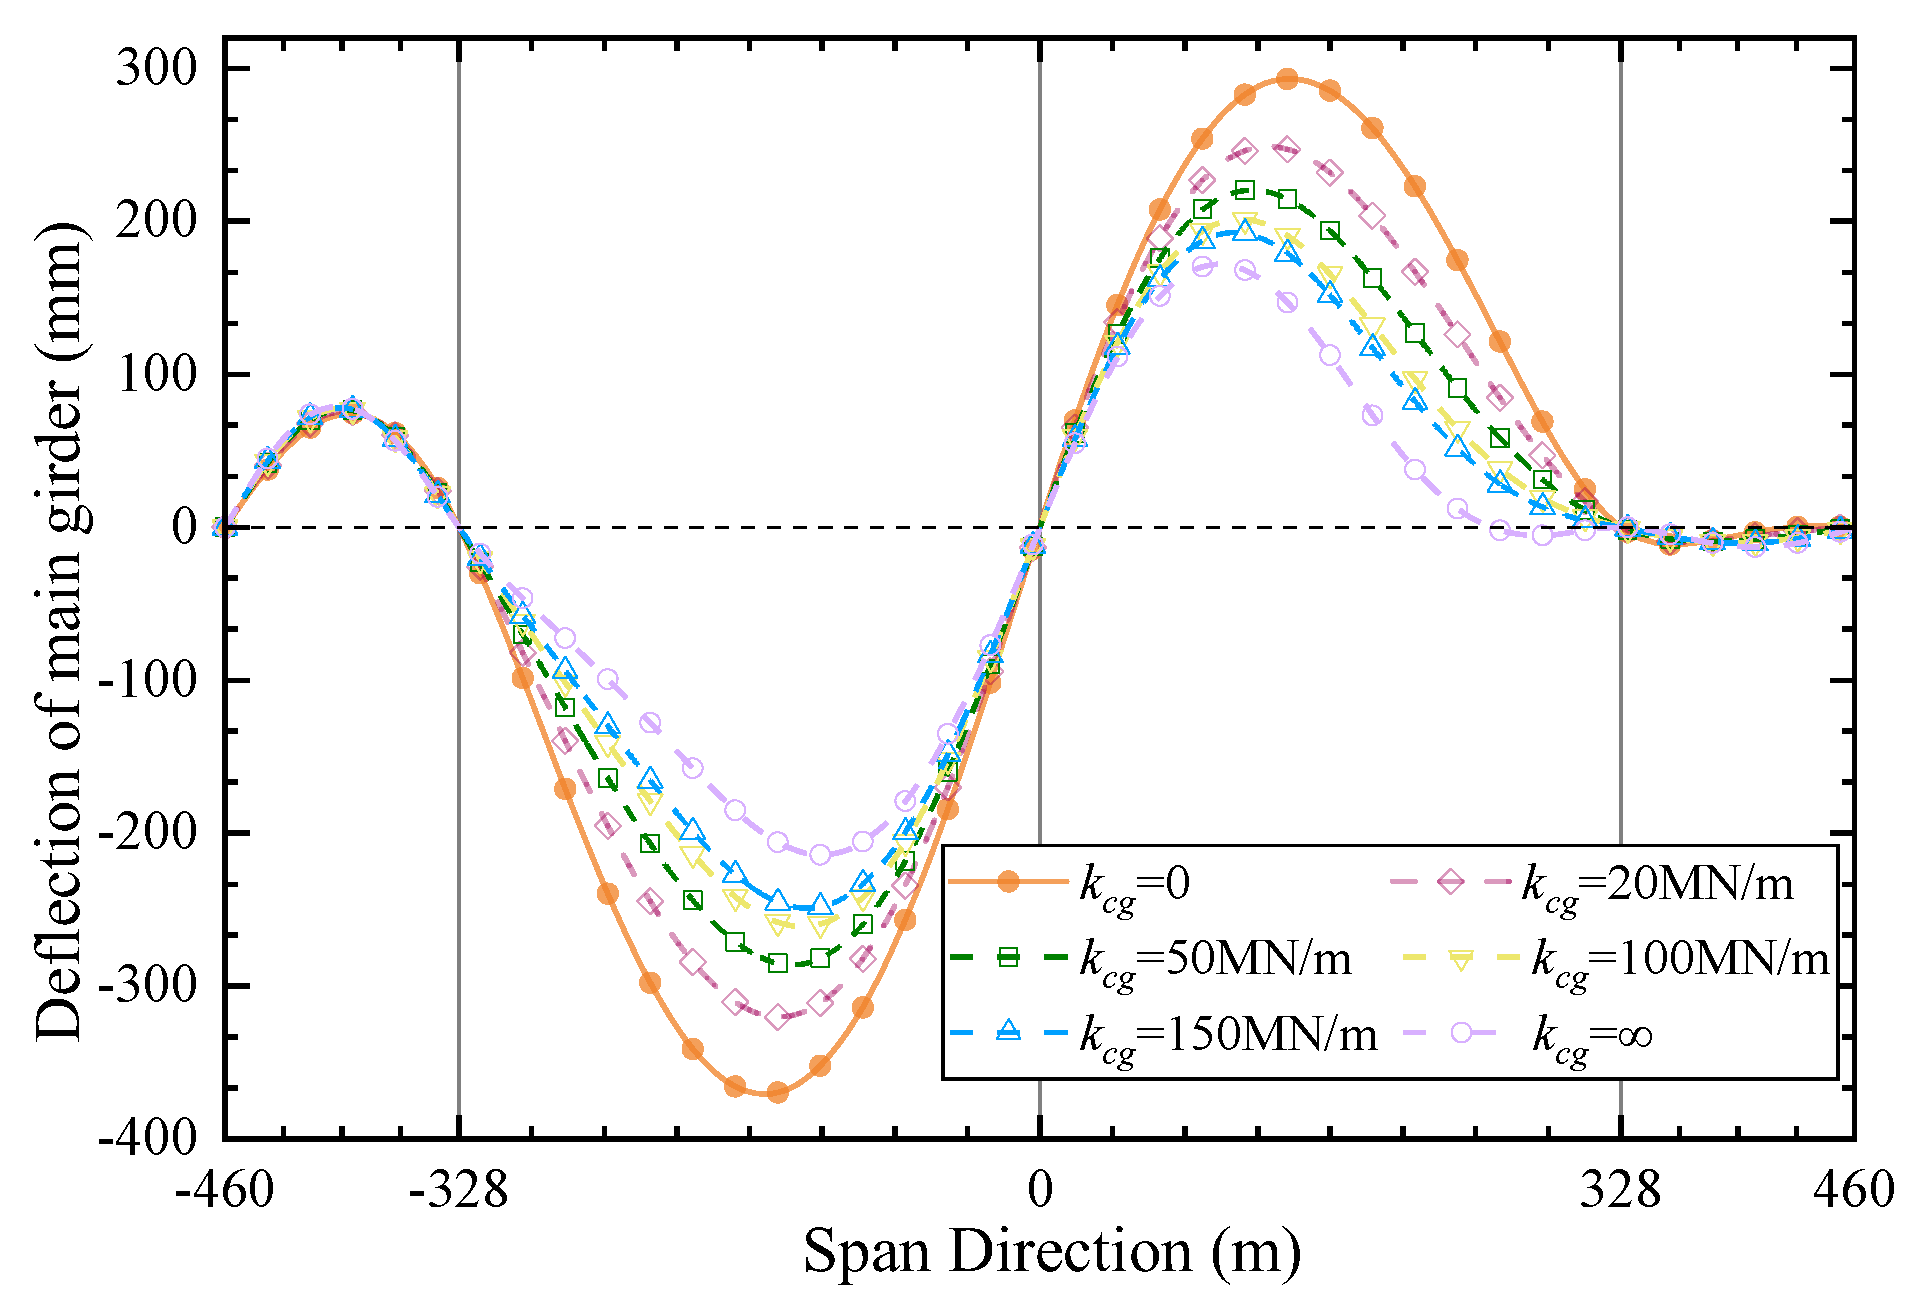
4.1. Stiffness of CGC

Figure 11 shows a comparison of the vertical deflection of the multi-tower self-anchored suspension bridge in response to load scenario LC1 using the suggested model and various CGC stiffness levels. This proves that making the CGC stiffer will make the main beam bend less vertically. For example, from 0 to infinity, stiffness lowers maximum vertical deflection by 42.3%. As the CGC stiffness increases, the maximum displacement location of the main girder progressively moves from the center of the mid-span section to the mid-tower section.
Figure 12 displays, taking into account five distinct CGC stiffness levels, the effect of tower stiffness on the main girder’s movement. Figure 12a shows that a stiffer side tower or mid-tower makes the main beam of a bridge with CGCs move less vertically. The reason is that increasing the tower stiffness directly reduces the live load-induced horizontal displacements at the top. The stiffness of the side and middle towers is equally important to limit girder deflection. However, this effect gradually attenuates with the increase in the stiffness of the CGC.
Figure 12b,c show how the stiffness of the towers affects their lengthwise movement when five different CGC stiffness levels are used. The findings show that the CGC may considerably lessen the center tower’s and side tower’s longitudinal movement, and this impact is particularly pronounced when tower stiffness is low. The reason is that the CGC limits the girder’s and cable’s relative movement, which, in turn, lessens the imbalanced horizontal force acting on the tower’s two sides. In addition, the increase in the stiffness of the side tower will result in a rise in the longitudinal displacement of the mid-tower section, as seen in Figure 12b. Furthermore, the influence rate is not impacted by the stiffness of the CGC side tower. The value increases by nearly 45.9%, 81.2%, 92.7%, 98.4%, and 115.3% in the five CGC forms, respectively, with the stiffness varying from 0.2 to 2.0 times the original. This pattern is comparable to what happens when the mid-tower stiffness influences the side tower’s longitudinal displacement (Figure 12c).

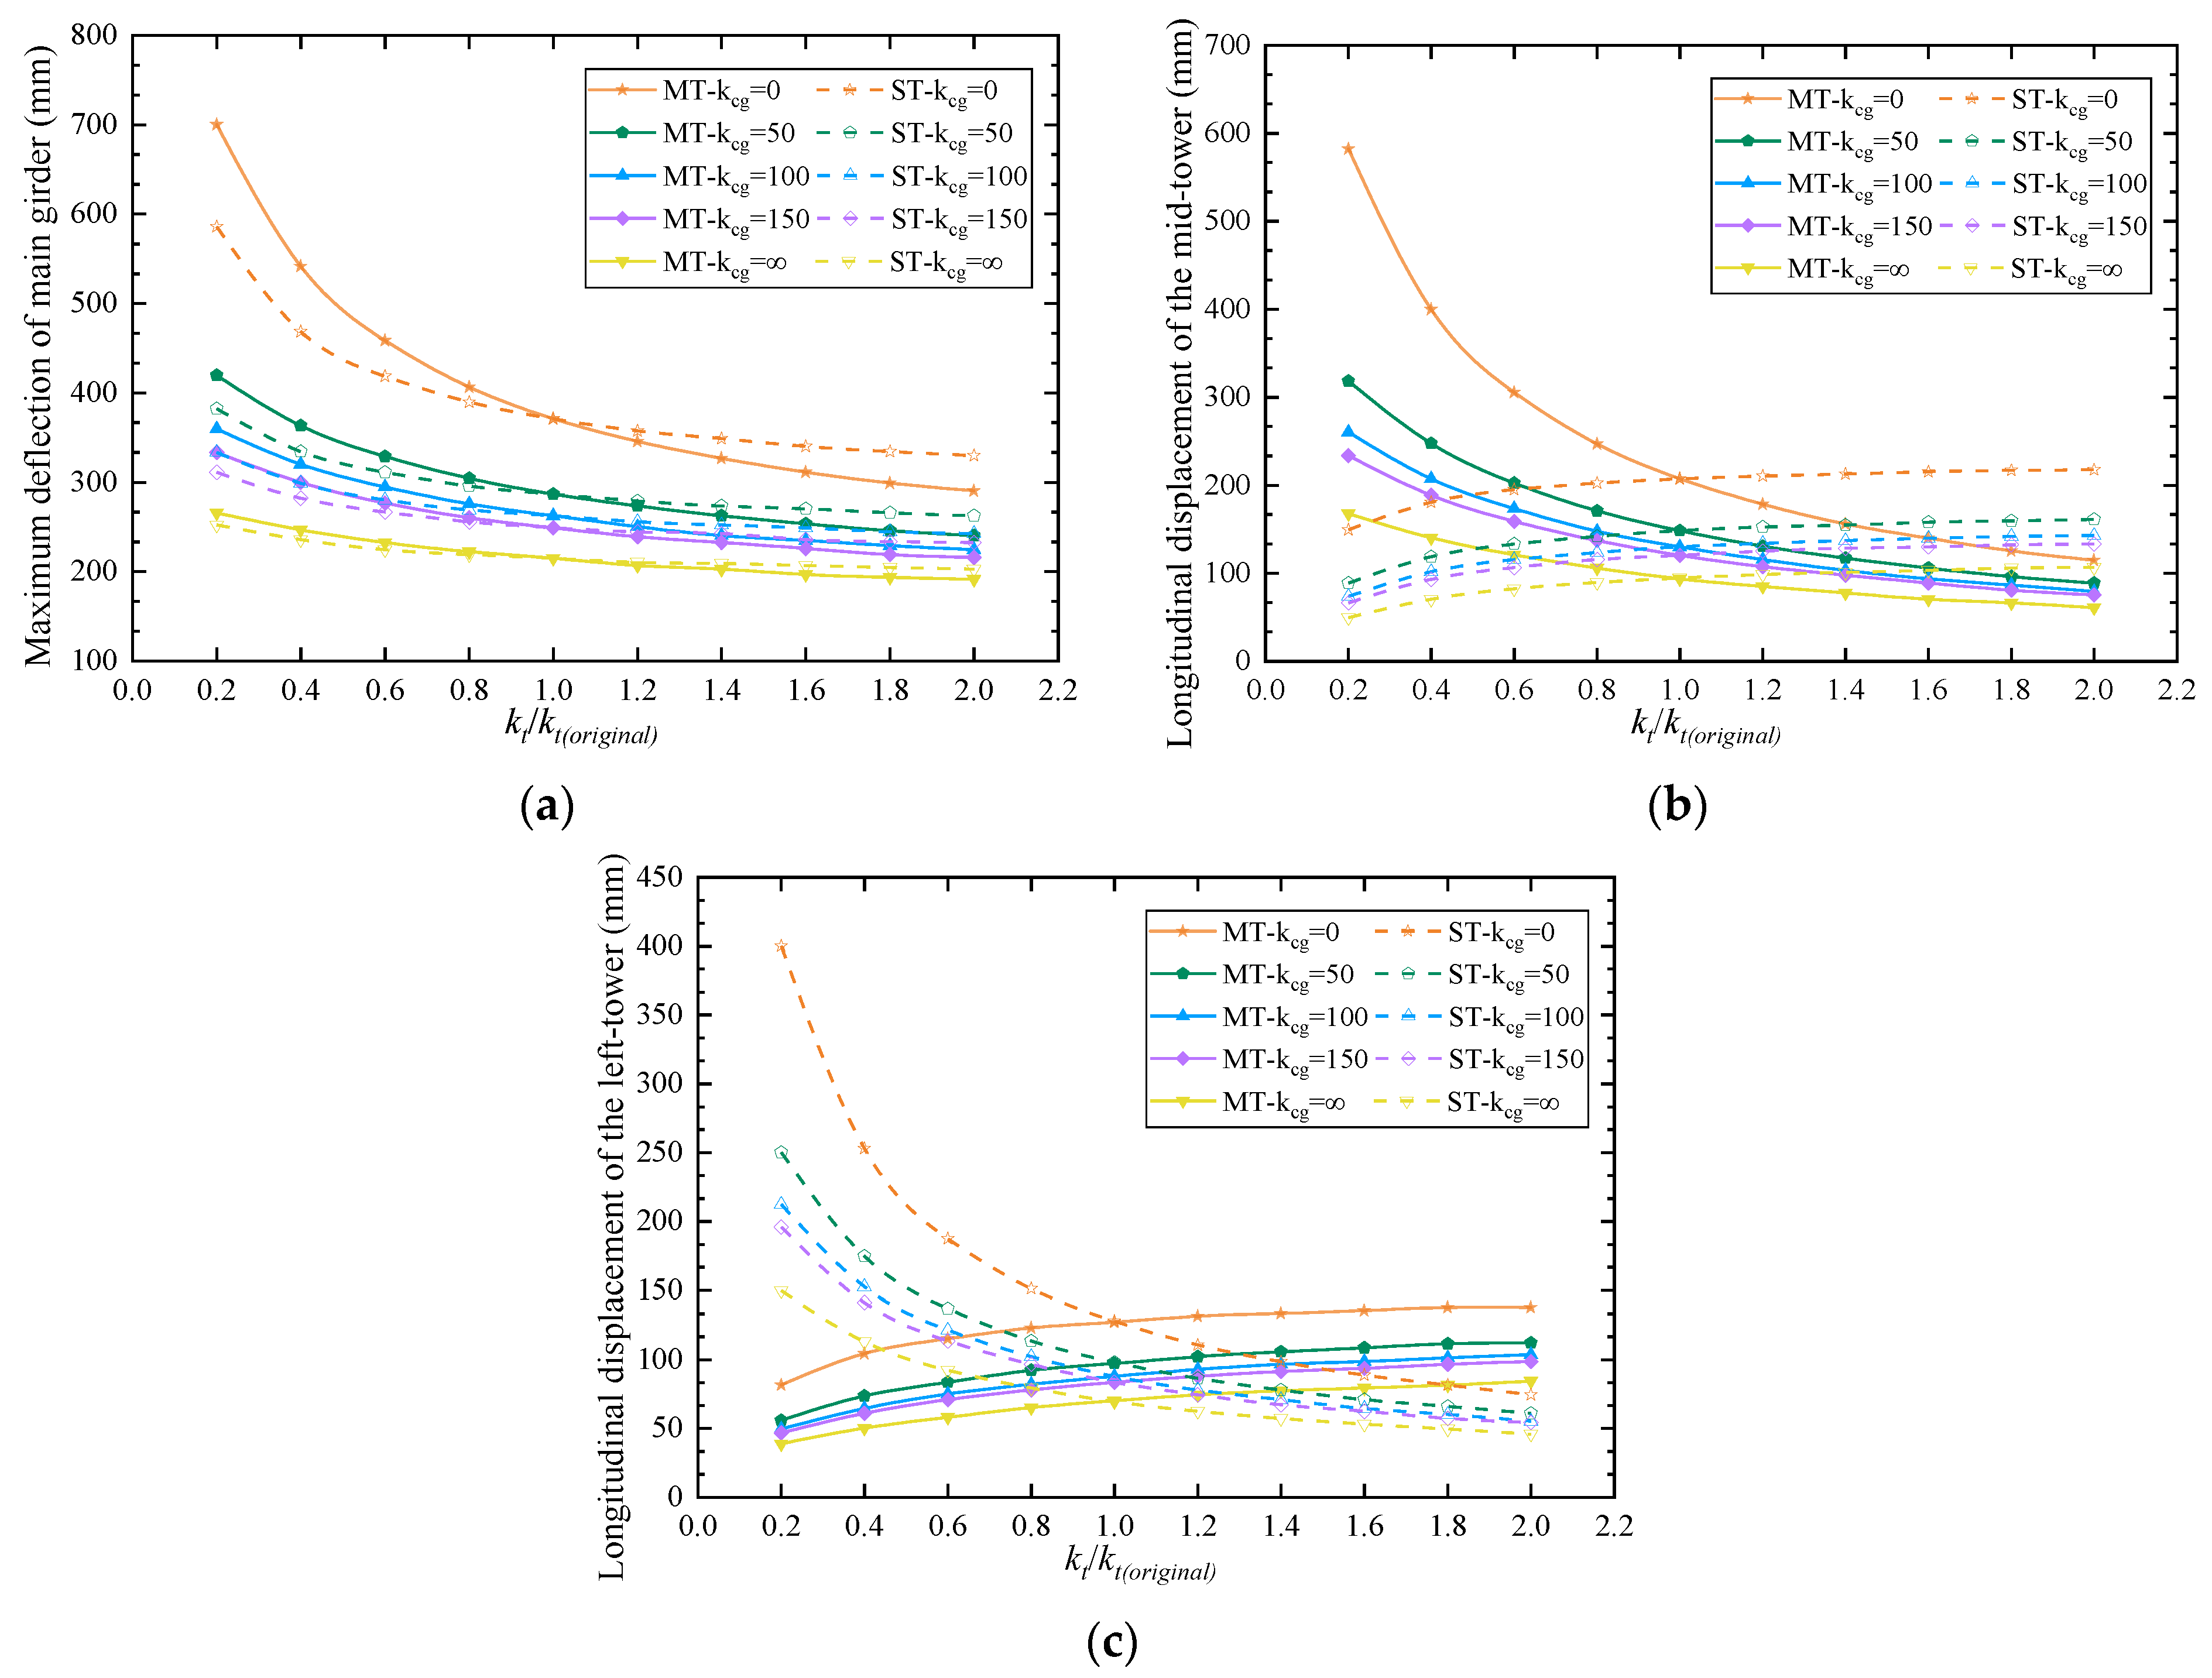
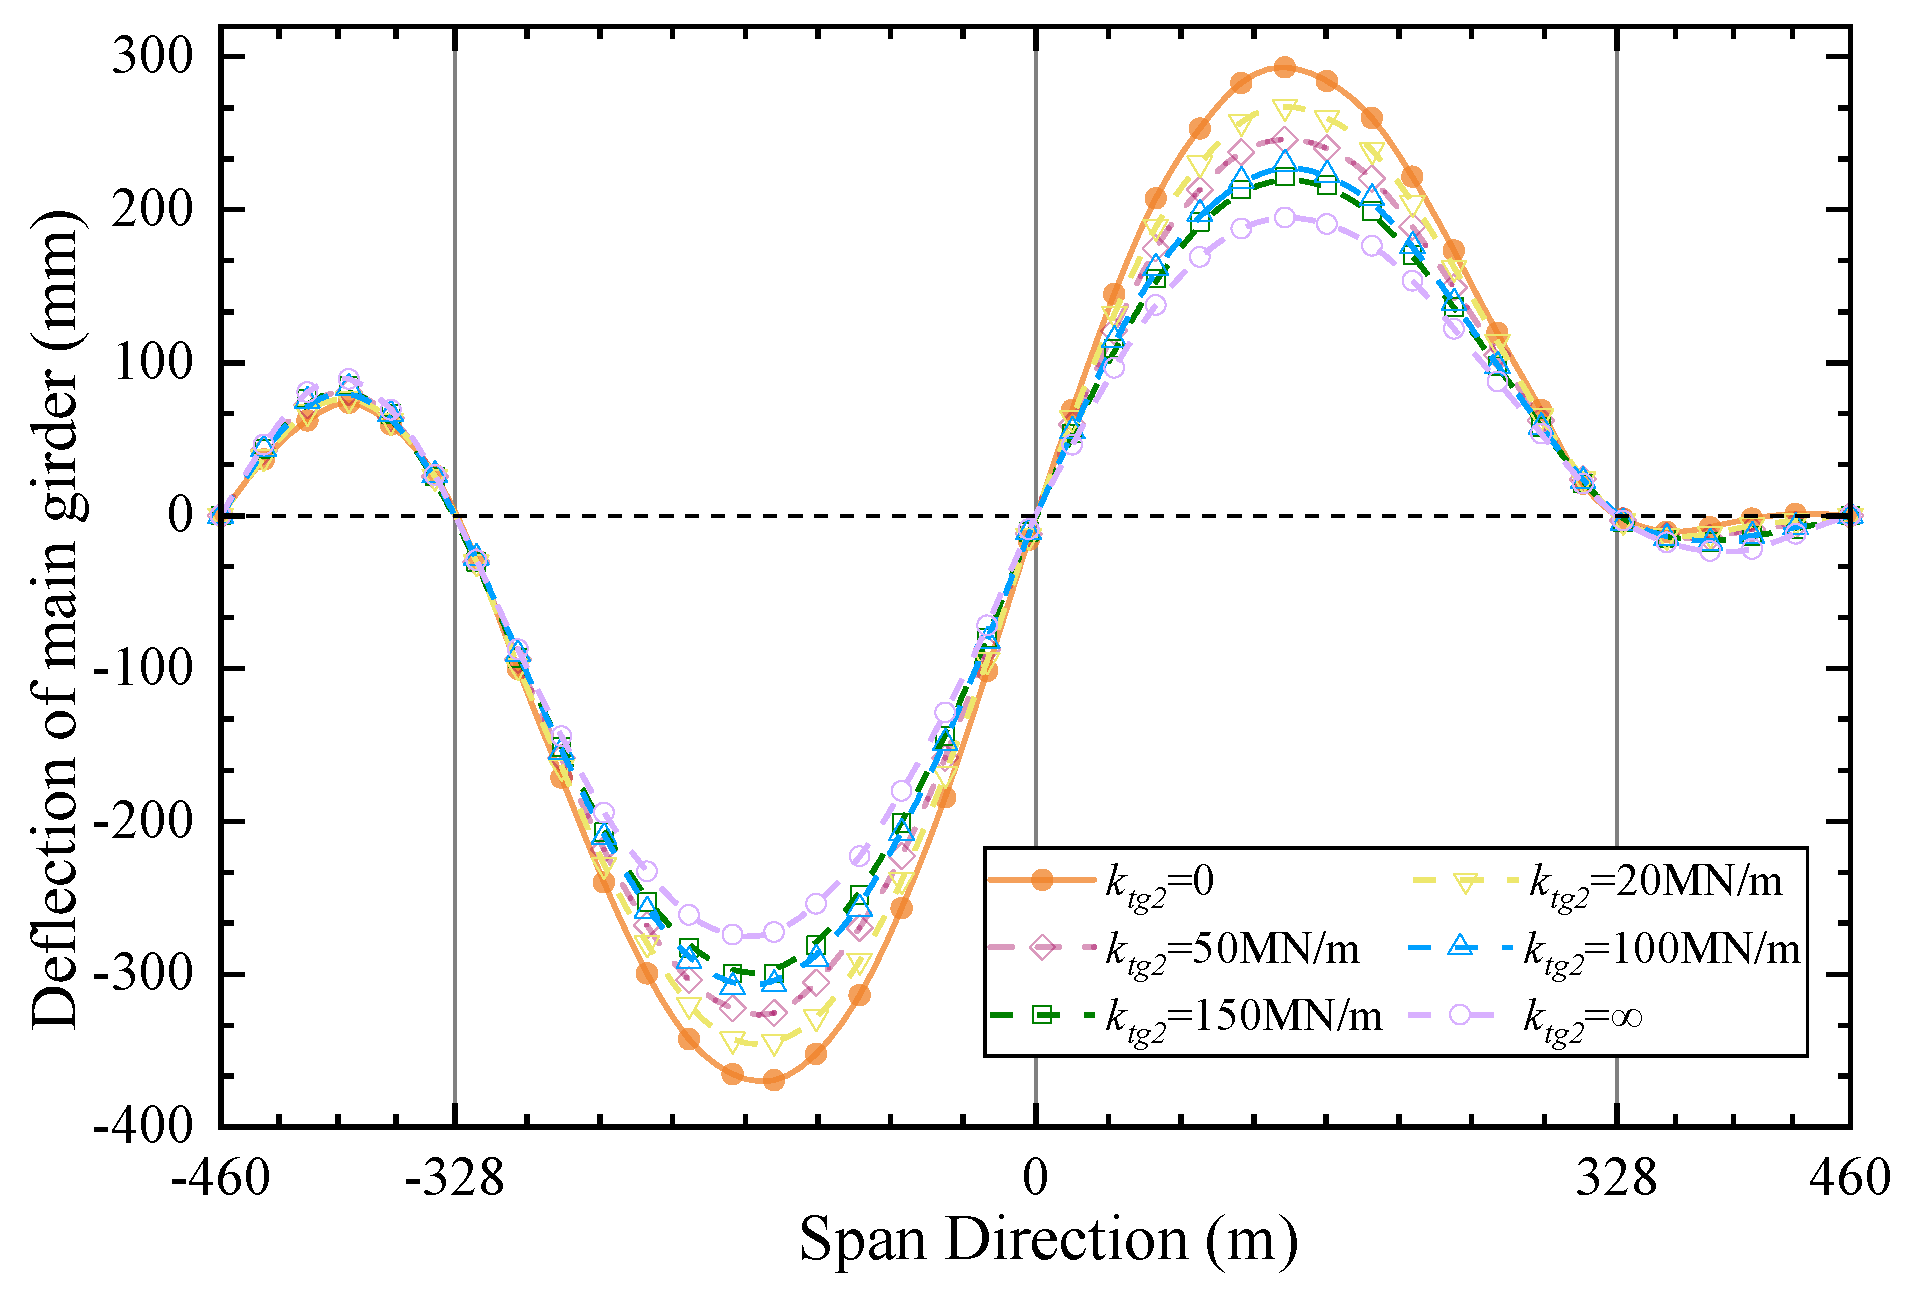
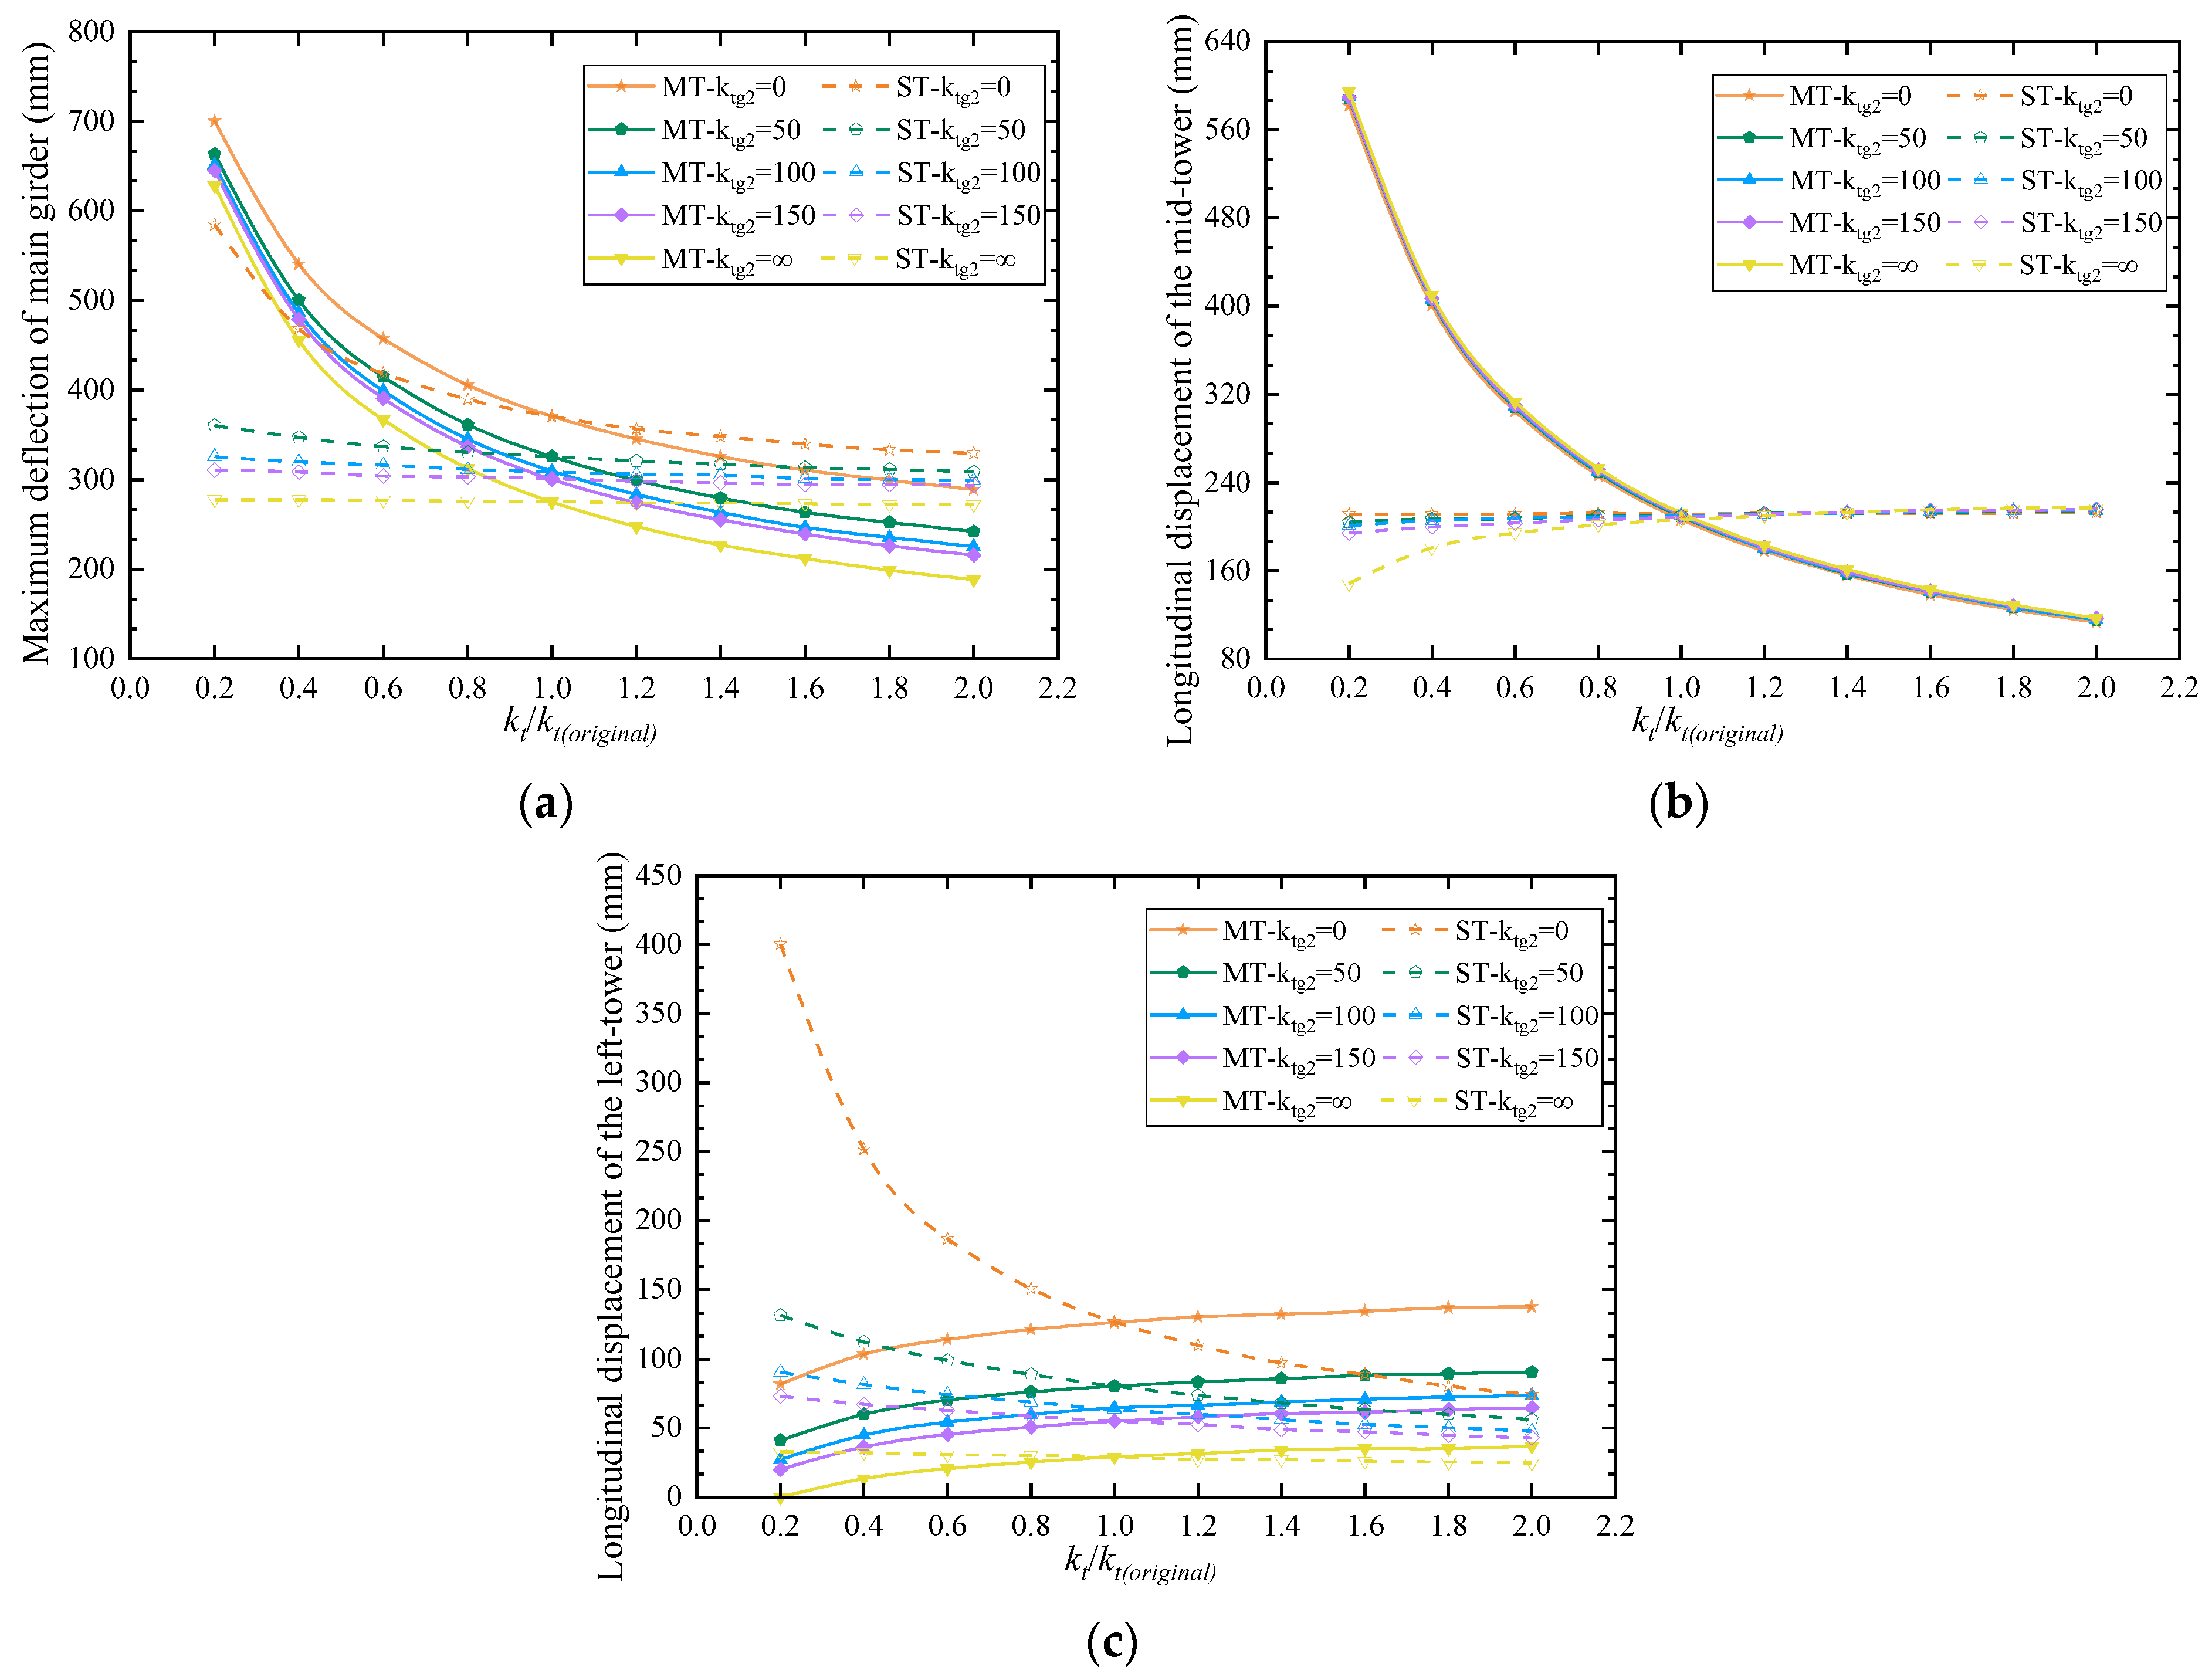
4.2. Stiffness of TGC

The proposed model predicts the vertical bending of the main beam under load case LC1 while taking into account different TGC stiffness levels (Figure 13). This shows that making the TGC stiffer will make the main beam less likely to bend vertically. When the stiffness value increases from 0 to infinity, the maximum vertical deflection decreases by nearly 25.8%.
As shown in Figure 14a, the main girder’s maximum displacement decreased in a way that was not straight, while the mid-tower section’s stiffness went up for all five TGC stiffness levels. When the bridge is constructed without TGC and the side tower’s stiffness is increased, however, this event takes place. Compared to the LFS, the side tower receives a stronger anchoring impact from the mid-tower TGC, which limits the girder’s longitudinal displacement at the anchor locations. The compression deformation of the main girder is the primary source of longitudinal displacement of the anchor points when the TGC stiffness reaches 50 MN/m. Thus, the anchoring effect of the side cable on the side tower no longer significantly changes with the increase in TGC stiffness.
Figure 14b shows how the stiffness of the tower affects the lengthwise movement of the mid-tower section when five different TGC stiffness levels are used. An outcome distinct from the impact of CGC is that, similar to the change in TGC stiffness, increasing the mid-tower stiffness has a comparable effect on decreasing the mid-tower section’s longitudinal displacement. The value is reduced by nearly 80.2%, with the mid-tower stiffness being increased from 0.2 to 2.0 times the original. The lengthwise movement of the mid-tower will only increase if the stiffness of the side tower increases from 0.2 to 1.0 times what it was before for the LFS.
Figure 14c shows a comparison of how the stiffness of the tower affects the side tower’s longitudinal displacement. When the stiffness of the side tower fluctuates between 0.2 and 1.0 times the initial value, the longitudinal displacement of the side tower can be significantly diminished in the LFS. This phenomenon decreases gradually with the increase in the TGC stiffness. For example, when the side-tower stiffness increases from 0.2 to 2.0 times the original value, the longitudinal displacement of the side tower only decreases by 25% with k t g 2 , while the value is 81.3% in the LFS ( k t g 2 = 0 ). Similarly, the increase in the mid-tower stiffness will amplify the longitudinal displacement of the side tower with the CGC. The increasing rate is the same with a fast tendency first and a slow tendency afterward regardless of the TGC stiffness.

5. Conclusions

Based on the deflection theory, this study introduced a unified analytical model for multi-tower self-anchored suspension bridges with tower–girder connections (TGCs) and cable–girder connections (CGCs). The feasibility and effectiveness of the proposed method are verified against the nonlinear FEM using a multi-tower self-anchored suspension bridge with spans of 132 m + 328 m + 328 m + 132 m. The unified analytical model reveals the key influencing parameters of suspension bridges and presents a new method for the structural analysis of suspension bridges. The parametric investigation examines the effect of different stiffness levels of the CGC and TGC on the mechanical performances of multi-tower suspension bridges. The conclusions can be summarized as follows:
  • A multi-tower self-anchored suspension bridge’s equilibrium differential equation, originally derived from the deflection theory, becomes nonlinear when the stiffness of the towers, TGCs, and CGCs is taken into account. In the substitution beam solution procedure, it was found that the addition of CGCs will not result in the discontinuity of the equivalent axial forces along the two main spans. The analytical model results are almost identical to those of the nonlinear FE analyses with a relative deviation of about 10%. The accuracy is mainly affected by the inclination of the hangers, and the application of TGCs and CGCs can limit this shortcoming.
  • By adjusting the main cable’s and girder’s load distribution relationship, the CGC may simultaneously decrease the middle and side towers’ longitudinal displacement. Increasing the stiffness of the CGC will reduce the main girder’s deflection, and the maximum displacement will gradually shift from the mid-span section to the mid-tower section. If the side-tower stiffness is higher, the main beam of the bridge with CGC moves less vertically, which is the same as when the mid-tower toughness is higher.
  • The TGC may effectively augment the anchoring effect of the side cable to the side tower by restraining the longitudinal movement of the anchor points. An increase in side-tower stiffness will decrease the main girder’s deflection and increase the mid-tower section’s longitudinal displacement when the TGC stiffness is minimal. As the stiffness of the TGC rises, this action will weaken. While the mid-tower section’s displacement will be somewhat increased due to the TGC, the side tower’s longitudinal displacement will be reduced.

Author Contributions

Conceptualization, S.L.; Data Curation, D.L. and Y.Z.; Formal Analysis, J.S. and S.L.; Methodology, S.L. and H.C.; Software, S.L.; Validation, D.L. and S.L.; Writing—Original Draft, S.G. and S.L.; Writing—Review and Editing, D.L., S.L. and H.C. All authors have read and agreed to the published version of the manuscript.

Funding

This research received no external funding.

Data Availability Statement

Data are contained within the article.

Conflicts of Interest

Authors Shiyu Guan Yi Zhang and Jun Shi are employed by the China Construction Third Bureau First Engineering Co., Ltd. The remaining authors declare that the research was conducted in the absence of any commercial or financial relationships that could be construed as a potential conflict of interest.

References

  1. Collings, D. Multiple-span suspension bridges: State of the art. In Proceedings of the Institution of Civil Engineers-Bridge Engineering; Thomas Telford Ltd.: London, UK, 2016; pp. 215–231. [Google Scholar]
  2. Pan, S.; Cui, Y.; Zhang, Z.; Zhu, W. Behaviour and design of three-tower, self-anchored suspension bridge with a concrete girder. In Proceedings of the Institution of Civil Engineers-Bridge Engineering; Thomas Telford Ltd.: London, UK, 2019; pp. 190–203. [Google Scholar]
  3. Cheng, J.; Xu, H.; Xu, M. Study on midtower longitudinal stiffness of three-tower four-span suspension bridges with steel truss girders. Struct. Eng. Mech. 2020, 73, 641–649. [Google Scholar]
  4. Zhang, C.; Wu, S. Effects of Non-Uniform Excitation on Seismic Responses of a Multi-tower Self-Anchored Suspension Bridge. J. Vib. Shock 2015, 34, 7. [Google Scholar]
  5. Zhang, Q.; Tang, H.; Yang, G. Selection of a structural system for a three-tower suspension bridge of Maanshan Yangtze River Highway Bridge. Struct. Eng. Int. 2012, 22, 139–143. [Google Scholar]
  6. Xu, F.; Zhang, M.; Wang, L.; Zhang, Z. Self-anchored suspension bridges in China. Pract. Period. Struct. Des. Constr. 2017, 22, 04016018. [Google Scholar] [CrossRef]
  7. Kang, J.; Hu, J.; Dong, P.; Cao, H.; Qin, S. Parametric Analysis of Dynamic Performance of Triple-tower Self-anchored Suspension Bridge. J. Wuhan Univ. Technol. 2017, 41, 543–548. [Google Scholar]
  8. Sun, H.T.; Zhang, D.M.; Shao, C.Y. Design of Main Bridge of Binhe Huanghe River Bridge in Yinchuan. Bridge Constr. 2017, 47, 95–100. [Google Scholar]
  9. Shao, F.; Chen, Z.; Ge, H. Parametric analysis of the dynamic characteristics of a long-span three-tower self-anchored suspension bridge with a composite girder. Adv. Bridge Eng. 2020, 1, 10. [Google Scholar] [CrossRef]
  10. Yoshida, O.; Okuda, M.; Moriya, T. Structural characteristics and applicability of four-span suspension bridge. J. Bridge Eng. 2004, 9, 453–463. [Google Scholar] [CrossRef]
  11. Zhang, W.; Yang, C.; Wang, Z.; Liu, Z. An analytical algorithm for reasonable central tower stiffness in the three-tower suspension bridge with unequal-length main spans. Eng. Struct. 2019, 199, 109595. [Google Scholar] [CrossRef]
  12. General Specifications for the Design of Highway Bridges and Culverts; China Communications Press Co.: Beijing, China, 2015.
  13. Cao, H.; Qian, X.; Zhou, Y.; Chen, Z.; Zhu, H. Feasible range for midtower lateral stiffness in three-tower suspension bridges. J. Bridge Eng. 2018, 23, 06017009. [Google Scholar] [CrossRef]
  14. Fukuda, T. Analysis of Multispan Suspension Bridges. J. Struct. Div. 1967, 93, 63–86. [Google Scholar] [CrossRef]
  15. Chai, S.; Xiao, R.; Li, X. Longitudinal restraint of a double-cable suspension bridge. J. Bridge Eng. 2014, 19, 06013002. [Google Scholar] [CrossRef]
  16. Gimsing, N.J.; Georgakis, C.T. Cable Supported Bridges: Concept and Design; John Wiley & Sons: Hoboken, NJ, USA, 2011. [Google Scholar]
  17. Hasegawa, K.; Kojima, H.; Sasaki, M.; Takena, K. Frictional resistance between cable and saddle equipped with friction plate. J. Struct. Eng. 1995, 121, 1–14. [Google Scholar] [CrossRef]
  18. Zhang, Q.; Cheng, Z.; Cui, C.; Bao, Y.; He, J.; Li, Q. Analytical model for frictional resistance between cable and saddle of suspension bridges equipped with vertical friction plates. J. Bridge Eng. 2017, 22, 04016103. [Google Scholar] [CrossRef]
  19. Zhang, Q.; Wang, Y.; Chen, Z.; Jia, D. Hybrid analytical-numerical method for evaluating the frictional resistance between main cable and saddle. China J. Highw. Transp. 2020, 33, 158–168. [Google Scholar]
  20. Wang, H.; Li, A.; Zhao, G.; Li, J. Non-linear buffeting response analysis of long-span suspension bridges with central buckle. Earthq. Eng. Eng. Vib. 2010, 9, 259–270. [Google Scholar] [CrossRef]
  21. Viola, J.M.; Syed, S.; Clenance, J. The new Tacoma Narrows suspension bridge: Construction support and engineering. In Proceedings of the Structures Congress 2005: Metropolis and Beyond, New York, NY, USA, 20 April 2005; pp. 1–12. [Google Scholar]
  22. Xu, X.; Qiang, S.-Z.; He, S.-H. Influence of central buckle on dynamic behavior and response of long-span suspension bridge under vehicle group excitation. China J. Highw. Transp. 2008, 21, 57–63. [Google Scholar]
  23. Guo, W.; Li, J.; Xiang, N. Seismic performance of the buckling-restrained brace central buckle for long-span suspension bridges. J. Earthq. Tsunami 2018, 12, 1850015. [Google Scholar] [CrossRef]
  24. Li, W.; Wang, Y.; Sun, Y.; Wu, H.; Li, P. Effect of structural connections on three-pylon suspension bridges based on analyzing influence lines. J. Harbin Inst. Technol. 2017, 49, 170–174. [Google Scholar]
  25. Liang, P.; Wu, X.-N.; Li, W.-H.; Xu, Y. Longitudinal Constraint System Optimization for Multi-tower Suspension Bridge. China J. Highw. Transp. 2011, 24, 9. [Google Scholar]
  26. Zhang, C.; Chen, Y.J.; Fang, Z.Z.; Wu, S.P. Influence law of middle tower on mechanical performance of three-tower self-anchored suspension bridge. Adv. Mater. Res. 2013, 684, 134–138. [Google Scholar] [CrossRef]
  27. Gwon, S.-G.; Choi, D.-H. Continuum model for static and dynamic analysis of suspension bridges with a floating girder. J. Bridge Eng. 2018, 23, 04018079. [Google Scholar] [CrossRef]
  28. Jung, M.-R.; Shin, S.-U.; Attard, M.M.; Kim, M.-Y. Deflection theory for self-anchored suspension bridges under live load. J. Bridge Eng. 2015, 20, 04014093. [Google Scholar] [CrossRef]
  29. Chen, Y.-J.; Wang, S.; Zhong, J.-W.; Lian, F. Study on static analytical method of multi-tower self-anchored suspension bridge. Appl. Sci. 2022, 12, 8499. [Google Scholar] [CrossRef]
  30. Liu, S.; Chen, Z.; Cao, H.; Shao, C. An Analytical Model for Three-Tower Self-Anchored Suspension Bridges with Longitudinal Tower-Girder Connections. In Proceedings of the Structures; Elsevier: Amsterdam, The Netherlands, 2023; pp. 1455–1467. [Google Scholar]
  31. Liu, S.; Cao, H.; Chen, Z.; Habib, M.; Zhu, H. Study on Dimensionless Mid-tower Stiffness of Three-Tower Self-Anchored Suspension Bridges Based on an Analytical Approach. In Proceedings of the Structures; Elsevier: Amsterdam, The Netherlands, 2022; pp. 1573–1586. [Google Scholar]
  32. Cao, H.; Chen, Y.; Li, J.; Liu, S. Static characteristics analysis of three-tower suspension bridges with central buckle using a simplified model. Eng. Struct. 2021, 245, 112916. [Google Scholar] [CrossRef]
  33. Choi, D.-H.; Gwon, S.-G.; Yoo, H.; Na, H.-S. Nonlinear static analysis of continuous multi-span suspension bridges. Int. J. Steel Struct. 2013, 13, 103–115. [Google Scholar] [CrossRef]
  34. Irvine, H. Cable Structure (Structural Mechanics); Mit Press: Cambridge, MA, USA, 1981. [Google Scholar]
  35. Wollmann, G.P. Preliminary analysis of suspension bridges. J. Bridge Eng. 2001, 6, 227–233. [Google Scholar] [CrossRef]
Figure 1. Cable system of suspension bridge with CGCs.
Buildings 14 03945 g001
Figure 2. Different types of CGCs on suspension bridges [32].
Buildings 14 03945 g002
Figure 3. An analysis of the cable and girder differential element at different stages: (a) the completed stage; (b) the operational stage.
Buildings 14 03945 g003
Figure 4. A schematic of the main girder with longitudinal tower–cable–girder connections.
Buildings 14 03945 g004
Figure 5. Simplified mechanical comparison of suspension bridge with CGCs.
Buildings 14 03945 g005
Figure 6. Mechanical diagram of each tower with TGCs.
Buildings 14 03945 g006
Figure 7. Substitutional beam method for multi-tower self-anchored suspension bridge. (a) Statically indeterminate structure under live load and equivalent dead load. (b) Basic structure under live load. (c) Basic structure under equivalent dead load.
Buildings 14 03945 g007
Figure 8. The structural and load parameters of the numerical model.
Buildings 14 03945 g008
Figure 9. A comparison of the girder deflection computed from the FEM (the dashed line with hollow symbols) and the proposed method (the solid line with filled symbols): (a) LFS; (b) TGC; and (c) CGC.
Buildings 14 03945 g009
Figure 10. A comparison of the girder moment computed from the FEM (the dashed line with hollow symbols) and the proposed method (the solid line with filled symbols): (a) LFS; (b) TGC; and (c) CGC.
Buildings 14 03945 g010
Figure 11. The influence of the CGC stiffness on girder deflection.
Buildings 14 03945 g011
Figure 12. The influence of tower stiffness on structure performance considering different CGC stiffness levels: (a) the maximum deflection of the girder; (b) the longitudinal displacement of the mid-tower section; (c) the longitudinal displacement of the left-side tower.
Buildings 14 03945 g012
Figure 13. The influence of the TGC stiffness on girder deflection.
Buildings 14 03945 g013
Figure 14. The influence of tower stiffness on structure performance considering different TGC stiffness levels: (a) the maximum deflection of the girder; (b) the longitudinal displacement of the mid-tower section; (c) the longitudinal displacement of the left-side tower.
Buildings 14 03945 g014
Table 1. Calculation formulas of simply supported beams with compression.
ItemDeflectionMoment
Buildings 14 03945 i001 M N sin ε ξ sin ε L ξ * M sin ε ξ sin ε
Buildings 14 03945 i002 M N sin ε ξ sin ε ξ M sin ε ξ sin ε
Buildings 14 03945 i003 q L 2 N 1 ε 2 cos ε 0.5 ξ cos ε / 2 1 ξ ξ 2   q L 2 ε 2 cos ε 0.5 ξ cos ε / 2 1
*   ξ = x / L ;   ξ = L x / L ;   ε = N / E I .
Table 2. Structural and loading parameters of multi-tower self-anchored suspension bridge.
ItemParameterValue
CableCross-sectional area A c 0.2333 m2
Elastic modulus ( E c ) 2 × 10¹¹ N/m2
GirderCross-sectional area ( A b ) 3.5065 m2
Moment of inertia ( I g ) 7.8483 m4
Elastic modulus ( E b ) 2.06 × 10¹¹ N/m2
LoadDead load ( q ) 745.7 kN/m
Live load p 40.32 kN/m
Table 3. A comparison of the longitudinal displacement of the towers.
Connection FormLoad CaseLeft-Side TowerMid-Tower SectionRight-Side Tower
FEM (mm)PM (mm)Error (%) *FEM (mm)PM (mm)Error (%) *FEM (mm)PM (mm)Error (%) *
LFSLC1113.91127.2811.74−177.96−197.5811.0264.8980.3023.75
LC295.05104.6710.12−167.41−186.8111.5973.1488.1420.51
LC330.1428.435.6710.5710.872.84−40.75−39.303.56
LC421.9320.635.9300/−21.93−20.635.93
LC558.8263.768.40−102.56−110.307.5544.2148.549.79
CGCLC171.5169.692.55−97.00−95.002.0625.9525.302.50
LC252.4050.982.71−84.50−83.131.6232.5032.151.08
LC326.4525.643.0612.5411.895.18−39.06−37.543.89
LC419.8818.815.3800/−19.88−18.815.38
LC537.6036.822.07−69.37−68.581.1432.0931.761.03
TGCLC132.5229.299.93−197.80−212.517.44−16.35−17.818.93
LC26.716.089.39−188.97−202.026.91−15.13−16.559.39
LC323.1521.895.448.839.9412.57−47.74−45.834.00
LC421.9320.635.9300/−21.93−20.635.93
LC56.115.726.38−115.27−117.241.71−8.47−8.824.13
*   Error = ( ( F E M ) ( P M ) ) / ( F E M ) × 100 % .
Disclaimer/Publisher’s Note: The statements, opinions and data contained in all publications are solely those of the individual author(s) and contributor(s) and not of MDPI and/or the editor(s). MDPI and/or the editor(s) disclaim responsibility for any injury to people or property resulting from any ideas, methods, instructions or products referred to in the content.

