Article

Deformation Behaviors and Failure Mechanism of Coal Under Various Loading Rates Using Acoustic Emission and Digital Image Correlation

1
Shendong Coal Technology Research Institute, China Energy Shendong Coal Group Co., Ltd., Yulin 719000, China
2
State Key Laboratory of Water Resource Protection and Utilization in Coal Mining, National Institute of Clean and Low Carbon Energy, Beijing 102211, China
*
Authors to whom correspondence should be addressed.
Buildings 2024, 14(12), 3856; https://doi.org/10.3390/buildings14123856
Submission received: 12 November 2024 / Revised: 27 November 2024 / Accepted: 29 November 2024 / Published: 30 November 2024
(This article belongs to the Section Building Structures)

Abstract

:
Coal pillar dams are affected by mining disturbance, which threatens the efficient operation of the underground reservoir. To study the deformation behaviors and failure mechanism of coal pillars under mining disturbance, an acoustic emission (AE) system and a deformation field system were applied to conduct uniaxial compression tests at various displacement rates. The AE characteristics and deformation field evolution of coal were investigated, and the microfailure mechanism was identified. The result shows that the deformation field evolutions are the same under various displacement rates. The increment of accumulated absolute energy near the peak stress rises with the displacement rates. The increase rate of the mean vertical displacement is positively correlated with the displacement rate. The coefficient of variation (CV) of the deformation field can be applied to identify the deformation behaviors of coal and shows the fluctuate–slow increase–rapid increase trend. The distribution ranges of AF (count/duration) and RA (rise time/amplitude) are mainly 0–750 kHz and 0–700 μs/dB. The microfailure mechanism is mainly tensile failure and is accompanied by some shear failure. The percentage of shear failure increases with the increase in the displacement rate. The result provides a reference for the design and stability evaluation of the underground reservoir.

1. Introduction

In Western China’s ecologically fragile mining areas, underground reservoirs have become essential to water and coal resources co-mining technology [1,2,3]. The underground reservoir mainly includes a water storage area (broken rock in goaf), coal pillar dam, artificial dam, and water transmission network, and the coal pillar dam is the crux to ensuring the stable, safe, and efficient operation of the underground reservoir [2,4]. The coal pillar dam is affected by mining disturbances with different strain rates, such as roof caving, mine earthquakes, and water pressure. Thus, it is necessary to analyze coal’s damage and failure behaviors under various loading rates.
Numerous studies have revealed that loading rate significantly influences mechanical properties and deformation behaviors of coal and rock [5,6,7,8], which is significant for the stability and design of underground engineering structures. Wu et al. [5] investigated the influence of low loading rates on dynamic mechanical behaviors of rock joints. Gong and Zhao [6] obtained the tensile mechanical properties of sandstone with different dynamic loading rates. Li et al. [7] evaluated coal’s bursting characteristics with varying loading rates. Wang et al. [8] obtained the acoustic emission (AE) evolution and failure mechanism for fractured sandstone with different loading rates. Dou et al. [9] defined the coal mine loading state with a strain rate based on the in situ test, and the disturbance strain rate ranged from 10−5 to 10−3 s−1. Liu et al. [10] investigated the evolution of AE, infrared radiation, and the deformation field under Brazilian splitting tests with different strain rates (1.0 × 10⁻⁵~1.0 × 10⁻³ s−1).
AE waves are detected during the coal and rock damage process and are usually used to quantitatively obtain the damage and failure characteristics [9,10,11,12,13]. Wang et al. [14] obtained the AE counts evolution and predicted the deformation response. Liu et al. [15] investigated coal’s mechanical response and AE evolution with varying loading rates. Wang et al. [16] predicted the failure time of sandstone using supervised deep learning. Gao et al. [17] studied coal’s failure characteristics and AE evolution after microwave irradiation. Zou et al. [18] analyzed the AE response of semi-circular red sandstone under varying dynamic–static coupling loading conditions. Liu et al. [19] obtained the deformation behaviors, AE spatial evolution, and failure mode of coal in Brazilian splitting tests. Peng et al. [20] investigated rock-like materials’ damage and failure characteristics using infrared thermal imaging and AE. Gao et al. [21] studied the AE and infrared thermal response of phosphorite with varying height-to-diameter ratios. Liu et al. [22] acquired the AE multifractal characteristics of composite samples under triaxial loading conditions. Kong et al. [23] obtained coal’s AE temporal evolution and fractals characteristic in uniaxial compression tests. Digital image correlation (DIC) techniques are widely applied in geotechnical engineering and are mainly used to monitor the surface deformation of rock and soil materials. Lin and Labuz [24] analyzed the fracture characteristics of sandstone based on DIC. Wei et al. [25] obtained the tensile properties and deformation characteristics with varying water content using DIC. Zhang et al. [26] studied the peak strength and crack evolution of single-fissure coal by DIC.
The inner damage and failure evolution can be characterized by the AE technique, which mainly uses the DIC technique to detect the surface deformation field. Considering the superiority of AE and DIC techniques, some scholars analyzed the mechanical response and failure characteristics combined with the AE and DIC techniques. Zhang et al. [27] obtained sandstone beam damage and failure patterns using the DIC and AE methods. Ashraf and Rucka [28] compared the fracture behaviors of two different concrete beams under three-point bending tests by the DIC and AE techniques. Yang [29] studied spatial fracture behaviors and failure modes of granite subjected to uniaxial loading using 3D DIC and AE methods. Xing et al. [30] analyzed the deformation behaviors of sandstone under uniaxial conditions combined with the DIC and AE techniques. Ye et al. [31] investigated the cracking damage pattern of asphalt concrete by the DIC and AE methods. Wang et al. [32] obtained the fracture propagation of sandstone using the DIC and AE methods. Wang et al. [33] investigated the fracture propagation and AE evolution characteristics of coal with various bedding planes using the DIC and AE methods. Mahesh et al. [34] studied the damage evolution of open-hole fiber-reinforced polymer laminate under different loading conditions using the DIC and AE methods.
The AE and DIC methods have widely analyzed the deformation characteristics and fracture evolution, while quantitative analysis of the deformation field and microfailure mechanism has rarely been reported. Meanwhile, the coal pillar dam is subjected to mining disturbance with different strain rates (10−5~10−3 s−1). It is necessary to obtain the damage and fracture behaviors of coal pillar dams under mining disturbance. Thus, uniaxial loading tests were conducted on a coal pillar dam with various displacement rates in this study, and the AE system and deformation field system collected relevant data simultaneously. The deformation evolution, AE characteristics, and deformation field evolution of coal were investigated, and the microfailure mechanism was identified based on the AE signals. The research results provide the basis for the design and stability evaluation of the coal pillar dam.

2. Test Summary

2.1. Specimen Preparation

The coal blocks were collected from the 3−1101 working face of Hongqinghe Coal Mine in the Xinjie Coalfield, Ordos, China. The coal specimens were drilled perpendicular to the bedding plane, and the dimensions were 100 mm in height and 50 mm in diameter. To monitor the surface deformation, the surface of coal specimens was sprayed to obtain speckles (Figure 1).

2.2. Testing System

As illustrated in Figure 2, an electronic universal testing machine (Model: MTS e45.305), a deformation field system (Model: ISM-2 D), an AE system (Model: PCI-Express 8), and a strain collecting system (Model: SIRIUS) were employed to acquire the deformation and failure signals during the loading process. The maximum load and test speed of the electronic universal testing machine are 300 kN and 254 mm/min, and the acquisition frequency of the strain collecting system is up to 1 MHz. The maximum resolution of the deformation field system is 4096 pixels × 3000 pixels. The AE system includes the main engine, AE sensors, amplifier, and wires; a detailed description can be found in the previous study [10].

2.3. Experimental Methods

Based on previous studies [9,10], the range of disturbed strain rate is 10−5 s−1~10−3 s−1 during the coal mining process. It is not conducive to data collection during the test if the displacement rate exceeds 6.0 mm/min (1.0 × 10⁻³ s−1). Thus, the displacement rates were selected as 0.2 mm/min (3.3 × 10⁻⁵ s−1), 0.6 mm/min (1.0 × 10⁻⁴ s−1), 1.0 mm/min (1.7 × 10⁻⁴ s−1), and 3.0 mm/min (5.0 × 10⁻⁴ s−1), and the coal specimens were separated into four groups according to the four different displacement rates. The resolution and acquisition frequency of the deformation field system were set to 1600 pixels × 1200 pixels and 100 Hz, and the acquisition frequency of the strain monitoring system was 10 Hz. The AE system’s threshold and acquisition frequency were fixed at 45 dB and 1 MHz. Before each test, the specimen was placed between the two press heads, and Vaseline was applied to both ends of the specimen to reduce friction. Two strain gauges and six AE sensors were fixed on the specimen surface, then the electronic universal testing machine, strain collecting system, deformation field system, and AE system were synchronized, and the test data were recorded simultaneously.

3. Results and Discussion

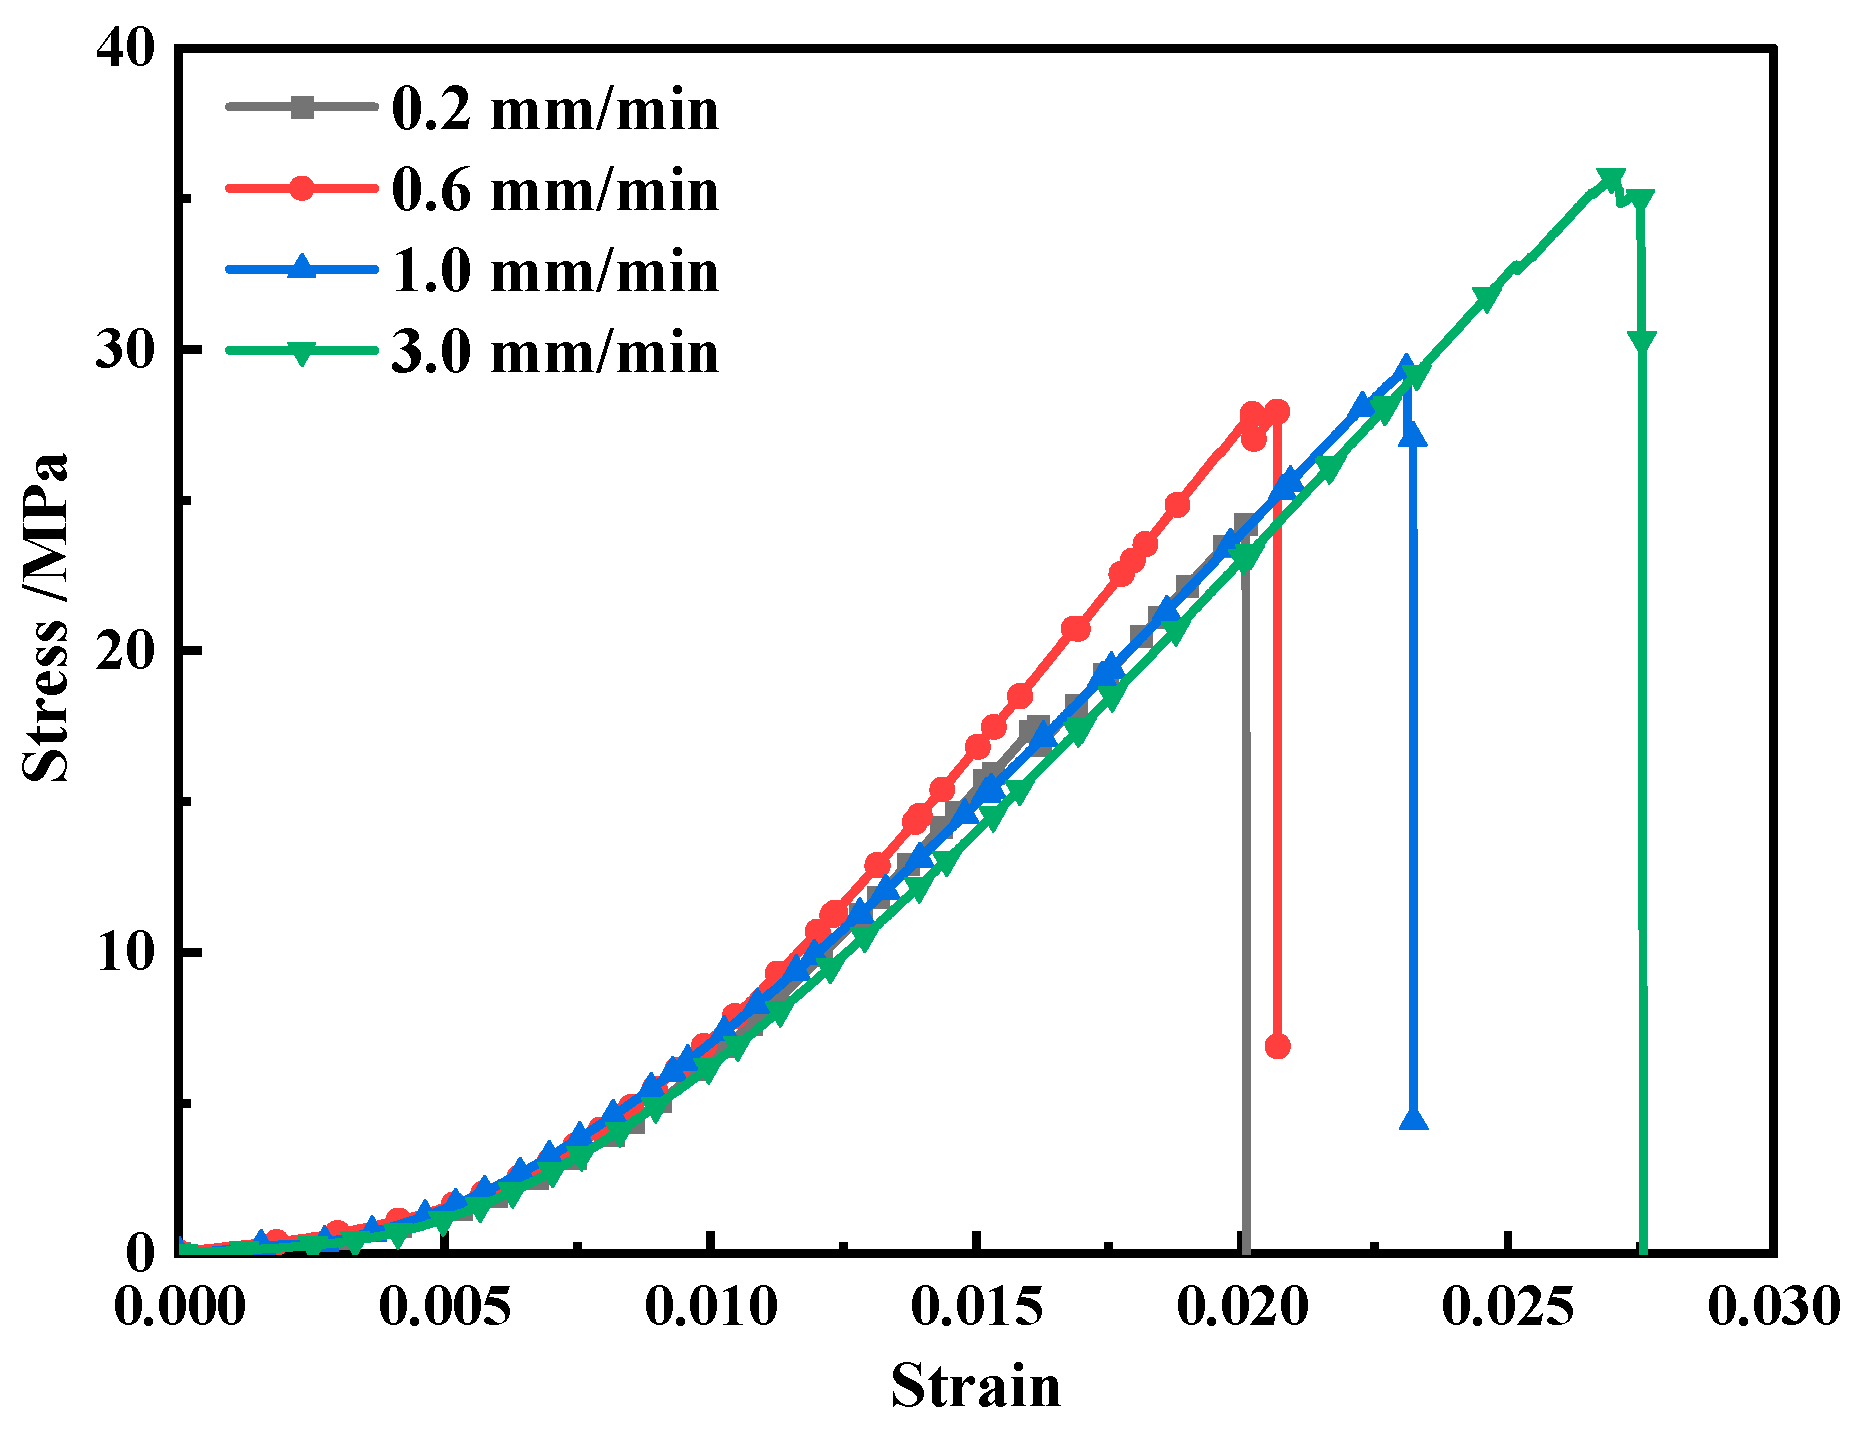
3.1. Stress–Strain Characteristics

As illustrated in Figure 3, the stress–strain curves of typical coal specimens at various displacement rates show the same trend in deformation and fracture behaviors, which shows elastic–brittle failure. The pre-peak deformation and fracture process can be separated into four phases [35] (Figure 4): fissures and pores compaction phase (Phase I), microcrack initiation phase (Phase II), microcrack steady propagation phase (Phase III), and microcrack unsteady propagation and coalescence phase (Phase IV). During Phase I, the stress–strain curve shows a concave trend due to the closure and compaction of primary fissures and pores. In Phase II, the stress rises linearly with the increasing strain, and a few microcracks are initiated. During Phase III, the stress rises approximately linearly with the growing strain caused by the initiation and propagation of microcracks. The curve is convex due to the microcrack’s coalescence and macrocrack initiation at Stage IV. During the post-peak phase (Phase V), the stress drops suddenly, and the specimen bursts. Meanwhile, the failure strain and uniaxial compressive strength are positively correlated to the displacement rates, consistent with the existing studies [7,15]. However, there is stress adjustment near the peak stress at 0.6 mm/min and 3.0 mm/min, which is caused by the local failure.

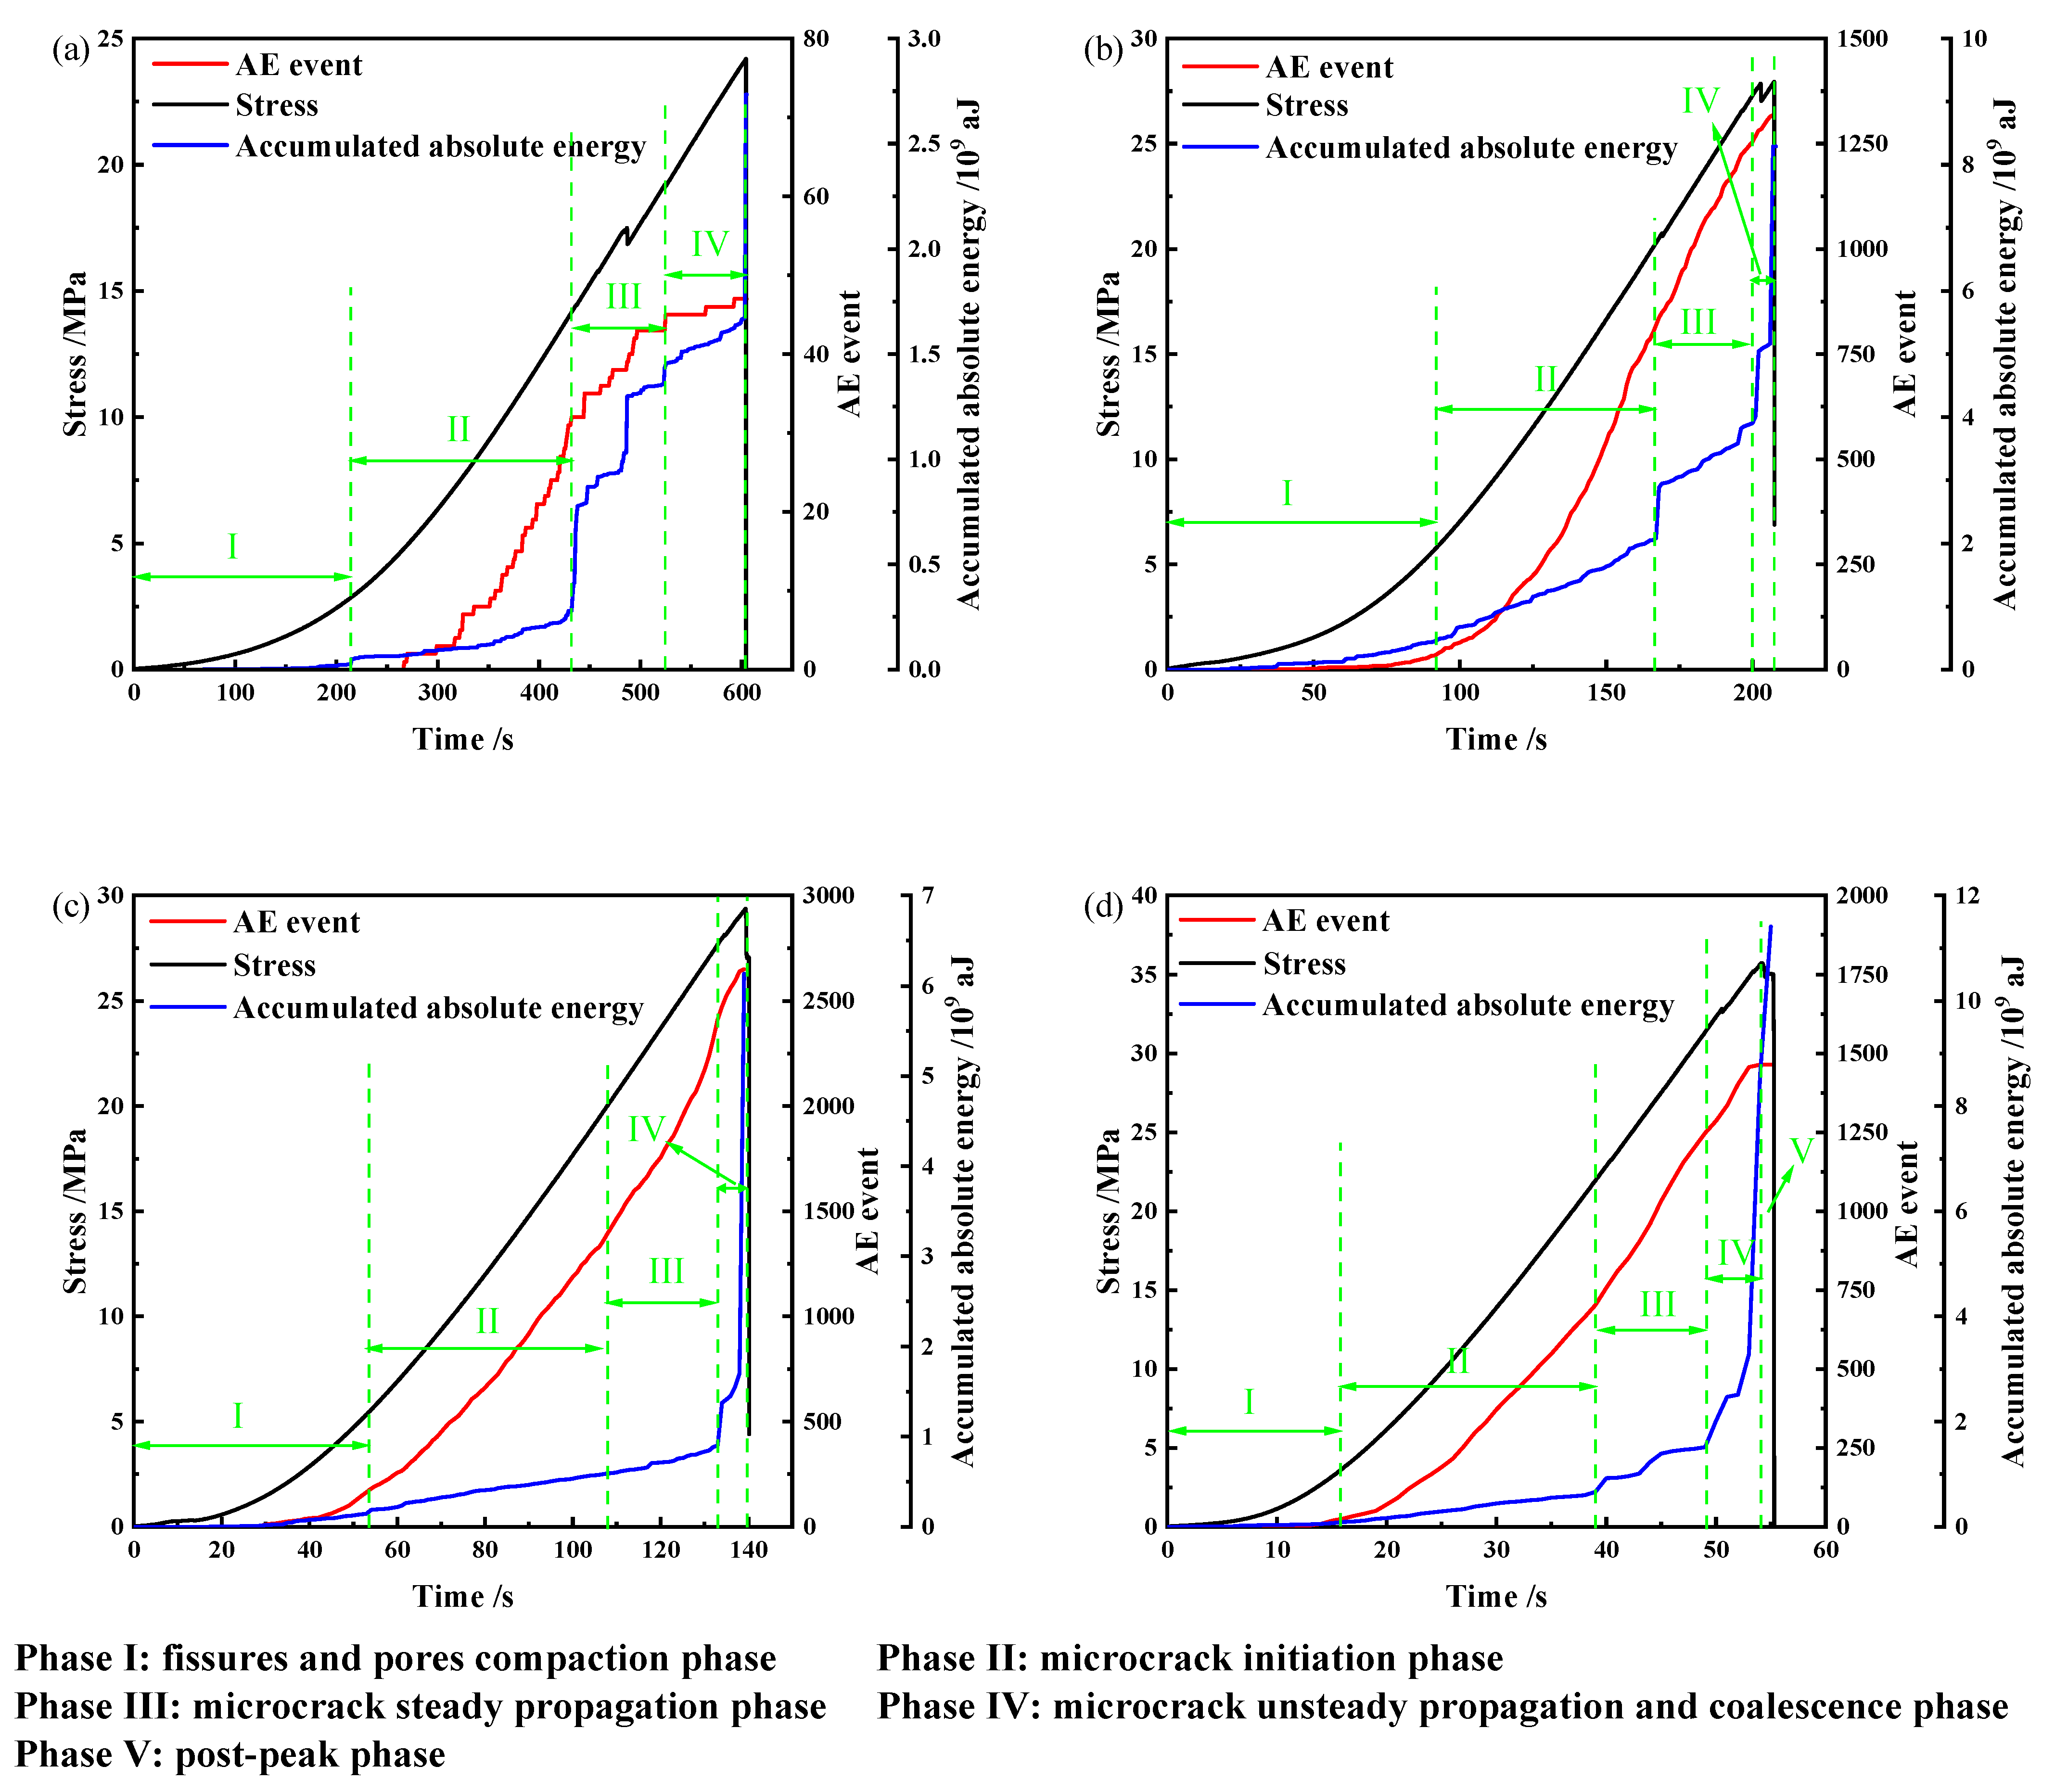
3.2. AE Evolution Characteristics

AE characteristic parameters (AE event and absolute energy) were obtained based on the AEwin for Express-8 Software, which can be characterized by the damage and failure process [10,11,12,13]. The AE absolute energy (unit: aJ) refers to the time integral of the square of the sensor signal voltage (without amplification), divided by a 10 kΩ impedance. As illustrated in Figure 4, the evolution patterns of the AE event and accumulated absolute energy under various displacement rates show the same trend, which is consistent with the existing research [15,35]. The pre-peak damage process can also be separated into four phases. At Phase I, the AE event and accumulated absolute energy stay low and increase slowly, caused by the closure and compaction of primary fissures and pores. During Phase II, a few microcracks are initiated, and the AE event and accumulated absolute energy rise slowly. Then, the AE event and accumulated absolute energy rise rapidly caused by the initiation and propagation of massive microcracks at Phase III. During Phase IV, the AE event and accumulated absolute energy increase rapidly due to the large numbers of microcracks coalescence and macrocracks initiation. During the post-peak phase, the AE event and accumulated absolute energy increase slowly. However, the increment of accumulated absolute energy near the peak stress is 1.06 × 10⁹ aJ at 0.2 mm/min, while the increment is 8.12 × 10⁹ aJ at 3.0 mm/min. The result shows that the increment of accumulated absolute energy near the peak stress rises with the displacement rates. Generally, the more energy is released near the peak stress, the more serious the instability and failure increase, which is consistent with the existing research [7]. Thus, the risk of instability of coal pillar dams increases at a high strain rate, and measures should be taken to avoid strong mining disturbance. Therefore, the underground reservoir should be far from the fault structures and strong disturbance areas to avoid strong mining disturbance.

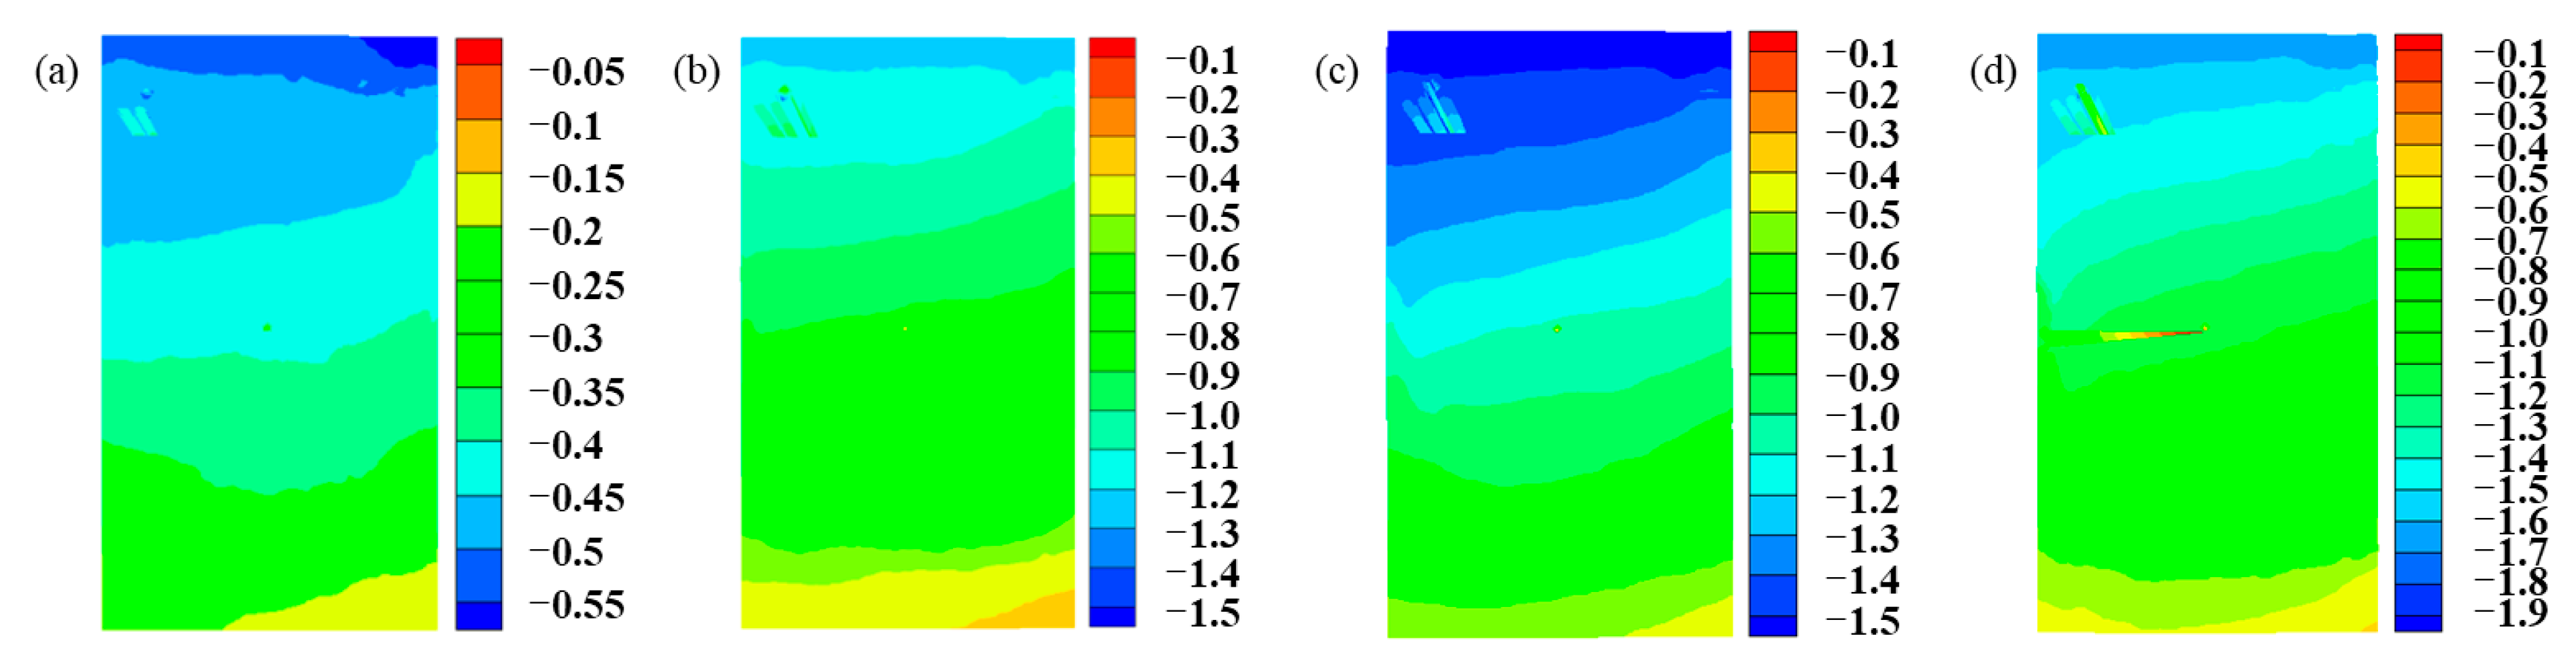
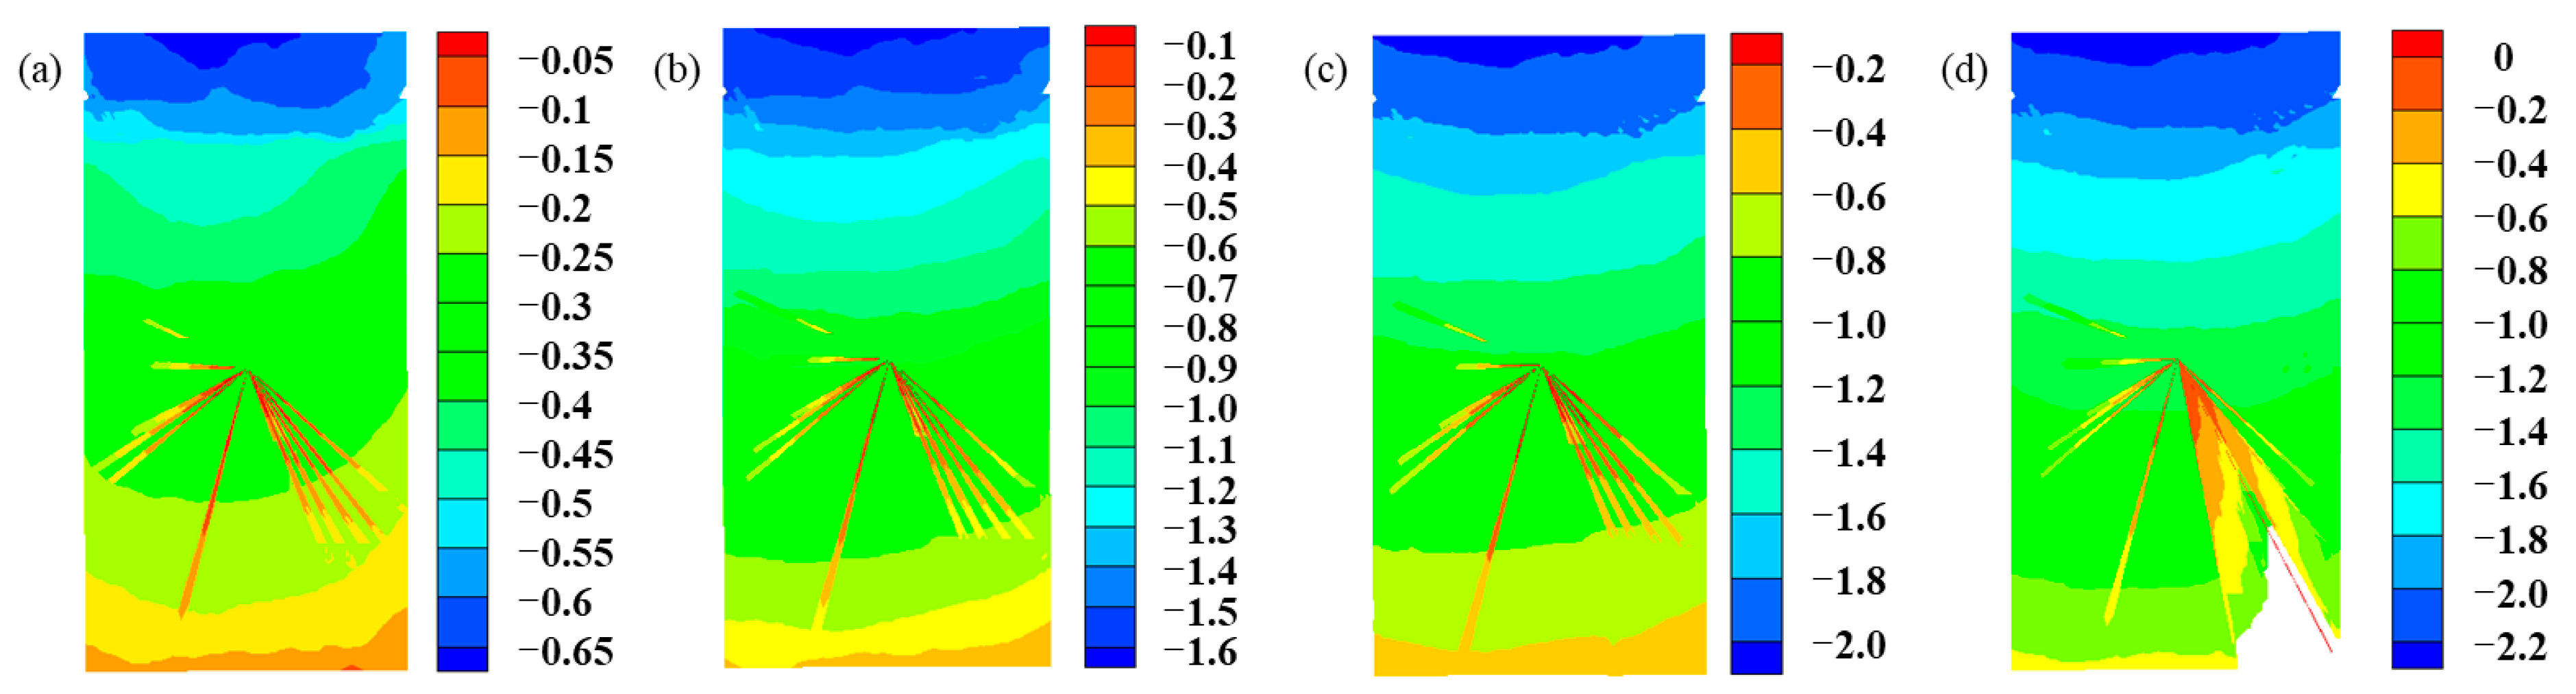
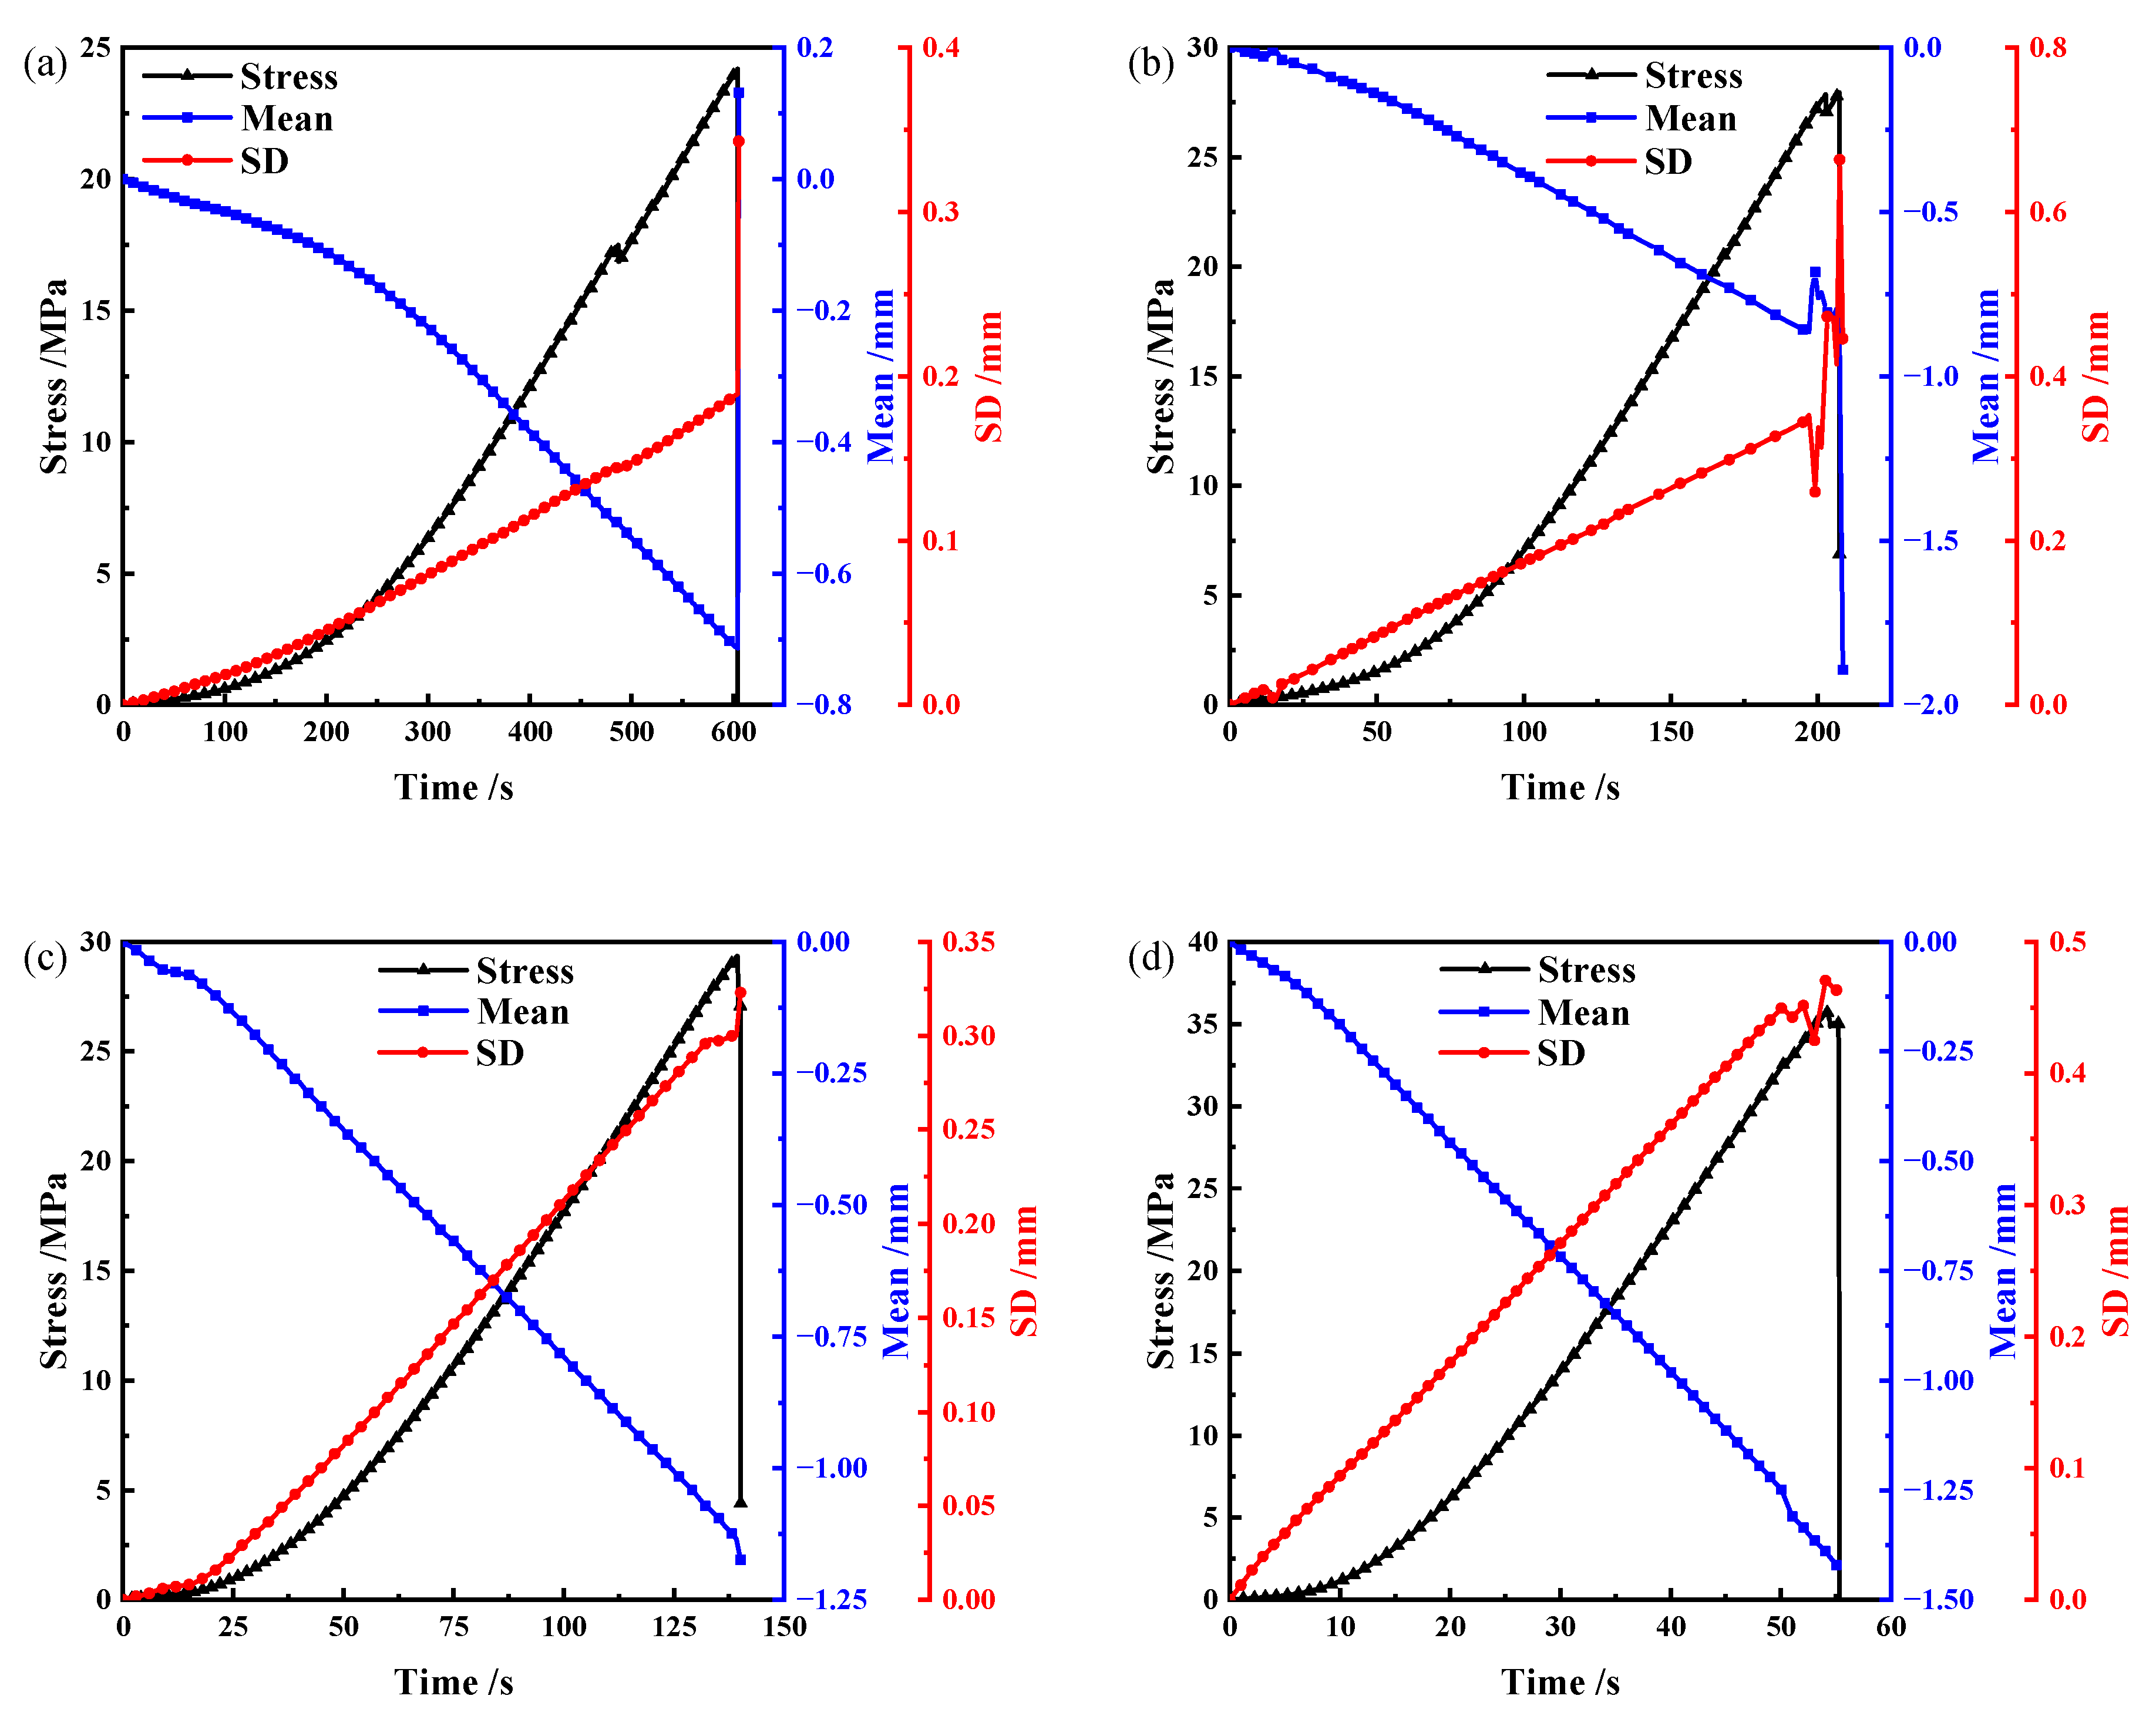
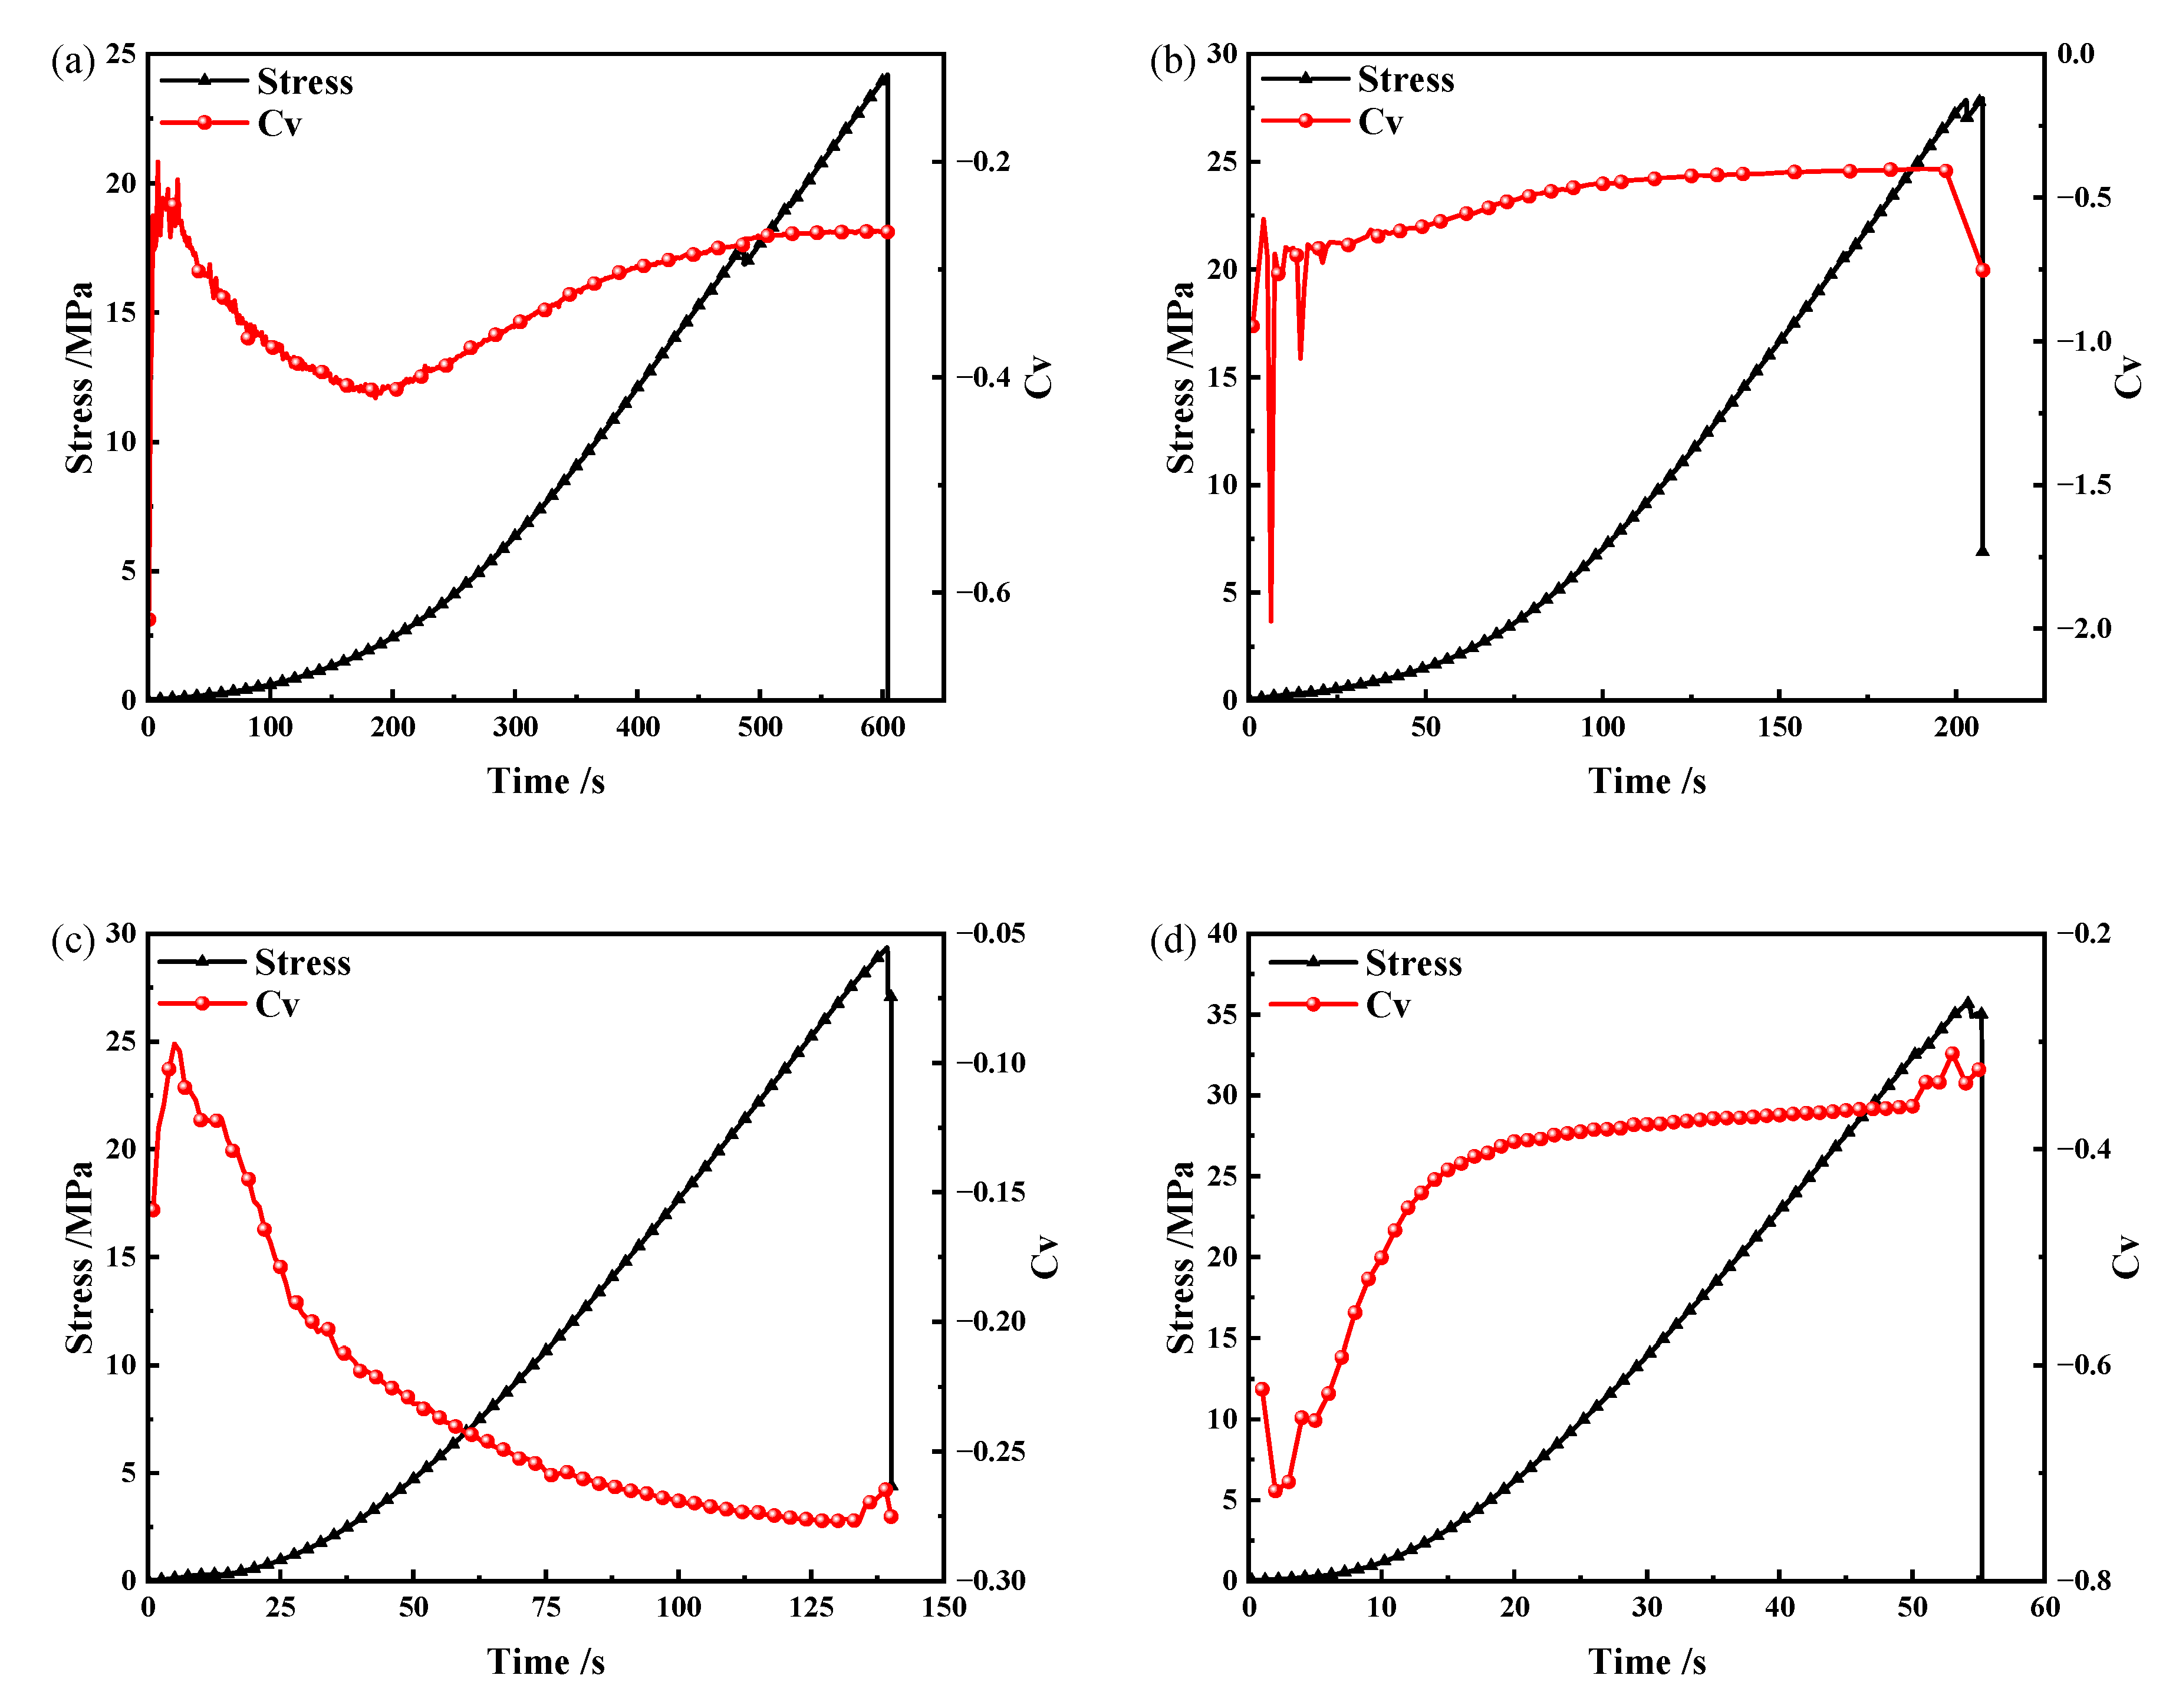
3.3. Deformation Field Evolution

Microcracks occur in inner coal rock under external load. When a particular load is reached, microcracks expand along one or more regions, and nonuniform deformation and deformation localization zones appear, making the localization zone’s deformation different from other regions. The initiation and propagation of the deformation localization zone are closely related to the damage and fracture process of the coal and rock samples. Therefore, the deformation field analysis is conducive to further understanding rock and coal’s damage and fracture process [24,25,26].
The surface speckle image without load is selected as the reference image, then a rectangular selection is established along the contour of the coal sample, and the cloud map of the deformation field during the whole loading process is calculated and drawn using the DIC method. According to Section 3.2, the damage and fracture process can be separated into five phases, and there are apparent distinctions in damage and failure characteristics at various stages. Figure 5, Figure 6, Figure 7 and Figure 8 show the evolution cloud map of the vertical deformation field at the end of each stage under various displacement rates. The vertical displacement is negative in the downward direction and positive in the upward direction. As illustrated in Figure 5, Figure 6, Figure 7 and Figure 8, the evolutions of the vertical deformation field are the same under various displacement rates. Due to the heterogeneity and anisotropy of the inner structure of the coal samples, the vertical deformation under external loads is significantly different. The deformation field shows nonuniform evolution at Phase I, and the maximum deformation is 0.28, 0.70, 0.55, and 0.65 mm, respectively. The vertical deformation increases to 0.80, 1.10, 1.50, and 1.60 mm during Phase II, caused by the elastic deformation and microcracks initiation. The vertical displacement rises to 1.20, 1.80, 1.90, and 2.20 mm during Phase III and IV due to the microcracks coalescence and macrocracks initiation. When entering the post-peak failure stage, the deformation localization zone and macrocracks appear, the samples burst instantaneously, and the speckle field is destroyed.
The vertical displacement is generally downward, and the displacement at the top is more significant than that at the bottom. Due to the high brittleness and strong impact tendency of the coal sample in this study, some fragments burst out during the deformation and failure process, resulting in partial scattered spots failure and “radial” displacement (Figure 6 and Figure 8). However, there are distinctions in vertical deformation fields of the coal samples under different displacement rates. At the displacement rates of 0.2, 0.6, 1.0, and 3.0 mm/min, the maximum vertical displacements are 1.2, 1.8, 1.9, and 2.2 mm, respectively. Therefore, the maximum vertical displacement is positively correlated with the displacement rate.
Because of the high anisotropy and heterogeneity of the coal samples, significant distinctions exist in fissures, pores, beddings, and other structures, and the evolution of the deformation field shows strong nonuniformity. The mean displacement can directly reflect the overall deformation field of the observed surface of the coal samples and quantitatively describe the evolution characteristics of the deformation field. In the deformation field system, a rectangular selection is established along the contour of the coal sample, and the displacement information in the rectangular selection is calculated and saved in the form of a matrix. According to the infrared radiation temperature field [36], the matrix ft(x,y) expression of the vertical deformation field at any time (t) is as follows:
f t ( x , y ) = [ f t ( 1 , 1 ) f t ( 1 , 2 ) f t ( 1 , L y ) f t ( 2 , 1 ) f t ( 2 , 2 ) f t ( 2 , L y ) f t ( L x , 1 ) f t ( L x , 2 ) f t ( L x , L y ) ]
where x and y are the row and column numbers of ft(x,y), and Lx and Ly are the maximum row and column numbers of x and y, respectively. The elements in the displacement field matrix are the vertical displacements of the coal sample at that position, thus forming the spatial distribution of the vertical displacement field of the coal sample at any time.
Based on the statistics, the expression of mean surface displacement (Mean) at any time (t) is as follows:
M e a n t = 1 L x L y x = 1 L x y = 1 L y f t ( x , y )
As illustrated in Figure 9, the mean vertical displacement evolutions of the coal samples with various displacement rates are the same. In the initial stage (Phase I), the mean vertical displacement is near 0 and increases slowly, mainly because the primary defects such as internal fissures and pores are closed and compacted, and the mean vertical displacement is small. With the increase in load, the mean vertical displacement continues to increase during Phase II and III. The mean vertical displacement rises rapidly near the peak load (Phase IV), and some coal samples have sudden displacement drops after the peak load. However, some distinctions exist in the evolution characteristics of the mean displacement under various displacement rates. The maximum mean vertical displacement for the overall vertical deformation field is 0.70, 1.87, 1.22, and 1.42 mm, which is inconsistent with the maximum vertical displacements. The increase rate of the mean vertical displacement is 0.001 mm/s at the displacement rate of 0.2 mm/min, while the increase rate is 0.026 mm/s at 3.0 mm/min. The increase rate of the mean vertical displacement is smaller than the displacement rate, mainly because there is no deformation in the local region of the coal sample during the loading process, and the positive and negative displacements will cancel each other. The phenomenon indicates that the faster the loading rate, the quicker the internal deformation rate of the coal sample, so the corresponding mean vertical displacement increase rate is faster.
During the deformation and fracture process, due to the heterogeneity of the internal structure, positive and negative displacements occur in various zones of the coal sample surface, and these two opposite displacements will cancel each other, resulting in the mean surface displacements not genuinely reflecting the deformation and fracture process of the coal sample [10,11]. Due to the nonuniform deformation and fracture of the coal samples under the external loads, the deformation localization zone occurs. The initiation and propagation of the deformation localization zone are closely correlated with the damage and fracture process of the coal samples. Standard deviation (SD) is commonly applied to calculate the deviation between each data sample and the population mean value of the data sample. If the sample value significantly deviates from the population mean, the sample value is relatively discrete, and the SD is large. If the sample value that deviates from the population is low, the degree of dispersion of the sample value is low, and the SD is small. Therefore, the SD can measure the degree of sample dispersion corresponding to the deformation localization phenomenon. If the deformation field is relatively uniform without a deformation localization zone, the SD is small. If the deformation localization zone is formed, there are apparent differences between the deformation inside and outside the localization zone, and the SD is large. Therefore, SD is a quantitative parameter used to characterize the spatial evolution characteristics of the deformation field during the damage and failure process. Based on the statistics, the SD expression of the surface deformation field of the coal sample at any time (t) is as follows:
S D t = 1 L x L y x = 1 L x y = 1 L y [ f t ( x , y ) - M e a n t ] 2
For Lx, Ly, x, y, and Meant, see Equations (1) and (2).
As illustrated in Figure 9, the evolution of SD of vertical displacement of coal pillars with various displacement rates is consistent. In Phase I, small displacement is generated due to the closure and compaction of primary fissures and pores, and the corresponding SD is small. The SD rises during Phase II, caused by the elastic deformation and microcracks initiation. The SD rises rapidly during Phase III and IV due to the microcracks coalescence and macrocracks initiation, and the SD of some coal samples drops abruptly after the peak load. However, there are also some differences. The SD of the vertical displacement fluctuates briefly near the peak load at the displacement rate of 0.6 and 3.0 mm/min, while the SD of the vertical displacement increases near the peak load at 0.2 and 1.0 mm/min. The phenomenon is mainly caused by the bursting of some fragments. The increase rate of the SD of the vertical displacement is 0.0003 s−1 at the displacement rate of 0.2 mm/min, while the increase rate is 0.008 s−1 at 3.0 mm/min. The result reveals that the faster the loading rate, the quicker the internal deformation rate of the coal sample, so the corresponding SD of the vertical displacement increase rate is faster.
Due to the distinction in the deformation of the coal samples, the corresponding SD is also different, so the direct comparative analysis of SD has certain limitations. In statistics, the coefficient of variation (CV) refers to the ratio of the SD to the Mean, which has no dimension and is often used to describe the degree of dispersion of the sample data. Therefore, the CV can be selected as a quantitative index to compare and analyze coal samples’ deformation and failure characteristics under different displacement rates. The CV of the surface deformation field of the coal sample at any time (t) is as follows [10,11]:
( C V ) t = S D t M e a n t × 100 %
For Meant and SDt, see Equations (2) and (3).
Figure 10 illustrates the evolution curve of the CV of surface displacement of the coal samples with various displacement rates. Overall, the evolution characteristics of the CV of vertical displacement are the same under multiple displacement rates; the CV fluctuates at the initial loading stage (Phase I) because the coal sample has a significant heterogeneity, resulting in uneven deformation and inevitable fluctuation of the CV. With the load increase, the CV increases slowly at Phase II and III due to the microcracks initiation and coalescence. The CV rises rapidly near the peak stress (Phase IV). The main reason is that the microcracks propagate to form macrocracks. The degree of deformation localization is high, and the CV increases rapidly. However, the CV remains stable near the peak load at the displacement rate of 0.2 mm/min, while the CV rises quickly near the peak load at 0.6, 1.0, and 3.0 mm/min. The phenomenon indicates that the high displacement rate aggravates the deformation and failure process, so the damage and failure are severe near the peak load. In summary, the CV of the deformation field shows the fluctuate–slow increase–rapid increase trend, which can be applied to characterize the deformation behaviors of coal and rock.

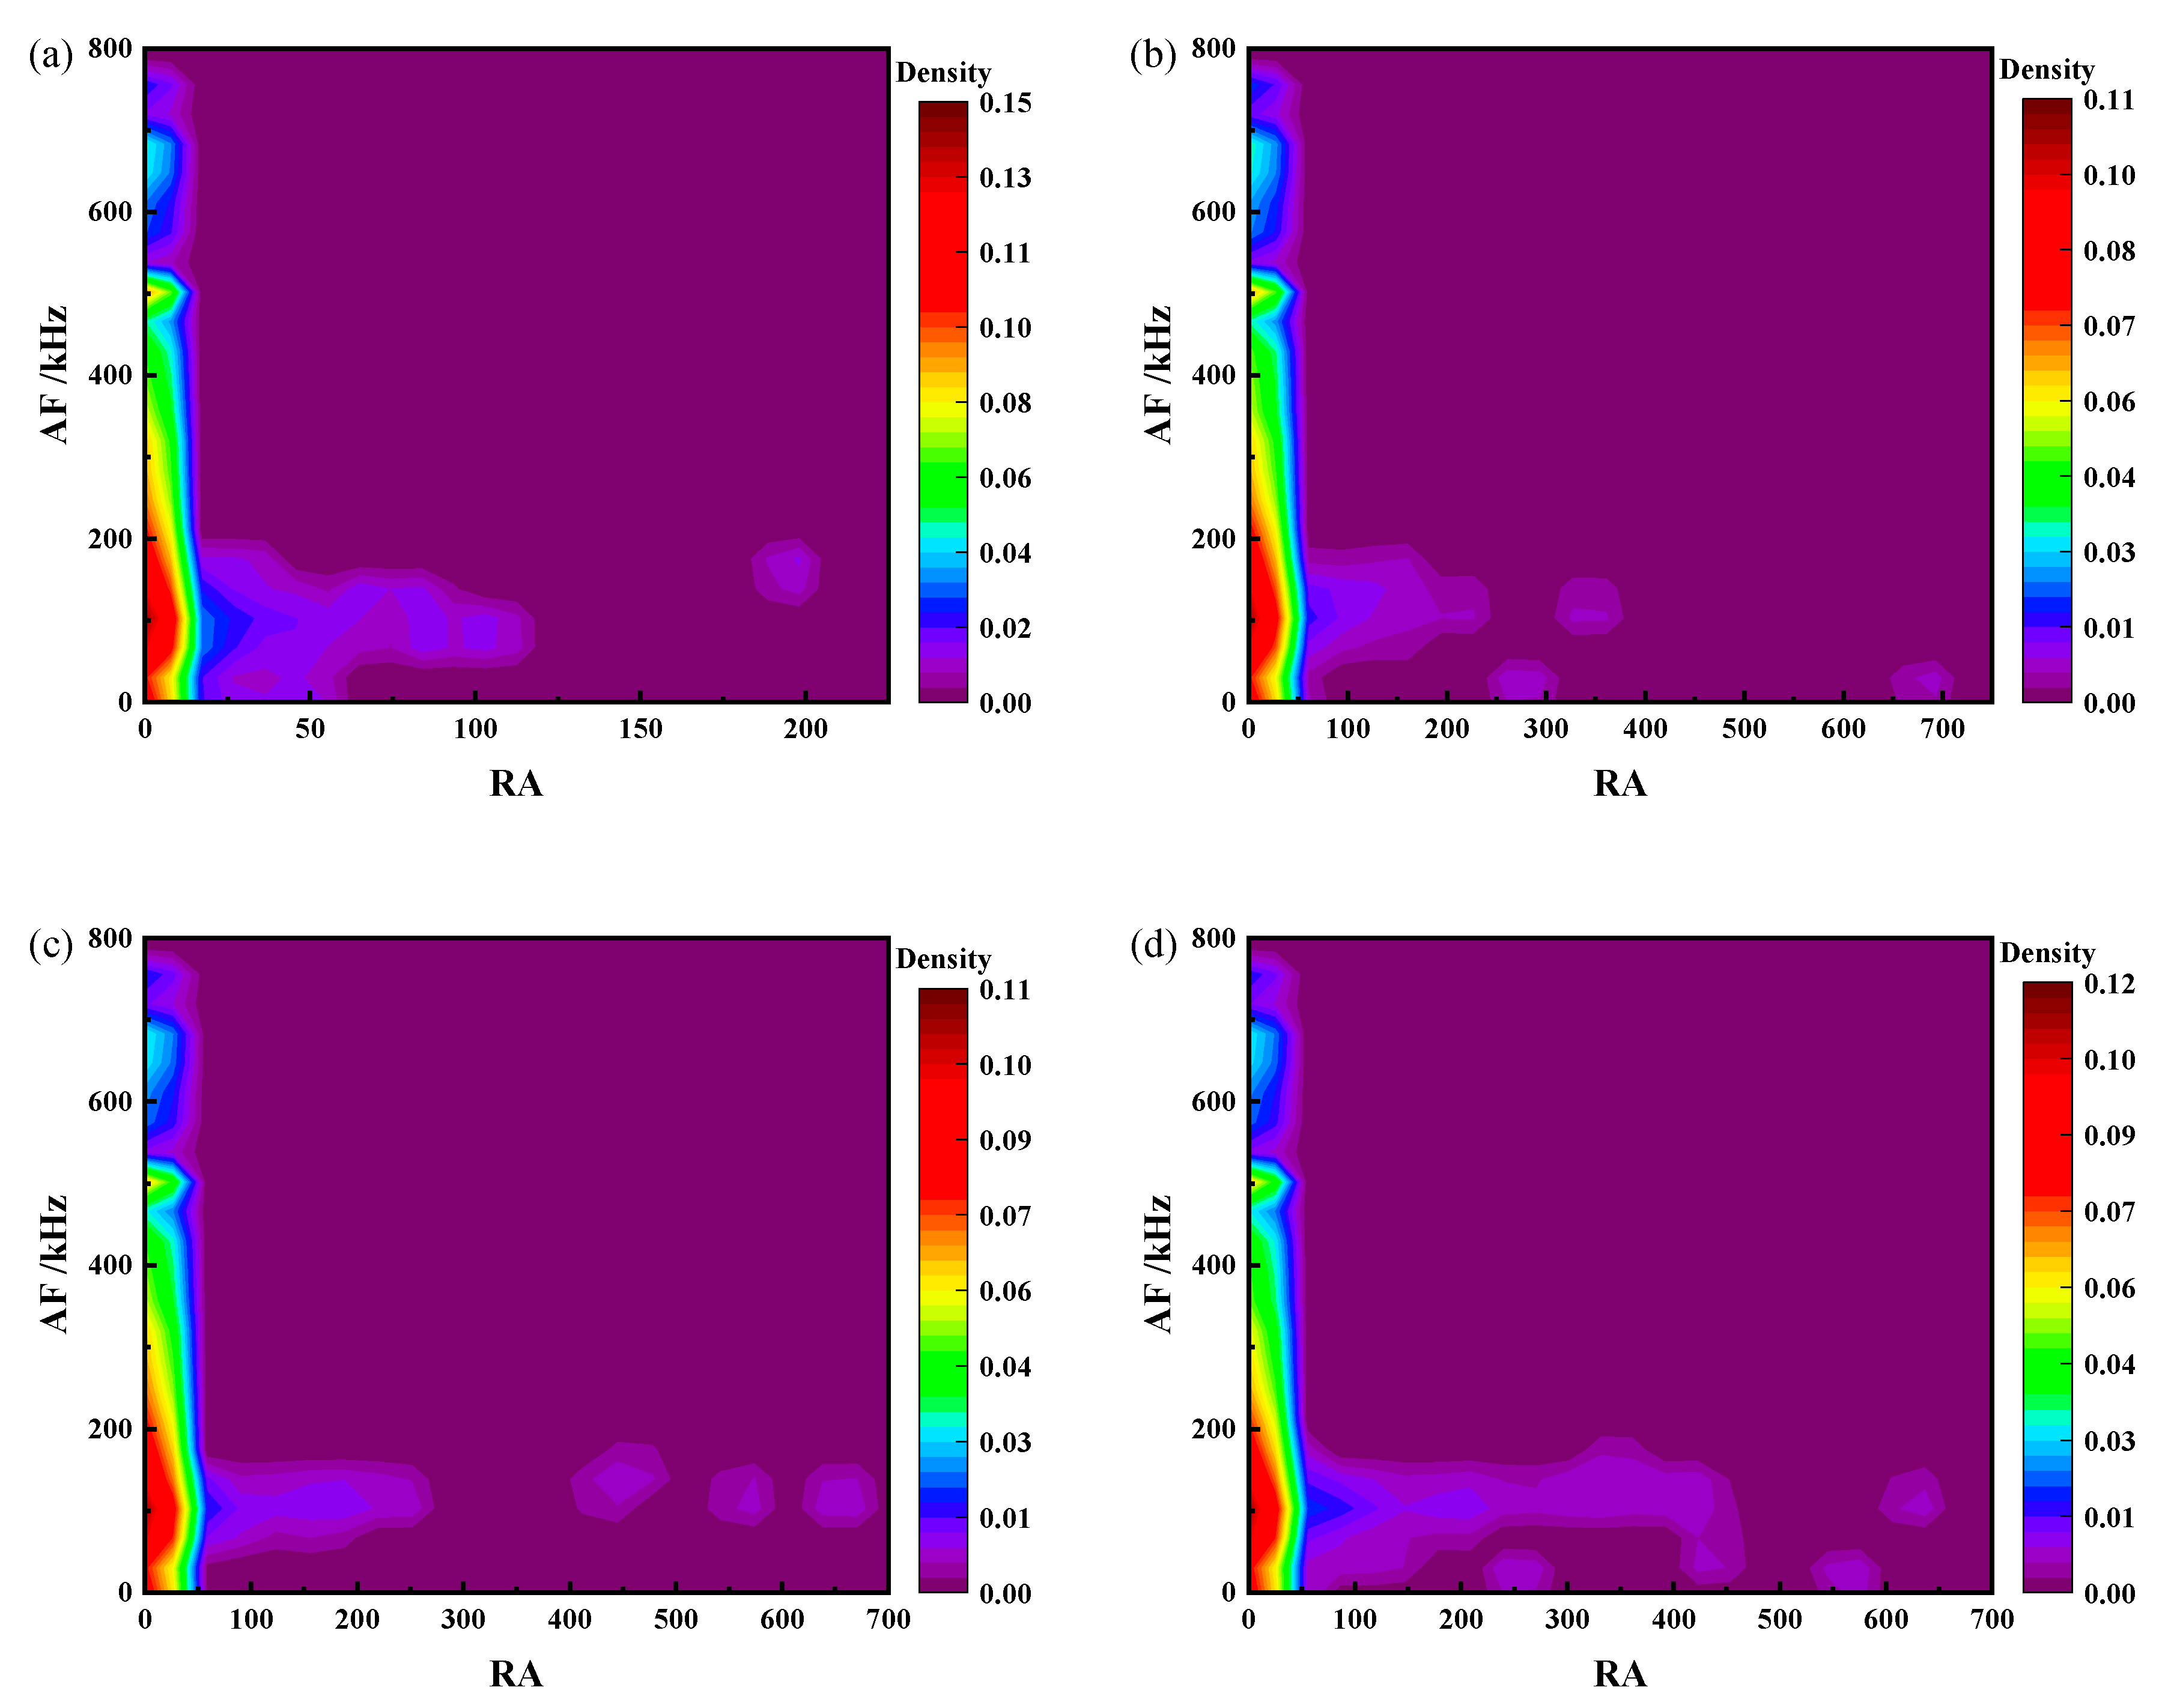
3.4. Microfailure Mechanism

Relevant studies have shown that the AE signals corresponding to tensile and shear cracks in the damage and fracture process are different, and the microfailure mechanism is commonly studied through the analysis of AE signals [37,38]. Tensile cracks commonly correspond to AE signals with high AF values (count/duration) and low RA values (rise time/amplitude), while shear cracks commonly correspond to AE signals with high RA values and low AF values (Figure 11).
Figure 12 illustrates the AF-RA data density cloud map of the coal samples with various displacement rates. The distribution range of AF values with various displacement rates is consistent, from 0 to 750 kHz. The RA values distribution ranges from 0 to 700 μs/dB but only ranges from 0 to 200 μs/dB when the displacement rate is 0.2 mm/min. The region with high AF-RA data density mainly appears along the vertical axis, and the low AF-RA data density region occurs along the horizontal axis. In other words, the microfailure mechanism of coal pillars with various displacement rates is mainly a tensile failure, accompanied by some shear failure, and the result is consistent with the existing studies [37,38]. However, the distribution of AF-RA in the coal samples with various displacement rates is also different. The data along the horizontal axis increase slowly with the increasing displacement rate. The proportion of shear failure increases with the growing displacement rate. From the perspective of coal pillar dam protection, the tensile and shear strength of coal and rock materials are poor, and measures should be taken to enhance the tensile and shear properties of coal pillar dams. Meanwhile, the risk of shear instability in coal pillar dams increases at a high strain rate. Therefore, the shear and tensile properties of coal pillar dams should be enhanced by bolting and grouting in the design process of the underground reservoir.
Although the failure behaviors and mechanism of the coal pillar dam under mining disturbance were investigated in our study, from the perspective of coal pillar dam protection, the risk of instability of the coal pillar dam increases at a high strain rate, and measures should be taken to avoid strong mining disturbance and enhance the tensile and shear properties of the coal pillar dam. The coal pillar dam stays in a complex mechanical environment, and the water content and in situ stress should be considered in future studies.

4. Conclusions

This paper investigated the deformation characteristics, AE evolution, deformation field evolution, and microfailure mechanism of coal pillars under uniaxial compression at various displacement rates. The conclusions can be summarized as follows:
(1) The accumulated absolute energy and AE event with various displacement rates show a similar trend, and the increment of accumulated absolute energy near the peak stress rises with the displacement rates.
(2) The Mean and SD of the deformation field with various displacement rates show a similar trend of slow increase–linear increase–rapid increase. The maximum vertical displacement and the increase rates of the Mean and SD of vertical displacement are positively related to the displacement rate.
(3) The CV of the deformation field with various displacement rates shows the same trend of fluctuate–slow increase–rapid increase, which can be applied to characterize coal and rock deformation behaviors.
(4) The range of RA values is mainly 0 to 700 μs/dB, and the AF values are 0 to 750 kHz. The microfailure mechanism with various displacement rates is mainly tensile failure and is accompanied by some shear failure. The percentage of shear failure increases with the increasing displacement rate.
(5) In the design process of the underground reservoir, the underground reservoir should be far away from the fault structures and strong disturbance area, and the shear and tensile properties of the coal pillar dam should be enhanced by bolting and grouting.

Author Contributions

Conceptualization, X.Z. and B.L.; methodology, X.Z. and P.L.; investigation, P.L. and B.L.; resources, X.Z. and P.L.; data curation, B.L.; writing—original draft preparation, X.Z. and B.L.; writing—review and editing, P.L. and Y.W. All authors have read and agreed to the published version of the manuscript.

Funding

This research was funded by the National Energy Group Science and Technology Innovation Project (grant number GJNY-21-26-04).

Data Availability Statement

All data that support the findings of this study are available from the corresponding author upon reasonable request.

Acknowledgments

This research was supported by the State Key Laboratory of Mining Response and Disaster Prevention and Control in Deep Coal Mines, Anhui University of Science and Technology.

Conflicts of Interest

Author Xin Zou and Peng Li were employed by the company Shendong Coal Technology Research Institute, China Energy Shendong Coal Group Company Limited. The remaining authors declare that the research was conducted in the absence of any commercial or financial relationships that could be construed as a potential conflict of interest.

References

  1. Gu, D.Z. Theory Framework and Technological System of Coal Mine Underground Reservoir. Meitan Xuebao/J. China Coal Soc. 2015, 40, 239–246. [Google Scholar] [CrossRef]
  2. Gu, D.; Yan, Y.; Zhang, Y.; Wang, E.; Cao, Z. Experimental Study and Numerical Simulation for Dynamic Response of Coal Pillars in Coal Mine Underground Reservoir. Meitan Xuebao/J. China Coal Soc. 2016, 41, 1589–1597. [Google Scholar] [CrossRef]
  3. Gu, D.; Cao, Z.; Li, J.; Wu, B.; Zhang, Y.; Jiang, B.; Guo, Q.; Wang, H.; Wu, Y.; Shi, X.; et al. Original Experimental Platform System and Application of Underground Coal Mine Reservoirs. Meitan Xuebao/J. China Coal Soc. 2024, 49, 100–113. [Google Scholar] [CrossRef]
  4. Yao, Q.; Liu, Y.; Chen, T.; Li, X.; Yang, S.; Duan, H. Experimental Study of Damage Evolution of Artificial Dam Strength of Underground Reservoir. Meitan Xuebao/J. China Coal Soc. 2018, 43, 1111–1117. [Google Scholar] [CrossRef]
  5. Wu, W.; Li, J.; Zhao, J. Loading Rate Dependency of Dynamic Responses of Rock Joints at Low Loading Rate. Rock Mech. Rock Eng. 2012, 45, 421–426. [Google Scholar] [CrossRef]
  6. Gong, F.; Zhao, G. Dynamic Indirect Tensile Strength of Sandstone Under Different Loading Rates. Rock Mech. Rock Eng. 2014, 47, 2271–2278. [Google Scholar] [CrossRef]
  7. Li, H.; Zhou, H.; Jiang, Y.; Wang, H. An Evaluation Method for the Bursting Characteristics of Coal Under the Effect of Loading Rate. Rock Mech. Rock Eng. 2016, 49, 3281–3291. [Google Scholar] [CrossRef]
  8. Wang, X.; Wang, E.; Liu, X.; Zhou, X. Failure Mechanism of Fractured Rock and Associated Acoustic Behaviors under Different Loading Rates. Eng. Fract. Mech. 2021, 247, 107674. [Google Scholar] [CrossRef]
  9. Dou, L.; He, J.; Cao, A.; Gong, S.; Cai, W. Rock Burst Prevention Methods Based on Theory of Dynamic and Static Combined Load Induced in Coal Mine. Meitan Xuebao/J. China Coal Soc. 2015, 40, 1469–1476. [Google Scholar] [CrossRef]
  10. Liu, B.; Zhao, Y.; Wang, H.; Gao, Y.; Sun, Z. Tensile Properties and Multiparameter Response Characteristics of Coal under Different Loading Rates. Nat. Resour. Res. 2022, 31, 2787–2803. [Google Scholar] [CrossRef]
  11. Zhao, Y.; Liu, B. Deformation Field and Acoustic Emission Characteristics of Weakly Cemented Rock under Brazilian Splitting Test. Nat. Resour. Res. 2021, 30, 1925–1939. [Google Scholar] [CrossRef]
  12. Liu, B.; Zhao, Y.; Zhang, C.; Zhou, J.; Li, Y.; Sun, Z. Characteristic Strength and Acoustic Emission Properties of Weakly Cemented Sandstone at Different Depths under Uniaxial Compression. Int. J. Coal Sci. Technol. 2021, 8, 1288–1301. [Google Scholar] [CrossRef]
  13. Zhao, Y.; Liu, B.; Ling, C.; Gao, Y.; Wang, X.; Danesh, N.N. Infrared Radiation and Acoustic Emission Characteristics of Sandstone with Different Granularities under Uniaxial Compression. Bull. Eng. Geol. Environ. 2023, 82, 24. [Google Scholar] [CrossRef]
  14. Wang, M.; Zhang, J.; Jia, B.; Du, W.; Chen, Z.; Liu, S. Research on Prediction of Coal Sample Deformation Based on Acoustic-Emission Sensitive Index. Sustainability 2022, 14, 14875. [Google Scholar] [CrossRef]
  15. Liu, B.; Sun, X.; Ling, C.; Huang, Z.; Zhang, H. Mechanical Behaviors and Acoustic Emission Fractal Characteristics of Bump-Prone Coal under Different Loading Rates. Fractal Fract. 2023, 7, 45. [Google Scholar] [CrossRef]
  16. Wang, S.; Zhao, Y.; Guo, J.; Liu, B. Investigation on Prediction of Sandstone Failure Under Uniaxial Compression Based on Supervised Deep Learning. Rock Mech. Rock Eng. 2023, 56, 8485–8501. [Google Scholar] [CrossRef]
  17. Gao, Y.; Zhao, Y.; Wang, H.; Liu, B.; Hartlieb, P.; Gao, S. Loaded Failure Characteristics of Anthracite Derived from Microwave Irradiation: Acoustic Emission Evaluation. Rock Mech. Rock Eng. 2023, 56, 8809–8831. [Google Scholar] [CrossRef]
  18. Zou, Q.; Chen, C.; Chen, Z.; Peng, K.; Lv, H.; Zhan, J. Characterization and Differences of Acoustic Signals Response of Semi-Circular Red Sandstone under Combined Monotonous and Cyclic Loadings. Geomech. Geophys. Geo-Energy Geo-Resour. 2024, 10, 146. [Google Scholar] [CrossRef]
  19. Liu, B.; Zhao, Y.; Gao, S.; Zhang, H.; Teng, T.; He, X. Effects of Displacement Rate on Mechanical Behaviors and Failure Mechanism of Non-Caking Coal in Brazilian Splitting Tests. Bull. Eng. Geol. Environ. 2024, 83, 179. [Google Scholar] [CrossRef]
  20. Peng, S.; Yang, Y.; Xu, Q.; Xu, J.; Qin, C.; Nong, X. Study on Impact Tendency and Damage Characteristics of Rock-Like Materials Based on Acoustic and Thermal Responses. Rock Mech. Rock Eng. 2024, 57, 10367–10383. [Google Scholar] [CrossRef]
  21. Gao, C.; Wang, L.; Lin, M.; Zheng, L.; Zhu, L.; He, Y.; An, C.; Liang, X. Study on the Acoustic-Thermal Effects and Damage Models during Uniaxial Compression Failure Process of Phosphorite with Different H/Di. Infrared Phys. Technol. 2024, 138, 105267. [Google Scholar] [CrossRef]
  22. Liu, Y.; Li, D.; Cheng, J.; Asad, M.W.A.; Gao, Z.; Jiao, J. The Multifractal Characteristics of Acoustic Emission for Composite Samples Subject to Simulated Field Loading Condition. Int. J. Min. Reclam. Environ. 2024, 38, 596–618. [Google Scholar] [CrossRef]
  23. Kong, X.; Zhan, M.; Lin, H.; Cai, Y.; Ji, P.; He, D.; Muhammad, A. Time-Varying Characteristics of Acoustic Emission and Fractals Based on Information Dimension during Structural Failure of Coal Subjected to Uniaxial Compression. Meas. J. Int. Meas. Confed. 2024, 236, 115088. [Google Scholar] [CrossRef]
  24. Lin, Q.; Labuz, J.F. Fracture of Sandstone Characterized by Digital Image Correlation. Int. J. Rock Mech. Min. Sci. 2013, 60, 235–245. [Google Scholar] [CrossRef]
  25. Wei, Z.; Yang, K.; Chi, X.; He, X.; Zhao, X.; Zhang, J. Dynamic Tensile Properties, Deformation, and Failure Testing of Impact-Loaded Coal Samples with Various Water Content. Sci. Rep. 2021, 11, 7096. [Google Scholar] [CrossRef]
  26. Zhang, T.; Liu, B.; Wei, Z.; Jiao, Z.; Song, Z.; Zhang, H. Dynamic Mechanical Responses and Crack Evolution of Burst-Prone Coal with a Single Prefabricated Fissure. Theor. Appl. Fract. Mech. 2022, 121, 103494. [Google Scholar] [CrossRef]
  27. Zhang, H.; Fu, D.; Song, H.; Kang, Y.; Huang, G.; Qi, G.; Li, J. Damage and Fracture Investigation of Three-Point Bending Notched Sandstone Beams by DIC and AE Techniques. Rock Mech. Rock Eng. 2015, 48, 1297–1303. [Google Scholar] [CrossRef]
  28. Ashraf, S.; Rucka, M. Comparative Study on Fracture Evolution in Steel Fibre and Bar Reinforced Concrete Beams Using Acoustic Emission and Digital Image Correlation Techniques. Case Stud. Constr. Mater. 2024, 20, e03359. [Google Scholar] [CrossRef]
  29. Yang, L.; Zhang, F.; You, J.; Man, D.; Gao, J.; Liu, W. Mechanical Behaviour and Spatial Fracture Characteristics of Weakly Filled Granite with Different Diameters under Uniaxial Loading Revealed by 3D DIC and AE Monitoring. Bull. Eng. Geol. Environ. 2024, 83, 217. [Google Scholar] [CrossRef]
  30. Xing, T.; Zhu, H.; Song, Y. Experimental Study on Rock Deformation Localization Using Digital Image Correlation and Acoustic Emission. Appl. Sci. 2024, 14, 5355. [Google Scholar] [CrossRef]
  31. Ye, Y.; Yang, Q.; Xiao, S.; Qiu, X.; Xiong, Y.; Yang, W. Fracture Evolution Characteristics of Asphalt Concrete Using Digital Image Correlation and Acoustic Emission Techniques. Constr. Build. Mater. 2024, 447, 138100. [Google Scholar] [CrossRef]
  32. Wang, X.; Liu, S.; Liu, X.; Shan, T.; Zhou, X.; Xie, H.; Wang, J. Mode I Fracture Propagation and Post-Peak Behavior of Sandstone: Insight from AE and DIC Observation. Eng. Fract. Mech. 2024, 302, 110093. [Google Scholar] [CrossRef]
  33. Wang, Z.; Liang, W.; Lian, H.; Chen, Y.; Li, W.; Xiao, H. Study on the Effect of Bedding Plane and Loading Style on Fracture Process Zone in Coal. Rock Mech. Rock Eng. 2024, 57, 3863–3883. [Google Scholar] [CrossRef]
  34. Mahesh, P.; Chinthapenta, V.; Raju, G.; Ramji, M. Experimental Investigation on Open-Hole CFRP Laminate under Combined Loading Using Acoustic Emission and Digital Image Correlation. Theor. Appl. Fract. Mech. 2024, 130, 104300. [Google Scholar] [CrossRef]
  35. Liu, B.; Zhao, Y.; Zhang, H.; Yuan, Y. Acoustic Emission Characteristics of Coal under Uniaxialcompression and Brazilian Splitting. Caikuang yu Anquan Gongcheng Xuebao/J. Min. Saf. Eng. 2020, 37, 613–621. [Google Scholar] [CrossRef]
  36. Lou, Q.; He, X. Experimental Study on Infrared Radiation Temperature Field of Concrete under Uniaxial Compression. Infrared Phys. Technol. 2018, 90, 20–30. [Google Scholar] [CrossRef]
  37. Aggelis, D.G. Classification of Cracking Mode in Concrete by Acoustic Emission Parameters. Mech. Res. Commun. 2011, 38, 153–157. [Google Scholar] [CrossRef]
  38. Elfergani, H.A.; Pullin, R.; Holford, K.M. Damage Assessment of Corrosion in Prestressed Concrete by Acoustic Emission. Constr. Build. Mater. 2013, 40, 925–933. [Google Scholar] [CrossRef]
Figure 1. Coal specimens with speckles.
Buildings 14 03856 g001
Figure 2. The layout of the experimental system.
Buildings 14 03856 g002
Figure 3. Stress–strain curves of coal with various displacement rates.
Buildings 14 03856 g003
Figure 4. Curves of stress, AE event, and accumulated absolute energy with various displacement rates: (a) 0.2 mm/min, (b) 0.6 mm/min, (c) 1.0 mm/min, and (d) 3.0 mm/min.
Buildings 14 03856 g004
Figure 5. Evolution of vertical deformation field at different stages of the coal sample (0.2 mm/min): (a) Phase I, (b) Phase II, (c) Phase III, and (d) Phase IV (unit: mm).
Buildings 14 03856 g005
Figure 6. Evolution of vertical deformation field at different stages of the coal sample (0.6 mm/min): (a) Phase I, (b) Phase II, (c) Phase III, and (d) Phase IV (unit: mm).
Buildings 14 03856 g006
Figure 7. Evolution of vertical deformation field at different stages of the coal sample (1.0 mm/min): (a) Phase I, (b) Phase II, (c) Phase III, and (d) Phase IV (unit: mm).
Buildings 14 03856 g007
Figure 8. Evolution of vertical deformation field at different stages of coal the sample (3.0 mm/min): (a) Phase I, (b) Phase II, (c) Phase III, and (d) Phase IV (unit: mm).
Buildings 14 03856 g008
Figure 9. Curves of stress, Mean, and SD of vertical deformation with various displacement rates: (a) 0.2 mm/min, (b) 0.6 mm/min, (c) 1.0 mm/min, and (d) 3.0 mm/min.
Buildings 14 03856 g009
Figure 10. Curves of stress and Cv with various displacement rates: (a) 0.2 mm/min, (b) 0.6 mm/min, (c) 1.0 mm/min, and (d) 3.0 mm/min.
Buildings 14 03856 g010
Figure 11. Microfailure mechanism analysis based on RA and AF.
Buildings 14 03856 g011
Figure 12. Distribution of AF and RA with various displacement rates: (a) 0.2 mm/min, (b) 0.6 mm/min, (c) 1.0 mm/min, and (d) 3.0 mm/min.
Buildings 14 03856 g012
Disclaimer/Publisher’s Note: The statements, opinions and data contained in all publications are solely those of the individual author(s) and contributor(s) and not of MDPI and/or the editor(s). MDPI and/or the editor(s) disclaim responsibility for any injury to people or property resulting from any ideas, methods, instructions or products referred to in the content.

