
Transverse-Direction Post-Seismic Running Safety of Longitudinally Connected Ballastless Track–Continuous Girder Bridge Systems Considering Earthquake Damage State


 and
and
Abstract
1. Introduction
2. Post-Seismic Damage Analysis of LCBTCGB
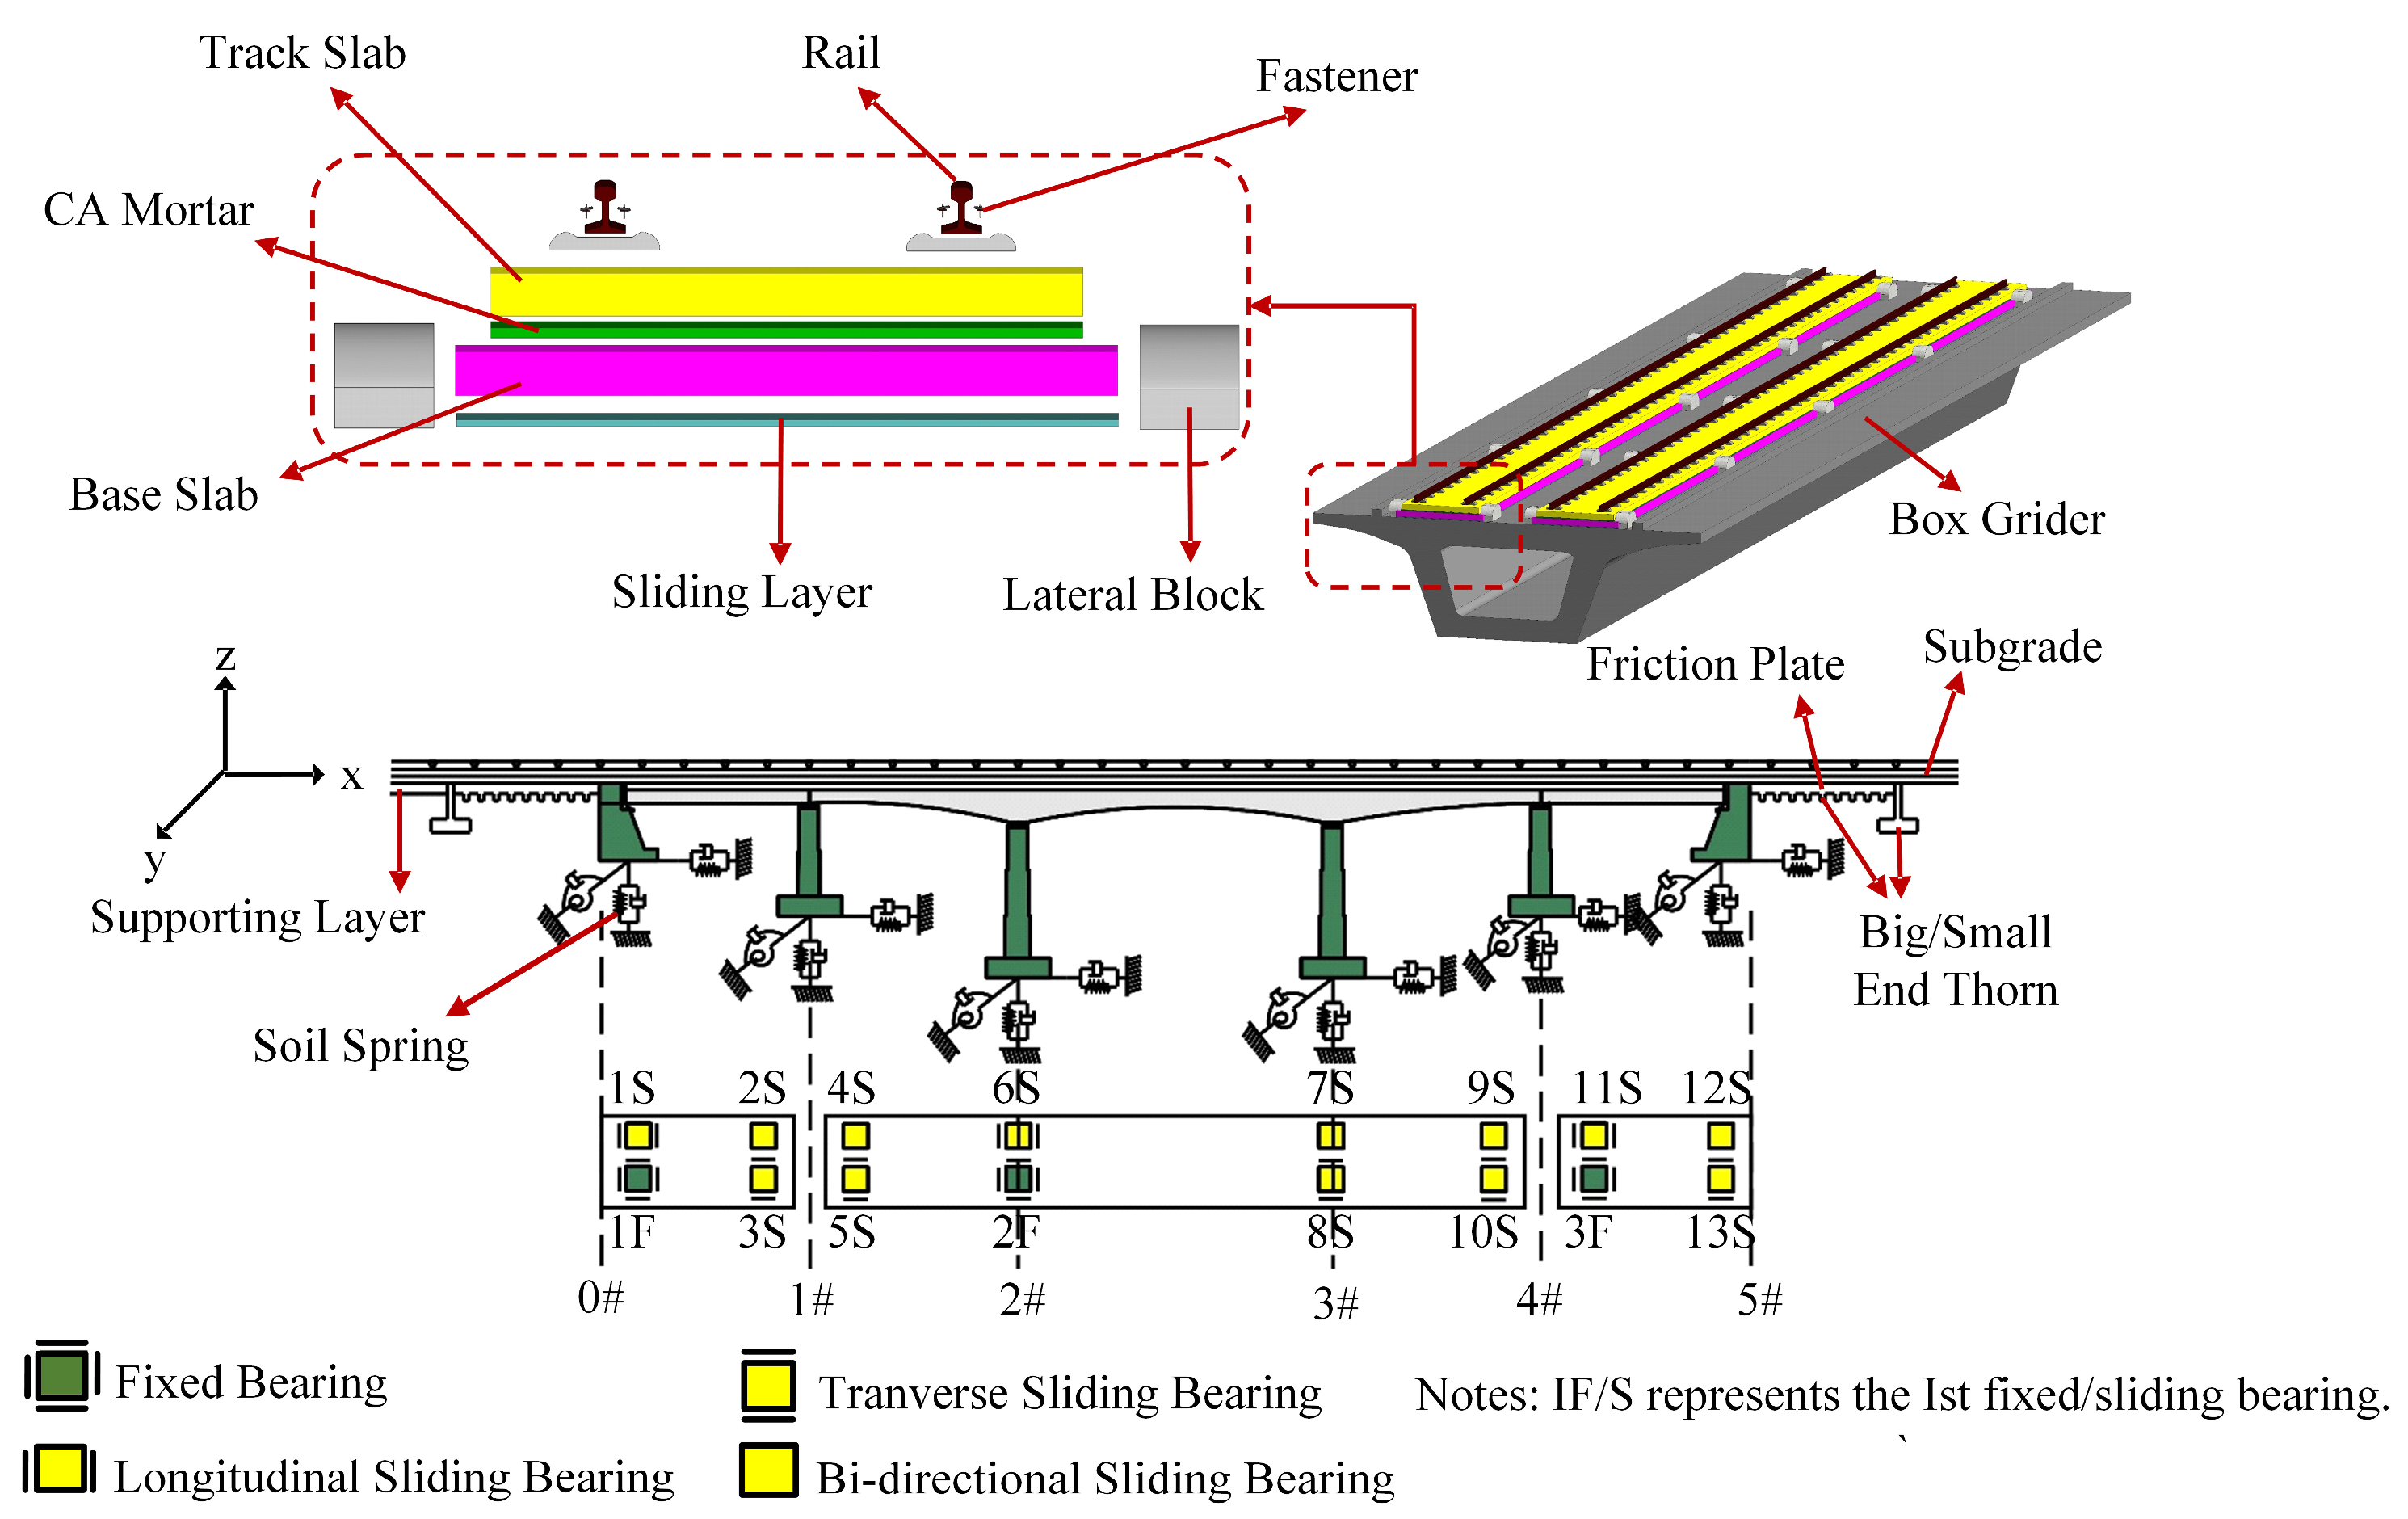
2.1. Simulation Model and Ground Motion Input for LCBTCGB
2.2. Post-Seismic Damage State Analysis of Key Interlayer Components in LCBTCGB
- (1)
- Fixed Bearings
- (2)
- Lateral blocks
- (3)
- Sliding Layer and Friction Plates
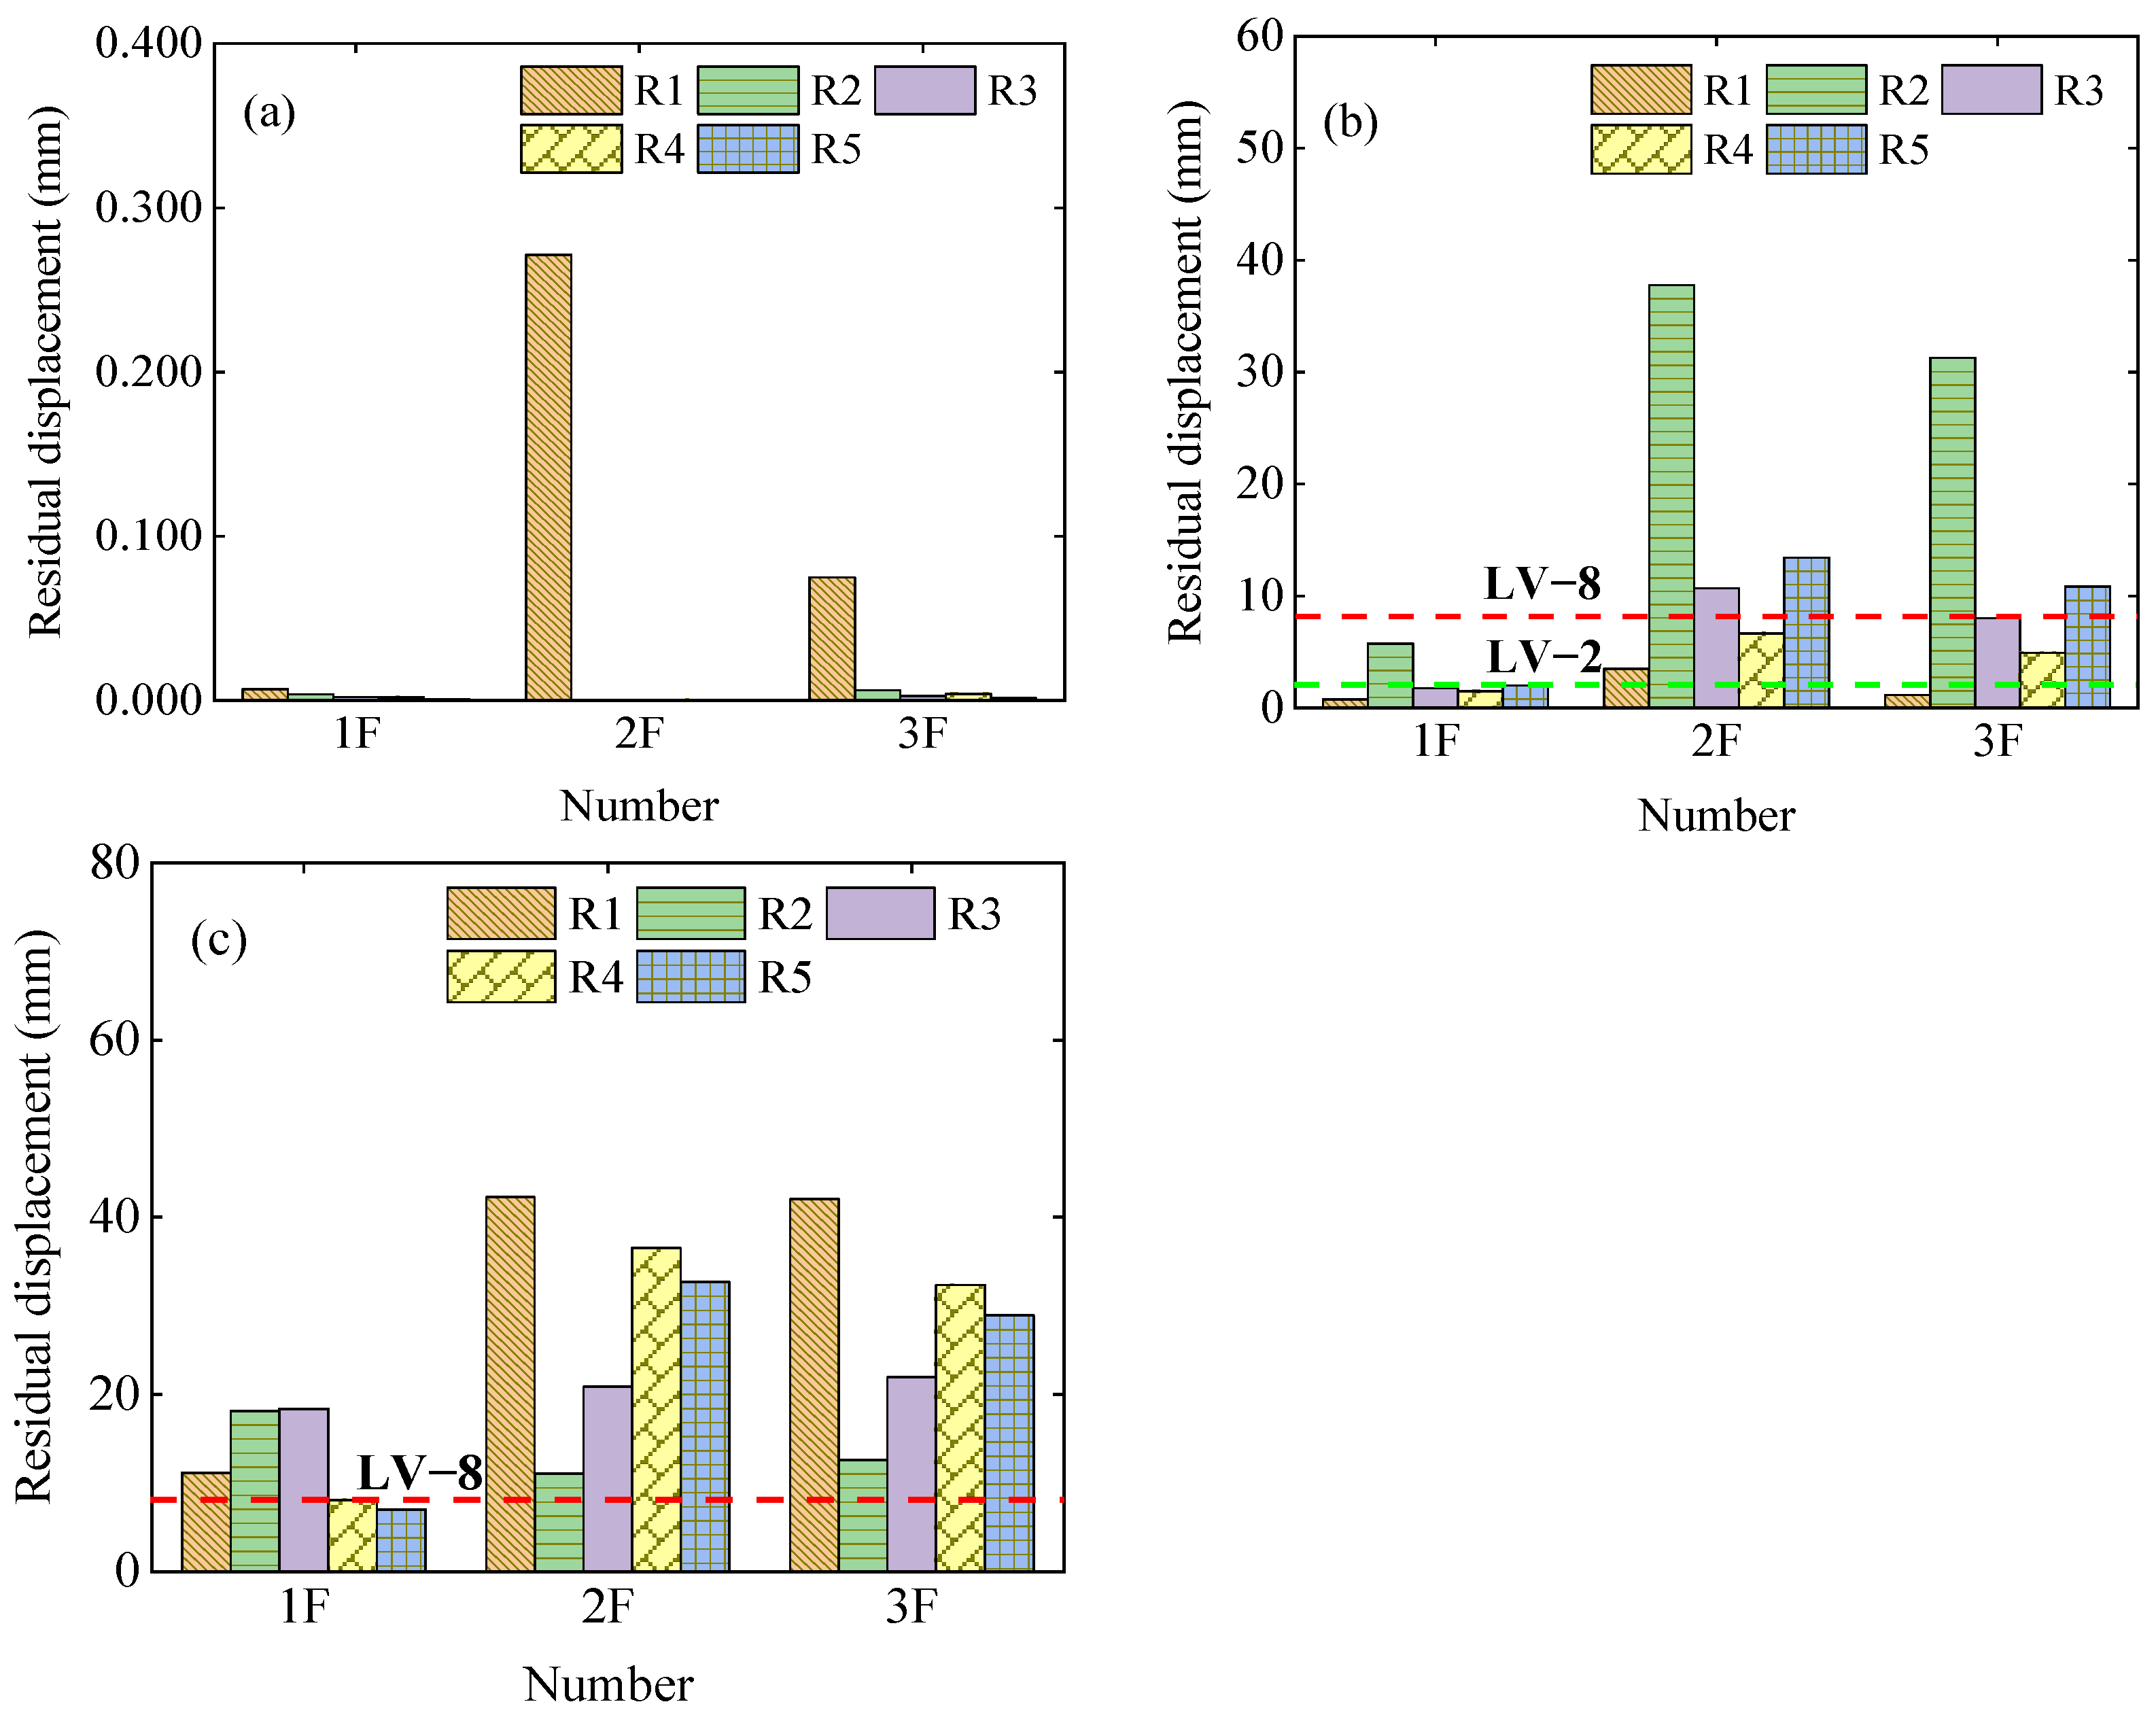
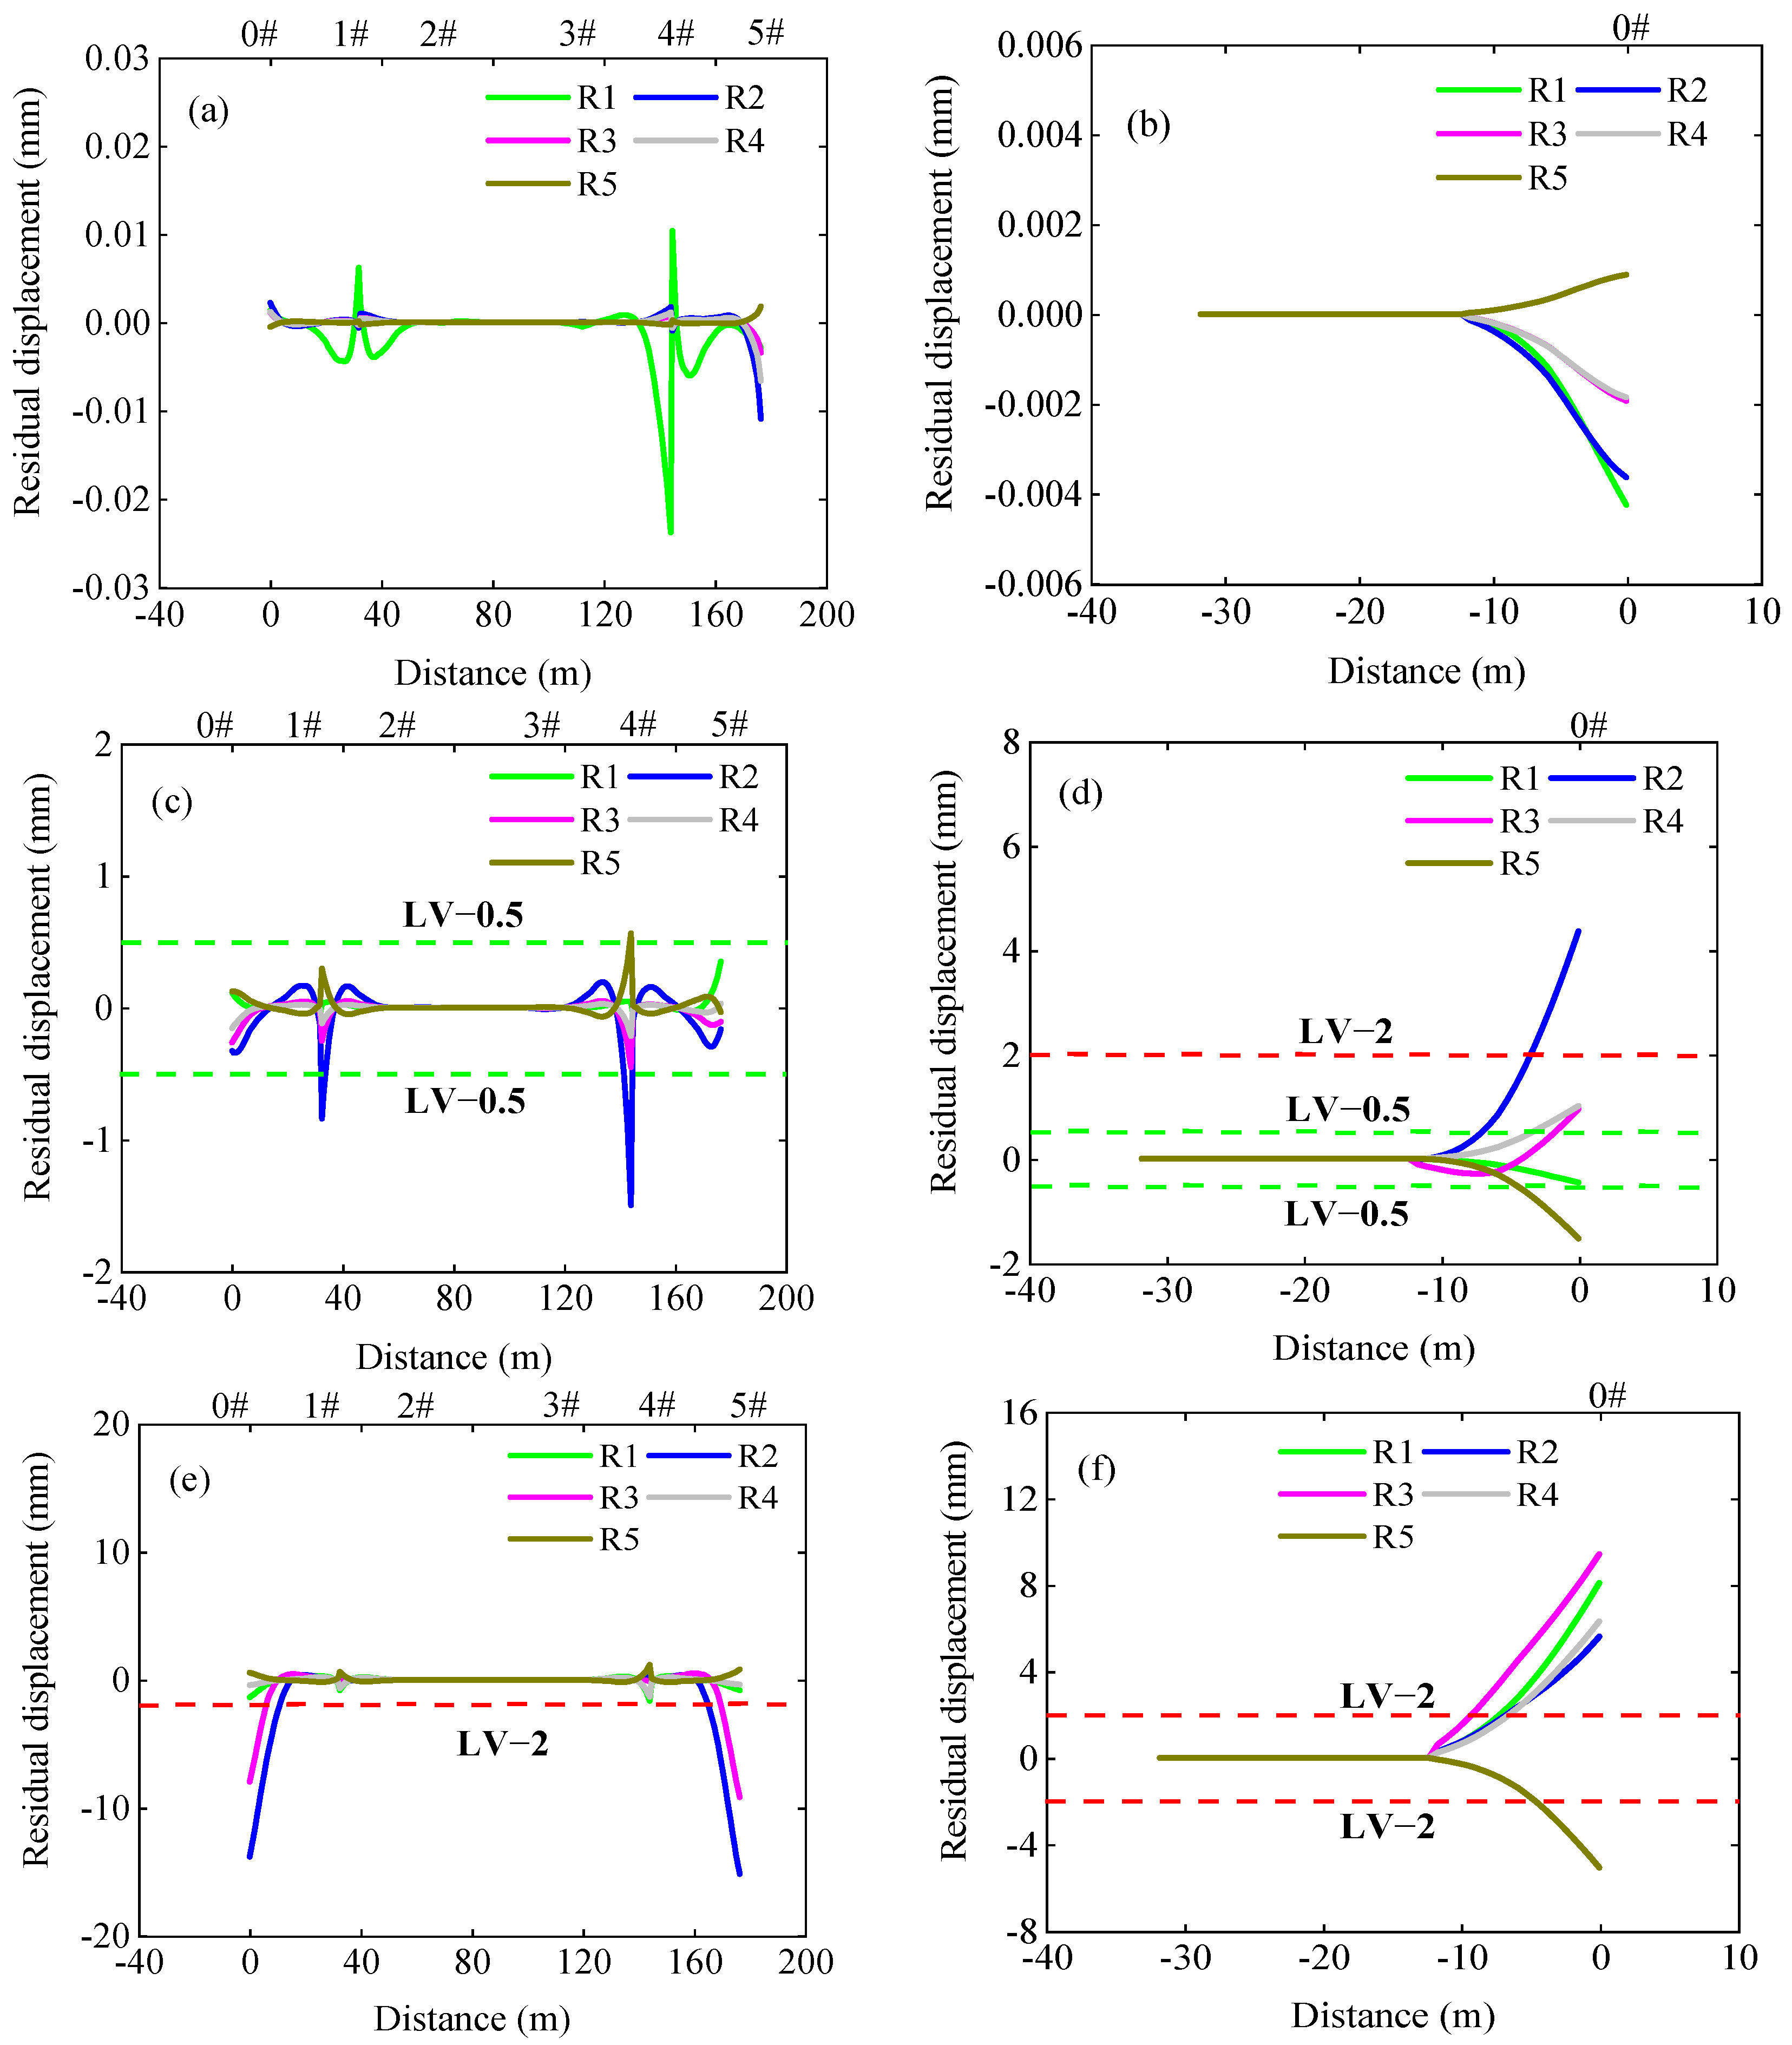
2.3. Post-Seismic Residual Deformation Analysis of Each Structural Layer in LCBTCGB
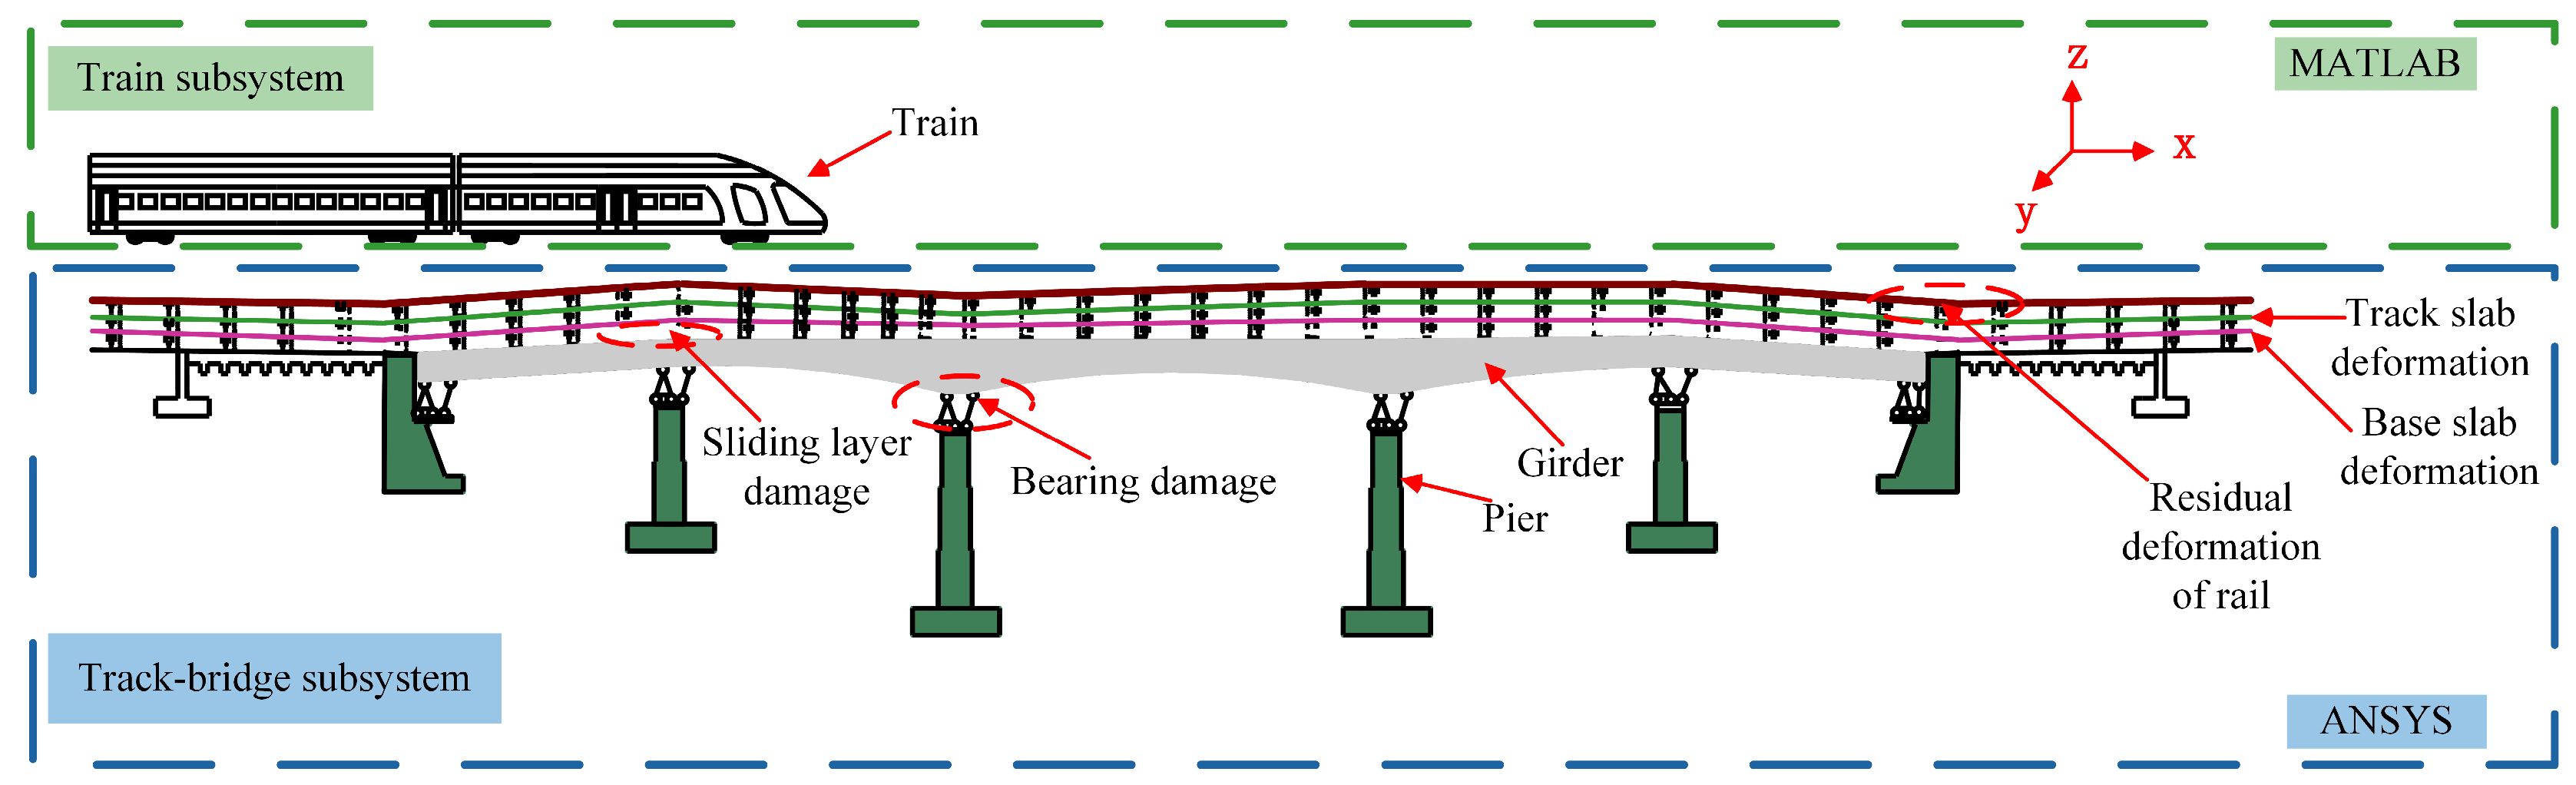
3. Coupled Dynamic Model of Train–LCBTCGB
3.1. LCBTCGB Model
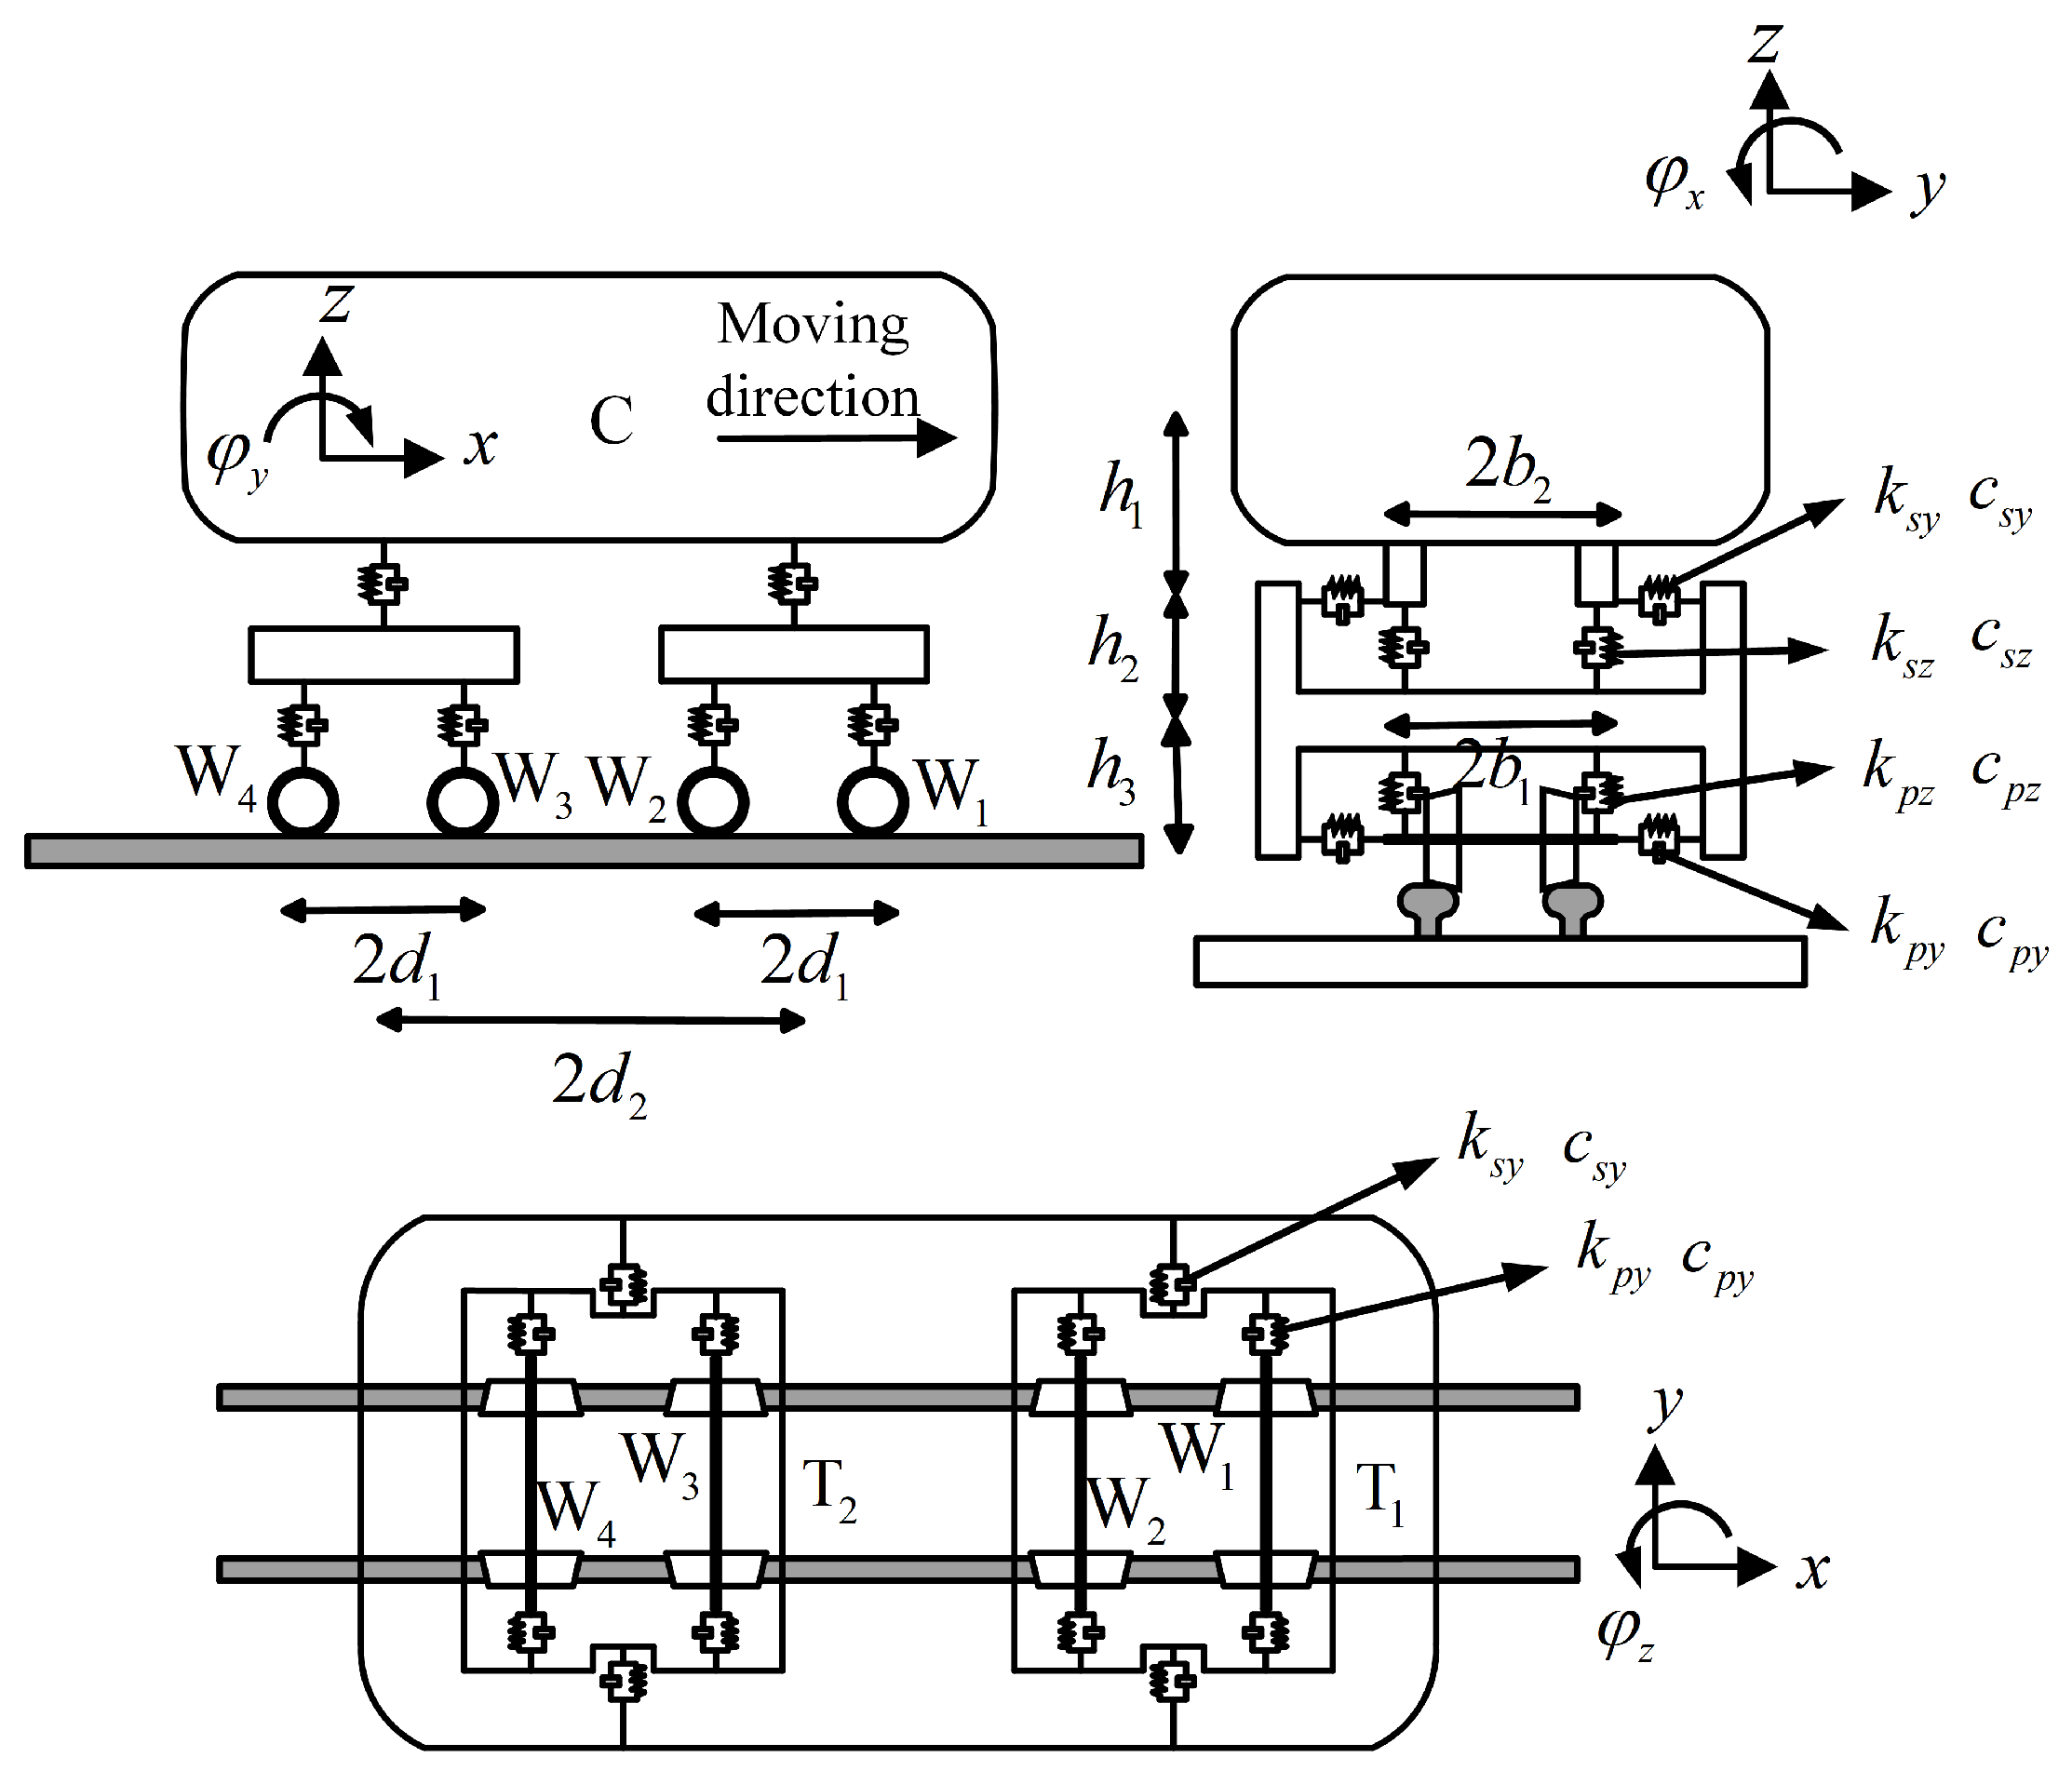
3.2. Train Model
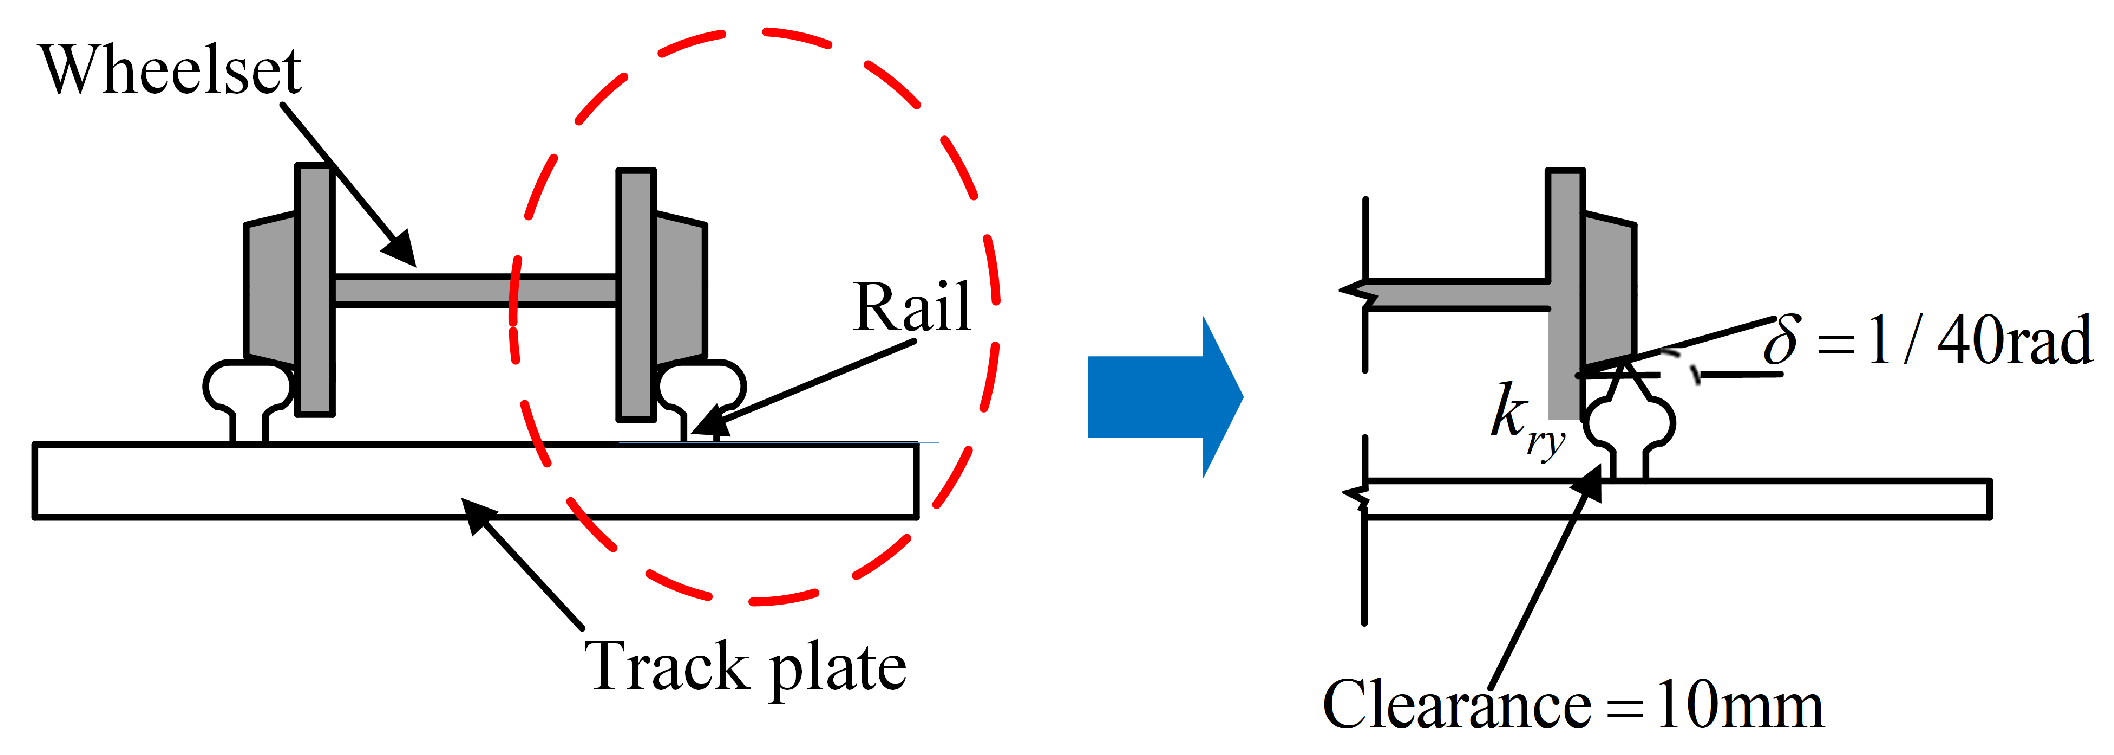
3.3. Wheel–Rail Contact Relationship
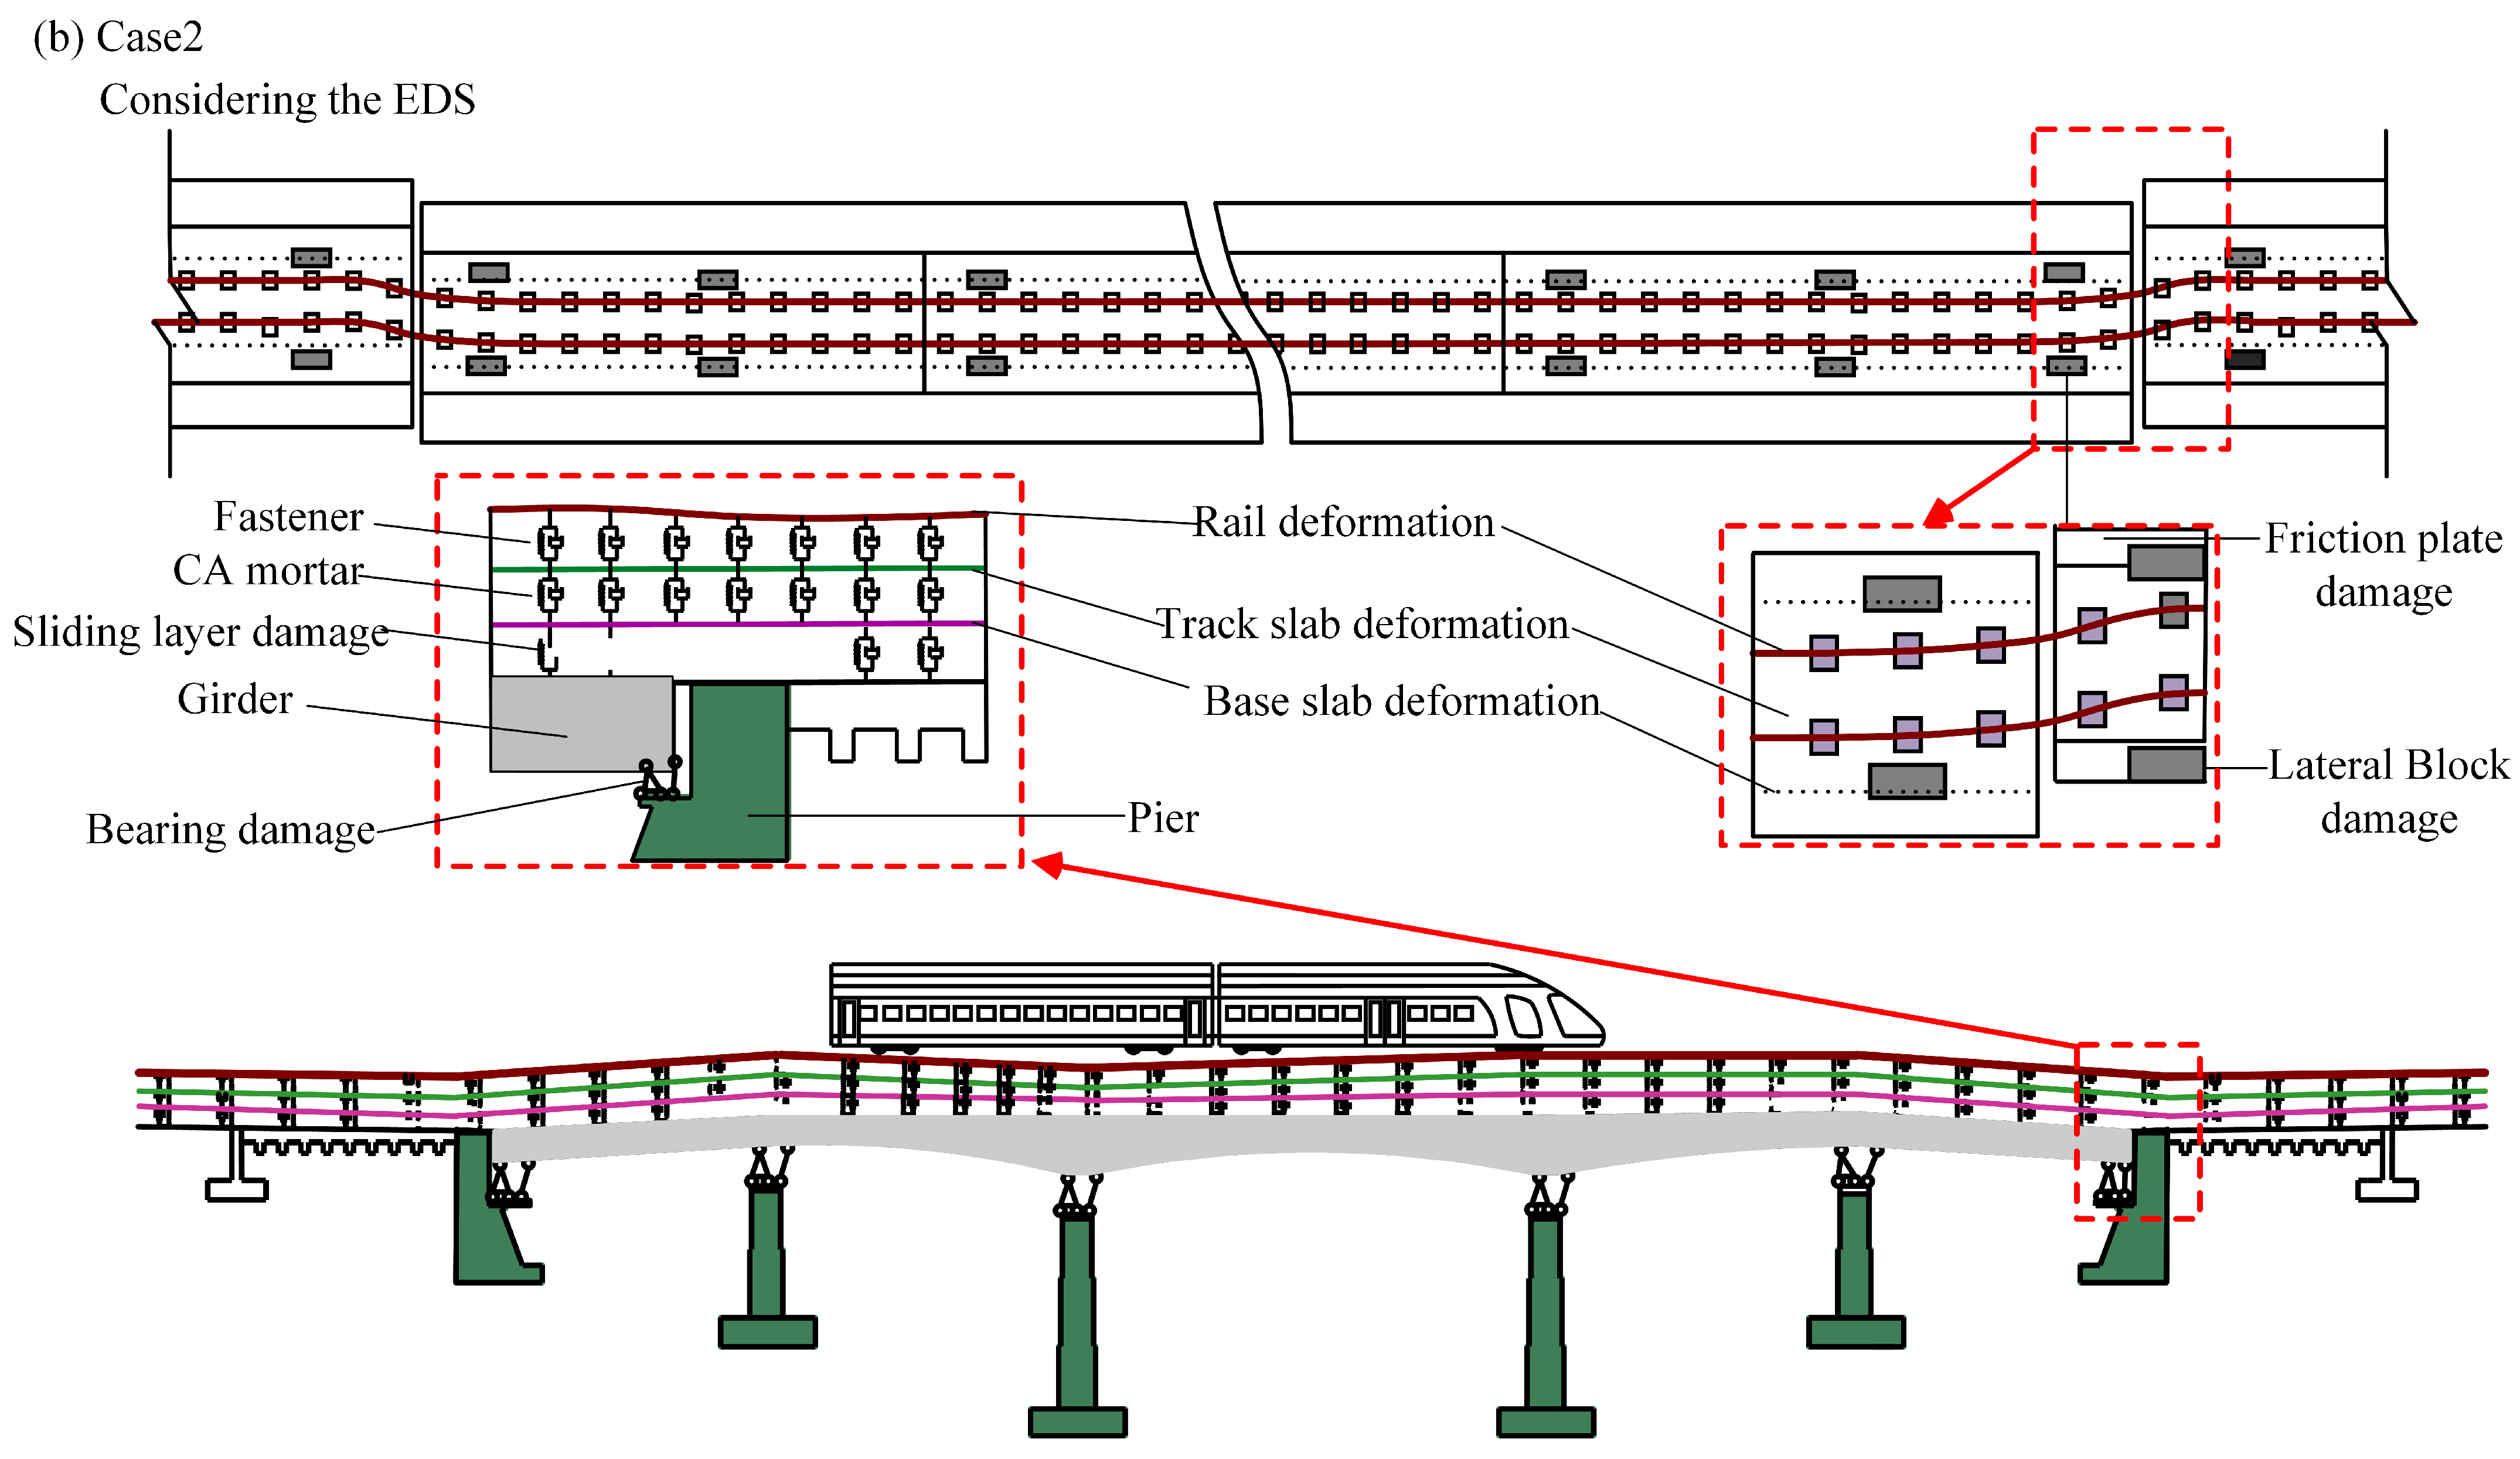
3.4. Extraction of EDS of LCBTCGB
3.5. Coupled Dynamic Train–LCBTCGB Model Considering EDS
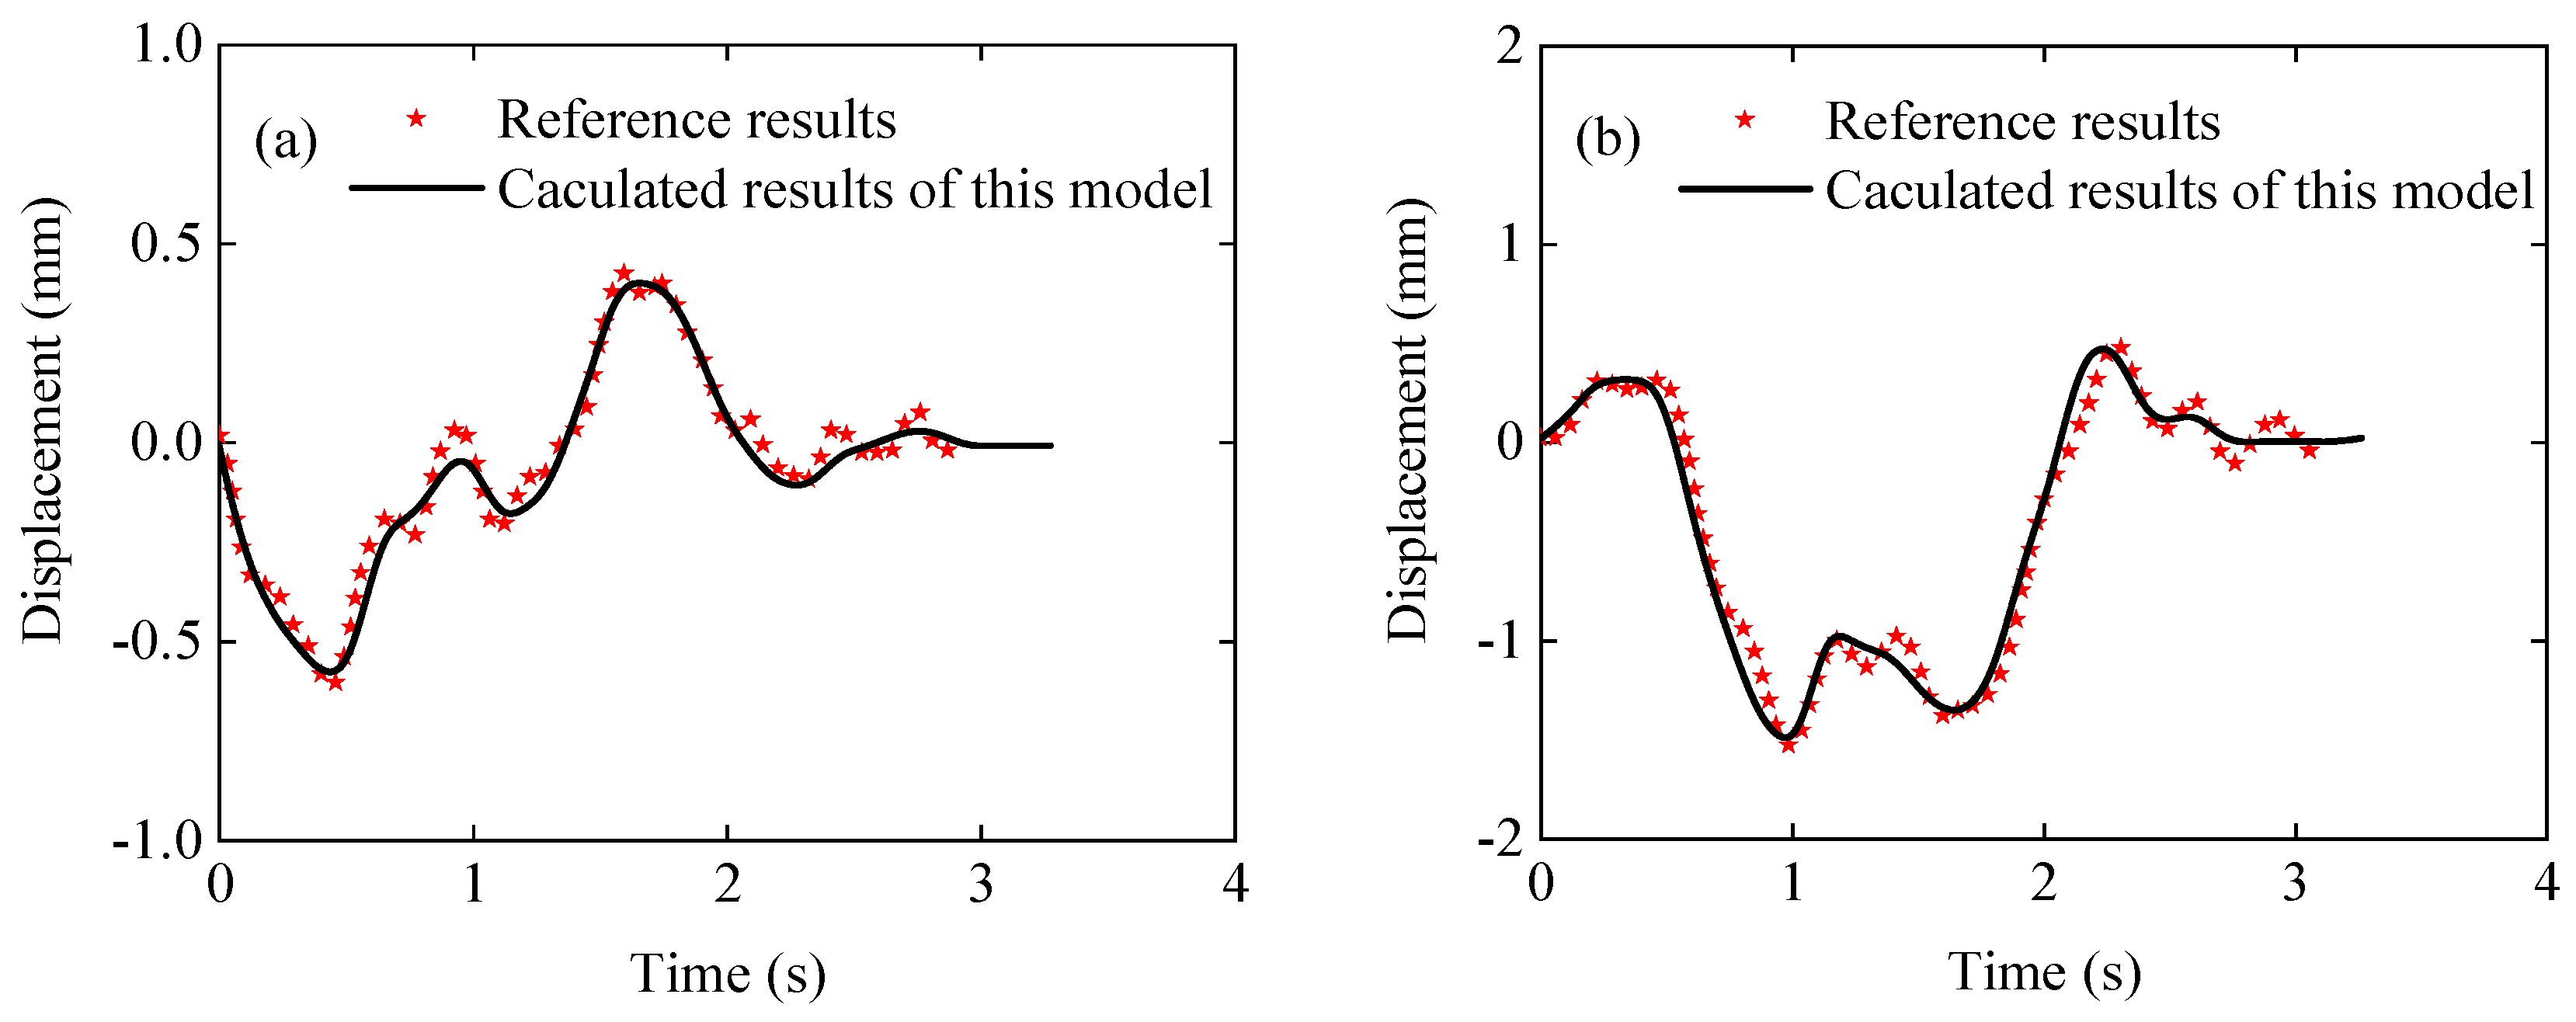
3.6. Validation of Coupling Dynamic Model of Train-LCBTCGB Considering EDS
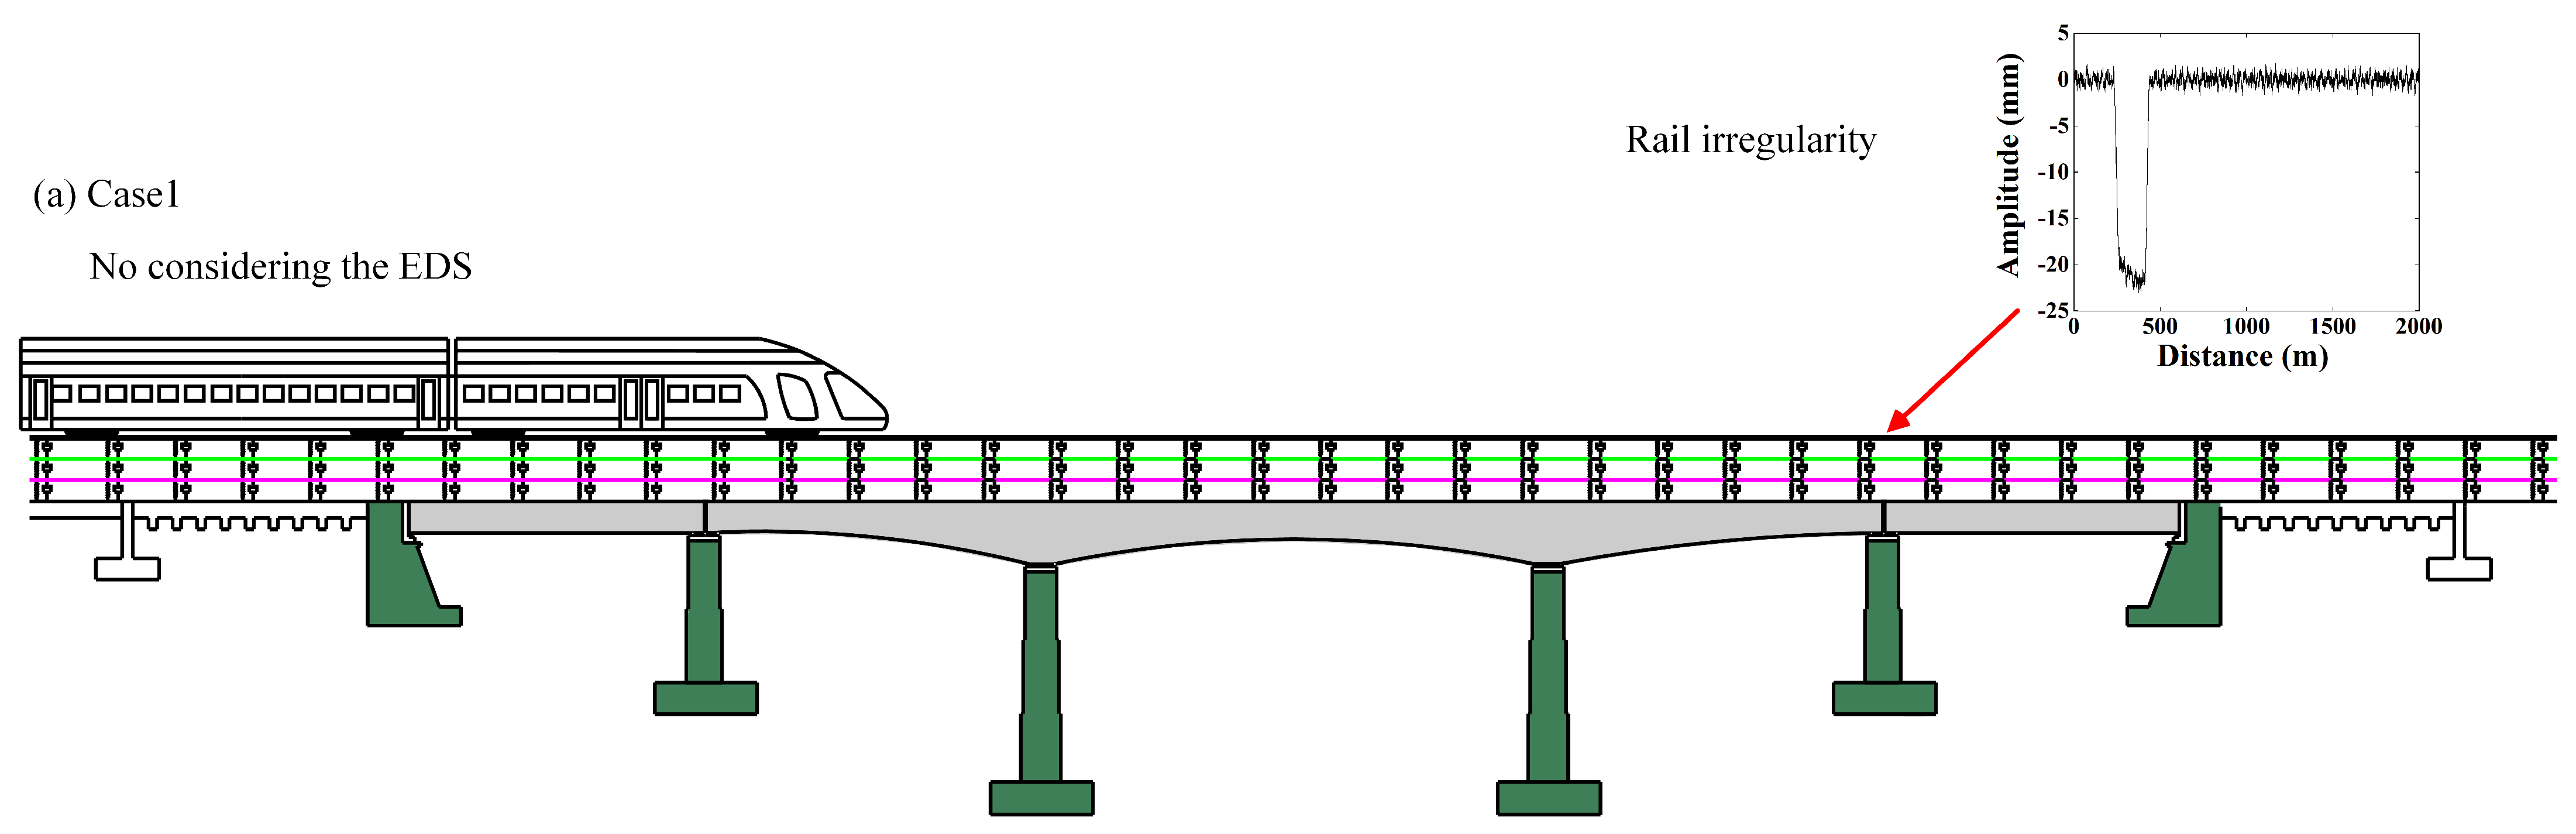
4. Post-Seismic Running Safety of LCBTCGB in the Transverse Bridge Direction, Considering and Not Considering EDS
4.1. Impact on Train Running Performance Considering and Not Considering EDS
4.2. Train Running Safety Analysis Considering and Not Considering EDS
4.3. Post-Seismic Running Safety Threshold Considering and Not Considering EDS
5. Conclusions
- (1)
- A coupled dynamic train–LCBTCGB model considering the EDS was established and verified. The calculated results were in good agreement with the literature results, verifying the accuracy of the established coupled dynamic model.
- (2)
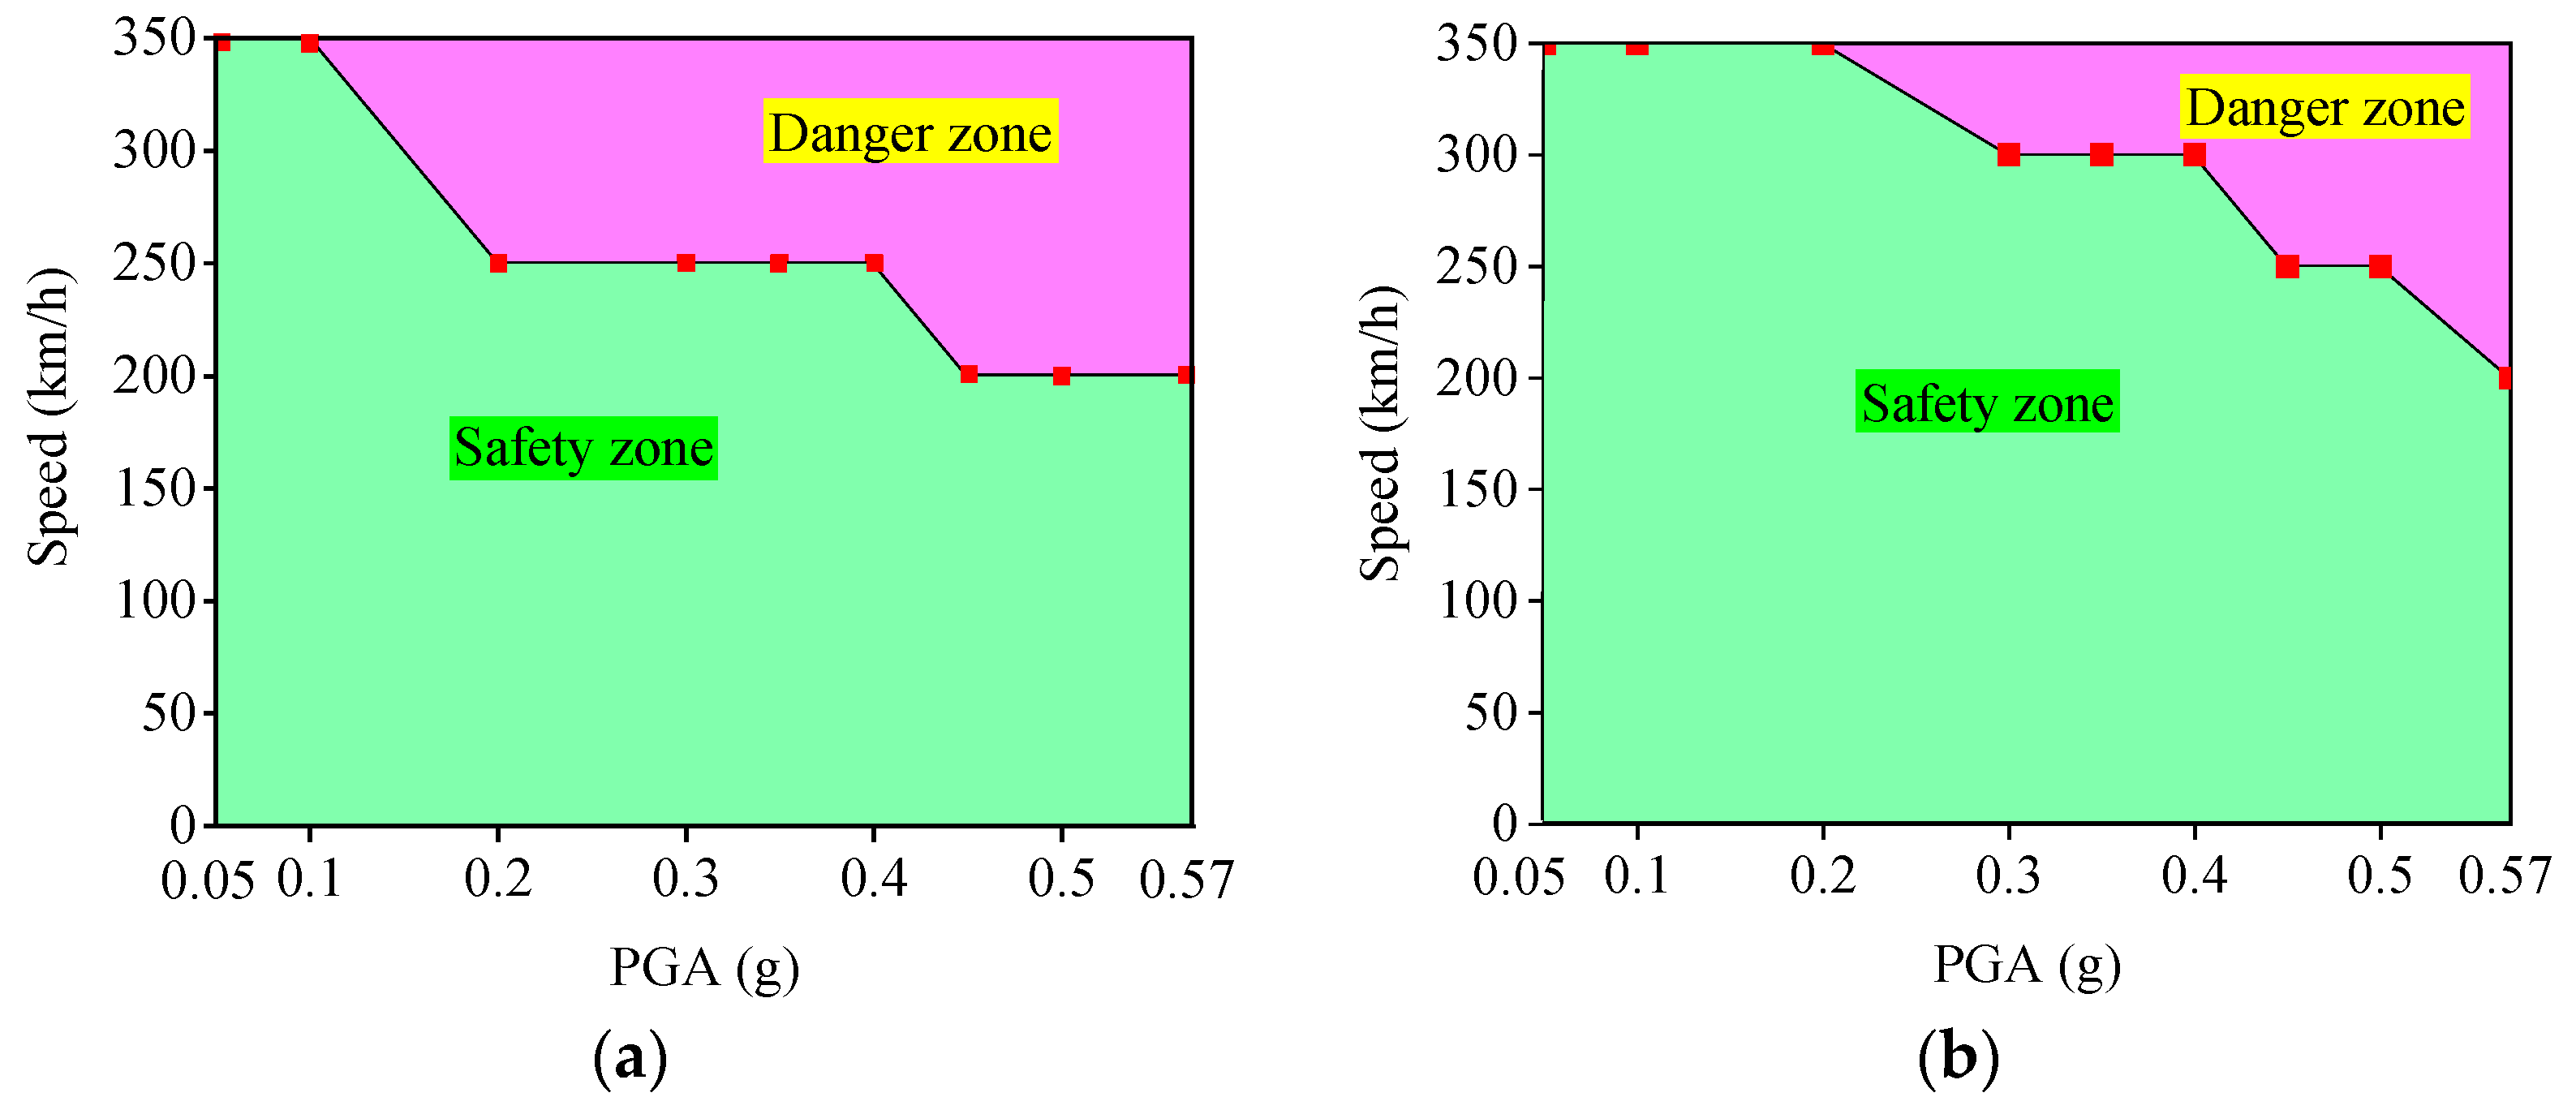
- For rare earthquakes, without considering EDS, the running safety judgment after the earthquake was underestimated, and the risk increased by 13.6%. For designed earthquakes, the running safety risk after an earthquake increased by 18.7% if EDS was not considered. The risk of the train running safety index exceeding the limit did not increase linearly with the earthquake intensities when considering or not considering EDS.
- (3)
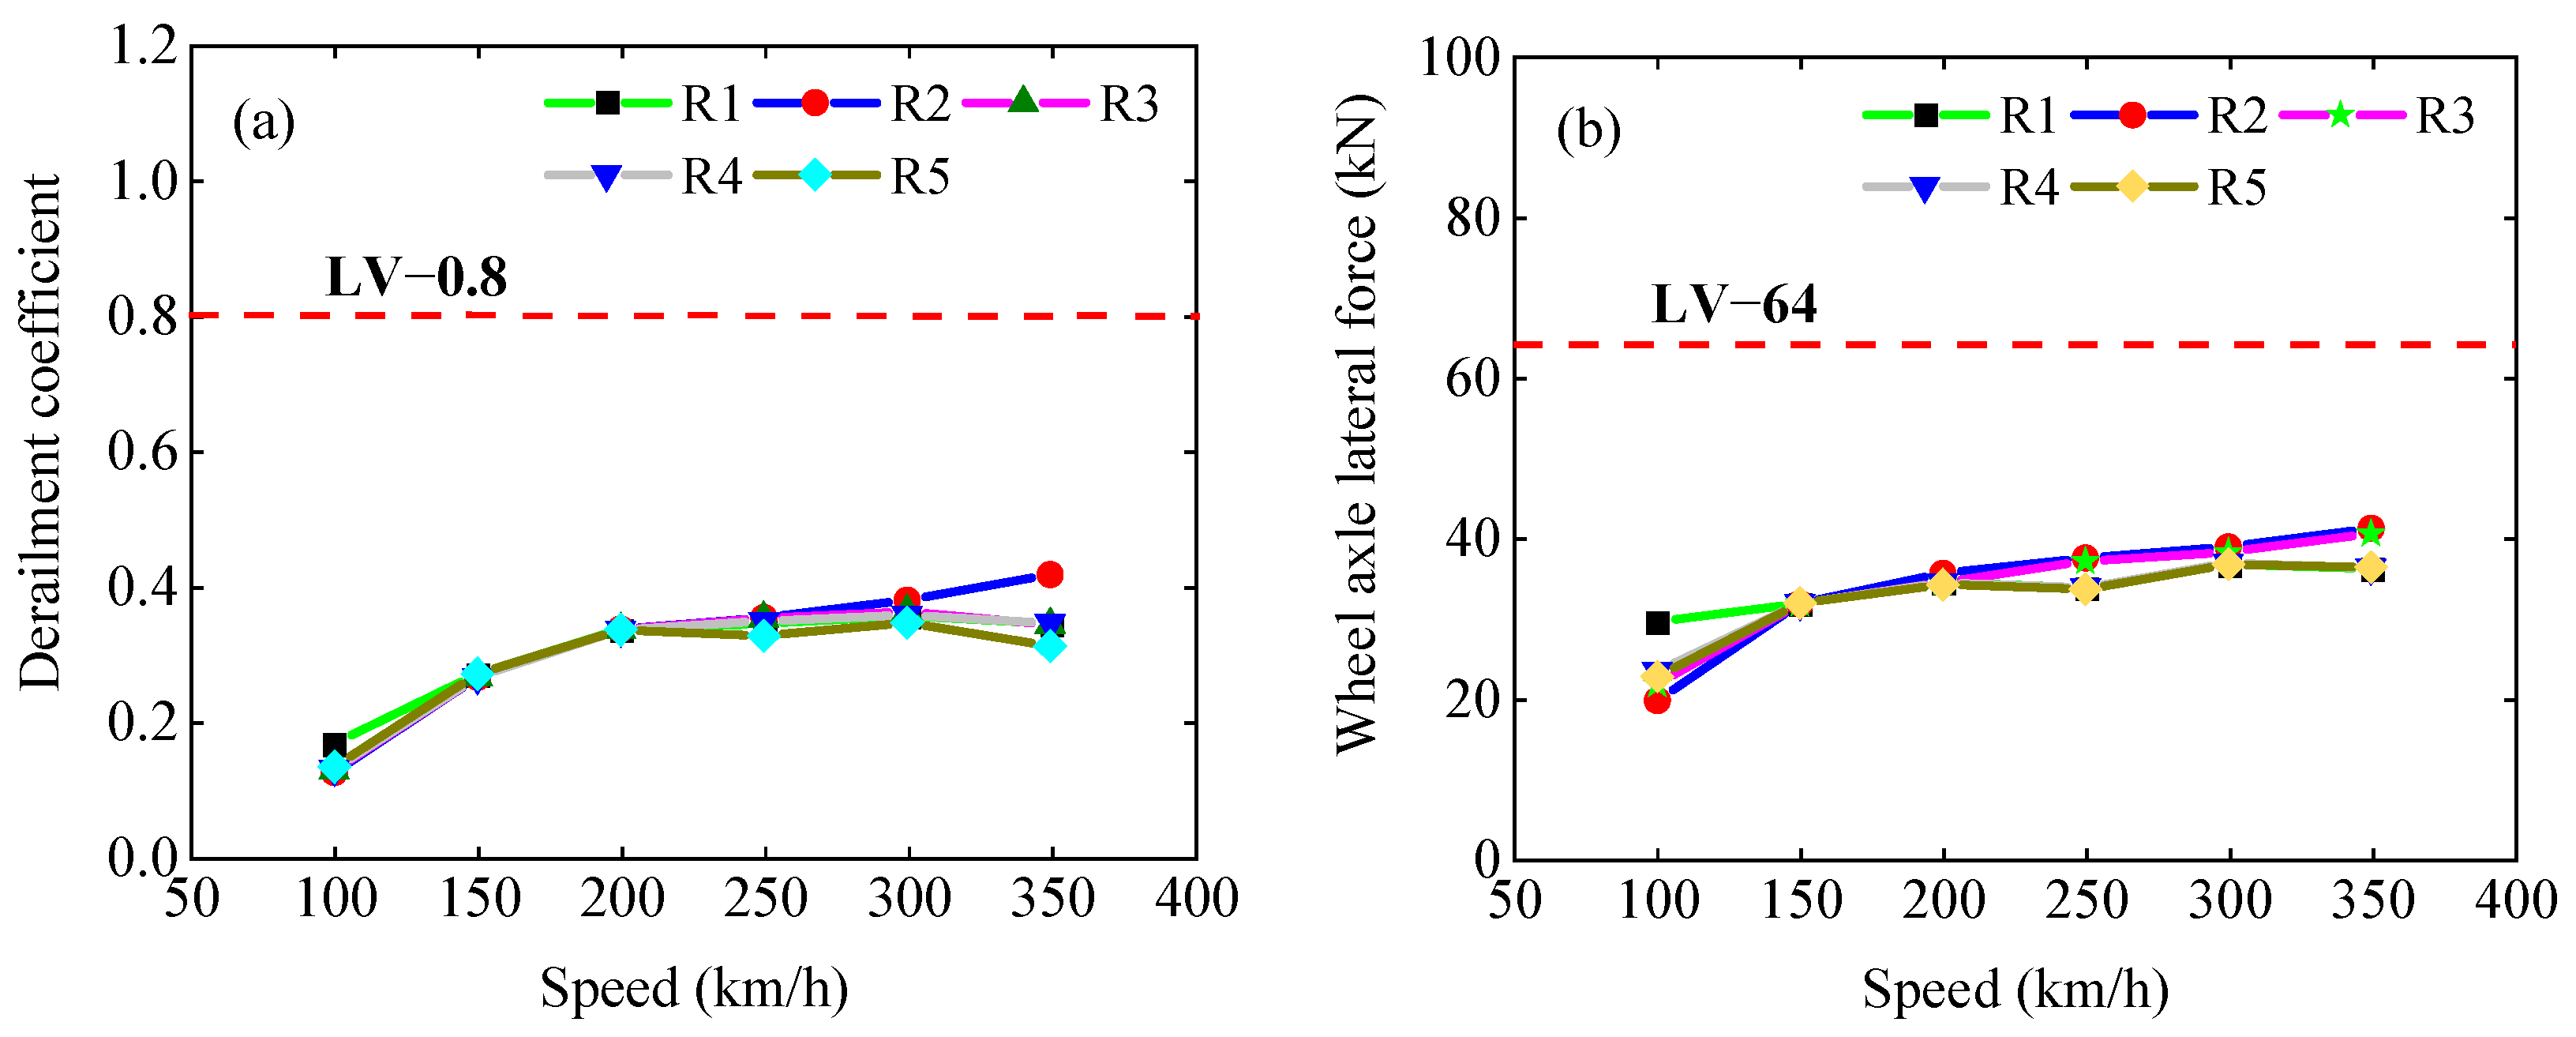
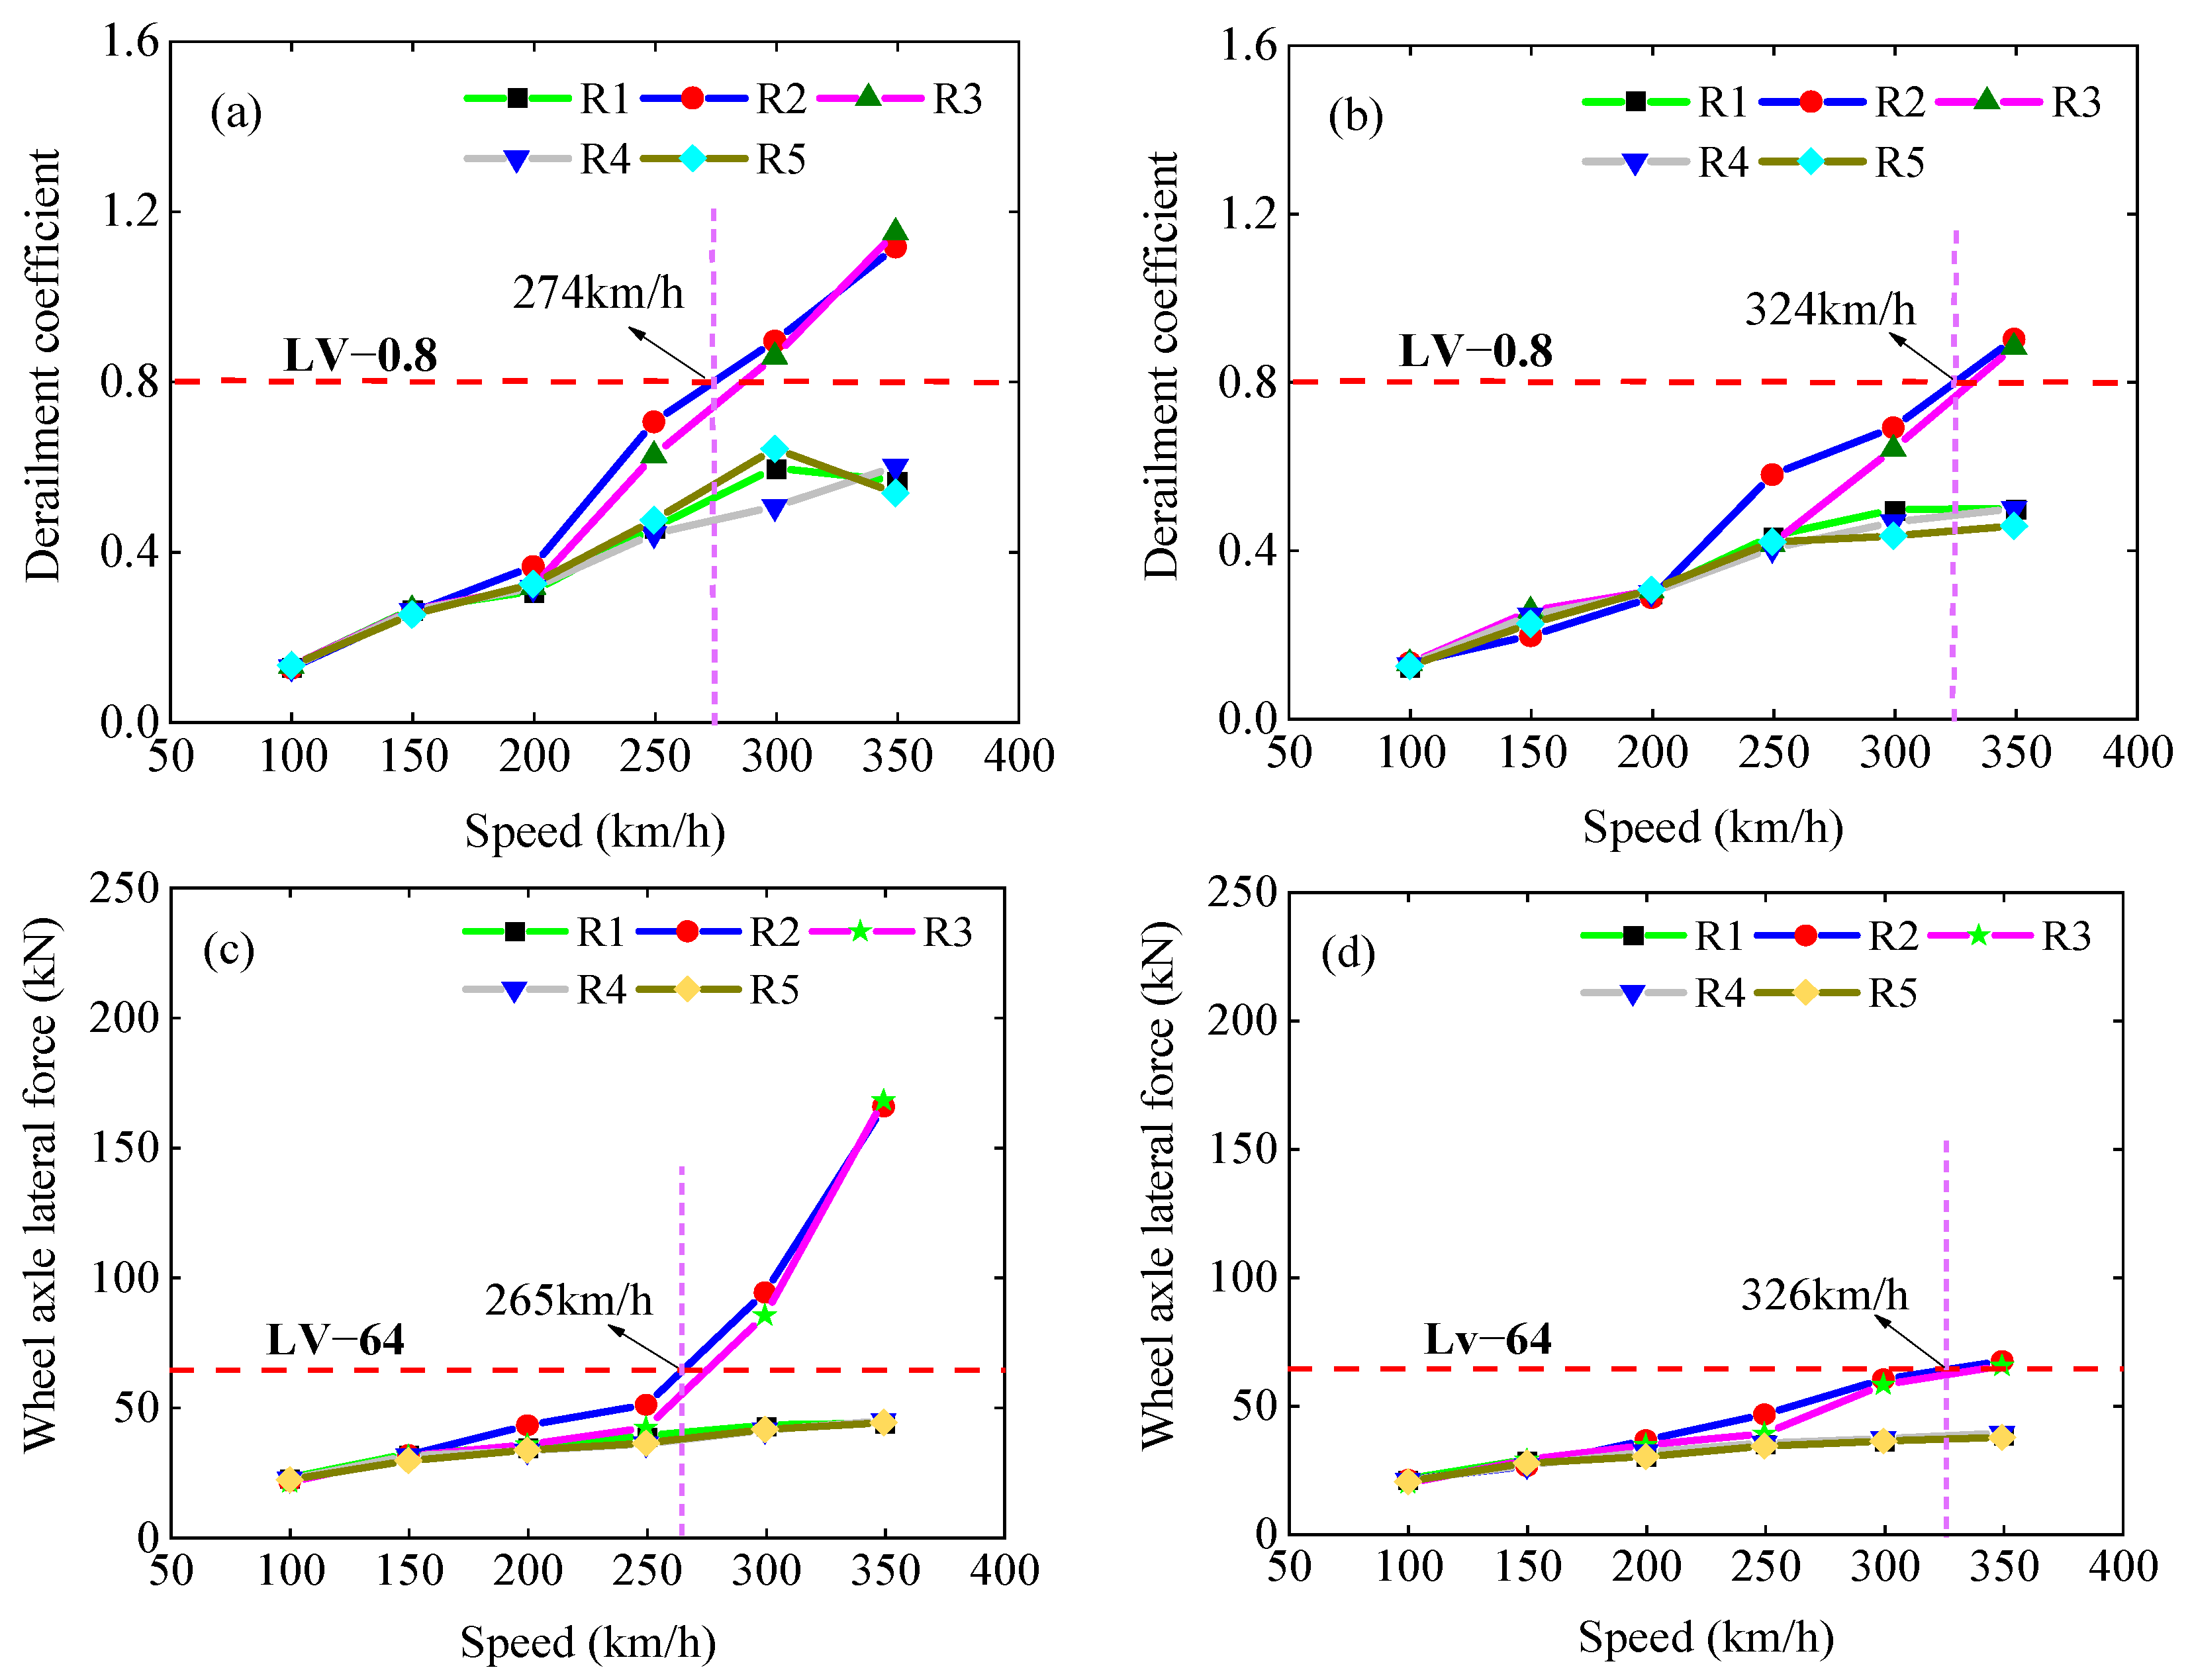
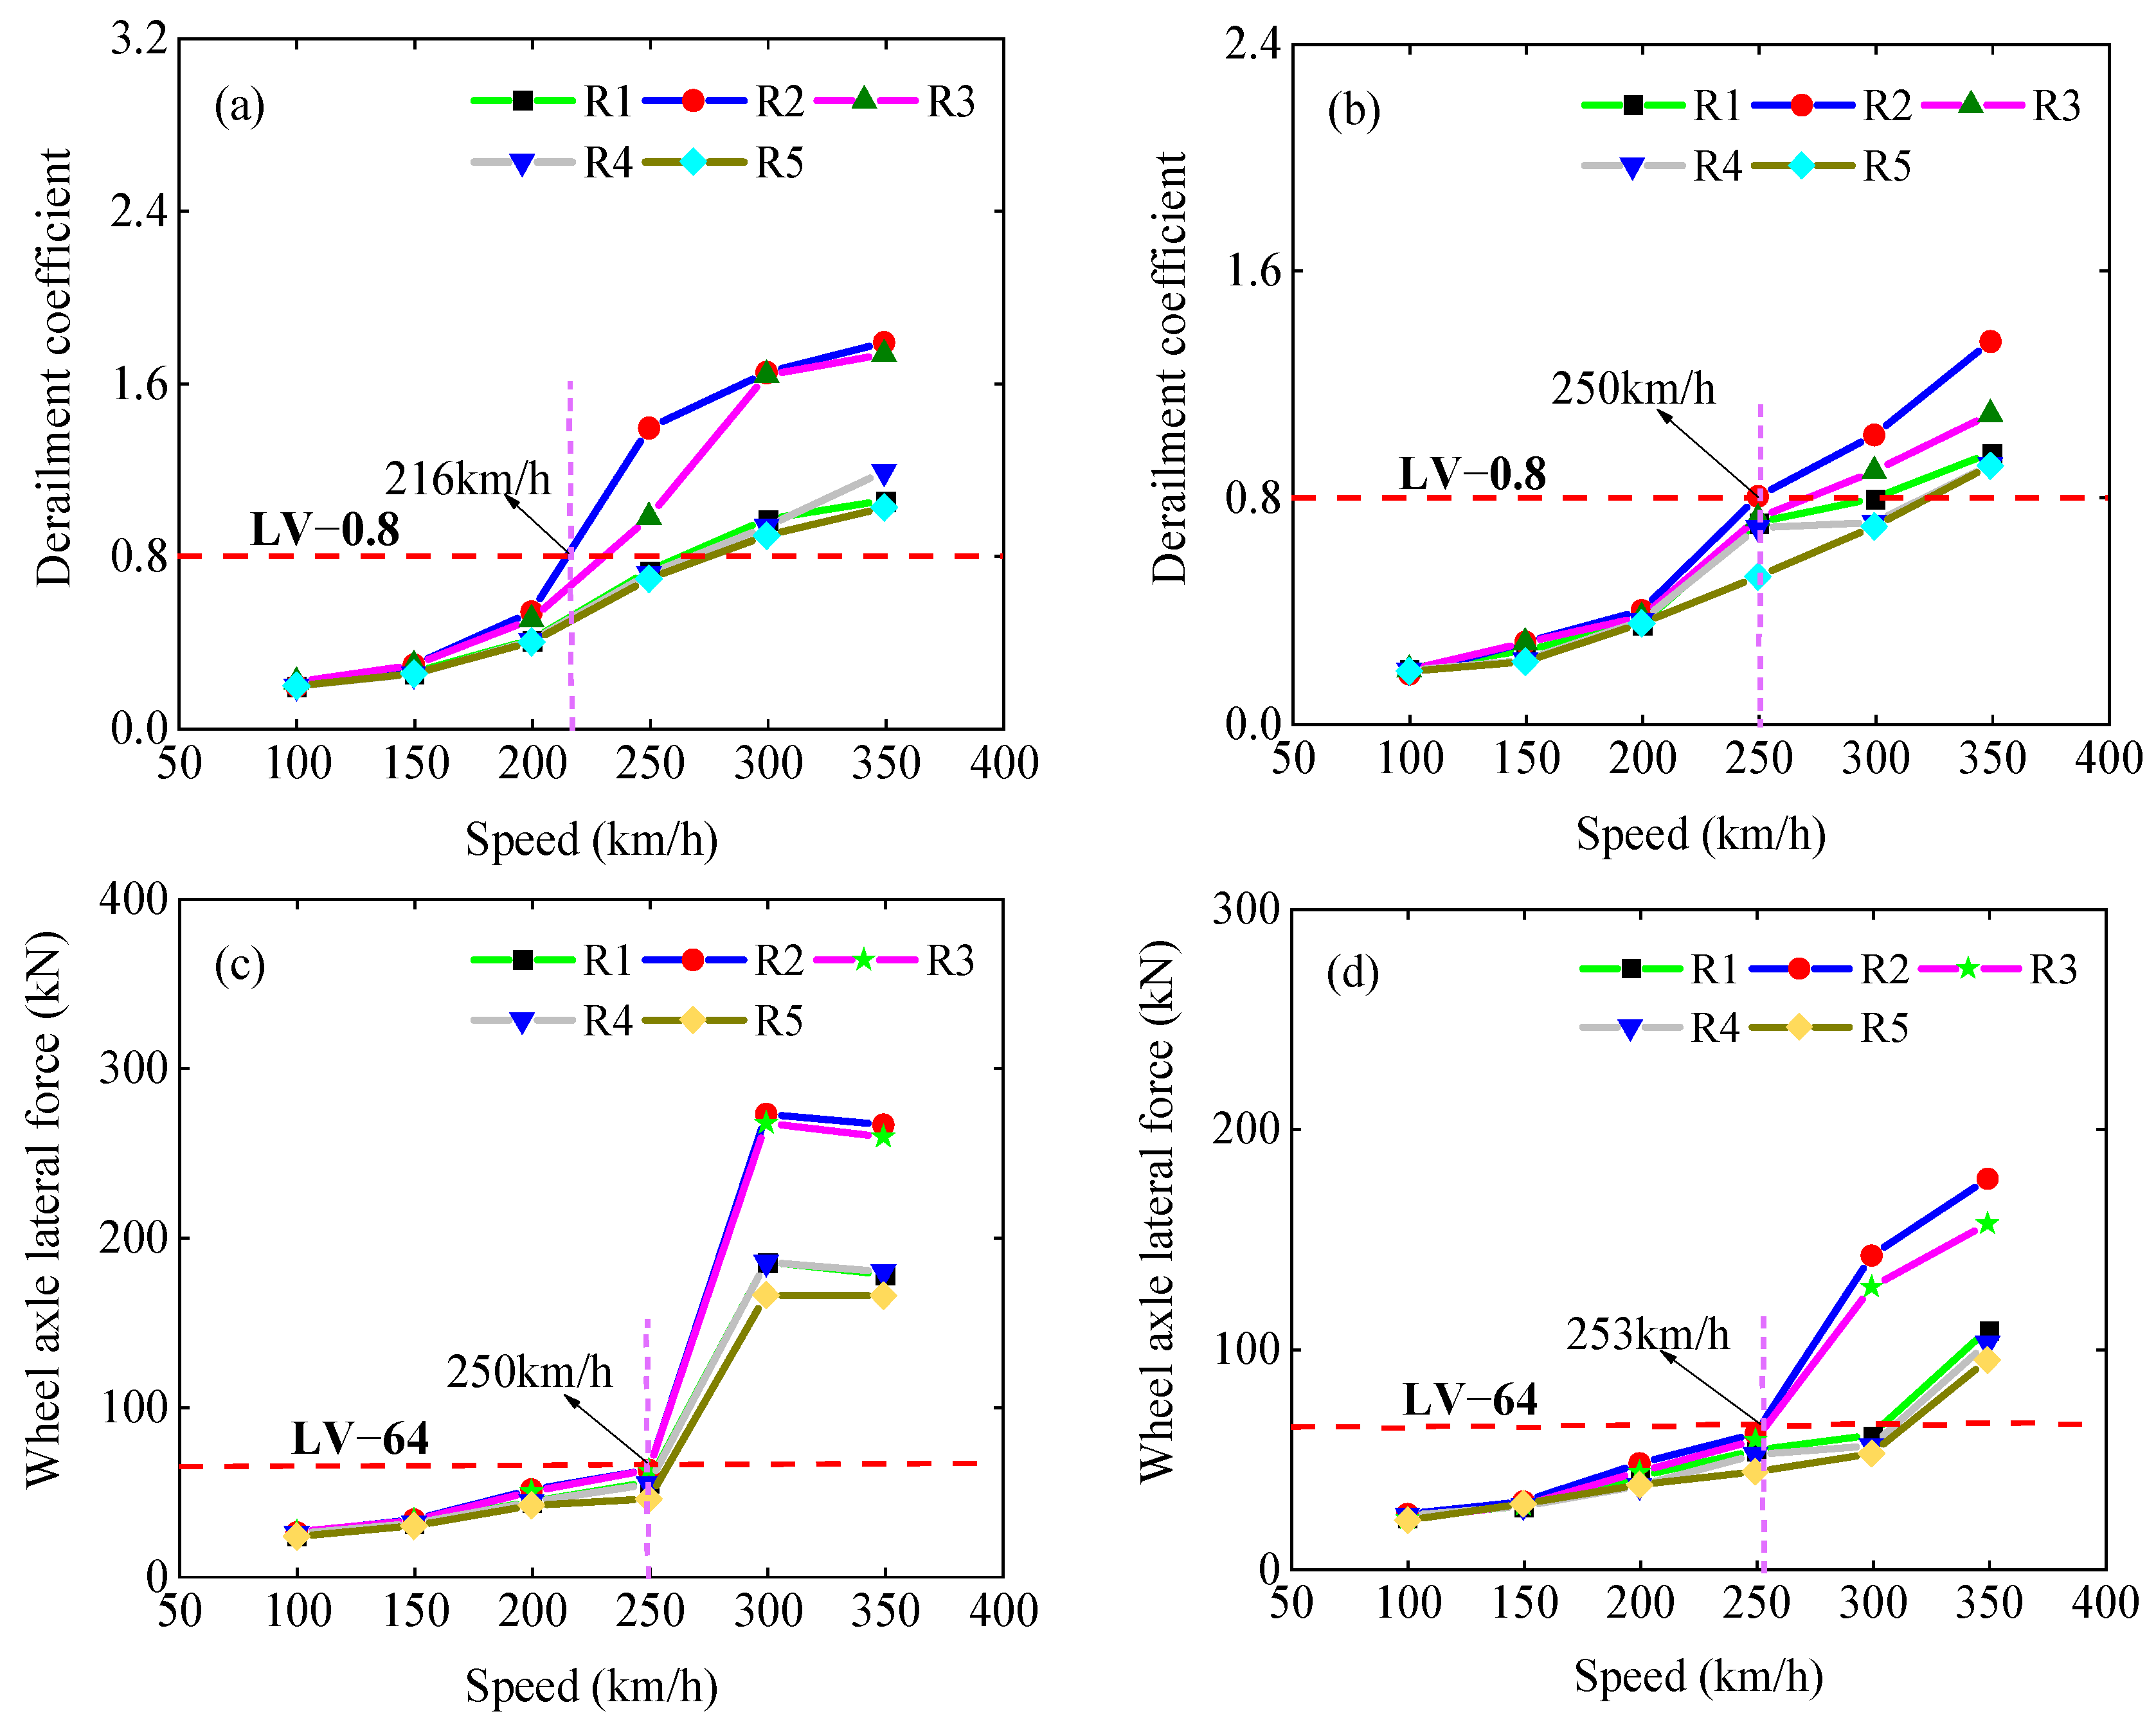
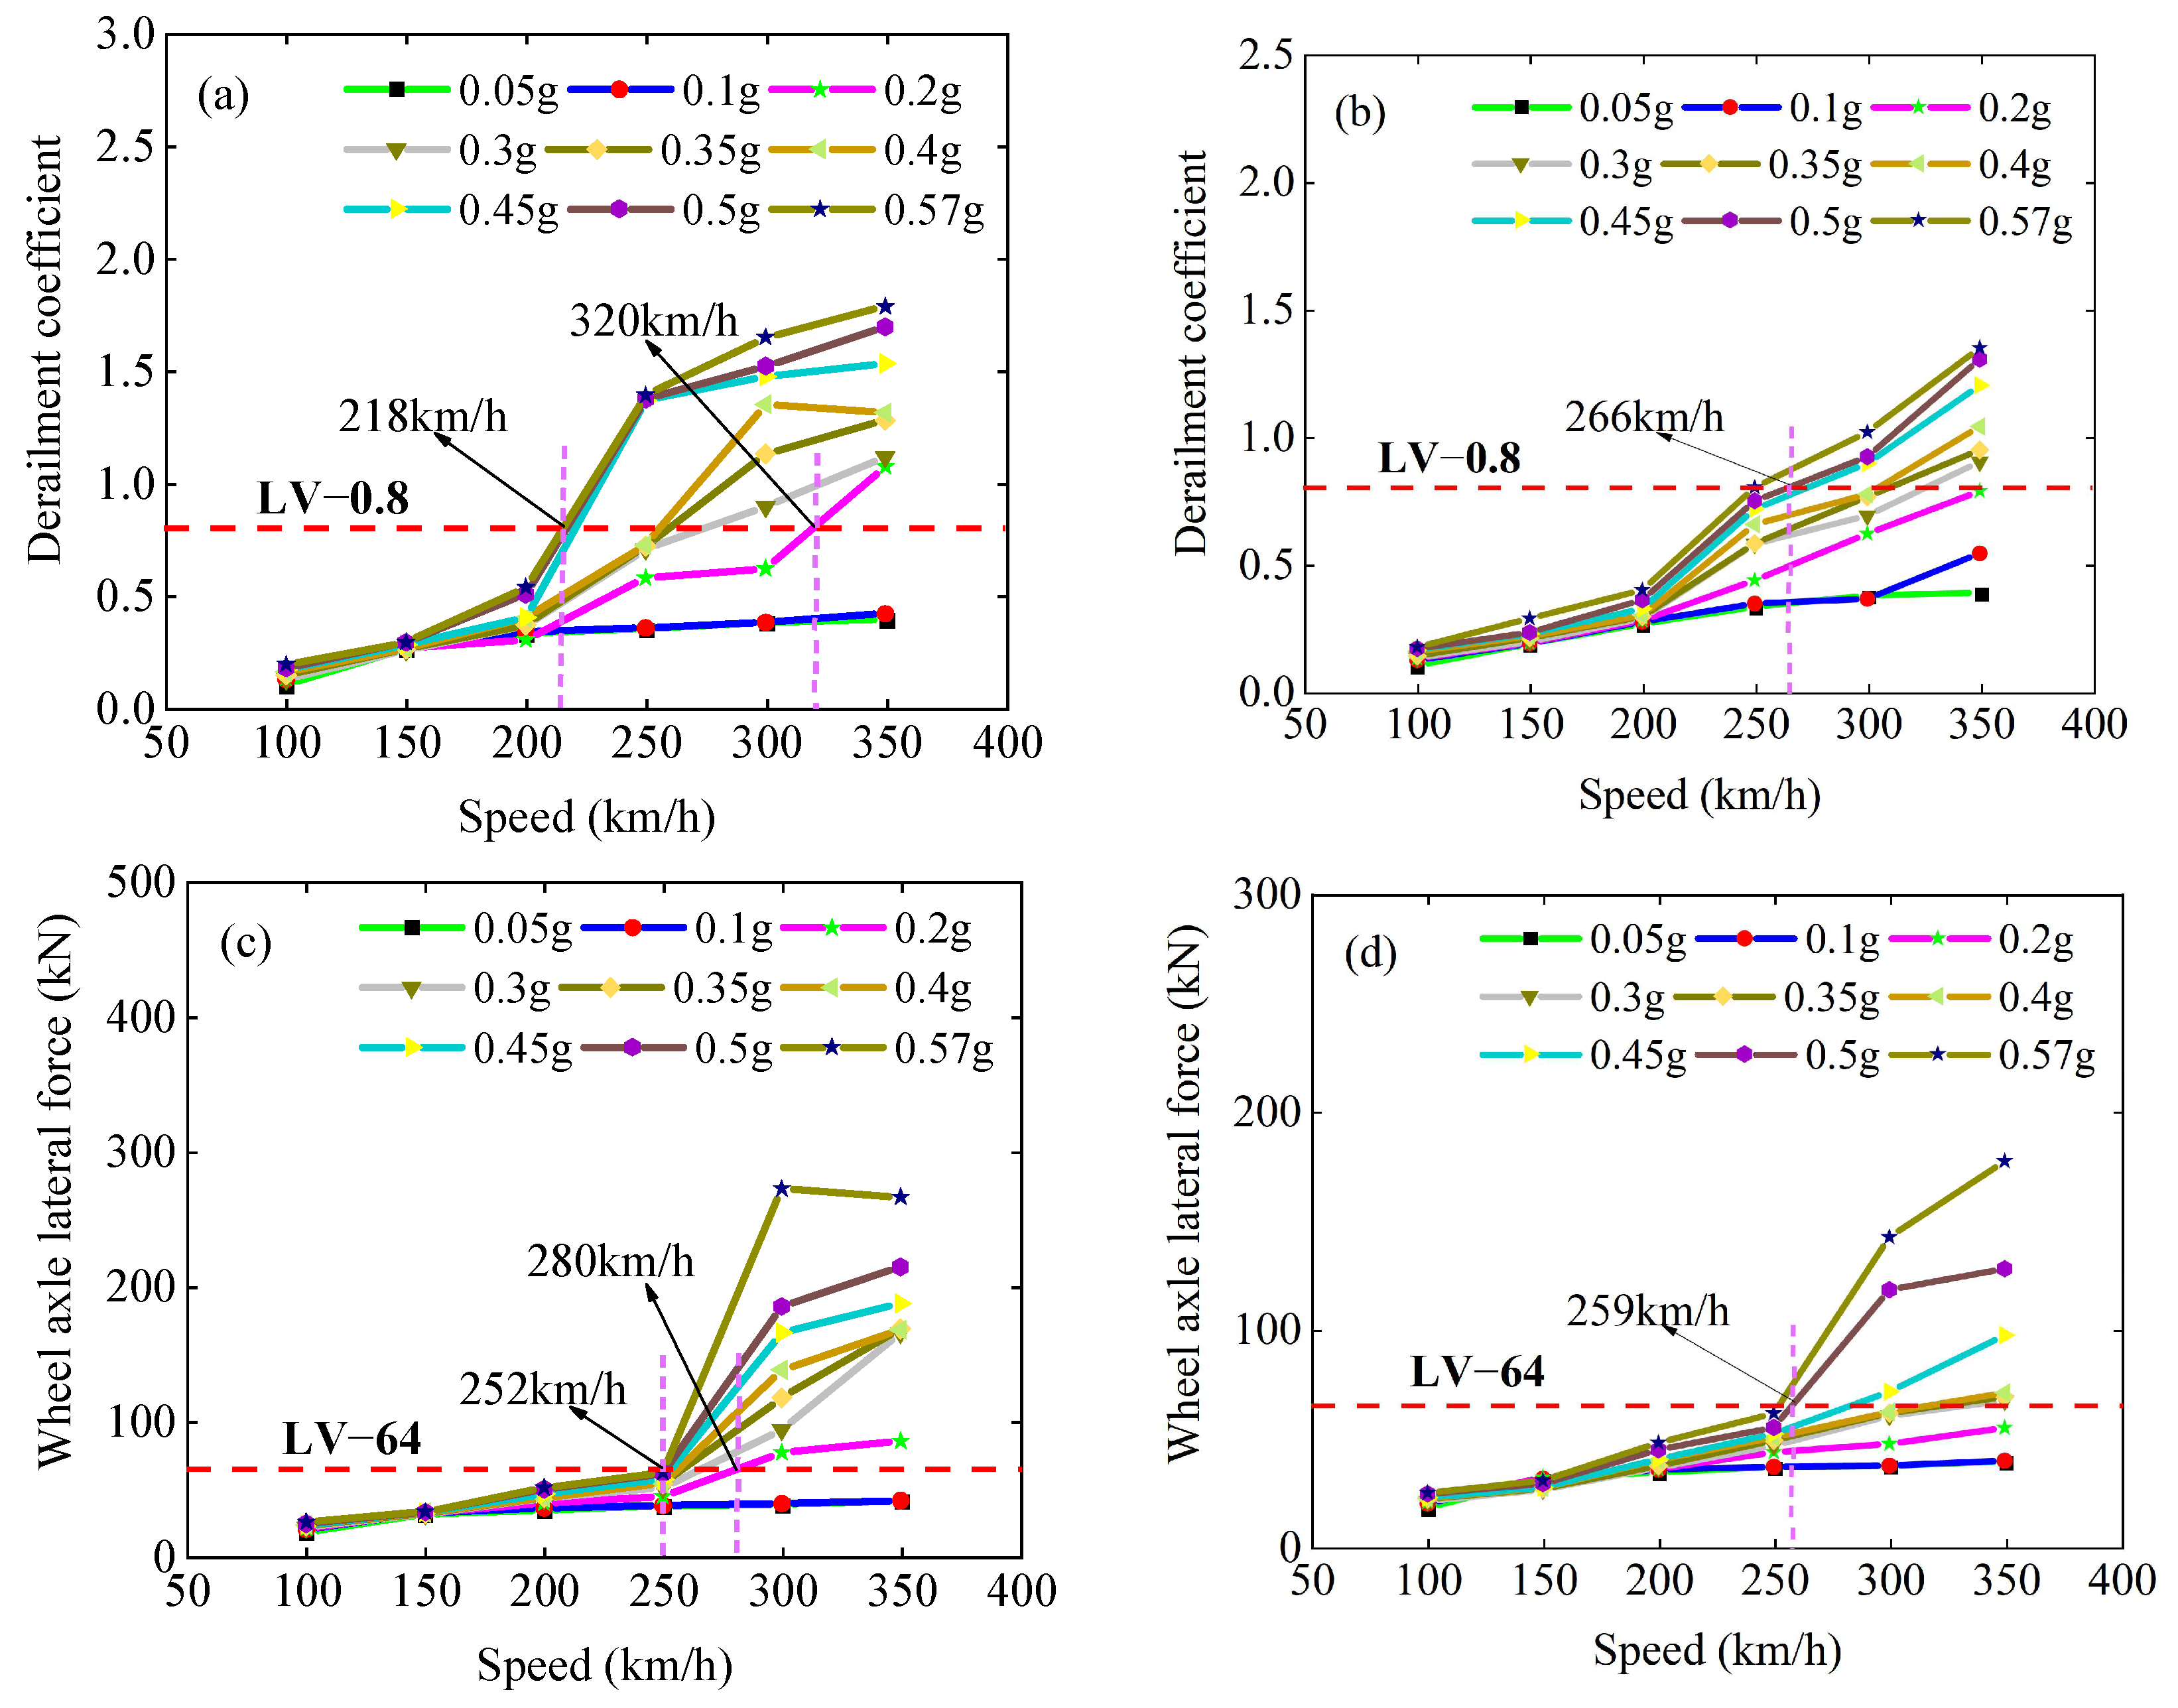
- When considering EDS, the derailment coefficient and wheel axle lateral force exceeded the limit value when the earthquake intensity reached 0.2 g, while when EDS was not considered, the derailment coefficient and wheel axle lateral force exceeded the limit value when the earthquake intensity reached 0.3 g. When the earthquake intensity reached 0.5 g, the influence on the derailment coefficient was greater with or without considering the EDS, but the influence on the wheel axle lateral force was not much different.
- (4)
- When conducting post-earthquake analysis of running safety for LCBTCGBs, it is suggested to consider the EDS.
Author Contributions
Funding
Data Availability Statement
Conflicts of Interest
References
- Liu, S.; Jiang, L.; Zhou, W.; Yu, J.; Xiao, J.; Liao, X. Study of post-earthquake train running performance considering earthquake-induced track irregularity. Veh. Syst. Dyn. 2024, 1–21. [Google Scholar] [CrossRef]
- Hu, Z.; Wei, B.; Jiang, L.; Li, S.; Min, H. Track structural damage index for high-speed railway girder bridges considering residual deformations due to earthquake. Bull. Earthq. Eng. 2022, 20, 6587–6609. [Google Scholar] [CrossRef]
- Guo, W.; Yang, S.; Jiang, L.; Yu, Z.; Zeng, C.; Wang, Y.; Huang, R.; Wu, S.; Ren, S. Effect of near-fault vertical seismic excitation on running safety of trains on high-speed railway bridges. Eng. Struct. 2023, 296, 116880. [Google Scholar] [CrossRef]
- Jiang, L.; Liu, S.L.; Zhou, W.; Jian, Y.; Xiang, L.; Kang, P.; Lingzhi, Z. Study on power spectral density curves of track dynamic irregularity caused by earthquake-induced damage. Eng. Struct. 2023, 51, 1281–1291. [Google Scholar]
- Yu, J.; Jiang, L.; Zhou, W.; Liu, X.; Nie, L.; Zhang, Y.; Feng, Y.; Cao, S. Running test on high-speed railway track-simply supported girder bridge systems under seismic action. Bull. Earthq. Eng. 2021, 19, 3779–3802. [Google Scholar] [CrossRef]
- Lai, Z.; Jiang, L.; Zhou, W.; Yu, J.; Zhang, Y.; Liu, X.; Zhou, W. Lateral girder displacement effect on the safety and comfortability of the high-speed rail train operation. Veh. Syst. Dyn. 2022, 60, 3215–3239. [Google Scholar] [CrossRef]
- Jiang, H.; Zeng, C.; Peng, Q.; Li, X.; Ma, X.-Y.; Song, G.-S. Running safety and seismic optimization of a fault-crossing simply-supported girder bridge for high-speed railways based on a train-track-bridge coupling system. J. Central South Univ. 2022, 29, 2449–2466. [Google Scholar] [CrossRef]
- Mao, J.-F.; Chen, X.-T.; Yu, Z.-W.; Jiang, L.-Z.; Moyi, A.Y. Random dynamic analysis and running safety assessment of long-span cable-stayed bridge under high-speed trains subjected to earthquake excitations and track irregularities. Int. J. Struct. Stab. Dyn. 2023, 23, 2340022. [Google Scholar] [CrossRef]
- Liu, S.; Jiang, L.; Zhou, W.; Yu, J.; Liu, X. Analysis of the influence of CA mortar layer void on the dynamic performance of high-speed trains. Mech. Based Des. Struct. Mach. 2024, 52, 2605–2622. [Google Scholar] [CrossRef]
- Wu, S.; Guo, W.; Jiang, L.; Yu, Z.; Zeng, C.; Wang, Y.; Shao, P.; Huang, R.; Yang, S.; Liang, G.; et al. Dynamic Response and Running Safety of High-Speed Railway Train–Track–Bridge System Under Near-Fault Pulse-Type Ground Motion. Int. J. Struct. Stab. Dyn. 2023, 24, 1–26. [Google Scholar] [CrossRef]
- Liu, L.; Jiang, L.; Zhou, W.; Liu, X.; Peng, D.; Chen, Y. Effect of girder deformation on the dynamic performance of high-speed train-track-bridge coupling system. Struct. Infrastruct. Eng. 2024, 20, 1801–1818. [Google Scholar] [CrossRef]
- Yu, J.; Zhou, W.; Jiang, L. Response spectra of fitted post-seismic residual track irregularity for high-speed railway. Earthq. Eng. Struct. Dyn. 2023, 52, 350–369. [Google Scholar] [CrossRef]
- Lin, X.; Liu, F.; Shan, W. Field survey and analysis on near-fault severely damaged high-speed railway bridge in 2022 M6.9 Menyuan earthquake. Earthq. Eng. Eng. Vib. 2024, 23, 1043–1055. [Google Scholar] [CrossRef]
- Tang, Y.; Zhu, Z.; Ba, Z.; Lee, V.W.; Gong, W. Running safety assessment of trains considering post-earthquake damage state of bridge–track system. Eng. Struct. 2023, 287, 116187. [Google Scholar] [CrossRef]
- Yan, B.; Li, Z.; Liu, S.; Xie, H.-R. Seismic response of CRTS II ballastless track-bridge system considering the damage of track structure. Sci. Prog. 2021, 104, 00368504211035207. [Google Scholar] [CrossRef]
- Feng, Y.; Jiang, L.; Zhou, W.; Chen, M. Post-earthquake track irregularity spectrum of high-speed railways continuous girder bridge. Steel and Composite Structures. Int. J. 2021, 40, 323–338. [Google Scholar]
- Feng, Y.; Hou, Y.; Jiang, L.; Zhou, W.; Yu, J.; Guo, W. Stochastic transverse earthquake-induced damage track irregularity spectrum considering the uncertainty of track-bridge system. Int. J. Struct. Stab. Dyn. 2021, 21, 2140004. [Google Scholar] [CrossRef]
- Sadeghi, J.; Seyedkazemi, M.; Khajehdezfuly, A. Nonlinear simulation of vertical behavior of railway fastening system. Eng. Struct. 2020, 209, 110340. [Google Scholar] [CrossRef]
- Feng, Y.; Li, H.; Yu, J.; Jiang, L.; Zhou, W.; Wu, G. Applicability of existing CRTS II ballastless track—Continuous girder bridge system under near-field transverse rare earthquake. Eng. Struct. 2022, 273, 115076. [Google Scholar] [CrossRef]
- Wei, B.; Yang, T.; Jiang, L. Influence of track structure modeling refinement on seismic susceptibility of continuous girder bridges for high-speed railroads. Eng. Mech. 2018, 35, 16–23+51. [Google Scholar]
- Zhai, W.; Zhai, W. Numerical method and computer simulation for analysis of vehicle-track coupled dynamics. Veh.-Track Coupled Dyn. Theory Appl. 2020, 203–229. [Google Scholar] [CrossRef]
- Lei, X.; Noda, N.-A. Analyses of dynamic response of vehicle and track coupling system with random irregularity of track vertical profile. J. Sound Vib. 2002, 258, 147–165. [Google Scholar] [CrossRef]
- Liu, S.; Jiang, L.; Zhou, W.; Yu, J.; Liu, X. Study on the influence of damage characteristics of longitudinal ballastless track on the dynamic performance of train-track-bridge coupled systems. Arch. Civ. Mech. Eng. 2022, 23, 23. [Google Scholar]
- Kalker, J.J. On the Rolling Contact of Two Elastic Bodies in the Presence of Dry Friction. 1967. Available online: https://api.semanticscholar.org/CorpusID:123555129 (accessed on 5 November 2024).
- Li, X.; Zhu, Y.; Jin, Z. Nonstationary Random Vibration Performance of Train-Bridge Coupling System with Vertical Track Irregularity. Shock. Vib. 2016, 2016, 1450895. [Google Scholar] [CrossRef]
- TB 10621-2014; Code for Design of High Speed Railway. China Railway Press: Beijing, China, 2014.


| Component | Vertical Stiffness (Mpa) | Transverse Stiffness (Mpa) | Yield Point (mm) |
|---|---|---|---|
| Fixed bearing | 1 × 10⁴ | 33.2 | 2 |
| Lateral block | 1.375 × 10³ | 238.68 | 2 |
| Sliding layer | 1.5 × 10³ | 12 | 0.5 |
| Friction plate | 1 × 10⁶ | 4.26 × 10⁶ | 0.5 |
| Symbol | Seismic Area Name | Station Name | RSN | PGA (g) |
|---|---|---|---|---|
| R1 | “Irpinia_Italy-01” | “Auletta” | RSN284_ITALY_A-AUL000.AT2 | 0.05513 |
| R2 | “Superstition Hills-02” | “Parachute Test Site” | RSN723_SUPER.B_B-PTS225.AT2 | 0.43182 |
| R3 | “Imperial Valley-06” | “El Centro Array #3” | RSN178_IMPVALL.H_H-E03140.AT2 | 0.26739 |
| R4 | “Coyote Lake” | “Gilroy Array #4” | RSN149 _COYOTELK_G04270.AT2 | 0.23291 |
| R5 | “Loma Prieta” | “Gilroy Array #3” | RSN767_LOMAP G03000.AT2 | 0.55912 |
| Components | Indexes | Limit Value of Transverse Damage | |||
|---|---|---|---|---|---|
| Slight | Moderate | Severe | Complete | ||
| Fixed bearings | Displacement | 2 | 4 | 6 | 8 |
| Sliding layer | Displacement | 0.5 | 1.0 | 1.5 | 2 |
| Friction plate | Displacement | 0.5 | 1.0 | 1.5 | 2 |
| Fastener | Displacement | 2 | 3 | 4 | 5 |
| Lateral block | Displacement | 2 | 3 | 4 | 5 |
| Parameter | Motor Car | Trail Car | Parameter | Motor Car | Trail Car |
|---|---|---|---|---|---|
| (kg) | 4.8 × 10⁴ | 4.4 × 10⁴ | (N/m·s) | 0 | 0 |
| (kg·m2) | 1.15 × 10⁵ | 1 × 10⁵ | (N/m·s) | 5 × 10⁴ | 5 × 10⁴ |
| (kg·m2) | 2.7 × 10⁶ | 2.7 × 10⁶ | (kg·m2) | 2.4 × 10⁵ | 2.8 × 10⁵ |
| (kg·m2) | 2.7 × 10⁶ | 2.7 × 10⁶ | (kg·m2) | 4.8 × 10⁵ | 5.6 × 10⁵ |
| (kg) | 3.2 × 10³ | 2.4 × 10³ | (N/m·s) | 4 × 10⁵ | 3 × 10⁵ |
| (kg·m2) | 3.2 × 10³ | 2.4 × 10³ | (N/m·s) | 1.2 × 10⁵ | 1.2 × 10⁵ |
| (kg·m2) | 7.2 × 10³ | 5.4 × 10³ | (N/m·s) | 3 × 10⁴ | 2.5 × 10⁴ |
| (kg·m2) | 6.8 × 10³ | 5.1 × 10³ | (N/m·s) | 6 × 10⁴ | 6 × 10⁴ |
| (kg) | 2.4 × 10³ | 2.4 × 10³ | (m) | 1.25 | 1.25 |
| (kg·m2) | 1.2 × 10³ | 1.2 × 10³ | (m) | 8.6875 | 9 |
| (kg·m2) | 1.2 × 10³ | 1.2 × 10³ | (m) | 1.025 | 1.025 |
| (N/m) | 9 × 10⁶ | 1.5 × 10⁷ | (m) | 1.025 | 1.025 |
| (N/m) | 3 × 10⁶ | 5 × 10⁶ | (m) | 0.36 | 0.83 |
| (N/m) | 1.04 × 10⁶ | 7 × 10⁵ | (m) | 0.24 | 0.15 |
| (N/m·s) | 0 | 0 | (m) | 0.33 | 0.34 |
Disclaimer/Publisher’s Note: The statements, opinions and data contained in all publications are solely those of the individual author(s) and contributor(s) and not of MDPI and/or the editor(s). MDPI and/or the editor(s) disclaim responsibility for any injury to people or property resulting from any ideas, methods, instructions or products referred to in the content. |
© 2024 by the authors. Licensee MDPI, Basel, Switzerland. This article is an open access article distributed under the terms and conditions of the Creative Commons Attribution (CC BY) license (https://creativecommons.org/licenses/by/4.0/).
Share and Cite
Feng, Y.; Xu, S.; Wu, B.; Zhou, W.; Liu, X.; Wu, L.; Rao, J.; Xiang, P.; Guo, Z. Transverse-Direction Post-Seismic Running Safety of Longitudinally Connected Ballastless Track–Continuous Girder Bridge Systems Considering Earthquake Damage State. Buildings 2024, 14, 3803. https://doi.org/10.3390/buildings14123803
Feng Y, Xu S, Wu B, Zhou W, Liu X, Wu L, Rao J, Xiang P, Guo Z. Transverse-Direction Post-Seismic Running Safety of Longitudinally Connected Ballastless Track–Continuous Girder Bridge Systems Considering Earthquake Damage State. Buildings. 2024; 14(12):3803. https://doi.org/10.3390/buildings14123803
Chicago/Turabian StyleFeng, Yulin, Shenglin Xu, Bitao Wu, Wangbao Zhou, Xiang Liu, Liangqin Wu, Junhuan Rao, Ping Xiang, and Zhongzhao Guo. 2024. "Transverse-Direction Post-Seismic Running Safety of Longitudinally Connected Ballastless Track–Continuous Girder Bridge Systems Considering Earthquake Damage State" Buildings 14, no. 12: 3803. https://doi.org/10.3390/buildings14123803
APA StyleFeng, Y., Xu, S., Wu, B., Zhou, W., Liu, X., Wu, L., Rao, J., Xiang, P., & Guo, Z. (2024). Transverse-Direction Post-Seismic Running Safety of Longitudinally Connected Ballastless Track–Continuous Girder Bridge Systems Considering Earthquake Damage State. Buildings, 14(12), 3803. https://doi.org/10.3390/buildings14123803