Abstract
To optimize the outdoor thermal comfort and sunlight hours of elderly residential areas in cold regions of China, we collected data on streets and building forms from 121 elderly residential sites in Beijing. Utilizing parametric modeling tools to generate ideal residential models, a multi-objective optimization algorithm was applied to identify 144 Pareto solutions. The optimal solutions were analyzed using K-means clustering and Pearson correlation analysis to examine how block form affects outdoor environmental performance. The universal thermal climate index (UTCI) in summer showed significant positive correlations (r > 0.72) with the distance between buildings (DB), building density (BD), shape coefficient (SC), and coefficient of variation for building height (CVH), and significant negative correlations (r < −0.82) with average building height (AH), floor area ratio (FAR), volume area ratio (VAR), mean building area (MA), average building volume (AV), and open space ratio (OSR). Winter UTCI was significantly positively correlated with AH, FAR, VAR, MA, and AV (r > 0.83) and significantly negatively correlated with DB, porosity (PO), SC, and CVH (r < −0.88). Sunlight hours were significantly positively correlated with DB, PO, OSR, and CVH (r > 0.84) and significantly negatively correlated with AH, BD, FAR, SC, VAR, MA, and AV (r > 0.88). Courtyard and point-building configurations performed the best across all optimization objectives. (The value of r, Pearson’s correlation coefficient, ranges from −1 to +1. r = +1: Perfect positive correlation, r = −1: Perfect negative correlation, r = 0: No linear correlation).
1. Introduction
Aging populations present a major challenge worldwide [1]. It is estimated that, by 2070, the global population aged 65 years and older will reach 2.2 billion, surpassing the number of people under the age of 18 years [2]. In China, the aging process started later but has developed rapidly. China transitioned from an aging society to a deeply aging society within 25 years, and it is expected that, by 2025, the elderly population will reach 300 million, accounting for >25% of the total population [3]. The rapid development of an aging society has sparked widespread discussion and concern worldwide regarding methods and strategies for improving the quality of living environments for the elderly. Currently, most research on improving the quality of living environments for the elderly focuses on environmental friendliness (creating livable residential environments for the elderly) [4,5,6], environmental safety (including age-friendly, barrier-free design, and creating safe neighborhood spaces) [7,8], environmental richness (designing spaces to meet various social activity needs of the elderly) [9,10], and environmental comfort (adjusting environmental performance to enhance the comfort of the elderly) [11,12,13]. Research on environmental comfort has primarily focused on the indoor environments of buildings with different functionalities. The key areas of study include home indoor environments [14], transitional spaces in elderly care centers [11], and indoor environments of senior apartments [15]. However, owing to a gradual decline in physical function with age, the activity spaces of elderly residents are relatively limited, with their outdoor environment (e.g., community surroundings, elderly care centers, and senior apartments) becoming the primary venue for daily social interactions [16,17].
Elderly individuals who frequently go outdoors can effectively prevent cognitive decline, alleviate depressive moods [18], stimulate vitality, and enhance their sense of well-being [19]. Additionally, frequent outdoor activities can reduce the risk of common diseases in the elderly, such as Parkinson’s disease [20] and Alzheimer’s disease [21]. A comfortable residential outdoor environment can increase the frequency and duration of outdoor activities among the elderly, thereby significantly promoting their social interactions and physical and mental health [22]. However, the current quality of residential outdoor environments does not meet the needs of the elderly [23]. Therefore, creating a comfortable residential outdoor environment for the elderly and encouraging them to go outdoors and engage in activities has become an increasingly crucial issue that must be addressed.
1.1. Literature Review
There are three key aspects to comprehensively understanding the relationship between urban morphology and environmental performance: (1) the impact of urban morphology on environmental performance, including the thermal environment and lighting conditions; (2) the effects of environmental performance on older adults, particularly regarding its role in promoting outdoor activities and enhancing the quality of life; and (3) the application of multi-objective optimization methods in urban morphology design, including the potential of optimization algorithms to improve environmental performance from a methodological perspective.
1.1.1. Urban Morphology and Environmental Performance
The limited research focusing on the performance of the outdoor environment in elderly residential areas mainly targets individual buildings, such as outdoor open spaces [24] and central green spaces [25]. Building spaces exist within urban spaces, and the two interact, forming a relationship between the local and overall environments. Consequently, the performance of a residential environment is inevitably influenced by the overall environment [26]. In recent years, an increasing number of studies have focused on improving the performance of outdoor residential environments from an urban perspective.
Numerous studies have demonstrated that urban morphology significantly affects outdoor environmental performance [27,28,29]. Urban morphology affects outdoor comfort by altering the microclimate through interbuilding effects [30], heat transfer [13], solar access [28], and ventilation conditions [31]. In hot or cold climates, unfavorable urban morphology can lead to more pronounced urban heat island [32] and urban cool island [33] effects. Therefore, optimizing the urban morphology is considered an effective approach for enhancing environmental performance.
The relationship between urban morphology and outdoor thermal comfort has been extensively studied. In general, there are two methods for evaluating thermal comfort: one based on the actual thermal perception of the human body in outdoor environments and the other using quantitative indicators. Common indicators include the physiologically equivalent temperature, universal thermal climate index (UTCI), and outdoor standard effective temperature. Using a coupled thermoradiative model and computational fluid dynamics (CFD) model, one study compared the thermal comfort of three urban morphologies in an ecological district in France: open, intermediate horizontal, and semi-open city blocks. The results indicated that the open city block had the best thermal comfort [34]. Another method based on field experiments investigated the factors influencing outdoor thermal comfort through on-site measurements of 48 students on a university campus. They concluded that direct sunlight, shading, and wind turbulence quantitatively affect thermal perception [35]. A recent study from northeastern Algeria analyzed the urban morphology of three typical residential areas in the city of Skikda and discussed how the building height-to-width ratio (H/W) and sky view factor (SVF) affect the outdoor thermal environment. Higher H/W and lower SVF were found to be associated with more comfortable outdoor thermal environments [36]. Another study used onsite measurements and thermal comfort surveys to examine the impact of urban morphology on pedestrian outdoor thermal comfort in a commercial area in Harbin, China [37]. A case study analyzed the urban morphology of modern, contemporary, and historical areas in Mashhad and suggested relevant urban design strategies to enhance thermal comfort [38].
Urban morphology is also a key factor influencing the available daylight. Increasing sunlight duration and quality have long been important indicators for assessing the livability and well-being of residential areas for the elderly [39]. A recent study investigated the relationship between urban form and the potential for daylight exposure in humans. The results showed that when the urban canyon width was <25 m, the color of the building façades, particularly orange and blue, significantly impacted the non-image-forming potential of daylight [40]. A case from China used typical urban morphologies in areas with low sunlight, and the sunlight potential was compared and analyzed through climate-based daylight modeling. The study found that the urban layout significantly influences the overall daylight potential of south-facing building façades, with square and rectangular buildings having better daylight potential [41]. Another study proposed a workflow based on artificial neural networks that considered daylight, sunshine duration, and outdoor thermal comfort for residential design [42]. Additionally, the connection between urban morphology and various environmental performance indicators, such as solar potential [43], wind comfort [44], and the acoustic environment [45], has received wide attention.
From the perspective of study participants, most research focuses on mixed-age groups, with relatively few studies targeting the elderly. Elderly people differ from younger and middle-aged people in terms of activity range, environmental perception, and the typical functions of their residential buildings, necessitating studies specifically for the elderly population. Moreover, from a climatic perspective, most of the optimization goals in the aforementioned studies were concentrated in hot regions. Different climatic zones elicit different microclimate comfort responses, and the research results from other climatic zones cannot be directly applied.
1.1.2. Influence of Environmental Performance on Older Adults
Various physical indicators of outdoor spaces (such as outdoor wind comfort, sunlight duration, temperature, and humidity) are closely related to the health of elderly people [46]. The outdoor thermal environment is a significant factor affecting the elderly. Compared with other age groups, their immune system and physiological regulation abilities are generally weaker, decreasing their sensitivity to temperature with age [47,48]. Low and high temperatures pose high potential health risks [49] and increase the incidences of cardiac arrest [50], respiratory diseases [51], and cardiovascular diseases [52]. In urban environments, short-term or several consecutive days of extreme temperatures, particularly extremely low temperatures, can increase mortality risk among the elderly [53].
In studies on the effect of the thermal environment on both physiological and psychological aspects of the elderly, the UTCI has been more comprehensively researched than direct weather variables. The UTCI better represents the human body’s physiological response, making it more sensitive to thermal stress changes than other thermal indices. A study from Germany quantified and compared the seasonal and spatial associations of the UTCI with mortality, morbidity, and road traffic accidents in the federal state of Bavaria; the results indicated that an increase in UTCI was positively correlated with higher summer mortality and road traffic incidence among the elderly, whereas a decrease in UTCI during winter led to higher incidences of pulmonary diseases and heart conditions in the elderly [54]. Another study collected 54,536 dynamic test results measuring uric acid levels and established a multiple regression model to discuss the impact of high-temperature environments on uric acid levels. This study found significant seasonal variations in uric acid levels, with elderly individuals showing noticeable differences in uric acid levels under cold (lower) and hot (higher) stress conditions [55].
Recent studies have consistently demonstrated the beneficial effects of natural sunlight on the physiological and psychological well-being of the elderly [56]. Regular exposure to direct sunlight improves the sleep quality of older adults [57] and enhances cognitive functions [58]. The high incidence of falls and fractures in elderly individuals is partly due to vitamin D deficiency. Frequent sunlight exposure can increase blood vitamin D levels [59] and improve bone density in the elderly [60], thereby reducing the likelihood of falls and fractures. In addition to the aforementioned studies on the physiological effects of sunlight duration on the elderly, there has also been a significant focus on its psychological impact. A recent study surveyed 1429 elderly women and collected information on their sunlight exposure and self-reported depression scale. A logistic regression model established that increased sunlight exposure was associated with a lower prevalence of depressive symptoms in those over 60 years of age [39]. Another study used experiments to compare emotional changes between students and the elderly under the same conditions to examine the relationship between emotional experiences and weather variables. The results showed a positive correlation between positive emotions and sunlight duration, with a clear trend toward higher drowsiness rates among the elderly under cold and dark conditions [61].
Additionally, other environmental performance factors affect the psychological and physiological well-being of the elderly, such as air quality [62], solar radiation [63], and the acoustic environment [64]. These findings indicate that a suitable, stable, and comfortable outdoor environment is crucial for the health of the elderly.
1.1.3. Multi-Objective Optimization and Urban Morphology
Early urban morphology design relied mainly on architects’ subjective design decisions based on their knowledge, which was inefficient [65]. Optimization algorithms have provided researchers with faster design methods, giving rise to performance-driven morphology designs. Moreover, architectural design solutions are often simultaneously required to satisfy multiple environmental performance objectives. However, conflicting optimization goals often create a dilemma for architects. Optimizing each objective separately can lead to a situation in which addressing one aspect results in neglecting the other, making it difficult to strike a balance. Against this backdrop, evolutionary algorithms, represented by genetic algorithms, are commonly used for multi-objective optimization (MOO) in the architectural design process [66].
Traditionally, owing to hardware limitations, researchers primarily focused on optimizing the morphology of individual buildings or indoor environments [11,12,13,14,15], with relatively few environmental performance targets, often concentrating on the heat island effect [67] and natural ventilation [68]. However, in the past 5 years, with the continuous improvement in computing power, more attention has been paid to optimizing performance-driven morphology designs at the block scale or larger scales, with a more diverse range of environmental performance targets, such as the outdoor wind environment [30], solar energy potential [27,42], and sunlight [38,39,40,41,42].
In the past, researchers utilized external optimization tools like MATLAB and Isight [69]. Today, popular parametric design platforms like Rhino/Grasshopper [70] and Revit/Dynamo [71] can integrate evolutionary algorithm plugins, including genetic algorithms and simulated annealing algorithms. Combined with major performance evaluation plugins such as Galapagos [72], Octopus [73], and Wallacei [74], these have greatly enhanced environmental performance optimization during the initial phases of design [75].
Octopus and Wallacei are commonly used plugins on the Grasshopper platform to execute single-objective optimization or MOO. Each method has its own advantages and disadvantages. Octopus offers various optimization algorithms, including SPEA2 and hypE [76]. It provides a more diverse solution set for high-dimensional problems and is simpler and lighter weight compared with other approaches, although the clustering process is time-consuming and inefficient [77]. Wallacei offers a non-dominated sorting genetic algorithm II (NSGA-II) and enhances the optimization results through visualization and analytical capabilities. NSGA-II offers several advantages, including high computational efficiency [78], diverse solution sets, strong interactivity, and improved performance in addressing low-dimensional optimization problems [79].
1.2. Innovation and Research Objectives
Previous studies have predominantly focused on mixed-age groups, often overlooking the unique needs of the elderly, who exhibit significant differences in activity ranges, environmental perceptions, and building environment requirements compared with those of younger and middle-aged individuals. Moreover, most existing research has been centered on indoor environments and single-building scales, neglecting the importance of optimizing outdoor environments, which play a critical role in psychological and physiological health and the daily social interactions of the elderly. Furthermore, although many studies have targeted either hot or severely cold regions, they have failed to account for the varying microclimate comfort needs across different climatic zones. People in different climate zones respond differently to microclimate comfort, making it inappropriate to directly apply the findings from one climate zone to another. In cold regions characterized by long, cold, and dry winters and hot, humid summers, winter and summer thermal comfort issues are equally prominent. Therefore, urban designs in these regions must focus on winter insulation and summer heat prevention.
This study addresses these issues and proposes corresponding research objectives. Specifically, this study employed three main stages:
(1) Focusing on cold regions, a MOO design framework for urban block forms that considers winter thermal comfort, summer thermal comfort, and daylighting was proposed.
(2) The framework was applied to the outdoor environments of elderly residential areas and their surroundings in Beijing to explore the optimal block morphology. Finally, a Pearson correlation analysis revealed the impact of block morphology parameters on block performance.
(3) The research findings are summarized as solutions to provide references for urban designers aiming to create more comfortable outdoor environments for elderly residential areas.
The remainder of this paper is organized into three sections. Section 2 provides a detailed description of the data sources used in this study, outlines the methodology for constructing the MOO framework, and explains the analytical methods employed in the subsequent research. Section 3 presents the research process and results, evaluates the effectiveness of the MOO approach, and systematically explores the impact of street form on the outdoor environmental performance in elderly residential areas in cold regions. Finally, Section 4 summarizes the main conclusions of this study.
2. Research Methods
This chapter provides a detailed explanation of each stage of the methodology. The research is conducted through the following steps: first, the overall methodological framework is established, outlining the research process and logic (Section 2.1); second, a representative study area is selected, and relevant data are collected (Section 2.2); third, key variables influencing the environmental performance of blocks are identified and defined (Section 2.3); fourth, performance simulation tools are applied to quantify the environmental performance of block forms (Section 2.4); fifth, Pareto-optimal solutions are generated through multi-objective optimization and thoroughly analyzed (Section 2.5); and finally, Pearson correlation analysis and K-means clustering are utilized to examine relationships between variables and classify the optimized solutions into distinct groups (Section 2.6).
2.1. Methodological Framework
Figure 1 illustrates the MOO framework proposed in this study, which comprises five main steps. The first step is the extraction of the basic urban forms, including a detailed survey of residential areas for the elderly, such as communities, care centers, and apartments, to obtain building and urban data. Ideal sites and simplified real building types are proposed.
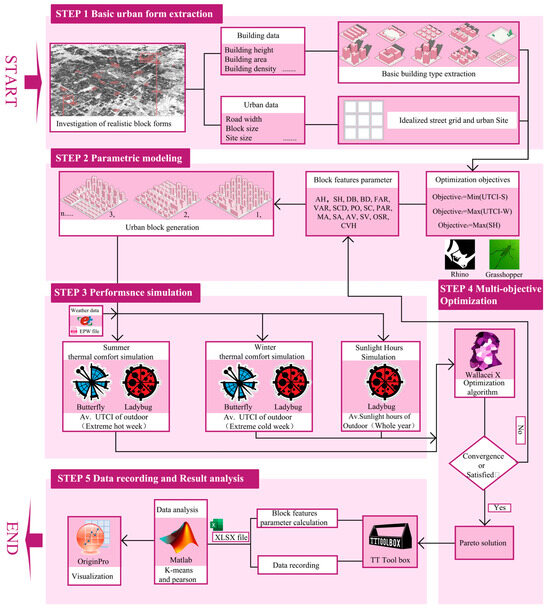
Figure 1.
MOO framework used in this study to design block forms.
The second step involves parametric modeling and the determination of the optimization objectives. The optimization objectives in this study included minimizing the UTCI in summer (UTCI-S) during extremely hot weeks, maximizing the UTCI in winter (UTCI-W) during extremely cold weeks, and maximizing the average annual outdoor ground sunlight hours (SHs). Block feature parameters such as the average building height (AH), standard deviation of building height (StdH), and building density (BD) were selected. The modeling and generation of ideal block shapes were performed using the 3D modeling software Rhino in combination with the Grasshopper parametric plugin [71].
In the third step, the performance of the generated parametric modules was simulated. Initially, the boundary conditions for the parametric model simulation were established. Various factors, such as UTCI-S, UTCI-W, and SH, were calculated. Specifically, winter and summer outdoor UTCI were coupled and calculated using Ladybug [80] and Butterfly [81]. Ladybug calculates the main parameters involved in the UTCI, such as the mean radiant temperature (TMRT) on the human body surface, relative humidity, and dry bulb temperature, whereas Butterfly primarily handles wind field calculations in thermal comfort simulations. Sunlight duration simulations were performed using Ladybug.
The fourth step is MOO, which involves the evaluation of parametric blocks’ performance according to the specified optimization objectives. If the multi-objective functions are satisfied, the block form is considered a potential solution. Otherwise, the optimization algorithm adjusts the variables to generate a new block morphology.
In the fifth step, the data from the optimization procedure and optimization outcomes are recorded and analyzed. Specifically, the optimized solutions from the previous step are recorded using the TT Toolbox [82], and the Colibri tool in the TT Toolbox is used to batch calculate block feature parameters (such as AH, SH, and BD). Finally, the results are analyzed and visualized using the MATLAB R2024a and OriginPro.3 results.
2.2. Study Area
The study area was Beijing, China (Figure 2), which is characterized by a significant degree of aging, with a high number of densely distributed elderly residential areas, making it a representative region for research. Beijing has a population of 21.856 million, with individuals aged 60 years and older accounting for 20.18% of the population, a rate that far exceeds that of other Chinese cities [83]. The city faces notable challenges in terms of its thermal environment during winter and summer. Located in the cold region of China, Beijing’s climate is characterized by short spring and autumn seasons, long and cold, dry winters, hot and humid summers, large annual temperature variations, and highly uneven precipitation distributions throughout the year [84]. Compared with other major cities, Beijing is highly urbanized, with a dense concentration of high-rise and super high-rise buildings, and is currently facing environmental issues related to reduced sunlight duration in urban blocks.
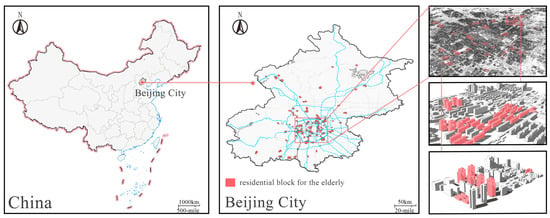
Figure 2.
Location of the study area and investigated residential blocks for the elderly.
Data for this study were collected from a survey of 121 elderly residential sites in Beijing, including elderly care centers, apartments, daycare centers, and communities (Figure 2). The survey covered the neighborhoods where these elderly residences were located as well as the morphology and urban data of the buildings within these neighborhoods, providing the basis and reference for the subsequent creation of parametric ideal residential models.
2.3. Variable Settings
To accurately evaluate the environmental performance of block forms, it is essential to identify key variables that characterize urban morphology. This section focuses on defining these variables, which serve as inputs for performance simulation and optimization. First, representative building types in the study area are extracted and simplified to ensure the analysis is both comprehensive and manageable (Section 2.3.1). Then, a parametric modeling approach is employed to systematically generate diverse block morphology configurations as a foundation for subsequent evaluations (Section 2.3.2).
2.3.1. Extraction and Simplification of Building Types
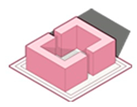
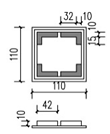
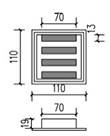
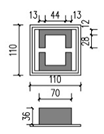
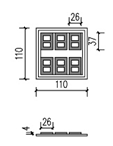
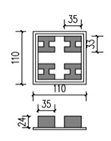
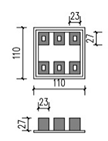
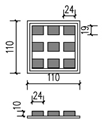
The building types extracted for this study included nine residential buildings commonly used by the elderly in Beijing. Based on previous research, these types were categorized into three classes: point, slab, and courtyard-style buildings (Table 1) [28,42,72,77]. Figure 3 show three slab-style (S-1, S-2, and S-3), three courtyard-style (C-1, C-2, and C-3), and three point-style buildings (P-1, P-2, and P-3). The height ranges for these building types were divided into three segments: 1–3 stories, 4–9 stories, and 10–18 stories. Owing to Beijing’s regulations on the height of residential buildings for the elderly, buildings exceeding 18 stories were excluded. To facilitate the calculation of building areas and data analysis, the roof area and BD within the same height range for each building type were assumed to be the same.

Table 1.
Description of the nine simplified building types.
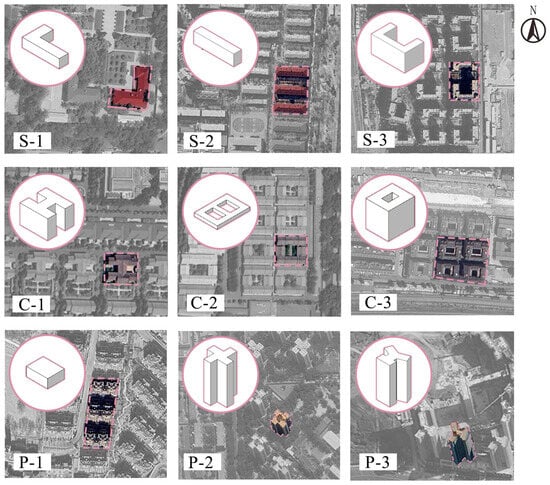
Figure 3.
Nine simplified building types extracted from senior residential areas in Beijing.
2.3.2. Parametric Modeling and Block Morphology Generation
Once a city block is established, several block feature parameters can be defined, which may correlate with the outdoor environmental performance. In this study, we selected 16 morphological indicators (Figure 4): AH, StdH, distance between buildings (DB), BD, floor area ratio (FAR), volume area ratio (VAR), space crowding density (SCD), porosity (PO), shape coefficient (SC), perimeter area ratio (PAR), mean building area (MA), standard deviation of building area (SA), average building volume (AV), volume standard deviation (SV), open space ratio (OSR), and coefficient of variation for building height (CVH).
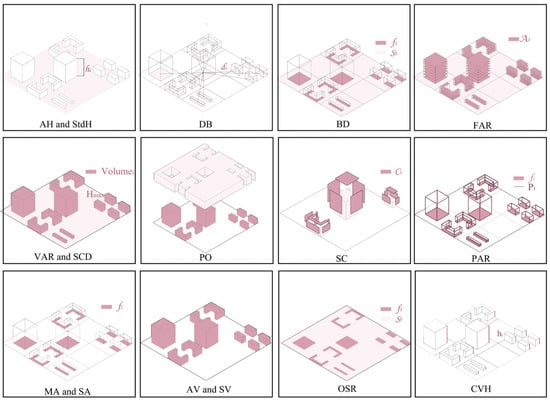
Figure 4.
Abstraction and calculation of block feature parameters in this study.
AH and StdH are crucial factors for evaluating urban outdoor environments. A higher AH may significantly impact outdoor thermal comfort, whereas a higher AH can also cast more shadows, affecting daylight hours. StdH represents the level of height variation within the block, and a greater height difference makes it easier for wind and sunlight to penetrate.
DB is calculated as the mean distance from the center point of a building’s footprint to the center point of the footprint of other buildings. Building spacing reflects the compactness and sprawl of the urban block. Previous studies have rarely investigated the impact of building spacing on thermal comfort and daylight hours.
BD and FAR are among the most commonly used indicators for describing urban block morphology and are key early indicators in urban planning and design. BD is the ratio of the total building footprint to the block area, whereas FAR is the ratio of the total building area (building footprint multiplied by the number of floors) to the block area. High construction density and intensity often lead to reduced wind speed and decreased thermal comfort within urban blocks.
VAR is the ratio of the total building volume in the urban block to the site area, reflecting the land-use efficiency and building scale. A high volume density often implies taller and denser buildings, which can make better use of urban land resources; however, an excessively high volume density may also lead to environmental issues.
SCD is the ratio of the total building volume to the product of the highest building height in the block and block areas. This reflects the level of indoor space utilization within the block, with a higher SCD indicating more efficient use of the building space.
PO is the ratio of the void volume in the urban canopy to the total volume of the urban canopy. In this study, the urban canopy volume was defined as the product of the highest building height in the block and the block areas. PO is an important indicator of the ventilation performance of urban blocks.
SC describes the complexity of building forms within a block and is calculated as the surface area of the building exposed to air (excluding the ground) divided by the building volume. SC is an important indicator of building energy efficiency, with a larger SC potentially leading to increased heat transfer and thermal bridging. Moreover, a higher SC indicates a more complex building form, which can have more complex effects on the outdoor environment.
PAR is the ratio of the perimeter of a building to the total building area within a block. This reflects the compactness and permeability of the urban blocks. A high perimeter–area ratio typically indicates narrower streets and more compact buildings that can better utilize urban land resources.
MA and SA evaluate the scale of buildings on a horizontal plane within an urban block. A larger MA is more likely to affect the outdoor environment. SA reflects the variability in the building volume. A higher standard deviation (SD) may increase the unevenness or instability of the outdoor environment within a block.
AV and SV are used to assess the AV within a block. A larger AV may lead to mutual shading among buildings, thereby affecting the daylighting capability of the block. A higher SV indicates a greater variability in the building volume, which may influence the wind environment of the block.
OSR is the ratio of open areas to built-up areas, reflecting the intensity of non-built land use. From an outdoor environmental perspective, a higher open-space ratio contributes to better ventilation and cooling capacity within an urban block.
CVH reflects the degree of relative variation in building height within an urban block. A higher coefficient of variation for the building height indicates more significant height differences and greater unevenness between buildings. Each of these parameters has a specific calculation method, as shown in Table 2.

Table 2.
Block feature parameter calculation methods.
In urban settings, vacant lots are often counted based on morphology. Therefore, the block form consisted of nine basic building unit types, one type of open space, roads, and other elements. Figure 5 illustrates an ideal block made up of nine building types and one type of open space extracted from a real city, as well as the process of generating this block. To control the generation of the block morphology through parameters, block feature parameters were determined, and generation rules were established. The selected block features and site environment parameters were used to construct a parametric model of the block morphology. The Grasshopper platform generated 3D block models based on these block feature parameters. This study used the NSGA-II optimization algorithm to control the feature parameters and combinations listed in Table 2. This algorithm changes the input of the block feature parameters based on the results from evaluating the performance of the block model to identify better-performing blocks.
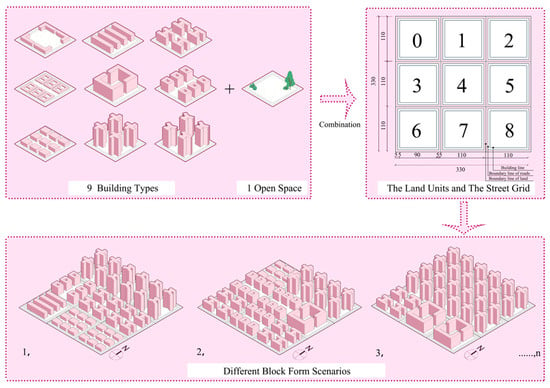
Figure 5.
Illustration of block form scenario generation.
As shown in Figure 5, the ideal block size is defined as 330 × 330 m and divided into nine 110 × 110 m land units, numbered 0–8. For each land unit boundary, the boundary line of the road was offset 5 m inward, and the building line was further offset 5 m from the boundary line of the road. The developable area within the building line was 90 × 90 m, which was sufficient for one building type.
2.4. Performance Simulation of Block Form
After completing the parametric modeling and generation of the block form, the next step was to evaluate their performance. The ultimate goal of this study was to create an outdoor environment in residential areas that was warm in winter, cool in summer, and well-lit to promote longer outdoor activities for the elderly. To achieve this, this study employed UTCI-S, UTCI-W, and SH as environmental performance indicators to assess the quality of urban block morphology.
2.4.1. Performance Indicators
- (1)
- Outdoor Thermal Comfort in Winter and Summer
The UTCI describes human thermal comfort in outdoor environments and incorporates most meteorological factors that affect thermal physiology. UTCI values significantly correspond to human thermal comfort [88]. Typically, the UTCI ranges from −50 °C to +50 °C, representing comfort under different thermal stress conditions. Generally, people feel comfortable when the UTCI is between −10 °C and +30 °C. For each 10 °C decrease in UTCI, skin temperature drops by approximately from 1.2 to 1.7 °C [89]. When the UTCI falls below −13 °C, the risk of cold stress reactions significantly increases [90]. Conversely, when the UTCI exceeds 32 °C, the mortality risk increases by from 10% to 20%; if the UTCI exceeds 38 °C, the risk increases by from s25% to 30% [84]. This study calculated the UTCI at a height of 1.5 m (representing the pedestrian level) for outdoor areas within the urban block, using the average UTCI value to reflect the average thermal comfort experienced by people in the outdoor environment of the study area. The mathematical expression is as follows:
where is the dry-bulb temperature, is the mean radiant temperature, is the wind velocity, and is the relative humidity [91].
- (2)
- SH
SH refers to the duration of direct sunlight received at a specific location over a given period. Evaluating SH for urban blocks helps to understand sunlight exposure in different city areas, providing a basis for urban planning and building design. Higher SH in public spaces, green areas, and residential areas contributes to increased comfort and quality of life. This study evaluated the average SH received by all building surfaces in an urban block. This study used the annual average daily SH on outdoor surfaces to assess blocked sunlight performance as an indicator.
2.4.2. Simulation Parameter Settings and Calculation
- (1)
- UTCI for summer and winter
Calculation of the UTCI involves multiple meteorological parameters such as dry-bulb temperature, TMRT, relative humidity, and simulated wind environment data. As illustrated in Figure 6a, the simulation of the UTCI in Ladybug Tools can be divided into four steps. The first step involves the collection of meteorological data from the simulation area. Hourly EPW data from the Beijing meteorological station (station number: 545110) were downloaded through Energyplus to calculate the meteorological parameters required for UTCI. Given the high sensitivity of the UTCI to meteorological parameters, fixing these parameters helps to analyze the impact of urban block morphology on the UTCI.
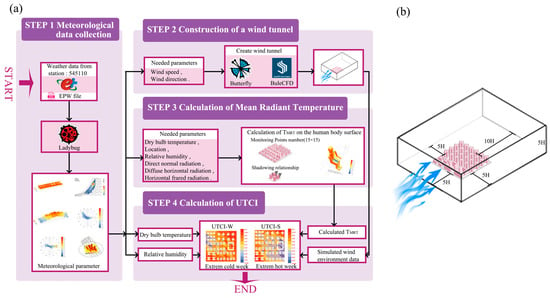
Figure 6.
(a) UTCI calculation process overview and (b) the boundaries of the virtual wind tunnel.
The second step is to create a wind tunnel to obtain wind environment data within the block. Since Ladybug cannot provide the real-time simulated wind environment data necessary for UTCI calculation, the Butterfly plugin was coupled to acquire outdoor wind environment data. Butterfly serves as an interface that combines with the CFD software BlueCFD-Core 2.3-1 to create a virtual wind tunnel for outdoor wind environment simulation, as shown in Figure 6b. BlueCFD is a computational engine based on OpenFOAM CFD technology [92]. In this study, Butterfly acted as an interface to invoke OpenFOAM commands and run the CFD model on BlueCFD, which provides the necessary computational engine [81]. All parameter settings for the wind tunnel simulation are completed in Butterfly. Specifically, the wind speed and direction data collected from Beijing’s meteorological data are transferred to the wind tunnel calculation module in Butterfly. Then, the boundaries of the virtual wind tunnel computational domain are created, with a distance of 5H between the side and top boundaries and an outflow direction of 10H, where H is the maximum building height of the simulated urban block. In this study, considering the high-density urban environment in Beijing, the surface roughness length was set to 0.5, and the atmospheric boundary layer thickness was set to 550 m. The top and side boundaries were set as symmetry boundary conditions, ensuring that the velocity component of parallel flow at the boundary’s average direction was zero. All surfaces were defined as no-slip walls, and the outlet boundary was defined as a pressure outlet boundary with static pressure set to zero. The blockmesh and snappyhexmesh tools in the Butterfly plugin were used to generate an adaptive grid division method for the monitoring grid. A monitoring surface of the same size as the urban block bottom was set at a height of 1.5 m above the ground. This monitoring surface was divided into 225 (15 × 15) grid cells, with an expansion ratio of 1.1 between two consecutive grids. Finally, the average values of the wind tunnel simulation data were output to the UTCI calculation module.
The third step involves calculating the TMRT. To compute the UTCI, the meteorological data from the first step are transferred to the TMRT calculation module, and the monitoring points are set within the block. Here, these points were assumed to represent human exposure, and the relationships between sunlight exposure, shadowing effects, and the geometric positioning of each monitoring point were assessed to determine the impact of radiation on temperature enhancement. The monitoring points were set at a height of 1.5 m, totaling 225 (15 × 15) points. All steps were performed using the Ladybug plugin.
Finally, the simulated wind environment data, dry-bulb temperature, relative humidity, and TMRT parameters for a specific day (Extreme Hot Week in summer and Extreme Cold Week in winter) are inputted into the UTCI module of the Ladybug plugin for calculation.
- (2)
- SH
The Sunlight Hours Analysis Calculator in the Ladybug plugin was used to compute SH. Calculating SH involves constructing a solar trajectory based on the geographical location of the site to determine the solar altitude and azimuth angle for each hour. Using EPW data from Beijing, the simulation period was set to 1 year. In this study, the monitoring grid was positioned on the outdoor ground surface of a block with a grid spacing of 2 m to balance simulation time and accuracy. Ultimately, the average SH values for all reference points in the block were calculated to evaluate the overall sunlight performance of the block. The specific parameter settings are shown in Table 3.

Table 3.
Simulation parameter settings.
2.5. MOO
This study used the NSGA-II for MOO provided by the Wallacei plugin. NSGA-II is a commonly used multi-objective genetic algorithm that employs non-dominated sorting and crowding distance strategies to search for Pareto front solutions [93]. As illustrated in Figure 7, the NSGA-II procedure begins with the generation of an initial population P0 of size N. The population is then subjected to nondominated sorting. Selection, crossover, and mutation operations are performed on this population to produce a new population Q0, which is a subset of the initial population. These two populations are combined to create a new population, R0. Non-dominated sorting is then performed on population R0. This process is repeated until the maximum number of generations is attained.
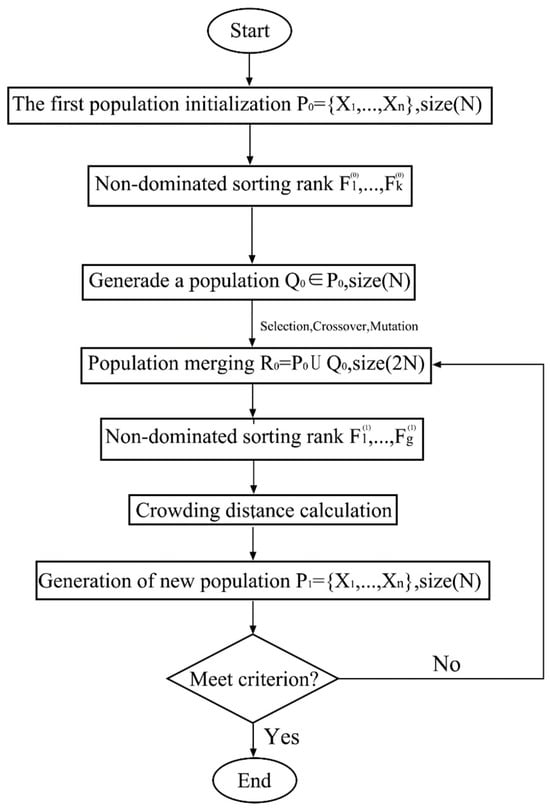
Figure 7.
Flowchart of the NSGA-II algorithm.
The algorithm effectively reduces the computational complexity and increases the solving speed. Consequently, NSGA-II produces a diverse and high-quality set of solutions that is close to the Pareto optimal solutions [78]. When optimizing multiple interrelated or constrained outdoor environmental performance objectives, solutions to the MOO problem often appear in the form of a set. Therefore, solving a MOO problem generally involves determining the optimal set of solutions. The specific formula is as follows:
where (1 ≤ i ≤ k) are the objective functions and are the constraints. This formulation seeks to solve for the optimal set of solutions under k objective functions and h constraints.
In this study, the primary optimization goals were to minimize the minimum summer outdoor pedestrian thermal comfort, maximize the winter outdoor pedestrian thermal comfort, and maximize the average daily sunlight duration on the street surface. The mathematical expressions for these optimization objectives are given by Equations (19)–(21):
where , , and represent the three optimization objectives. Constant 10 denotes the sum of the nine building types and one open space. The variables represent the dimensional design variables in this study, such as the number of buildings and building heights, and denotes the constraint function.
In Wallacei, because the plugin’s default settings are optimized by gradually decreasing the objective values and because winter outdoor pedestrian thermal comfort and average daily sunlight duration on the street surface are expected to increase, these two objectives are treated as negative values. These were then connected to the Wallacei plugin with the specific parameter settings listed in Table 4.

Table 4.
MOO parameter settings.
2.6. Pearson Correlation Analysis and K-Means Clustering
After obtaining the optimization results, Pearson’s correlation analysis was used to further investigate the impact of block form characteristics on outdoor environmental performance. The Pearson correlation coefficient is a statistical measure that quantifies the linear relationship between two variables, with values ranging from −1 to 1, where 1 indicates a perfect positive correlation, −1 indicates a perfect negative correlation, and 0 indicates no linear relationship. This analysis reveals the relationship between block form characteristics and environmental performance, providing scientific evidence for the design of outdoor environments in elderly residential areas and guiding future design decisions to enhance comfort.
Additionally, following Pearson correlation analysis, K-means clustering was performed on all optimal solutions to rapidly classify them and extract representative blocks, providing various reference scenarios for urban design. K-means clustering is a widely used clustering algorithm designed to partition a dataset into k distinct, non-overlapping clusters by minimizing the variance within each cluster. The algorithm groups data points based on their features to identify similar points and assigns them to the same cluster, thereby simplifying and accelerating the classification process.
3. Results and Discussion
This chapter presents and discusses the main findings of this study. First, a trend analysis of the optimization process is conducted to reveal the changes in objective performance during iterations (Section 3.1). Second, the distribution characteristics of feasible and Pareto solutions are analyzed to explore the spatial distribution patterns and diversity of solutions generated during the optimization process (Section 3.2). Subsequently, the specific impacts of different building types on environmental performance are further investigated (Section 3.3). Based on this, Pearson correlation analysis is employed to examine the relationships between variables (Section 3.4). Finally, K-means clustering is applied to group the Pareto solutions, identifying their potential features and classification patterns (Section 3.5).
3.1. Trend Analysis of the Optimization Process
The optimization process took ~195 h and 60 iterations to stabilize, generating 3000 feasible solutions and 388 optimal solutions. After removing 267 duplicates, 144 Pareto solutions remained.
Figure 8 depicts the iterative trends of the three optimization objectives examined in this study. Figure 8a,c,e shows the SD trends for each objective. The highest point on the x-axis of each curve represents the average objective value for the generation. The color gradient of the curve indicates the generation, with red and blue hues representing earlier and later generations, respectively. Each curve shows the SD of the objective values after one iteration, which reflects the degree of data dispersion. A wider curve indicates a larger SD and vice versa. Figure 8a shows that as the optimization progresses, the average objective value for each generation decreases, and the width of the curve narrows, indicating that the distribution of the objective values becomes more concentrated.
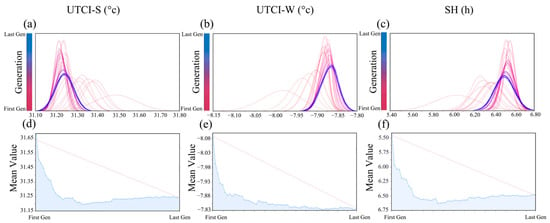
Figure 8.
(a–c)Trends of change in different objectives in the optimization process: (a) UTCI-S, (b) UTCI-W, and (c) SH. (d–f) Visualization of the objective values of the Pareto solution set: (d) UTCI-S, (e) UTCI-W, and (f) SH.
Figure 8b,d,f further demonstrates the convergence of the genetic algorithm. Each blue circle represents the average objective value for the 50 experimental sets within each iteration. The blue line represents the trend of the average objective values over generations, and the red dashed line represents the fitted trend line. Similar to the results shown in Figure 8a,c,e, the optimization process for UTCI-W is the smoothest. In the early iterations, the average value of UTCI-W increased significantly from −8.08 to approximately −7.90. During subsequent optimization, the average value of UTCI-W gradually increased and stabilized around −7.83. In addition, Figure 8d,f shows slight downward and upward fluctuations in the mid-to-late iterations, ultimately reaching a steady state.
3.2. Distribution of Feasible and Pareto Solutions
Box plots for each optimization objective are presented to compare the environmental performance of the feasible and Pareto solutions. As shown in Figure 9a, the median and mean UTCI-S for feasible solutions are both 31.80, with a distribution mainly between 31.59 and 31.92. There are many outliers below the lower limit of feasible solutions, indicating a more dispersed and variable distribution of the UTCI-S data for feasible solutions. In contrast, the Pareto solutions had UTCI-S values primarily ranging between 31.10 and 31.38, with a median of 31.20, showing a highly concentrated data distribution and indicating better summer outdoor thermal comfort performance.

Figure 9.
Performance comparative analysis of Pareto solutions: (a) UTCI-S, (b) UTCI-W, and (c) SH.
For UTCI-W, feasible solutions are mainly distributed between −8.45 and −8.13, as shown in Figure 9b, with many outliers above −8.13. In contrast, the Pareto solutions have a highly concentrated data distribution, with UTCI-W mainly between −8.14 and −7.95 and no outliers, indicating better winter thermal comfort performance compared with that of feasible solutions.
The annual average SH values are shown in Figure 9c. SH for the feasible solutions ranges from 5.70 to 7.25. Pareto solutions have SH values primarily between 5.90 and 6.74, with a median of 6.30. Although the maximum and minimum values for the feasible solutions were higher than those for the Pareto optimal solutions, the feasible solutions had many outliers, indicating more dispersed and variable data. This suggests that the Pareto solutions have a better daylighting performance.
3.3. Analysis of Building Types
Figure 10a shows the distribution frequency of the building types in each land unit for the feasible solutions. The optimization algorithm tends to place high-rise buildings on the northern and western sides of the block, particularly in land units 0, 1, 2, and 4. In contrast, the southern land units mainly feature mid-rise buildings, whereas the eastern land units, such as 2 and 8, have predominantly low-rise buildings. This results in a layout with more buildings in the northwest and fewer in the southeast. The most frequent building types in the feasible solutions are C-2, C-1, and C-3, all of which are courtyard-type buildings. The least frequent types are open spaces and S-3. Additionally, land units 6, 1, and 8 have higher building frequencies, predominantly mid-rise buildings with some high rises, whereas land units 5 and 7 have lower building frequencies and mainly consist of mid-rise and low-rise buildings.
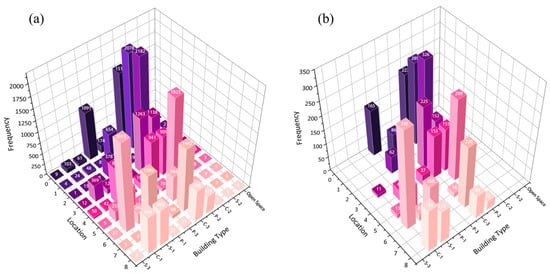
Figure 10.
Trends for different building types. (a) The distribution frequency of the building types in each land unit for the feasible solutions. (b) Further insight into the preferences of the optimization algorithm and building layout characteristics of the Pareto optimal solutions.
Figure 10b provides further insight into the preferences of the optimization algorithm and building layout characteristics of the Pareto optimal solutions. Similar to Figure 10a, the entire block shows a northwest–high and southeast–low layout. However, the proportion of high-rise buildings in the western land units decreases, whereas the proportion of mid-rise and low-rise buildings increases. This layout may be advantageous in Beijing, where summer southeast winds can enter the center of the block, carrying away heat and providing cooling. In winter, the northwest winds are blocked by high-rise buildings, aiding block insulation. High-rise buildings in the west can provide shade and reduce heat gain from intense western sunlight in the summer. Conversely, lower-lying buildings in the east can increase morning sunlight exposure, which is beneficial for elderly residents who primarily engage in outdoor activities in the morning. The absence of S-3, S-2, and open spaces in land units 0–8 suggests that slab buildings and open spaces may not perform as well in UTCI and daylighting optimization. In the Pareto optimal solutions, courtyard-style buildings such as C-2, C-1, and C-3 are also the most frequent, indicating their significant performance in optimizing outdoor environmental conditions. Additionally, the northern side of the block mainly features point buildings P-1, P-2, and P-3, whereas the southern side predominantly has courtyard-style buildings. Land units 2 and 7 have the fewest building types, with only one type each, whereas land units 4, 8, and 6 have the most building types, with four or more types.
3.4. Pearson’s Correlation Analysis
To further explore the impact of urban morphology on environmental performance, this study employed the Colibri tool in the TT-Toolbox to perform batch calculations of block characteristic parameters (such as AH, StdH, and BD) for Pareto solutions. The computed data were analyzed using Pearson’s correlation coefficients to examine the relationships between variables. Before the calculations, normality tests were conducted to ensure that the data met the assumption of a normal distribution. The block morphology feature and environmental performance indicators in this study followed a normal distribution.
The results are presented in Figure 11. The direction of correlation between the morphological and performance variables was generally consistent, although the correlation values varied slightly. Specifically, UTCI-S showed significant positive correlations with DB, BD, SC, and CVH and significant negative correlations with AH, FAR, VAR, MA, AV, and OSR. UTCI-W exhibited significant positive correlations with AH, FAR, VAR, MA, and AV, and significant negative correlations with DB, PO, SC, and CVH. SH was significantly positively correlated with DB, PO, OSR, and CVH and significantly negatively correlated with AH, BD, FAR, SC, VAR, MA, and AV. These results indicate a significant difference in the impact of the block morphology on the outdoor average UTCI between winter and summer.
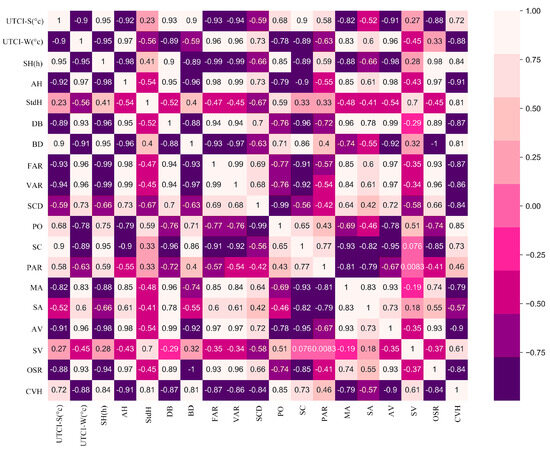
Figure 11.
Heatmap of Pearson correlation coefficients between block form feature parameters and environmental performance parameters.
In summer, outdoor thermal comfort is more sensitive to solar radiation, with higher temperatures and stronger solar radiation. High building densities and complex block shapes can reduce ventilation and lead to heat accumulation. Larger building spacing may allow more solar radiation to penetrate the block, thereby increasing heat absorption and reflection, which increases the surrounding temperature and exacerbates discomfort. Lower building heights and smaller OSRs facilitate the entry of southeastern winds, which can carry away heat and reduce the temperature. However, areas with high construction intensity and land use often create more shaded areas, which can reduce the impact of solar radiation on the ground and surrounding air, thereby lowering the outdoor UTCI.
In winter, thermal comfort is more sensitive to wind conditions, with lower temperatures and weaker solar radiation. Taller buildings reduce the intrusion of cold northeastern air during the winter, thereby enhancing thermal comfort. High construction intensity and complex block shapes create barriers that reduce wind speed and convective heat loss, helping retain heat within the block and improving winter thermal comfort. Smaller building spacing also decreases airflow, aiding heat retention. High PO and greater differences in building heights may increase wind speed within the block, thereby carrying away heat. High FARs can block sunlight and reduce thermal comfort during winter.
Additionally, the results showed a significant difference in the impact of urban morphology on annual SH. A larger building spacing and more open spaces increase the ability of the block ground to receive solar radiation, thereby increasing annual SH. Larger open spaces and lower building densities facilitate direct sunlight exposure to the ground, thereby extending the sunlight duration. A high BD and FAR indicate more buildings, which may block sunlight and reduce the ground illumination time within the block.
Moreover, among the performance indicators, the UTCI-S showed a strong positive correlation with SH, whereas the UTCI-W had a strong negative correlation with SH. A possible reason is that in summer, owing to higher temperatures and stronger solar radiation, sunlight and heat are the major factors affecting the UTCI. When building surfaces receive more sunlight, the outdoor air temperature increases, leading to an increase in the UTCI, which results in a positive correlation between SH and UTCI. In contrast, in winter, with weaker solar radiation, the UTCI is more sensitive to wind. A larger SH indicates a lower BD and construction intensity, which may increase the outdoor wind speed (as shown by the negative correlations between SH and BD, FAR, and VAR in Figure 11), reducing the UTCI. Consequently, SH and UTCI exhibited a negative correlation.
3.5. Clustering Results
This study utilized the K-means clustering algorithm in MATLAB to classify 144 nondominated solutions and efficiently extract representative blocks. The optimal number of clusters, K, was determined to be three using the sum of squared errors, as illustrated in Figure 12. Figure 13 displays the spatial distribution of the Pareto solutions after clustering, with each cluster shown in a different color. The black lines connect the centroids of the clusters to other Pareto optimal solutions.
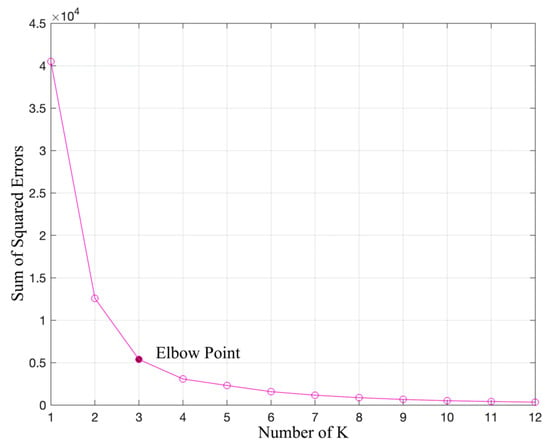
Figure 12.
Elbow method for determining the optimal number of clusters.
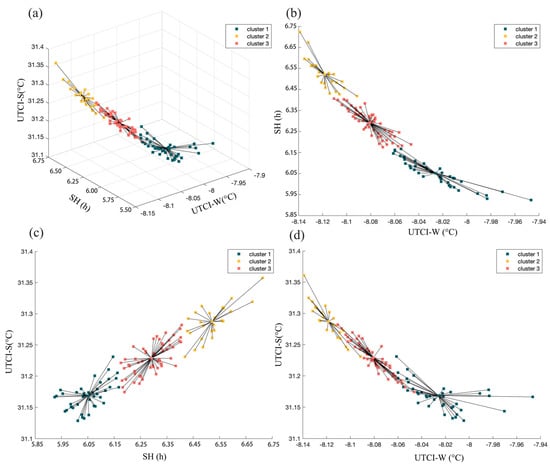
Figure 13.
Clustering distributions of Pareto solutions. (a) Three-dimensional view of the clustering, with black lines connecting the centroids of each cluster. The green, yellow, and red colors represent the three clusters, showing the distribution of each solution set in three-dimensional space. (b) Distribution of SH and UTCI-W values in the three clusters, (c) Distribution of UTCI-S and SH values in the three clusters, (d) Distribution of UTCI-S and UTCI-W values in the three clusters.
Clusters 1 and 2 were located at the ends of the Pareto optimal set. Cluster 1 had the lowest overall UTCI-S, highest UTCI-W, and lowest daylight hours. In contrast, Cluster 2 had the highest overall UTCI-S, lowest UTCI-W, and highest daylight hours. Cluster 3 exhibited a more balanced performance across all three aspects.
Box plots of the data for the three clusters were constructed to observe the distribution (Figure 14). As shown in Figure 14a, the median UTCI-S for clusters 1, 2, and 3 were 31.16, 31.29, and 31.22, respectively. Compared with the other clusters, Cluster 1 had a lower median and more concentrated data distribution within the Pareto optimal set, mainly in the range of 31.13–31.23. This indicates that Cluster 1 had better summer pedestrian thermal comfort, followed by Clusters 3 and 2.
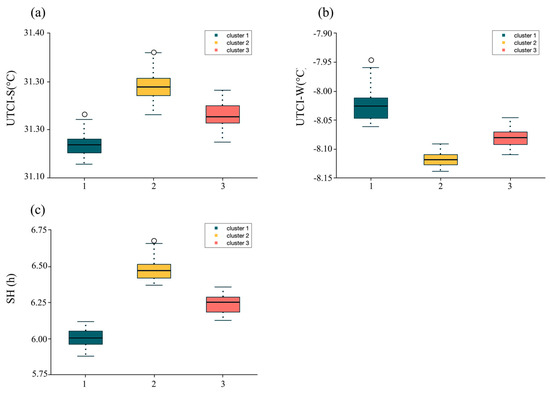
Figure 14.
Box plots of UTCI-S, UTCI-W, and SH indices for the three clusters. (a) Performance and distribution of the three clusters in the UTCI-S index; (b) performance and distribution of the three clusters in the UTCI-W index; (c) performance and distribution of the three clusters in the SH index.
For UTCI-W, as shown in Figure 14b, the median of Cluster 1 is at the top of the box, indicating a higher proportion of larger values, with most values between −8.065 and −7.975. This suggests that the block morphology in Cluster 1 provides better outdoor comfort during the winter.
Regarding the SH index, as shown in Figure 14c, the median for Cluster 2 was 6.45, which was the highest among the three clusters. The data were concentrated between 6.40 and 6.68, indicating better daylight performance in outdoor spaces.
Finally, the most representative solutions for each cluster were identified and associated with positively or negatively correlated morphological parameters for reference by urban designers. The Pareto optimal solutions for the three clusters exhibited different block forms for each city, and these representative solutions are shown in Figure 15. Each type of solution achieved notable optimization in at least two performance indicators, as shown in Figure 15. For instance, the UTCI-S performance of the first sample in the 23rd generation ranked first among all samples, whereas UTCI-W performance ranked 46th and SH performance ranked 330th. However, the Pareto solutions represent the best set of solutions where the three objectives cannot be optimized simultaneously. Therefore, within the Pareto set, designers can choose based on their preferences for the block form or performance.
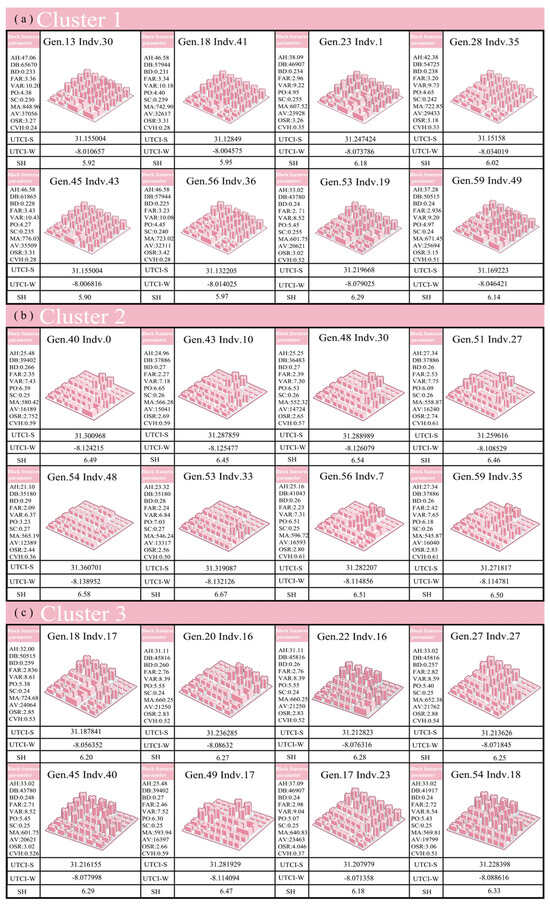
Figure 15.
Feasible urban design solutions for three clusters based on the Pareto optimal solutions, including block form features for each design.
4. Conclusions
This study focused on cold regions to optimize outdoor environmental comfort in residential areas for the elderly. Data regarding blocks and building forms were collected from 121 elderly residential locations in Beijing (including nursing homes, elderly communities, senior apartments, and daycare centers). An ideal residential area was generated using the Rhino tool. Subsequently, the NSGA-II MOO algorithm was employed to achieve three objectives: minimizing summer outdoor thermal discomfort, maximizing winter outdoor thermal comfort, and maximizing annual average daylight duration. This resulted in 144 Pareto optimal solutions, which were clustered using K-means. Pearson correlation analysis was conducted to explore the impact of block form characteristics on outdoor environmental performance. The results were as follows:
- (1)
- Impact of block form on outdoor environmental performance: UTCI-S was significantly positively correlated with DB, BD, SC, and CVH, and significantly negatively correlated with AH, FAR, VAR, MA, AV, and OSR. UTCI-W was significantly positively correlated with AH, FAR, VAR, MA, and AV, and significantly negatively correlated with DB, PO, SC, and CVH. SH was significantly positively correlated with DB, PO, OSR, and CVH, and significantly negatively correlated with AH, BD, FAR, SC, VAR, MA, and AV.
- (2)
- Building layout patterns: high-rise point and slab buildings concentrated in the northwest, along with mid-rise and low-rise courtyard-style and point buildings distributed in the southeast, reduce summer heat accumulation, enhance winter sunlight access, and mitigate the impact of northwestern winds, thereby significantly improving the outdoor environment for elderly residents.
- (3)
- Building form patterns: In the optimized solutions, courtyard buildings (C-1, C-2, and C-3) were concentrated in the northern part of the block, whereas point buildings (P-1, P-2, and P-3) were concentrated in the southern part. These building forms are beneficial for improving summer thermal comfort, winter thermal comfort, and daylight duration. Conversely, mid-rise and high-rise slab buildings (S-3 and S-2) are less advantageous for these three outdoor environmental performances.
This study revealed the specific impacts of different block form characteristics on environmental performance, providing a scientific basis for optimizing urban form designs. In addition, three types of solutions that offer various reference scenarios for urban design are presented. Each type of solution achieved notable optimization in at least two indicators. However, the Pareto solutions represent the best set of solutions where the three objectives cannot be optimized simultaneously. Designers can select from the Pareto set based on their preferences for the block form or performance to create a more comfortable outdoor environment for the elderly.
This study has some limitations. First, it only considered one city in a cold region, and the generalizability of the findings needs to be validated for different cities and climatic conditions. Second, although various block form characteristics were considered, other factors (such as green space coverage and water body distribution) that may significantly affect thermal comfort and daylight duration were excluded. Future research should incorporate more field data from various types of cities to further validate and expand the conclusions and explore additional factors affecting thermal comfort and daylight duration to provide more comprehensive guidance for optimizing urban block forms.
Author Contributions
H.Y.; conceptualization, writing—original draft, project administration, supervision, resources, writing—review and editing. L.Z.; data curation, formal analysis, funding acquisition, investigation, methodology, project administration, software, validation, visualization, writing—original draft, writing—review and editing, resources. X.D. and Z.Z. software. Z.Q.; investigation. L.J.; project administration. D.B.; supervision. All authors have read and agreed to the published version of the manuscript.
Funding
This work was supported by the Special Fund for Graduate Education of Tianjin University, grant number A1-2021-007.
Data Availability Statement
Data will be made available on request.
Conflicts of Interest
The authors declare no conflicts of interest.
Abbreviations
| Acronym | Written-out form |
| UTCI | Universal Thermal Climate Index (°C) |
| UTCI-S | Universal Thermal Climate Index in summer (°C) |
| UTCI-W | Universal Thermal Climate Index in winter (°C) |
| SH | Sunlight hour (h) |
| AH | Average Building Height (m) |
| StdH | Standard Deviation of Building Height (m) |
| BD | Building Density (%) |
| DB | Distance Between Buildings |
| FAR | Floor Area Ratio |
| VAR | Volume Area Ratio (%) |
| SCD | Space Crowding Density |
| PO | Porosity (%) |
| SC | Shape Coefficient |
| PAR | Perimeter Area Ratio |
| MA | Mean Building Area (m2) |
| SA | Standard Deviation of Building Area (m2) |
| AV | Average Building Volume (m3) |
| SV | Volume Standard Deviation (m3) |
| OSR | Open Space Ratio (%) |
| CVH | Coefficient of Variation for Building Height |
| MOO | Multi-objective Optimization |
| SVF | Sky View Factor |
| NSGA-II | Non-dominated Sorting Genetic Algorithm II |
| SSE | Sum of Squared errors |
| TMRT | Mean Radiant Temperature (°C) |
| SD | Standard Deviation |
References
- Aging and Health. Available online: https://www.who.int/news-room/fact-sheets/detail/ageing-and-health (accessed on 7 August 2024).
- Population Division World Population Prospects 2024 (United Nations). Available online: https://population.un.org/wpp/ (accessed on 6 August 2024).
- Total Population Growth Is Maintained and the Level of Urbanisation Is Steadily Increasing. National Bureau of Statistics of China. Available online: http://www.stats.gov.cn/xxgk/jd/sjjd2020/202201/t20220118_1826609.html (accessed on 6 August 2024). (In Chinese)
- Zhong, S.; Lee, C.; Lee, H. The role of community environments in older adults’ intergenerational and peer social interactions. Cities 2022, 129, 103785. [Google Scholar] [CrossRef]
- Dugan, E.; Porell, F.; Silverstein, N.M.; Lee, C.M. Healthy aging data reports: Measures of community health to identify disparities and spur age-friendly progress. Gerontologist 2022, 62, e28–e38. [Google Scholar] [CrossRef] [PubMed]
- Xiang, L.; Mei, T. Developing the age-friendly community parks survey for older adults: Assessing aging environment. Urban For. Urban Green. 2024, 99, 128424. [Google Scholar] [CrossRef]
- Wen, C.; Albert, C.; Von Haaren, C. The elderly in green spaces: Exploring requirements and preferences concerning nature-based recreation. Sustain. Cities Soc. 2018, 38, 582–593. [Google Scholar] [CrossRef]
- Subramanian, D.; Jana, A. Assessing urban recreational open spaces for the elderly: A case of three Indian cities. Urban For. Urban Green. 2018, 35, 115–128. [Google Scholar] [CrossRef]
- Zhang, Y.; Wu, Z.; Wu, Z.; Liu, Y.; Yang, Z. Using space syntax in close interaction analysis between the elderly: Towards a healthier urban environment. Buildings 2023, 13, 1456. [Google Scholar] [CrossRef]
- Cui, Y.-T.; Zhang, G.-Z. Optimizing community green roof spaces in high-density cities: A K-modes clustering algorithm based analysis of resident preferences and spatial configuration. J. Asian Archit. Build. Eng. 2024. [Google Scholar] [CrossRef]
- Jiao, Y.; Yu, Y.; Yu, H.; Wang, F. The impact of thermal environment of transition spaces in elderly-care buildings on thermal adaptation and thermal behavior of the elderly. Build. Environ. 2023, 228, 109871. [Google Scholar] [CrossRef]
- Long, X.; Che Din, N.; Lei, Y.; Mahyuddin, N. The restorative effects of outdoor soundscapes in nursing homes for elderly individuals. Build. Environ. 2023, 242, 110520. [Google Scholar] [CrossRef]
- Carstens, D.Y. Site Planning and Design for the Elderly: Issues, Guidelines, and Alternatives. 1993. Available online: https://www.semanticscholar.org/paper/Site-Planning-and-Design-for-the-Elderly:-Issues,-Carstens/29cc4cf778958dc14b56520766745e809b790e19 (accessed on 12 August 2024).
- Cho, M.E.; Kim, M.J.; Kim, J.T. A smart workspace supporting a healthy life in pre-elderly households. Indoor Built Environ. 2013, 22, 280–288. [Google Scholar] [CrossRef]
- Tsoulou, I.; Andrews, C.J.; He, R.; Mainelis, G.; Senick, J. Summertime thermal conditions and senior resident behaviors in public housing: A case study in Elizabeth, NJ, USA. Build. Environ. 2020, 168, 106411. [Google Scholar] [CrossRef]
- Zhu, W.; Wang, J.; Qin, B. Quantity or quality? Exploring the association between public open space and mental health in urban China. Landsc. Urban Plan. 2021, 213, 104128. [Google Scholar] [CrossRef]
- Wang, Z.; Shepley, M.M. Can aging-in-place be promoted by the built environment near home for physical activity: A case study of non-Hispanic White elderly in Texas. J. Hous. Built. Environ. 2018, 33, 749–766. [Google Scholar] [CrossRef]
- Suzuki, T.; Murase, S. Influence of outdoor activity and indoor activity on cognition decline: Use of an infrared sensor to measure activity. Telemed J. E. Health 2010, 16, 686–690. [Google Scholar] [CrossRef] [PubMed]
- Ju, H. The relationship between physical activity, meaning in life, and subjective vitality in community-dwelling older adults. Arch. Gerontol. Geriatr. 2017, 73, 120–124. [Google Scholar] [CrossRef]
- Zhu, D.; Liu, G.; Lv, Z.; Wen, S.; Bi, S.; Wang, W. Inverse associations of outdoor activity and vitamin D intake with the risk of Parkinson’s disease. J. Zhejiang Univ. Sci. 2014, 15, 923–927. [Google Scholar] [CrossRef]
- Cedervall, Y.; Torres, S.; Åberg, A.C. Maintaining well-being and selfhood through physical activity: Experiences of people with mild Alzheimer’s disease. Aging Ment. Health 2015, 19, 679–688. [Google Scholar] [CrossRef]
- Yung, E.H.K.; Wang, S.; Chau, C. Thermal perceptions of the elderly, use patterns and satisfaction with open space. Landsc. Urban Plan. 2019, 185, 44–60. [Google Scholar] [CrossRef]
- Wu, H.-W.; Kumar, P.; Cao, S.-J. Implementation of green infrastructure for improving the building environment of elderly care centres. J. Build. Eng. 2022, 54, 104682. [Google Scholar] [CrossRef]
- Ma, X.; Song, L.; Hong, B.; Li, Y.; Li, Y. Relationships between EEG and thermal comfort of elderly adults in outdoor open spaces. Build. Environ. 2023, 235, 110212. [Google Scholar] [CrossRef]
- Wang, W.; Li, Y.; Li, L.; Wang, R.; Wang, Y. Study on thermal comfort of elderly in community parks: An exploration from the perspectives of different activities and ages. Build. Environ. 2023, 246, 111001. [Google Scholar] [CrossRef]
- Hong, T.; Chen, Y.; Luo, X.; Luo, N.; Lee, S.H. Ten questions on urban building energy modeling. Build. Environ. 2020, 168, 106508. [Google Scholar] [CrossRef]
- Li, J.; You, W.; Ding, W. Exploring urban space quantitative indicators associated with outdoor ventilation potential. Sustain. Cities Soc. 2022, 79, 103696. [Google Scholar] [CrossRef]
- Liu, K.; Xu, X.; Huang, W.; Zhang, R.; Kong, L.; Wang, X. A multi-objective optimization framework for designing urban block forms considering daylight, energy consumption, and photovoltaic energy potential. Build. Environ. 2023, 242, 110585. [Google Scholar] [CrossRef]
- Zuo, J.; Ma, J.; Lin, T.; Dong, J.; Lin, M.; Luo, J. Quantitative valuation of green roofs’ cooling effects under different urban spatial forms in high-density urban areas. Build. Environ. 2022, 222, 109367. [Google Scholar] [CrossRef]
- Castaldo, V.L.; Pisello, A.L.; Piselli, C.; Fabiani, C.; Cotana, F.; Santamouris, M. How outdoor microclimate mitigation affects building thermal-energy performance: A new design-stage method for energy saving in residential near-zero energy settlements in Italy. Renew. Energy 2018, 127, 920–935. [Google Scholar] [CrossRef]
- Zhang, M.; You, W.; Qin, Q.; Peng, D.; Hu, Y.; Gao, Z.; Buccolieri, R. Investigation of typical residential block typologies and their impact on pedestrian-level microclimate in summers in Nanjing, China. Front. Archit. Res. 2022, 11, 278–296. [Google Scholar] [CrossRef]
- Leconte, F.; Bouyer, J.; Claverie, R.; Pétrissans, M. Using Local Climate Zone scheme for UHI assessment: Evaluation of the method using mobile measurements. Build. Environ. 2015, 83, 39–49. [Google Scholar] [CrossRef]
- Jeon, G.; Park, Y.; Guldmann, J.-M. Impacts of urban morphology on seasonal land surface temperatures: Comparing grid- and block-based approaches. ISPRS Int. J. Geoinf. 2023, 12, 482. [Google Scholar] [CrossRef]
- Athamena, K. Microclimatic coupling to assess the impact of crossing urban form on outdoor thermal comfort in temperate oceanic climate. Urban Clim. 2022, 42, 101093. [Google Scholar] [CrossRef]
- Li, J.; Niu, J.; Huang, T.; Mak, C.M. Dynamic effects of frequent step changes in outdoor microclimate environments on thermal sensation and dissatisfaction of pedestrian during summer. Sustain. Cities Soc. 2022, 79, 103670. [Google Scholar] [CrossRef]
- Qaoud, R.; Adel, B.; Sayad, B.; Alkama, D.; Attia, S. Assessing the influence of neighborhood urban form on outdoor thermal conditions in the hot dry city of Biskra, Algeria. Ain Shams Eng. J. 2023, 14, 102525. [Google Scholar] [CrossRef]
- Sun, C.; Lian, W.; Liu, L.; Dong, Q.; Han, Y. The impact of street geometry on outdoor thermal comfort within three different urban forms in severe cold region of China. Build. Environ. 2022, 222, 109342. [Google Scholar] [CrossRef]
- Darbani, E.S.; Rafieian, M.; Parapari, D.M.; Guldmann, J.-M. Urban design strategies for summer and winter outdoor thermal comfort in arid regions: The case of historical, contemporary and modern urban areas in Mashhad, Iran. Sustain. Cities Soc. 2023, 89, 104339. [Google Scholar] [CrossRef]
- Cui, Y.; Gong, Q.; Huang, C.; Guo, F.; Li, W.; Wang, Y.; Cheng, X. The relationship between sunlight exposure duration and depressive symptoms: A cross-sectional study on elderly Chinese women. PLoS ONE 2021, 16, e0254856. [Google Scholar] [CrossRef]
- Šprah, N.; Potočnik, J.; Košir, M. The influence of façade colour, glazing area and geometric configuration of urban canyon on the spectral characteristics of daylight. Build. Environ. 2024, 251, 111214. [Google Scholar] [CrossRef]
- Lu, M.; Du, J. Dynamic evaluation of daylight availability in a highly-dense Chinese residential area with a cold climate. Energy Build. 2019, 193, 139–159. [Google Scholar] [CrossRef]
- Wang, S.; Yi, Y.K.; Liu, N. Multi-objective optimization (MOO) for high-rise residential buildings’ layout centered on daylight, visual, and outdoor thermal metrics in China. Build. Environ. 2021, 205, 108263. [Google Scholar] [CrossRef]
- Kaleshwarwar, A.; Bahadure, S. Assessment of the solar energy potential of diverse urban built forms in Nagpur, India. Sustain. Cities Soc. 2023, 96, 104681. [Google Scholar] [CrossRef]
- Norouziasas, A.; Pilehchi Ha, P.; Ahmadi, M.; Rijal, H.B. Evaluation of urban form influence on pedestrians’ wind comfort. Build. Environ. 2022, 224, 109522. [Google Scholar] [CrossRef]
- Yildirim, Y.; Arefi, M. Seeking the nexus between building acoustics and urban form: A systematic review. Curr. Pollut. Rep. 2023, 9, 198–212. [Google Scholar] [CrossRef] [PubMed]
- Xu, R.; Liu, Y.; Mu, T.; Ye, Y.; Xu, C. Determining the association between different living arrangements and depressive symptoms among over-65-year-old people: The moderating role of outdoor activities. Front. Public Health. 2022, 10, 954416. [Google Scholar] [CrossRef] [PubMed]
- Petkova, E.P.; Dimitrova, L.K.; Sera, F.; Gasparrini, A. Mortality attributable to heat and cold among the elderly in Sofia, Bulgaria. Int. J. Biometeorol. 2021, 65, 865–872. [Google Scholar] [CrossRef] [PubMed]
- Guergova, S.; Dufour, A. Thermal sensitivity in the elderly: A review. Ageing Res. Rev. 2011, 10, 80–92. [Google Scholar] [CrossRef] [PubMed]
- Qiu, H.; Sun, S.; Tang, R.; Chan, K.-P.; Tian, L. Pneumonia hospitalization risk in the elderly attributable to cold and hot temperatures in Hong Kong, China. Am. J. Epidemiol. 2016, 184, 570–578. [Google Scholar] [CrossRef]
- Low, C.T.; Lai, P.C.; Yeung, P.S.S.; Siu, A.Y.C.; Leung, K.T.Y.; Wong, P.P.Y. Temperature and age–gender effects on out-of-hospital cardiac arrest cases. Hong Kong J. Emerg. Med. 2018, 25, 83–90. [Google Scholar] [CrossRef]
- Zhao, Y.; Huang, Z.; Wang, S.; Hu, J.; Xiao, J.; Li, X.; Liu, T.; Zeng, W.; Guo, L.; Du, Q.; et al. Morbidity burden of respiratory diseases attributable to ambient temperature: A case study in a subtropical city in China. Environ. Health 2019, 18, 89. [Google Scholar] [CrossRef]
- Klompmaker, J.O.; Laden, F.; James, P.; Sabath, M.B.; Wu, X.; Schwartz, J.; Dominici, F.; Zanobetti, A.; Hart, J.E. Effects of long-term average temperature on cardiovascular disease hospitalizations in an American elderly population. Environ. Res. 2023, 216, 114684. [Google Scholar] [CrossRef]
- Lin, Y.-K.; Ho, T.-J.; Wang, Y.-C. Mortality risk associated with temperature and prolonged temperature extremes in elderly populations in Taiwan. Environ. Res. 2011, 111, 1156–1163. [Google Scholar] [CrossRef]
- Ghada, W.; Estrella, N.; Ankerst, D.P.; Menzel, A. Universal thermal climate index associations with mortality, hospital admissions, and road accidents in Bavaria. PLoS ONE 2021, 16, e0259086. [Google Scholar] [CrossRef]
- Romaszko, J.; Dragańska, E.; Cymes, I.; Drozdowski, M.; Gromadziński, L.; Glińska-Lewczuk, K. Are the levels of uric acid associated with biometeorological conditions? Sci. Total Environ. 2022, 819, 152020. [Google Scholar] [CrossRef] [PubMed]
- Elmadfa, I.; Meyer, A.L. Body composition, changing physiological functions and nutrient requirements of the elderly. Ann. Nutr. Metab. 2008, 52, 2–5. [Google Scholar] [CrossRef] [PubMed]
- Düzgün, G.; Durmaz Akyol, A. Effect of natural sunlight on sleep problems and sleep quality of the elderly staying in the nursing home. Holist. Nurs. Pract. 2017, 31, 295–302. [Google Scholar] [CrossRef] [PubMed]
- Gao, Q.; Luan, D.; Wang, X.; Xin, S.; Liu, Y.; Li, J. Effect of sun exposure on cognitive function among elderly individuals in Northeast China. CIA 2018, 13, 2075–2082. [Google Scholar] [CrossRef] [PubMed]
- Okan, F.; Zİncİr, H.; Devecİ, K. The effect of sun light exposure to the level of vitamin D in elderly people living in nursing home. J. Clin. Densitom. 2022, 2, 261–271. [Google Scholar] [CrossRef]
- Cheng, J.; Meng, S.; Lee, J.; Kwak, H.-B.; Liu, Y. Effects of walking and sun exposure on bone density and balance in elderly with osteopenia. J. Bone Miner. Metab. 2022, 40, 528–534. [Google Scholar] [CrossRef]
- Kööts, L.; Realo, A.; Allik, J. The influence of the weather on affective experience. J. Individ. Differ. 2011, 32, 74–84. [Google Scholar] [CrossRef]
- Wu, H.-W.; Kumar, P.; Cao, S.-J. The role of roadside green infrastructure in improving air quality in and around elderly care centres in Nanjing, China. Atmos. Environ. 2024, 332, 120607. [Google Scholar] [CrossRef]
- Ferrari, U.; Exner, T.; Wanka, E.R.; Bergemann, C.; Meyer-Arnek, J.; Hildenbrand, B.; Tufman, A.; Heumann, C.; Huber, R.M.; Bittner, M.; et al. Influence of air pressure, humidity, solar radiation, temperature, and wind speed on ambulatory visits due to chronic obstructive pulmonary disease in Bavaria, Germany. Int. J. Biometeorol. 2012, 56, 137–143. [Google Scholar] [CrossRef]
- Cui, P.; Zhang, J.; Li, T.T. Research on acoustic environment in the building of nursing homes based on sound preference of the elderly people: A case study in Harbin, China. Front. Psychol. 2021, 12, 707457. [Google Scholar] [CrossRef]
- Bre, F.; Roman, N.; Fachinotti, V.D. An efficient metamodel-based method to carry out multi-objective building performance optimizations. Energy Build. 2020, 206, 109576. [Google Scholar] [CrossRef]
- Bhattacharjya, S.; Chakraborty, S. An improved robust multi-objective optimization of structure with random parameters. Adv. Struct. Eng. 2018, 21, 1597–1607. [Google Scholar] [CrossRef]
- Liu, Z.; Li, J.; Xi, T. A review of thermal comfort evaluation and improvement in urban outdoor spaces. Buildings 2023, 13, 3050. [Google Scholar] [CrossRef]
- Zhu, Y.; Luo, M.; Ouyang, Q.; Huang, L.; Cao, B. Dynamic characteristics and comfort assessment of airflows in indoor environments: A review. Build. Environ. 2015, 91, 5–14. [Google Scholar] [CrossRef]
- Attia, S.; Hamdy, M.; O’Brien, W.; Carlucci, S. Assessing gaps and needs for integrating building performance optimization tools in net zero energy buildings design. Energy Build. 2013, 60, 110–124. [Google Scholar] [CrossRef]
- Mandal, B.; Roy, P.K. Multi-Objective Optimal Power Flow Using Grasshopper Optimization Algorithm. Available online: https://doi.org/10.1002/oca.3065 (accessed on 6 August 2024).
- Alothaimeen, I.; Arditi, D.; Türkakın, O.H. Multi-objective optimization for LEED—New construction using BIM and genetic algorithms. Autom. Constr. 2023, 149, 104807. [Google Scholar] [CrossRef]
- Rutten, D. Galapagos: On the logic and limitations of generic solvers. Archit. Des. 2013, 83, 132–135. [Google Scholar] [CrossRef]
- Keskas, I.; Bourbia, F.; Mohammadi, M.; Calautit, J. Geo-solar segmentation mechanism: An early design stage method for building solar morphing. Sol. Energy 2022, 246, 302–319. [Google Scholar] [CrossRef]
- Evolutionary Engine for Grasshopper3D, Wallacei. Available online: https://www.wallacei.com (accessed on 6 August 2024).
- Touloupaki, E.; Theodosiou, T. Performance simulation integrated in parametric 3D modeling as a method for early stage design optimization—A review. Energies 2017, 10, 637. [Google Scholar] [CrossRef]
- Emmerich, M.T.M.; Deutz, A.H. A tutorial on multiobjective optimization: Fundamentals and evolutionary methods. Nat. Comput. 2018, 17, 585–609. [Google Scholar] [CrossRef]
- Zitzler, E.; Deb, K.; Thiele, L. Comparison of multiobjective evolutionary algorithms: Empirical results. Evol. Comput. 2000, 8, 173–195. [Google Scholar] [CrossRef] [PubMed]
- Ma, H.; Zhang, Y.; Sun, S.; Liu, T.; Shan, Y. A comprehensive survey on NSGA-II for multi-objective optimization and applications. Artif. Intell. Rev. 2023, 56, 15217–15270. [Google Scholar] [CrossRef]
- Deb, K.; Pratap, A.; Agarwal, S.; Meyarivan, T. A fast and elitist multiobjective genetic algorithm: NSGA-II. IEEE Trans. Evol. Comput. 2002, 6, 182–197. [Google Scholar] [CrossRef]
- Ladybug Tools|Ladybug. Available online: https://www.ladybug.tools/ladybug.html (accessed on 6 August 2024).
- Ladybug Tools|Butterfly. Available online: https://www.ladybug.tools/butterfly.html (accessed on 6 August 2024).
- TT Toolbox, Food4Rhino. 2013. Available online: https://www.food4rhino.com/en/app/tt-toolbox (accessed on 6 August 2024).
- Beijing Elderly Career Development Report 2021. Beijing Municipal Health Commission. Available online: https://wjw.beijing.gov.cn/wjwh/ztzl/lnr/lljkzc/lllnfzbg/ (accessed on 6 August 2024).
- China Climate Bulletin. China Meteorological Administration, 2022. Available online: https://www.cma.gov.cn/zfxxgk/gknr/qxbg/202303/t20230324_5396394.html (accessed on 6 August 2024).
- Joshi, M.Y.; Rodler, A.; Musy, M.; Guernouti, S.; Cools, M.; Teller, J. Identifying urban morphological archetypes for microclimate studies using a clustering approach. Build. Environ. 2022, 224, 109574. [Google Scholar] [CrossRef]
- Li, H.; Liu, Y.; Zhang, H.; Xue, B.; Li, W. Urban morphology in China: Dataset development and spatial pattern characterization. Sustain. Cities Soc. 2021, 7, 102981. [Google Scholar] [CrossRef]
- Geng, X.; Xie, D.; Gou, Z. Optimizing urban block morphologies for net-zero energy cities: Exploring photovoltaic potential and urban design prototype. Build. Simul. 2024, 17, 607–624. [Google Scholar] [CrossRef]
- Naskar, P.R.; Mohapatra, M.; Singh, G.P.; Das, U. Spatiotemporal variations of UTCI based discomfort over India. J. Earth Syst. Sci. 2024, 133, 47. [Google Scholar] [CrossRef]
- Ohashi, Y.; Katsuta, T.; Tani, H.; Okabayashi, T.; Miyahara, S.; Miyashita, R. Human cold stress of strong local-wind “Hijikawa-arashi” in Japan, based on the UTCI index and thermo-physiological responses. Int. J. Biometeorol. 2018, 62, 1241–1250. [Google Scholar] [CrossRef]
- Błażejczyk, K.; Twardosz, R. Secular changes (1826–2021) of human thermal stress according to UTCI in Kraków (southern Poland). Int. J. Climatol. 2023, 43, 4220–4230. [Google Scholar] [CrossRef]
- Kuchcik, M. Mortality and thermal environment (UTCI) in Poland—Long-term, multi-city study. Int. J. Biometeorol. 2021, 65, 1529–1541. [Google Scholar] [CrossRef]
- BlueCFD-Core 2.3-1. Available online: https://bluecfd.github.io/Core/UserGuide/ (accessed on 21 October 2024).
- Huang, C.; Zhang, G.; Yao, J.; Wang, X.; Calautit, J.K.; Zhao, C.; An, N.; Peng, X. Accelerated environmental performance-driven urban design with generative adversarial network. Build. Environ. 2022, 224, 109575. [Google Scholar] [CrossRef]
Disclaimer/Publisher’s Note: The statements, opinions and data contained in all publications are solely those of the individual author(s) and contributor(s) and not of MDPI and/or the editor(s). MDPI and/or the editor(s) disclaim responsibility for any injury to people or property resulting from any ideas, methods, instructions or products referred to in the content. |
© 2024 by the authors. Licensee MDPI, Basel, Switzerland. This article is an open access article distributed under the terms and conditions of the Creative Commons Attribution (CC BY) license (https://creativecommons.org/licenses/by/4.0/).


