
Study on the Influence of Density and Water–Cement Ratio on the Cement Utilization, Fluidity, Mechanical Properties, and Water Absorption of Foam Concrete


Abstract
1. Introduction
2. Materials and Methods
2.1. Preparation Method and Material Introduction
2.2. Calculation Method of the Mix Ratio
3. Sample Performance Test Method
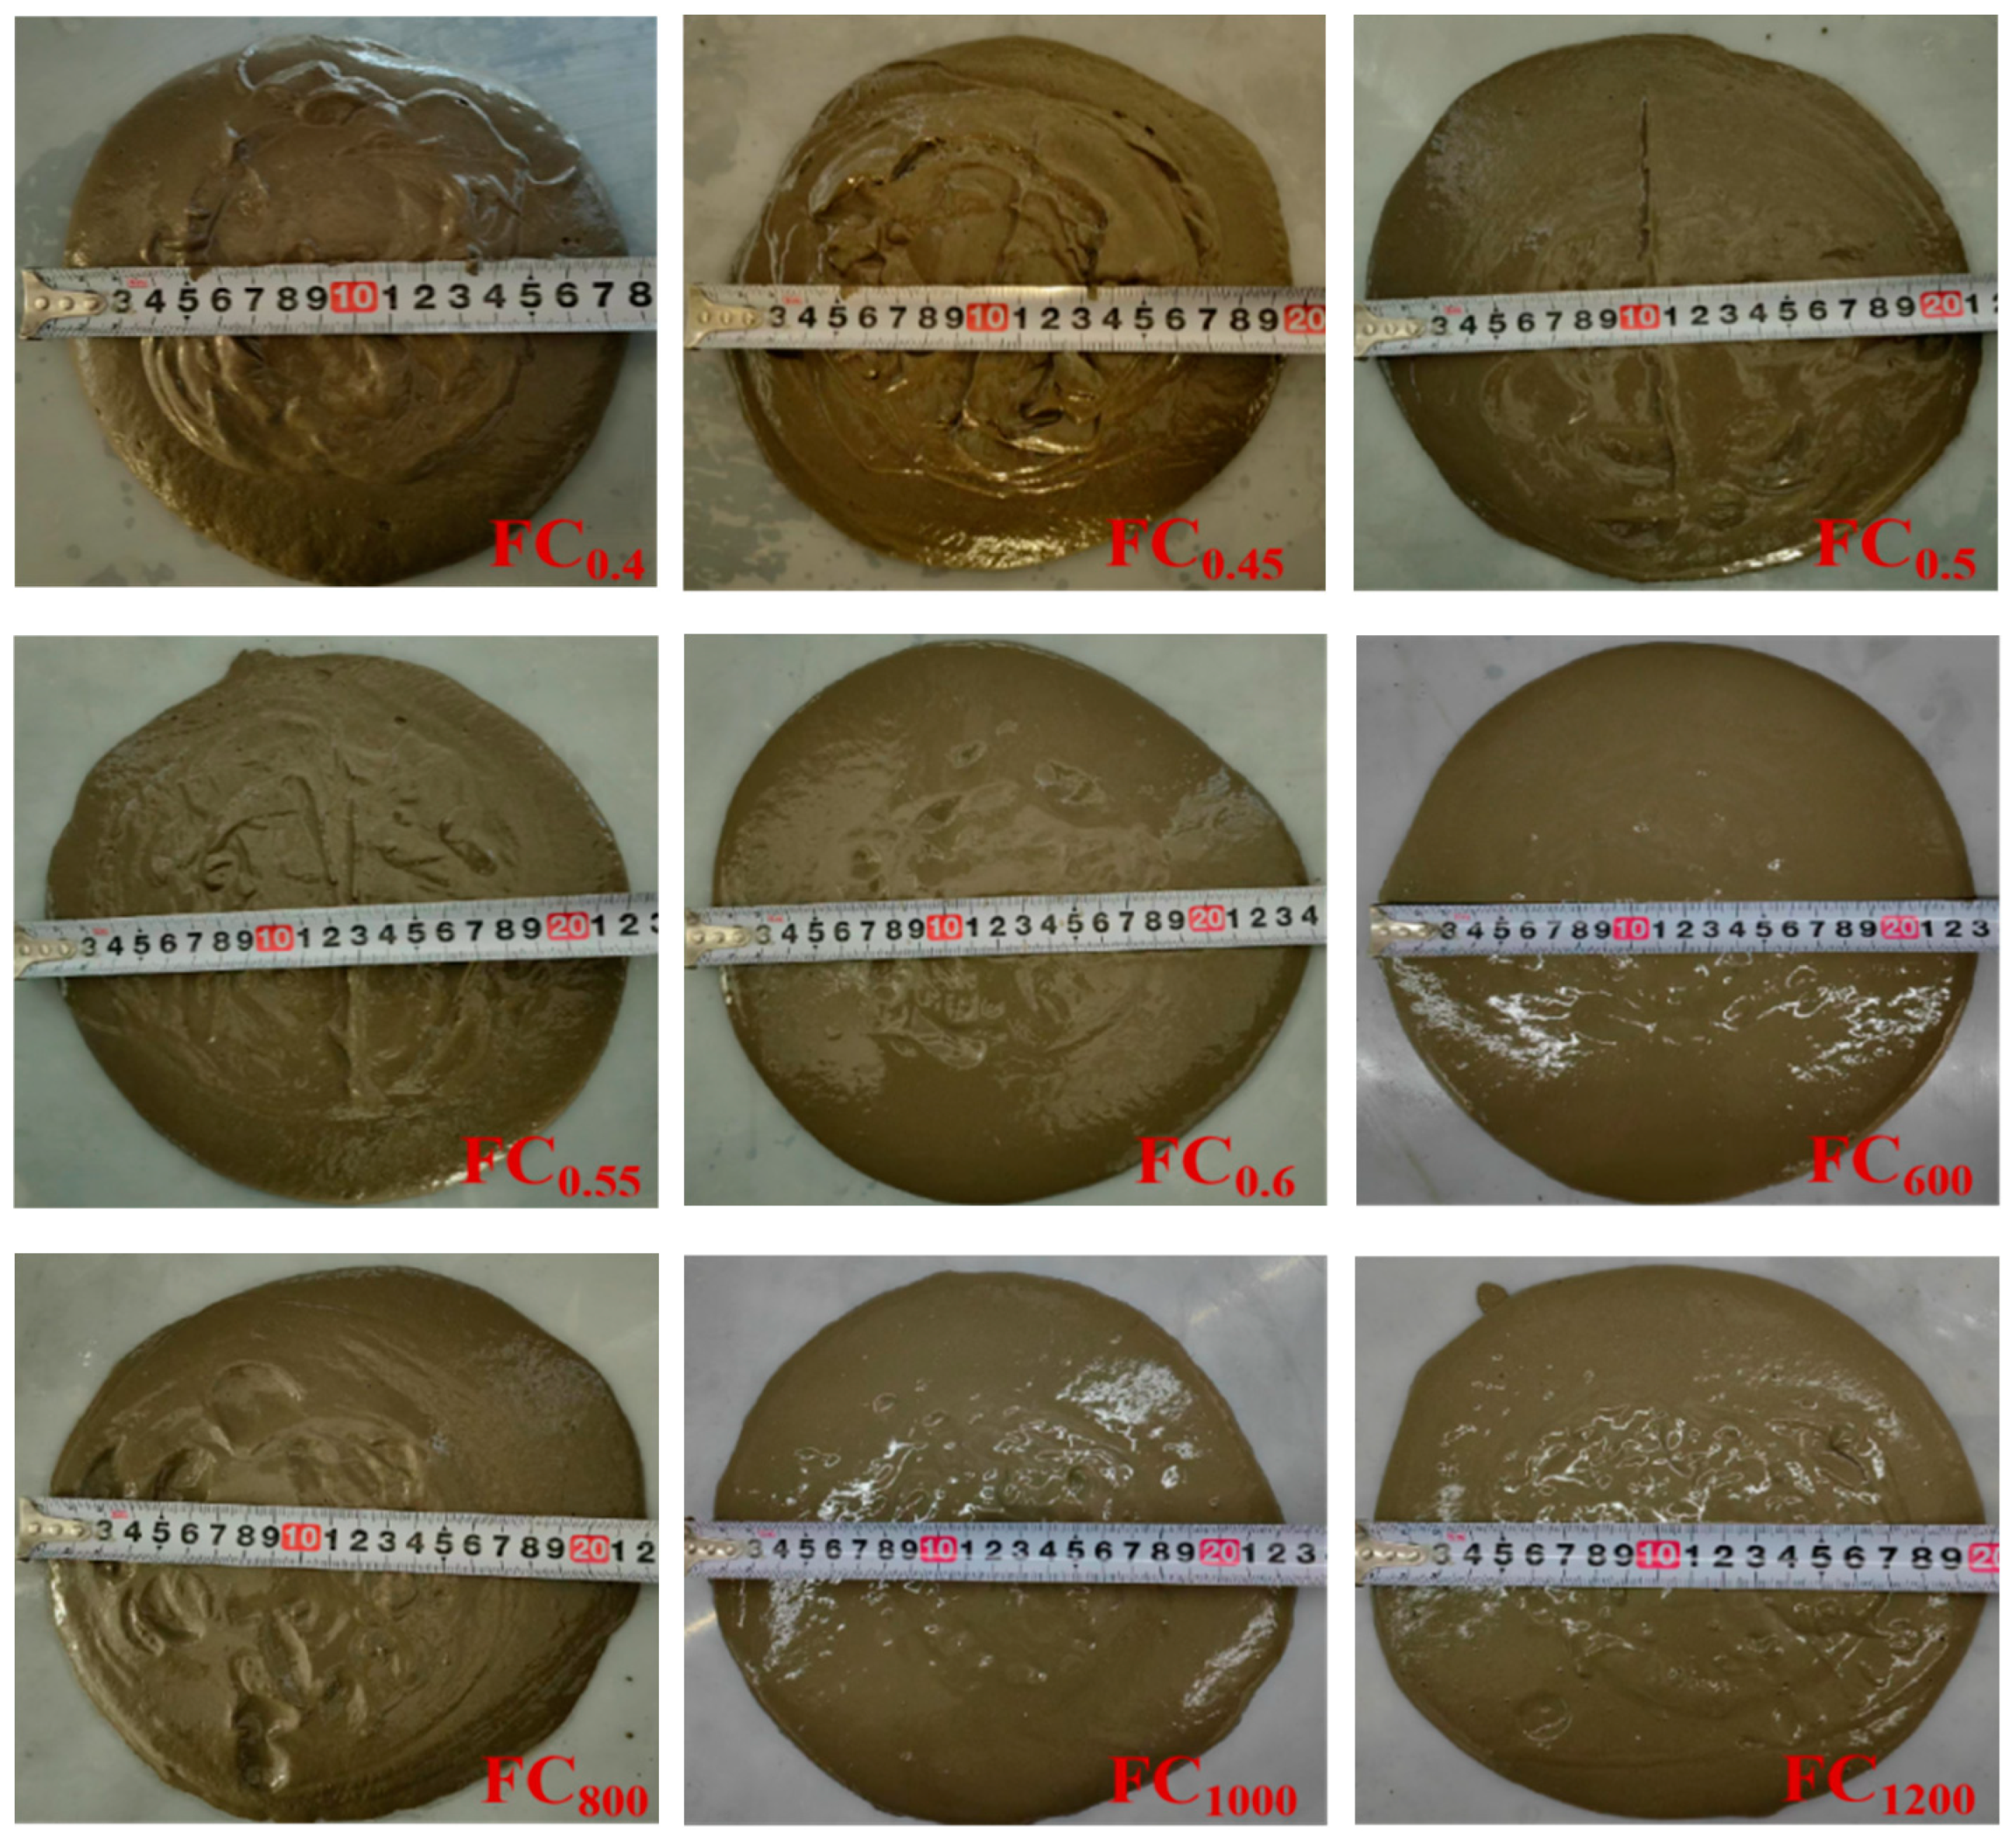
3.1. Fluidity Test
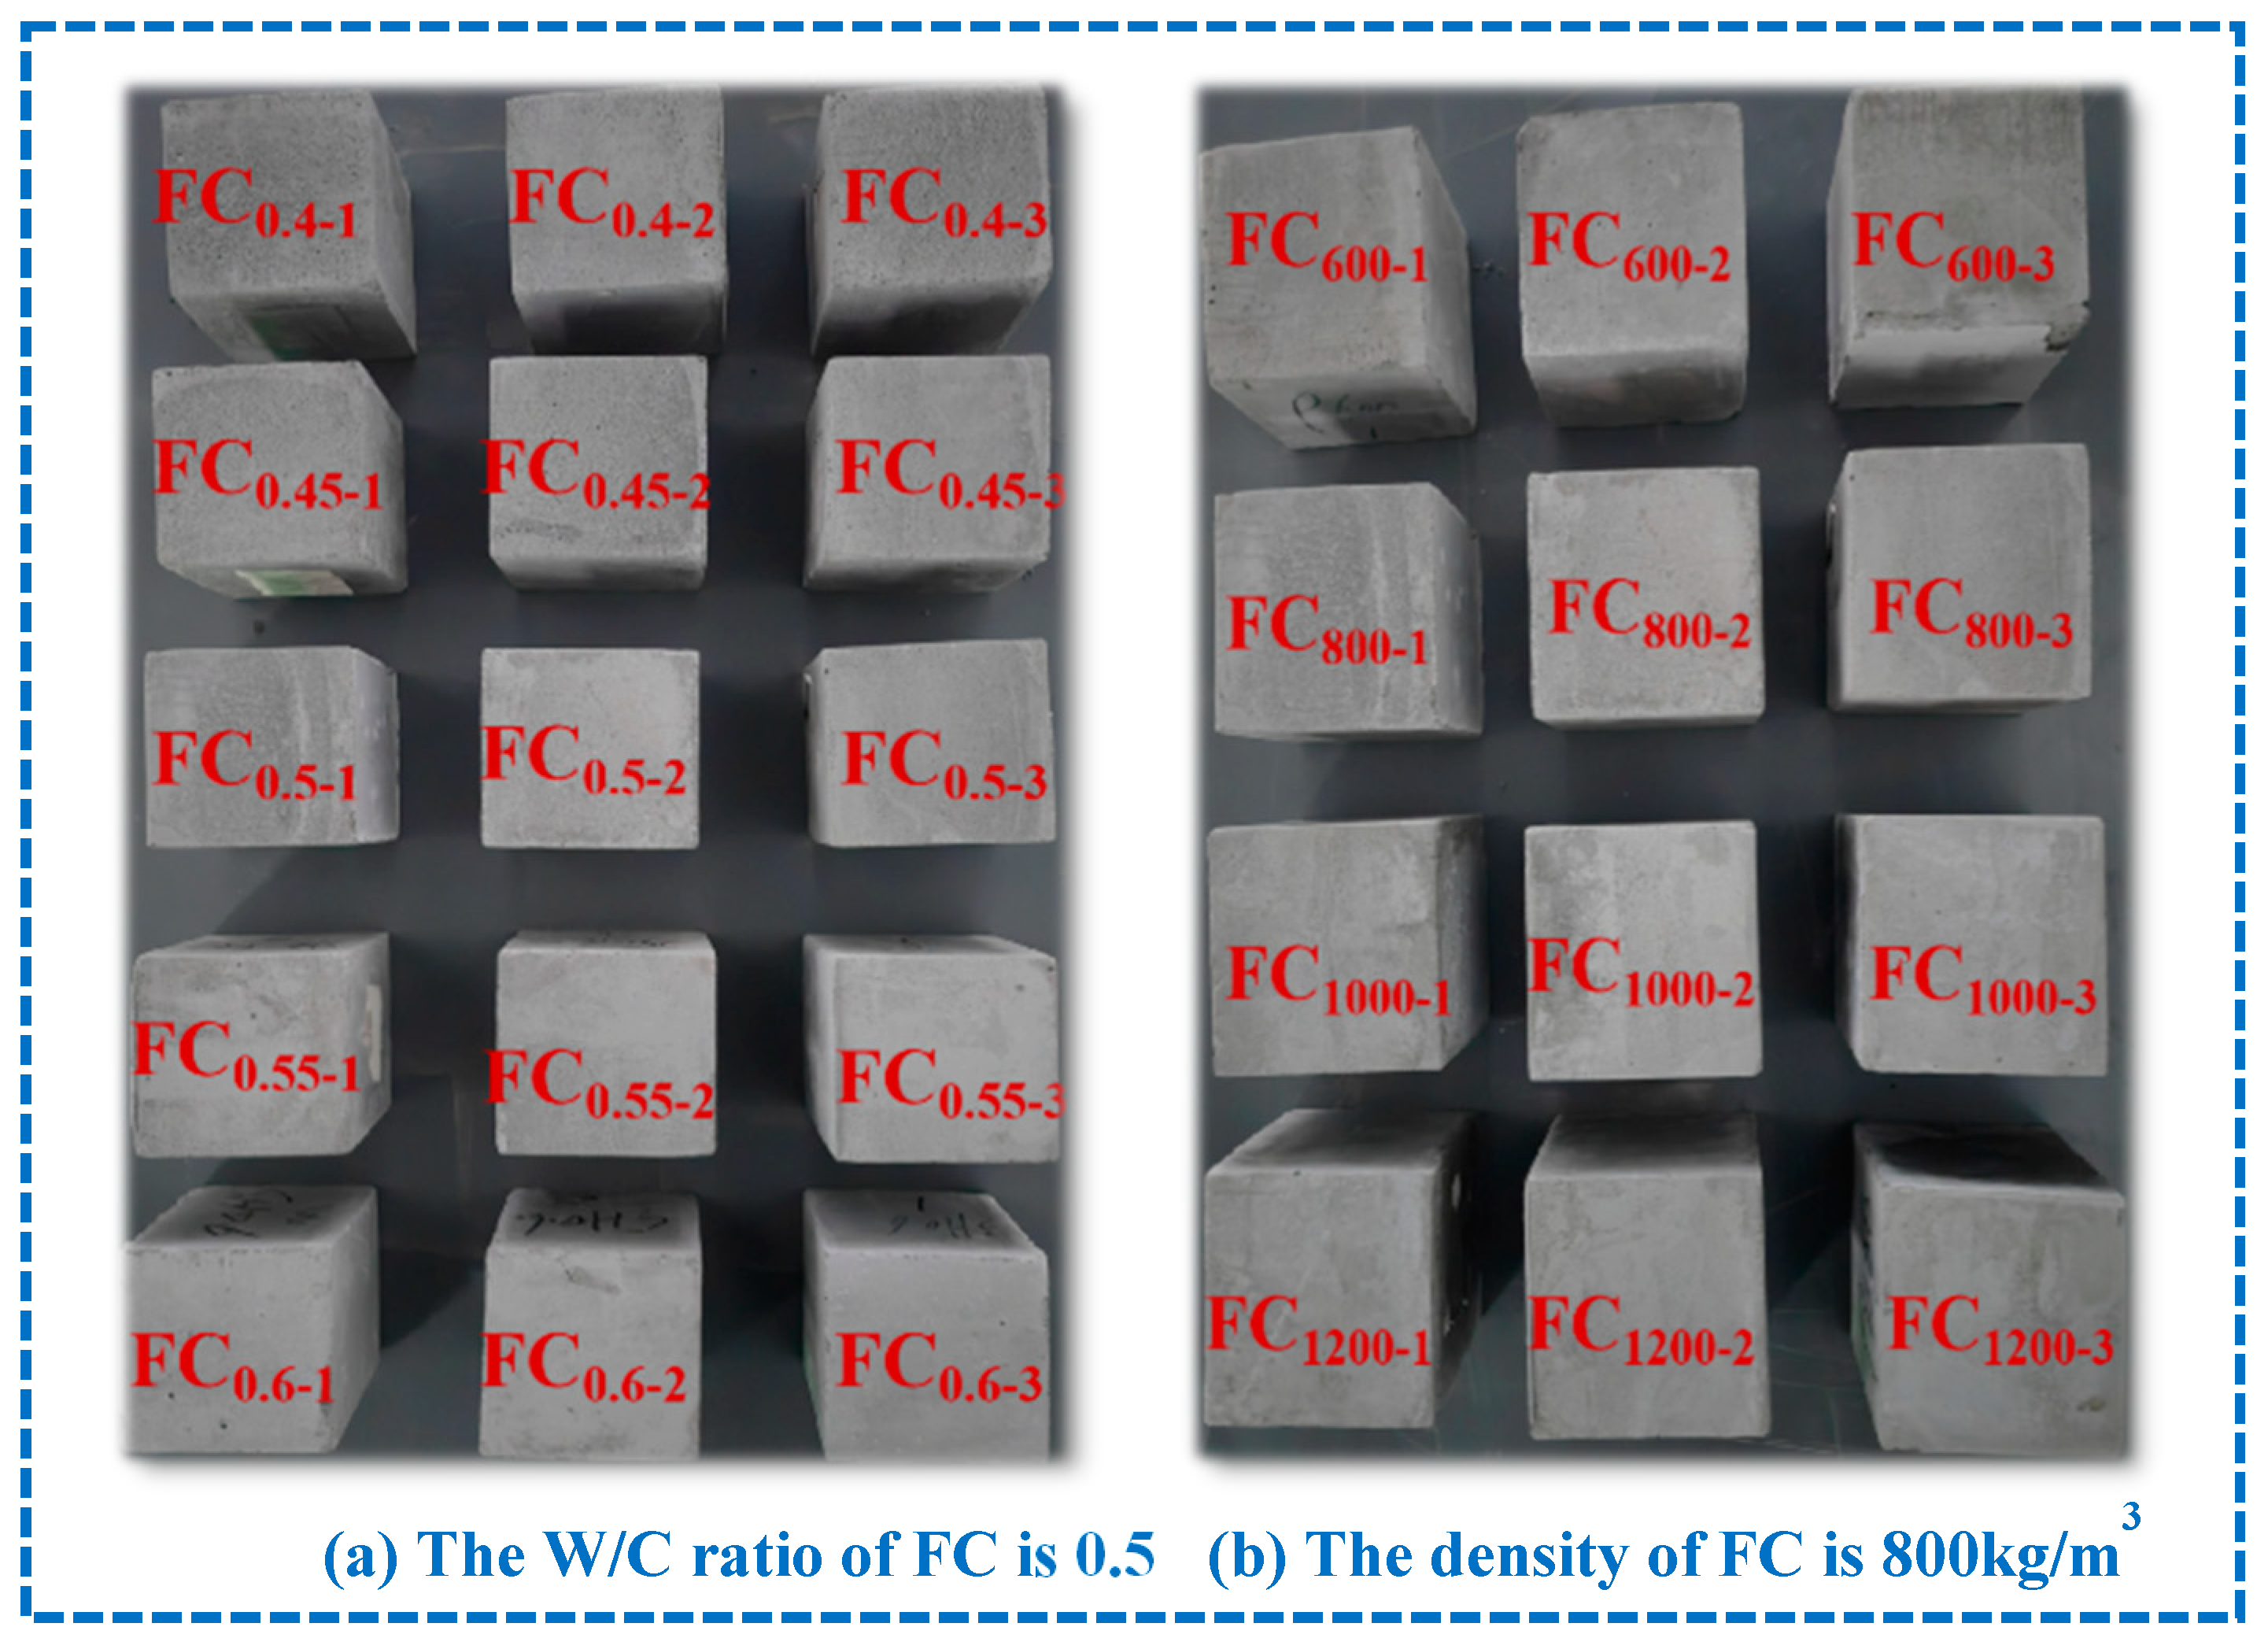
3.2. Uniaxial Compressive Strength Test
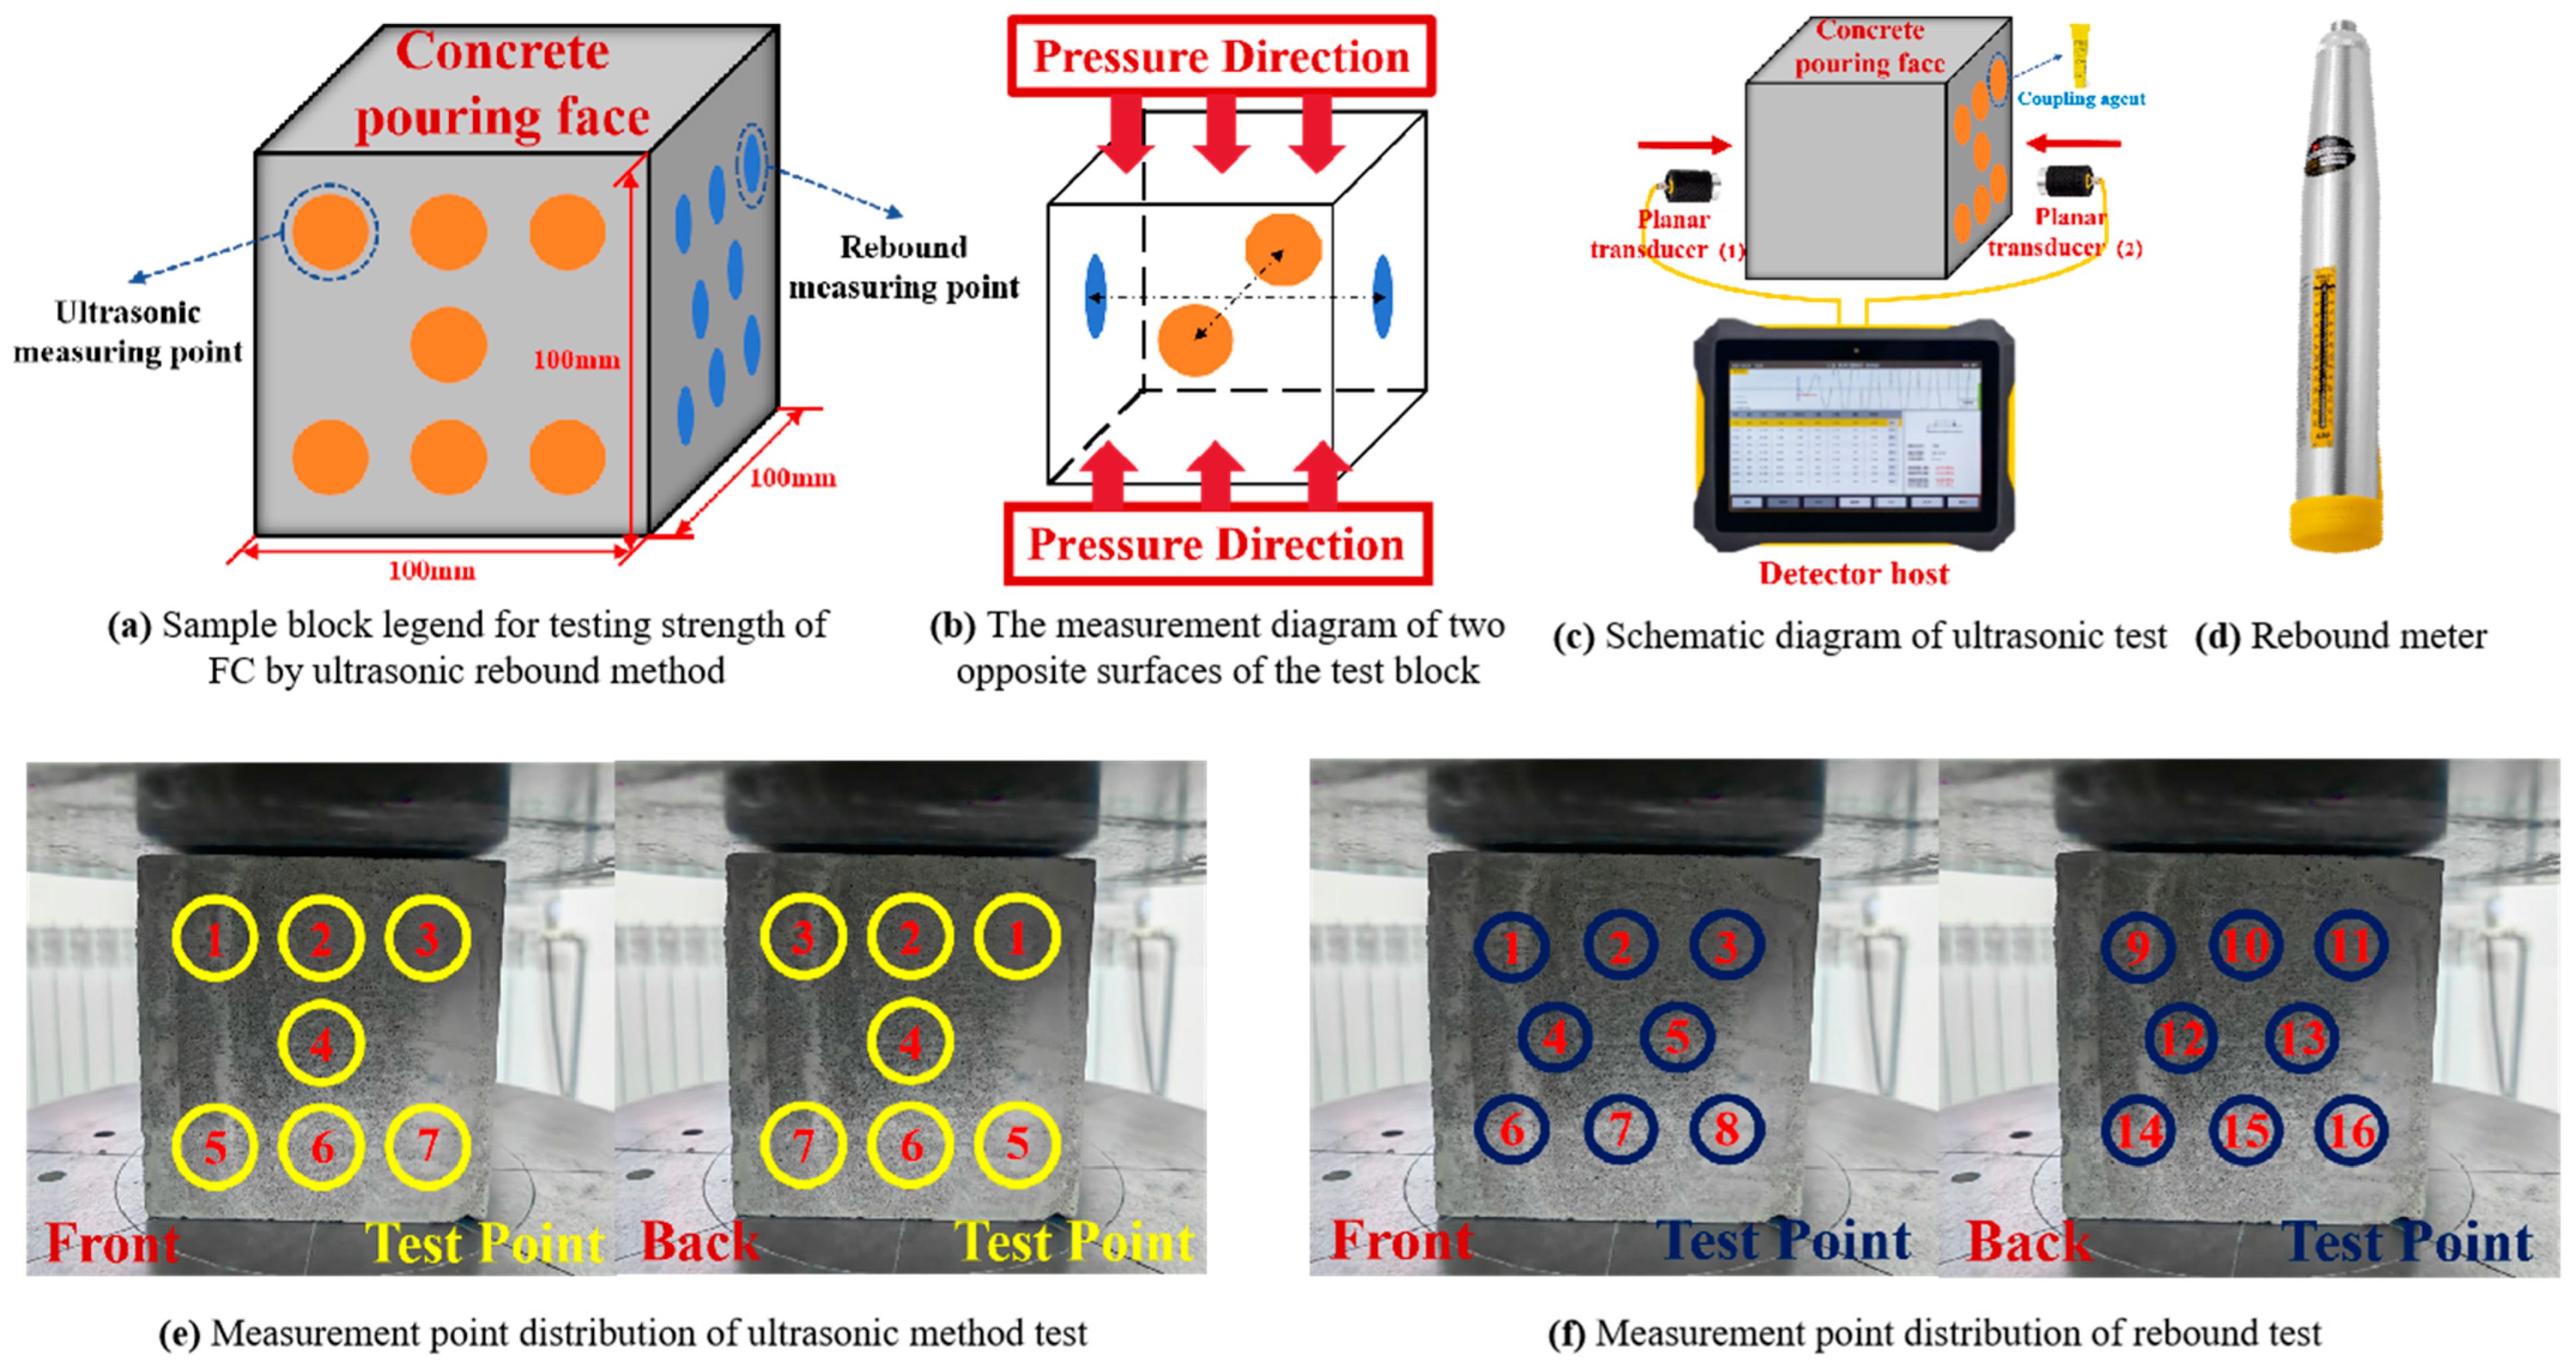
3.3. Nondestructive Testing
3.4. Water Absorption Test
4. Results and Analysis
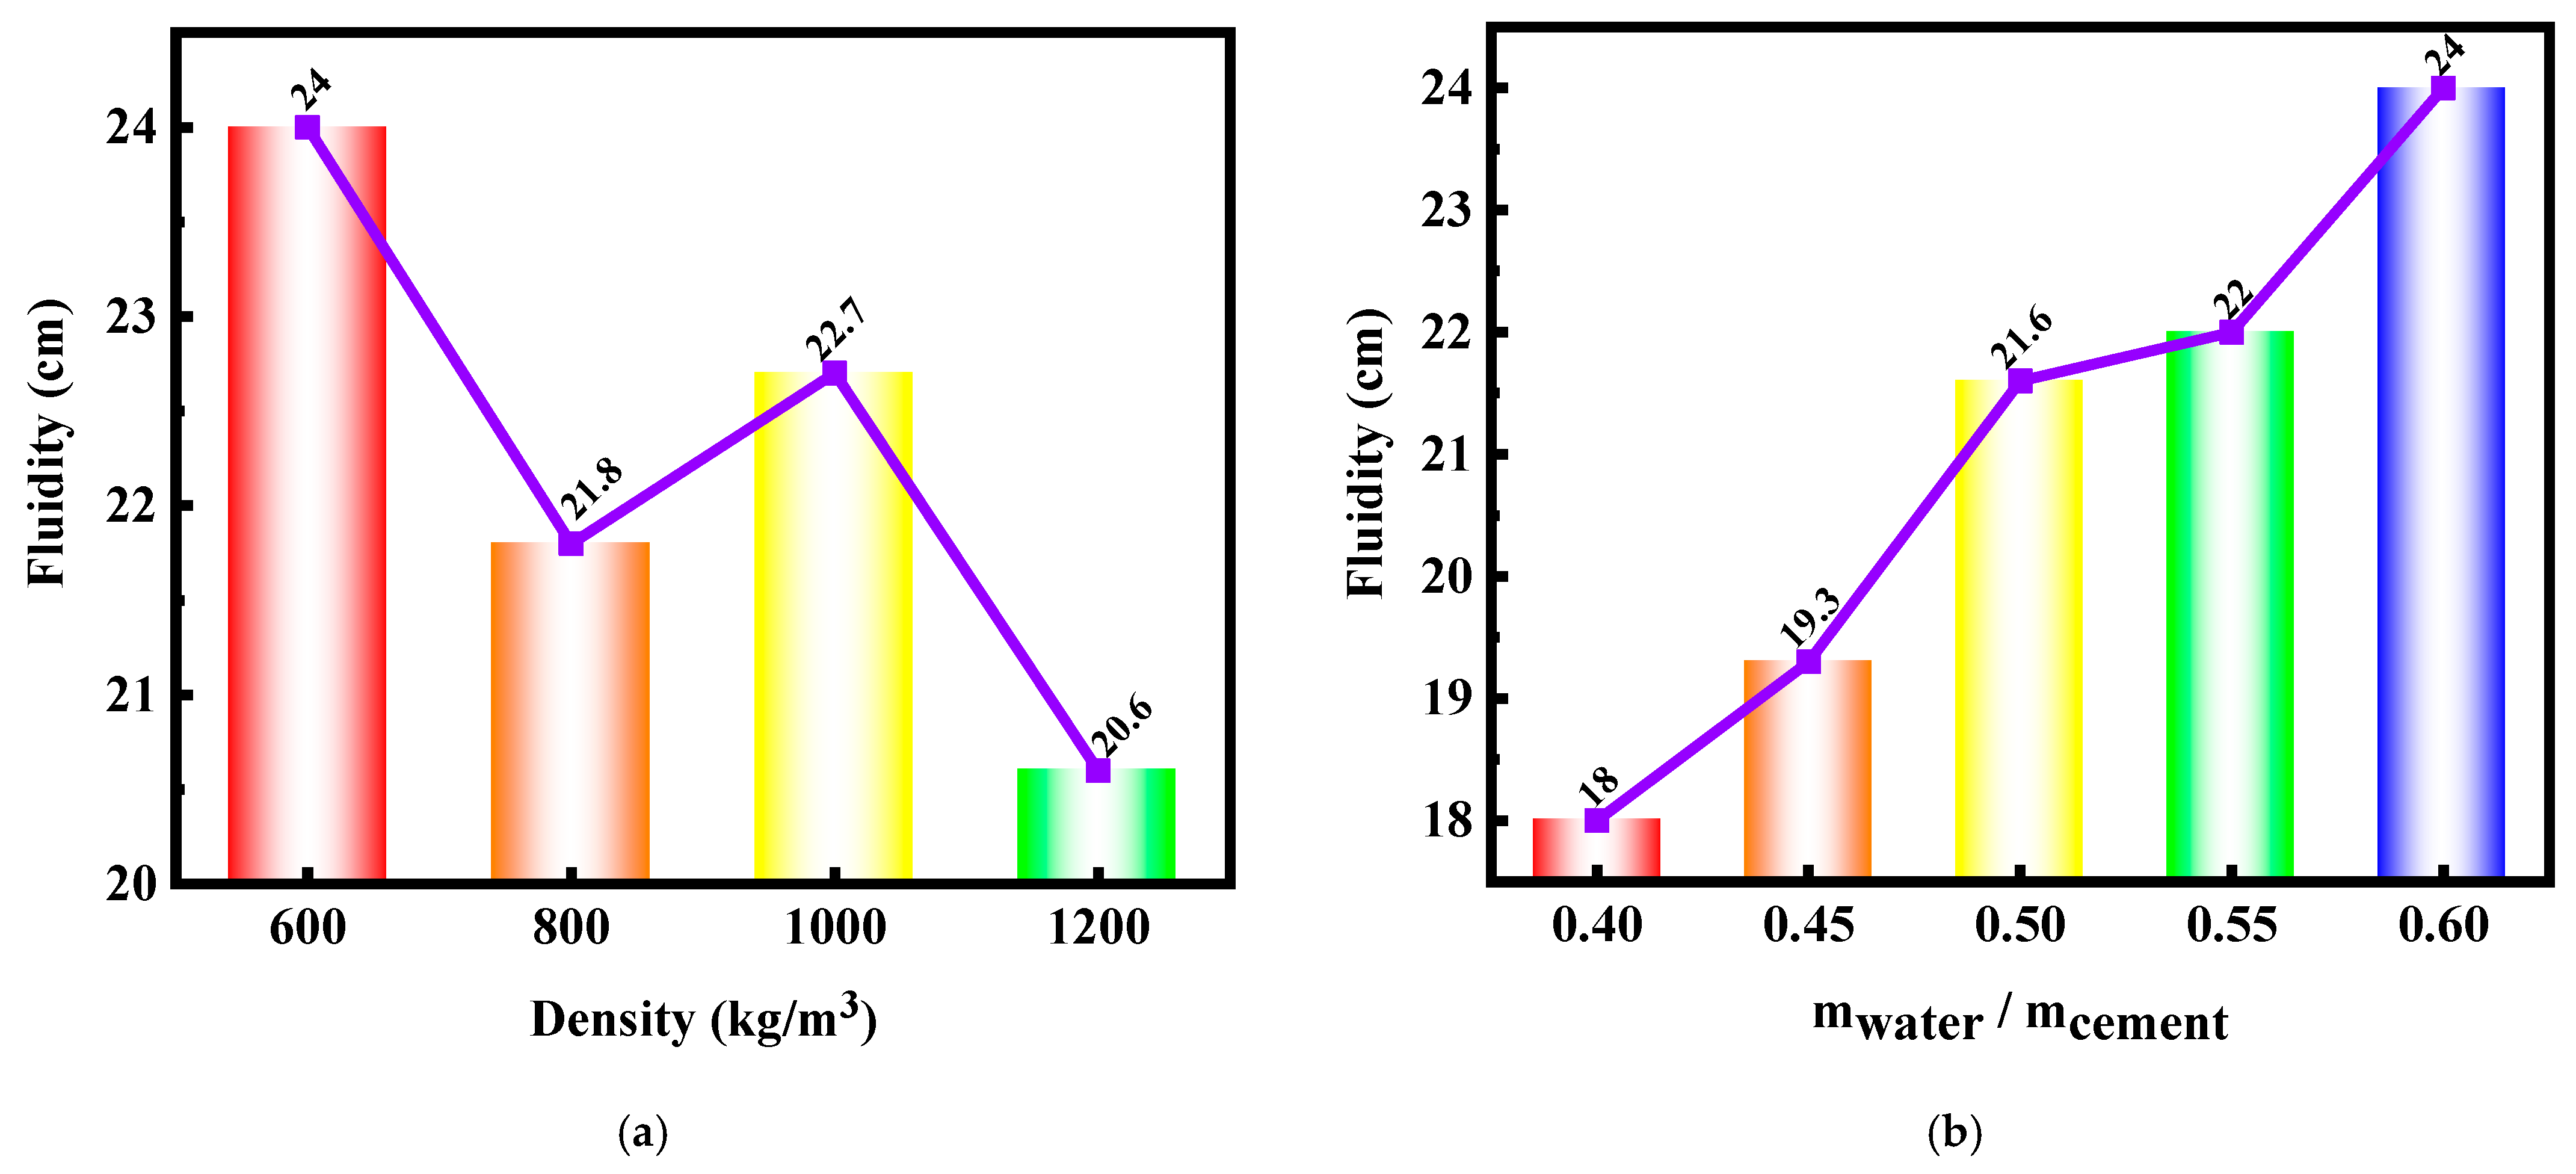
4.1. Fluidity Analysis of FC Slurry
4.2. Analysis of Compressive Performance of FC
4.3. Failure Mode of Foam Concrete Test Block
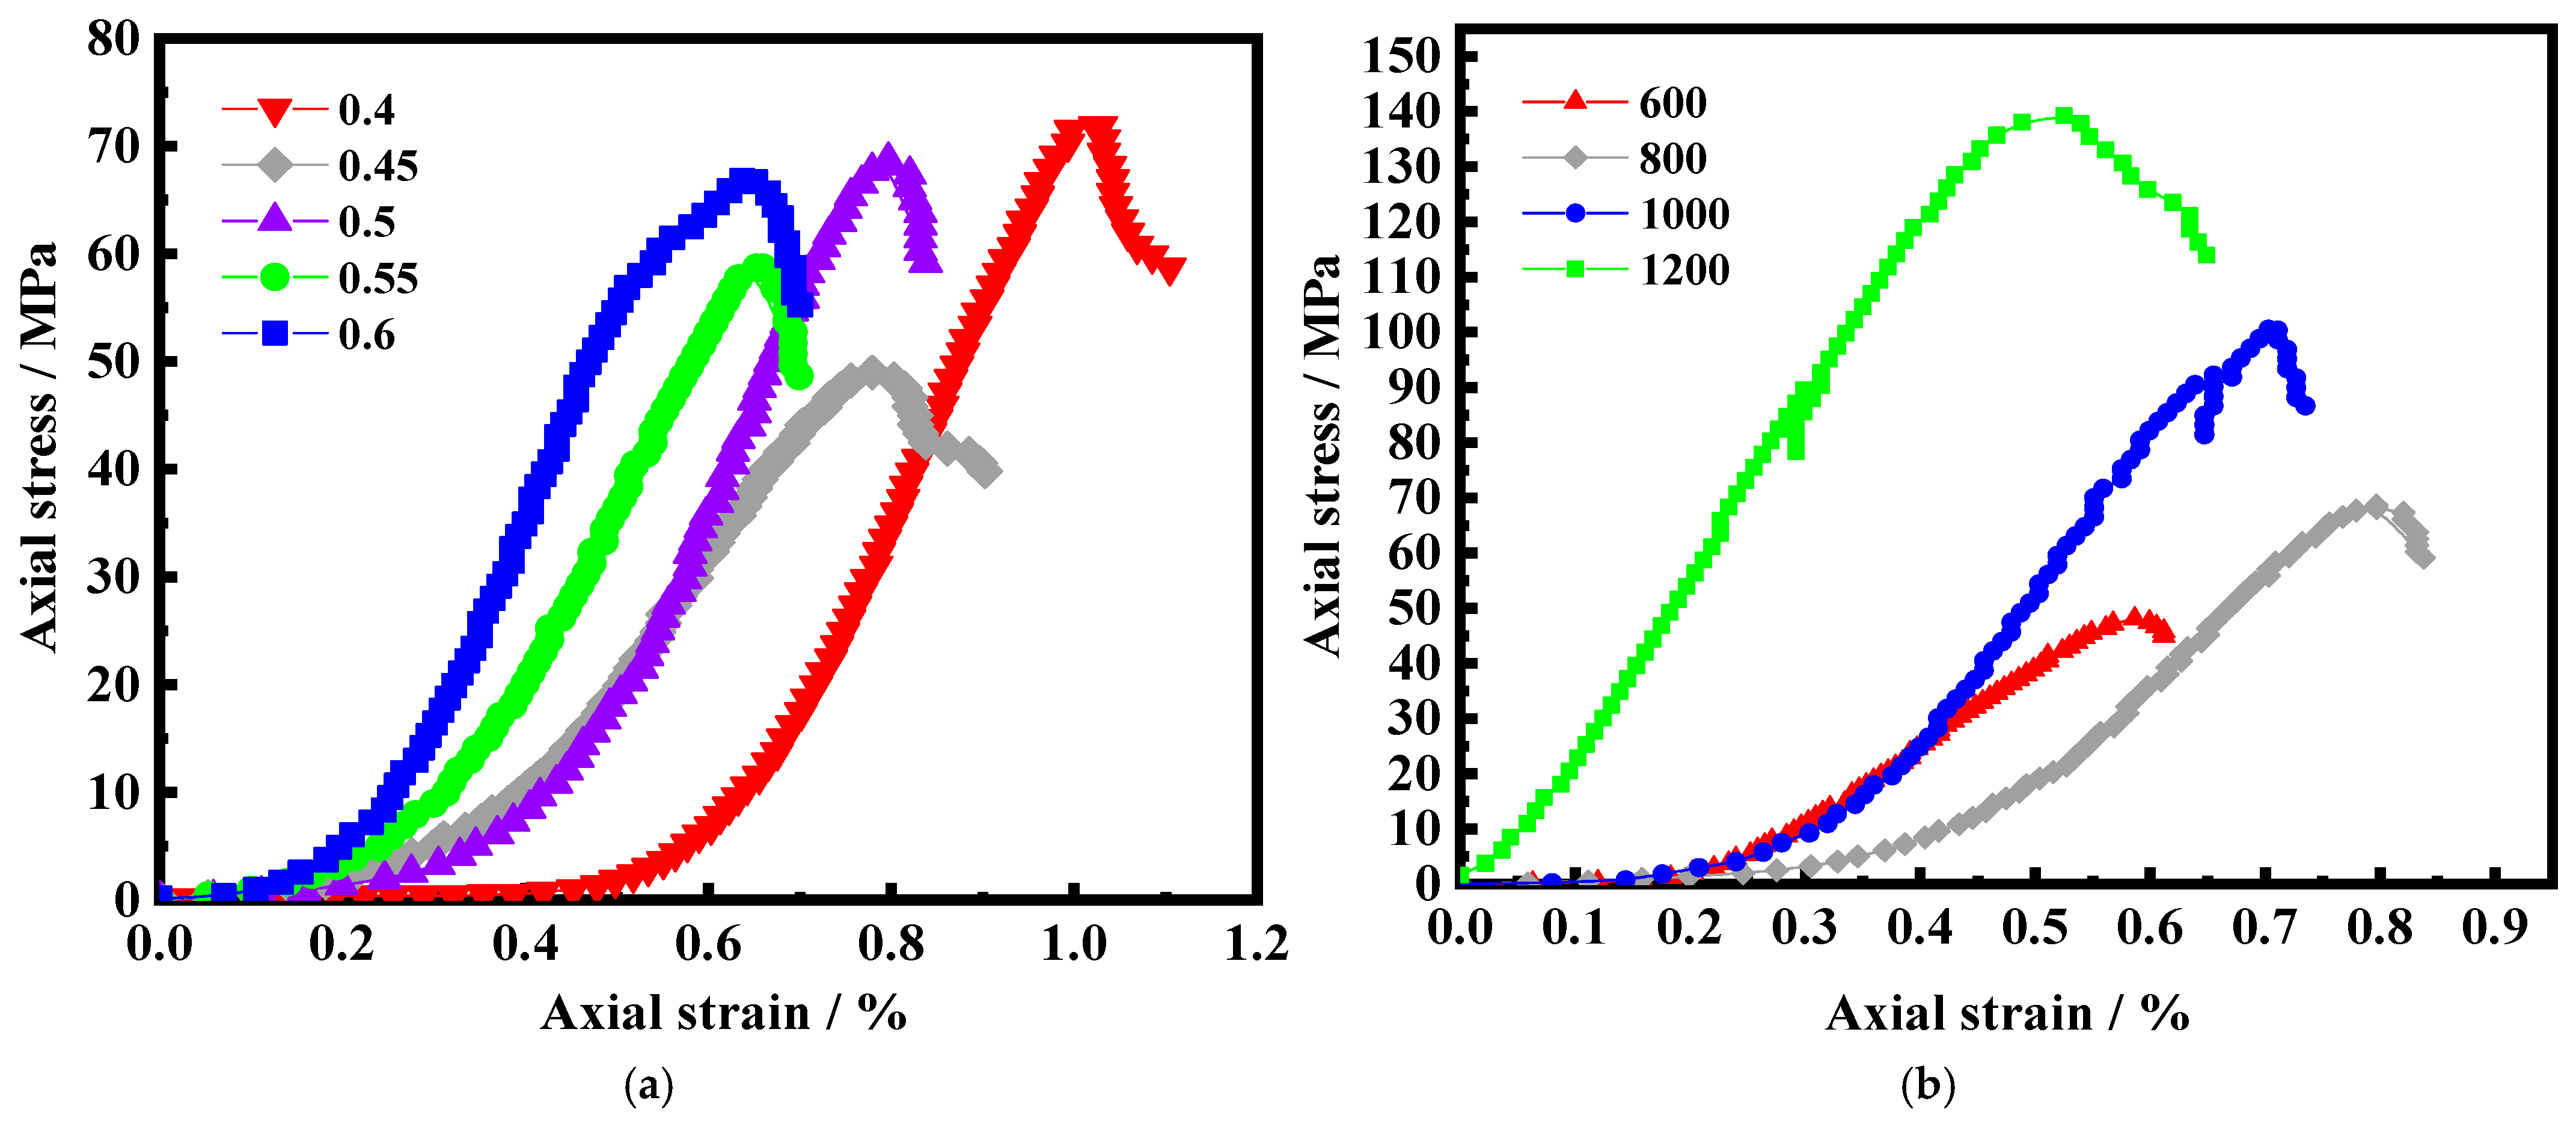
- (1)
- Compaction stage: Under the action of small axial stress, there are slight deformations on the specimen surface and internal micropores. The axial stress of the test block increases gradually with the increase of the axial strain.
- (2)
- Elastic stage: Under the action of axial stress, the particle gap and the closed pore structure in FC show elastic deformation. It is shown that the stress increment of FC is proportional to the strain increment, and this proportion is named the elastic modulus of FC.
- (3)
- Yield stage: At this stage, the relative position of the particles changes and the closed pore structure is damaged, resulting in local stress concentration in the FC. This stage is characterized by a rapid increase in strain and a slow increase in stress. The slope of the curve gradually flattens until the maximum load is reached. The peak stress can be taken as the compressive strength of FC.
- (4)
- Failure stage: A very significant plastic compression deformation occurs after the specimen reaches the maximum axial stress. The axial stress is gradually reduced and stabilized. Due to the high compressibility of FC, it shows load retention during the failure stage. On a macro level, the surface of the FC sample is not broken, and the residual strength remains stable [30].
4.4. Rebound Value and UPV
4.5. Analysis of Water Absorption of FC
5. Conclusions
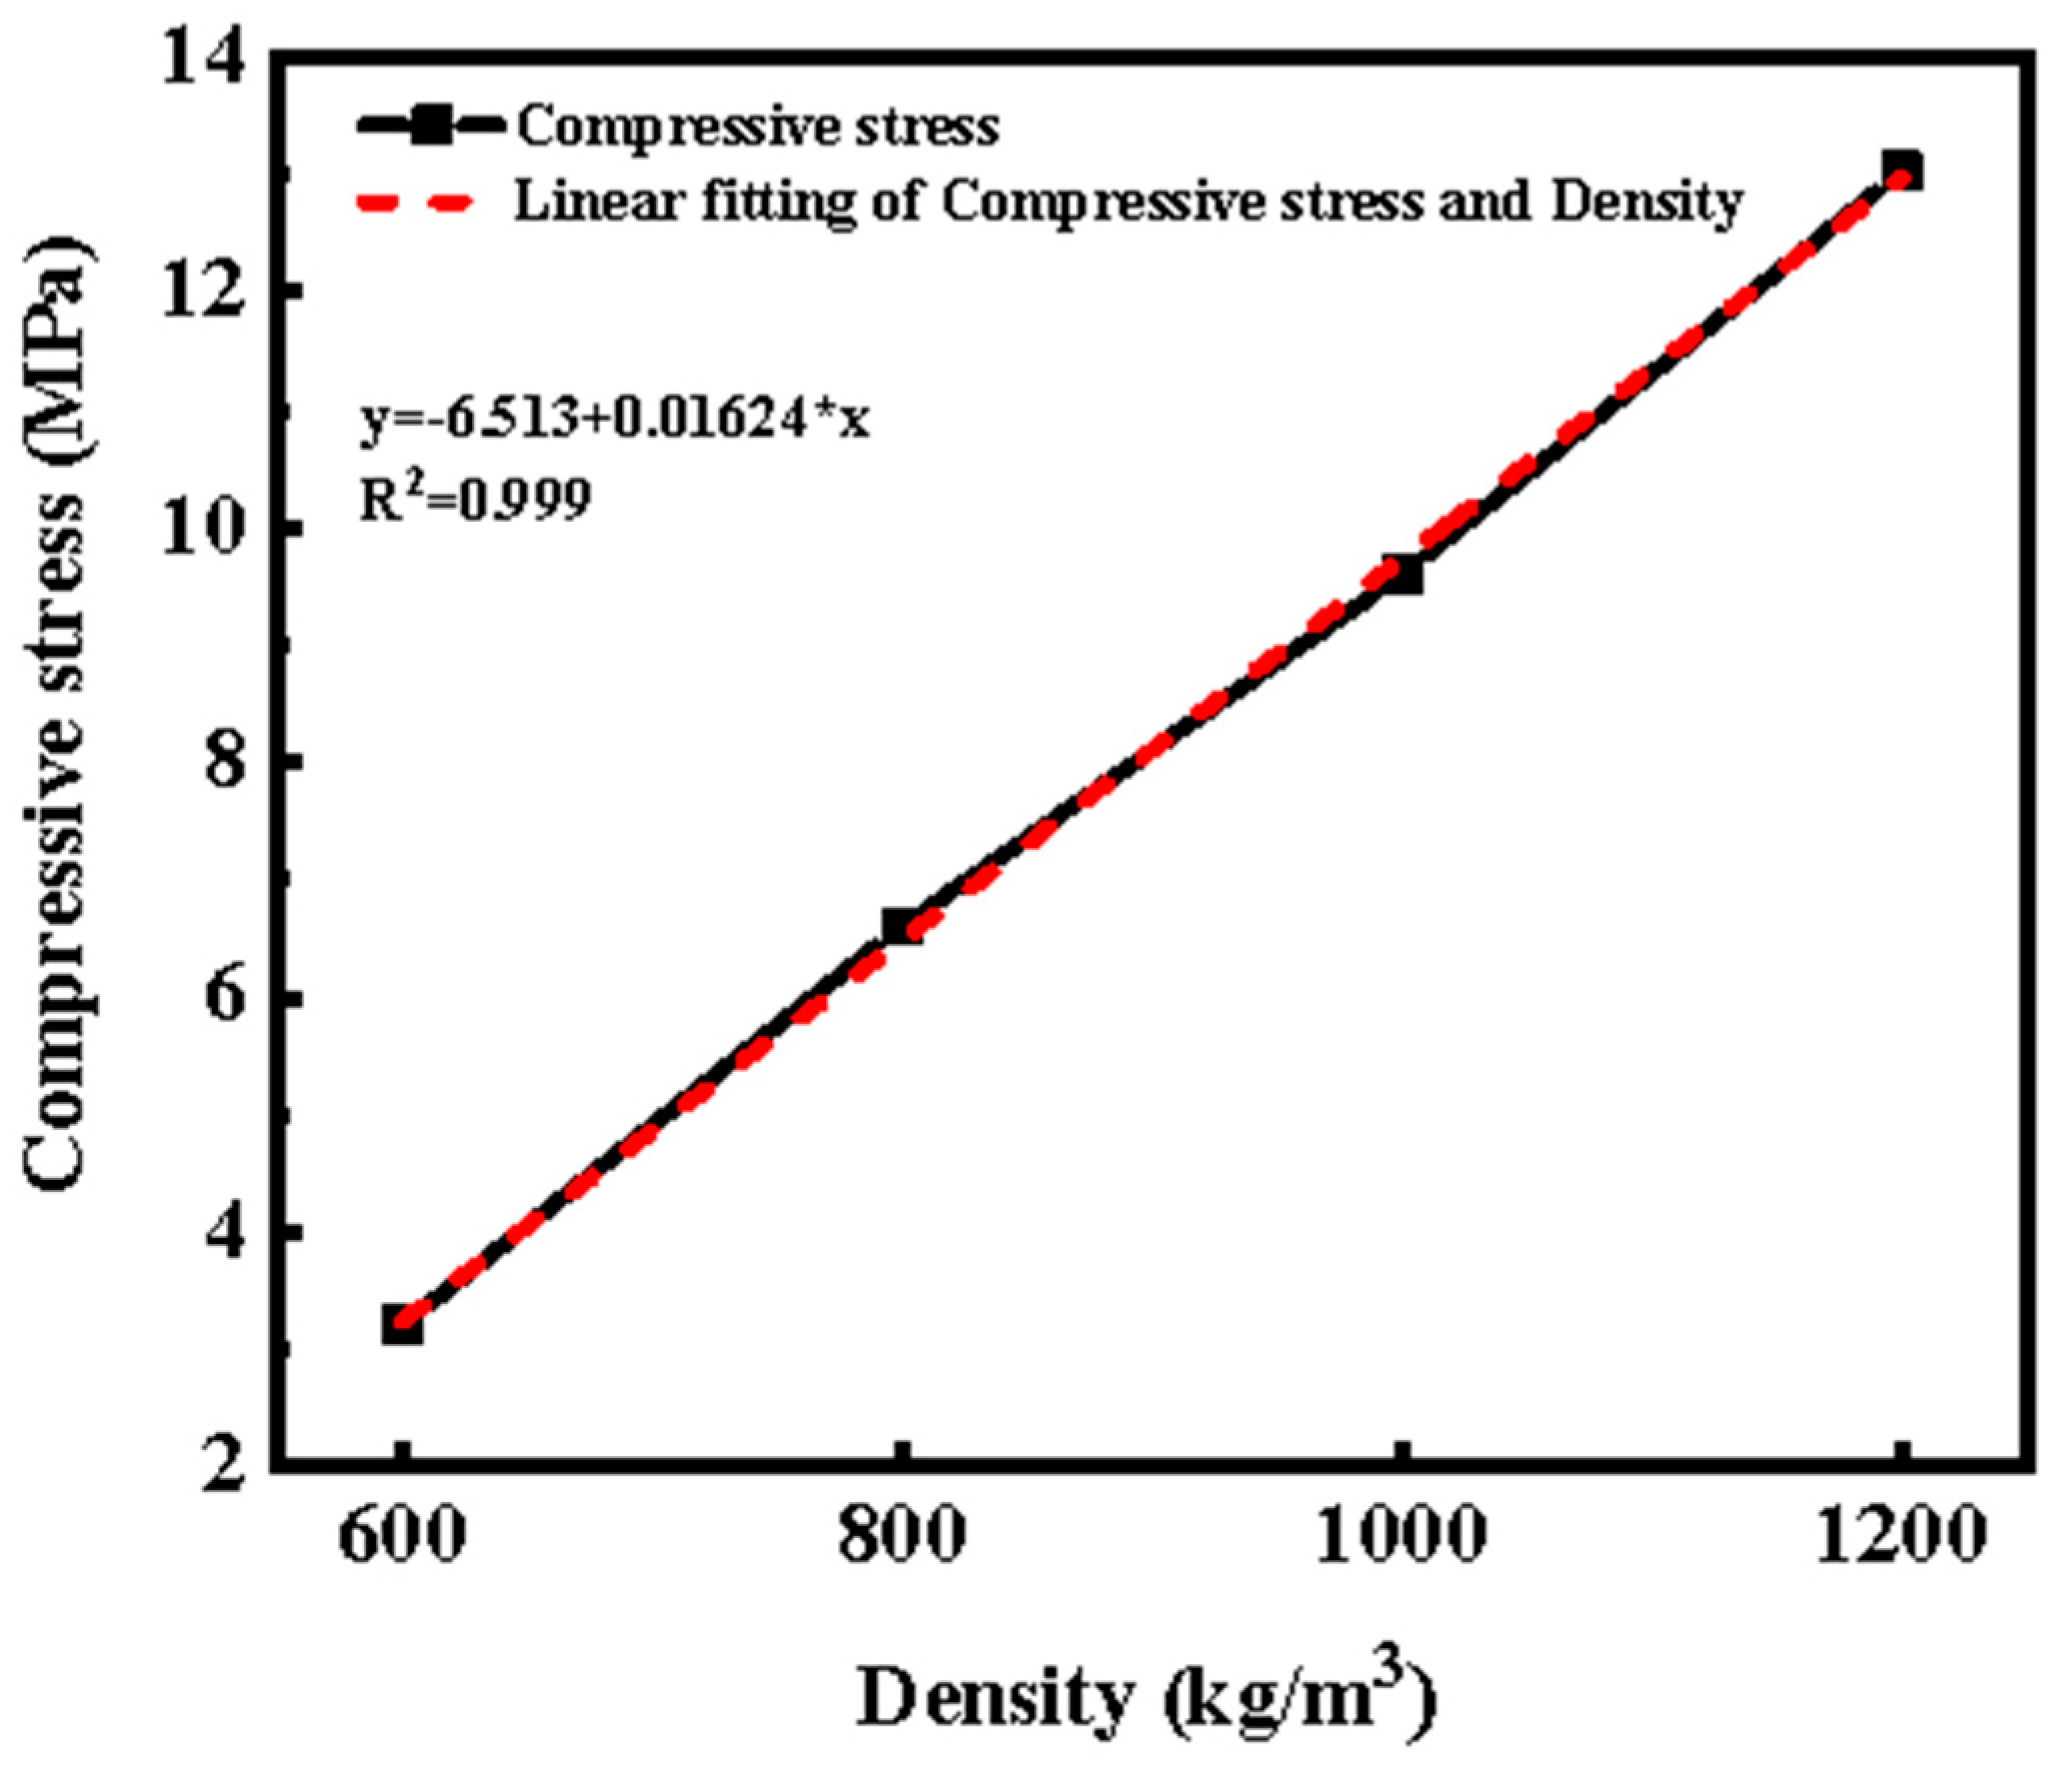
- (1)
- Through mathematical analysis, it was found that the 28 d compressive strength of the FC test block has a very strong correlation with the density. The fitting curve is , and the fitting degree is R2 = 0.999;
- (2)
- It was found that when the W/C ratio is 0.5, the maximum UCS/C of FC is 0.0127, the relative change rate of compressive strength is 32.80%, and the cement utilization rate at this time is significantly improved compared with other W/C ratios;
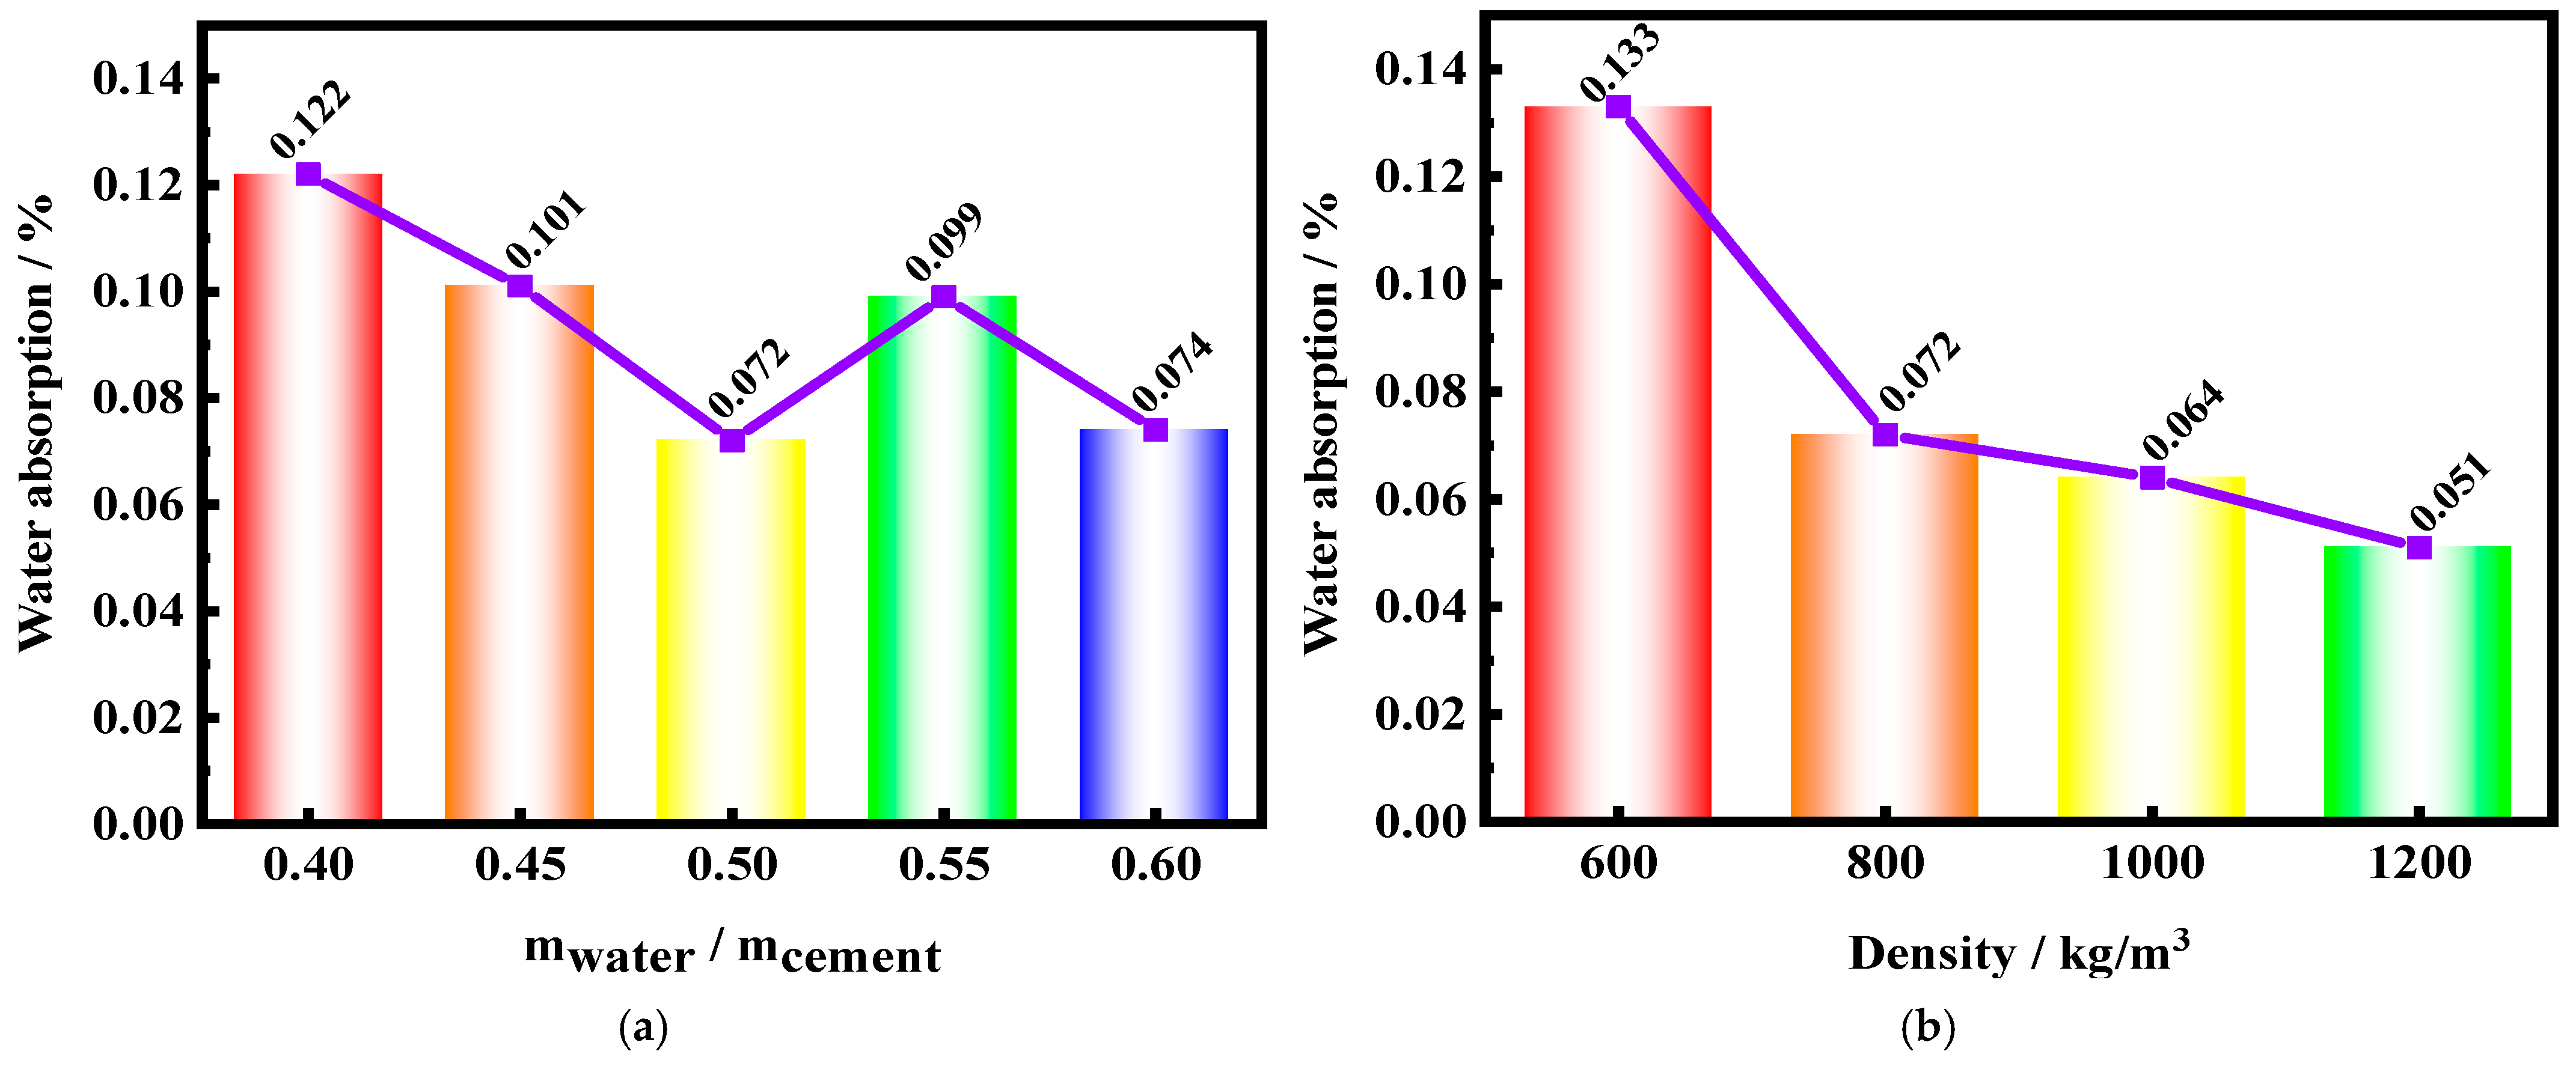
- (3)
- It was found that when the W/C ratio is 0.5, the test block forms a large number of closed holes to minimize its water absorption, which greatly enhances the durability of the FC;
- (4)
- It was found that when the density decreased from 1200 kg/m3 to 1000 kg/m3, the cement usage of FC decreased by 20.73%, the fluidity increased by 10.19%, the water absorption increased by 25.49%, and the compressive strength decreased by 26.32%. However, the compressive strength of the FC test block at this time was 9.6 MPa, which met the application standards. Therefore, the optimal density, as obtained in this paper, is 1000 kg/m3;
- (5)
- The optimal W/C ratio, as determined by this experiment, is 0.5, and the optimal density is 1000 kg/m3.
Author Contributions
Funding
Data Availability Statement
Conflicts of Interest
References
- Valore, R.C. Cellular concretes Part 1 composition and methods of preparation. J. Proc. 1954, 50, 773–796. [Google Scholar]
- Jin, Y.; Wang, X.; Huang, W.; Li, X.; Ma, Q. Mechanical and durability properties of hybrid natural fibre reinforced roadbed foamed concrete. Constr. Build. Mater. 2023, 409, 134008. [Google Scholar] [CrossRef]
- Ramamurthy, K.; Nambiar, E.K.; Ranjani, G.I.S. A classification of studies on properties of foam concrete. Cem. Concr. Compos. 2009, 31, 388–396. [Google Scholar] [CrossRef]
- Raj, A.; Sathyan, D.; Mini, K. Physical and functional characteristics of foam concrete: A review. Constr. Build. Mater. 2019, 221, 787–799. [Google Scholar] [CrossRef]
- Ge, Z.; Yuan, H.; Sun, R.; Zhang, H.; Wang, W.; Qi, H. Use of green calcium sulphoaluminate cement to prepare foamed concrete for road embankment: A feasibility study. Constr. Build. Mater. 2020, 237, 117791. [Google Scholar] [CrossRef]
- Xu, L.; Duan, Y.; Li, Y. Porosity, gradient and impact velocity effects on compressive response of foamed concrete. Constr. Build. Mater. 2022, 315, 125616. [Google Scholar] [CrossRef]
- Shi, J.; Liu, B.; Liu, Y.; Wang, E.; He, Z.; Xu, H.; Ren, X. Preparation and characterization of lightweight aggregate foamed geopolymer concretes aerated using hydrogen peroxide. Constr. Build. Mater. 2020, 256, 119442. [Google Scholar] [CrossRef]
- Amran, Y.H.M.; Farzadnia, N.; Ali, A.A.A. Properties and applications of foamed concrete; a review. Constr. Build. Mater. 2015, 101, 990–1005. [Google Scholar] [CrossRef]
- Lezgy-Nazargah, M.; Vidal, P.; Polit, O. A 1D nonlinear finite element model for analysis of composite foam-insulated concrete sandwich panels. Compos. Struct. 2019, 210, 663–675. [Google Scholar] [CrossRef]
- Guo, Y.; Chen, X.; Chen, B.; Wen, R.; Wu, P. Analysis of foamed concrete pore structure of railway roadbed based on X-ray computed tomography. Constr. Build. Mater. 2021, 273, 121773. [Google Scholar] [CrossRef]
- Hashim, M.; Tantray, M. Comparative study on the performance of protein and synthetic-based foaming agents used in foamed concrete. Case Stud. Constr. Mater. 2021, 14, e00524. [Google Scholar] [CrossRef]
- Dhasindrakrishna, K.; Pasupathy, K.; Ramakrishnan, S.; Sanjayan, J. Progress, current thinking and challenges in geopolymer foam concrete technology. Cem. Concr. Compos. 2021, 116, 103886. [Google Scholar] [CrossRef]
- SatySatyanarayana, G.V.V.; Ranjith, A. Experimental Studies on Compressive Strength of Aerated Concrete with Varying Percentage of Aluminium Powder. In E3S Web of Conferences; EDP Sciences: Les Ulis, France, 2021; Volume 309, p. 01197. [Google Scholar]
- Jiang, L.; Wang, K.; Fang, H.; Chen, B.; Zhu, L.; Zhang, Q.; Zhang, X. Protection performance of a novel anti-collision guardrail with recycled foamed concrete under vehicle collision. Eng. Struct. 2024, 305, 117795. [Google Scholar] [CrossRef]
- Liu, K.W.; Yue, F.; Su, Q.; Zhou, C.; Xiong, Z.; He, Y. Assessment of the use of fiberglass-reinforced foam concrete in high-speed railway bridge approach involving foundation cost comparison. Adv. Struct. Eng. 2020, 23, 388–396. [Google Scholar] [CrossRef]
- Baghban, S.; Mo, K.H.; Ibrahim, Z.; Radwan, M.K.; Shah, S.N. Effect of basalt and polypropylene fibers on crumb rubber mortar with Portland cement and calcium aluminate cement binders: Strength and artificial neural network prediction model. Prog. Rubber Plast. Recycl. Technol. 2022, 38, 99–124. [Google Scholar] [CrossRef]
- Han, W.; Lee, J.S.; Jeong, S.H.; Lim, D.S.; Byun, Y.H. Evaluation of engineering properties of expandable foam grout with admixture content. Constr. Build. Mater. 2021, 293, 123488. [Google Scholar] [CrossRef]
- Huang, W.; Chen, X.; Feng, L.; Ji, T.; Ning, Y.; Wang, J. Experimental investigation of mechanical behavior and microstructural properties in roadbed foam concrete at different densities and correlation analysis. Case Stud. Constr. Mater. 2023, 19, e02565. [Google Scholar] [CrossRef]
- Zhang, H.; Qi, X.; Wan, L.; Zuo, Z.; Ge, Z.; Wu, J.; Song, X. Properties of silt-based foamed concrete: A type of material for use in backfill behind an abutment. Constr. Build. Mater. 2020, 261, 119966. [Google Scholar] [CrossRef]
- Cong, M.; Bing, C. Properties of a foamed concrete with soil as filler. Constr. Build. Mater. 2015, 76, 61–69. [Google Scholar] [CrossRef]
- Falliano, D.; De Domenico, D.; Ricciardi, G.; Gugliandolo, E. Experimental investigation on the compressive strength of foamed concrete: Effect of curing conditions, cement type, foaming agent and dry density. Constr. Build. Mater. 2018, 165, 735–749. [Google Scholar] [CrossRef]
- Guan, L.L.; Chen, Y.G.; Ye, W.M.; Wu, D.B.; Deng, Y.F. Foamed concrete utilizing excavated soil and fly ash for urban underground space backfilling: Physical properties, mechanical properties, and microstructure. Tunn. Undergr. Space Technol. 2023, 134, 104995. [Google Scholar] [CrossRef]
- Hoff, G.C. Porosity-strength considerations for cellular concrete. Cem. Concr. Res. 1972, 2, 91–100. [Google Scholar] [CrossRef]
- Kearsley, E.P.; Wainwright, P.J. Porosity and permeability of foamed concrete. Cem. Concr. Res. 2001, 31, 805–812. [Google Scholar] [CrossRef]
- Li, C.; Li, X.; Guan, D.; Li, S.; Lv, W.; Cong, Z.; Soloveva, V.Y.; Dalerjon, H.; Qin, P.; Liu, X. Study on influence factors of compressive strength of low density backfill foamed concrete used in natural gas pipeline tunnel. Sustainability 2022, 14, 8333. [Google Scholar] [CrossRef]
- Li, C.; Li, X.; Li, S.; Guan, D.; Xiao, C.; Xu, Y.; Soloveva, V.Y.; Dalerjon, H.; Qin, P.; Liu, X. Effect of Maintenance and Water–Cement Ratio on Foamed Concrete Shrinkage Cracking. Polymers 2022, 14, 2703. [Google Scholar] [CrossRef]
- Zhang, S.; Qi, X.; Guo, S.; Zhang, L.; Ren, J. A systematic research on foamed concrete: The effects of foam content, fly ash, slag, silica fume and water-to-binder ratio. Constr. Build Mater. 2022, 339, 127683. [Google Scholar] [CrossRef]
- Meera, M.; Gupta, S. Development of a strength model for foam concrete based on water–cement ratio. Mater. Today Proc. 2020, 32, 923–927. [Google Scholar] [CrossRef]
- Liu, X.; Huang, F.; Zheng, A. Investigation of foam concrete’s mechanical properties and multi-scale damage evolution characteristics under uniaxial loading. Constr. Build. Mater. 2024, 430, 136503. [Google Scholar] [CrossRef]
- JC/T2199-2013; Ministry of Industry and Information Technology of the People’s Republic of China. Foaming Agents for Foamed Concrete. China Construction Science And Technology Press: Beijing, China, 2013. (In Chinese)
- JG/T266-2011; Ministry of Housing and Urban-Rural Development of the People’s Republic of China. Foam Concrete. China Standards Press: Beijing, China, 2011. (In Chinese)
- JGJ/T23-2011; Ministry of Housing and Urban-Rural Development of the People’s Republic of China. Technical Specification for Inspecting of Concrete Compressive Strength by Rebound Method. China Construction Industry Press: Beijing, China, 2011. (In Chinese)
- T/CECS02-2020; China Engineering Construction Standardization Association. Technical Specification for Inspecting Compressive Strength of Concrete by Ultrasonic-Rebound Combined Method. China Planning Press: Beijing, China, 2020. (In Chinese)
- Zhang, X.; Yang, Q.; Shi, Y.; Zheng, G.; Li, Q.; Chen, H.; Cheng, X. Effects of different control methods on the mechanical and thermal properties of ultra-light foamed concrete. Constr. Build. Mater. 2020, 262, 120082. [Google Scholar] [CrossRef]
- JGJ/T341-2014; Ministry of Housing and Urban-Rural Development of the People’s Republic of China. Technical Specification for Application of Foamed Concrete. China Construction Industry Press: Beijing, China, 2014. (In Chinese)
- Nambiar, E.K.K.; Ramamurthy, K. Models relating mixture composition to the density and strength of foam concrete using response surface methodology. Cem. Concr. Compos. 2006, 28, 752–760. [Google Scholar] [CrossRef]
- Nambiar, E.K.K.; Ramamurthy, K. Influence of filler type on the properties of foam concrete. Cem. Concr. Compos. 2006, 28, 475–480. [Google Scholar] [CrossRef]
- Tan, X.; Chen, W.; Hao, Y.; Wang, X. Experimental study of ultralight (<300 kg/m3) foamed concrete. Adv. Mater. Sci. Eng. 2014, 2014, 514759. [Google Scholar]
- Bing, C.; Zhen, W.; Ning, L. Experimental research on properties of high-strength foamed concrete. J. Mater. Civ. Eng. 2012, 24, 113–118. [Google Scholar] [CrossRef]
- Chung, S.Y.; Abd Elrahman, M.; Kim, J.S.; Han, T.S.; Stephan, D.; Sikora, P. Comparison of lightweight aggregate and foamed concrete with the same density level using image-based characterizations. Constr. Build. Mater. 2019, 211, 988–999. [Google Scholar] [CrossRef]
- Abd Elrahman, M.; El Madawy, M.E.; Chung, S.Y.; Sikora, P.; Stephan, D. Preparation and characterization of ultra-lightweight foamed concrete incorporating lightweight aggregates. Appl. Sci. 2019, 9, 1447. [Google Scholar] [CrossRef]
- He, J.; Gao, Q.; Song, X.; Bu, X.; He, J. Effect of foaming agent on physical and mechanical properties of alkali-activated slag foamed concrete. Constr. Build. Mater. 2019, 226, 280–287. [Google Scholar] [CrossRef]
- Bensaber, A.; Boudaoud, Z.; Seghir, N.T.; Czarnecki, S.; Sadowski, Ł. The assessment of concrete subjected to compressive and flexural preloading using nondestructive testing methods, correlation between concrete strength and combined method (SonReb). Measurement 2023, 222, 113659. [Google Scholar] [CrossRef]
- Hao, Y.; Yang, G.; Liang, K. Development of fly ash and slag based high-strength alkali-activated foam concrete. Cem. Concr. Compos. 2022, 128, 104447. [Google Scholar] [CrossRef]
- Oren, O.H.; Gholampour, A.; Gencel, O.; Ozbakkaloglu, T. Physical and mechanical properties of foam concretes containing granulated blast furnace slag as fine aggregate. Constr. Build. Mater. 2020, 238, 117774. [Google Scholar] [CrossRef]


| Device Name | Device Type | Manufacturer |
|---|---|---|
| Cement foaming machine | f-100 | Xingtai Liyu machinery factory |
| Microcomputer controlled electro-hydraulic servo pressure testing machine | HCT306A | Shenzhen Wan test equipment Co., Ltd. |
| Concrete rebound meter | HT-450A | Beijing Haichuang High-tech Technology Co., Ltd. |
| Concrete ultrasonic detector | HC-U91 | Beijing Haichuang High-tech Technology Co., Ltd. |
| Raw Material | Specifications |
|---|---|
| Cement | Ordinary Portland cement—P.O. 42.5; density, 3100 kg/m3 |
| Foaming agent | Plant protein foaming agent—20× dilution ratio; measured foam density, 35 kg/m3; 28× foaming ratio |
| Water | Tap water |
| CaO2 | SiO2 | Al2O3 | Fe2O3 | MgO | SO3 |
|---|---|---|---|---|---|
| 57.65 | 21.44 | 5.36 | 3.56 | 1.24 | 2.43 |
| Project Number | Density (kg/m3) | W/C Ratio | Cement (kg) | Water (kg) | Foam (kg) |
|---|---|---|---|---|---|
| FC0.4 | 800 | 0.4 | 556.48 | 222.59 | 20.93 |
| FC0.45 | 0.45 | 537.61 | 241.92 | 20.46 | |
| FC0.5 | 0.5 | 519.98 | 259.99 | 20.03 | |
| FC0.55 | 0.55 | 503.47 | 276.91 | 19.62 | |
| FC0.6 | 0.6 | 487.97 | 296.78 | 19.24 |
| Project Number | W/C Ratio | Density (kg/m3) | Cement (kg) | Water (kg) | Foam (kg) |
|---|---|---|---|---|---|
| FC600 | 0.5 | 600 | 384.04 | 192.02 | 23.94 |
| FC800 | 800 | 519.98 | 259.99 | 20.03 | |
| FC1000 | 1000 | 655.92 | 327.96 | 16.12 | |
| FC1200 | 1200 | 791.86 | 395.93 | 12.20 |
| Project number | FC600 | FC800 | FC1000 | FC1200 |
| W/C ratio | 0.5 | |||
| Fluidity (cm) | 24 | 21.8 | 22.7 | 20.6 |
| Rate of relative change (%) | −9.2 | 4.1 | −9.3 | |
| Project number | FC0.4 | FC0.45 | FC0.5 | FC0.55 | FC0.6 |
| Density (kg/m3) | 800 | ||||
| Fluidity (cm) | 18.0 | 19.3 | 21.6 | 22.0 | 24.0 |
| Rate of relative change (%) | 7.2 | 11.9 | 1.9 | 9.1 | |
| W/C Ratio | 0.4 | 0.45 | 0.5 | 0.55 | 0.6 |
| Cement (kg) | 556.48 | 537.61 | 519.98 | 503.47 | 487.97 |
| Relative rate of change | 0% | −3.40% | −6.60% | −9.50% | −12.30% |
| Uniaxial compressive strength (MPa) | 6.8 | 4.97 | 6.6 | 6.07 | 6.17 |
| Relative rate of change | 36.80% | 0% | 32.80% | 22.10% | 24.10% |
| UCS/C | 0.0122 | 0.0092 | 0.0127 | 0.0121 | 0.0126 |
| Time | Ultrasonic Pulse Velocity (UPV) (km/s) | Rebound Value | ||||||||
|---|---|---|---|---|---|---|---|---|---|---|
| FC0.4 | FC0.45 | FC0.5 | FC0.55 | FC0.6 | FC0.4 | FC0.45 | FC0.5 | FC0.55 | FC0.6 | |
| 7 d | 2.5 | 2.32 | 2.15 | 2.19 | 2.12 | 20.6 | 17.7 | 21.2 | 22.8 | 21.2 |
| 14 d | 2.54 | 2.35 | 2.25 | 2.25 | 2.25 | 21.2 | 18.7 | 23.9 | 22.8 | 25.8 |
| 28 d | 2.63 | 2.38 | 2.26 | 2.3 | 2.29 | 23.4 | 21.0 | 27.2 | 25.2 | 25.8 |
| Time | Ultrasonic Pulse Velocity (UPV) (km/s) | Rebound Value | ||||||
|---|---|---|---|---|---|---|---|---|
| FC600 | FC800 | FC1000 | FC1200 | FC600 | FC800 | FC1000 | FC1200 | |
| 7 d | 1.99 | 2.15 | 2.37 | 2.51 | 17 | 21 | 27.5 | 30.8 |
| 14 d | 2.10 | 2.25 | 2.51 | 2.7 | 16.5 | 23.9 | 28.8 | 32.7 |
| 28 d | 2.12 | 2.26 | 2.54 | 2.71 | 17.5 | 27.3 | 31 | 35.5 |
| Project Number | FC0.4 | FC0.45 | FC0.5 | FC0.55 | FC0.6 | FC600 | FC800 | FC1000 | FC1200 |
|---|---|---|---|---|---|---|---|---|---|
| Before water absorption, mean density (kg/m3) | 917 | 833 | 877 | 867 | 923 | 750 | 877 | 1087 | 1230 |
| After absorbing water, mean density (kg/m3) | 1029 | 917 | 940 | 953 | 991 | 850 | 940 | 1157 | 1293 |
| Water absorption | 12.2% | 10.1% | 7.2% | 9.9% | 7.4% | 13.3% | 7.2% | 6.4% | 5.1% |
Disclaimer/Publisher’s Note: The statements, opinions and data contained in all publications are solely those of the individual author(s) and contributor(s) and not of MDPI and/or the editor(s). MDPI and/or the editor(s) disclaim responsibility for any injury to people or property resulting from any ideas, methods, instructions or products referred to in the content. |
© 2024 by the authors. Licensee MDPI, Basel, Switzerland. This article is an open access article distributed under the terms and conditions of the Creative Commons Attribution (CC BY) license (https://creativecommons.org/licenses/by/4.0/).
Share and Cite
Jierula, A.; Li, H.; Chen, Y.; Wu, C.; Wu, X.; Yin, H. Study on the Influence of Density and Water–Cement Ratio on the Cement Utilization, Fluidity, Mechanical Properties, and Water Absorption of Foam Concrete. Buildings 2024, 14, 3550. https://doi.org/10.3390/buildings14113550
Jierula A, Li H, Chen Y, Wu C, Wu X, Yin H. Study on the Influence of Density and Water–Cement Ratio on the Cement Utilization, Fluidity, Mechanical Properties, and Water Absorption of Foam Concrete. Buildings. 2024; 14(11):3550. https://doi.org/10.3390/buildings14113550
Chicago/Turabian StyleJierula, Alipujiang, Haodong Li, Yang Chen, Cong Wu, Xiao Wu, and Hanlin Yin. 2024. "Study on the Influence of Density and Water–Cement Ratio on the Cement Utilization, Fluidity, Mechanical Properties, and Water Absorption of Foam Concrete" Buildings 14, no. 11: 3550. https://doi.org/10.3390/buildings14113550
APA StyleJierula, A., Li, H., Chen, Y., Wu, C., Wu, X., & Yin, H. (2024). Study on the Influence of Density and Water–Cement Ratio on the Cement Utilization, Fluidity, Mechanical Properties, and Water Absorption of Foam Concrete. Buildings, 14(11), 3550. https://doi.org/10.3390/buildings14113550