Article

Horizontal Deformation Control Strategy and Implementation Method of Eccentric Core Tube Structure Based on Construction Error Uncertainty

1
School of Civil and Environmental Engineering, Harbin Institute of Technology (Shenzhen), Shenzhen 518055, China
2
China Construction Eighth Engineering Division Co., Ltd., Shanghai 200112, China
*
Author to whom correspondence should be addressed.
Buildings 2024, 14(11), 3384; https://doi.org/10.3390/buildings14113384
Submission received: 19 September 2024 / Revised: 20 October 2024 / Accepted: 22 October 2024 / Published: 25 October 2024
(This article belongs to the Section Building Structures)

Abstract

Estimating and controlling the horizontal deformation of eccentric core-tube structure is challenging due to the time-varying characteristics of concrete materials and structural construction. In order to solve the construction uncertainty, an analysis method of horizontal deformation control theory based on construction error uncertainty is proposed in this paper, which is used to predict the overall deflection in the project design stage. At the same time, considering the construction complexity, the relationship between deviation correction value, structural initial deformation, structural positional posture, and deformation increment data is established. And the “prediction-measurement-construction-adjustment” stage transformation control method is established, which is used to check and adjust the predicted pre-arch target curve in the construction period. The engineering implementation method of the deviation correction scheme of wall line control is put forward based on the construction stringing habit. The proposed method was evaluated on a 390-m high-rise building with numerical simulation and measure verifications. The results show that when the control method is adopted, the top displacement of the structure is only 8 mm, which is much smaller than 75 mm without considering the horizontal deformation control strategy. The proposed control method can effectively control the horizontal deflection of the structure under construction, and the predicted value is in good agreement with the measured value during the observation period.

1. Introduction

With the gradual improvement of building function, space utilization and landscape effect, a variety of small eccentricity and even large eccentricity structural forms are increasing [1,2]. As the core eccentricity leads to the deviation of the gravity center and rigidity center of the structure, the horizontal deformation in the direction of the core eccentricity caused by structural asymmetry even affects the acceptance and safety of the high-rise structure. In the conventional construction method, the structural deformation is significantly affected by uncertain factors such as actual construction progress [3,4,5] and shrinkage creep [6,7,8,9,10,11], which may not meet the vertical deviation requirements of GB50204-2015 [12] (the minimum value between 1/10,000 H and 80 mm). Wu et al. [13] established an ETABS calculation model for the 250 m highly eccentric core tube structure under multiple working conditions. The results indicate that the displacement angle of the top of the eccentric core tube structure will increase with the degree of eccentricity, and under vertical load, the horizontal displacement of the highly eccentric core tube structure has even reached 70% in multiple seismic conditions. Lu et al. [14] studied the horizontal deformation process of a 279 m highly eccentric core tube super high-rise structure during construction, pointing out that significant horizontal deformation occurs in highly eccentric core tube structures during construction. Wang et al. [15] suggested that the horizontal deformation of the frame–eccentrical core tube structure needs to be controlled, but no effective control method has been proposed. For highly eccentric core tube structures, it is worth studying how to effectively control horizontal deformation during construction.
Currently, axial deformation prediction and control methods in high-rise buildings have been extensively studied. The deformation of the component is approximately simulated by a numerical simulation method in accordance with the overall stress characteristics of the structure. This is then reversely applied to the initial length of the component, ensuring that the structure is exactly consistent with the planned size or design elevation. This approach allows for the control of construction error. The current research on structural deformation control during construction is primarily focused on the calculation and analysis of deformation discrepancies during the construction phase [16,17]. However, there is a paucity of studies that undertake a comprehensive analysis and discussion of compensatory control measures. Li et al. [18] proposed that the method of adjusting the length of steel columns could be used to compensate for the vertical difference in shortening. In a construction simulation analysis of ultra-high-rise steel structures, Yan et al. [19] proposed a methodology for determining the pre-adjustment value of steel processing through the estimation of vertical floor deformation. Yun et al. [20] put forth a novel approach that employs Bayesian theory to enhance the prediction outcomes of axial deformations of concrete vertical members. This approach integrates the measured strains of the vertical members with the equation representing the time-varying characteristics of concrete. Yun et al. [21] proposed a prediction method for the axial deformation of vertical members in super high-rise structures based on an adaptive unscented Kalman filter. Whether the vertical deformation control method of pre-arch can be transplanted to the horizontal deformation control and how to achieve it in engineering is a focus of this research.
It is evident that the construction process of super high-rise buildings is not without its share of challenges. A multitude of factors, both human and technical in nature, can contribute to the occurrence of errors during this complex undertaking [22,23,24]. It is worth noting that when the overall height of the structure is high, the actual deviation correction value generated by averaging the maximum deviation of the whole structure to each layer is small, and there is a risk of construction error less than the actual verticality of each layer of the wall. Therefore, the effect of actual construction error must be considered in the calculation of simulation results.
The purpose of this research is to solve the problem that the large eccentric core tube structure will tilt towards the eccentric side under the action of dead load due to the non-coincidence of center of gravity and rigid center. In order to solve these problems, a methodology for horizontal deformation control theory was proposed based on the construction errors uncertainty in Section 2. The pre-arch target curve of the structure was obtained based on the simulation analysis of random error, and the final deformation of the structure was judged by the probability density curve of horizontal deformation. In Section 3, the concepts and calculation methods for each measurement data related to the structural shape and position were clarified, and the method of solving the deviation correction value of each level by the pre-arch target curve was established. Meanwhile, based on the actual measurement habit, the construction measurement and stringing method that are compatible with the deviation correction value were also proposed. Finally, a 390-m-high large eccentric core-tube structure was used as an engineering case study to compare the structural deformation difference before and after the implementation of the horizontal displacement control theory in Section 4, and the prediction results were also validated in Section 5. The correction method proposed in this research solves the difficult problem of controlling the horizontal deformation of super high-rise eccentric cylinder structure according to the way of controlling the configuration of the construction process.

2. Construction Error Intervention Strategy and Construction Stringing Method

The construction error intervention strategy based on probabilistic theory and modified construction stringing method are proposed in this section, which solves the problem that the actual construction error is much larger than the demand of story deflection correction and realizes the application on the engineering.

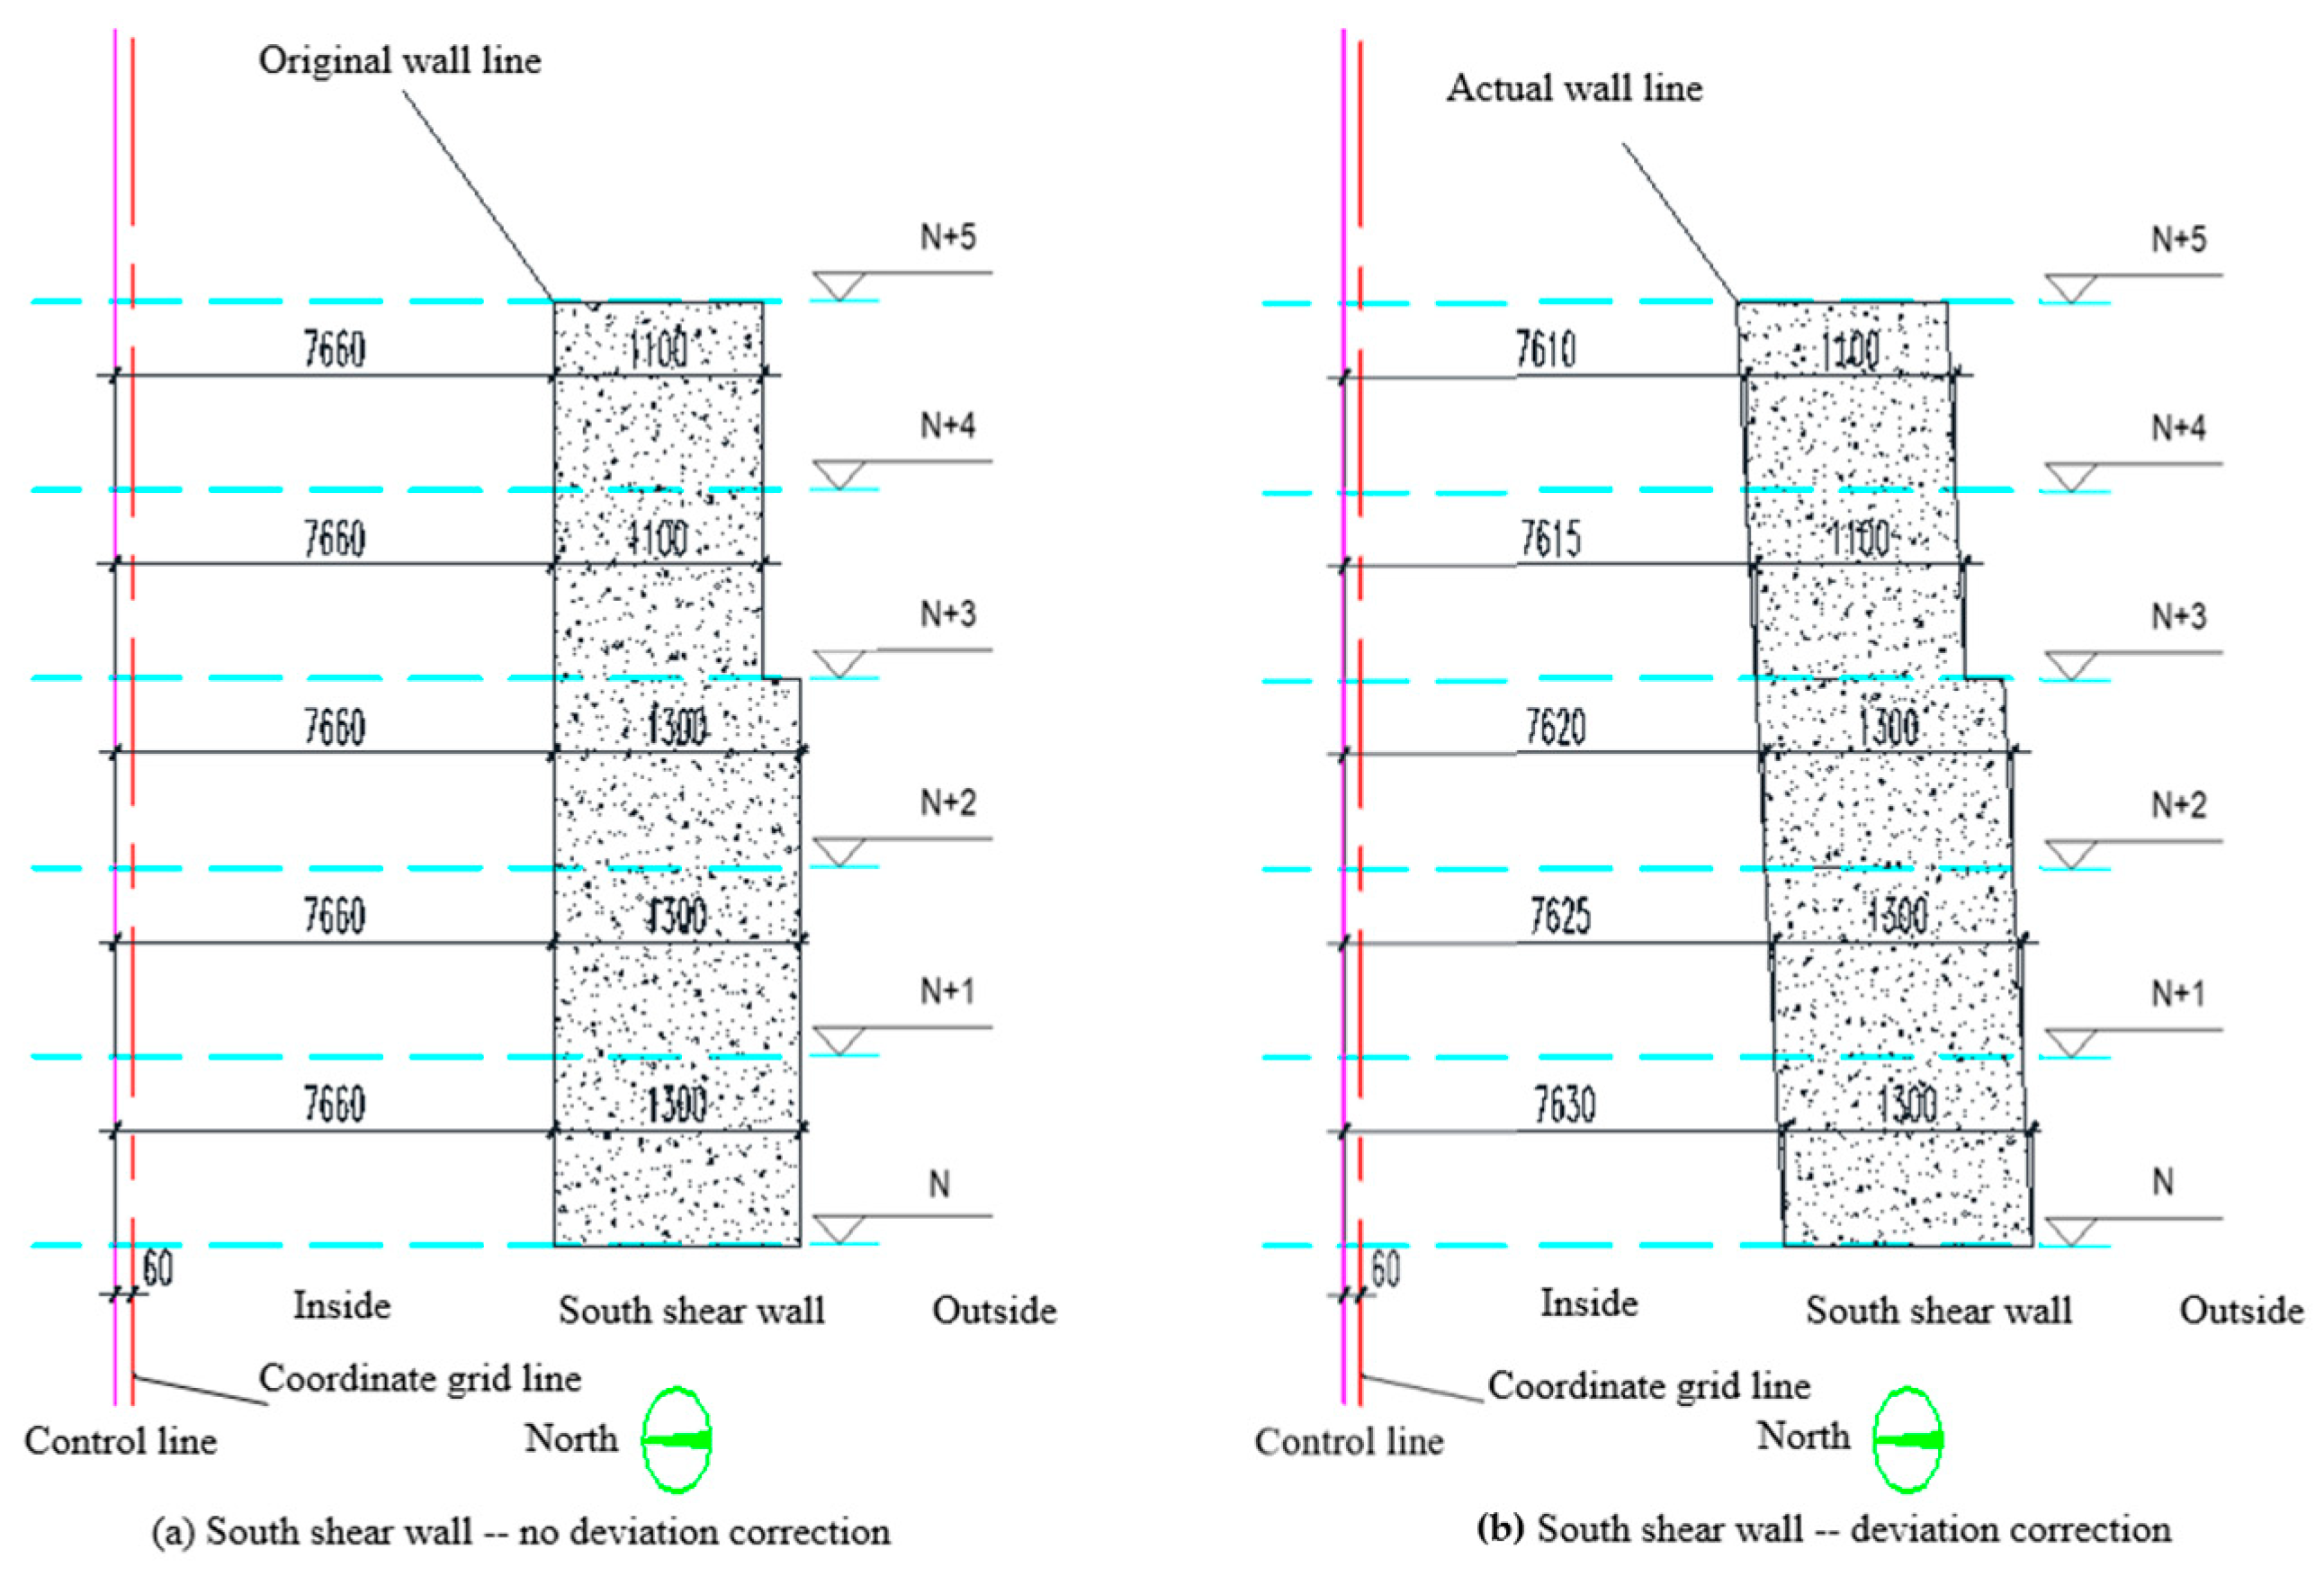
2.1. Construction Error Intervention Strategy

The equation for calculating the probability density of the normal distribution is as follows:
φ x = 1 σ 2 π e ( x μ ) 2 2 σ 2
where, σ represents the population standard deviation, which means the distance from one of the inflection points on either side of the curve to the curve: x = μ.
Interval probability of random error is as follow:
P = φ x d x = 1 σ 2 π e ( x μ ) 2 2 σ 2 d x
where, ∆ represents the interval in which random errors occur. which means the construction deviation of displacement.
According to the requirements of code for quality acceptance of concrete structure construction (GB50204-2015) [12], the vertical deviation of cast-in-place concrete shear wall should not be greater than 10 mm when the height is less than 6 m. Assuming that each construction error follows the standard normal distribution (μ = 0, σ = 10), the probability density distribution of wall verticality deviation deformation of each layer is calculated by Equation (1) φ x = 1 10 × 2 π e x 2 200 . The probability density distribution of wall verticality deviation deformation of each layer is shown in the Figure 1.
Consider an extreme case: Assuming a symmetrical structure, if the wall perpendicularity of each layer of wall construction is randomly developed, without timely human intervention to adjust the horizontal deviation. Through 1000 times of simulation analysis based on random error (μ = 0, σ = 10, P = 95%), the 1 10 × 2 π e x 2 200 d x = 0.95 can be obtained from Equation (2). Figure 2 shows the construction error deviation based on 1000 random error analyses with completely random condition. The construction error deviation 1 = ±150 mm of the final structure can be solved.
Actually, during the construction period of the core-tube, the construction deviation will be timely corrected by surveying and setting out. For example, if the wall of the N layer is 10 mm to the north, the wall of the N + 1 layer will be offset to the south during the construction according to the measurement results. Therefore, the deviation of the actual construction error is interfered by some people. On the premise of ensuring that the vertical deviation of the wall meets the requirements of the specification, each construction error follows a normal distribution of 0~+10 mm with a 95% guarantee rate (μ = 5, σ = 5). By Equation (1) to calculate the probability density distribution φ x = 1 10 × 2 π e ( x 5 ) 2 200 , as shown in the Figure 3.
Consider a common case: Assuming a symmetrical structure, the vertical deviation direction of each wall during construction will be shifted in a single direction according to the construction situation of the previous layer. Through 1000 times of simulation analysis based on random error (μ = 5, σ = 10, P = 95%), it can be obtained from Equation (2). The 1 10 × 2 π e ( x 5 ) 2 200 d x = 0.95 can be obtained from Equation (2). Figure 4 shows the construction error deviation based on 1000 random error analyses with the human intervention condition. The construction error deviation 2 = ±12 mm of the final structure can be solved.
The above analysis results show that the construction accuracy of the wall can be greatly improved by adopting the correct single-direction verticality deviation requirement according to the measurement results. It can be seen that construction technology and measurement method have great influence on structural deformation.

2.2. Implementation Effect Criterion

Based on the construction error uncertainty, the Equation (3) is used as the criterion to judge whether the construction error intervention strategy meets the structural deformation requirements.
P ( < [ ] ) 95 %
For specific projects, statistical analysis is carried out on the data and the probability density curve of horizontal deformation of each floor is drawn. And further judge whether the guarantee rate of structural deformation meets the above requirement, and further deduce the final deformation control situation of the structure.

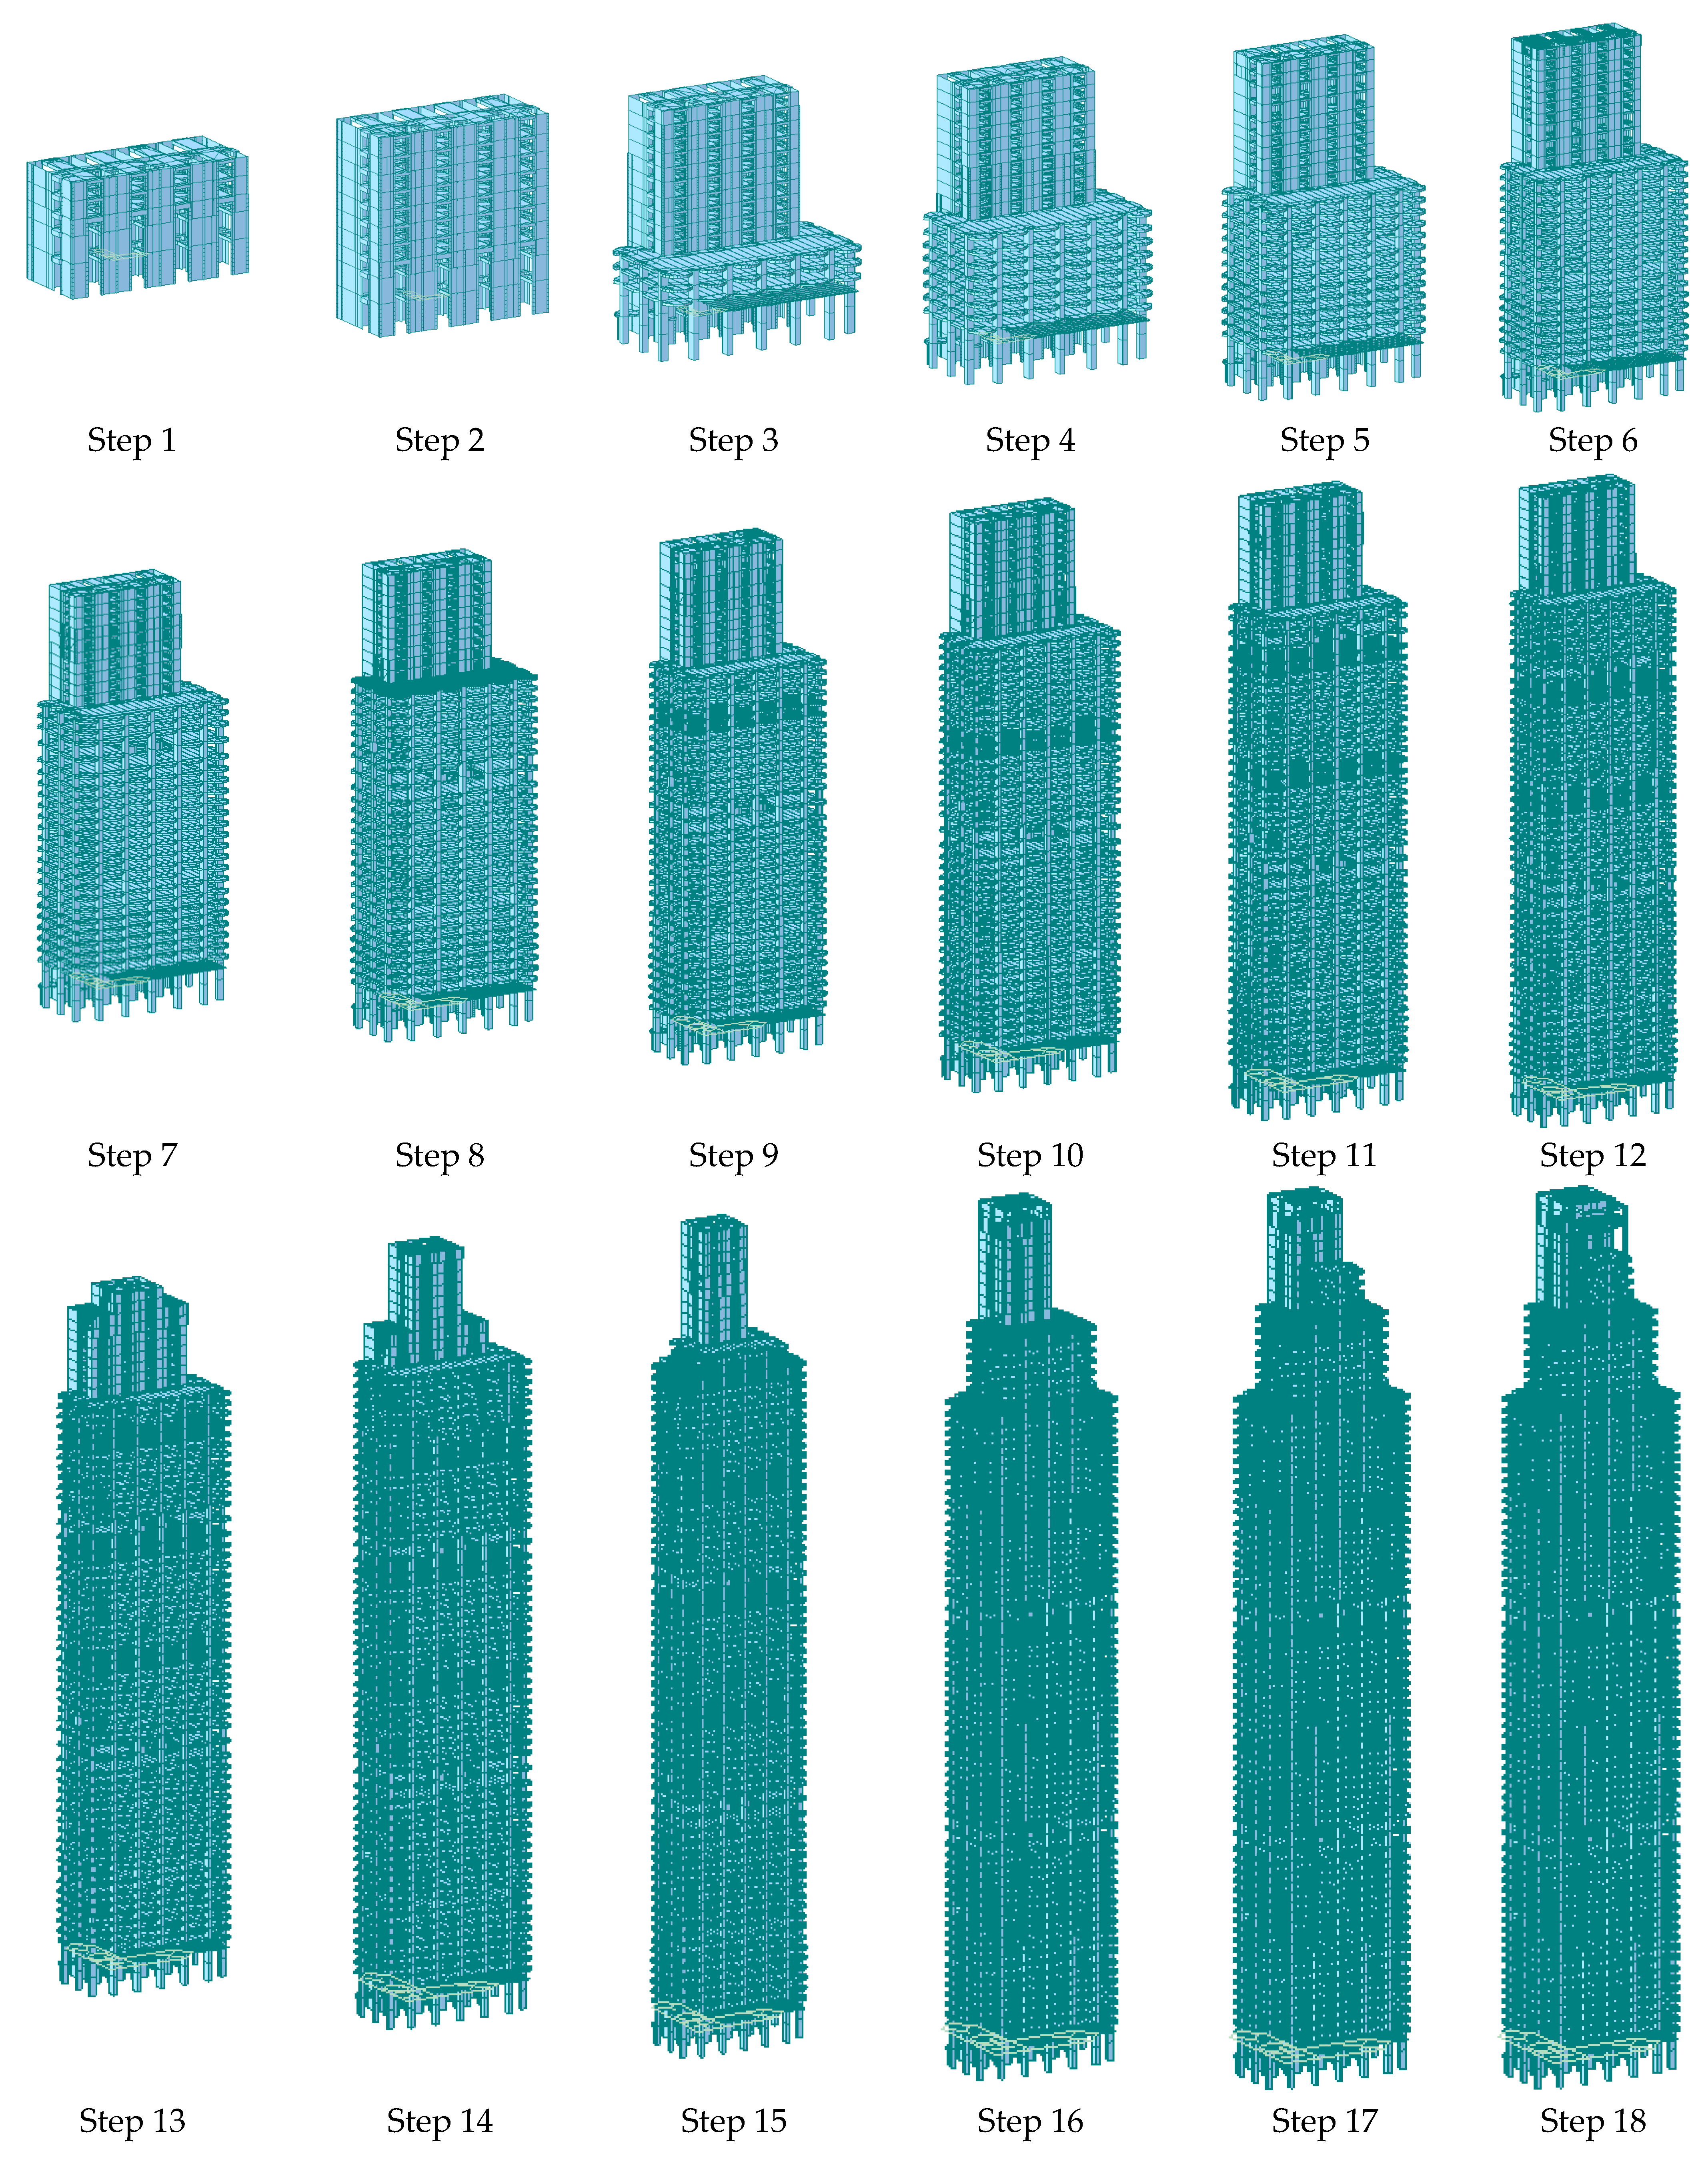
2.3. Construction Stringing Method Based on Construction Error Intervention Strategy

Before the concrete is poured, the axis remains unchanged, and the wall formwork perpendicular to the north-south direction is ensured to be biased in the direction of the pre-arch target curve by adjusting the positioning line of the core wall, as shown in Figure 5. In order to facilitate the construction and measuring and placing, the edge line position of the wall is offset every several layers, and the offset is taken as 5 mm each time, and the offset wall edge line can provide the position reference for the formwork installation.
At the beginning, the deviation of wall perpendicularity is 0, and the position of three wall lines remains unchanged. When each layer of pre-offset is used, the bottom opening of the wall of each layer is pre-offset by 5 mm according to the original position of the wall, and the verticality of the formwork is adjusted correspondingly, and the wall triple-zero control line position varies according to the offset amount, as shown in the Figure 6.
Take a construction section as an example. Assuming that N − 5 to N has deviated by 30 mm totally, and now N to N + 5 layers need to be pre-arched 5 mm to the north side each layer, the correction process is as follows: N layer wall positioning is pre-arched 0 mm (+30 mm) according to the original wall position in drawing; N + 1 layer wall positioning is pre-arched 5 mm (+30 mm) according to the original wall position in drawing; N + 2 layer wall positioning is pre-arched 10 mm (+30 mm) according to the original wall position in drawing; N + 3 layer wall positioning is pre-arched 15 mm (+30 mm) according to the original wall position in drawing; N + 4 layer wall positioning is pre-arched 20 mm (+30 mm) according to the original wall position in drawing; N + 5 layer wall positioning is pre-arched 35 mm (+30 mm) according to the original wall position in drawing.
According to the above construction stringing control method, the control will be continued according to the actual measurement results during the later construction, and the target-position will be adjusted in time, so as to control the horizontal deformation of the structure through the iterative method of prediction-feedback-prediction-feedback again.

3. Prediction-Construction-Measurement Integration Analysis Theory and Adjusting Process of Pre-Arch Correction Method

Based on the construction deformation prediction data, construction stringing data, and the instrument measurement data, the deformation checking and control theory during the prediction-construction-measurement stage is proposed, which is used to check the correction deformation. In addition, the adjusting process was also given to adjust the pre-arch correction scheme if necessary.

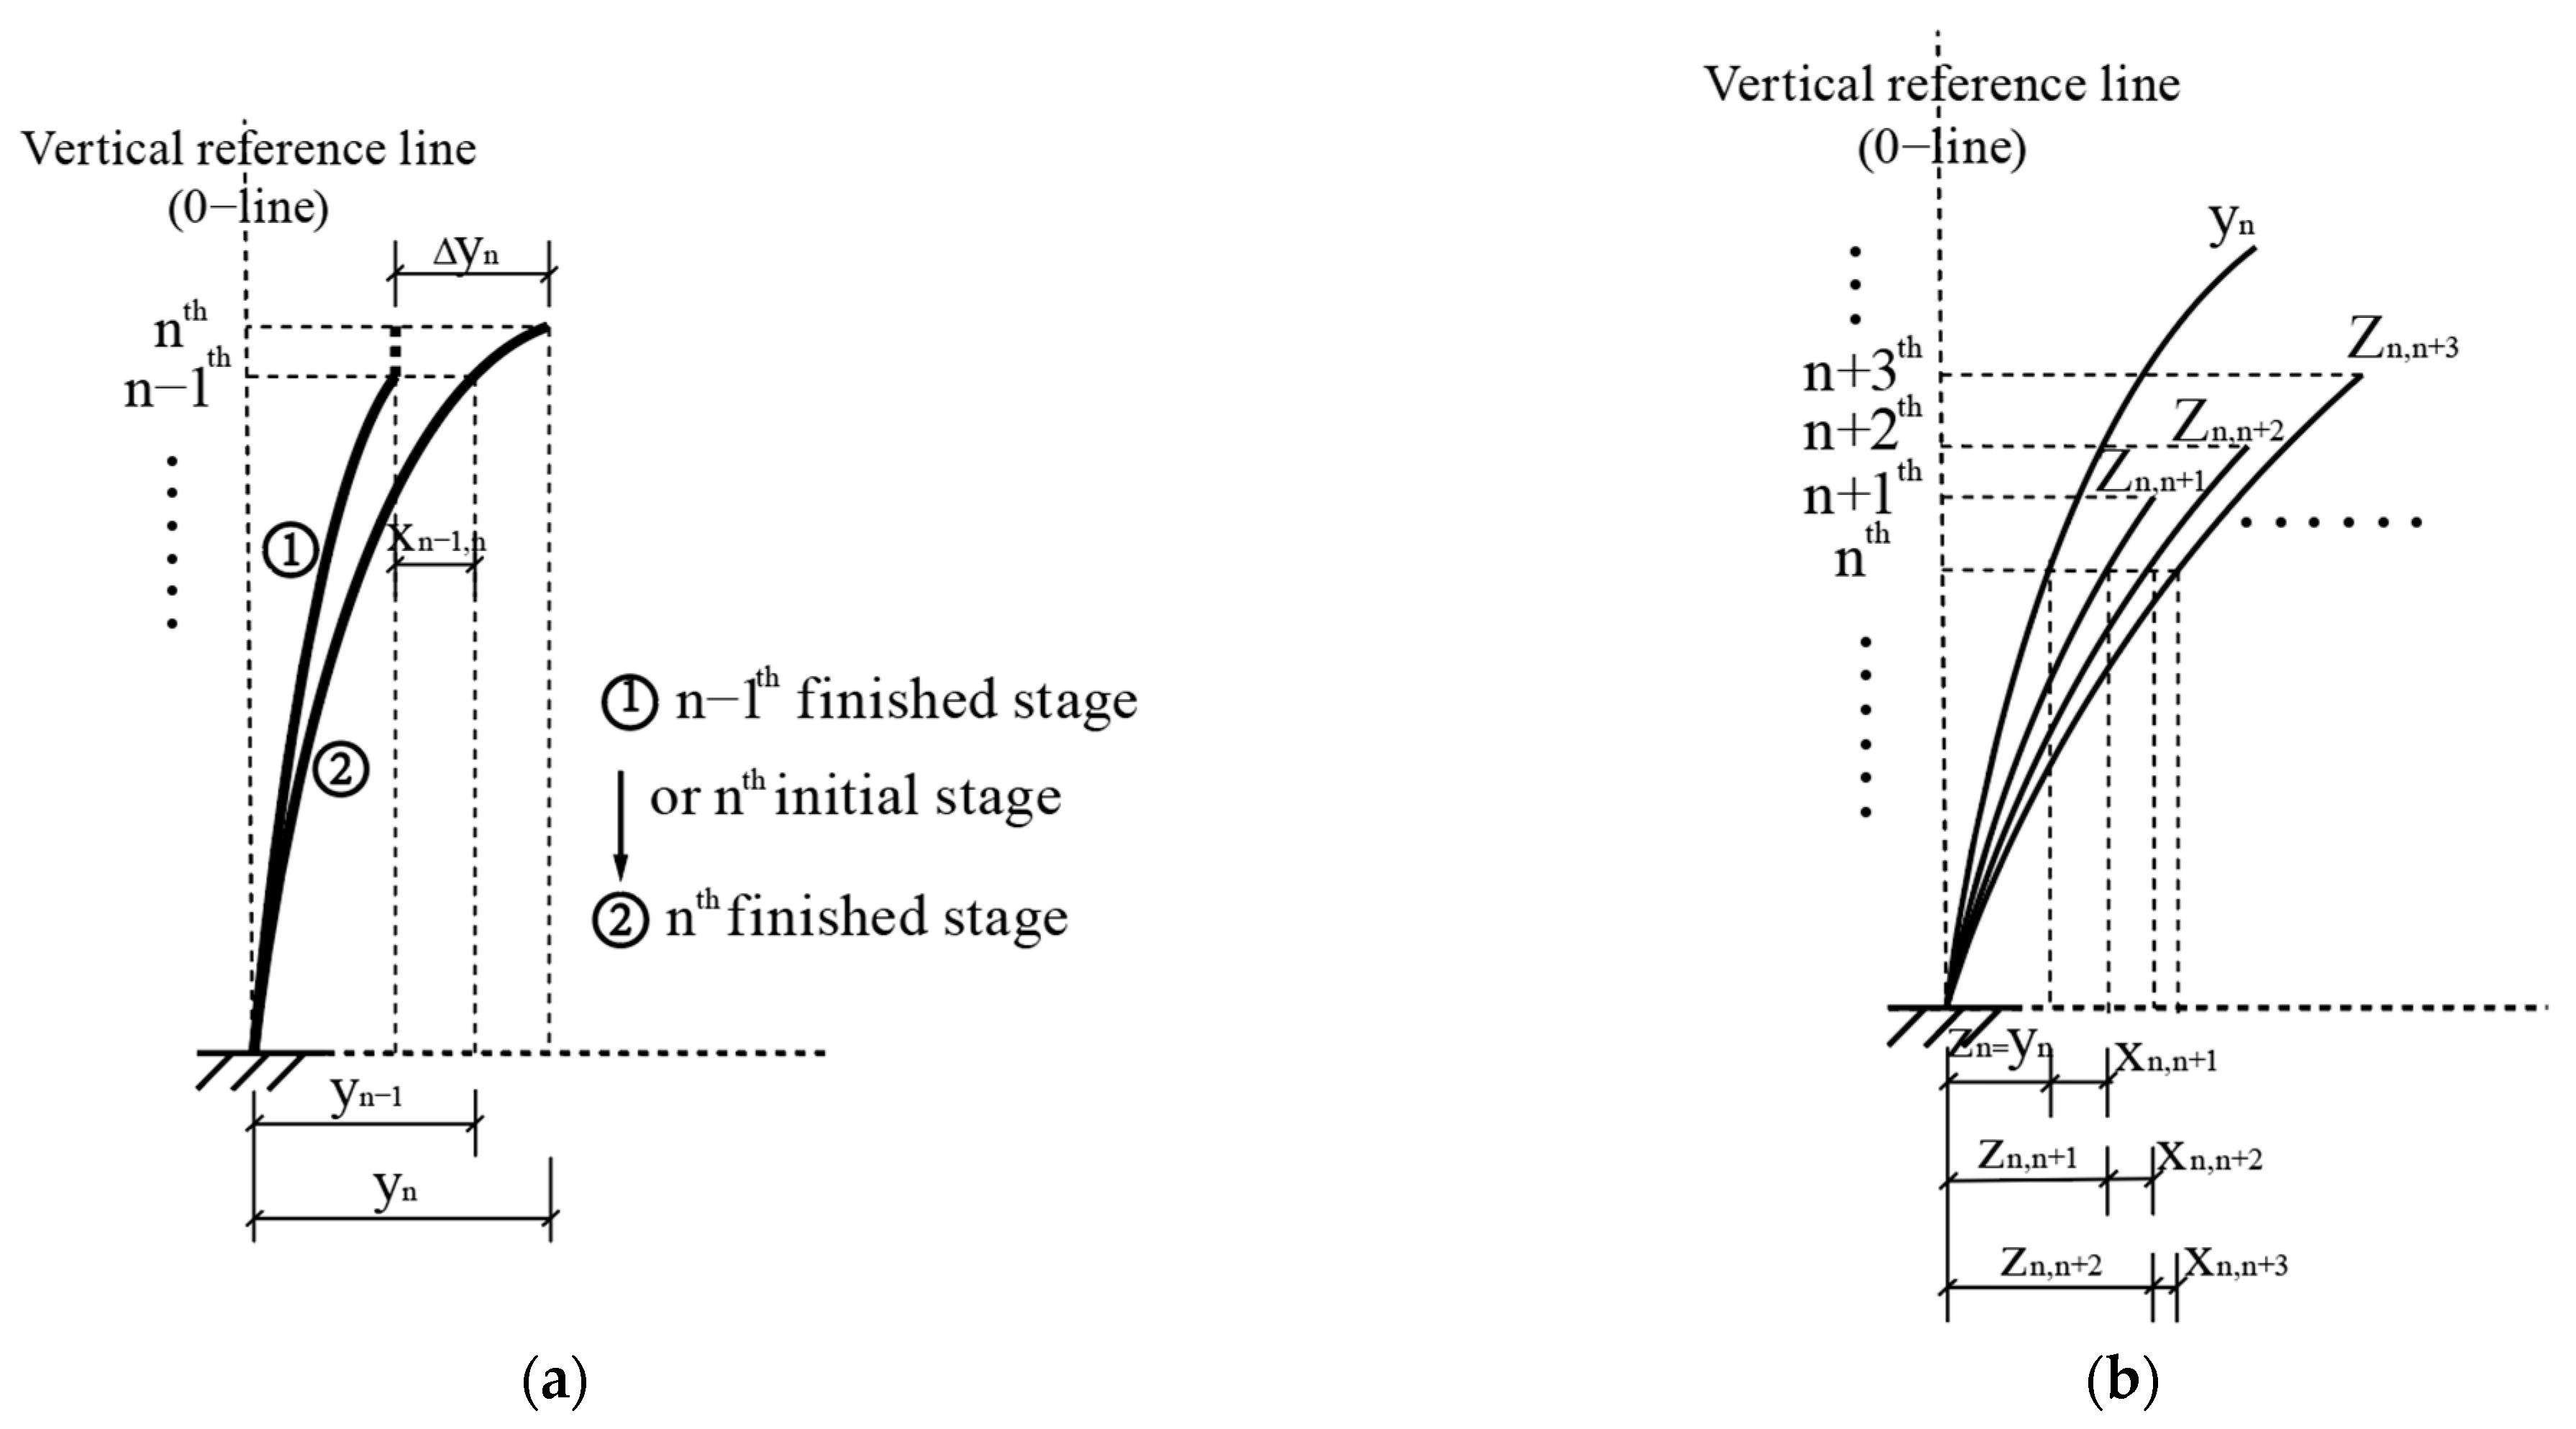
3.1. Prediction-Construction-Measurement Integration Analysis Theory

3.1.1. Initial Deformation yn

After the construction of the n-layer is completed, the initial horizontal deformation between the n-layer and the vertical reference line (0-line) can be written in the form of yn, representing the initial deflection when the construction reaches the n-layer.
The yn is also the characteristic value of pre-arch target curve, and the overall control target of the deviation correction construction. The pre-arch target curve can be used as the initial deformation value of the subsequent construction simulation of the unfinished structure. If the final simulated structural configuration does not meet the deformation requirements, the pre-arch target curve needs to be further iteratively adjusted.
The boundary line of the wall can be determined by measuring the ground lead by internal control method, or also can be obtained by finite element calculation. The measured results of internal control method and the results of finite element calculation can verify the accuracy of each other.
(1) Measured by internal control method
Taking the first floor as the base floor, the plumb meter is set up on the internal control point, and the laser receiving target (L-type Leica 90° Right Angle prism, Figure 7) is placed on the measured floor. The laser plumb is turned on and the laser spot is projected onto the fixed laser receiving target. By measuring the current position of the light spot on the laser receiving target and the internal control point, the initial deformation yn of the measured floor (n-layer) is obtained.
Due to the vibration and external environmental influence of the structure in the measurement process of the lead hammer instrument, there is a certain degree of public errors in the working base point of the measurement to the reference layer. In order to eliminate the error, the working base point is measured on the reference layer by the rear intersection measurement method that comes with the instrument in order to eliminate the common error.
(2) Calculation by finite element method (FE method)
Element displacement mode in FE model is:
f = N δ e
N = I N 1 , I N 2 , I N 8
δ e = u i , v i , w i , T
where, [N] is the displacement function, representing the distribution pattern of field variables within the unit; I is the identity matrix; {δ}e represents several node displacements of the unit.
ε x x = u x ε y y = v y γ x y = u y + v x
According to the geometric Equation (6), the strain matrix {ε} in the element can be obtained as follows:
ε = ε x , ε y , ε z , γ x y , γ y z , γ z x = B δ e
B = B 1 , B 2 , B 8
B i = N i 0 0 0 N i y 0 0 0 N i z N i y N i x 0 0 N i z N i y N i z 0 N i x
According to the physical Equation (11), the stress matrix {σ} in the element can be obtained as Equation (12):
ε x x = σ x x μ σ y y E ε y y = σ y y μ σ x x E γ x y = τ x y G
σ = D ε = D B δ e
where, [B] is the geometric matrix, [D] is the elastic matrix, and [S] = [D][B] is the stress matrix.
According to the principle of virtual work and the nodal force in a unit of F e = k δ e . Where [k] is the stiffness matrix of the element, k = B T D B d x d y d z .
For any point i on the structure, the equilibrium equation F i = R i is established, where R i is the external load on the i node. The finite element equilibrium equations [k]{δ} = {R} of the whole structure are formed by using the equilibrium equations of structural forces and boundary conditions. Where, [k] is the global stiffness matrix, K i j = k i j ; {R} is the node load matrix of the entire structure, is known; {δ} is the node displacement matrix of the entire structure.
By solving the matrix, the displacement matrix {δ} of each node of the structure can be obtained when the construction reaches the n-layer, and then the initial deformation yn of the structure can be obtained at this time.

3.1.2. Deformation Increment {xn,k}

The incremental horizontal deformation of each layer at each construction stage caused by the structure’s self-weight can be written as a matrix {xn,k}, representing the incremental horizontal deformation of n-layer caused by the construction of k-layer, and n ≤ k.
Based on the finite element simulation considering the construction process, the working conditions of the construction to n-layer and k-layer are simulated respectively, and the corresponding horizontal displacement xn,n and xn,k of the structure are extracted. Then the calculation equation of deformation during the construction stage from layer n- to k-layer is as:
x n , k = Σ x n , i i = n   t o   k x n , n , k n

3.1.3. Deviation Correction Value Δyn

In construction period, each layer wall is artificially corrected in a certain direction. According with the construction habits, the wall boundary line is artificially offset under the condition that the control line is basically not moving in the current construction stage. And the offset value in the current construction stage is the deviation correction value Δyn. When making construction disclosure, workers are concerned about the correction value Δyn, rather than the other parameters mentioned above. Therefore, it is necessary to conduct construction simulation according to the connection between the deviation correction quantity, the measurement and the finite element results, and give the correction quantity scheme of the subsequent construction that meets the requirements.
During construction process, each layer of wall is artificially corrected in a certain direction. Figure 8a represents the relationship between the deviation correction value Δyn and the pre-arch target curve yn before and after the construction process of the nth construction section. According to Figure 8a, the relationship shown in Equation (14) is established.
Yn = yn−1 + Δyn − |xn−1,n|
Where, yn or yn−1 represents the predicted deformation value of the pre-arch target curve at layer n or n − 1, respectively; |xn−1,n| represents the n − 1 layer deformation affected by n layer construction.
Further, the deviation correction value of each construction stage is added, which is the cumulative deviation correction value ΣΔyi (i = n to k), as shown in Equation (15).
ΣΔyi (i = n~k) = yk − yn−1 + Σxi−1,i (i = n~k)

3.1.4. Positional Posture zn,k

The structure is abstracted as a standing curve, and the curve state seen by observation at every moment is written as zn,k, indicating that the structural configuration of the n-layer during the construction of the k-layer. By observing Figure 8b, it can be found that zn,k are related to yn and cumulative deformation Σxn,i in the construction stage, which can be expressed as Equation (16).
zn,k = yn + = yn + Σxn,i (i = n to k) − xn,n (k ≥ n)

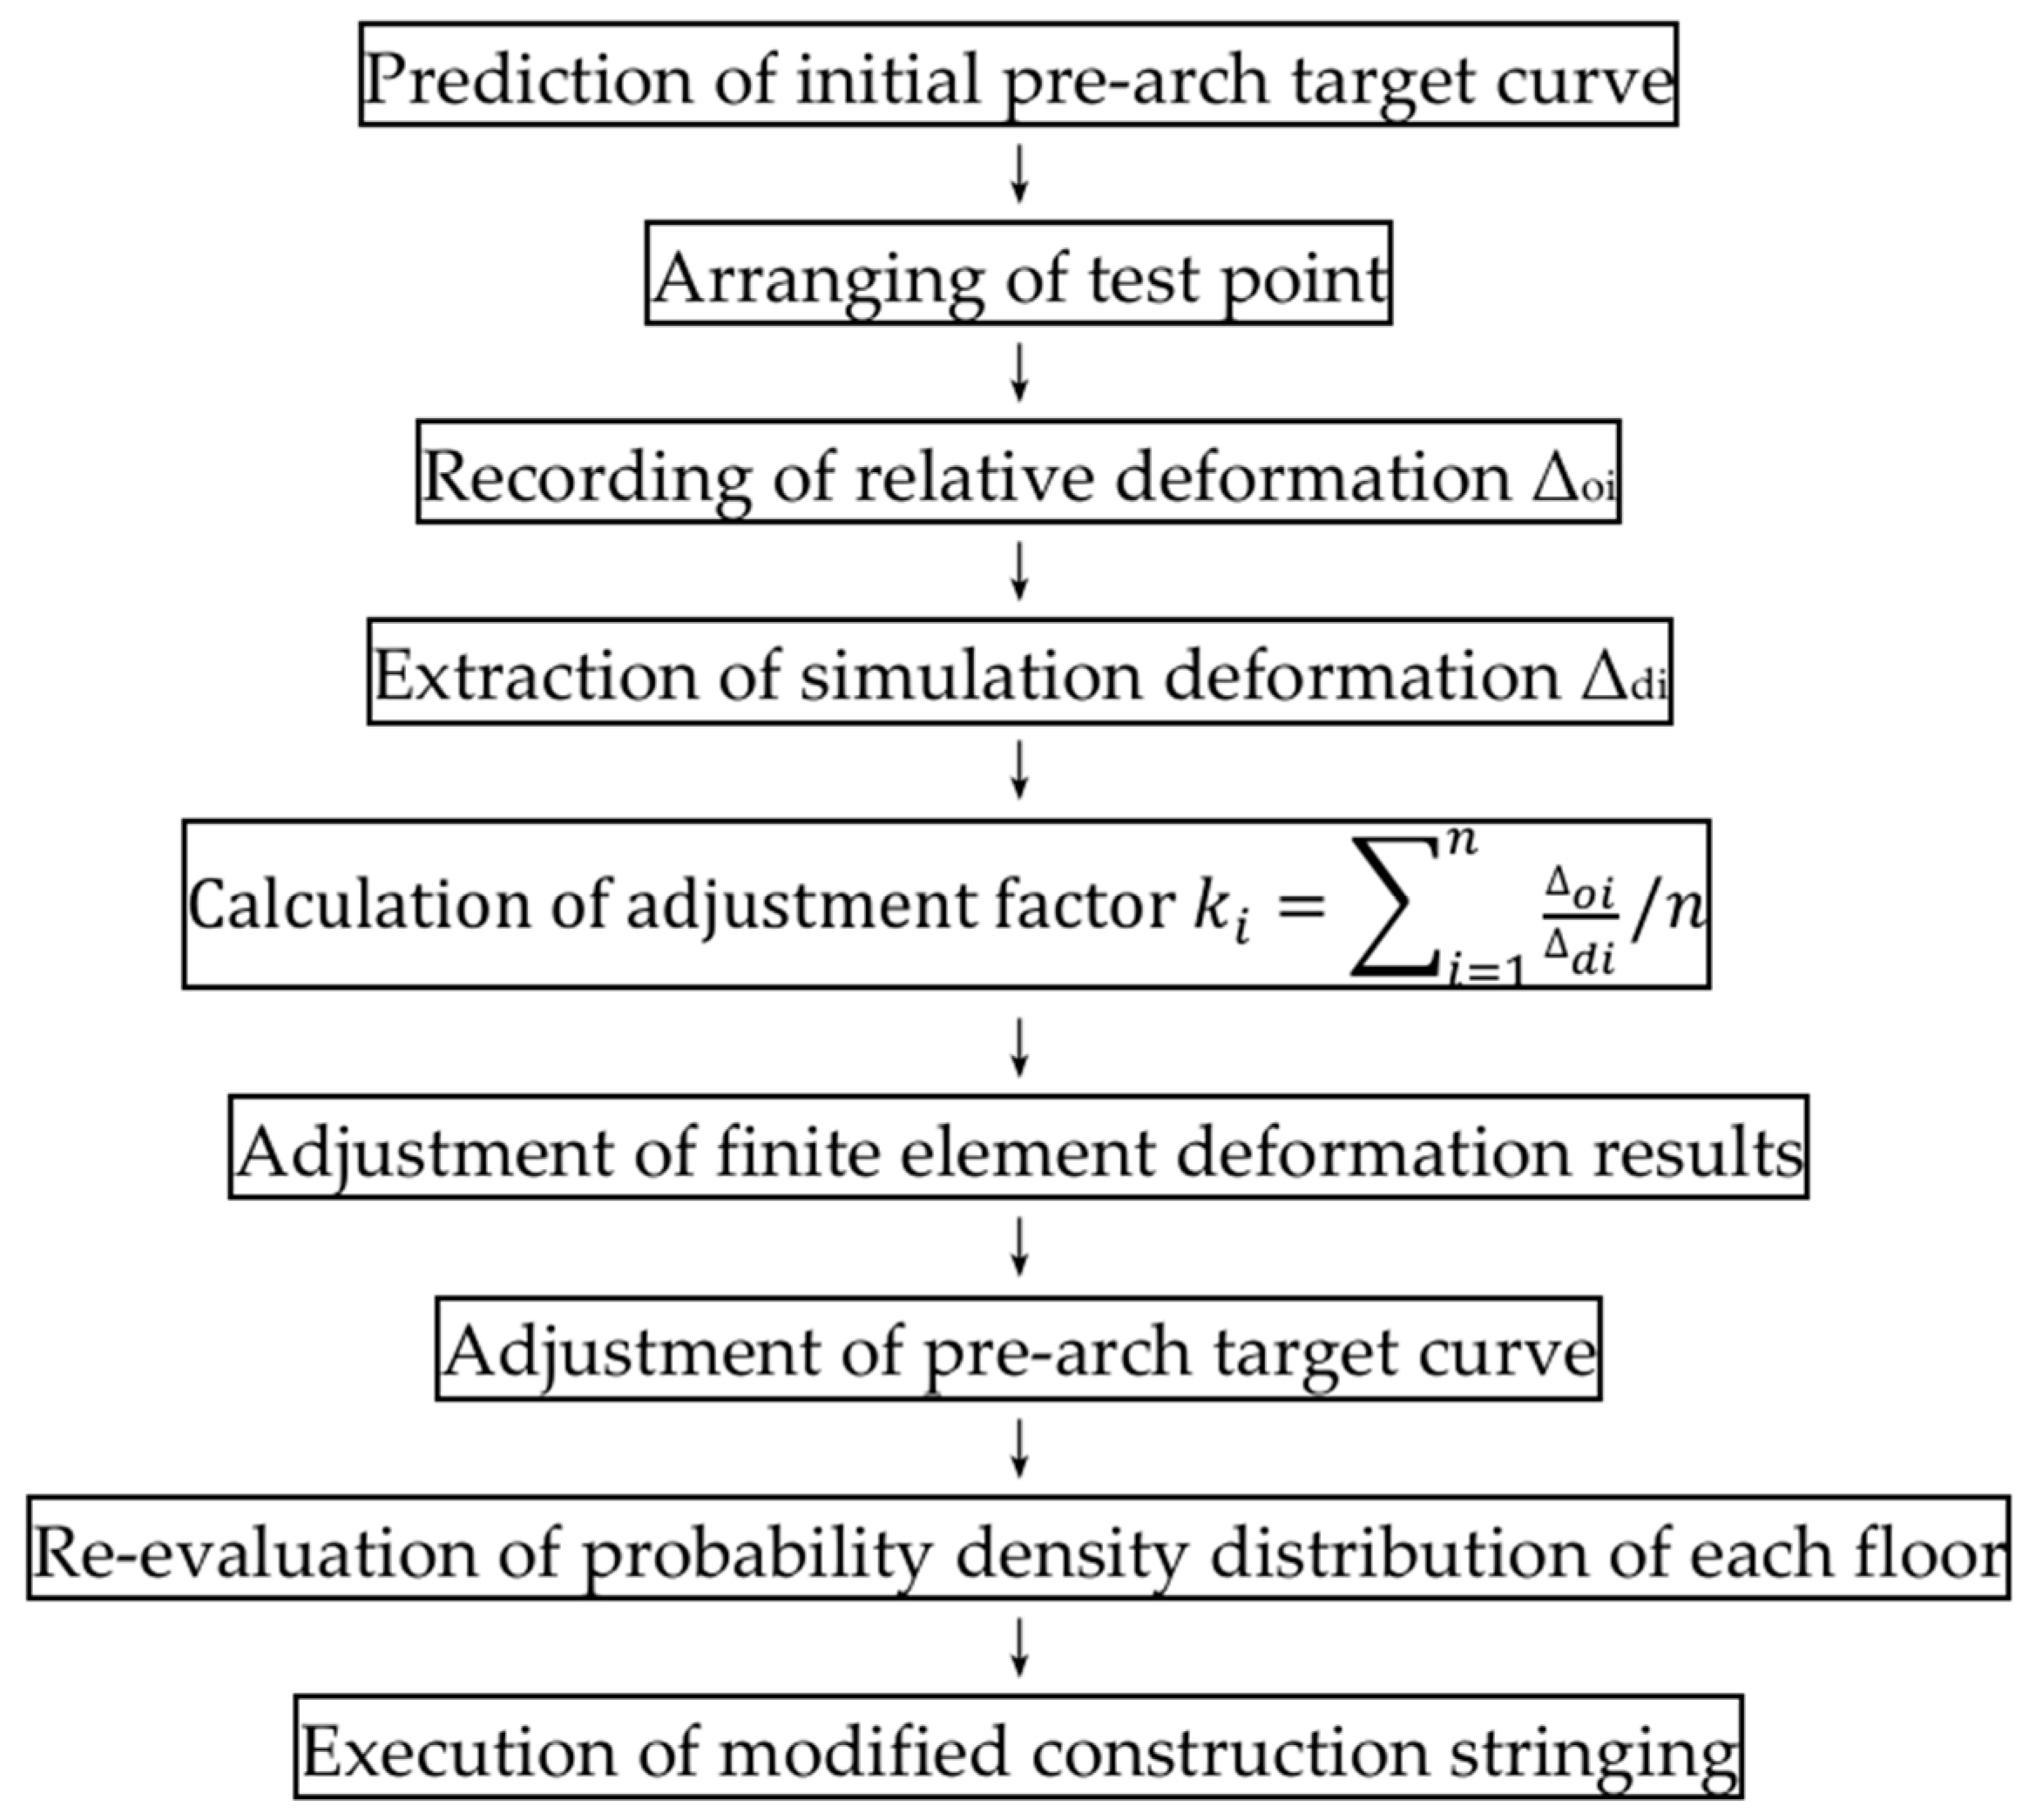
3.2. Adjusting Process of Pre-Arch Correction Method

In order to achieve horizontal displacement control, it is first necessary to develop a control curve (predicted pre-arch target curve). Predicted pre-arch target curve does not refer to the final shape curve of the structure after the pre-arch, but an imaginary shape curve. Its role is to guide the construction how to choose a single direction perpendicularity deviation. The final horizontal deformation of the structure is predicted by finite element construction simulation analysis, and the pre-arch target curve can be preliminarily determined according to the pre-arch idea, the value of which is consistently inversely equal to the predicted structural deformation at all heights.
In order to realize pre-arch deflection correction, a uniform error bias construction strategy is adopted for construction. In order to solve the problem that the finite element analysis results may have a large deviation from the actual measurement results, multiple displacement calibration points should be set up, and the relative deformation of the displacement calibration points under each construction stage should be obtained through high-precision measurement methods, and then the actual pre-arch target determination curve scheme adopted should be judged according to the measured results. The specific process is shown in the Figure 9. Where, the calculation of adjustment coefficient should be based on the ratio of actual measurement results and analysis results of different measurement points, and the average value should be taken after comprehensive comparison.
It should be noticed that when the overall height of the structure is high, the maximum pre-arch correction value of the overall structure averaged to each floor requires a smaller value of pre-arch deflection. And there is a risk of actual verticality construction error more than the correction value in each wall. For example, when the maximum correction value of the overall structure is 100 mm, the average to each layer is only about 1.5 mm. In contrast, the actual verticality construction error of each layer of the wall is 10 mm. Therefore, the calculation simulation results must take into account the effect of the actual construction error. The pre-arch target curve should be adjusted according to the actual measurement results in the later construction. And the horizontal deformation of the structure should be controlled by the iterative method of “prediction-feedback-prediction-feedback” again.

4. Case Study

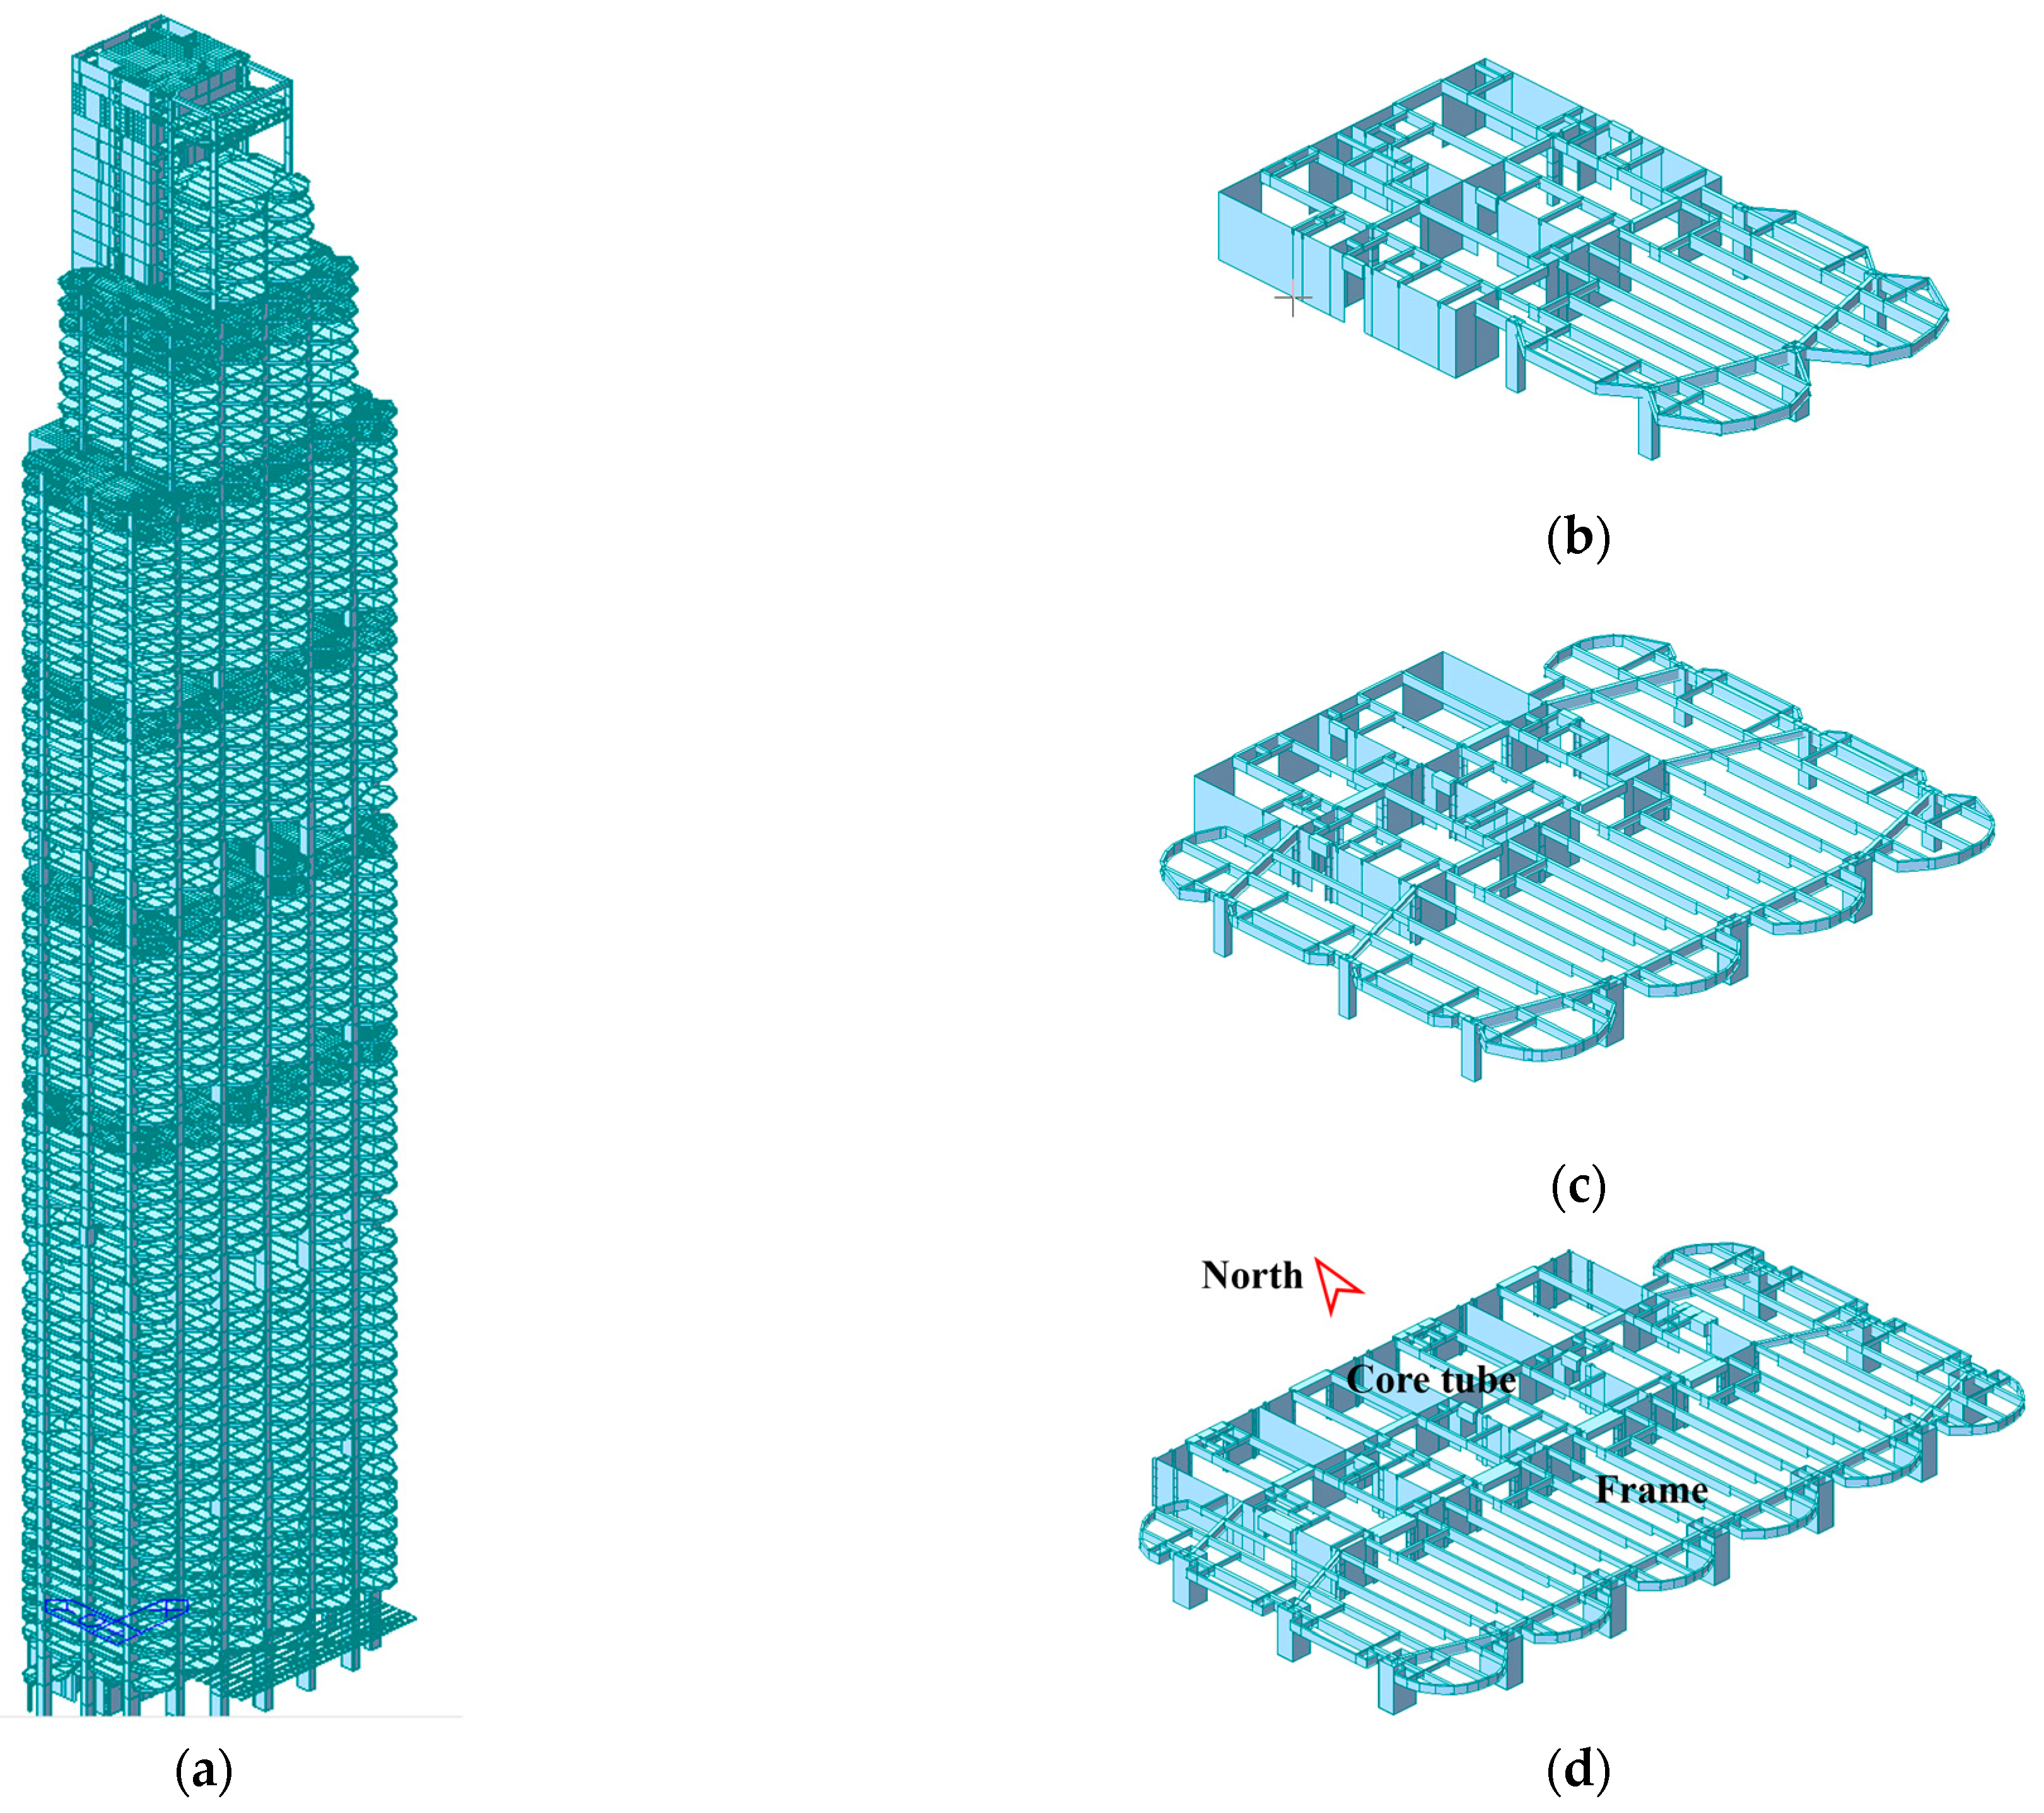
4.1. Project Overview

The project is based on a currently under-construction 390 m-high super high-rise commercial office building, which is a frame-core tube structure system with a large eccentric core tube offset, as shown in Figure 10. Where, the core tube is placed on the north side, and its shear wall is completely separated from the outer frame, only the southern side and some shear walls on the east and west sides are connected with the outer frame. The outer frame of the structure is composed of round steel tube concrete column and steel beam, and the core tube is composed of reinforced concrete shear wall.
MIDAS/Gen is used to establish the finite element model of the building and to conduct the nonlinear construction simulation. The structure model includes columns, beams, diagonal braces, belt trusses and floor slabs. Among them, the column, beam and belt truss are simulated by beam element, and the floor is simulated by plate element.
In terms of time-dependent material conditions, ACI-209 model was used to consider the time-varying characteristics of concrete materials, including the change of concrete strength with the development of age and the shrinkage and creep deformation of concrete during construction. Among them, the compressive strength factor a = 2.3 and b = 0.92; Humidity is 75%, and the curing method is moist cured; Shrinkage starts at 3 days; Air content is 6%; The fine aggregate, cement content and slump are obtained from the material property test results.
In terms of boundary conditions, the model is firmly connected to the ground as a whole, and the hinge joints between the internal bars are set to release at the beam end. In terms of load application conditions, the calculated load is G (self-weight), additional dead load, and self-weight of curtain wall. It should be noted that the effects of live loads, such as wind load, are not taken into account. This is because only dead loads cause permanent displacement effects on the structure as built.
According to the overall construction schedule and the main structure construction scheme, the whole construction process is divided into 18 steps to conduct construction simulation analysis. Each separate three-dimensional models contains 4 to 6 newly-established floors with a duration of 30 days, representing a discrete time during construction (Figure 11). The frame is 10F behind the core tube construction, the additional load due to self-weight and curtain wall are 30F behind the core tube construction, and the extended arm truss BRB is applied simultaneously in the last step. At each point in time, for each model, only the incremental loads occurring in that particular time step were applied. The structural responses occurring at each time step were stored and combined in a database to allow studying the time-dependent deformation response of the structure.

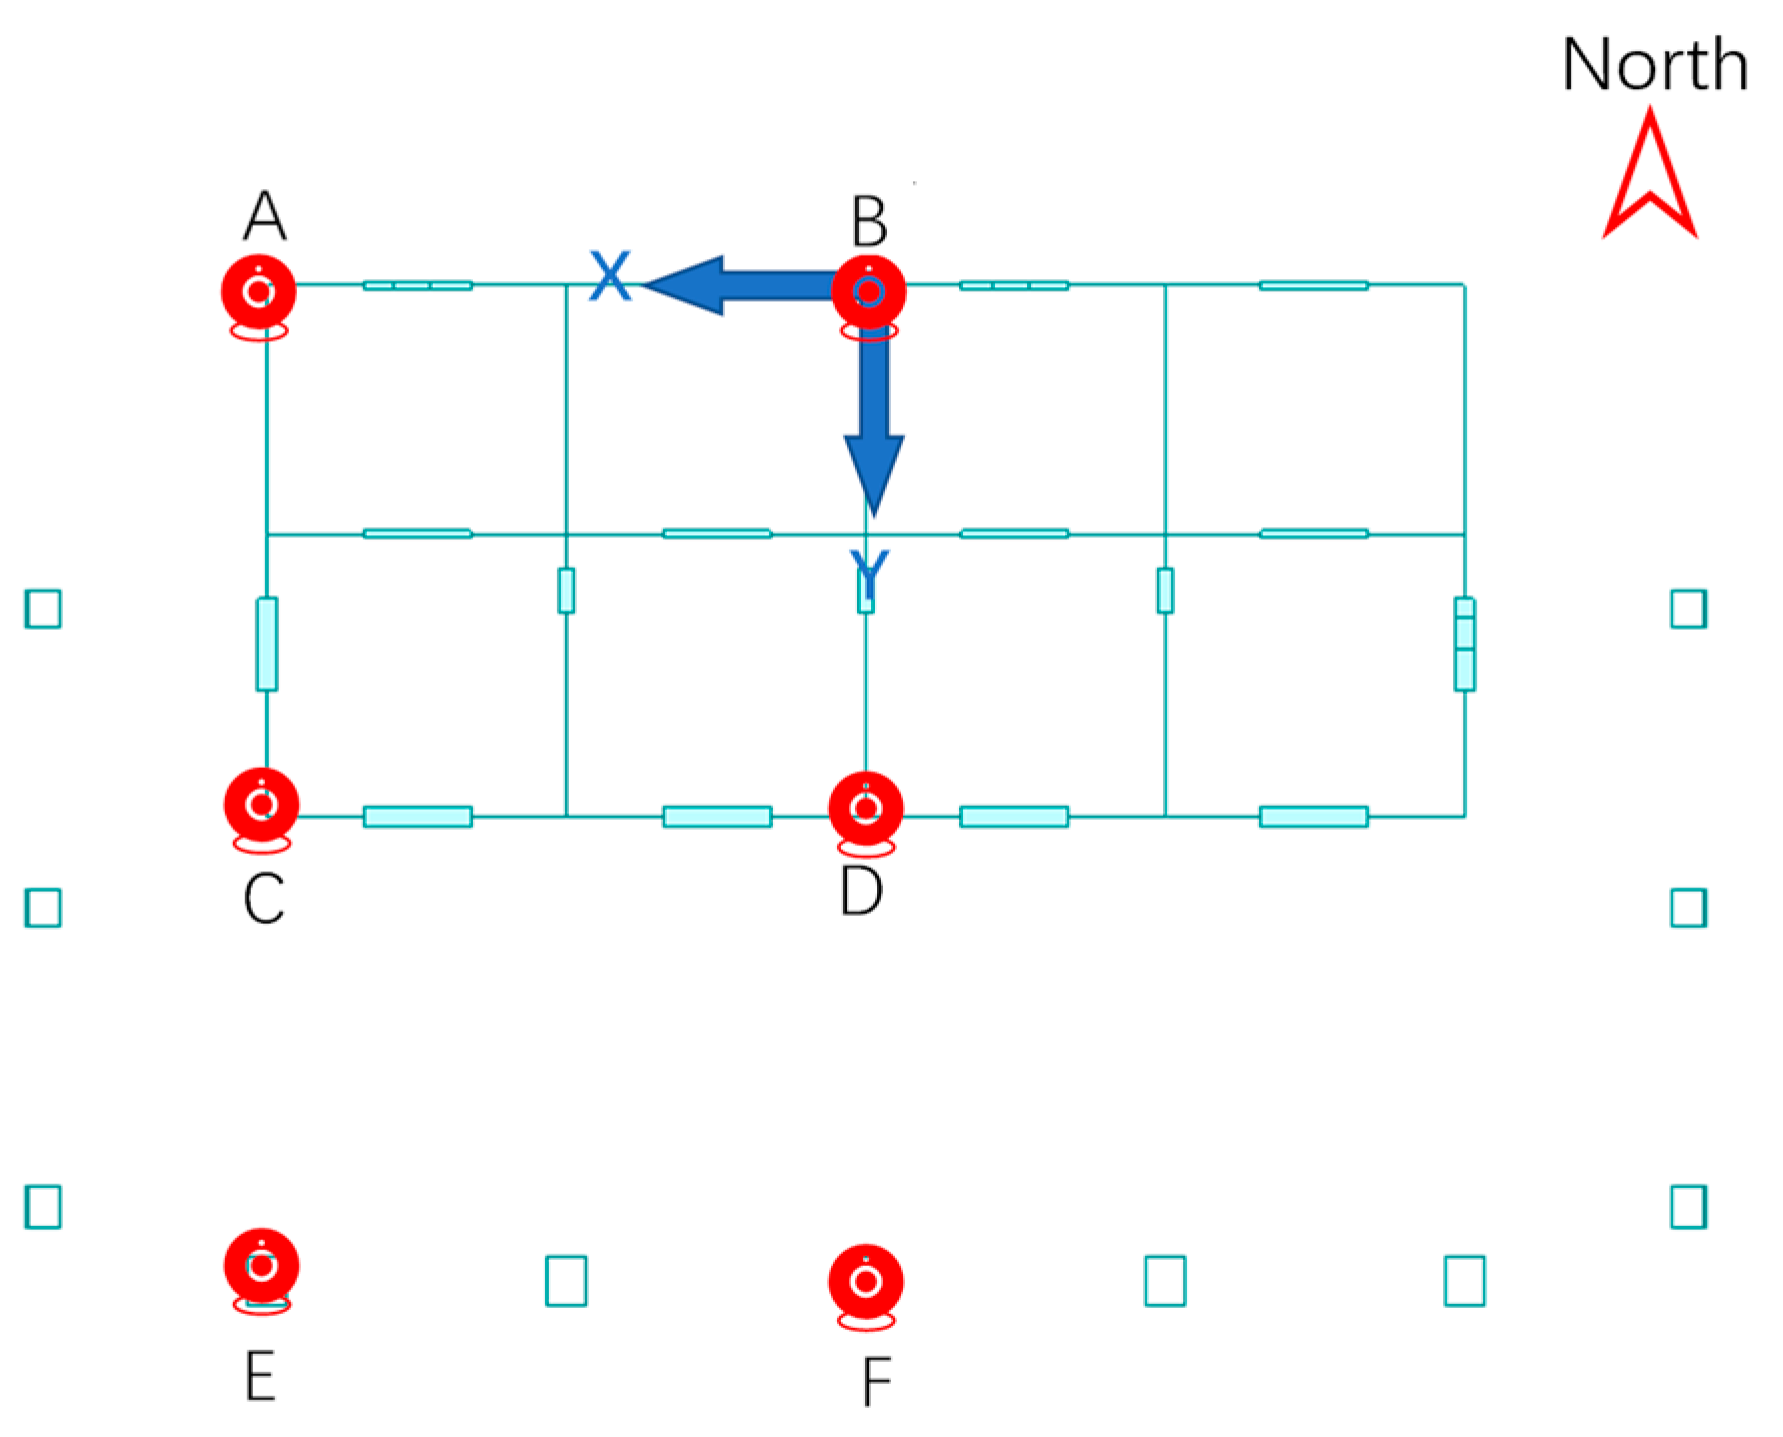
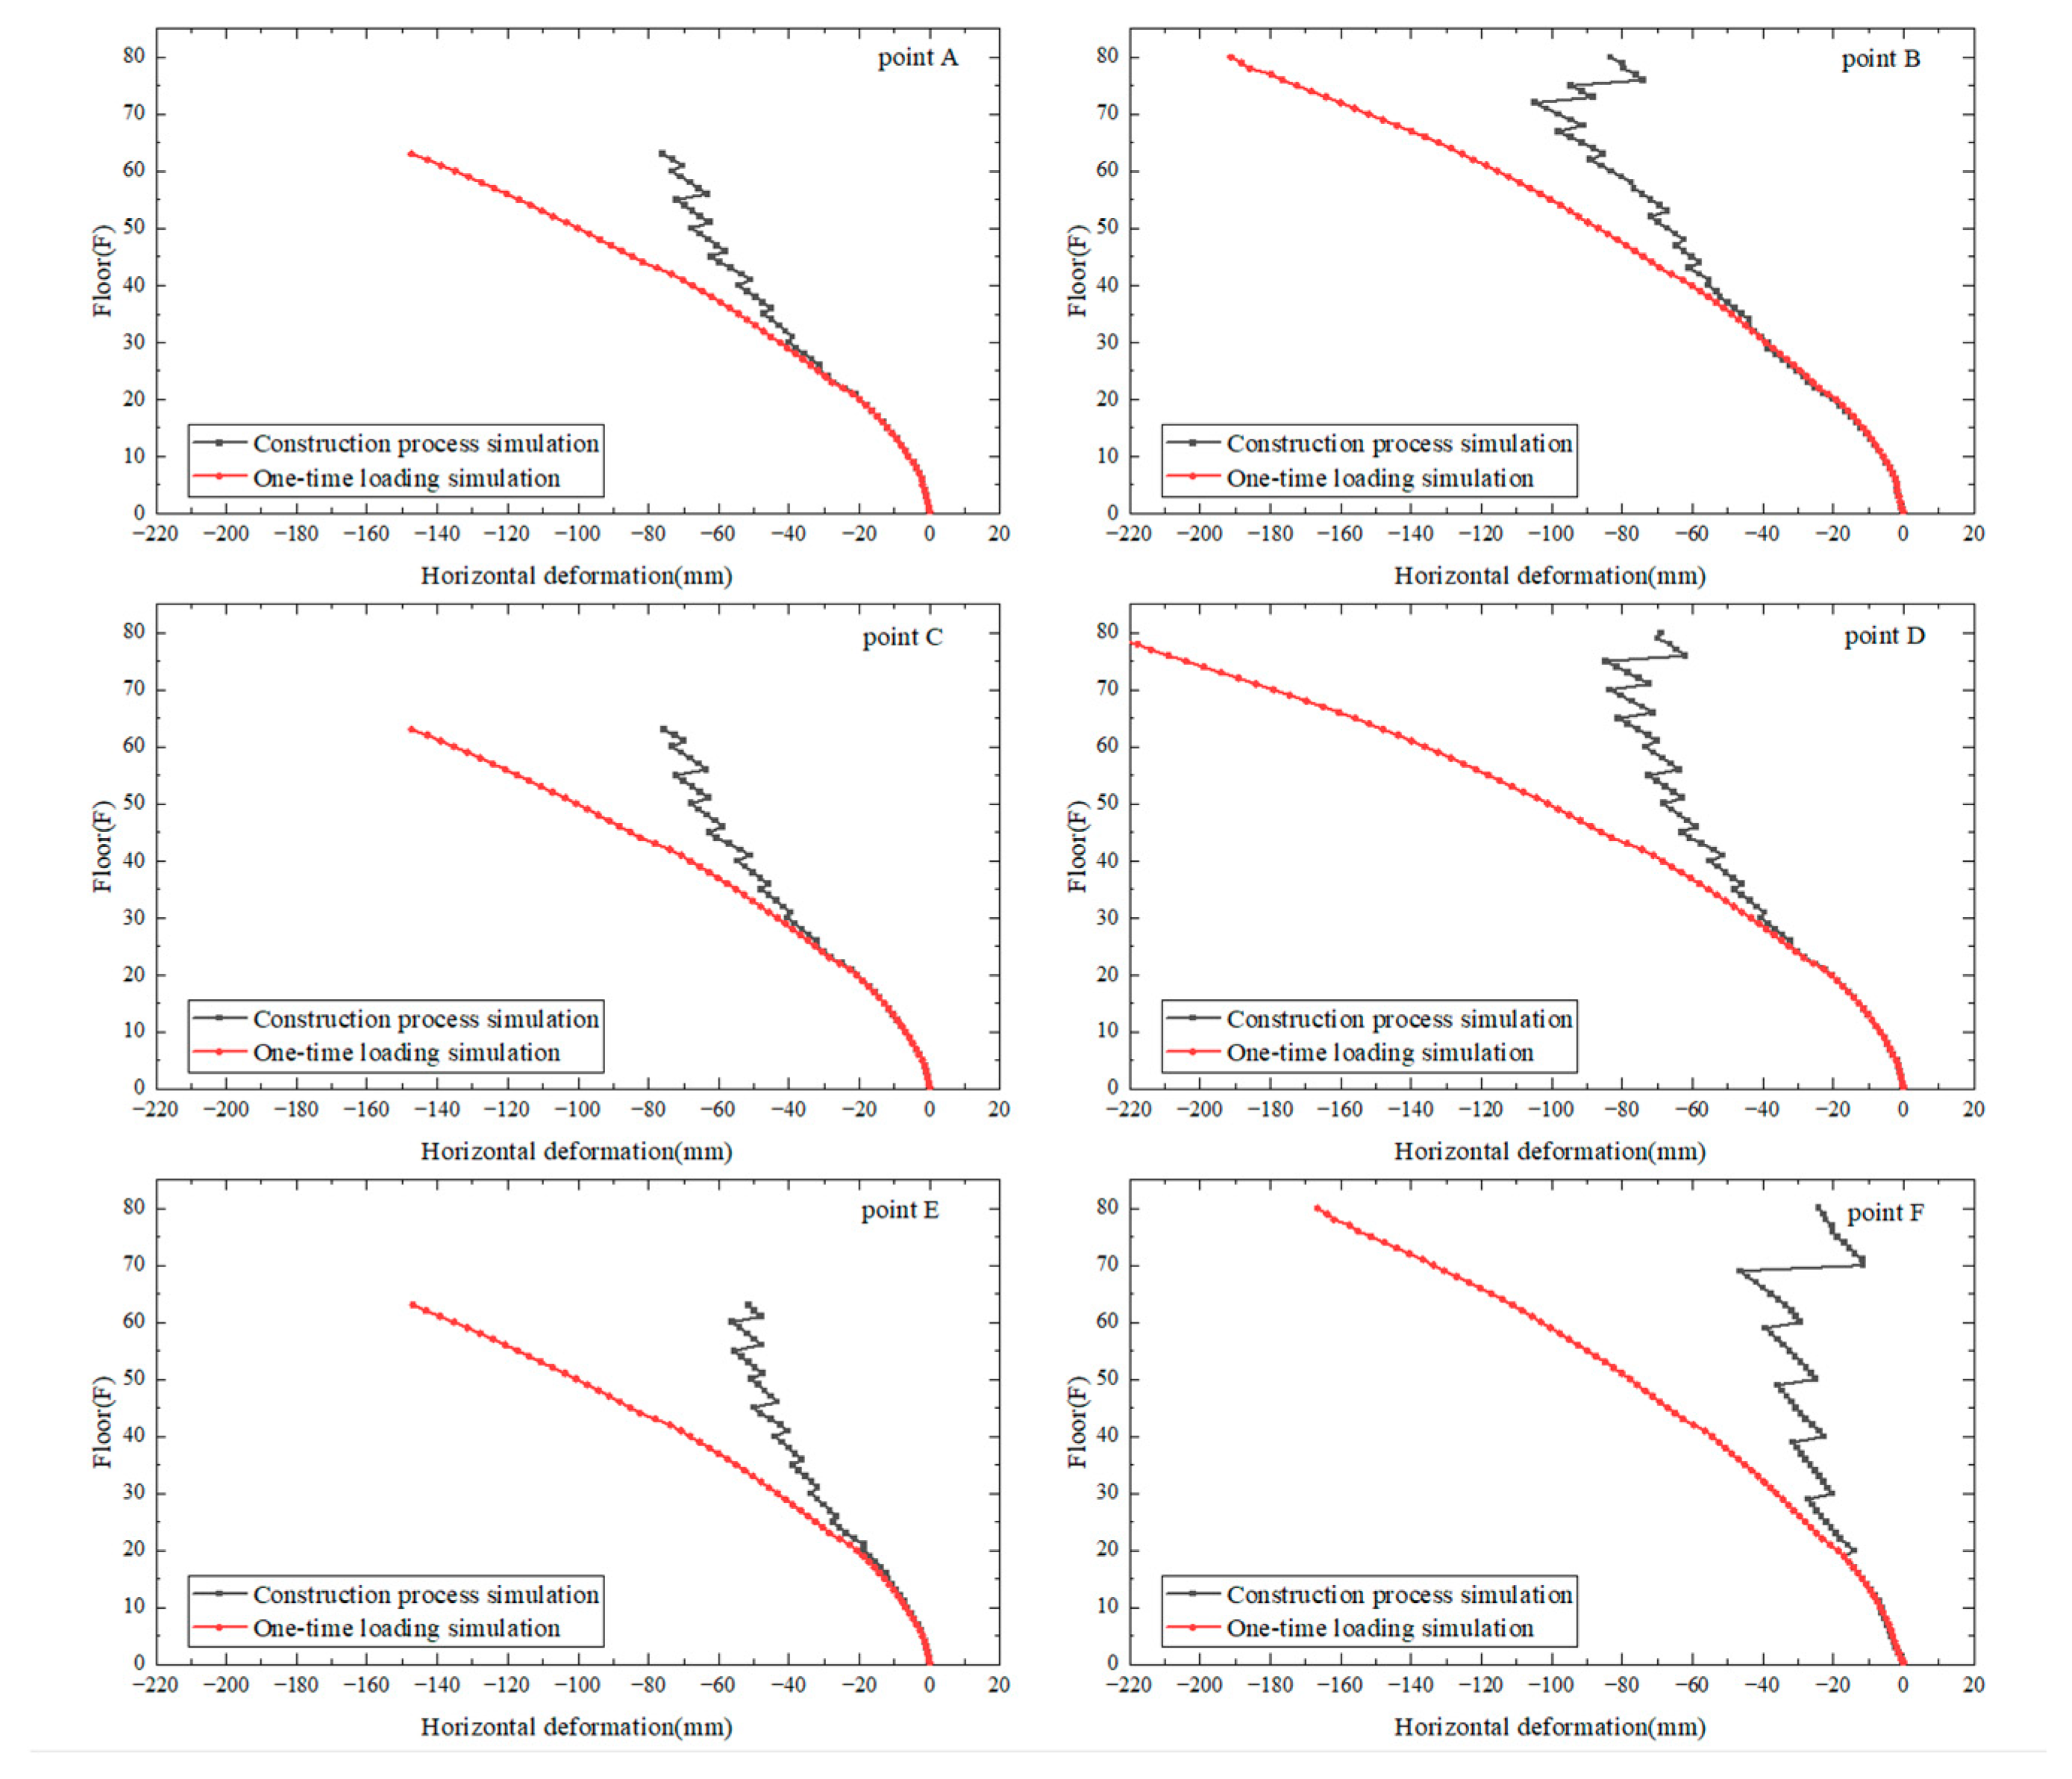
4.2. Horizontal Deformation Results Under Simulation Condition

This case is a large eccentric core tube structure, the gravity center does not coincide with the rigid center, and the overall height of the structure exceeds 300 m. This results that the structure itself will be tilted towards -Y (south) during the construction process under the constant load. Considering the influence of location factor (center-line side or edge-line side) and relative position factor (core tube and frame column), 6 groups of representative point positions were selected as shown in the Figure 12. Focus on the horizontal deformation (Y-direction) characteristics of each point.
As shown in Figure 13, when considering the one-time loading simulation, the horizontal deformation increases monotonically with the increase of height, and the maximum deformation appears at the top of the structure. In contrast, when considering the construction process simulation, the horizontal deformation is significantly reduced. The extraction points on the center-line side showed a trend of first increasing and then decreasing, and the largest deformation appeared near the 70th floor. The overall deformation of the extraction points on the edge-line side still keeps the trend of increasing gradually with the height.
Taking analysis point D in the middle of the core and frame as reference, according to construction simulation and one-time loading analysis results, it can be seen that under conventional construction mode, the upper and lower limits of the maximum horizontal deformation of the structure are about 84.62 mm~227.75 mm. The influence of uncertain factors, such as actual construction progress and shrinkage and creep, were considered in, and the upper and lower limits were estimated. It is greater than the perpendicularity deviation requirement of 38.8 mm (the minimum value between 1/10,000 H and 80 mm) in code GB50204-2015. For this reason, construction surveying measures for pre-arch control were required in this case to control the horizontal deformation of the structure as it was delivered.

4.3. Initial Determination and Verification of Horizontal Deformation Control Strategy

Taking the horizontal deformation of each construction stage obtained from the finite element construction process simulation as the reference deformation, the maximum deformation of the final construction stage is obtained as 84.62 mm (shown in Figure 14a). Taking this reference deformation as the predicted value of load-induced deformation, the maximum horizontal offset of the pre-arch target curve is taken to be 80 mm (located at 50F) (shown in Figure 14b).
The assumed target position curve is validated below. If the horizontal deformation occurring in the structure during each construction stage is not considered and implemented according to the horizontal deformation control strategy, the displacement construction deviation of the final structure is obtained by 1000 times random construction error based simulation analyses as shown below (μ = ∆N, σ = 10, P = 95%). By substituting the deviation correction value ∆i of each floor in the pre-arch target determination curve, the displacement construction deviation ∆3 of the corresponding floor can be solved, and finally the structural displacement construction deviation ∆3 = ±12 mm, as shown in the Figure 15. And the horizontal deformation caused by load in each construction stage is not considered.
3 3 1 10 × 2 π e ( x N ) 2 200 d x = 0.95
If the horizontal displacement under load in each construction stage is considered, the layer displacement increment of each construction stage in the finite element construction simulation is extracted to form the structural floor displacement increment matrix {∆3} during the construction process. And the layer displacement increment matrix {∆2} generated during the construction process considering the Construction error uncertainty is superimposed. Through 1000 times of simulation analysis based on random error, The displacement construction deviation of the final structure {∆} = {∆3} + {∆2} is obtained, as shown in the Figure 16. In Figure 16, The horizontal deformation caused by load in each construction stage is considered.
Statistical analysis was carried out on the displacement data to draw the probability density curve of horizontal deformation at each layer, as shown in the Figure 17. It can be seen that the final deformation of the structure can be controlled at about ±25 mm, which compliances with specification.

4.4. Correction of Pre-Arch Target Curve Using Measured Deflection Curve

Since the horizontal deformation control strategy was not carried out according to the pre-arch target curve yn shown in Section 4.3 in the early stage of actual construction, which led to a large deformation from 1F to 20F, and unavoidably departed from the initial plan (Figure 18a). Therefore, this section revises the pre-arch target curve yn by measured positional posture zn,k = 5 (measuring range: 1F to 20F, corresponds to stage-5 of the construction process in FE simulation), and re-designs the horizontal deformation control scheme from 21F to above floors.
In this section, the pre-arch target curve yn is revised by fixing the deviation correction value (Δyn = 5 mm) to ensure that the simulation is more consistent with the actual construction condition. Where, the relationship between Δyn and yn has been derived from the Equation (14) in Section 3.1. By comparing the measured value with the pre-arch target curve, the effect of correction construction can be evaluated.
Figure 18a–d show the solving process of the pre-arch target curve yn. Taking 20F as the base layer, through the deformation increment xn−1,n, artificial deviation correction value Δyn, and the initial deviation yn−1 (yn−1 is represented by the measured curve), the pre-arch target curve yn can be calculated by iterative solution Equation (14). The deformation guarantee rate of yn of the pre-arch target curve has been verified in Section 4.3, so it will not be discussed again. The revised pre-arch target curve yn is shown in Figure 18a. The modified initial deformation is roughly similar to the original design value, where, yn is about 80 mm.
Further, Figure 18e–h show the solving process of the positional posture curve zn,k. The deformation increment matrix {xn,i} in the FE simulation analysis results can be extracted to obtain the parameters related to construction deformation, such as Σxn,i and xn,n. And the positional posture curve zn, k can be calculated by solving the Equation (15). In this section, only the positional posture at completion (corresponds to stage-18 of the construction process) was showed in Figure 18h. The predicted results and analysis of subsequent relevant construction stages are detailed in Section 4.5.

4.5. Structural Positional Posture Preview After Correction

The horizontal displacement control strategy in Section 4.4 was adopted to conduct finite element preview of the positional posture zn,k in each subsequent construction stage, as shown in the Figure 19. It can be shown that the whole control structure is inclined to the core tube side (+) before core tube construction completed (the first two rows in Figure 19), and the displacement of the top position is close to the preset deviation correction value of 80 mm. In contrast, the structure gradually leans to the side of the outer frame (−) with the frame construction process after core tube construction completed (the last row in Figure 19), and finally the top position back to near zero line at the end of completion. When the structure is completed, the upper displacement of the structure can be accurately controlled within ±20 mm, and the lower displacement can be basically controlled within ±40 mm, and the final structural position basically meets the requirements. The position with large deviation occurs at the bottom in this engineering case, which is mainly due to the residual problems caused by the pre-construction not carried out according to the horizontal displacement control strategy.

5. Verification

In order to verify the accuracy of the structural deformation predicted in this paper, the simulation data were compared with the construction monitoring data. The high precision three-dimensional laser scanner system is used to monitor the horizontal deformation of typical floors in real-time (Figure 20). The measured data were obtained by scanning the north facade of the core tube at one side of the tower core tube, and nonlinear fitting method was adopted to fit the data of each monitoring point. So as the skipping or missing monitoring values caused by local construction errors or non-coverage of monitoring points were avoided. The horizontal deformation results (measured values) of the core tube in different monitoring periods were obtained.
The horizontal deformation of observation point D was taken as the research object, and the structural deformation obtained when the structure was constructed to 30/40/50/60 (±3F) layer was taken as the reference to verify the prediction results in Section 4.5 in different construction stages. The measured results were compared with the predicted results, as shown in Figure 21. The results show that the measured data match well with the predicted data, which verifies the accuracy of the proposed method in predicting the long-term horizontal deformation during the construction process. It should be noted that the measured value has a tendency to deviate to the frame side (−) compared with the predicted value. Combined with the positional posture predicted at the time of final completion (shown in Figure 19), the trend is beneficial for the verticality correction of the structure. Therefore, the horizontal deformation control strategy specified in Section 4.4 can be still implemented. In the future, the horizontal deformation control strategy will be continued or adjusted through continuous deformation monitoring to meet the structural verticality requirement.

6. Conclusions

In this paper, the mathematical model of construction error uncertainty was studied, and the verification method of pre-arch target curve based on construction error was proposed. Four key deformation parameters, such as positional posture, initial deformation, deformation increment, and deviation correction value, were correlated and the calculation formulas were established. In terms of the implementation of horizontal displacement control strategy, a method of wall line control based on deviation correction value was proposed according to the construction stringing habit. On the basis of the initial horizontal deformation control scheme, the strategy was modified based on the engineering practice, and used to guide the actual engineering construction. Finally, the effectiveness of the horizontal displacement control strategy was verified by the measured results. The following conclusions were drawn:
1. The horizontal deformation analysis method of eccentric core tube structure based on the construction error model, the implementation process of control strategy, and the basis of judging the error correction effect were proposed, which solves the problem that the actual construction error is much larger than the demand of interlayer correction. This method can be used to analysis the overall structural deviation and to design the deviation correction plan in the pre-construction stage. The results of the study show that the construction process and measurement methods have a great influence on the structural deformation. Adopting the correct unidirectional verticality deviation requirements based on the measurement results can significantly improve the accuracy of structural construction.
2. The quantitative relationships among the displacement data such as the initial deformation, the deformation increment, the deviation correction value, and the positional posture were established, and the iterative calculation formula of the initial deformation of the structure (pre-arch target curve) was proposed. Based on the experience of construction habit, an improved stringing and concreting method adapted to the horizontal displacement control strategy was proposed. The control points and control lines were fixed, and the position of the wall line on each floor was adjusted based on the deviation correction amount. It is suitable for the adjustment and verification of the correction scheme and the construction disclosure in the implementation stage of the scheme.
3. Taking a 390-m super high-rise eccentric core structure under construction as a case study and integrating the whole construction process of ‘prediction-construction-measurement-adjustment’, the preliminary formulation and verification of the horizontal displacement control strategy, as well as the adjustment strategy adopted in the implementation course when a large error is measured, were elaborated in detail. The predict results verified by measurement data show that the horizontal displacement of the structure is effectively controlled, which can provide a reference for the horizontal displacement control of the same type of project, especially to the large-eccentric building.
4. If the horizontal displacement is not controlled, the eccentric core tube structure will show obvious horizontal deformation during the construction period. The control measures of construction leveling can effectively reduce the horizontal deformation of super high-rise structures, which is very important for controlling the deformation of structures, and should be paid attention to in the actual construction process.

Author Contributions

Conceptualization, H.W. and Y.X.; methodology, G.Y. and X.M.; software, X.M. and D.Z.; validation, D.Z., S.W. and Q.A.; formal analysis, G.Y.; investigation, X.M.; resources, Y.X. and S.W.; data curation, H.W.; writing—original draft preparation, H.W. and D.Z.; writing—review and editing, G.Y. and X.M.; visualization, Q.A.; supervision, Y.X.; project administration, S.W.; funding acquisition, H.W. and S.W. All authors have read and agreed to the published version of the manuscript.

Funding

This research was funded by China Construction Technology R&D Project, grant number CSCEC-2017-Z-36.

Data Availability Statement

The data presented in this study are available on request from the corresponding author. The data are not publicly available due to privacy.

Conflicts of Interest

Author Dekai Zhang, Guanghua Yin, Xinxu Ma, Sijiu Wang and Qiyang Ai was employed by China Construction Eighth Engineering Division Co., Ltd. The remaining authors declare that the research was conducted in the absence of any commercial or financial relation-ships that could be construed as a potential conflict of interest.

References

  1. Wang, W.B.; Hu, H.S.; Wang, R.T.; Gao, Y.C.; Guo, Z.X. Effects of belt trusses on drift control of frame-core tube structures. Eng. Struct. 2024, 304, 117583. [Google Scholar] [CrossRef]
  2. Li, J.W.; Wang, N.; Zhang, C.X.; Rong, W.H.; Zhao, Y. Research on structural design and key technology of super high-rise China merchants bank headquarters building with off-center core tube. Build. Struct. 2023, 53, 16–24. [Google Scholar]
  3. Ou, Y.; Chen, B.; Jia, H.; Yin, G.; Cao, J. Simulation Analysis and Application of Super High-rise Tower Construction Process. J. Phys. Conf. Ser. 2022, 2185, 012065. [Google Scholar] [CrossRef]
  4. Gao, F.; Zhou, H.; Liang, H.; Weng, S.; Zhu, H. Structural deformation monitoring and numerical simulation of a supertall building during construction stage. Eng. Struct. 2019, 209, 110033. [Google Scholar] [CrossRef]
  5. Porcar, B.; Soutullo, S.; Enríquez, R.; Jiménez, M.J. Quantification of the uncertainties produced in the construction process of a building through simulation tools: A Case Study. J. Build. Eng. 2018, 20, 377–386. [Google Scholar] [CrossRef]
  6. Jia, H.X.; Zhang, X.Q.; Feng, J. Construction Simulation Analysis of Super High-rise Building Considering: The Concrete Filled Steel Tubular Column Shrinkage and Creep Effect. Build. Struct. 2019, 49, 519–523. [Google Scholar]
  7. Chen, Z.; Gao, F.; Hu, J.; Liang, H.; Huang, S. Creep and shrinkage monitoring and modelling of CFST columns in a super high-rise under-construction building. J. Build. Eng. 2023, 76, 107282. [Google Scholar] [CrossRef]
  8. Wang, L.L.; Zhao, X.; Yan, C.Z. Time-dependent vertical shortening prediction for super-tall buildings by using a modified B3 model to consider moisture distribution. Eng. Struct. 2020, 209, 109994. [Google Scholar] [CrossRef]
  9. Kim, H.S.; Cho, S.H. Column Shortening of Concrete Cores and Composite Columns in a Tall Building. Struct. Des. Tall Spec. Build. 2005, 14, 175–190. [Google Scholar] [CrossRef]
  10. Xiao, J.; Peng, J.; Cai, C.S.; Bian, H.; Zhang, J. Experimental Study of Shrinkage and Creep Behaviors of Low-Shrinkage and Low-Creep C60 High-Performance Concrete and Parameter Recommendations. J. Mater. Civ. Eng. 2024, 36, 04024218. [Google Scholar] [CrossRef]
  11. Matiushin, E.; Sizyakov, I.; Shvetsova, V.; Soloviev, V. The Properties and Behavior of Ultra-High-Performance Concrete: The Effects of Aggregate Volume Content and Particle Size. Buildings 2024, 14, 2891. [Google Scholar] [CrossRef]
  12. GB50204-2015; Code for Quality Acceptance of Concrete Structure Construction. China Architecture & Building Press: Beijing, China, 2015.
  13. Wu, H.L.; Ding, J.M.; Wang, S.Y.; Yang, B.; Zhang, T.; Geng, Y. Structural design and key technology of eccentric high-rise frame-core tube structures. J. Build. Struct. 2023, 44, 154–165. [Google Scholar]
  14. Lu, Z.; Zhou, Y.M.; Wang, Y.H.; Wang, Z.; Zhang, F.W. Analysis of horizontal deformation and internal force of super high-riase frame-eccentrical core tube structure considering creep and shrinkage of concrete. Struct. Eng. 2023, 39, 1–8. [Google Scholar]
  15. Wang, Y.; Zhou, Y.; Zhu, L.; Zhang, T.; Jia, B.; Han, S.; Lu, Z. Horizontal deformation and construction analysis of frame–eccentrical core tube structure. Struct. Des. Tall Spec. Build. 2022, 31, e1943. [Google Scholar] [CrossRef]
  16. Huang, Y.L. Research on Vertical Time-Varying Characteristics of Super Tall Building Structures During Construction Period; Tongji University: Shanghai, China, 2008. [Google Scholar]
  17. Liu, F.N. The Analysis and Control Methods of Vertical Deformation of Super High-Rise Frame-Core Wall Structure Under Construction; Dalian University of Technology: Dalian, China, 2018. [Google Scholar]
  18. Li, P.N.; Qing, R.; Gui, G.Q. Study of differential shortening of steel-concrete hybrid structure vertical members in high-rise residential buildings. Constr. Technol. 2006, 8, 42–45. [Google Scholar]
  19. Yan, F.; Zhou, J.L.; Wang, D.S.; Zheng, L.; Lang, T. Structural design of Nanjing Greenland Zifeng Mansion Super High-rise Building. Build. Struct. 2007, 37, 20–24. [Google Scholar]
  20. Zhou, Y.; Luo, X.; Ye, P.; Zhang, W.; Ling, Q.; Du, Z. Bayesian-based prediction and real-time updating of axial deformation in high-rise buildings during construction. Eng. Struct. 2023, 297, 116992. [Google Scholar] [CrossRef]
  21. Zhou, Y.; Luo, X.; Zhang, W.; Ye, P.; Chen, J.; Du, Z. Improvement of axial deformation prediction in high-rise buildings with field monitoring and adaptive unscented Kalman filter. J. Build. Eng. 2024, 84, 108432. [Google Scholar] [CrossRef]
  22. Ma, G.Q. Study on the influence of construction error on the reliability of building frame structure. Constr. Budg. 2024, 6, 34–36. [Google Scholar]
  23. Lim, K.; Kang, J.; Ryu, G.; Koh, K.; Kim, K. Fundamental Design Concepts of a Modular Pier System Using Ultra-High-Performance Concrete for Solving Construction Errors. Buildings 2023, 13, 1816. [Google Scholar] [CrossRef]
  24. Galvão, N.; Matos, J.C.; Hajdin, R.; Ferreira, L.; Stewart, M.G. Impact of construction errors on the structural safety of a post-tensioned reinforced concrete bridge. Eng. Struct. 2022, 267, 114650. [Google Scholar] [CrossRef]
Figure 1. −10~+10 mm construction error probability density distribution profile.
Buildings 14 03384 g001
Figure 2. Construction error deviation under completely random condition.
Buildings 14 03384 g002
Figure 3. 0~+10 mm construction error uncertainty density distribution profile.
Buildings 14 03384 g003
Figure 4. Construction error deviation under human intervention condition.
Buildings 14 03384 g004
Figure 5. Schematic diagram of wall line correction during construction stringing.
Buildings 14 03384 g005
Figure 6. Schematic diagram of Shear wall deviation correction.
Buildings 14 03384 g006
Figure 7. Observation device and measurement method.
Buildings 14 03384 g007
Figure 8. Schematic diagram of the relationship between different deformation parameters: (a) Schematic diagram of pre-arch target curve (yn); (b) Schematic diagram of positional posture (Zn,k).
Buildings 14 03384 g008
Figure 9. Flow chart of adjusting process of pre-arch correction method.
Buildings 14 03384 g009
Figure 10. Schematic diagram of the frame-core tube structure: (a) Schematic of entire structure; (b) Upper standard floor; (c) Middle standard floor; (d) Lower standard floor.
Buildings 14 03384 g010
Figure 11. Schematic diagram of the different construction process.
Buildings 14 03384 g011
Figure 12. Schematic diagram of displacement extraction points.
Buildings 14 03384 g012
Figure 13. Horizontal displacement under two simulation conditions (Y-direction).
Buildings 14 03384 g013
Figure 14. Pre-arch target curve based on predicted deformation curve: (a) Predicted Y-direction deformation without considering pre-arch deflection; (b) Pre-arch target curve.
Buildings 14 03384 g014
Figure 15. Deformation prediction of structure after implementing deviation control strategy.
Buildings 14 03384 g015
Figure 16. Deformation prediction of structure after implementing deviation control strategy. (Considering the horizontal deformation of the structure caused by loads in each construction stage).
Buildings 14 03384 g016
Figure 17. Probability density curve of the horizontal deformation.
Buildings 14 03384 g017
Figure 18. The calculation results of different deformation parameters: (a) yn; (b) Δyn; (c) ΣΔyn; (d) xn−1,n; (e) Σxn,i (i = n to k), k = 18; (f) xn,n; (g) Σxn,i (i = n + 1 to k), k = 18; (h) zn,k, k = 18.
Buildings 14 03384 g018
Figure 19. Positional posture preview zn,k under different construction stage.
Buildings 14 03384 g019
Figure 20. Three-dimensional laser scanner and operation mode: (a) Scanner operation mode; (b) Control point transformation mode; (c) Three-dimensional laser scanner.
Buildings 14 03384 g020
Figure 21. Comparison between predicted and measured results of horizontal deformation.
Buildings 14 03384 g021
Disclaimer/Publisher’s Note: The statements, opinions and data contained in all publications are solely those of the individual author(s) and contributor(s) and not of MDPI and/or the editor(s). MDPI and/or the editor(s) disclaim responsibility for any injury to people or property resulting from any ideas, methods, instructions or products referred to in the content.

