Article

Study on Fractal Damage of Concrete Cracks Based on U-Net

School of Civil Engineering, Xijing University, Xi’an 710123, China
*
Author to whom correspondence should be addressed.
Buildings 2024, 14(10), 3262; https://doi.org/10.3390/buildings14103262
Submission received: 9 September 2024 / Revised: 28 September 2024 / Accepted: 11 October 2024 / Published: 15 October 2024
(This article belongs to the Section Building Structures)

Abstract

The damage degree of a reinforced concrete structure is closely related to the generation and expansion of cracks. However, the traditional damage assessment methods of reinforced concrete structures have defects, including low efficiency of crack detection, low accuracy of crack extraction, and dependence on the experience of inspectors to evaluate the damage of structures. Because of the above problems, this paper proposes a damage assessment method for concrete members combining the U-Net convolutional neural network and crack fractal features. Firstly, the collected test crack images are input into U-Net for segmenting and extracting the output cracks. The damage to the concrete structure is then classified into four empirical levels according to the damage index (DI). Subsequently, a linear regression equation is constructed between the fractal dimension (D) of the cracks and the damage index (DI) of the reinforced concrete members. The damage assessment is then performed by predicting the damage index using linear regression. The method was subsequently employed to predict the damage level of a reinforced concrete shear wall–beam combination specimen, which was then compared with the actual damage level. The results demonstrate that the damage assessment method for concrete members proposed in this study is capable of effectively identifying the damage degree of the concrete members, indicating that the method is both robust and generalizable.

1. Introduction

Concrete structures are employed in a multitude of projects due to their exemplary mechanical properties and durability. However, the issue of surface cracks in concrete is becoming increasingly prevalent. These cracks not only compromise the structural integrity of the material but also pose a significant risk of collapse, endangering human lives and property [1]. Therefore, the precise identification and analysis of concrete cracks are crucial for ensuring the safety of building structures and extending their service life.
The methodology of analyzing the stage of crack development by calculating the fractal dimensions of cracks and thus characterizing building damage has been validated by numerous experts as a valuable approach. For example, Yin et al. [2] put forth a methodology for calculating damage variables based on the fractal dimension of cracks. This approach enables the characterization of the crack distribution throughout the entire process of concrete cracking, employing the fractal dimension to provide a quantitative description of the concrete damage evolution. Julian et al. [3] assessed the crack patterns and extensions in thin and light-reinforced concrete walls in a low-rise house subjected to seismic action. He et al. [4] achieved damage assessment by establishing a functional relationship between the fractal dimension of the apparent cracks and typical mechanical parameters. Kiarash et al. [5] proposed an equation relating the relative losses of stiffness and strength in the initially uncracked state to the fractal dimensions of the crack patterns. Liu et al. [6] developed a linear regression model between the fractal dimension of cracks and the load ratio, utilizing the novel fractal dimension of the cracks in concrete members for the damage assessment of the concrete members. Joshua et al. [7] proposed an automated methodology for evaluating the structural damage of reinforced concrete structures in the aftermath of a disaster. However, the traditional image processing methods are highly susceptible to environmental factors, such as light and background noise, thus impeding the extraction of sufficient crack detail in building crack fractal analysis and consequently affecting the accuracy of building damage recognition. Consequently, the application of deep learning methods for the segmentation and extraction of cracks represents a promising avenue for enhancing the robustness of crack detail extraction, as evidenced by the current research. For example, Chen et al. [8] put forth a novel approach for integrating fractal dimension and UHK-Net deep learning networks for the semantic recognition of concrete cracks. Hamidia et al. [9] presented a methodology for identifying seismic damage in non-ductile reinforced concrete frame structures using surface crack images and developed prediction equations for estimating the ratio of peak displacements during an earthquake. Xie et al. [10] devised a digital image algorithm based on fractal theory for the evaluation of the fractal dimension of the crack patterns in the impact damage region, intending to predict the degree of concrete fragmentation and damage from the fractal dimension.
Based on the existing research on the fractal damage identification of buildings, this study introduces the U-Net deep learning architecture to improve the robustness of crack extraction. By establishing the empirical relationship between the fractal dimension of surface cracks and the degree of damage to concrete members, the damage assessment of concrete members is carried out. It provides a new theoretical basis and technical support for the fine detection of concrete cracks and provides a new perspective and method for structural damage assessment.

2. U-Net Crack Detection Framework

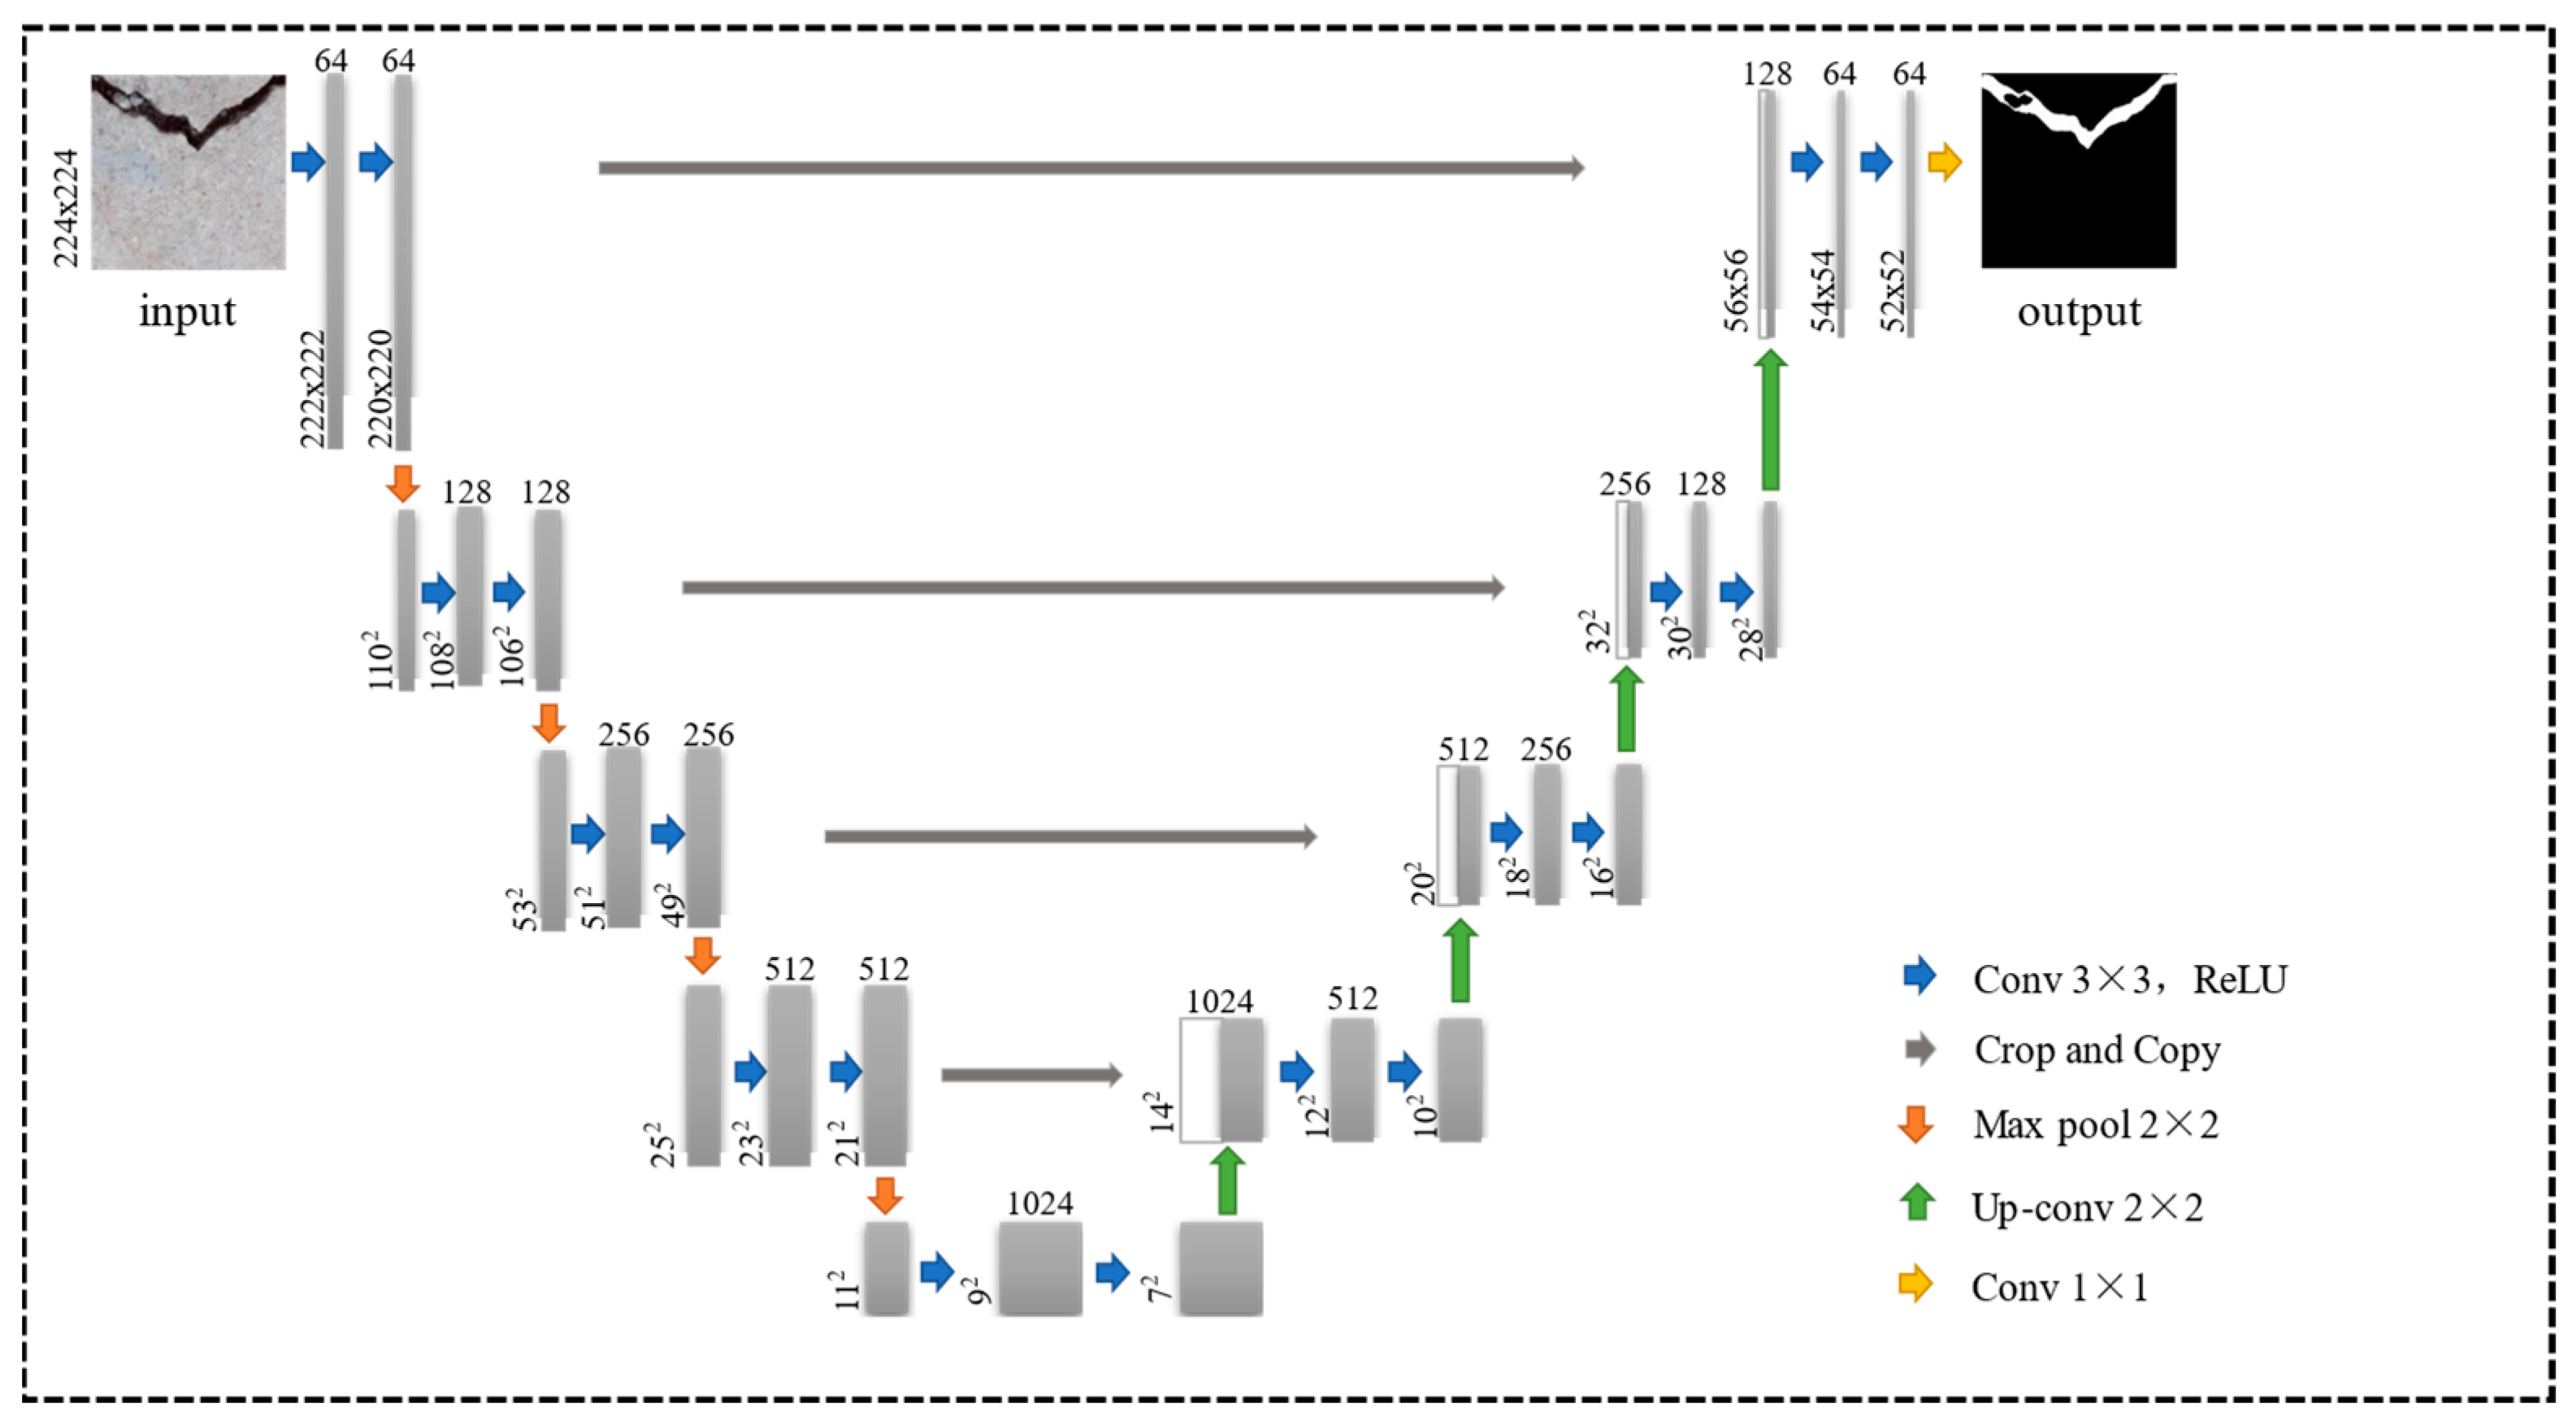
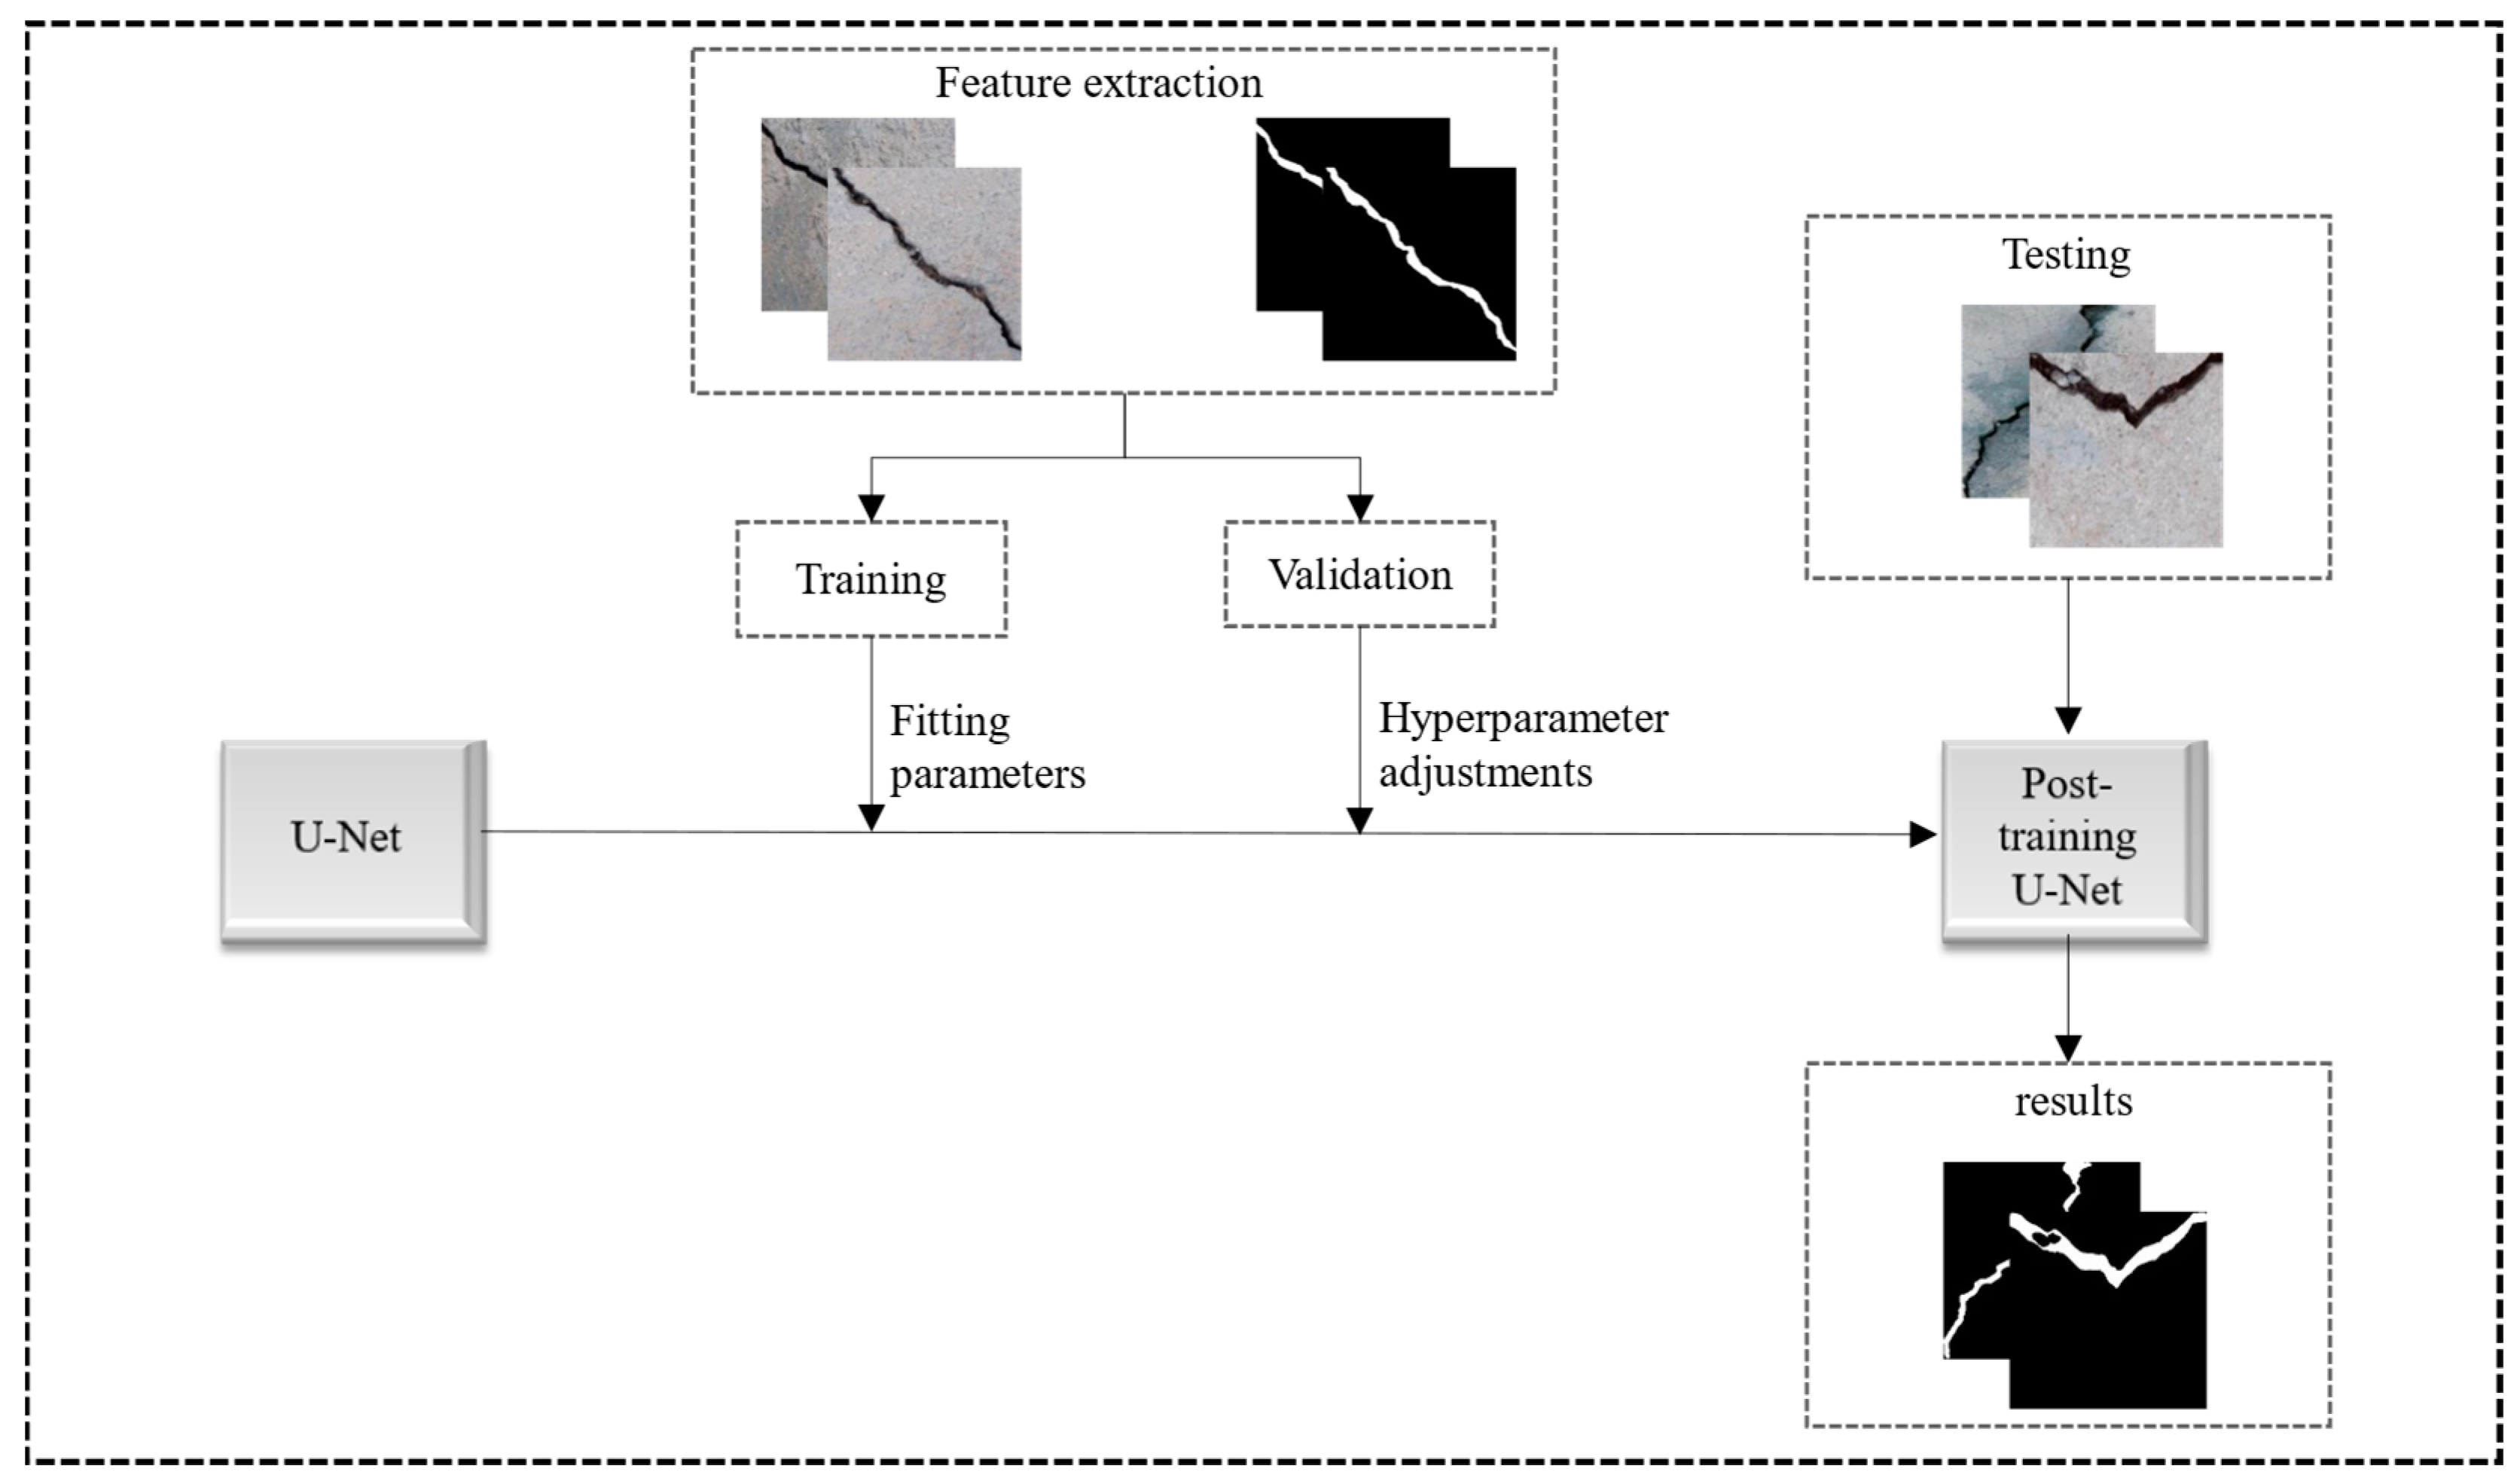
2.1. Model Framework

U-Net was proposed by Ronneberger at the 2015 MICCAI conference. It consists of an encoder and a decoder. The encoder extracts the features by convolution and pooling and gradually reduces the input dimension. Based on the information provided by the encoder, the decoder recovers the detailed features by multiscale feature fusion and upsampling operations to achieve higher accuracy [11]. U-Net Net was initially successful in biomedical image segmentation, using fewer training images and achieving more accurate results compared to a typical CNN convolutional neural network. The overall architecture of the U-Net model is shown in Figure 1.
To identify and locate the cracks in the concrete structure, the U-Net model was used to process the images, and, according to the prediction results of U-Net, we extracted the crack areas of the concrete from the image background. Figure 2 shows a schematic diagram of the training based on U-Net, in which U-Net is responsible for predicting the pixel position of the crack in the image and then extracting the crack region based on its prediction results.

2.2. Dataset

In this study, a public dataset ‘crack-detection-master’ and images taken from mobile phones are collected and a total of 400 crack images are fed into U-Net for training and prediction, and the dataset is described in detail below.
The crack-detection-master dataset was published in [12] and consists of 6077 crack images. All images are bridge and house cracks captured with the CMOS surface array camera of the Phantom 4 Pro at a resolution of 1024 × 1024 pixels. To meet the input requirements of the U-Net model, the image size was cropped to 224 × 224 pixels by a random center cropping operation, and, as these crack images are unevenly lit and contain noise such as shadows, mud stains, and exposure, the training set images were randomly rotated to further enhance the crack features.
The mobile phone images consisted of 40 RGB images with a resolution of 3024 × 3024 pixels. All images were captured by the iPhone 14 smartphone of house cracks, and the image size was cropped to 224 × 224 pixels to meet the input requirements of the U-Net model using a random center cropping operation.
A total of 400 images were selected to form a dataset, consisting of 360 images from the ‘crack-detection-master’ dataset and 40 images taken by mobile phones. In order to evaluate the generalization ability of U-Net, the 400 images were divided into three parts according to the principle of cross-validation: 80% for training, 10% for validation, and the remaining 10% for testing. Specifically, 320 images were randomly selected from the 400 to form the training set, 40 images were used for the validation set, and the remaining 40 images not selected for training or validation were used to form the test set. Table 1 shows the detailed proportions of the training set, validation set, and test set. Since it is not easy to find a concrete surface containing a variety of noise points, and multiple noise points can be captured in a single image, there are relatively few images that feature multiple noise points. Hence, images featuring multiple noise points are included in the test set to assess the detection capabilities of the U-Net model.

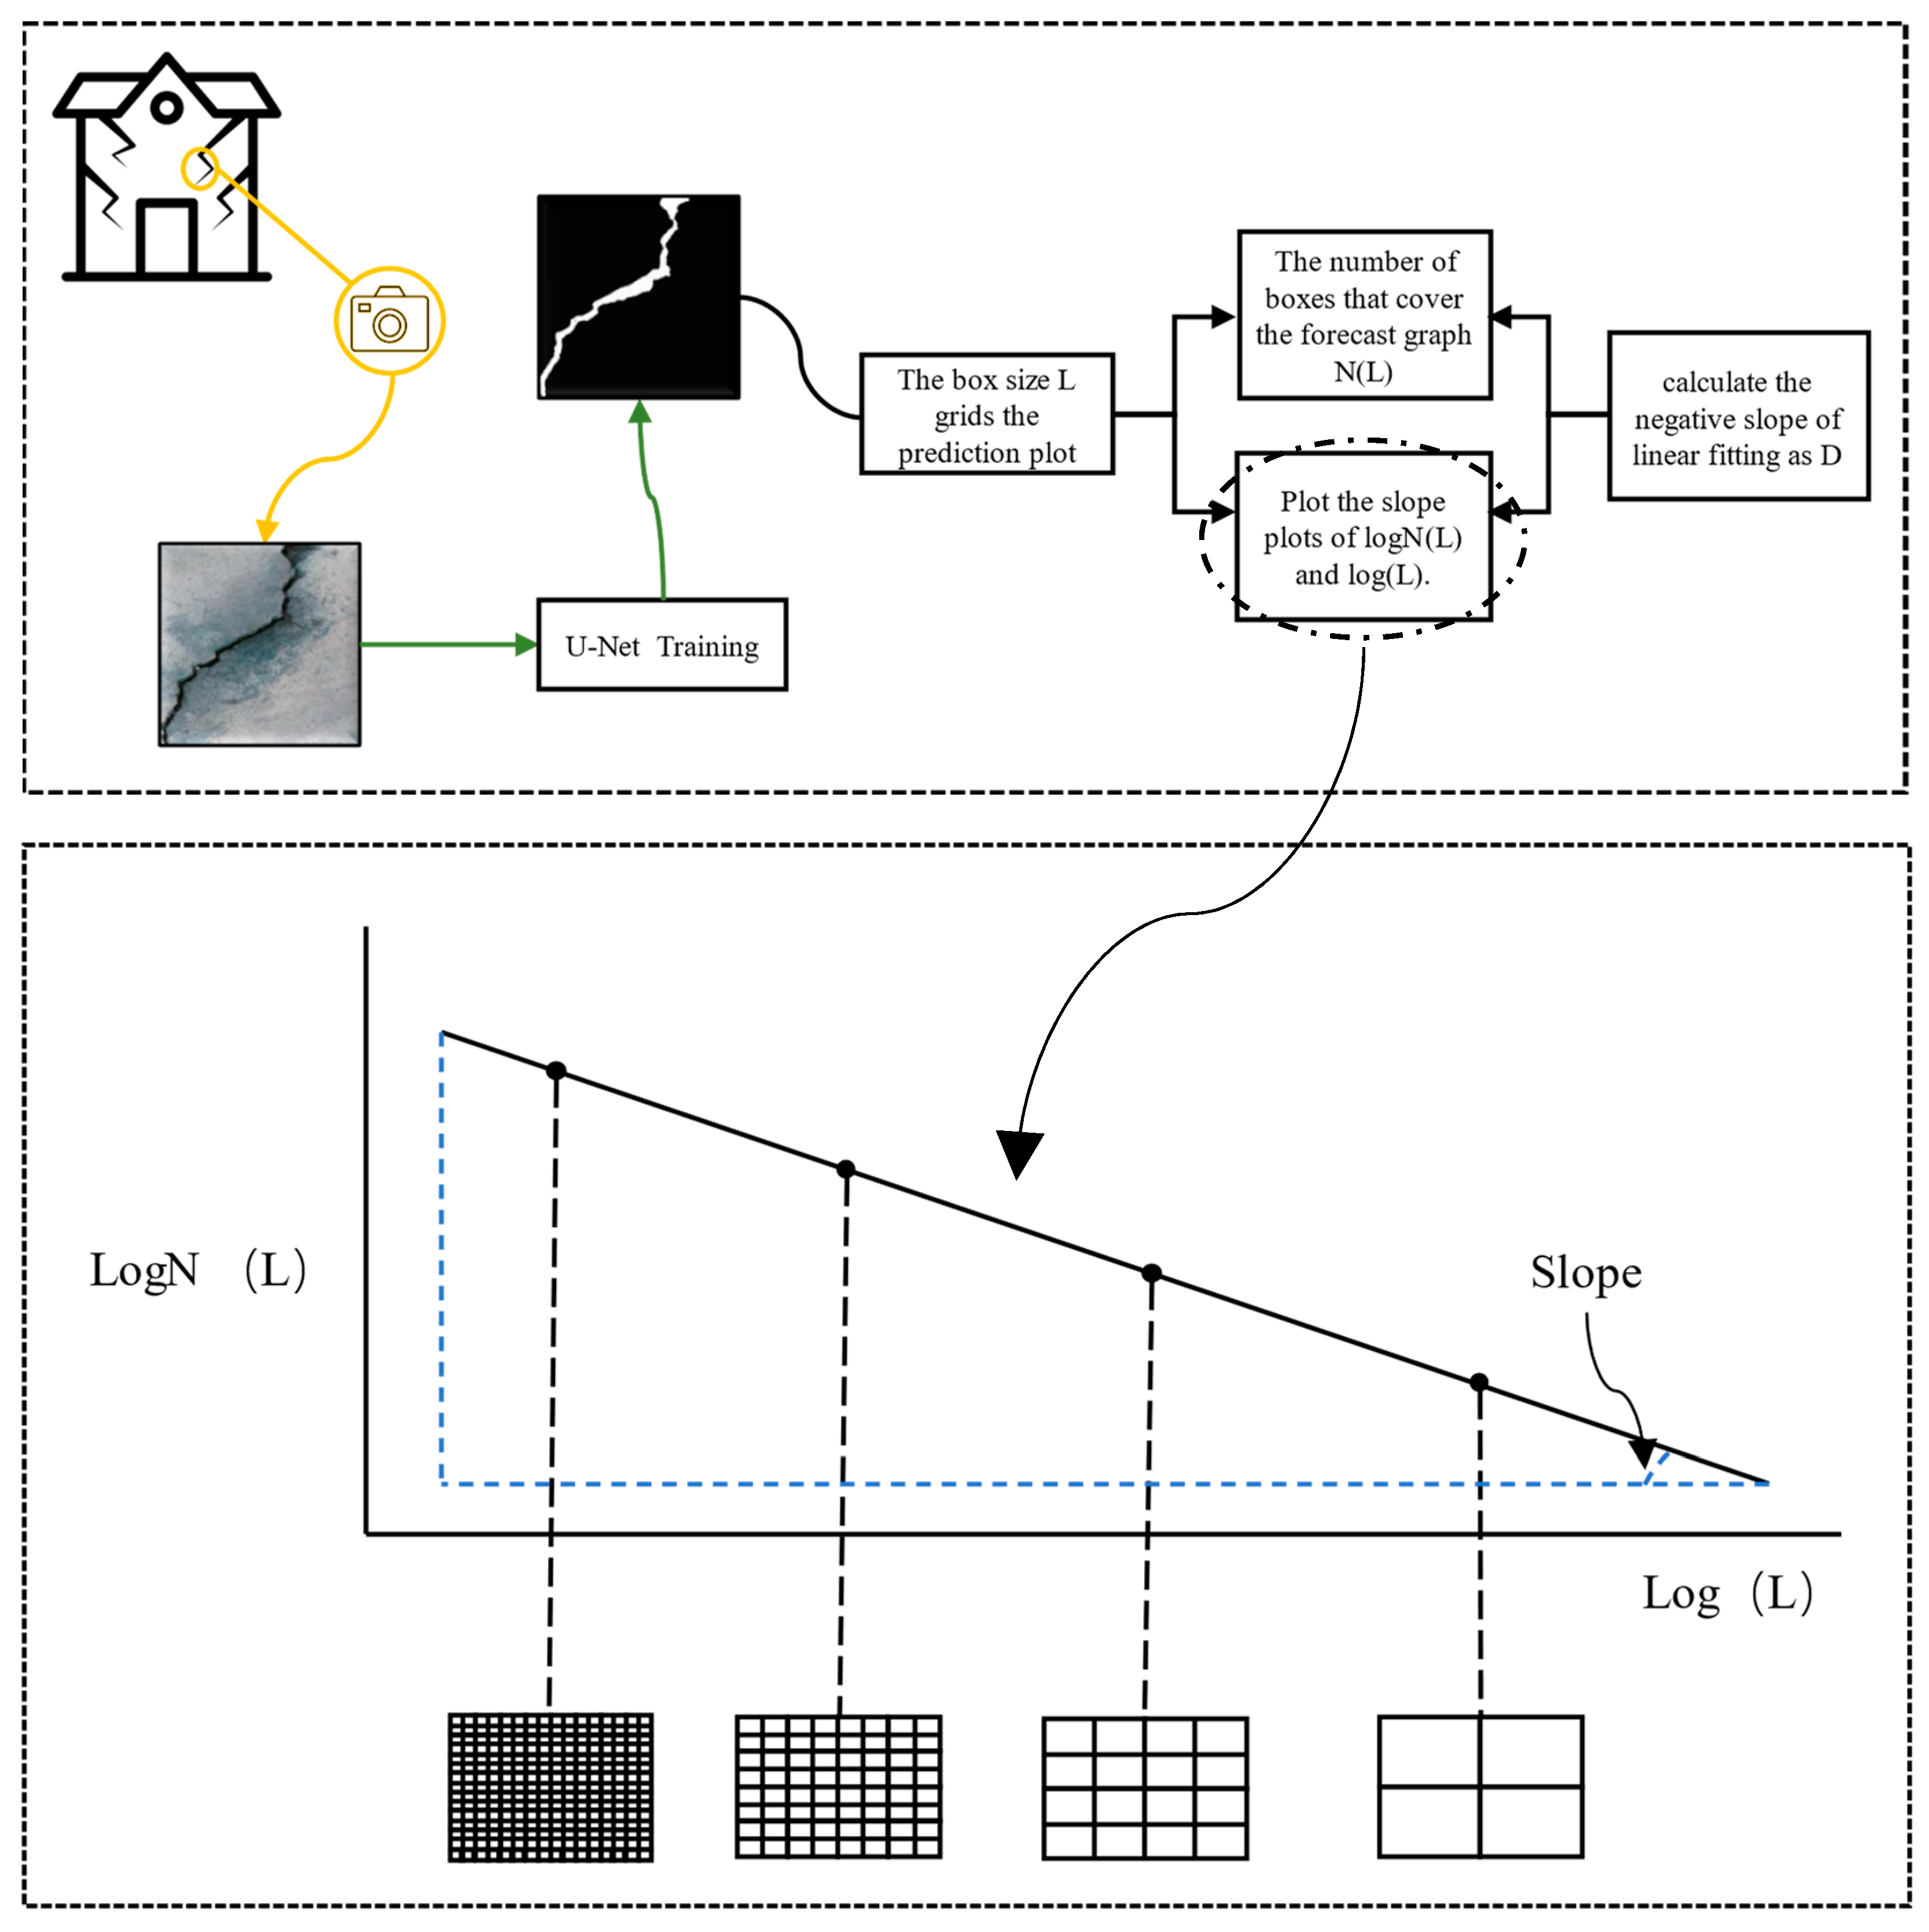
2.3. U-Net Semantic Segmentation

The U-Net architecture demonstrates exceptional performance in crack detection tasks, primarily attributed to its innovative encoder–decoder structure and skip connection mechanism. Within this framework, the encoder portion effectively captures global contextual information of image data through a continuous downsampling process, which involves the progressive abstraction of feature maps, thereby providing the model with rich semantic information. The decoder portion employs an upsampling strategy to restore the detailed aspect of the image, ensuring precise reconstruction in terms of spatial resolution. The skip connection strategy facilitates the integration of feature maps between the encoder and the decoder. This integration mechanism not only preserves the deep-level features extracted from the encoder but also incorporates the shallow-level features from the decoder, thereby achieving precise localization of crack areas at the feature level. This significantly enhances the model’s ability to distinguish between crack and non-crack regions, especially when the crack features are highly similar to the background features. The U-Net can still accurately identify the presence of cracks.
Furthermore, the structural design of the U-Net enables the model to balance global and local information when processing images, effectively enhancing the accuracy of crack detection. In the application of crack detection, this capability is crucial for extracting the specific contours of cracks, assessing crack dimensions and morphology, and providing a reliable foundation for subsequent damage assessment.
In this study, the Labelme4.5.6 software is utilized to meticulously annotate the crack regions within the dataset and convert them into PNG format for subsequent processing. Subsequently, a total of 320 images are allocated to the training set, 40 images to the validation set, and an additional 40 images to the test set. The images in the training and validation sets are employed to train the U-Net model, thereby enabling it to learn the characteristics of cracks and to fine-tune the model’s hyperparameters. Upon completion of the model training, the test set is introduced to evaluate the performance of the U-Net model, culminating in the output of the predicted results.
Figure 3 shows the crack images extracted by U-Net and traditional local threshold binarization prediction under various noise interference. In Figure 3a, the dark noise around the crack is associated with the crack, and its color is similar to that of the crack; in Figure 3b,c, the crack appears on a rough surface and there are small impurities inside the crack; in Figure 3d, the crack is small and the overall shape of the crack shows a ‘Y’-shaped bifurcation; and, in Figure 3e, there is a shadow interference caused by the strong light around the crack. Figure 3 indicates that the traditional local threshold binarization shows the wrong prediction under the interference of dark noise. In the rest of the interference, both U-Net and traditional local threshold binarization can detect the rough crack contour. However, in terms of details, some noise points in the image predicted by the traditional method are still not filtered, while the prediction effect of U-Net is better than that of the traditional method. Therefore, under the interference of different factors, the trained U-Net model can more accurately predict and extract cracks, indicating that the model has good robustness and accuracy, which can improve the accuracy and efficiency of subsequent crack fractal analysis.

2.4. U-Net Evaluation Criteria

In the crack segmentation task, crack pixels are defined as positive samples and non-crack pixels are defined as negative samples. In order to systematically evaluate the performance of the crack detection algorithm in this study, we adopted three core evaluation indicators: precision rate (Pr), recall rate (Re), and F1 score (F1), which are defined as follows:
P r = T P T P + F P
R e = T P T P + F N
F 1 = 2 × P r × R e P r + R e
where TP refers to the number of true positive crack identifications, FP refers to the number of false positive crack identifications, and FN refers to the number of false negative crack identifications.
As shown in Table 2, we quantitatively compare U-Net with traditional local threshold binarization. Evidently, in crack prediction and extraction, U-Net is superior to traditional local threshold binarization in three indicators.

3. Fractal Fusion

3.1. Fractal Dimension of a Crack

Fractals are a mathematical science proposed by the French mathematician Mandelbrot and are an effective method for specializing in irregular problems. This branch of mathematics was founded in the 1970s to study the irregularities and disorderly phenomena in nature and was soon used to study the microscopic structure of materials and their deformation characteristics [13]. Fractal dimension is a generalization of the traditional concept of dimensionality (i.e., integer dimension), which provides a new perspective to measure the characteristics of complex forms in nature and can more accurately describe objects with self-similarity and complex structures than integer dimensionality, especially when dealing with natural phenomena [14].
At present, there are various methods to calculate the fractal dimension, among which the box dimension is widely used to calculate the fractal dimension of cracks, as shown in Figure 4. The complexity of an object can be effectively captured by the number of minimum boxes (or unit squares) required to cover it, which can effectively capture the details and structural features of the object [15]. This method is particularly suitable for the analysis of complex morphologies such as damage cracks. Because cracks often exhibit self-similar characteristics and have multi-stage complex structures, the calculation formula of box dimension in the study of damaged cracks is as follows:
D = log N ( L ) log ( L )
where D is the box dimension of the damage crack distribution sought; L is the side length of the square box; N(L) is the number of boxes required to cover the damage crack distribution with a box with an edge length of L.
By constantly changing the box size to change the total number of boxes covering the graph, the logN(L)–log(L) relationship curve is plotted, and, if the curve satisfies the linear relationship, it is proved that the graph has self-similarity, which can be studied by using the fractal geometry theory. In the damage study of concrete specimens, the larger the fractal dimension, the more significant the damage degree and the more complex the crack distribution.

3.2. The Relationship between Fractal Dimension and Damage Degree of Concrete Members

The fractal dimension, as a metric tool for characterizing complex geometric structures, plays a crucial role in the field of concrete damage identification by quantifying the complexity of crack development, and an increase in the fractal dimension is usually closely related to porosity and crack propagation in concrete materials. As the level of damage increases, the fractal dimension shows a corresponding increase, a phenomenon that reveals the evolution of the internal microstructure of the material. Therefore, the fractal dimension not only provides an effective quantitative index for the NDT technique but also has an important reference value for assessing the mechanical properties and durability of concrete.
The propagation of cracks and the increase in the degree of damage within the concrete material are often closely related to the increase in loading. The microstructure of concrete undergoes significant changes as a result of the continuous application of loads, resulting in the morphology and distribution of cracks becoming more complex. In this process, the fractal dimension (D) of cracks shows a tendency of gradual increase. To quantitatively describe the degree of damage to concrete components, this study introduces the concept of damage index (DI). The damage index DI is a dimensionless parameter that can comprehensively reflect the damage state of concrete materials under the action of loading. The damage index DI can be expressed as follows:
D I = D i D 1 2 D 1 ,   0 D I < 1
where Di is the fractal dimension of the current state of the visible crack; D1 is the fractal dimension when the crack first becomes visible. According to the relevant literature and experimental research, the value of D1 in this paper is set to 1.05, which reflects the fractal characteristics of the initial state of the crack. DI describes the difference between the current state of the crack pattern and the initial state D1, which characterizes the degree of damage to the concrete member and takes values between 0 and 1, where 0 indicates that the concrete member is in the ideal state of no damage, and 1 corresponds to the fractal dimension of the crack pattern reaching the theoretically possible value; i.e., the cracks completely cover the concrete surface. The constant ‘2’ in the denominator is the maximum value of the fractal dimension of the surface cracks (i.e., D tends to 2 when the cracks cover the entire surface of the concrete) [16].
To facilitate the rapid application of practical engineering, the damage grades of concrete components characterized by damage index DI are divided into four empirical levels, as shown in Table 3.
To intuitively understand the relationship between fractal dimension and the degree of damage to concrete components, it is natural to verify it with studies in the relevant literature. It is important to note that, although a large number of experimental studies of concrete members have been reported in the literature, not all studies have provided both pictures of crack patterns and results of loading history. Therefore, this study can only rely on the limited experimental literature on concrete cracks for fractal analysis. The experimental data we collected from the published studies are shown in Table 4 and processed following the process shown in Figure 4 to obtain the fractal dimension D of the concrete member. Similarly, due to limited resources, this study only analyzes the two typical components, columns and beams, while ignoring the details of reinforcement and side effects, and derives the corresponding damage grades by fractal analysis of the collected experimental data. Finally, a linear regression equation between the crack fractal dimension D and the damage index DI of reinforced concrete components was constructed, and the damage index was predicted by linear regression for damage assessment.

3.2.1. The Relationship between the Fractal Dimension of Cracking of Concrete Columns and the Degree of Damage

In this paper, the experimental data of Yin et al. (2014) [17] are used as an example of data processing. The calculation steps of the fractal dimension are shown in Figure 4, and Figure 5 shows the crack development process on one side of a typical reinforced concrete column. As illustrated, the image size of Figure 5d is 192 × 384 pixels, which is enlarged on the left side to show the iterative process of box segmentation, changing the total number of boxes covering cracks N(L) by continuously changing the side length L of the square box and plotting the logN(L)–log(L) linear fitting curve. The absolute value of its slope is the crack fractal dimension D. The results of crack fractal dimension D and damage index D I at different development stages are shown in Table 5, and it can be seen that the crack fractal dimension D and damage index DI show a linear trend.

3.2.2. The Relationship between the Fractal Dimension of Cracking of Concrete Beams and the Degree of Damage

Experimental data from Zang (2007) [18] were used as data processing examples. Figure 6 shows the development of cracks in a typical reinforced concrete beam during loading. As an illustration, the image size of Figure 6d is 128 × 900 pixels, which is enlarged on the left side to show the iterative process of box segmentation. By continuously changing the side length L of the square box to change the total number of boxes covering the crack, N(L), and plotting the logN(L)–log(L) linear fitting curve, the absolute value of its slope is the crack fractal dimension D. The results of crack fractal dimension D and damage index DI at different development stages are shown in Table 6, and it can be seen that there is a positive correlation between crack fractal dimension D and damage index DI.

3.2.3. Establishment of Regression Models

In addition to the data from Yin et al. [17] and Zang [18], experimental data from Xing et al. [19], Biolzi et al. [20], and Saghafi et al. [21] were processed using the same procedure. A total of 70 DI-D data points obtained are shown in Figure 7, and a linear fit was performed on the damage index DI and fractal dimension D of these reinforced concrete members.
Many factors affect the development of cracks on the concrete surface and the corresponding fractal characteristics, such as the type of loading, the details of the reinforcement, the size effect, etc. In addition, the accurate calculation of the fractal dimension may also be affected by the noise in the crack image; however, the U-Net framework used in this study effectively segmented the crack, which significantly reduced the negative impact of noise on the calculation of the fractal dimension. Due to the limitations of the current literature, this study mainly focuses on the analysis of two concrete components, beams, and columns, and fails to fully consider other potential influencing factors, such as detailed reinforcement and site effects, which may cause a certain deviation in the accuracy of damage classification, but, with the continuous accumulation of data of similar structural components, the regression model between fractal dimension and damage index can be continuously optimized, which can improve the accuracy of damage assessment. Evident from Figure 7, there is a linear relationship between the fractal dimension and the damage index, which verifies that the four empirical levels considered for the damage representation of concrete components by the damage index DI proposed in this paper are feasible.

4. Damage Assessment Method Based on Fractal Dimensions of Surface Cracks

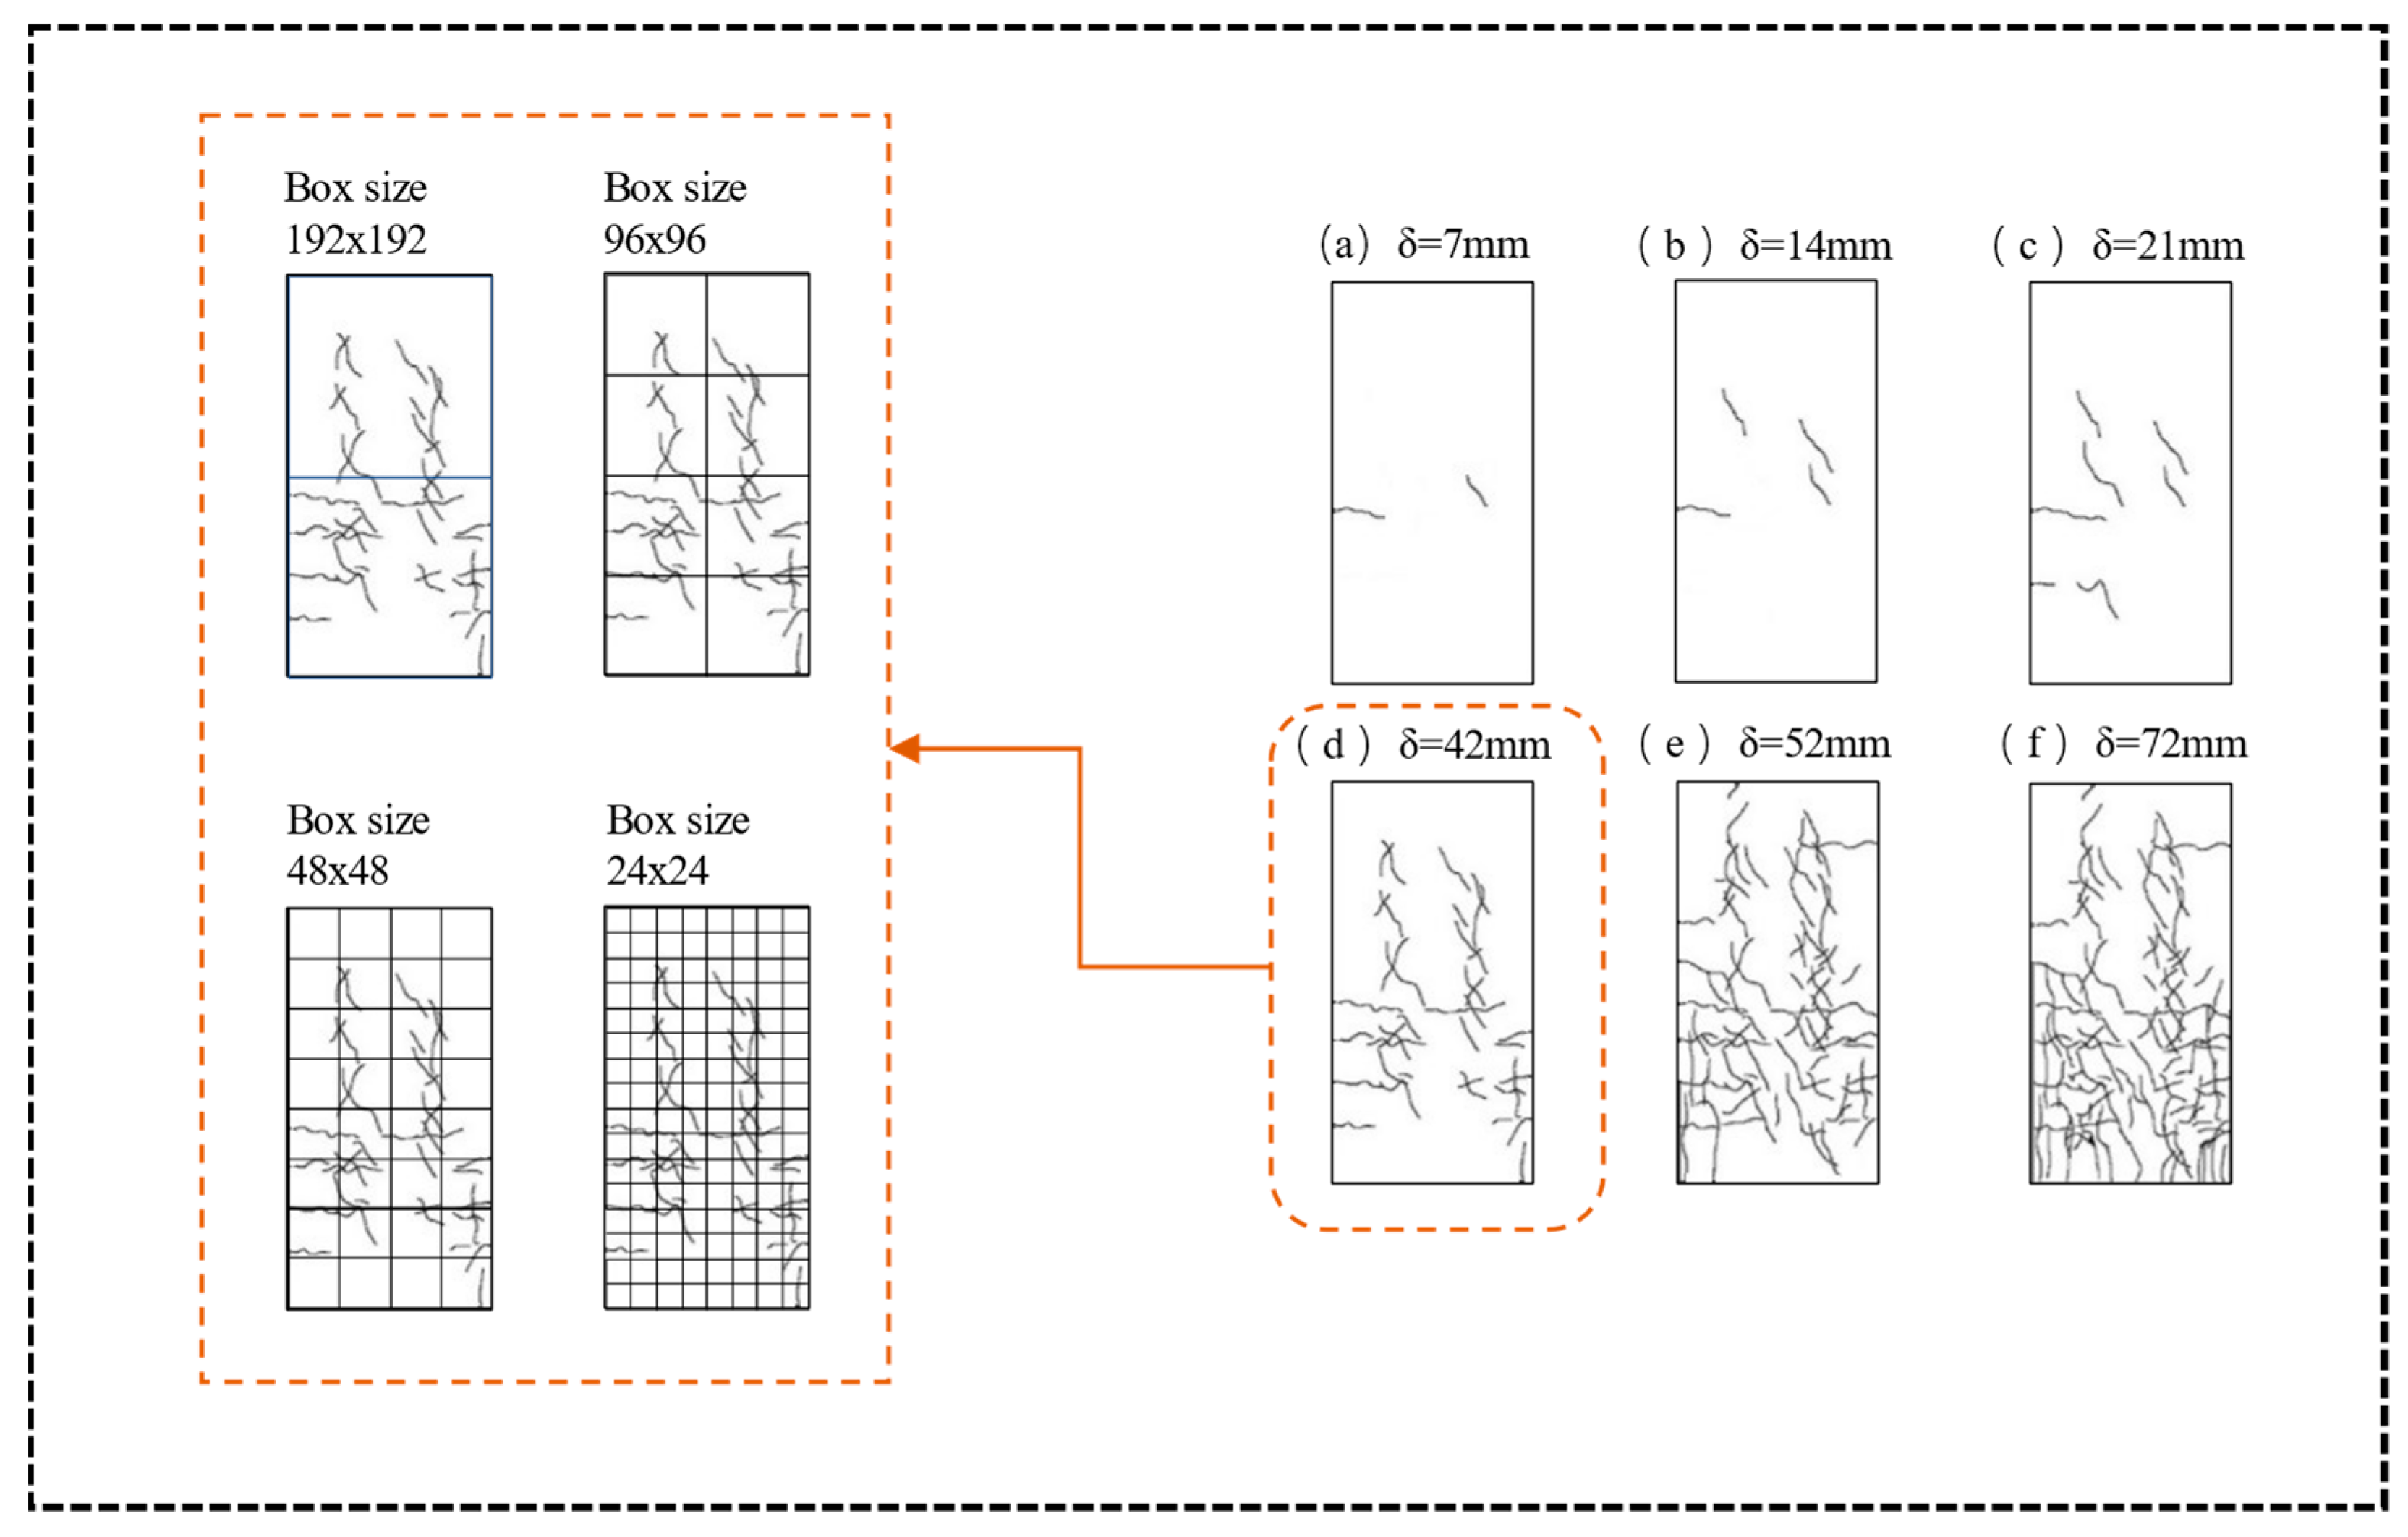
4.1. Boundary Fractal Dimension

The degree of damage to concrete components is expressed by the damage index DI, which can be divided into four grades, and the corresponding critical fractal dimension D is calculated according to Equation (2). The calculated critical fractal dimension D can be used as the boundary fractal dimension D for the classification of different damage levels of concrete components. The resulting values for boundary D corresponding to the different damage classes are shown in Table 7. Table 7 can be updated when new fractal data are available for concrete components for more accurate damage classification.

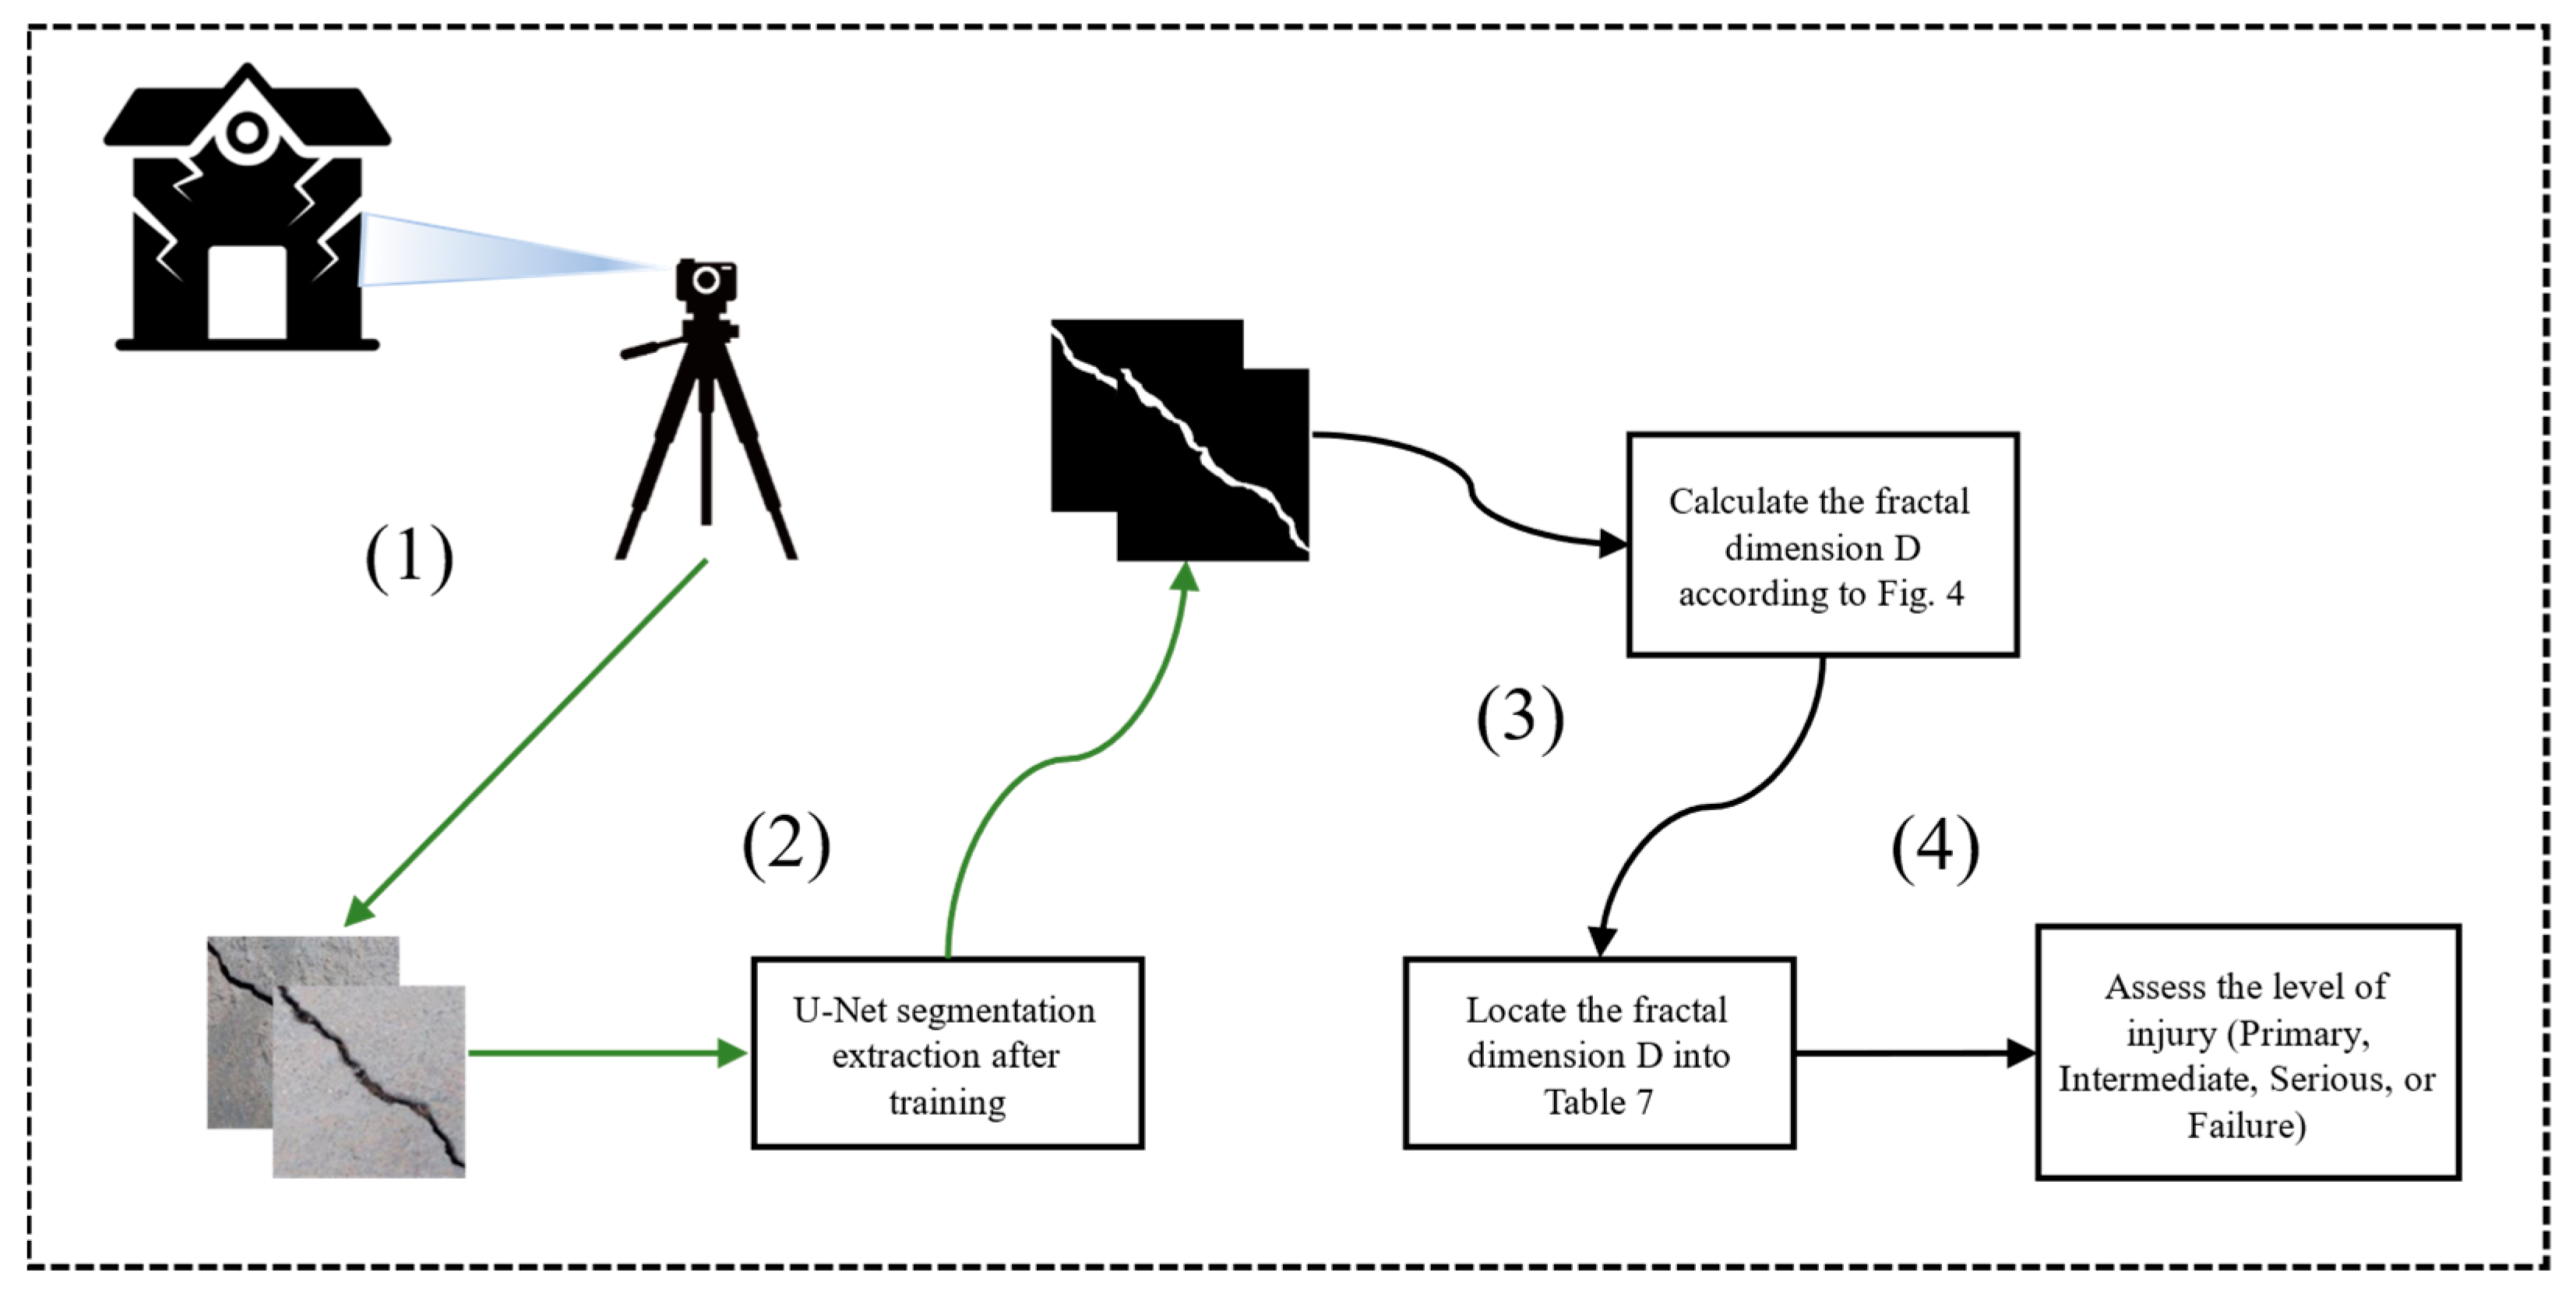
4.2. Concrete Component Damage Assessment Procedure

The proposed damage assessment method for concrete components is shown in Figure 8, which comprises (1) obtaining surface crack images of concrete components with a camera or mobile phone from the disaster site or laboratory test; (2) the crack image is input into the trained U-Net architecture for crack segmentation and extraction, and the crack binary image is output; (3) the fractal dimension D of the surface crack of the concrete component is calculated using the method described in Figure 4; and (4) the calculated fractal dimension D is positioned in Table 7 for the damage classification of concrete components.

4.3. Damage Assessment and Verification of Concrete Components

To verify the applicability of the proposed damage assessment method for concrete components, the full-scale test data of the RC shear wall beam components of Liu et al. [6] were used as a comparative example to verify the application. It is worth noting that, in this study, only the crack images and damage classification data of the concrete components in the test of Liu et al. were used for the comparison.
Figure 9 shows the crack development of the beam members in different loading stages and the iterative process of box segmentation, and the results of crack fractal dimension D and damage index DI in different loading stages are shown in Table 8. Based on the U-Net damage assessment method and the local threshold damage assessment method proposed in this study, the damage degree of the beam at different loading stages was classified and compared with the actual damage degree of the beam in the Liu et al. (2021) test. The classification results and comparison results are shown in Table 9.
The analysis of Table 9 shows that the damage assessment method based on U-Net achieves an overall accuracy of 83.33%, and there is only one prediction error among the six load types. In the case of wrong prediction, the fractal dimension D is close to its boundary value, which is consistent with the critical point between the adjacent damage levels. The damage assessment method based on the local threshold achieves an overall accuracy of 66.67%. Moreover, because the noise of the crack image processed by the local threshold is more than that predicted by U-Net, the fractal dimension based on the local threshold is generally larger than that based on U-Net. Consequently, it can be concluded that the U-Net-based damage assessment method exhibits superior robustness in crack extraction and higher accuracy in building damage assessment compared to the traditional local-threshold-based method.

5. Conclusions

Based on U-Net and fractal theory, this paper studies the relationship between the crack fractal dimension (D) and damage index (DI) of concrete components and proposes a damage assessment method for concrete components based on crack fractal characteristics. The main conclusions of this study are summarized as follows:
(1)
In this study, the U-Net deep learning model was introduced and subjected to a quantitative comparative analysis with the traditional local thresholding method. The results of the analysis demonstrated that the U-Net model outperformed the traditional local thresholding method across key performance metrics, including precision (Pr), recall (Re), and F1 score. The superiority of these metrics indicates that the U-Net model possesses greater robustness in crack detection tasks. Consequently, the crack damage information extracted using the U-Net model more accurately reflects the actual damage condition of concrete structural components.
(2)
The empirical relationship between the fractal characteristics of surface cracks and the damage degree of concrete components is proposed, which provides a concise and efficient tool for the structural damage assessment of concrete components. To improve the accuracy of damage assessment, quantitative relationships can be continuously optimized by following steps similar to those in this study, and more experimental data can be supplemented.
(3)
Upon the comparative analysis of the damage classification results from experiments utilizing the U-Net deep learning model and traditional local thresholding methods, it has been observed that the accuracy of the damage classification based on the U-Net model significantly surpasses that of the traditional local thresholding. This enhancement in performance underscores the superior efficacy and precision of the U-Net model, thereby validating its robustness in the context of crack detection. Consequently, the application of the U-Net model in the assessment of damage to concrete structures presents a more accurate reflection of the actual condition of the structural integrity, suggesting a promising application potential within the field of concrete structural damage assessment.
The damage assessment method of concrete components based on the combination of U-Net and crack fractal features proposed in this study is mainly based on limited relevant test data. The accuracy of this method is expected to be further improved by combining more laboratory tests with field survey data.

Author Contributions

Conceptualization, L.Y. and M.X. (Mengqi Xu); Methodology, Z.W. and F.X.; Validation, F.X. and X.W.; Writing—original draft, Z.W. and X.W.; Writing—review and editing, M.X. (Ming Xie) and L.Y. All authors have read and agreed to the published version of the manuscript.

Funding

This research received no external funding.

Data Availability Statement

All data generated or analyzed during this study are included in this published article.

Conflicts of Interest

The authors declare no conflicts of interest.

References

  1. Alaskar, A.; Alqarni, A.S.; Alfalah, G.; El-Sayed, A.K.; Mohammadhosseini, H.; Alyousef, R. Performance evaluation of reinforced concrete beams with corroded web reinforcement: Experimental and theoretical study. J. Build. Eng. 2021, 35, 102038. [Google Scholar] [CrossRef]
  2. Yin, Y.; Ren, Q.; Lei, S.; Zhou, J.; Xu, L.; Wang, T. Mesoscopic crack pattern fractal dimension-based concrete damage identification. Eng. Fract. Mech. 2024, 296, 109829. [Google Scholar] [CrossRef]
  3. Carrillo, J.; Avila, W. Assessment of seismic damage of thin and lightly reinforced concrete walls using the fractal dimension of cracking. Earthq. Eng. Struct. Dyn. 2017, 46, 661–675. [Google Scholar] [CrossRef]
  4. He, H.; Tian, S.; Zhang, Y. Refined fatigue damage assessment of RC beam based on fractal characteristics of cracks. Structures 2022, 46, 1595–1603. [Google Scholar] [CrossRef]
  5. Dolatshahi, K.M.; Beyer, K. Stiffness and strength estimation of damaged unreinforced masonry walls using crack pattern. J. Earthq. Eng. 2022, 26, 837–856. [Google Scholar] [CrossRef]
  6. Liu, Y.; Dai, K.; Li, D.; Luo, M.; Liu, Y.; Shi, Y.; Xu, J.; Huang, Z. Structural performance assessment of concrete components based on fractal information of cracks. J. Build. Eng. 2021, 43, 103177. [Google Scholar] [CrossRef]
  7. Woods, J.E.; Yang, Y.S.; Chen, P.C.; Lau, D.T.; Erochko, J. Automated crack detection and damage index calculation for RC structures using image analysis and fractal dimension. J. Struct. Eng. 2021, 147, 04021019. [Google Scholar] [CrossRef]
  8. An, Q.; Chen, X.; Wang, H.; Yang, H.; Yang, Y.; Huang, W.; Wang, L. Segmentation of concrete cracks by using fractal dimension and UHK-net. Fractal Fract. 2022, 6, 95. [Google Scholar] [CrossRef]
  9. Hamidia, M.; Ganjizadeh, A. Post-earthquake damage evaluation of non-ductile RC moment frames using surface crack patterns. Struct. Control Health Monit. 2022, 29, e3024. [Google Scholar] [CrossRef]
  10. Jin, Z.; Xie, F.; Yang, T.; Han, X.; Chen, X.; Zhang, Y. Fractal dimension analysis of concrete specimens under different strain rates. J. Build. Eng. 2023, 76, 107044. [Google Scholar] [CrossRef]
  11. Yang, Y.; Zhao, Z.; Su, L.; Zhou, Y.; Li, H. Research on pavement crack detection algorithm based on deep residual UNET neural network. J. Phys. Conf. Ser. 2022, 2278, 012020. [Google Scholar] [CrossRef]
  12. Xu, H.; Su, X.; Wang, Y.; Cai, H.; Cui, K.; Chen, X. Automatic Bridge Crack Detection Using a Convolutional Neural Network. Appl. Sci. 2019, 9, 2867. [Google Scholar] [CrossRef]
  13. Mandelbrot, B.B.; Passoja, D.E.; Paulley, A.J. Fractal character of the fracture surface of metals. Nature 1984, 308, 721–722. [Google Scholar] [CrossRef]
  14. Carpinteri, A.; Chiaia, B.; Cornetti, P. A fractal theory for the mechanics of elastic materials. Mater. Sci. Eng. A 2004, 365, 235–240. [Google Scholar] [CrossRef]
  15. Cherepanov, G.P.; Balankin, A.S.; Ivanova, V.S. Fractal fracture mechanics—A review. Eng. Fract. Mech. 1995, 51, 997–1033. [Google Scholar] [CrossRef]
  16. Farhidzadeh, A.; Dehghan-Niri, E.; Moustafa, A.; Salamone, S.; Whittaker, A. Damage assessment of reinforced concrete structures using fractal analysis of residual crack patterns. Exp. Mech. 2013, 53, 1607–1619. [Google Scholar] [CrossRef]
  17. Yin, X.; Lü, X.; Lu, W. Resilience model of SRC columns with cross-shaped encase steel. Eng. Mech. 2014, 31, 97–103. [Google Scholar]
  18. Zang, P. The Experimental Study on Bending Behavior of RC Beams with 500 MPa Steel Bar. Master’s Thesis, Hebei University of Technology, Tianjin, China, 2007. [Google Scholar]
  19. Xing, G.; Ozbulut, O.E. Flexural performance of concrete beams reinforced with aluminum alloy bars. Eng. Struct. 2016, 126, 53–65. [Google Scholar] [CrossRef]
  20. Biolzi, L.; Cattaneo, S. Response of steel fiber reinforced high strength concrete beams: Experiments and code predictions. Cem. Concr. Compos. 2017, 77, 1–13. [Google Scholar] [CrossRef]
  21. Hossein Saghafi, M.; Shariatmadar, H. Enhancement of seismic performance of beam-column joint connections using high-performance fiber reinforced cementitious composites. Constr. Build. Mater. 2018, 180, 665–680. [Google Scholar] [CrossRef]
Figure 1. U-Net training architecture.
Buildings 14 03262 g001
Figure 2. Schematic diagram of U-Net training.
Buildings 14 03262 g002
Figure 3. Examples of cracks predicted by U-Net: (a) dark noise-exposed surface, (b) rough surface, (c) impurities in cracks, (d) “Y”-shaped cracks, and (e) sunlight shadow images.
Buildings 14 03262 g003
Figure 4. The fractal dimension calculation process.
Buildings 14 03262 g004
Figure 5. The crack development process of a typical reinforced concrete column.
Buildings 14 03262 g005
Figure 6. The crack development process of a typical reinforced concrete beam.
Buildings 14 03262 g006
Figure 7. DI-D linear relationship of reinforced concrete components [17,18,19,20,21].
Buildings 14 03262 g007
Figure 8. Damage assessment method for concrete components.
Buildings 14 03262 g008
Figure 9. Crack development of beam members at different loading stages (Liu et al. [6]).
Buildings 14 03262 g009
Table 1. The proportions of the training, validation, and testing sets.
Noise TypeTrainingValidationTesting
Rough surface80104
Bright light80104
Dark noise80104
Dirt noise80104
Rough surface + strong light--6
Rough surface + dark noise--5
Rough surface + dirt noise--8
Strong light + crack--5
Total3204040
Table 2. Comparison of U-Net and traditional method.
IndexPrReF1
U-Net0.91370.90680.9102
Partial threshold0.83260.82870.8306
Table 3. Empirical damage levels of concrete components defined by DI.
Damage LevelDamage Index DI
Primary<20%
Intermediate20–50%
Serious50–70%
Failure>70%
Table 4. Detailed information on the concrete components collected.
ReferencesSpecimenSpecimenConstraintsLoading MethodSize
Yin et al. (2014) [17]concrete columns8Top fixed; bottom fixedLow-frequency cyclic loading500 mm × 500 mm
Zang (2007)
[18]
RC beams9Simply
supported
4-point
bending
400 mm × 200 mm
Xing et al. (2016) [19]RC beams11Simply
supported
4-point
bending
200 mm × 120 mm
Biolzi et al.
(2017) [20]
Steel fiber
RC beams
36Simply
supported
4-point
bending
300 mm × 150 mm
Saghafi (2018) [21]Beam–Column joint6Top free; bottom fixedLow-frequency cyclic loading250 mm × 250 mm
Table 5. The fractal dimension and damage index of the specimen shown in Figure 5 at different stages of development.
Development Stageabcdef
Displacement δ (mm)71421425272
Fractal dimension D1.161.251.391.581.721.78
Damage index DI (%)11.621.135.855.870.576.8
Table 6. The fractal dimension and damage index of the specimen shown in Figure 6 at different stages of development.
Development Stageabcdef
Concentrate the load (KN)20406080150190
Fractal dimension D1.141.191.321.451.691.75
Damage index DI (%)9.514.728.442.167.473.7
Table 7. Damage level assessment table of concrete components.
Damage LevelPrimaryIntermediateSeriousFailure
Fractal dimension<1.241.24–1.5251.525–1.715>1.715
Table 8. The fractal dimension and damage index of the specimen shown in Figure 9 at different loading stages.
Development Stageabcdef
Concentrate the load (KN)100.5118147.6184.6205.6221.4
Fractal dimension D1.231.441.491.571.611.77
Damage index DI (%)18.94146.354.758.975.8
Table 9. Damage assessment of beam members of reinforced concrete shear wall–beam assembly.
Load (KN)D Based on U-NetD Based on Local ThresholdBased on U-NetBased on the Local ThresholdActual Damage Level
100.51.231.23PrimaryPrimaryIntermediate
1181.441.46IntermediateIntermediateIntermediate
147.61.491.54IntermediateSeriousIntermediate
184.61.571.60SeriousSerious Serious
205.61.611.63SeriousSeriousSerious
221.41.771.81FailureFailureFailure
Disclaimer/Publisher’s Note: The statements, opinions and data contained in all publications are solely those of the individual author(s) and contributor(s) and not of MDPI and/or the editor(s). MDPI and/or the editor(s) disclaim responsibility for any injury to people or property resulting from any ideas, methods, instructions or products referred to in the content.

