Article

New Buckling Curve for a Compressed Member with Cold-Formed Channel Cross-Section

by
Bálint Vaszilievits-Sömjén
1,* and
Ferenc Papp
2
1
Doctoral School of Multidisciplinary Engineering Sciences, Széchenyi István University, 9026 Győr, Hungary
2
Department of Structural and Geotechnical Engineering, Széchenyi István University, 9026 Győr, Hungary
*
Author to whom correspondence should be addressed.
Buildings 2024, 14(10), 3258; https://doi.org/10.3390/buildings14103258
Submission received: 2 September 2024 / Revised: 8 October 2024 / Accepted: 10 October 2024 / Published: 15 October 2024
(This article belongs to the Section Building Structures)

Abstract

The verification of a column made from a lipped cold-formed channel section, subjected to pure axial compression relative to the gross cross-section, often results in a combined verification of bending and compression due to the appearance of a shift of the centroid of its effective cross-section. Following Eurocode 3 rules, this requires the determination of two distinct effective cross-sections and various interaction factors. This paper, based on an analytic approach, offers a modification to the actual buckling curve, based on Ayrton–Perry formulation, to include the second-order effects raised by the eventual shift of the effective centroid due to local buckling of the compressed web plate. This eliminates the need to use an interaction formula. The modified buckling curve is verified based on a GMNIA analysis performed on a numerical parametric model, which was previously validated by laboratory tests. In addition, the results are compared with strength results provided by appropriate Eurocode 3 formulas and AISI Direct Strength Method for global-local interaction and with classic experimental results.

1. Introduction

1.1. General

Cold-formed sections are often used in steel constructions due to their favorable characteristic, such as low self-weight and built-in corrosion protection. A factor that prevents their even wider use is the associated complex design process. Sophisticated finite element software and analysis methods like GMNIA are readily available for researchers to accurately predict the load-bearing capacity, but the tools available for practitioners are very limited.
Compressed members made of thin-walled, cold-formed, lip-shaped channel sections are prone to global, local, and distortional buckling failure modes. The global buckling mode can take the form of flexural buckling around the major or minor axis, or torsional buckling mode, depending on the cross-sectional dimensions and boundary conditions of the member. C-sections with commonly used geometries have slender web plates that are highly exposed to local buckling unless web stiffeners are used.
Eurocode 3 [1] provides a general, section-type-independent, approximate but very complex calculation method for the design even of the simplest possible application, the simple supported centrically compressed member with lipped channel section.
In the following paper, centric compression will be associated with a stress distribution relative to the center of gravity of the gross cross-section of the member. Such stress distribution in most cases will turn to be eccentric to the effective cross-section. As a result, the traditional design of a centrically compressed member in practice becomes an interactive check for compression and bending moments, where the bending moment is the result of the internal eccentricity of applied stresses.
This paper proposes a modified buckling curve to cover the case of centrically compared members, which can be implemented in software packages for everyday structural engineering. It is valid for a practical range of lipped channels with slender web plates and provides a simple solution with the use of a modified Ayrton–Perry-type buckling curve, which incorporates the effects due to the interaction of both global (member, overall) and local buckling, considering also the effect of the shift of the effective centroid.
The buckling curve is developed for pinned-pinned-ended members but can also be used as a conservative solution for members with other boundary conditions using the appropriate effective length.

1.2. Literature Review

Due to their high width-per-thickness ratio, compressed plates of cold-formed profiles are prone to local buckling. Compressed plates of a profile are, as a simplification, handled individually, disregarding any existing interaction between them. When the longitudinal compressive stress reaches the elastic critical stress of an individual plate supported along at least one of its edges, in general, it does not mean reaching the load-bearing capacity. By further increasing the load acting on the plate, post-critical stress distribution can be formed. Instead of directly considering for the design calculation the actual post-critical stress distribution, effective widths are used by most design standards. The determination of the effective widths is generally based on the work of Winter [2]. The effective critical stresses are traditionally determined using equations, assuming pinned-pinned boundary conditions along the edges where they meet other plates of the cross-section. With the evolution of software solutions, a very convenient option based on finite strip analysis became readily available to determine critical stresses considering also the connectivity of adjacent plates of the cross-sections, as shown by Cheung [3]. Miller et al. [4] have analyzed the interaction of plates and determined plate slenderness limits to differentiating web-induced and flange-induced buckling for both plain and lipped channel sections. They concluded that the capacity of the whole cross-section is often influenced by the buckling characteristic of just a single plate, although for more complex profiles composed of several plates, the interaction of more than one plate can contribute to the load-bearing capacity of the member.
Szalai [5] proposed an assignment method that can assign global buckling modes calculated on the entire structure to its individual members based on studying induced deformation energy. This method can also be successfully applied analogically for the plates of a cross-section, as shown by Vaszilievits [6,7] and later used in this paper.
When the effective cross-section is formed—with or without considering the interaction of plates—the center of gravity usually does not coincide with the position of the centroid of the original gross cross-section. Consequently, compressive loading centric to the gross section’s centroid causes an additional bending moment due to its eccentricity. Young et al. [8] have extensively studied the behavior of compressed plain and lipped channels. It has been shown that although the AS/NZS 4600 standard [9] properly predicts the load-bearing capacity of compressed members made of such profiles, they fail to properly quantify the amount of the shift of the effective centroid. Young [10] identifies discontinuities in the effective-width formulation. In some cases, not only the size but even the direction of the shift is incorrectly predicted. A correction to the concerned standard has been proposed. No similar study considering the rules of the Eurocode is known.
Batista [11] has pointed out that the effect of local and overall buckling interaction has a very significant effect on compressed members, mainly in the medium slenderness range.
The interaction of local and overall buckling gives rise to a shift of the effective centroid, which has an elevated importance on the determination of the load-bearing capacity of compressed members with single or monosymmetric sections. Due to the increased importance of the shift of the effective centroid, developers of Eurocode 3 have objections against a new design method called the Direct Strength Method (DSM) [12], which is based on the use of the gross cross-section. It is important to note that, although the consequences of the shift of the effective centroid are of significant importance, there are many other unsolved problem; for example, the interaction of local and distortional buckling, which may give inconsistent results when the Eurocode rules are used, as mentioned by Becque [13]. He concluded that part of the discrepancy comes from the fact that Eurocode 3 normally determines the effective cross-section assuming yield stress instead of the actual stress level. A study by Mulligan et al. [14] recommended an iterative approach that considered the effect of the shift of the effective centroid based on a formula from Timoshenko and Gere [15]. The iterative solution can properly follow the position of the effective centroid at different stress levels. This approach has been further improved by Miller et al. [4] by including the AISI [12] effective-width equations. Becque et al. [16] have also noted the importance of considering the shift of the effective centroid as being responsible for causing a second-order effect on the member level. This has been implemented in EN 1993-1-4 [17] for stainless steel members, similarly to AS/NZS 4673 [18], applicable to stainless steel members.

2. Research Objective and Strategy

The objective of this study is to offer a design possibility that remains fully compatible with the principles of Eurocode 3 [1,19,20], and
  • uses a single effective cross-section determined from the actual stress due to compression and second-order bending moments due to flexural member buckling;
  • considers the proper equivalent second-order effects caused by the shift of the effective cross-section due to local buckling of compressed plates in a way consistent with the direction of the assumed member imperfection;
  • presents these improvements in the form of a new extended Ayrton–Perry-type buckling curve for simple practical use.
Another objective of the present research is to offer a buckling curve for determining the compressive strength of cold-formed, lipped-C-section, pin-supported, and centrally compressed members.
The results obtained using the new buckling curve are compared within a parametric study with results provided by an advanced characteristic numerical model, performed in Abaqus software 6.13 [21], following a GMNIA procedure.
In addition, the results will be also compared to the prediction of the AISI DSM method [12].

3. New Buckling Curve

3.1. Basic Assumptions

The new buckling curve presented in this paper is valid for the following conditions:
  • prismatic members with simple supported boundary conditions,
  • concentric compression applied at the centroid of the cross-section,
  • single-symmetric lipped channels,
  • the web plate of the section can be of Class 4, but not the remaining plates of the cross-section,
  • the overall flexural buckling due to compression happens around the minor principal axis (the displacement is perpendicular to the web plate),
  • the torsional rotations around the reference axis of the member are constrained along the length of the member,
  • the global non-dimensional slenderness of the member λ ¯ is higher than 0.2.

3.2. Mechanics of Centrically Compressed Channel with Slender Web Plates

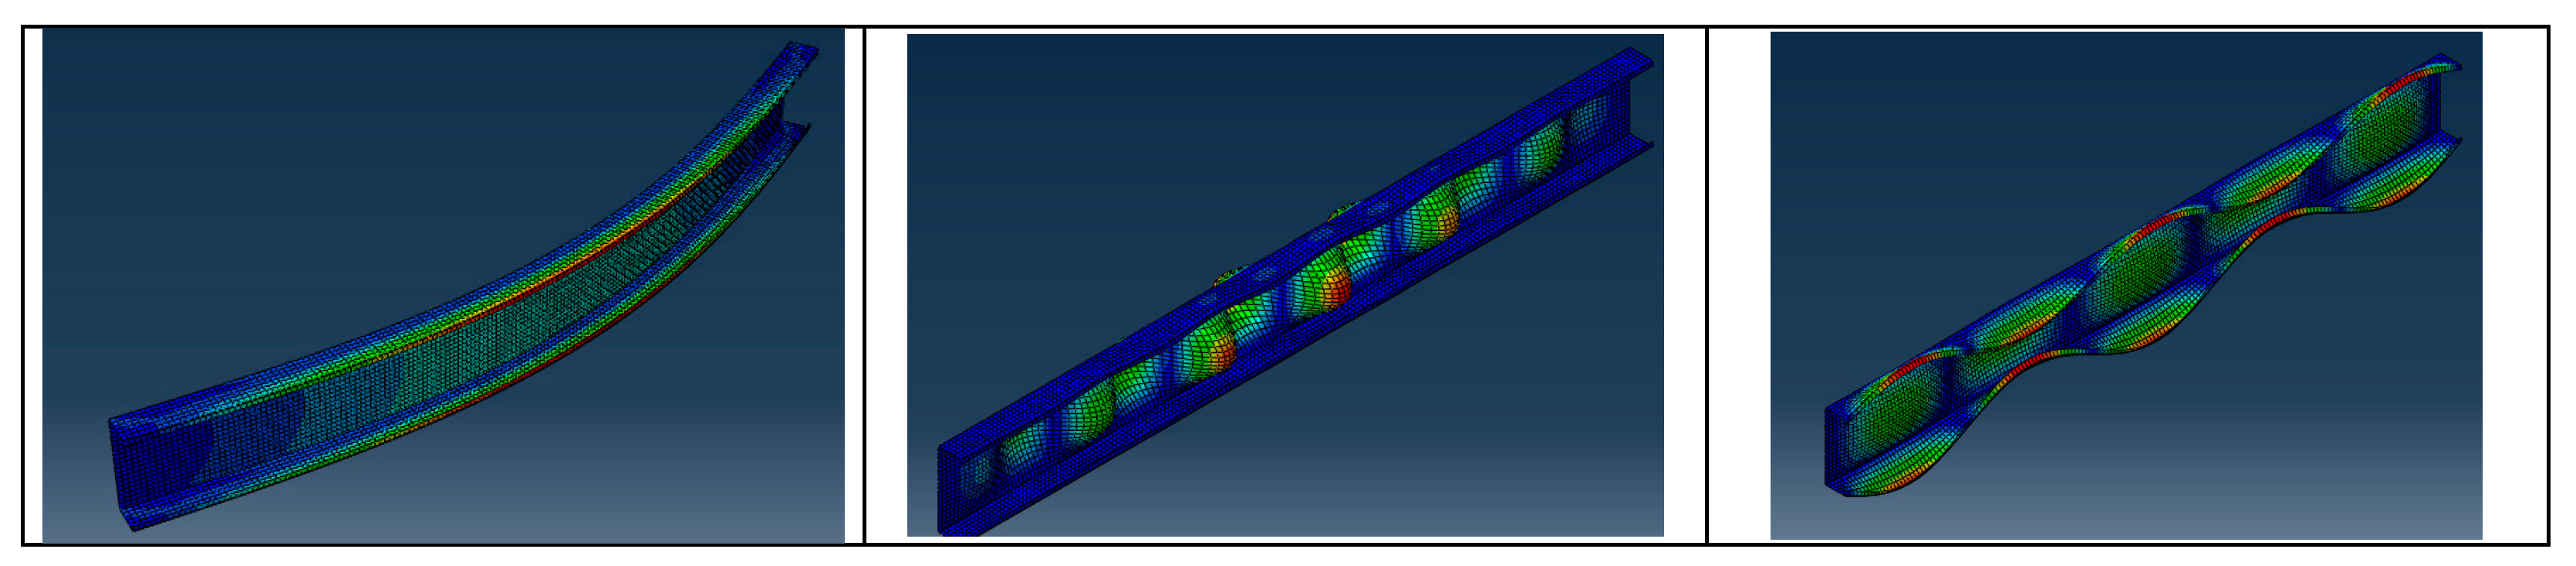
The present paper deals with thin-walled members with slender plates constituting its cross-sections. When local or distortional buckling happens due to the formation of compressive stresses higher than the critical stress of the plates or stiffener zones of the cross-section, an effective cross-section characterized by a shift of the centroid is formed. As the cross-section is singly symmetric about the major axis and the original stress distribution is uniform, the direction of the shift of the effective cross-section is perpendicular to the web plate. This shift of the centroid results in an additional bending moment around the minor axis of the cross-section.
This moment results in a displacement, which is affine with the shape of flexural buckling around the minor axis. In such a case, it is expected that this causes an interaction.
Other flexural buckling modes, such as flexural-torsional or major-axis flexural buckling, are perpendicular to the displacement of the effective centroid and cause no amplified interaction; therefore, they are excluded from this work.
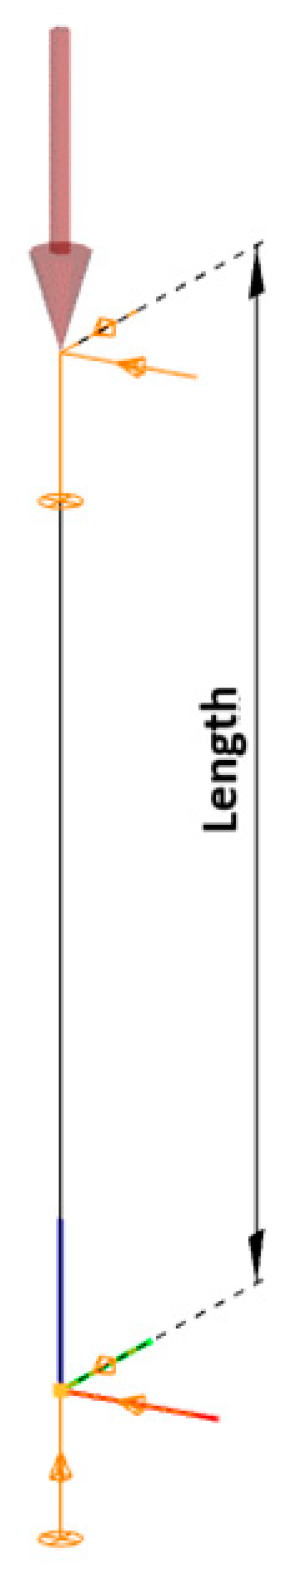
The magnitude of an equivalent imperfection corresponding to flexural buckling can be determined using the Overall Imperfection Method (OIM) by Papp [22]. The direction of the application of the imperfection plays an important role in cases of monosymmetric cross-sections. When this imperfection is assumed to act in the positive direction, the resulting minor-axis bending moment will increase the stresses along the web and may therefore strongly interact with local buckling. If the imperfection is applied in the negative direction, the stresses are increased around the edge stiffener zone, and this may result in an interaction with distortional buckling.
For a typical C-section with an unstiffened and slender web, the controlling case is the positive imperfection causing an increase in compressive stresses in the web. This paper focuses on this scenario.

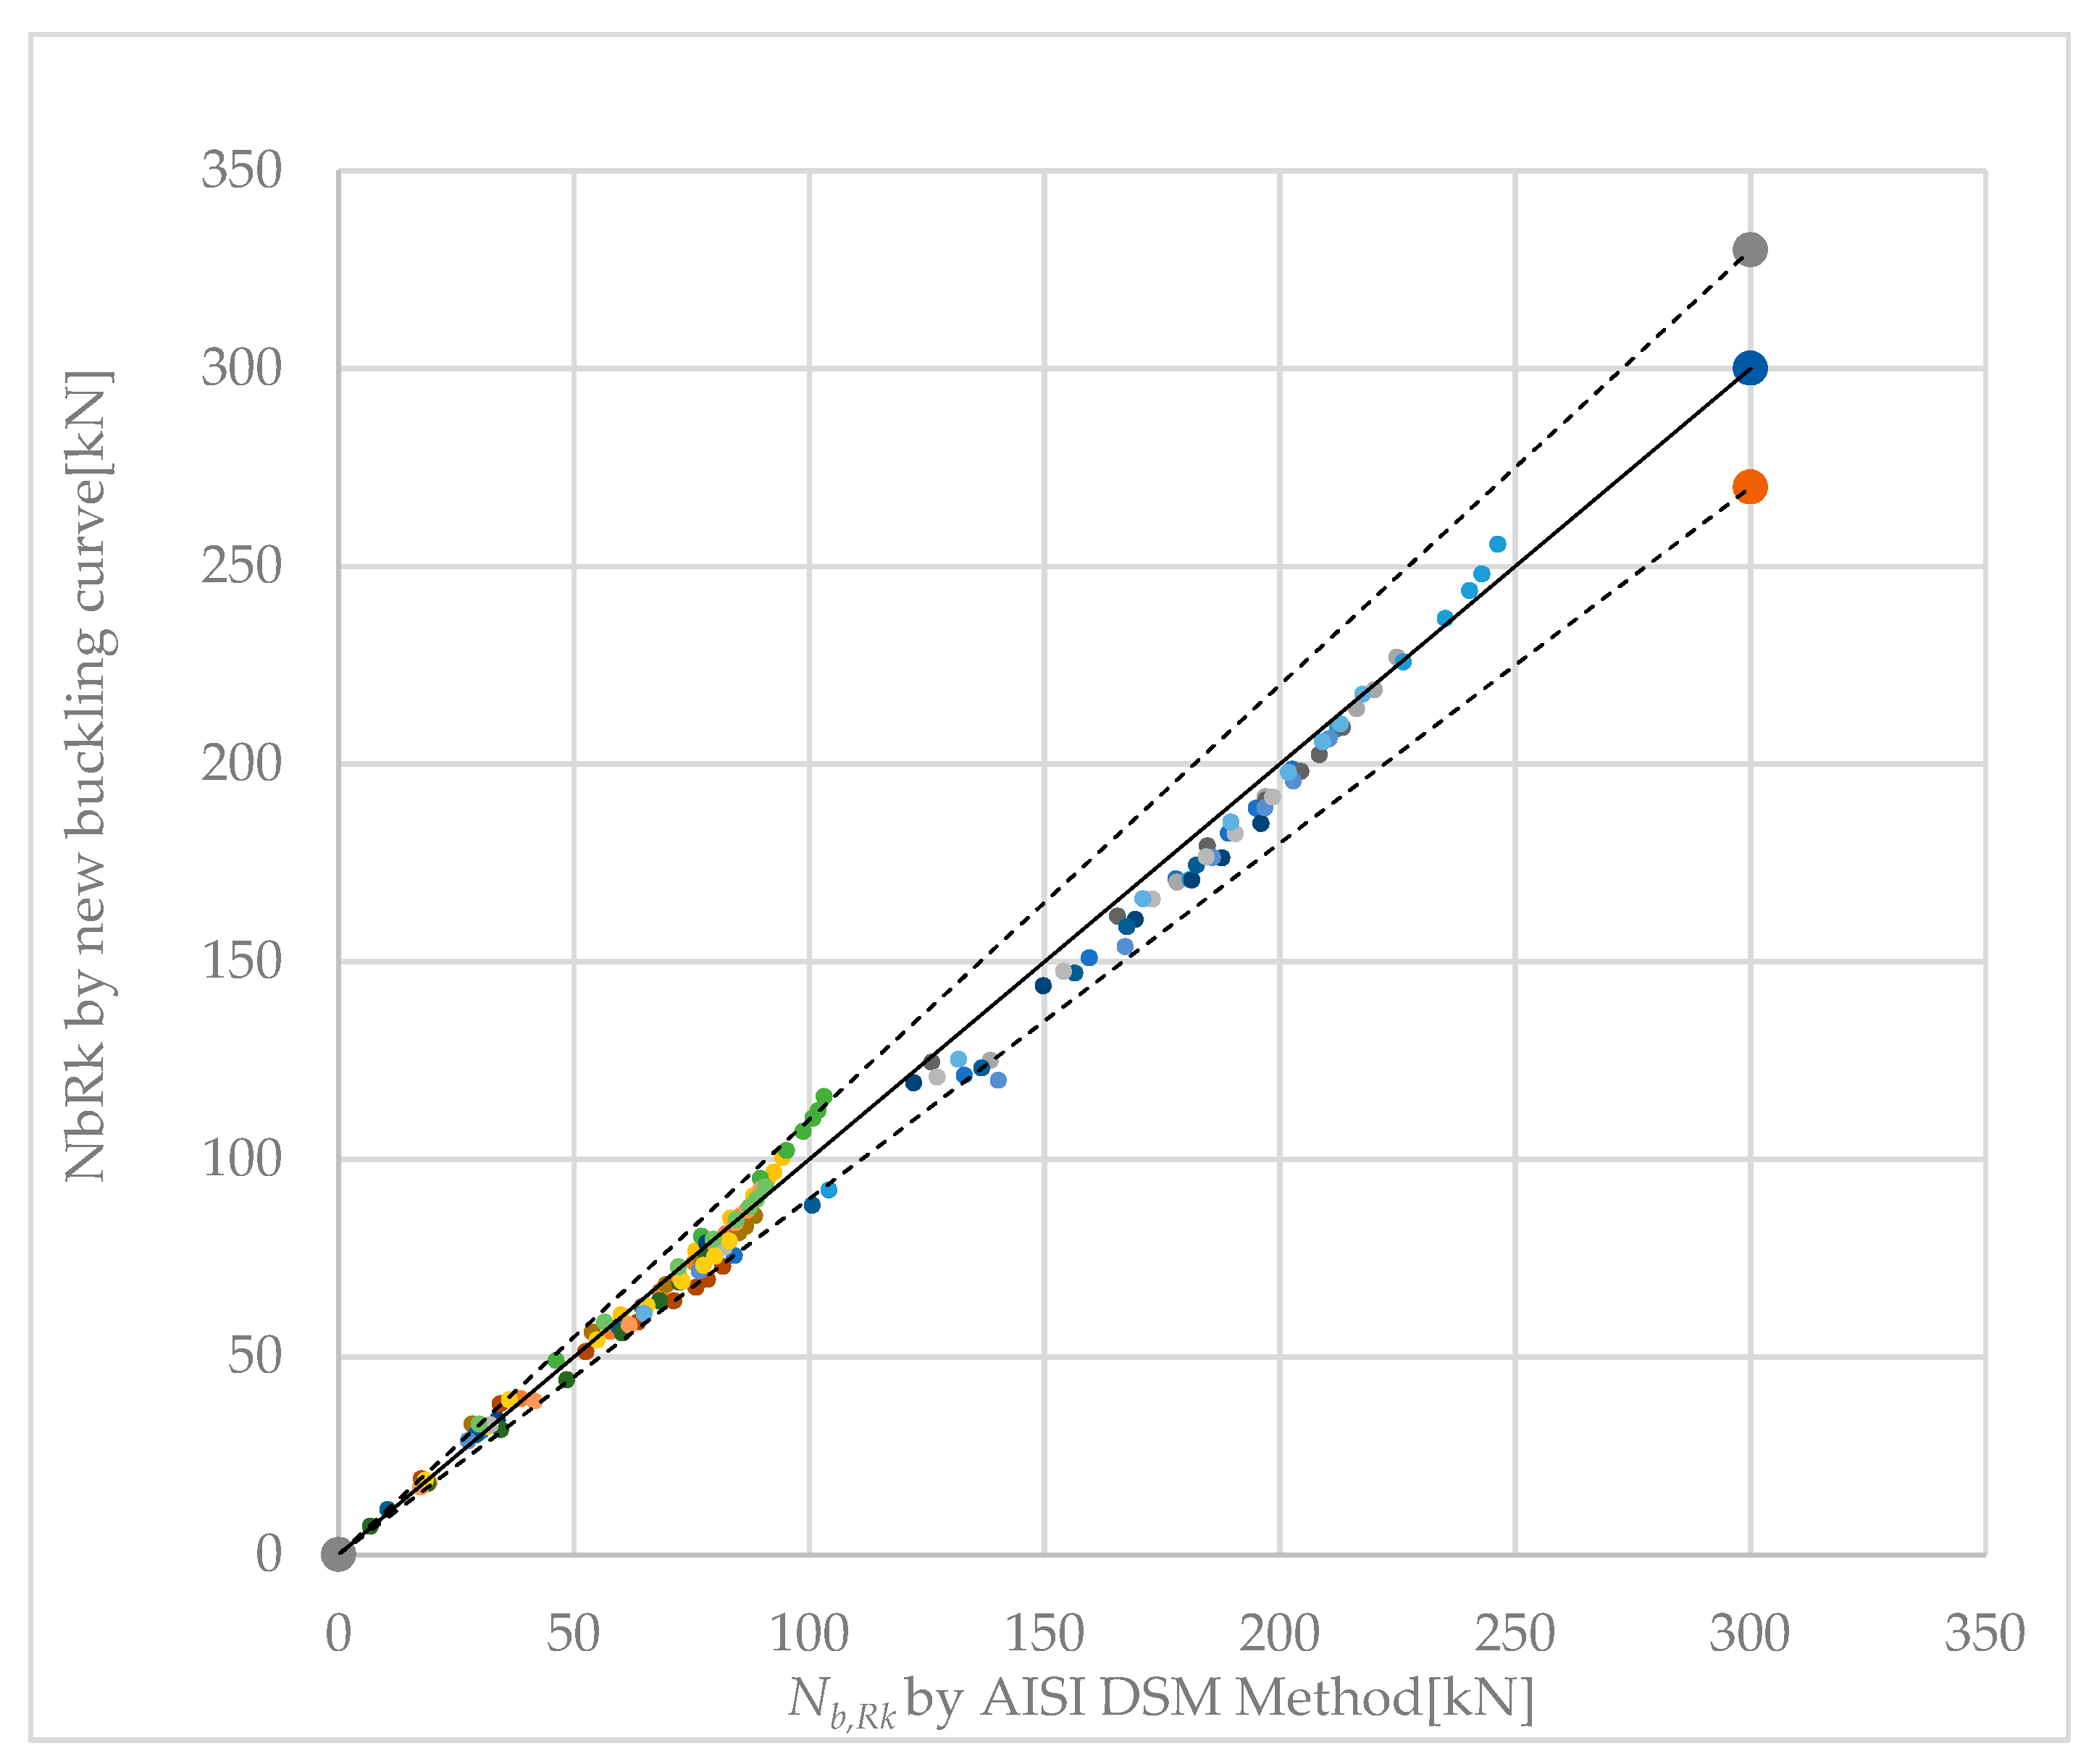
3.3. The New Buckling Curve

For construction of the buckling curve, a simple model is assumed. We assume that at failure of the simple supported column, the compressive stress at the web plate at mid-height, calculated on the effective cross-section, will just reach the yield stress value. The possible elevated tension stresses in the lip-side of the cross-section are not checked against the yield stress; we assume that plastic reserves in the tension zone may be used without any strain limit, as allowed in section 6.1.4.2(1) of EN 1993-1-3. If the stress on the lip-side is a compression, we check the flange-lip zone, with reference to Vaszilievits [7], as a column for flexural buckling, but using the distortional bucking curve from EN 1993-1-3 instead of the more onerous column buckling curves from EN 1993-1-1.
The failure conditions of this model are defined as:
σ c o m , w e b f y b / γ M 0
σ c o m , l i p C G   χ d · f y b / γ M 1   if   compressive   stress
where χ d is the reduction factor to consider the distortional buckling effect on the stiffener zones, f y b is the basic yield strength, and γ M 0 , γ M 1 are partial factors for resistance, according to EN 1993-1-3. The first condition (1a) is directly used for the formulation of the buckling curve, while the second (1b) is presented in the form of an additional verification. σ c o m , w e b represents the compressive stresses in the web, and σ c o m , l i p C G represents the compressive stress in the center of gravity of the lip zone, both calculated on the effective cross-section.
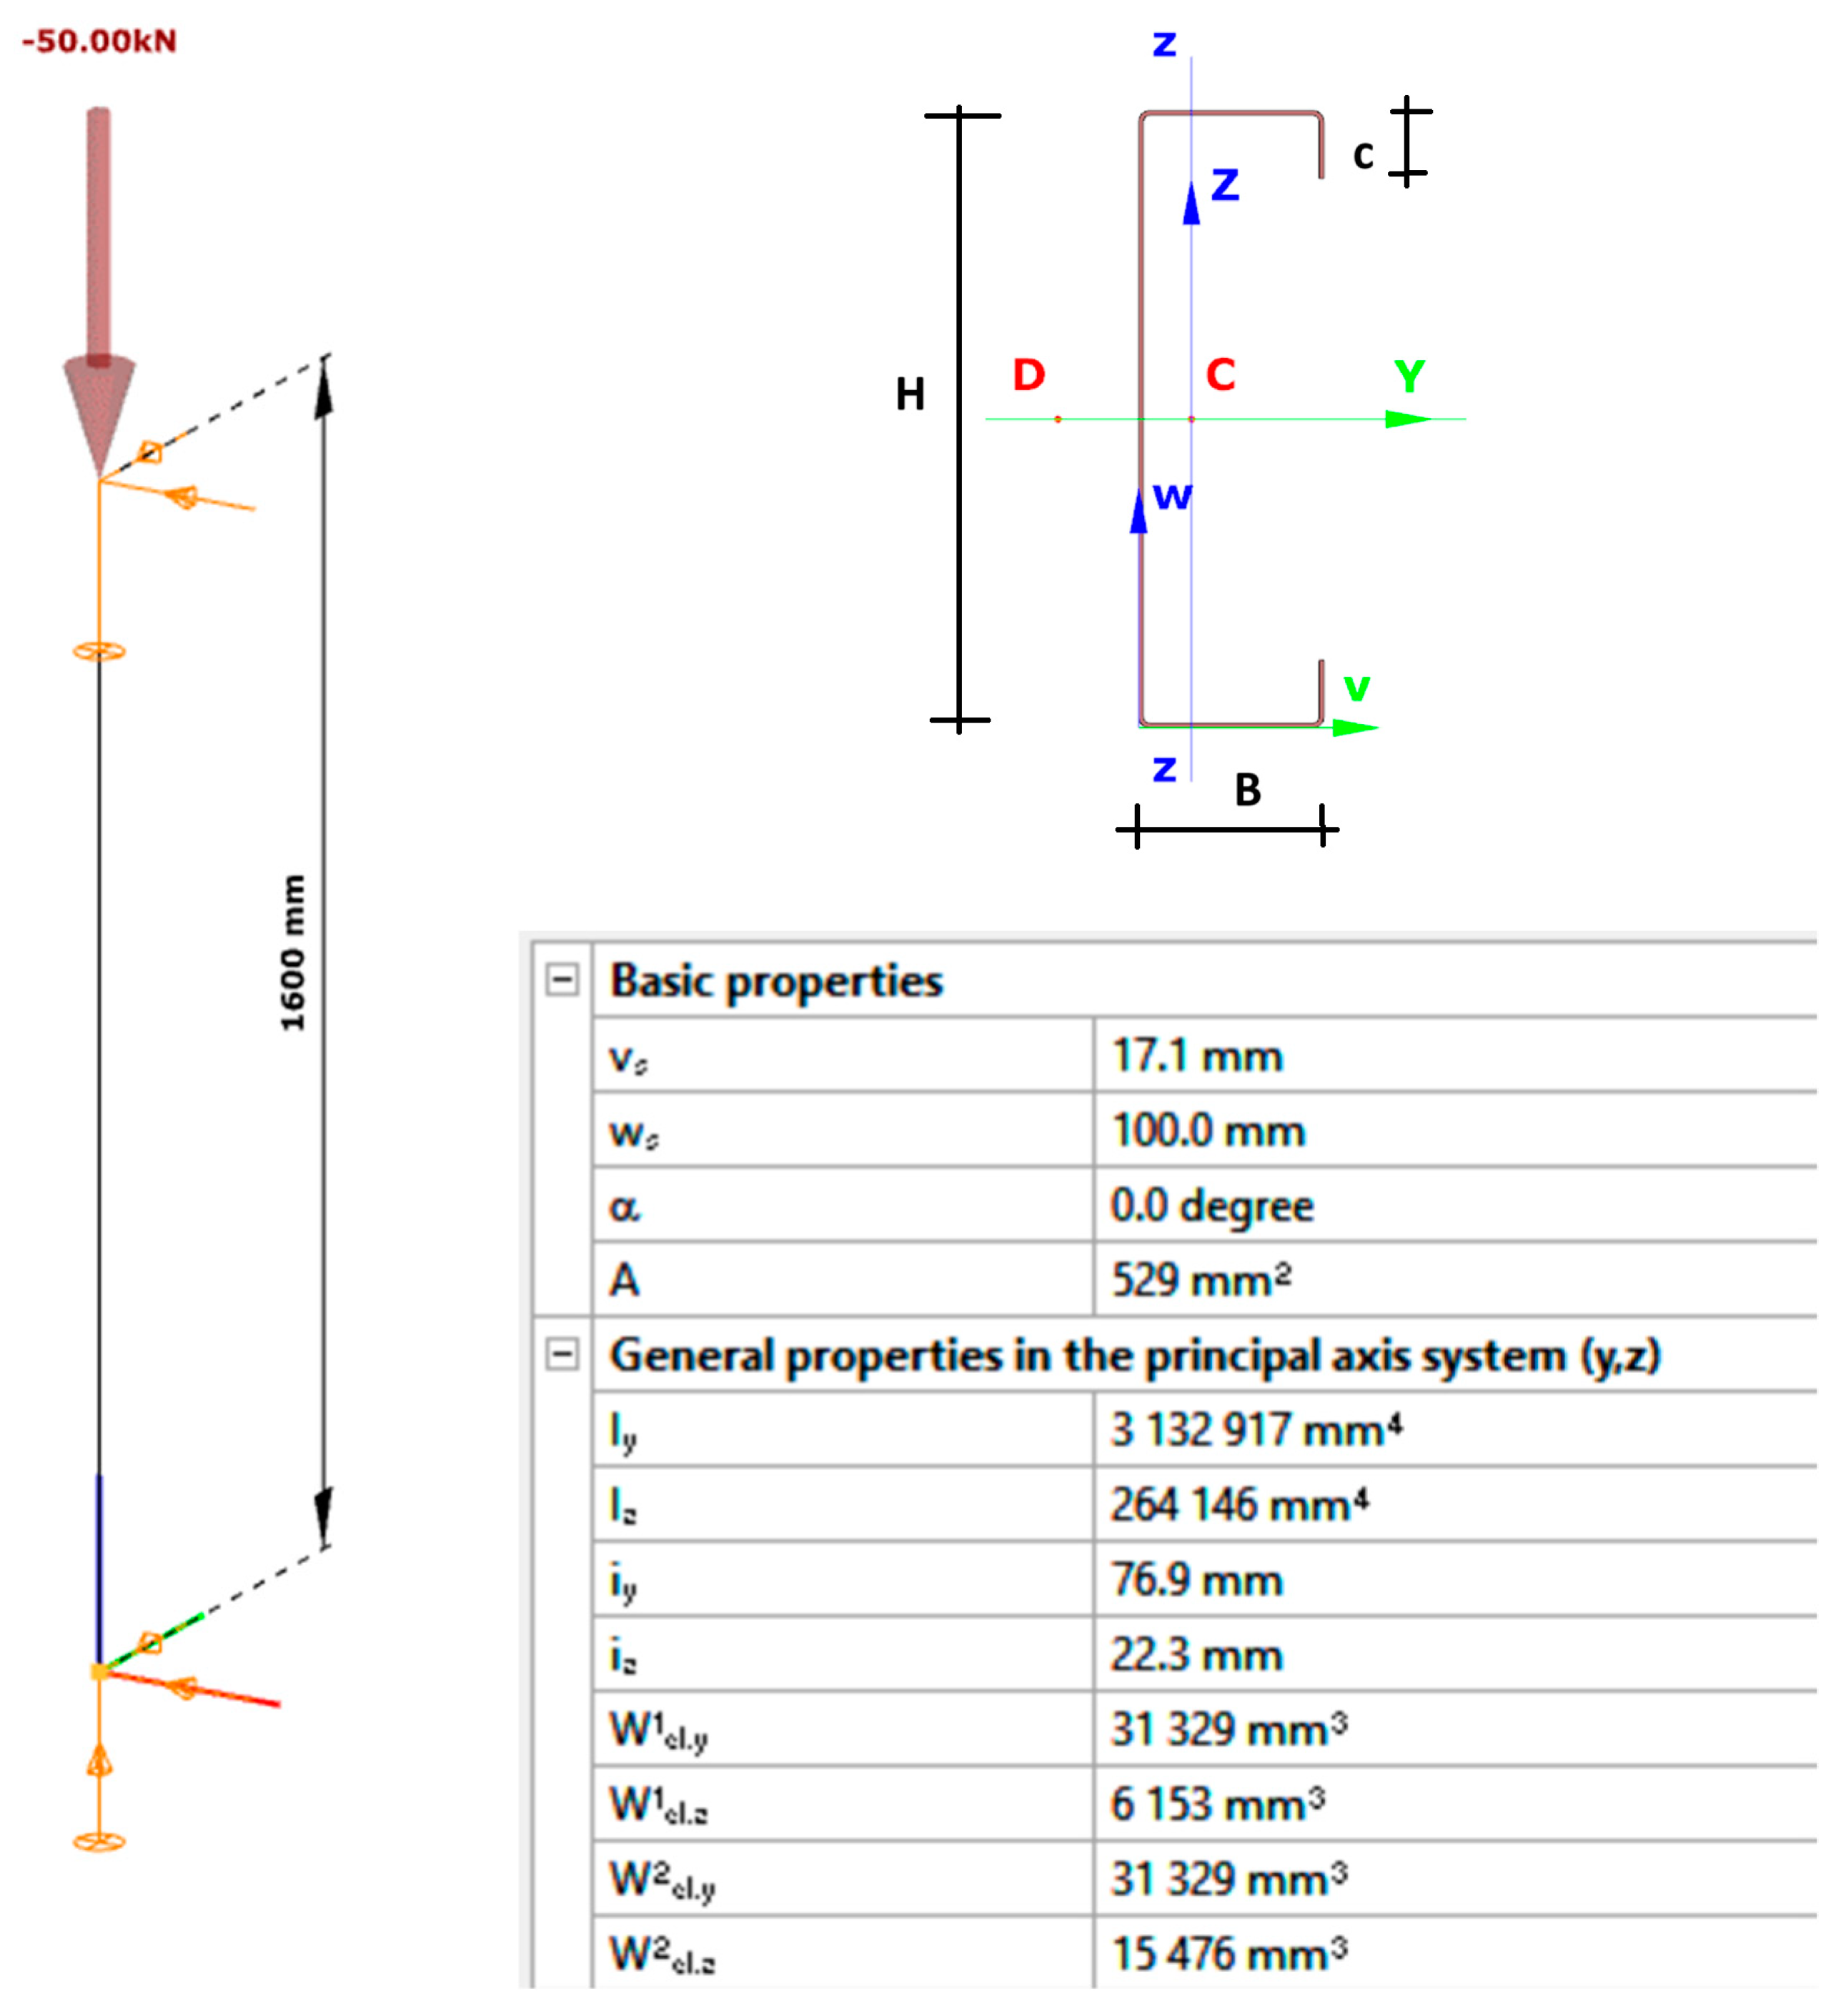
If not only the web but also the flange was slender, determining the effective stress and its effective width would require knowledge of the stress gradient, which, in turn, depends on the unknown compression-to-minor-axis bending moment ratio. Many commonly used cross-sections have narrower flanges, falling under the limiting ratio of Class 4 according to EN 1993-1-1. When applying the solution to such shapes, the general non-linear problem simplifies into a second-order problem, for which a closed-form solution can be built. It can also be added that, if slender flanges were allowed, the formation of effective widths would have no significant effect on either the position of the effective centroid or the calculated stresses, as the inefficient part is usually located very close to the neutral axis of the formed effective cross-section.
In the subsequent discussion, we assume that only the web plate of the cross-section is slender, while the other plates are within the limits of Class 3 of EN 1993-1-1. In this scenario, the formation of effective widths is solely considered on the web plate.
Based on these assumptions, failure is expected when the stress calculated on the effective cross-section reaches the yield strength in the web:
N A e f f + M z I I W e f f , w e b = f y b
where
M z I I = N ( e 0 + Δ v s ) k a m p
and k a m p = 1 1 1 α c r . g , as defined by Merchant in [23]. In addition, e 0 = α ( λ ¯ 0.2 ) W e f f A e f f is the equivalent geometrical imperfection, and the elastic buckling multiplier αcr.g can be computed analytically or in general case with 14 DOF beam-column finite element analysis.
Equations (2) and (3) can be combined into the following second-order equation:
N 2 ( 1 A e f f · N c r ) N ( e 0 W e f f , w e b + Δ v s W e f f , w e b + 1 A e f f + f y b N c r ) + f y b = 0
where Ncr = αcr,g N.
The characteristic value of buckling resistance is obtained by solving the Equation (4) second-order equation for the smallest positive roof of N. For a simpler presentation, the following expression is introduced:
B = e 0 W e f f , w e b + Δ v s W e f f , w e b + 1 A e f f + f y b N c r
With its help, the buckling load can be obtained as the smallest positive roof of the second-order equation, Equation (4):
N b , R k = A e f f N c r 2 ( B B 2 4 f y b A e f f N c r )
Using the usual form of the characteristic buckling resistance employed by Eurocode 3 of a member with Class 4 sections, as follows,
N b R k = χ e f f A e f f f y b
gives the following equation for the reduction factor:
χ e f f = N c r 2 f y b ( B B 2 4 f y b A e f f N c r )
where Ncr can be expressed with the member slenderness as
N c r = A e f f f y b λ ¯ 2
Using Equation (9) in Equation (5) results in the following,
B = α ( λ 0.2 ) W e f f , l i p A e f f W e f f , w e b + Δ v s W e f f , w e b + 1 A e f f + λ ¯ 2 A e f f
which can be further simplified to
B = 1 A e f f [ 1 + α ( λ ¯ 0.2 ) W e f f , l i p W e f f , w e b + λ ¯ 2 ] + Δ v s W e f f , w e b
Using this in Equation (8), the final equation of the reduction factor is
χ e f f = A e f f 2 λ ¯ 2 ( B B 2 4 λ ¯ 2 A e f f 2 )
or, after rewriting both Equations (11) and (12) equivalently into the well-known formulation used by EN 1993-1-1, is as follows:
χ e f f = 1 ϕ e f f + ϕ e f f 2 λ ¯ 2
where
ϕ e f f = 1 2 [ 1 + α ( λ ¯ 0.2 ) W e f f , l i p W e f f , w e b + λ ¯ 2 + Δ v s A e f f W e f f , w e b ]
The buckling resistance is defined as
N b , R d = χ e f f A e f f f y b γ M 1
Under the conditions conforming to this paper, it might happen that compressive stress arises at the lip of the cross-section, and an additional check is therefore necessary to ensure that the second condition Equation (1b), expressed as σ c o m , l i p C G   χ d · f y b / γ M 1 from Section 3.3, is satisfied. The normal stress σ c o m , l i p C G at the center of gravity of the lip zone at failure of the member can be calculated as
σ c o m , l i p C G = N b R d A e f f M z I I W e f f , l i p C G
where N b , R d is the member compressive resistance determined with Equation (15), and W e f f , l i p C G is the section modulus referring to the center of gravity of the lip zone, calculated on the effective cross-section.
Using this value, we obtain
M z I I = N b , R d ( e 0 + Δ v s ) k a m p
At failure, the actual value of M z I I from Equation (2) is
M z I I = W e f f , w e b [ f y b γ M 1 N b , R d A e f f ]
By substituting it into Equation (16), we obtain the following:
σ c o m , l i p C G = N b , R d A e f f W e f f , w e b [ f y b γ M 1 N b R d A e f f ] W e f f , l i p C G
Finally, using Equation (15), we obtain the following:
σ c o m , l i p C G = f y b γ M 1 [ χ e f f W e f f , w e b W e f f , l i p C G ( 1 χ e f f ) ]
If the resulting stress σ c o m , l i p C G is a compressive stress, the verification for distortional buckling can be performed as
σ c o m , l i p C G = f y b γ M 1 [ χ e f f W e f f , w e b W e f f , l i p C G ( 1 χ e f f ) ]   χ d · f y b / γ M 1
which can also be written in a more compact form:
1   χ d [ χ e f f W e f f , w e b W e f f , l i p C G ( 1 χ e f f ) ] 1.0
An important remark can be made based on this result. When analyzing non-symmetric sections, it may be necessary to differentiate between the positive and negative directions of flexural buckling. Eurocode 3 provides guidelines for determining the amplitude of applicable imperfections if flexural buckling will occur in the direction resulting in the first yielding, regardless of the actual stress sign. It is crucial to emphasize, particularly for Class 4 sections, that compression may induce buckling, while tension obviously will not. In the case of typical C-sections, the amplitude scaling factor proposed by Eurocode 3, based on the first yielding irrespective of the sign of the stress, may be deemed overly conservative, as it overlooks this inherent difference, thus emphasizing the need for careful consideration in such scenarios.

4. Verification of the New Buckling Curve

A parametric study has been organized to verify the accuracy of the proposed solution to estimate the compressive strength of a member shown in Figure 1 under pure compression centric to the centroid of the original gross cross-section.
Simple supported, centrically compressed lipped channels are assumed. Under the parametric study, the values of the following parameters have been analyzed within the given ranges shown in Table 1.
The nominal strength values obtained with the presented design method are compared with results obtained using advanced numerical non-linear models and with results predicted by the AISI DSM method [12]. The numerical strength values are based on models with nominal section dimensions and nominal material properties.
The numerical models used in this research for the parametric study have been developed and validated by tests made at Politehnica University Timisoara, in the study of Ungureanu et al. [24], made during the CFSExpert project sponsored by Eurostars. Its validation is not detailed in this paper.
The advanced numerical models were defined using the commercial FE software ABAQUS/CAE [21]. Rectangular 4-node shell elements with reduced integration (S4R) were used to model the thin-walled, cold-formed steel members. The chosen mesh size for the shell elements was approximately 5 × 5 mm, determined by sensitivity analysis [24]. Both geometrical and material non-linearities were included. An isotropic elastic-plastic constitutive model was considered, with von Mises yielding criterion and associated flow rule, without considering the effect of cold work. No residual stresses have been assumed, mainly because the effect of residual stresses are considered to be in general very low, and in some cases may even have a beneficial effect on the strength. The membrane components of residual stresses can be ignored provided that the increase in yield strength due to the cold work of forming is not modeled [25].
The analysis was carried out in two main steps. The first step was the determination of the geometrical imperfections to be used in the model. The different imperfection modes have been created with several techniques, corresponding to their nature. The aim was to create individually “pure” imperfections, as shown in Figure 2, to avoid as much as possible unintended interactions of the imperfect shapes when combined with the GMNIA analysis, which was achieved with the following procedure:
  • For the global imperfection, a pure bow imperfection has been assumed by enforcing the displacements corresponding to the critical buckling mode obtained on the beam model;
  • The critical “pure” buckling mode to be used as the imperfection shape for the local buckling, with the main focus on buckling of the slender web plates, has been obtained by defining line supports along the edges of the member to exclude any possible global and distortional buckling and by performing an elastic linear buckling analysis (LBA);
  • The imperfect shape for the distortional buckling has been obtained by enforcing prescribed sinusoidal displacements of the edge stiffener as a function, in the direction perpendicular to the flanges, while keeping the longitudinal line supports along the edges between flanges and the web.
The obtained individual imperfections have been assembled into the final complete imperfection by applying scaling factors according to prEN 1993-1-14 [26]; see Table 2.
No special factors to differentiate between leading and non-leading imperfection modes have been considered. For the compilation of the imperfections, a Phyton script has been developed by Sánduly et al. [27] and modified to the needs of this research. After imposing the initial geometrical imperfection, a GMNIA analysis was used in the second step. A static non-linear analysis with Riks method was carried out to obtain the force-displacement curve corresponding to each load step.

4.1. Comparison of the Obtained Results against the Parametric Model

The plot in Figure 3 shows the correlation of corresponding characteristic strength values obtained with the non-linear numerical model with the calculated analytical strength predictions using the new modified buckling curve. The vertical axis shows the strength obtained from the numerical model using the worst possible combination of the considered imperfections. The horizontal axis shows the strength values obtained for the same specimen using the analytical method with the new buckling curve. The solid line represents 100% agreement between the results provided by the two methods. In addition, two additional lines have been added to graphically show a range of ±10% disagreement of the values. Points above the 45-degree line mean unsafe predictions. The statistical results of the ratios of resistances obtained by the advanced simulation over the resistances obtained by the present method are shown in Table 3. The table contains the calculated mean value, the value of standard deviation, the coefficient of variation, and the number of unsafe results by less than 5%, less than 10%, and conservative by less than 10% compared to the reference value by simulation. The values suggest a very consistent and reliable estimation of the resistance values.
In addition, the resistances have also been compared with the results provided by the AISI DSM method [12].
The plot in Figure 4 shows the correlation of corresponding characteristic strength values using the AISI DSM design method and with the calculated analytical strength prediction using the new modified buckling curve. The vertical axis shows the nominal strength value obtained from the AISI DSM equation corresponding to global-local interaction without the use of corresponding resistance factors. The horizontal axis shows the strength values obtained for the same specimen using the analytical method with the new buckling curve. The solid line represents 100% agreement between the results provided by the two methods. In addition, two additional lines have been added to graphically show a range of ±10% disagreement of the values. Points above the 45-degree line mean unsafe predictions. Statistical results are shown in Table 4. The results show an excellent agreement of the studied methods.

4.2. Comparison of the Results against the Classical Experimental Results

In addition to the parametric study conducted, resistance values calculated using the new buckling curve were compared with selected classical experimental results, which were used also for calibration of the AISI DSM method [28]. From the full set of experimental data, only those results were selected that align with the basic assumptions outlined in Section 3.1; namely, that the web plate is the only slender element of the cross-section. Since many of the classical results involved cross-sections with slender flanges, specimens with width/thickness ratios up to 160% of the Class 3 limit were also included. Although this geometry could lead to the formation of effective widths in the flanges, the ineffective region is located near the effective centroid and has minimal impact on further shifts. The results of these comparisons are presented in Table 5 and Table 6. Alongside the results based on the new buckling curve, predictions using DSM with approach B3 [28] are also provided in the same tables.
The results of statistical evaluation are shown in Table 7. The results show a perfect match with the predictions offered by the AISI DSM design method.

5. Application of the New Buckling Curve for an Example and Comparison with Other Solutions

The efficiency of the new buckling curve is presented on a simple example, shown in Figure 5, with geometrical parameters defined in Table 8. The pinned-pinned member is supported and loaded in its center of the gross cross-section, marked as “C” in Figure 5, and is restrained against torsion along its length.

5.1. Use of the New Buckling Curve for the Example

For the use of the buckling curve, as stated in Section 3.1, the fullfilment of the following conditions is necessary:
  • the member must have a minimum length, expressed as λ   ¯ > 0.2,
  • only the web plate can be slender (Class 4 of EN 1993-1-1); the remaining plates of the cross-section should be non-slender, under application of the most onerous, pure uniform compressive stress distribution.
Table 9 shows the results of the performed classification of the individual plates of the cross-section based on EN 1993-1-1. According to this, the flange slenderness is just slightly above the limit defined in EN 1993-1-1, but, in reality, the formation of effective widths is not expected, as the slightest second-order bending moment would already cause a stress gradient, which would increase the upper limit of Class 3 cross-sections. The lip is also at the limit of Class 4, but this is irrelevant for the present application.
The global elastic load of the compressed member can be calculated based on LBA analysis. For the given length, Ncr = 214.14 kN has been obtained. For this calculation, the finite element software Consteel 17 [31] was used.
The critical stress of the web plate is determined with the help of finite strip analysis combined with plate sensitivity analysis; see Vaszilievits [6]. Finite strip analysis is performed with a pure compressive stress distribution with a magnitude equal to the yield stress fy = 350 MPa. This stress distribution is possibly the most onerous one from the web plate point of view, as any amount of simultaneous minor-axis bending moment would result in a beneficial stress gradient in the flanges. The obtained critical length for local buckling is 148.8 mm, and the corresponding critical load multiplier is 0.1786. The critical stress can alternatively be determined using the formulas of EN 1993-1-5 [20] if a conservative prediction is also acceptable. The slenderness of the web plate is calculated as λ ¯ p = 1 / α c r . l = 2.366 , which results in ρ = 0.3833 using Equation 5.5.2 from the same EN 1993-1-5. The resulting effective cross-section properties are Aeff = 346.1 mm2 and Iz,eff = 175,780 mm4. The position of the center of gravity of the formed effective cross-section is at 24.99 mm from the centerline of the web, which means a shift of Δ v s = 8.66 mm in the positive direction (toward the lips). Based on the position of the center of gravity, the section modulus corresponding to the web and lip are, respectively, Weff,web = 7030 mm3 and Weff,lip = 5246 mm3.
With the above effective cross-section properties, the non-dimensional slenderness of the member can be calculated as λ ¯ = A e f f f y / N c r = 0.75. As it is higher than 0.2, the minimum member length criteria expressed as a slenderness limit has been fulfilled.
Once all the necessary parameters are available, the values defined in Equations (13) and (14) can be directly calculated:
ϕ e f f = 1 2 [ 1 + α ( λ ¯ 0.2 ) W e f f , l i p W e f f , w e b + λ ¯ 2 + Δ v s A e f f W e f f , w e b ] = 1 2 [ 1 + 0.34 ( 0.75 0.2 ) 5246 7030 + 0.75 2 + 8.66 · 346 7030 ] = 1.06 χ e f f = 1 ϕ e f f + ϕ e f f 2 λ ¯ 2 = 1 1.06 + 1.06 2 0.75 2 = 0.55
The buckling resistance is determined as:
N b , R d = χ e f f A e f f f y γ M 1 = 0.55 346 · 350 1.00 = 66.51   kN
As the lip might be under compression, an additional distortional buckling check of the lip might be necessary using Equation (1b). The actual normal stress at the center of gravity of the lip can be calculating using Equation (20):
σ c o m p , l i p C G = f y b γ M 1 [ χ e f f W e f f , w e b W e f f , l i p C G ( 1 χ e f f ) ] = = 350 1.00 [ 0.55 7030 5246 ( 1 0.55 ) ] = 18.56   MPa
This negative value means tension, and therefore no distortional buckling check is required, as expected.

5.2. Use of Advanced Numerical Analysis

The member was submitted to a GMNIA analysis executed by Abaqus software [21] using the same calibrated characteristic model [24] as for the parametric study presented earlier in Section 4. The obtained deformed shape at ultimate load at Nb,Rd = 66.96 kN is shown in Figure 6. The deformed shape reveals the correctness of the assumptions that the failure happens due to the complete yielding of the web at the midspan without any visible distortional buckling of the lips.

5.3. ENV 1993-1-3 Based Solution

The most closely applicable formula of Eurocode 3 can be found in ENV 1993-1-3 [32]. This formula uses two distinctive effective cross-sections. The first provides Aeff = 276 mm2, considering uniform compressive stress distribution. The effective cross-section includes effective widths on the web due to local buckling and reduced wall thicknesses on the edge stiffener zone due to distortional buckling. The shift of the effective cross-section is eNz = 10.1 mm. The second effective cross-section calculated from pure minor-axis bending causing compression on the web results in Ieff.z = 179,649 mm4 and Weff.z = min (Weff.z.web, Weff.z.lip) = 5430 mm3. Using
N E d χ z A e f f f y b / γ M 1 + κ z Δ v s N E d W e f f . z f y b / γ M 1 1
where the coefficient κz = 1.266, defined in ENV 1993-1-3, is responsible for providing the necessary second-order amplification, Nb,Rd is found to be equal to approximately 50.00 kN, as follows:
N E d χ z A e f f f y b γ M 1 + κ z Δ v s N E d W e f f f y b γ M 1 = 50000 0.80 × 276 350 1.00 + 1.226 10.1 × 50000 5430 × 350 1.00 = 0.96 1

5.4. Verification with a Commercial Design Software

SCIA Engineer 22.1.3016.64 [33] has been used for this verification. This software uses the formulas 6.61 and 6.62 from EN 1993-1-1 [1], although these formulas are strictly applicable for double symmetric cross-sections only, as stated in 6.3.3(1) in EN 1993-1-1.
This software finds a somewhat smaller shift of the effective cross-section with identical properties, such as Aeff = 280 mm2, Ieff.z = 179,880 mm4, and Weff.z = min (Weff.z.web, Weff.z.lip) = 5432 mm3.
As reported by the software, using the interaction method 1 of EN 1993-1-1, Nb,Rd is found to be equal to approximately 58.00 kN.

5.5. Comparison of the Results

The buckling resistance values obtained with the different approaches studied in Section 5.1, Section 5.2, Section 5.3 and Section 5.4 are summarized in Table 10.
The comparison shows perfect agreement between the resistances obtained with the use of the new buckling curve and the advanced numerical method (GMNIA). The results also prove that the Eurocode 3 formula may lead to conservative results in some cases.

6. Summary and Conclusions

The final summary and conclusions of this study are as follows:
  • A buckling curve applicable for prediction of the buckling resistance of simple supported members made with cold-formed, lipped channel cross-sections has been proposed, which is capable of considering consistently and directly the interaction of global and local buckling. The obtained resistance values show excellent agreement with both test-validated numerical results and those determined using AISI DSM [12]. Additionally, when compared to classical experimental results, the predicted resistance values are very similar to those provided by DSM.
  • Despite the proposed modifications, the new buckling curve can be considered a 100% Eurocode-compatible design method because the principles of Eurocode 3 have been carefully followed.
  • Although AIS DSM [12] is not recognized by Eurocode 3, the excellent agreement of its results points out the possibility of its inclusion as an alternative empirical design method in a future edition of the EN 1993-1-3.
  • This paper has shown how critical stresses obtained by the finite strip analysis can be assigned to different plates of the cross-section using plate sensitivity analysis to obtain safe but economical results instead of using the conservatively obtained results for the overall section, as proposed by the present edition of Eurocode EN 1993-1-3 [19] and its future FprEN edition [34].
  • This paper has called attention to the fact that, in cases of monosymmetric cross-sections, the smallest section modulus should not necessarily be used for the proper scaling of imperfections.
  • The new method yields in general higher resistance than using the most appropriate ENV [32] interaction formula. This can mostly be explained by the conservatism raised by the separate handling of compression and bending in cases of non-doubly-symmetric sections. The proposed solution, when implemented in software packages, would give consistent and accurate resistances.

7. Further Study to Conduct

This paper has focused on the situation when local buckling of the web plate controls the resistance of the cross-section. Another study is required focusing on the lipped side, proposing a similar solution involving the distortional buckling of the edge stiffener.

Author Contributions

Methodology, B.V.-S.; Validation, B.V.-S.; Formal analysis, B.V.-S.; Writing—original draft, B.V.-S.; Writing—review & editing, F.P.; Supervision, F.P. All authors have read and agreed to the published version of the manuscript.

Funding

This research received no external funding.

Data Availability Statement

The original contributions presented in the study are included in the article, further inquiries can be directed to the corresponding author.

Conflicts of Interest

The authors declare no conflicts of interest.

Nomenclature

OIMOverall Imperfection Method—a method for the assessment of the global buckling resistance of structural members
LBAElastic linear buckling analysis
GNIAGeometrically non-linear analysis with imperfections
GMNIAGeometrically and materially non-linear analysis with imperfections
DSMDirect Strength Method, as specified by AISI S100
DOFDegrees of Freedom

References

  1. EN 1993-1-1; Eurocode 3—Design of Steel Structures—Part 1-1: General Rules and Rules for Buildings. European Standards, CEN: Brussels, Belgium, 2005.
  2. Winter, G. Performance of Thin Steel Compression Flanges. International Association for Bridge and Structural Engineering. In Third Congress; Preliminary Publication: Liege, Belgium, 1948; Volume 317. [Google Scholar]
  3. Cheung, Y.K. Finite strip method analysis of elastic slabs. J. Eng. Mech. Div. 1968, 94, 1365–1378. [Google Scholar] [CrossRef]
  4. Miller, T.H.; Peköz, T. Load-eccentricity effects on cold-formed steel lipped-channel columns. J. Struct. Eng. 1994, 120, 805–823. [Google Scholar] [CrossRef]
  5. Szalai, J. Use of eigenvalue analysis for different levels of stability design. In Proceedings of the SDSS’ Rio 2010 Stability and Ductility of Steel Structures, Rio de Janeiro, Brazil, 8–10 September 2010. [Google Scholar]
  6. Vaszilievits-Sömjén, B. Local Buckling of Compressed Cold-Formed Lipped Channels via Buckling Mode Shapes. ce/papers 2022, 5, 178–185. [Google Scholar] [CrossRef]
  7. Vaszilievits-Sömjén, B. Distortional buckling of compressed cold-formed lipped C channels via buckling mode shapes. ce/papers 2021, 4, 2535–2541. [Google Scholar] [CrossRef]
  8. Young, B.; Rasmussen, K.J.R. Tests of Cold-Formed Channel Columns. CCFSS Proceedings of International Specialty Conference on Cold-Formed Steel Structures 4. 1998. Available online: https://scholarsmine.mst.edu/isccss/14iccfsss/14iccfsss-session4/4 (accessed on 9 October 2024).
  9. AS/NZS 4600:2018; Australian New Zealand Standard. Cold-Formed Steel Structures. Standards Australia: Sydney, Australia, 2018.
  10. Young, B. The Behaviour and Design of Cold-Formed Channel Columns. Ph.D. Thesis, University of Sydney, Sydney, Australia, 1997. [Google Scholar]
  11. Batista, M.E. Local–global buckling interaction procedures for the design of cold-formed columns: Effective width and direct method integrated approach. Thin-Walled Struct. 2009, 47, 1218–1231. [Google Scholar] [CrossRef]
  12. AISI. Direct Strength Method (DSM) Design Guide; American Iron and Steel Institute: Washington, DC, USA, 2006. [Google Scholar]
  13. Becque, J. The Interaction of Local and Overall Buckling of Cold-Formed Stainless Steel Columns. Ph.D. Thesis, The University of Sydney, Sydney, Australia, 2008. [Google Scholar]
  14. Mulligan, G.P.; Peköz, T. The Influence of Local Buckling on the Structural Behavior of Singly-Symmetric Cold-Formed Steel Columns. Center for Cold-Formed Steel Structures Library 117, 1983. Available online: https://scholarsmine.mst.edu/ccfss-library/117 (accessed on 9 October 2024).
  15. Timoshenko, S.P.; Gere, J.M. Theory of Elastic Stability; McGraw Hill Book: New York, NY, USA; London, UK, 1961. [Google Scholar]
  16. Becque, J.; Rasmussen, K.J. Numerical Investigation and Design Methods for Stainless Steel Columns failing by Interaction of Local and Overall Buckling; Research Report R888; University of Sidney: Sidney, Australia, 2008. [Google Scholar]
  17. EN 1993-1-4; Eurocode 3—Design of Steel Structures—Part 1-4: General Rules—Supplementary Rules for Stainless Steels. European Standards, CEN: Brussels, Belgium, 2006.
  18. AS/NZS 4673; Cold-Formed Stainless Steel Structures. Standards Australia: Sydney, Australia, 2001.
  19. EN 1993-1-3; Eurocode 3—Design of Steel Structures—Part 1-3: General Rules—Supplementary Rules for Cold-Formed Members and Sheeting. European Standards, CEN: Brussels, Belgium, 2008.
  20. EN 1993-1-5; Eurocode 3—Design of Steel Structures—Part 1-5: Plated Structural Elements. European Standards, CEN: Brussels, Belgium, 2006.
  21. Abaqus/CAE 6.13; Dassault Systèmes: Île-de-France, France. Simulia Corp.: Johnston, RI, USA, 2013.
  22. Papp, F. Buckling assessment of steel members through overall imperfection method. Eng. Struct. 2016, 106, 124–136. [Google Scholar] [CrossRef]
  23. Merchant, W. The failure load of rigid jointed frameworks as influenced by stability. Struct. Eng. 1954, 32, 185–190. [Google Scholar]
  24. Ungureanu, V.; Kotełko, M.; Bodea, F.; Both, I.; Czechowski, L. Failure mechanisms of TWCFS members considering various eccentricities. Steel Constr. 2023, 16, 44–55. [Google Scholar] [CrossRef]
  25. Schafer, B.W.; Peköz, T. Computational modeling of cold-formed steel: Characterizing geometric imperfections and residual stresses. J. Constr. Steel Res. 1998, 47, 193–210. [Google Scholar] [CrossRef]
  26. prEN 1993-1-14; Eurocode 3—Design of Steel Structures—Part 1-14: Design Assisted by Finite Element Analysis. European Standards, CEN: Brussels, Belgium, 2023.
  27. Sánduly, A.; Nagy, Z.; Kotełko, M.; Kelemen. Comparison of design methods for thin-walled cold-formed steel cross-sections. In Proceedings of the XXVII Conference on Civil Engineering and Architecture, Csiksomlyo, Romania, 8 June 2023; Available online: https://www.researchgate.net/publication/372316799_Vekonyfalu_hidegen_hajlitott_acelszelvenyek_ellenorzesi_modszereinek_osszehasonlitasa (accessed on 9 October 2024). (In Hungarian).
  28. Schafer, B.W. Local, Distortional, and Euler Buckling of Thin-Walled Columns. J. Struct. Eng. 2002, 128, 289–299. [Google Scholar] [CrossRef]
  29. Mulligan, G.P. The Influence of Local Buckling on the Structural Behavior of Singly-Symmetric Cold-Formed Steel Columns. Ph.D. Thesis, Cornell University, Ithaca, NY, USA, 1983. [Google Scholar]
  30. Loughlan, J. Mode Interaction in Lipped Channel Columns under Concentric or Eccentric Loading. Ph.D. Thesis, University of Strathclyde, Glasgow, UK, 1979. [Google Scholar]
  31. Consteel 17, Consteel Solutions Kft: Budapest, Hungary, 2024.
  32. ENV 1993-1-3; Eurocode 3: Design of Steel Structures—Part 1-3: General Rules—Supplementary Rules for Cold Formed Thin Gauge Members and Sheeting. European Standards, CEN: Brussels, Belgium, 1997.
  33. SCIA Engineer 22.1.3016.64; A Nemetschek Company: Antwerp, Belgium, 2024. Available online: https://www.scia.net/en (accessed on 9 October 2024).
  34. FprEN 1993-1-3; Eurocode 3: Design of Steel Structures—Part 1-3: Cold-Formed Members and Sheeting. European Standards, CEN: Brussels, Belgium, 2023.
Figure 1. Concentrically compressed column subject to parametric study.
Buildings 14 03258 g001
Figure 2. “Pure” global, local and distortional imperfection modes assumed for the parametric study.
Buildings 14 03258 g002
Figure 3. Comparison of predicted resistances, Abaqus vs. use of new buckling curve, ±10% error ranges.
Buildings 14 03258 g003
Figure 4. Comparison of predicted resistances, AISI DSM [12] vs. use of new buckling curve, ±10% error ranges.
Buildings 14 03258 g004
Figure 5. Simple supported column with C200x60x22x1.50 mm profile.
Buildings 14 03258 g005
Figure 6. The deformed shape at the ultimate load level.
Buildings 14 03258 g006
Table 1. Details of parametric study.
ParameterValues
Profile depth, B150–300 mm
Profile width, D40–100 mm
Profile lip length, d10–22 mm
Profile thickness tcore1.5–2.5 mm
Column length, L300–5000 mm
Global non-dimensional slenderness, λ ¯ 0.20–2.97
Table 2. Scaling factors for individual buckling modes.
ModeScale Factor
Global bucklingL/1000
Local bucklingH/200
Distortional buckling 0.3   ×   t core   ×   f y b / σ c r . d
Table 3. Statistical evaluation of the results.
QuantityValue
Mean value0.997
Standard deviation0.0588
C.o.v0.0589
N144
N > 1.0080
N > 1.0526
N > 1.106
N < 1.0064
Table 4. Statistical evaluation of the results.
QuantityValue
Mean value0.981
Standard deviation0.0547
C.o.v0.0557
N144
N > 1.0047
N > 1.0514
N > 1.105
N < 1.0097
Table 5. Ultimate strength results.
Series of ExperimentMarkPexp/PproposedPex/PDSM
Mulligan [14]GM10.991.04
GM21.081.11
GM31.071.07
GM41.121.13
GM51.111.13
GM61.111.14
GM71.111.14
GM81.101.14
GM91.201.23
Mulligan [29]SLC/1 60 × 301.191.18
SLC/1 90 × 301.191.17
SLC/1 120 × 301.241.21
SLC/1 60 × 600.971.14
SLC/2 60 × 601.001.16
SLC/1 120 × 601.051.14
SLC/2 120 × 601.111.20
SLC/1 180 × 601.181.23
SLC/2 180 × 601.201.25
SLC/1 240 × 601.341.36
SLC/2 240 × 601.261.26
SLC/3 240 × 601.301.32
Miller, Peköz [4]LC-10.940.88
LC-20.850.78
LC-30.870.81
LC-41.011.04
LC-60.850.86
LC-70.981.00
LC-140.900.95
LC-191.461.53
LC-210.990.92
LC-220.920.85
LC-230.890.83
LC-301.501.57
LC-311.241.30
Table 6. Ultimate strength results—continuation.
Series of ExperimentMarkPexp/PproposedPex/PDSM
Loughlan [30]L10.760.74
L21.120.93
L60.991.00
L70.960.97
L80.950.97
L120.870.88
L130.840.84
L140.870.87
L180.900.90
Mulligan stub tests [29]L190.910.89
L200.870.85
L241.391.28
L251.091.03
L261.010.97
L270.990.96
L281.091.02
L291.040.99
L301.020.98
L311.211.15
L321.131.09
L331.131.10
Table 7. Statistical evaluation of the results.
QuantityProposedDSM B3
Mean value1.061.06
Standard deviation0.160.18
C.o.v0.150.17
N5555
Table 8. Cross-section dimensions; for example, shown in Figure 5.
DimensionValueRemark
Member length (L)1600 mmpinned-pinned
Profile depth (H)200 mmexternal dimension
Flange width (B)60 mmexternal dimension
Lip length (c)22 mmexternal dimension
Wall thickness (tcore)1.50 mmno zinc coating assumed
Material yield stress (fy)350 MPa
Modulus of elasticity (E)210,000 MPaS350GD material
Table 9. Verification of the actual cross-section classification.
Platebp/tcoreLimit Slenderness for Class 3Plate Class
lip13.6311.47≈3
flange37.9334.44≈3
web131.2634.444
Table 10. Summary of resistance values by different methods.
MethodBuckling Resistance Nb,Rd
Use of new buckling curve (Section 5.1)66.51 kN
ENV 1993-1-3 (Section 5.3)50.00 kN
SCIA Engineer 22.1.3016.64 (Section 5.4)58.00 kN
Reference advanced numerical method (Section 5.2)66.96 kN
Disclaimer/Publisher’s Note: The statements, opinions and data contained in all publications are solely those of the individual author(s) and contributor(s) and not of MDPI and/or the editor(s). MDPI and/or the editor(s) disclaim responsibility for any injury to people or property resulting from any ideas, methods, instructions or products referred to in the content.

