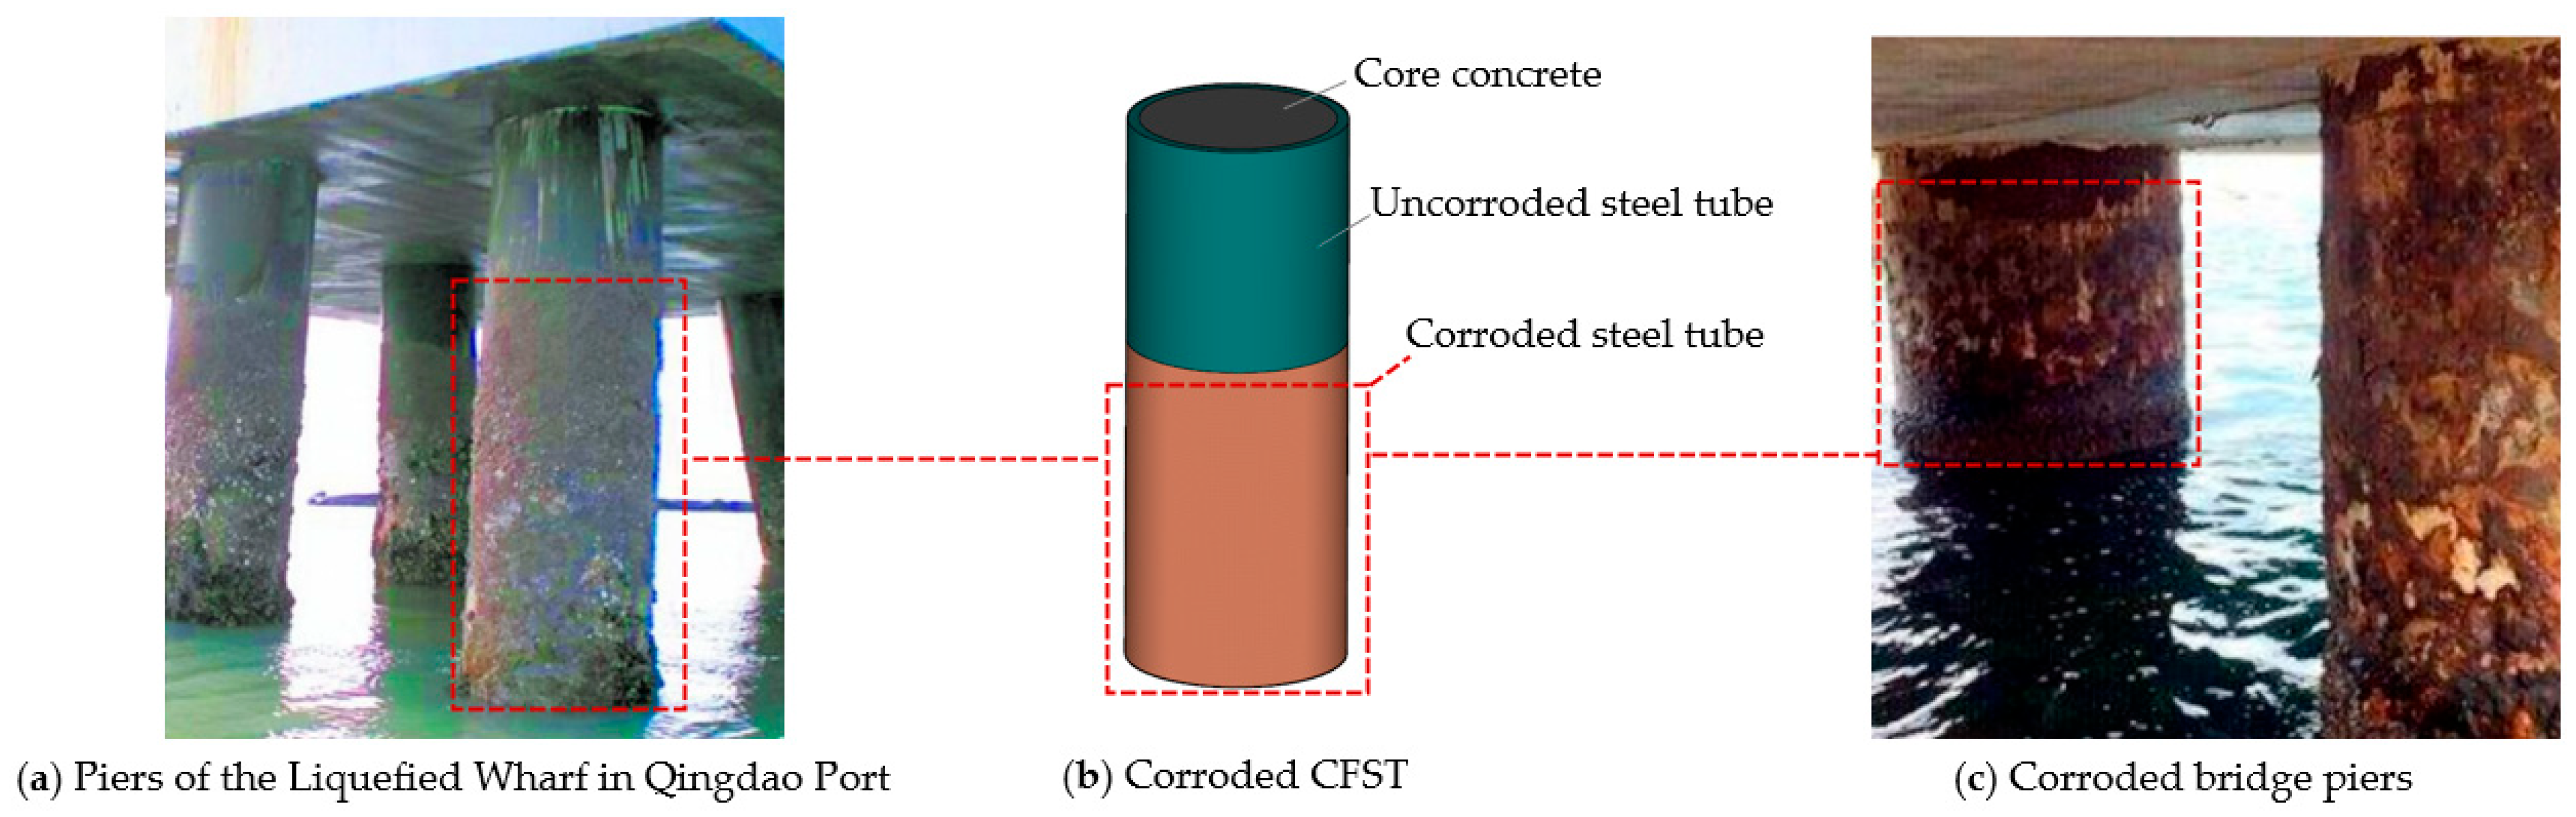
Based on the distribution of standard calculation results, a reliability analysis could be conducted using the commonly approved methodology FOSM for corroded CFST members. This analysis can provide crucial constructional details for CFST members in wet environments.
4.1. Reliability Index Calculations with Different Standards
In accordance with Chinese standard GB/T 50283-1999 [
19], structures were required to have a target reliability index
βT of 4.2 with a safety level of II and a reference period of 100 years. On the other hand, the American and European standards specify target reliability indices
βT of 3.5 and 3.8 for reference periods of 75 years and 50 years, respectively. To compare the reliability indices
β obtained from different standards within the same period, the following approximate formula can be used for conversion:
where
βn is the reliability index for an n-year reference period, and
β1 is the reliability index for a 1-year reference period. The structure design typically uses a reference period of 100 years as a unified period. Therefore, the target reliability index
βT for the American standard over a reference period of 100 years is calculated as 3.4 based on Equation (12), while it is 3.65 for the European standard over the same period. The reliability index
βT for the Chinese standard is 4.2.
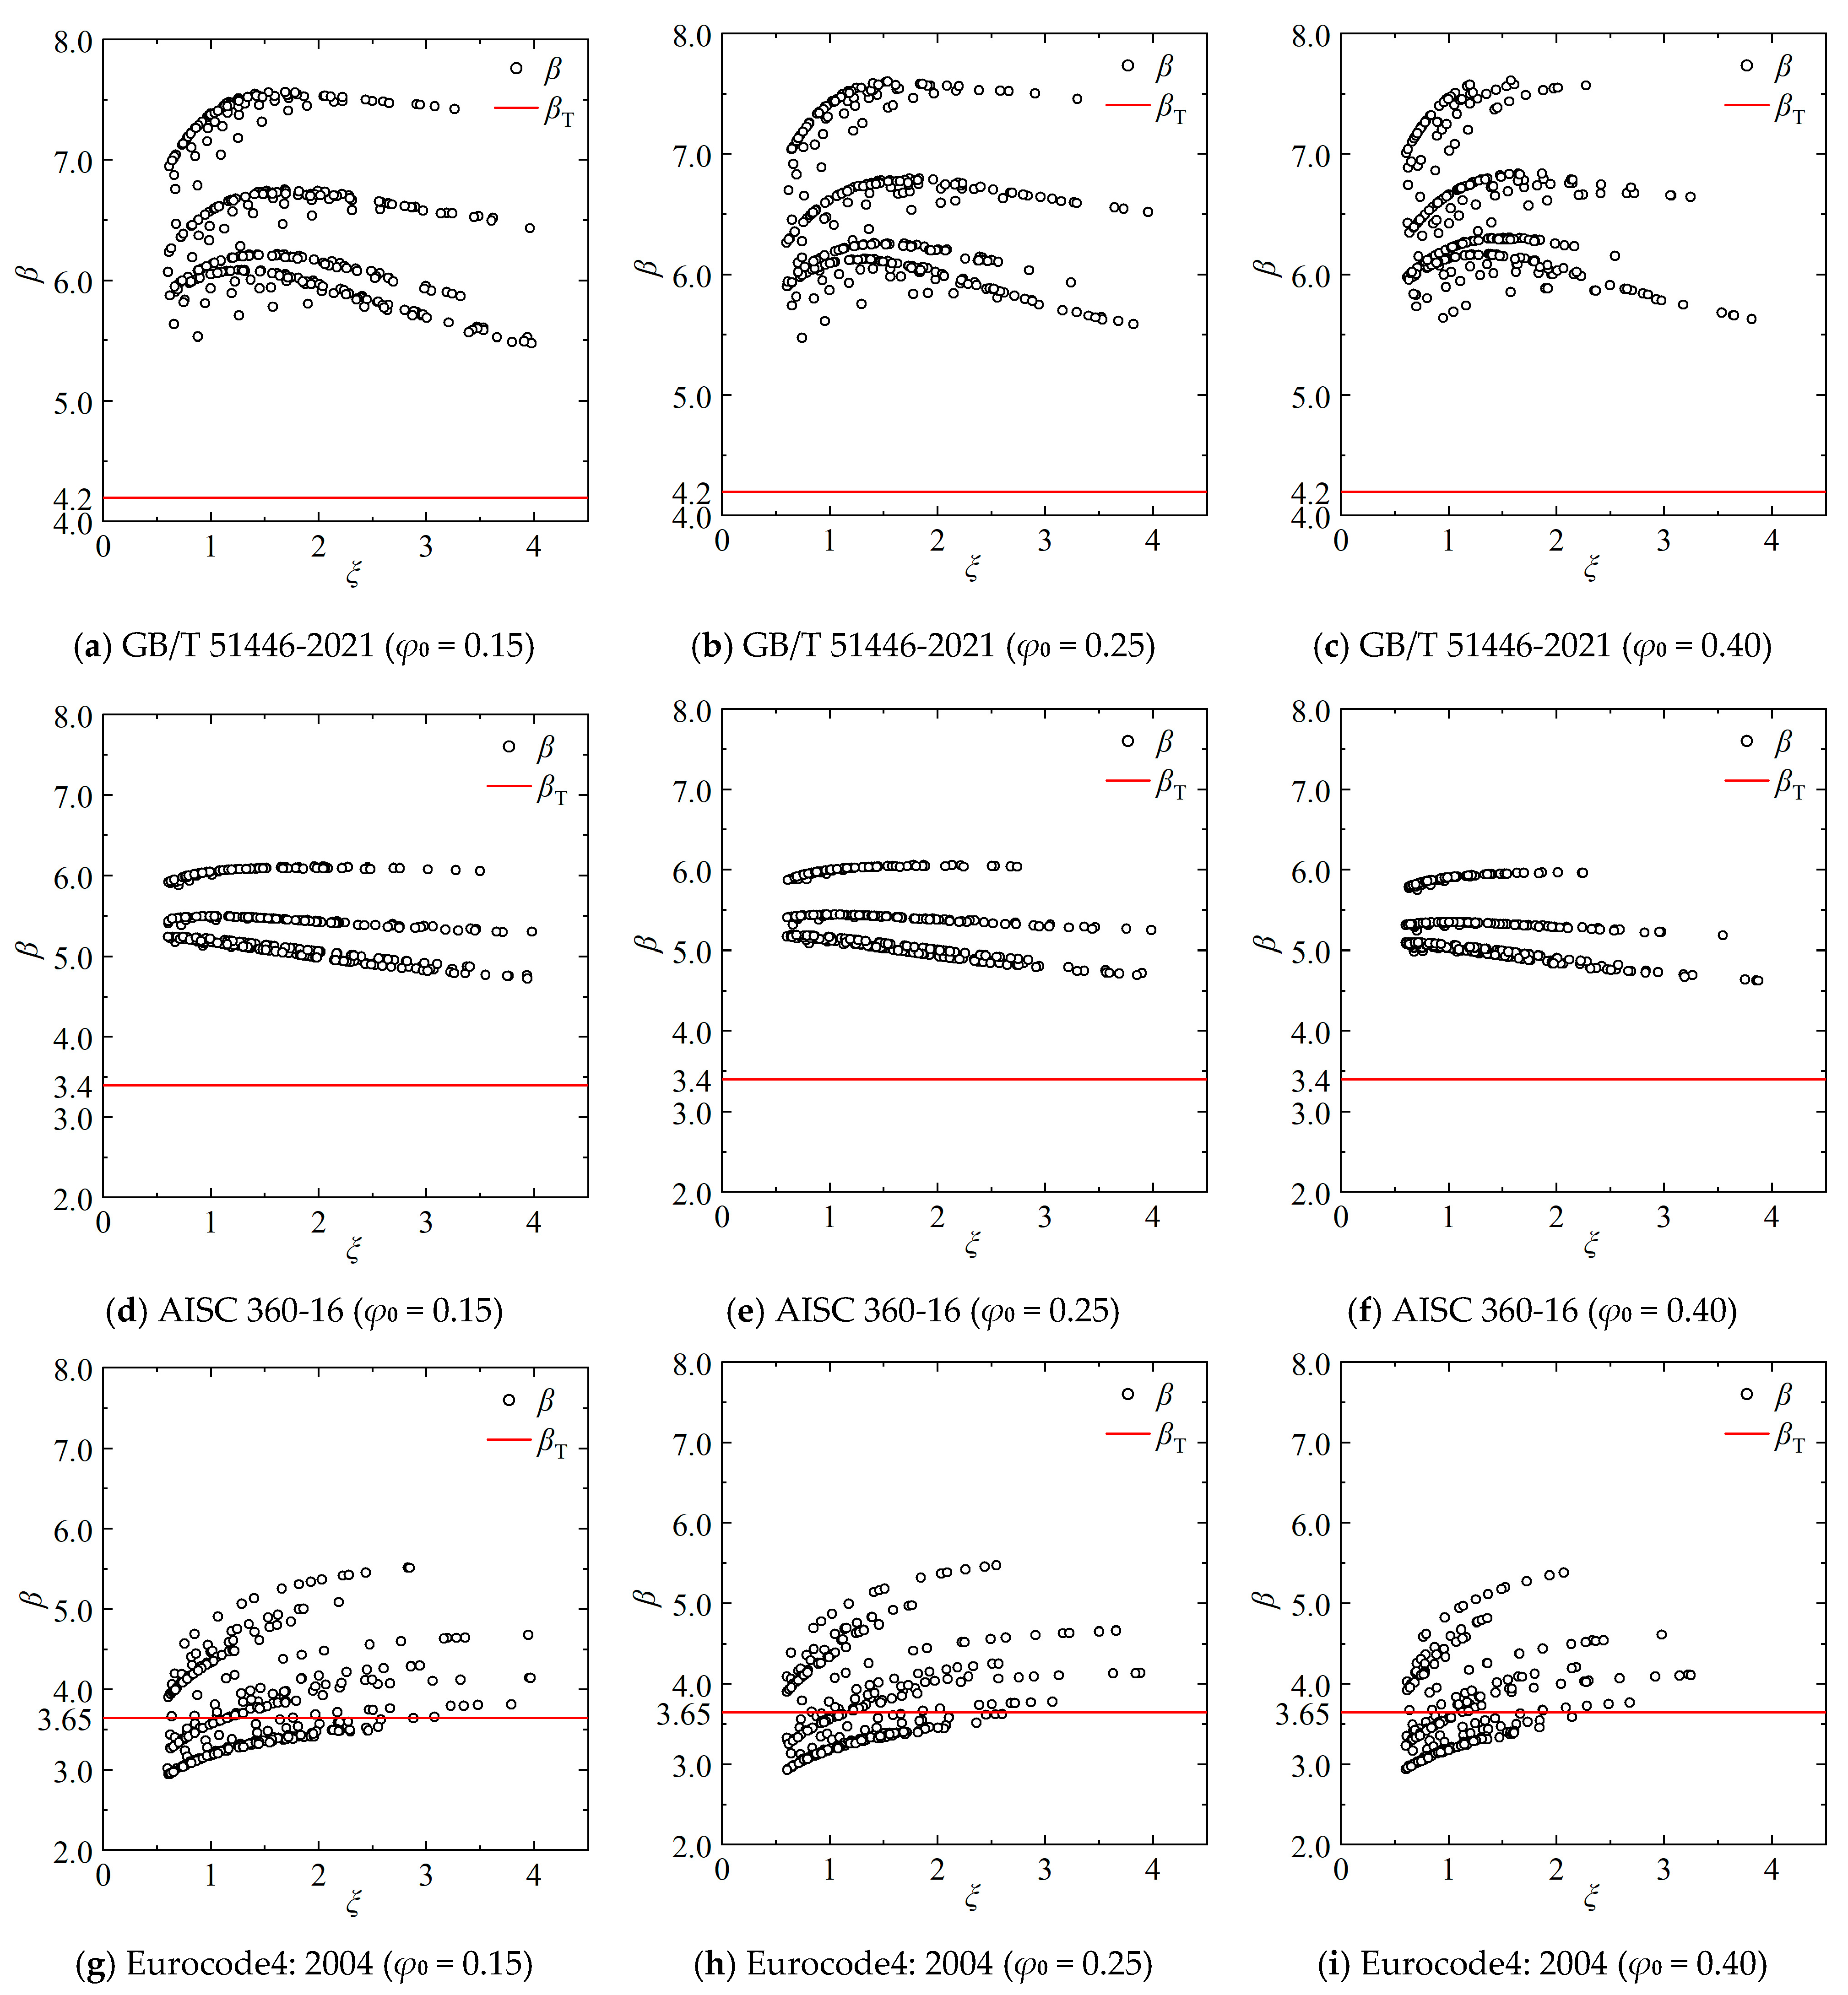
The calculation of reliability indices was conducted using the FOSM method, and the parameter ranges are shown in
Table 9. Since steel ratio
αs has the great influence in structural performance and reliability analysis, the steel tube ratio
αs was set in a large range of 0.05 to 0.35 and divided into multiple intervals. Based on these ranges, 448 sets of parameters were computed for each of the three standards under different corrosion rates, as depicted in
Figure 10. The black circles represent the calculated reliability index
β, while the red solid line represents the target reliability index
βT. To ensure a fair comparison of reliability across different standards, the resistance partial factor
γ was uniformly set to 1.2.
Since the confinement factor
ξ is an essential factor for the mechanical behaviour of CFST members, the relationship between
ξ and
β is illustrated in
Figure 10. For Chinese standard GB/T 51446-2021 [
25], the
β initially increased at a high rate with the increase in ξ and decreased afterward. It could be observed that
β is relatively high within the range of
ξ from 1.5 to 2.0, and it gradually decreased after
ξ exceeded 2.5, reaching its lowest value when
ξ equalled 4.0. For AISC 360-16 [
23], the pattern is obviously different.
ξ had a minor influence on
β, as shown in
Figure 10d–f. With the increase in
ξ,
β remained constant initially and decreased a bit later. Finally, Eurocode4: 2004 [
24] exhibits totally different results, which are shown in
Figure 10g–i. Parts of the results are lower than
βT, especially when
fys and
fcu,c are high, which means the calculation method is insufficient.
In summary, the reliability index
β obtained from three standards varied with changes in the confinement factor
ξ. Moreover, the reliability index
β from European standard Eurocode4: 2004 [
24] is lower than the target reliability index
βT in some cases. Therefore, it is essential to propose structural requirements that can meet the reliability of the structure under corrosion conditions based on the results of the reliability analysis.
4.2. Reliability Analysis under Corrosion Conditions
Confinement factor
ξ is composed of multiple parameters, including the strength of concrete, the strength of the steel tube, and the steel tube ratio. It is unable to independently analyze the influence pattern of a specific parameter on the reliability index
β. Therefore, it is necessary to analyze the coupling effects of each parameter on
β and further investigate the influence patterns. In this study, the results from Eurocode4: 2004 [
24] were selected for analysis since the low reliability index
β was found in the above analysis.
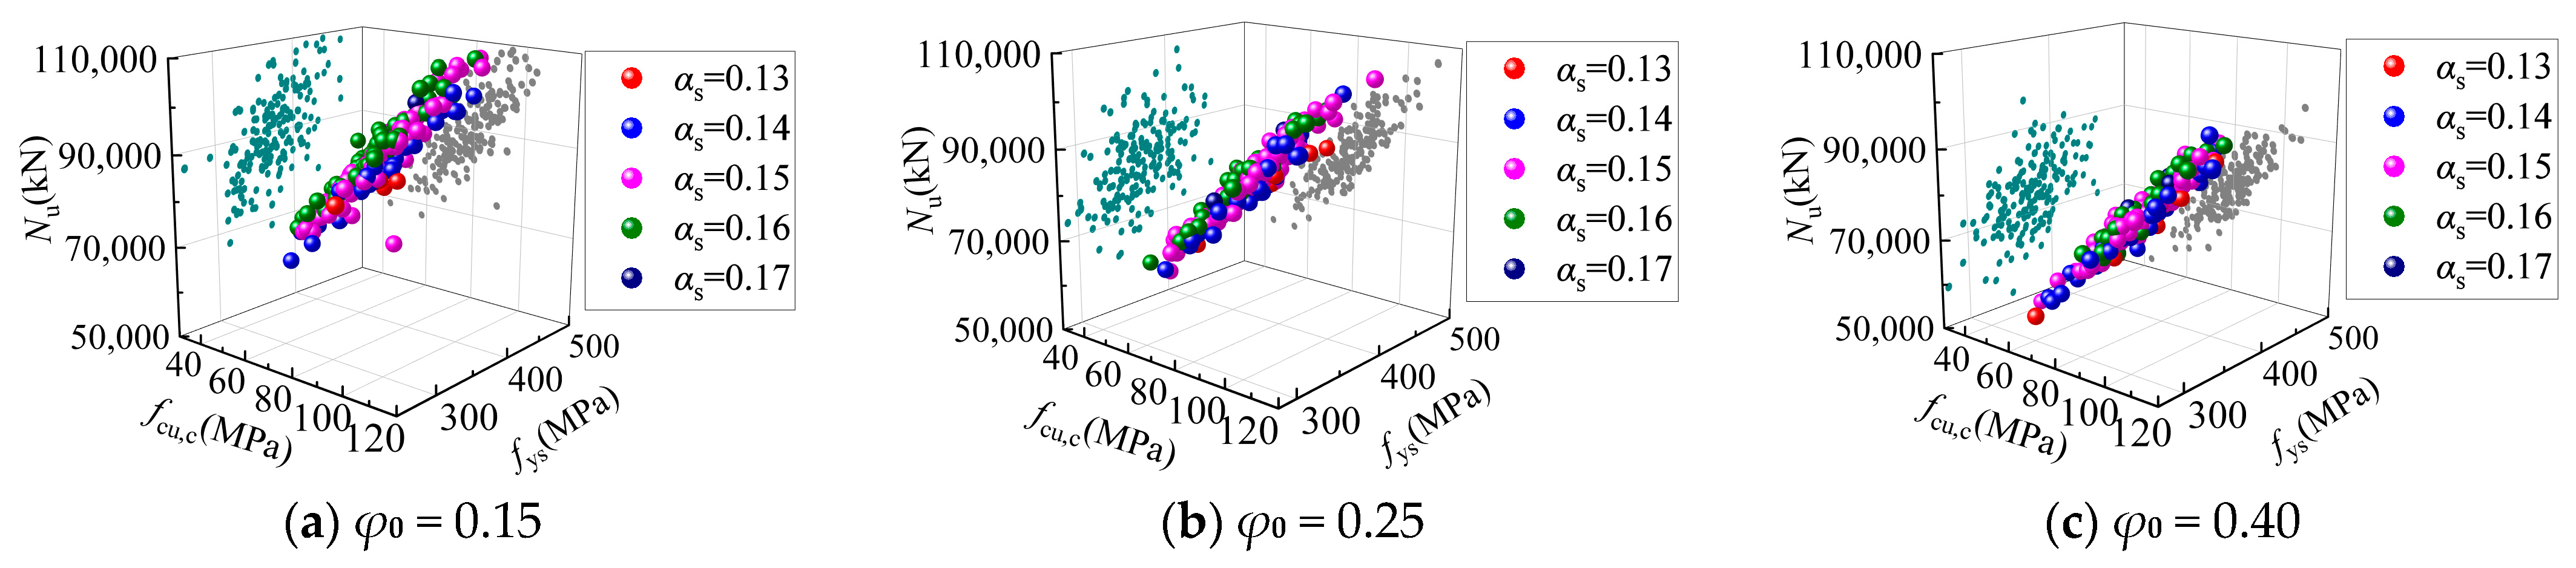
Figure 11 illustrates the coupling influence patterns of
fcu,c,
fys, and
αs on
β under different corrosion rates
φ0.
From
Figure 11, it can be observed that the influence patterns of various parameters on
β remain consistent across different corrosion rates. Therefore, this study focused on the corrosion rate of 0.15 to promote detailed analysis. As shown in
Figure 11a, there is a nonlinear relationship between
β and
fys, and this influence pattern varies with
αs. When
αs is 0.15,
β decreases by 5.53~19.96% as
fys increases from 235 MPa to 420 MPa. However,
β only increases by 3.03% at most as
fys increases from 420 MPa to 460 MPa. When
αs is 0.35,
β decreases by 19.95~24.96% as
fys increases from 235 MPa to 420 MPa. The influence of
fys on
β becomes more noticeable as the value of
αs becomes larger. This is mainly due to the thickness of the steel tube, which increases with
αs. With a larger value of
αs, the strength contribution of the steel tube occupies a larger proportion of the entire structure. Consequently,
β is more affected by the
fys with the high value of
αs. The same principle applies to other parameters. For example, the influence of
fcu,c on
β is simultaneously affected by
fys. When
fys is 235 MPa to 420 MPa,
β decreases by 12.63~23.90% as
fcu,c increases from 30 MPa to 90 MPa. Conversely,
β decreases by 4.24~6.03% with the same increase in
fcu,c when
fys is 460 MPa. As the strength of the steel tube increases sufficiently, the influence of concrete on
β decreases accordingly.
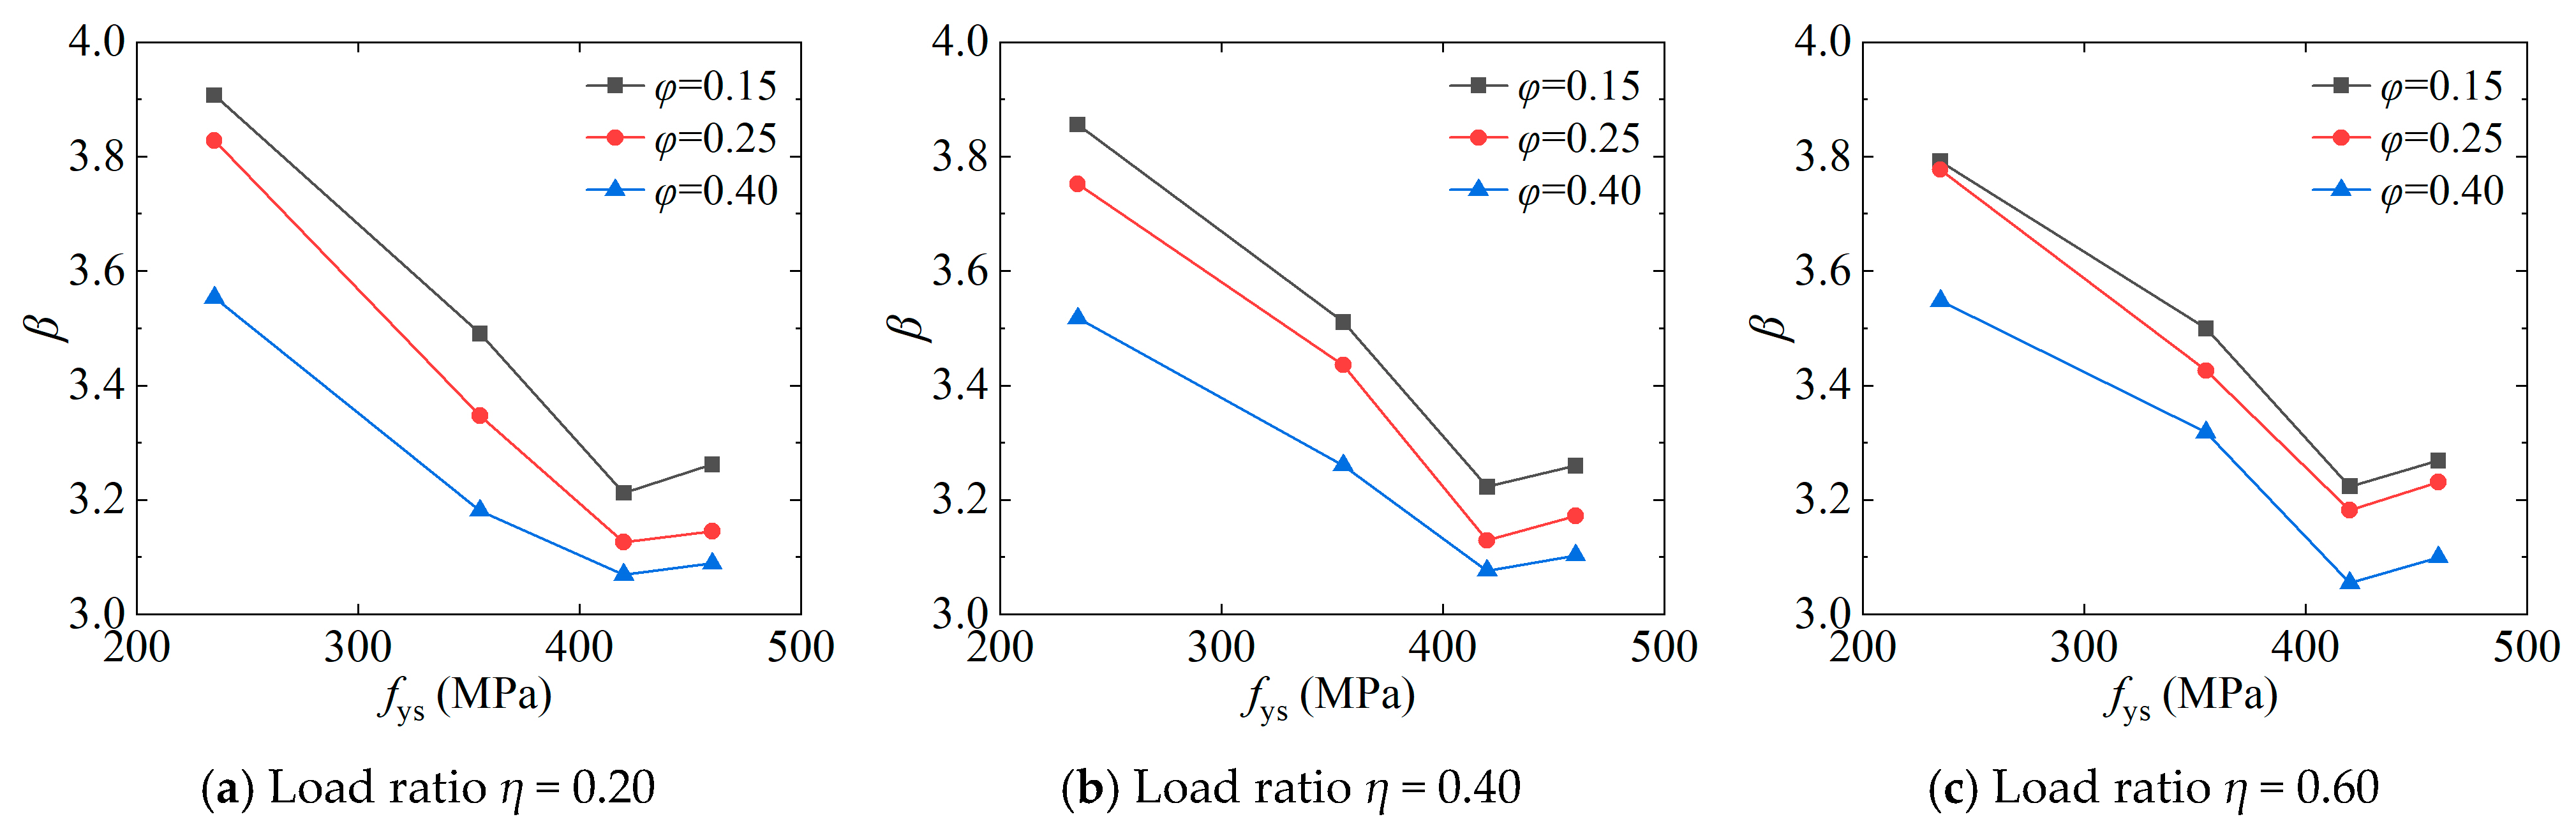
Based on the comprehensive analysis, it can be concluded that
fys has the greatest impact on the reliability index
β. To further investigate the influence of
fys and
φ on
β, the results with
fcu,c of 60 MPa and
αs of 0.15 were selected for analysis, as shown in
Figure 12a. To study the impact of different external loads on
β under corrosion conditions, the influence of
fys and
φ was further analyzed under the load ratios
η of 0.40 and 0.60, as shown in
Figure 12b,c. This indicates that the influence of
φ and
fys on
β is almost identical when load ratio
η takes different values. Therefore, the detailed analysis will focus on the load ratio of 0.20. The following patterns can be observed:
- (1)
For the influence of
fys, it could be found that
β decreases as
fys increases from 235 MPa to 420 MPa. For steel tube corrosion rates
φ of 0.15, 0.25, and 0.40,
β decreases by 17.79%, 18.33%, and 13.63%, respectively. Conversely,
β shows a slight increase as
fys increases from 420 MPa to 460 MPa. This pattern of change is highly consistent with the earlier analysis results. According to
Table 2, when
fys increases from 235 MPa to 420 MPa, the ratio between the mean and the standard value of
fys continuously decreases. Therefore,
β would decrease as
fys increases from 235 MPa to 420 MPa. For
fys of 420 MPa and 460 MPa, the ratio between the mean and the standard value of
fys is the same, both being 0.96. Thus,
β does not continue to decrease with the increase in
fys.
- (2)
The impact of corrosion rate φ on the reliability index β is related to the yield strength of the steel tube fys. When fys is 235 MPa and 355 MPa, β decreases by 9.05% and 8.86% with the increase in φ, respectively. When fys is 420 MPa and 460 MPa, β decreases by 4.45% and 5.29% with the increasing of φ.
- (3)
The preceding analysis indicates that fys would lead to a reduction in reliability index β, and the minimum value of β would occur with an fys between 420 MPa and 460 MPa.
To identify the most detrimental combination for the reliability of CFST members, it is essential to reasonably consider the coupling effects of all parameters. According to the above distribution pattern of
fcu,c and
fys, they are categorized into two groups, and the average reliability indices are calculated with an
αs of 0.15, 0.25, and 0.35. The results are presented in
Table 10. The table reveals that the calculated mean reliability index
β is consistently lower than the target reliability index
βT of 3.65 when
fys ranges from 420 MPa to 460 MPa. Additionally, the calculated mean reliability index also falls below the target reliability index with a certain combination of
αs,
fys, and
fcu,c. To ensure the reliability of CFST members under the combined effects of corrosion and external loads, it is recommended to avoid multi-parameter combinations corresponding to the bolded values of the reliability index
β in
Table 10. Therefore, the reliability index
β under unsafe circumstances is marked in bold. In summary, the range of
fys between 420 MPa and 460 MPa is generally unsafe. Additionally, particular attention should be paid when
αs is 0.15 and
fcu,c is between 60 MPa and 90 MPa, as these conditions may also pose safety risks.


