Article

Dynamic and Residual Static Behavior of Axially Loaded RC Columns Subjected to Low-Elevation Impact Loading

Civil Engineering Faculty, Istanbul Technical University, Istanbul 34469, Turkey
*
Author to whom correspondence should be addressed.
Buildings 2024, 14(1), 92; https://doi.org/10.3390/buildings14010092
Submission received: 24 November 2023 / Revised: 21 December 2023 / Accepted: 27 December 2023 / Published: 29 December 2023
(This article belongs to the Section Building Materials, and Repair & Renovation)

Abstract

:
Columns can suffer heavy damage due to dynamic impact effects, which are ignored during their design. The impact effect could be a vehicle crash to columns of streetside buildings, parking garages or bridges. However, the effect of impact loading on the behavior of reinforced concrete columns has not been sufficiently studied. In this study, an experimental and numerical investigation is carried out on the impact behavior of axially loaded reinforced concrete columns. Dynamic experiments were carried out by dropping a mass from different heights to apply low-elevation impact on axially loaded, full-scale (30 × 30 × 320 cm) columns. After evaluating the performance of the columns under varied impact loadings, the residual load carrying capacities of the columns were also obtained by static loading. Additionally, a three-dimensional finite element model was developed and validated by using drop weight experimental results. The effect of increasing the impact energy on the behavior of RC columns was also examined numerically. As a result of the research, it has been observed that, as the applied impact energy increases, the dynamic damage/failure mode changes from flexure to shear. When a column was impacted by 75.8% of its total impact energy capacity, a decrease of 38.1% in its stiffness and a decrease of 49.7% in its load carrying capacity were determined compared to its previous unimpacted state. Additionally, the static energy dissipation capacity loss of the column was reached, up to 81.7% of its preloading state. The developed finite element model can also be utilized to determine the dynamic performance and the damage modes of columns under vehicle collision-type low-elevation impacts, which can be a guide for structural engineers in the design of such vulnerable columns and will contribute to safer structural designs.

1. Introduction

Reinforced concrete structures are designed considering all potential loads that they can be exposed to during their service lives. In addition to the common dead and live loads acting on structures, dynamic effects such as earthquake and wind loads can be listed as conventional loads considered in the design. Apart from these design loads, impact loads can be counted among the dynamic loads that are likely to affect many structures due to their function or location. Transportation structures such as bridges, viaducts and ports are exposed to ship and vehicle impacts, and conventional reinforced concrete structures, industrial buildings and parking lot columns beside the active road routes can be exposed to such dynamic effects.
There are many studies in the literature that investigated the behavior of reinforced concrete (RC) structural elements under impact loads. Although most of these studies focused on RC slabs/beams impacted on their mid-spans, there were only a limited number of column impacts. These studies were mostly carried out without axial loads. Moreover, there was no full-scale study to determine the post-impact residual capacities. In this study the behavior of axially loaded RC columns under low-elevation impact loading, which represents vehicular crashes, was investigated experimentally and numerically on full-scale columns. The residual capacities of the post-impacted columns were also determined by conducting static tests on the damaged columns. Among the previous research in the literature, there was no other study where full-scale axially loaded RC columns were tested under low-elevation impact loading and their post-impact residual capacities were determined experimentally.
Impact is a short-term, sudden dynamic effect that changes the behavior of the structural members [1,2,3]. There have been several studies that have investigated the impact behavior of slabs [4,5,6,7], beams [8,9,10,11], columns [12,13,14] and column–beam joints [15].
In studies examining the impact effect on columns, the impact load was applied on varied regions of the column specimens. In some of the experimental impact studies on columns, the impact load was applied on the upper end of the specimen [16,17], whereas, in most of the studies, the impact load was applied at the mid-height of the specimens [18,19,20,21,22,23,24]. Many parameters such as slenderness, longitudinal reinforcement ratio, transverse reinforcement ratio and axial load ratio have been investigated in these studies.
In addition to experimental research, there have been many numerical studies on axial and mid-span impacts on structural members [25,26,27]. Most of the numerical studies were low-elevation impacts to simulate vehicle collisions, where some of them were on circular columns [28,29,30,31,32] and the rest were on square or rectangular columns [33,34,35,36,37,38,39,40,41,42]. In these studies, variables such as impactor/vehicle weight, impact speed and relative stiffness of impacting bodies were examined; additionally, the effects of many parameters such as the size of the column, slenderness, reinforcement ratio and axial load ratio were investigated.
A small number of low-elevation impact tests have been performed. Demartiono et al. [43] examined the parameters of hoop spacing, impact velocity and boundary conditions on circular column impacts. It was concluded that the impact force duration and the dissipated energy increased with the increasing impact speed until the specimen reached its ultimate state. Li et al. [44] examined the effect of the longitudinal reinforcement ratio and impact velocity. In the study, the impact response was divided into three stages: the crack emerging stage, crack development stage and oscillation stage. Due to the inertial force effect, the deformation response comes after the impact force. Al-Bukhaiti et al. [45] examined the behavior of columns with different reinforcement configurations under various impact effects. It was concluded that the stirrups ratio might be increased to increase the specimen energy consumption capacity. Chen et al. [46] examined the effect of impact velocity, impact weight, slenderness and the axial load ratio. The studies by Demartino et al. [43] and Li et al. [44] were both carried out on scaled specimens with no axial loads. Al-Bukhaiti et al. [45] and Chen et al. [46] carried out studies on scaled specimens despite the presence of axial loads. Gurbuz et al. [47] conducted low-elevation impact tests on axially loaded RC columns and stated that columns designed as flexure-critical could present insufficient shear strength under impact. Therefore, conventionally designed roadside columns and parking lot columns could present poor performance against vehicle impacts regarding the conducted low-elevation impact tests on axially loaded full-scale specimens.
Although the behavior of full-scale axially loaded columns under low-elevation impact loads was previously investigated by Gurbuz et al. [47], in this study, in order to examine the effect of the impact energy on the behavior of axially loaded columns, the specimens were impacted from various dropping heights, and additionally, static experiments were performed to determine the change in the columns’ residual static capacities after the applied varied impact energies.
The residual static capacities of structural members after the impact loading were also investigated by researchers. The axial top impact was applied on scaled RC columns, and the slenderness, longitudinal reinforcement ratio and axial load ratio [48], as well as the impact velocity and shear–span ratio [49], parameters were investigated to examine the residual load capacity after the axial impact. Fan et al. [50] conducted mid-span impacts on circular columns and investigated the longitudinal reinforcement ratio, axial load ratio and impact velocity parameters; additionally, the column residual capacities after the impact effect were studied. In the high-energy impact scenario, axially loaded specimens were found to have almost twice the residual axial load capacity compared to unloaded specimens. However, shear-critical columns have been found to have lower residual axial load capacities than flexure-critical columns. Wei et al. [51] examined the effect of the impact velocity and impact weight experimentally on conventional and ultra-high-performance concrete columns. Al-Bukhaiti et al. [52] theoretically revealed the residual bending capacity with the help of internal forces resulting from numerical impact studies. All these residual capacity test studies [48,49,50,51,52] were carried out on scaled specimens, and none of them were low-elevation impact tests.
In this study, unlike other studies, the low-elevation impact behavior of square-section full-scale flexure-critical axially loaded reinforced concrete columns under different impact energies was investigated both experimentally and numerically. In addition to that, residual load-carrying capacities of the columns were also determined by conducting static loading tests on damaged specimens after the impact tests. This study, as known by the authors, is the first in the literature, examining low-elevation impact behavior and post-residual static capacities of axially loaded full-scale square reinforced concrete (RC) columns.

2. Experimental Preparation and Materials

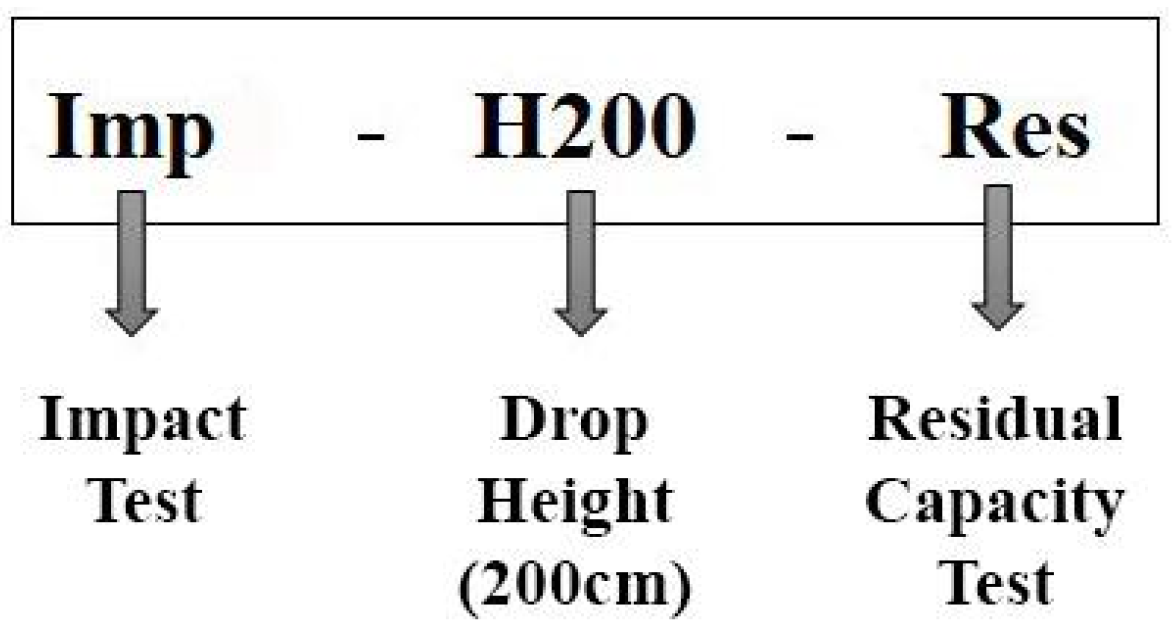
2.1. Experimental Program

In the experimental part, the behavior of the full-scale axially loaded reinforced concrete columns was investigated under different impact velocities. The impact load was applied as a low-elevation load to represent a vehicle impact on RC columns properly. Drop weight impact tests were applied on axially loaded specimens by dropping the same impactor from various drop heights. Thus, it aimed to obtain different damage levels in specimens by considering the impact height as an experimental parameter. The changes in the column static capacity after impact were also investigated, and the residual capacities of the columns were obtained. The notation of specimen names is shared in Figure 1. Table 1 presents the properties of the seven tested specimens in this research.
The first specimen (Sta) was tested under static loads only to obtain its static capacity. Impact force was applied to the rest of the six specimens by free dropping the 585 kg impactor from heights of 2.00, 3.00, 3.50, 4.00, 4.50 and 5.00 m, respectively. Thus, the behavior of RC columns against impact loads at different energy levels was investigated. The impact velocities and impact energy levels were calculated by using Equation (1) and are presented in Table 1. In the equation, m is the mass of the impactor, g is the gravitational acceleration, h is the drop height and v is the impact velocity of impactor. In the last stage of the experimental study, after the drop weight tests, a static loading was carried out on three specimens in order to determine their residual static capacities after the impact (indicated in the last column of Table 1). The residual capacity test results were compared with the Sta specimen.
E = m · g · h = 1 2 · m · v 2
The dimensions, reinforcement details and axial load level of the test specimens were chosen to represent conventional ground floor columns in low-rise buildings. In all specimens, the axial load level was kept constant, and the axial load ratio (n) was 10% (approximately 270 kN), which was calculated by using Equation (2). In the equation, n is the axial load ratio, N is the axial load level, fcm is the concrete compressive strength and bx and by are the dimensions of the column.
n = N f c m · b x · b y

2.2. Preparation of Specimens
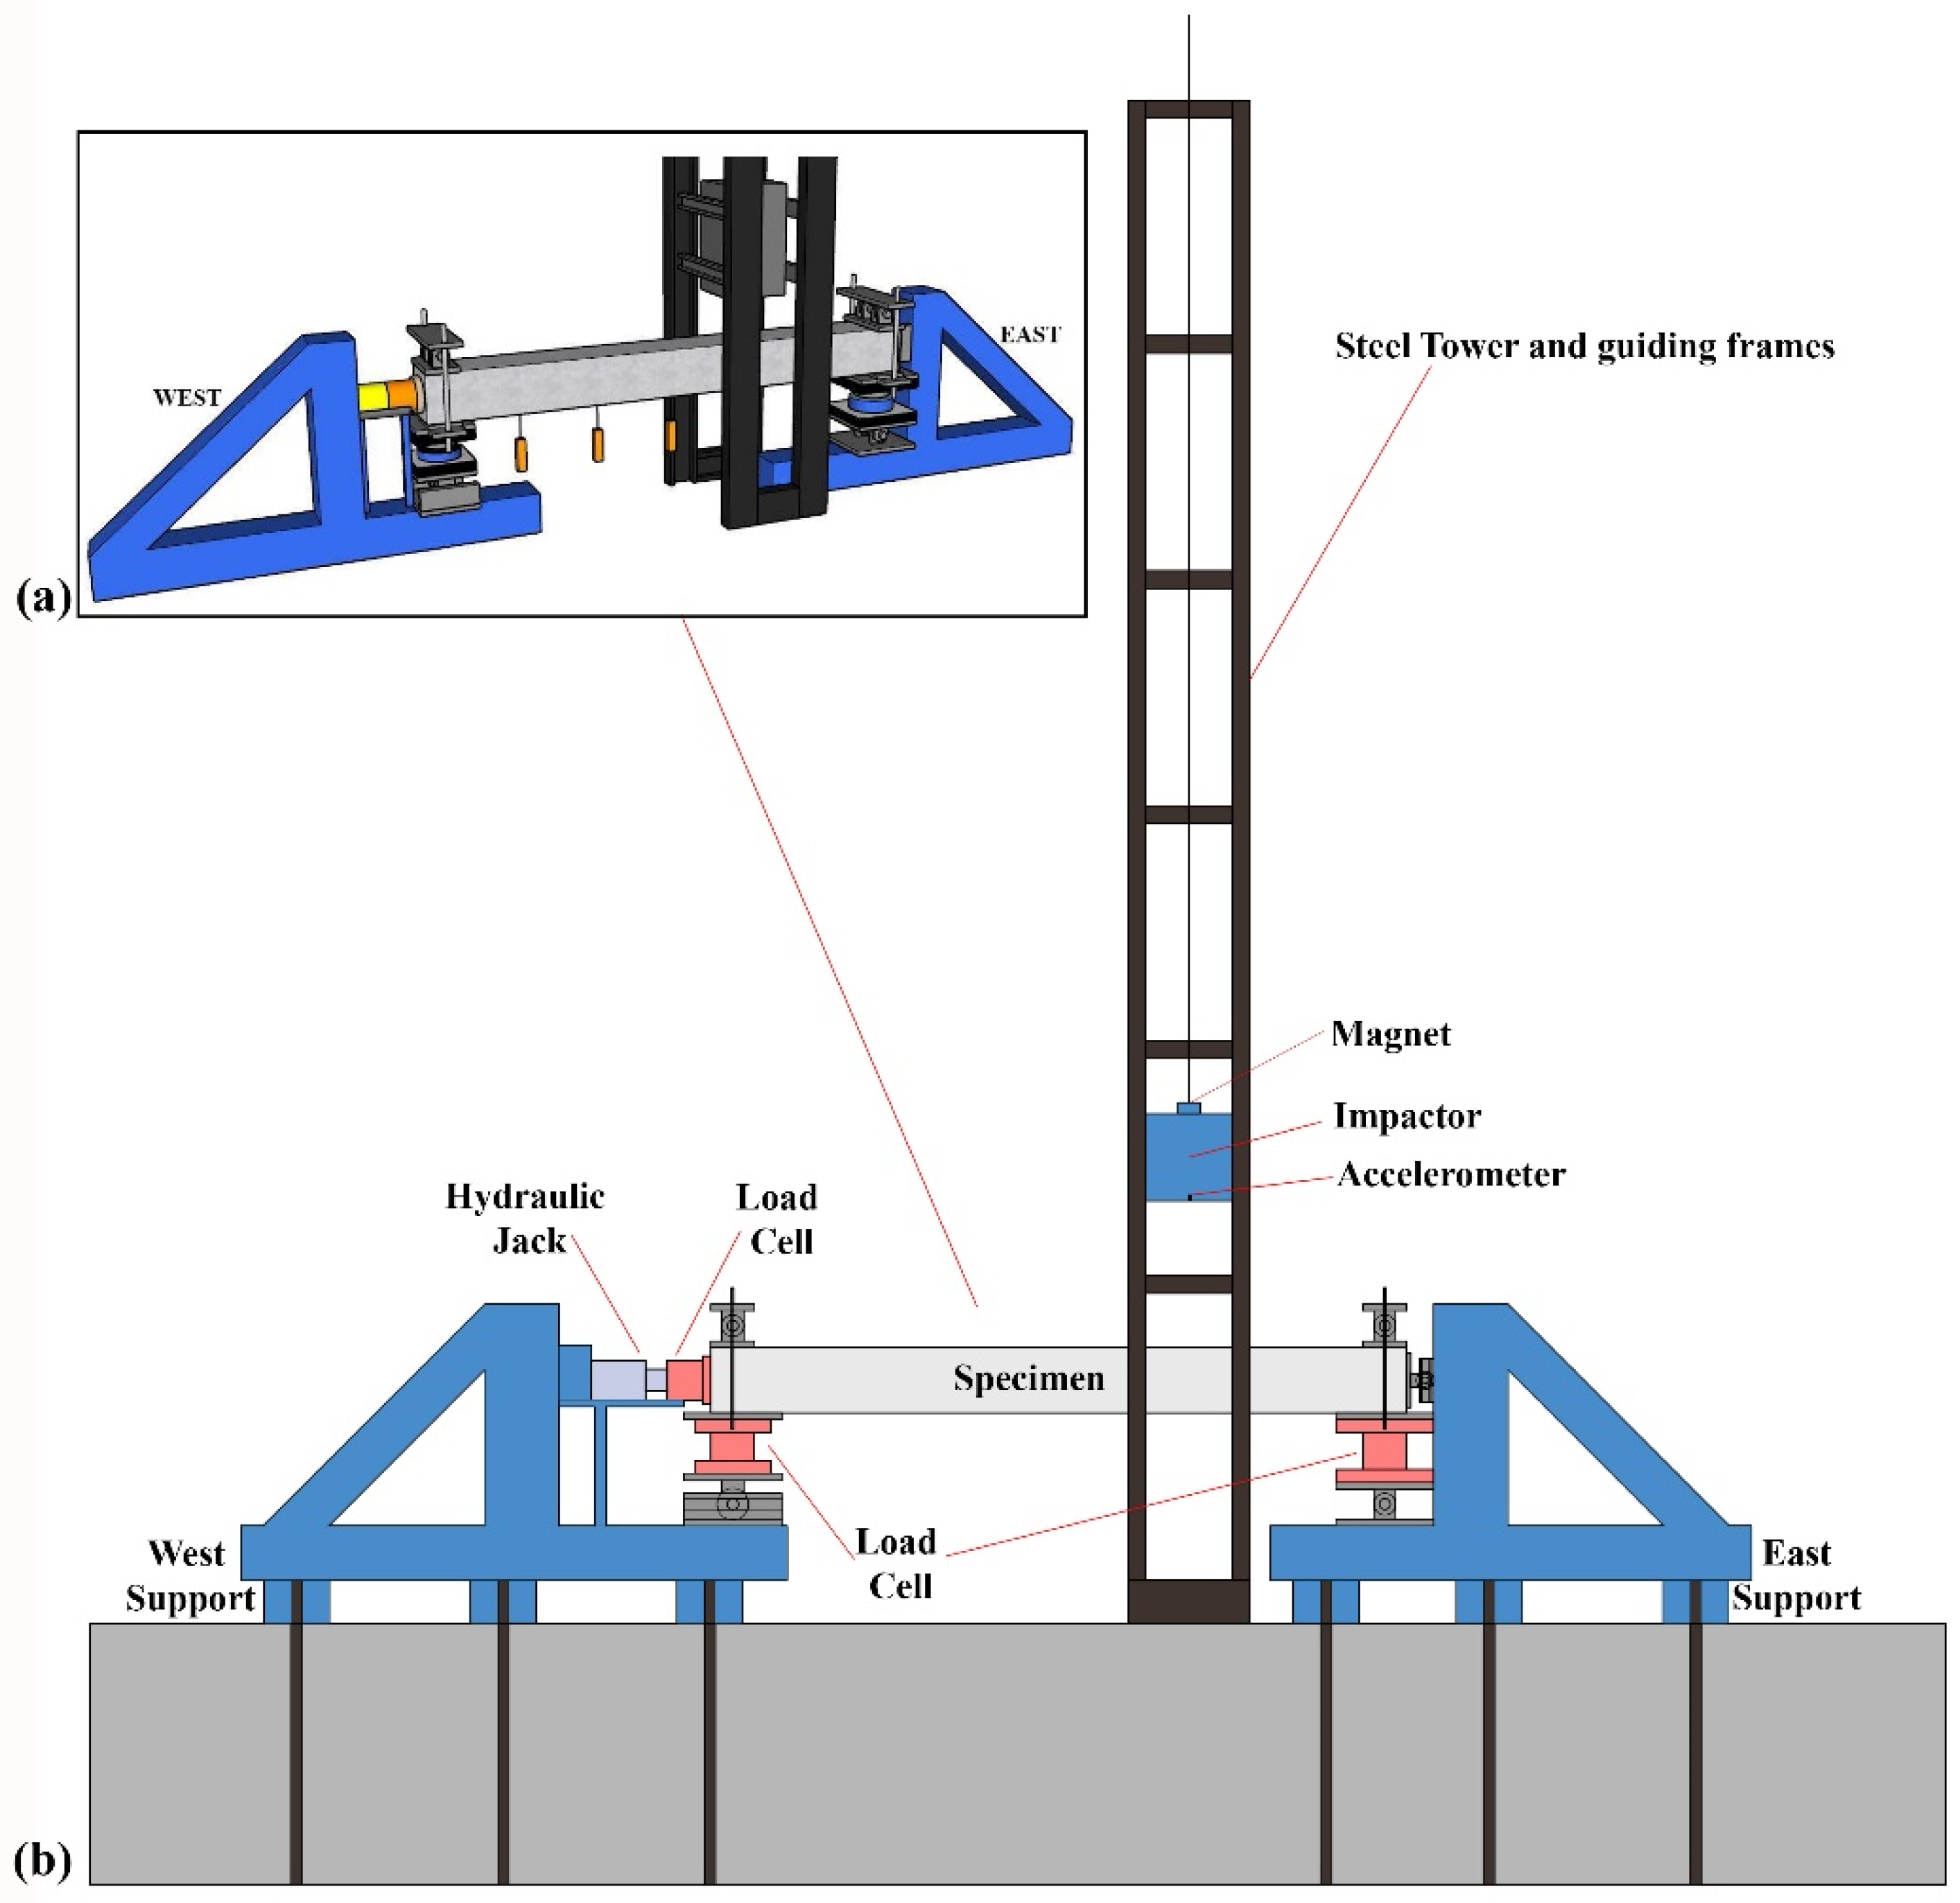
The sectional dimensions, longitudinal reinforcement ratios and material properties (steel and concrete) are identical in all the specimens. The dimensions and the reinforcement details of the identical specimens are shared in Figure 2. Deformed reinforcing bars are used for longitudinal and transverse reinforcements. The longitudinal reinforcement of the columns is 4Ø18 (ρmin = 0.01), and the shear reinforcement is Ø8/300. The shear capacities of the test specimens were calculated by using Equations (3) and (4). In the equation, Vcr is the cracking shear strength of the reinforced concrete section, fctm is the tensile strength of the concrete, bw is the width of the column, d is the effective depth of the column, Nd is the axial load level and Ac is the cross-sectional area of the column (where Nd/Ac should be in terms of MPa). The shear reinforcement contribution (Vw) was calculated by using Equation (4), where fywk is the yield strength of shear reinforcement steel, Asw is the area of transverse reinforcement, s is the stirrup spacing and d is the effective depth of the cross-section. By using Equation (5), the total shear strength (Vr) is taken as the sum of the concrete contribution (Vcr) and the shear reinforcement contribution (Vw). The total shear strength of the columns (Vr = Vcr + Vw = 84.6 + 42.3) is calculated as 126.9 kN, and then, the ratio of the shear/flexural strengths of the test specimens becomes Vr/Ve = 1.10, where Ve is the shear demand (the shear force when the specimen reaches its moment capacity). The ratio of the shear/flexural strengths of the test specimens highlights that the specimens are designed as flexural-critical under static loading.
V c r = 0.65 f c t m b w d ( 1 + 0.07 N d A c )
V w = A s w s f y w k d
V r = V c r + V w
During the preparation of the RC column specimens, the strain gauges were bonded on longitudinal and transverse bars, and they are presented in Figure 3. Six FLA-5-type strain gauges were used for each column specimen, two strain gauges were bonded on the two legs of stirrups closest to the impact area and two strain gauges were bonded on the bottom longitudinal reinforcing bars (Figure 3 and Figure 4a).
After the reinforced concrete column molds (30 × 30 × 320 cm specimens) were prepared, the reinforcement cage was placed in the mold. The concrete casting and vibration process was carried out in a way that would not damage the strain gauges, and the reinforced concrete column specimens were cured by watering for 14 days (Figure 4).

2.3. Test Setup

The experiments within the scope of the study were carried out at the İstanbul Technical University, Structural and Earthquake Engineering Laboratory. The impact test frame system presented in Figure 5 consists of a steel tower (that allows impact from a maximum height of 7.0 m) and two rigid steel reaction bases (east and west supports), which support the specimens. The specimens are placed horizontally during the test setup. An axial load was applied to the reinforced concrete column specimens with the help of a hydraulic jack placed on the western reaction frame. The axial load was measured with the help of a 1000 kN capacity load cell placed between the hydraulic jack and the specimen. The impactor (steel box with dimensions of 40 × 40 × 90 cm) was elevated to the target drop height by a crane, and then, the magnet of the impactor was released, and the weight freely dropped to impact the specimen following the guiding frame (Figure 5). Thus, the impact velocity and energy can be controlled in the drop weight test setup similar to previous studies [45,47,50,51].
The configuration of the supports, load application area and the used instruments is presented in Figure 6. The lateral impact load was applied 1.0 m away from the east support. The contact area of the loading was 40 × 40 cm. The western support of the reinforced concrete specimen is designed as a roller support, and the eastern support is designed as a simple support. A roller support was placed between the eastern reaction base and the specimen to allow the specimen to rotate freely (Figure 7d). Load cells with a capacity of 1000 kN on the western support and a capacity of 2000 kN on the eastern support were placed between the specimen and the supports to measure the support reactions. Thus, unlike previous studies [45,47,50,51], the reaction forces could be measured during the tests. In order to measure the acceleration during and after the impact, an accelerometer with a capacity of 5000 g was placed on the drop weight impactor (Figure 7b). In order to measure the displacements on the specimen, five displacement transducers (P50, P100, P150, P200 and P250) were placed under the specimen with 50 cm spacings (Figure 6 and Figure 7a). After the experiment, the location and width of the cracks formed in the specimens were detected, and the crack maps were drawn. Some photos from the test setup are presented in Figure 7.
The static loading system was formed by rearranging the impact loading system. The static test setup is presented in Figure 8. The east and west reaction bases for the axial load system support conditions are identical to the impact loading system. After impact loading, the steel tower was removed, and the static test was conducted with the help of three rigid steel profiles and tension rods.
A hydraulic jack with a capacity of 1000 kN was placed between the rigid steel profile and reinforced concrete column specimen and tied with high-strength steel tension rods. The static load was applied at the same location as the impact load (1.0 m away from the east support) with the help of this hydraulic jack. The location of the instruments is the same as in the impact tests (Figure 9).

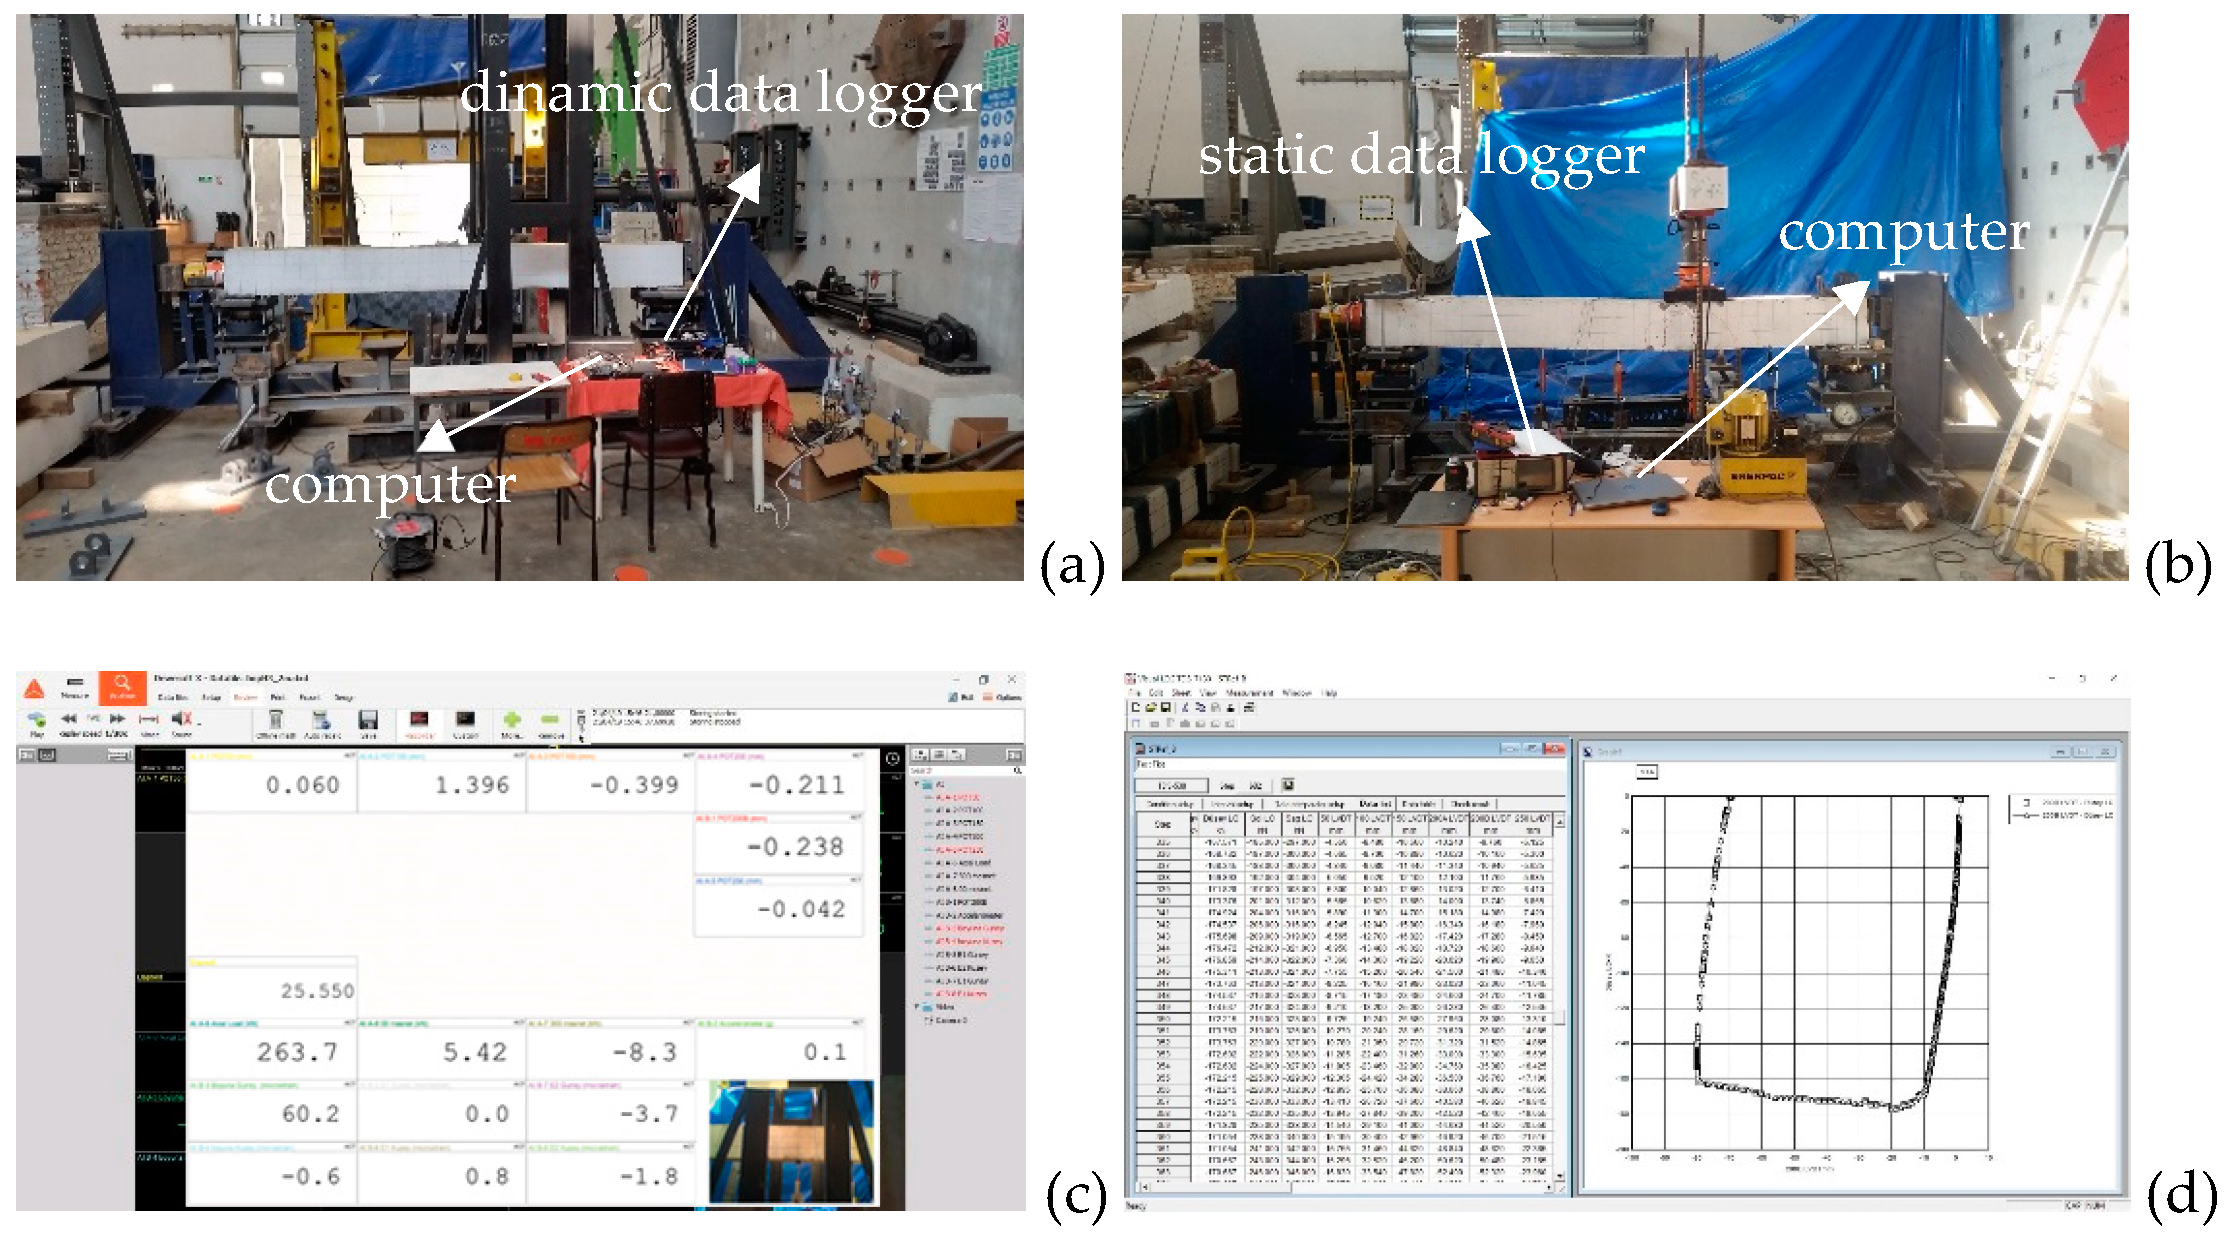
2.4. Data Collection

Before the experiments, all instruments were calibrated in the ITU Construction Materials Laboratory, and the calibration coefficients were determined. The instruments and the strain gauges were connected to the data collection system, and the data during the experiment were monitored and recorded by a computer. During the impact tests, data measurements were recorded with a DEWE-43A dynamic data logger [53] at 10 kHz, and in the static tests, a TDS-540 static data logger was used [54]. Data analyses were made with Dewesoft X3 [55] and TDS-7130 [56] software (Figure 10). The experimental process was recorded with a high-resolution camera to obtain the stages of the damage mechanism during impacts. In addition, data verification was made with the displacement measurements obtained from the potentiometers and with the video images.

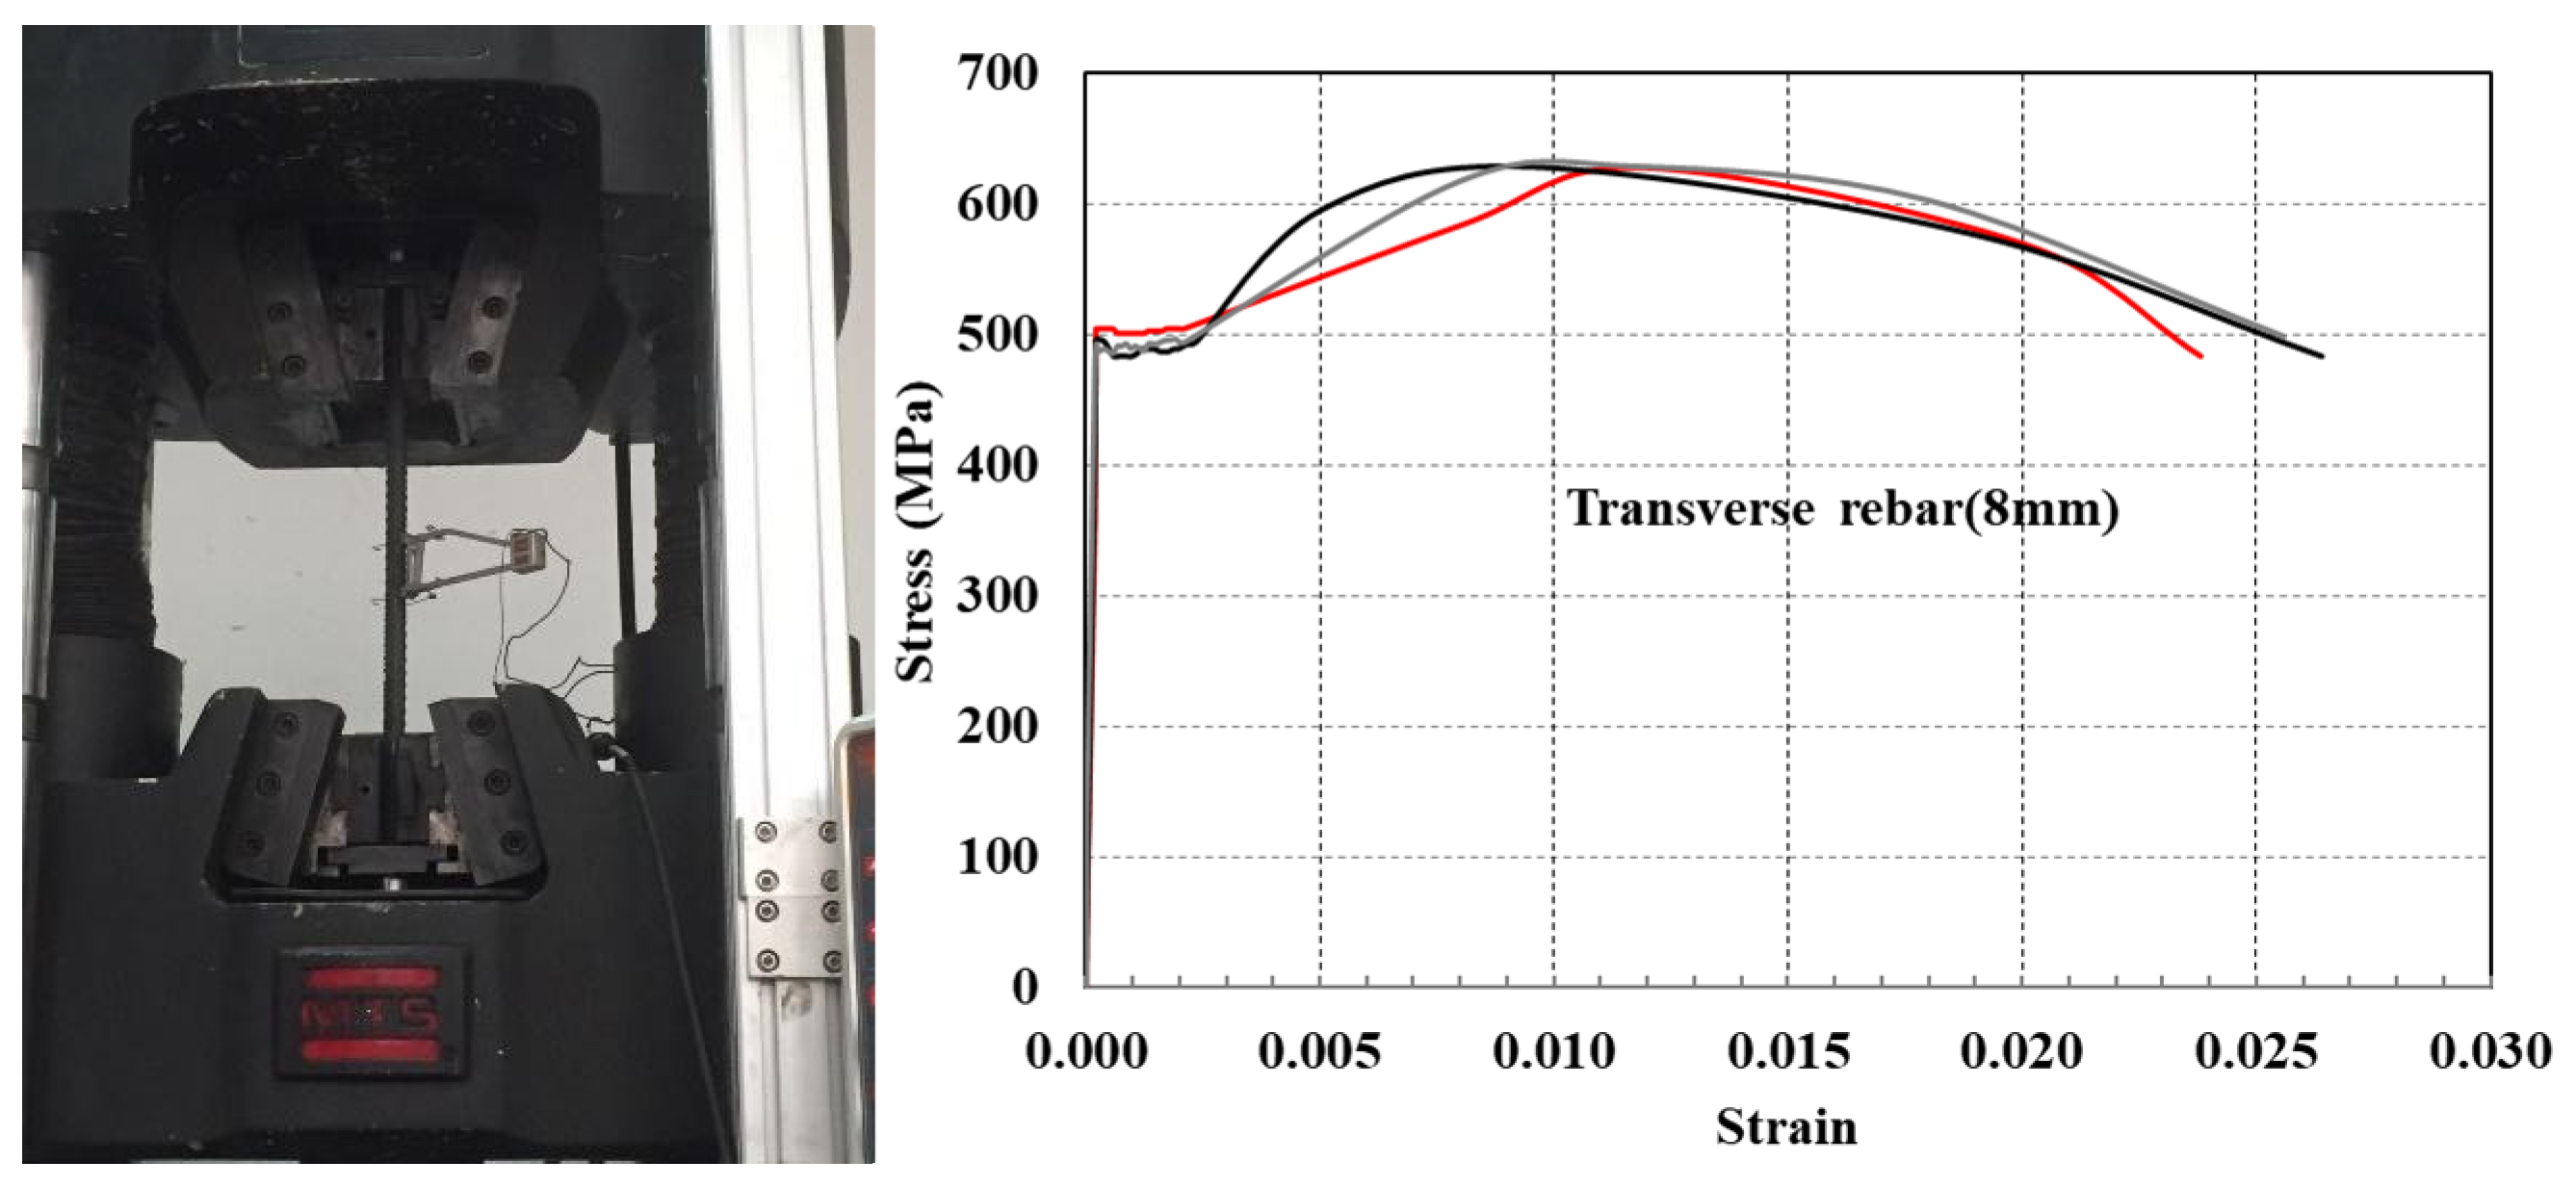
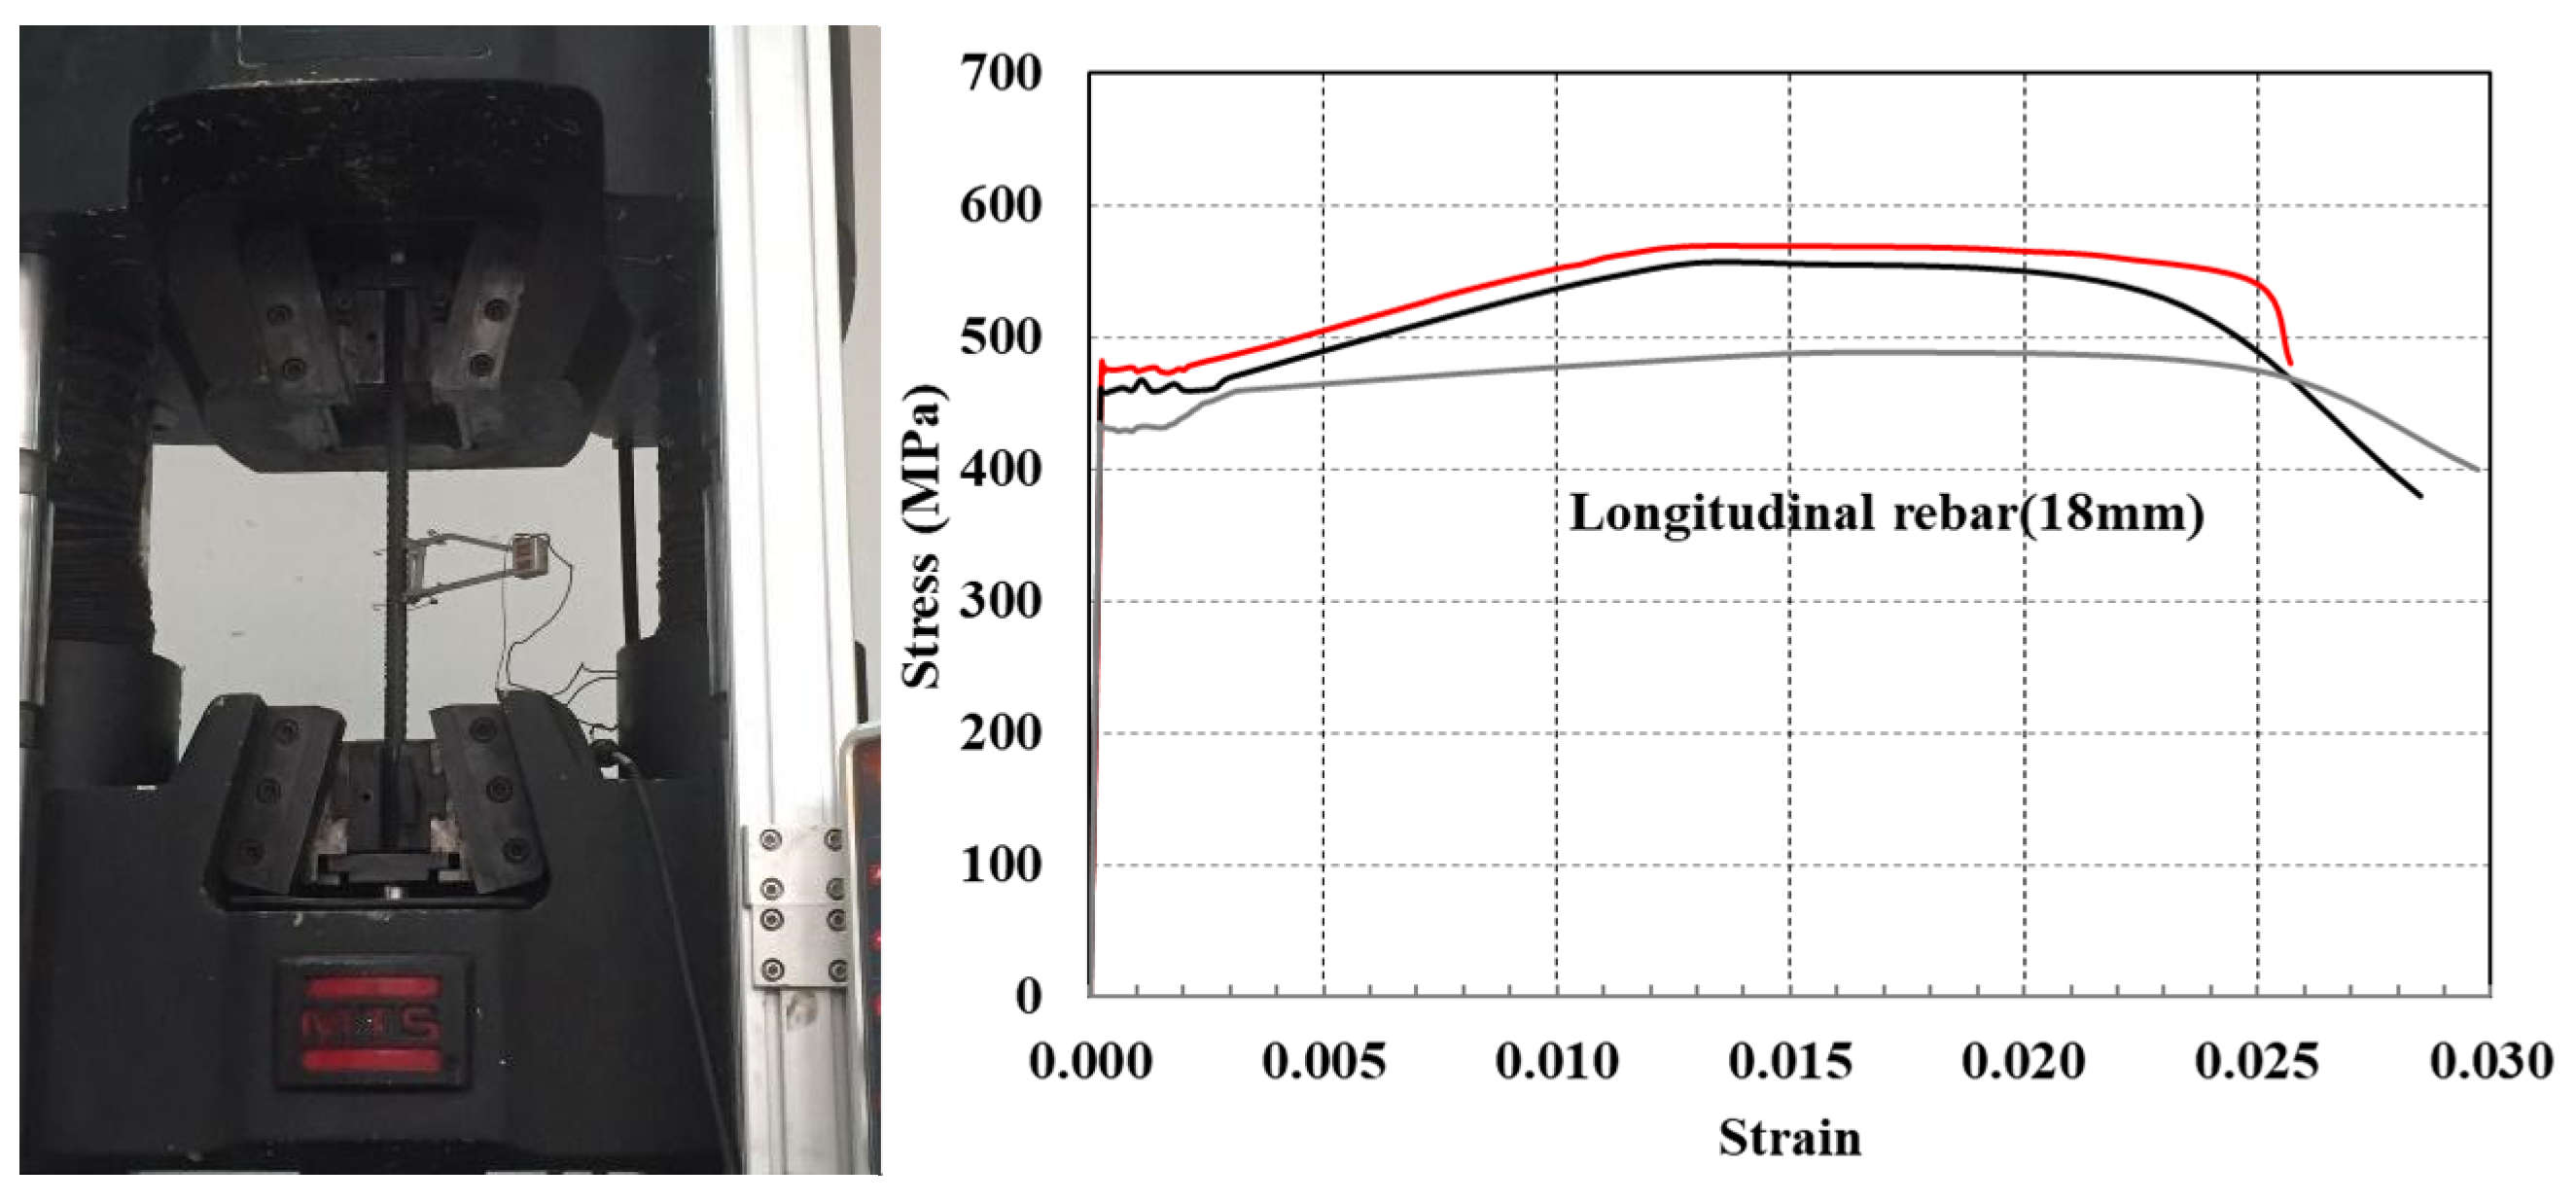
2.5. Material Properties of the Specimens

Compressive strength tests were carried out on three standard cylinder (150 × 300 mm) concrete specimens around test days 704, 712 and 730, in accordance with the TS EN 12390-3 standard [57]. The stress–strain relationship of the concrete specimens is presented in Figure 11, and the average compressive strength of the concrete is presented in Table 2.
Tensile strength tests were carried out, in accordance with the TS 708 standard [58], on longitudinal reinforcement bars (18 mm) and stirrup bars (8 mm). Three specimens were tested from each diameter. The stress–strain relations of the stirrups and longitudinal bars are presented in Figure 12 and Figure 13, respectively.
The concrete mix proportions, average compressive strength of the concrete cylinders around the test days and the average mechanical properties of the steel-reinforcing bars are summarized in Table 2.

3. Experimental Study

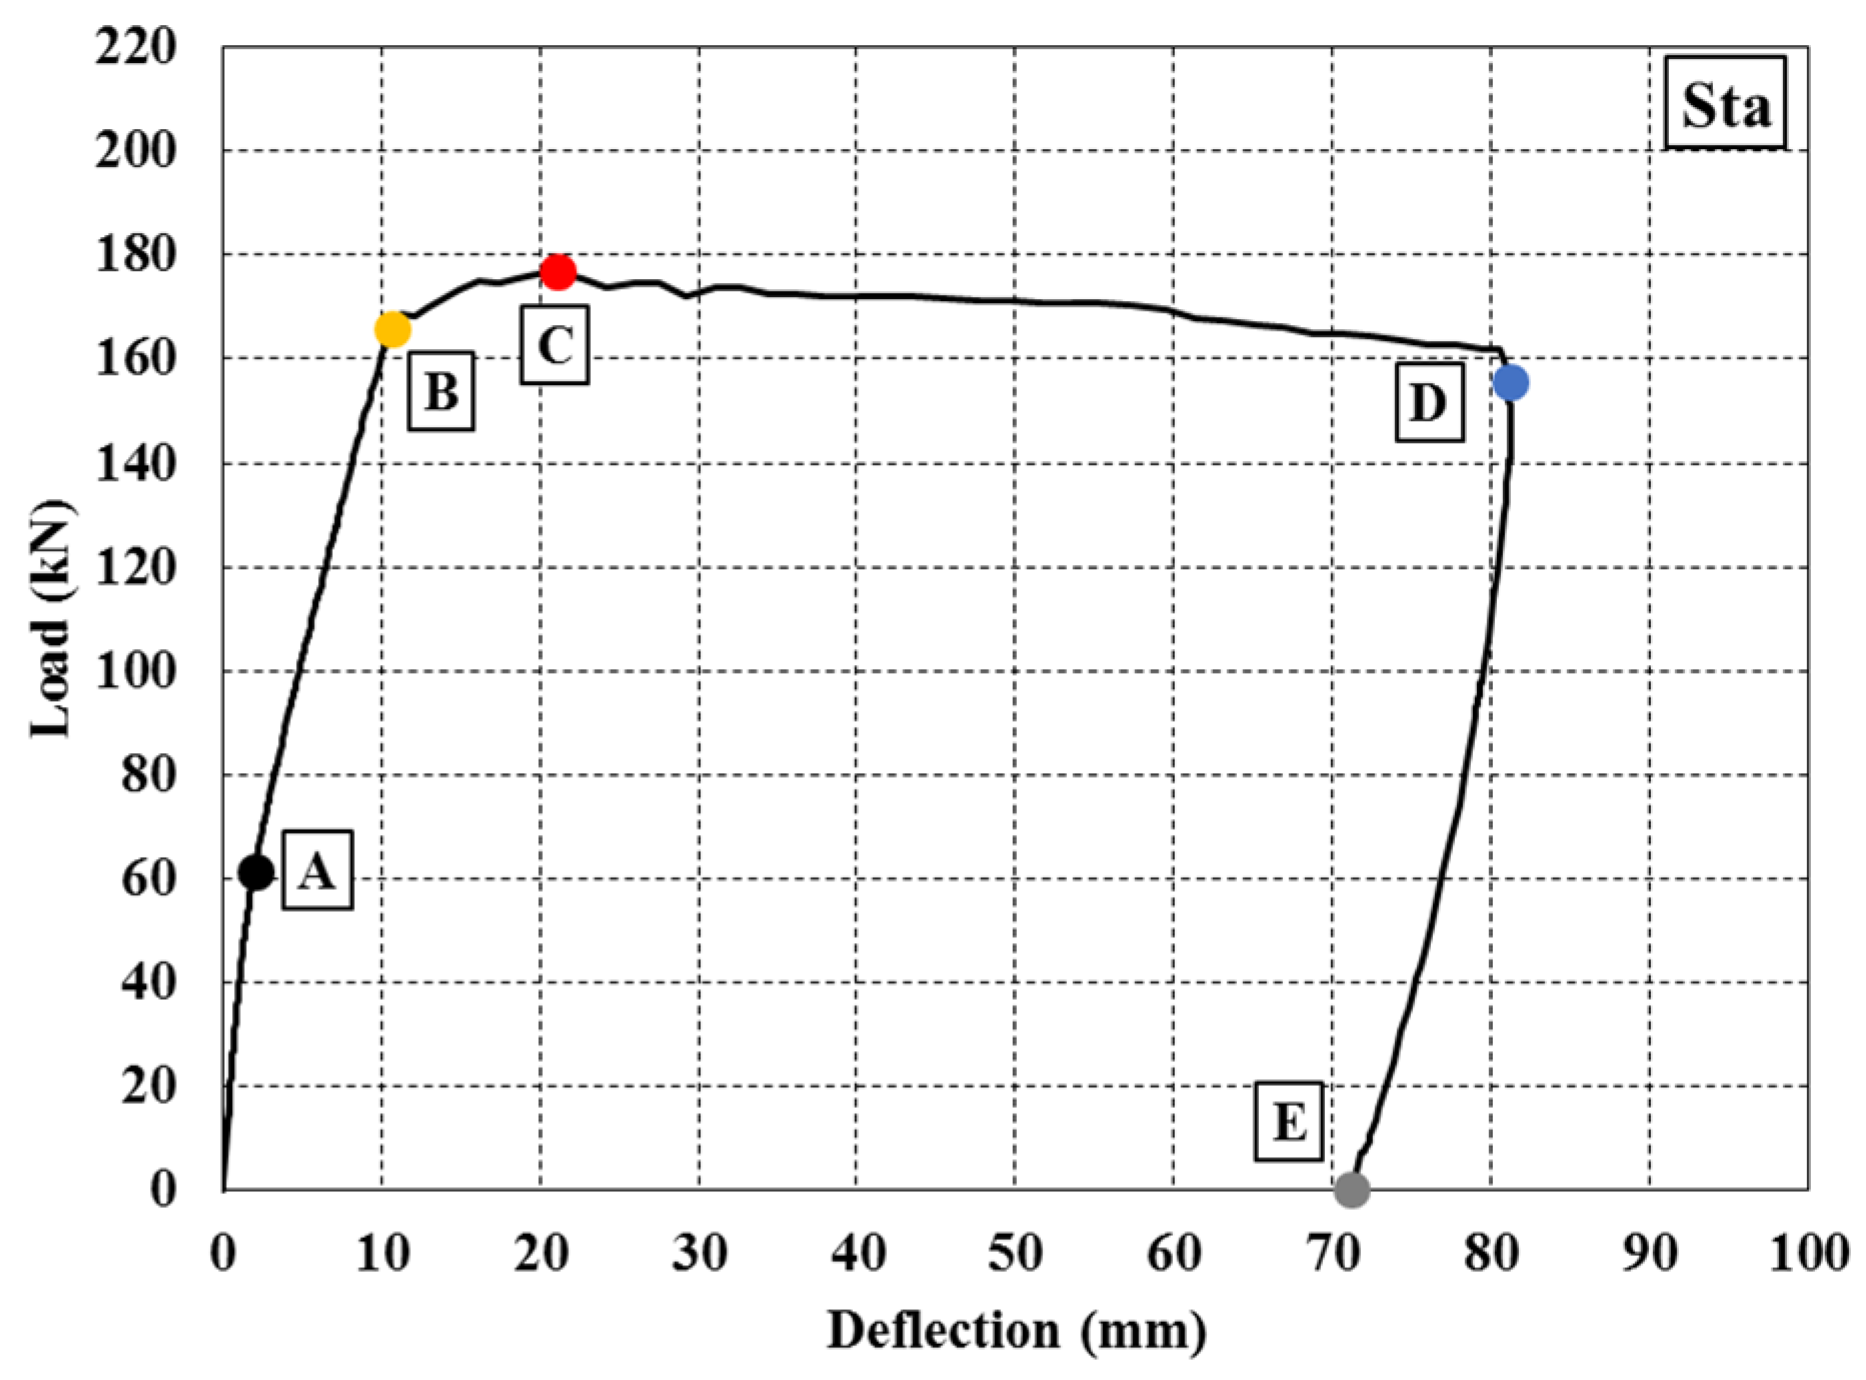
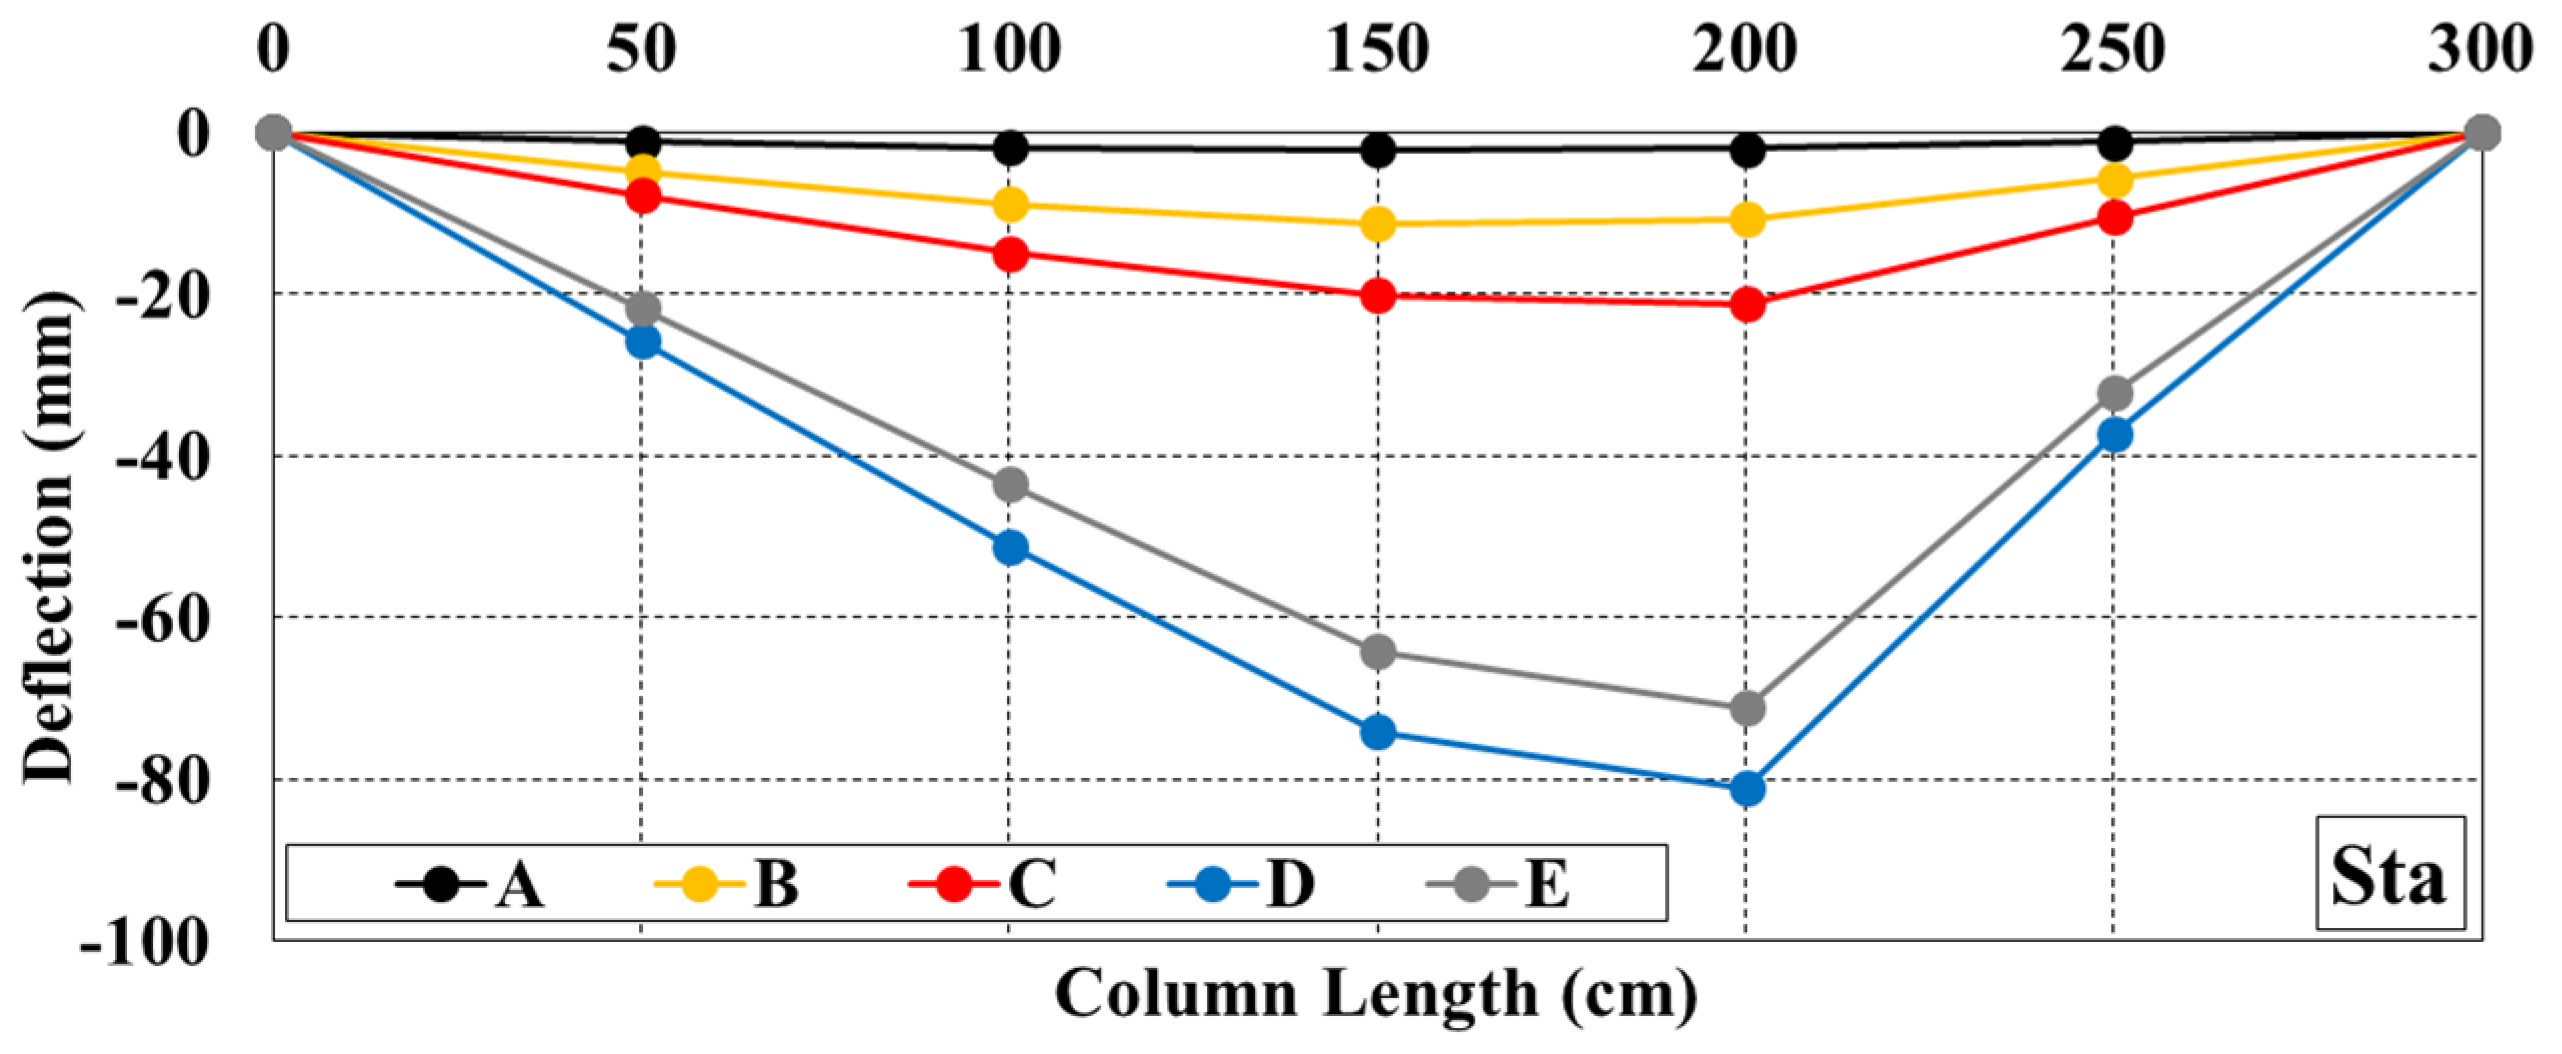
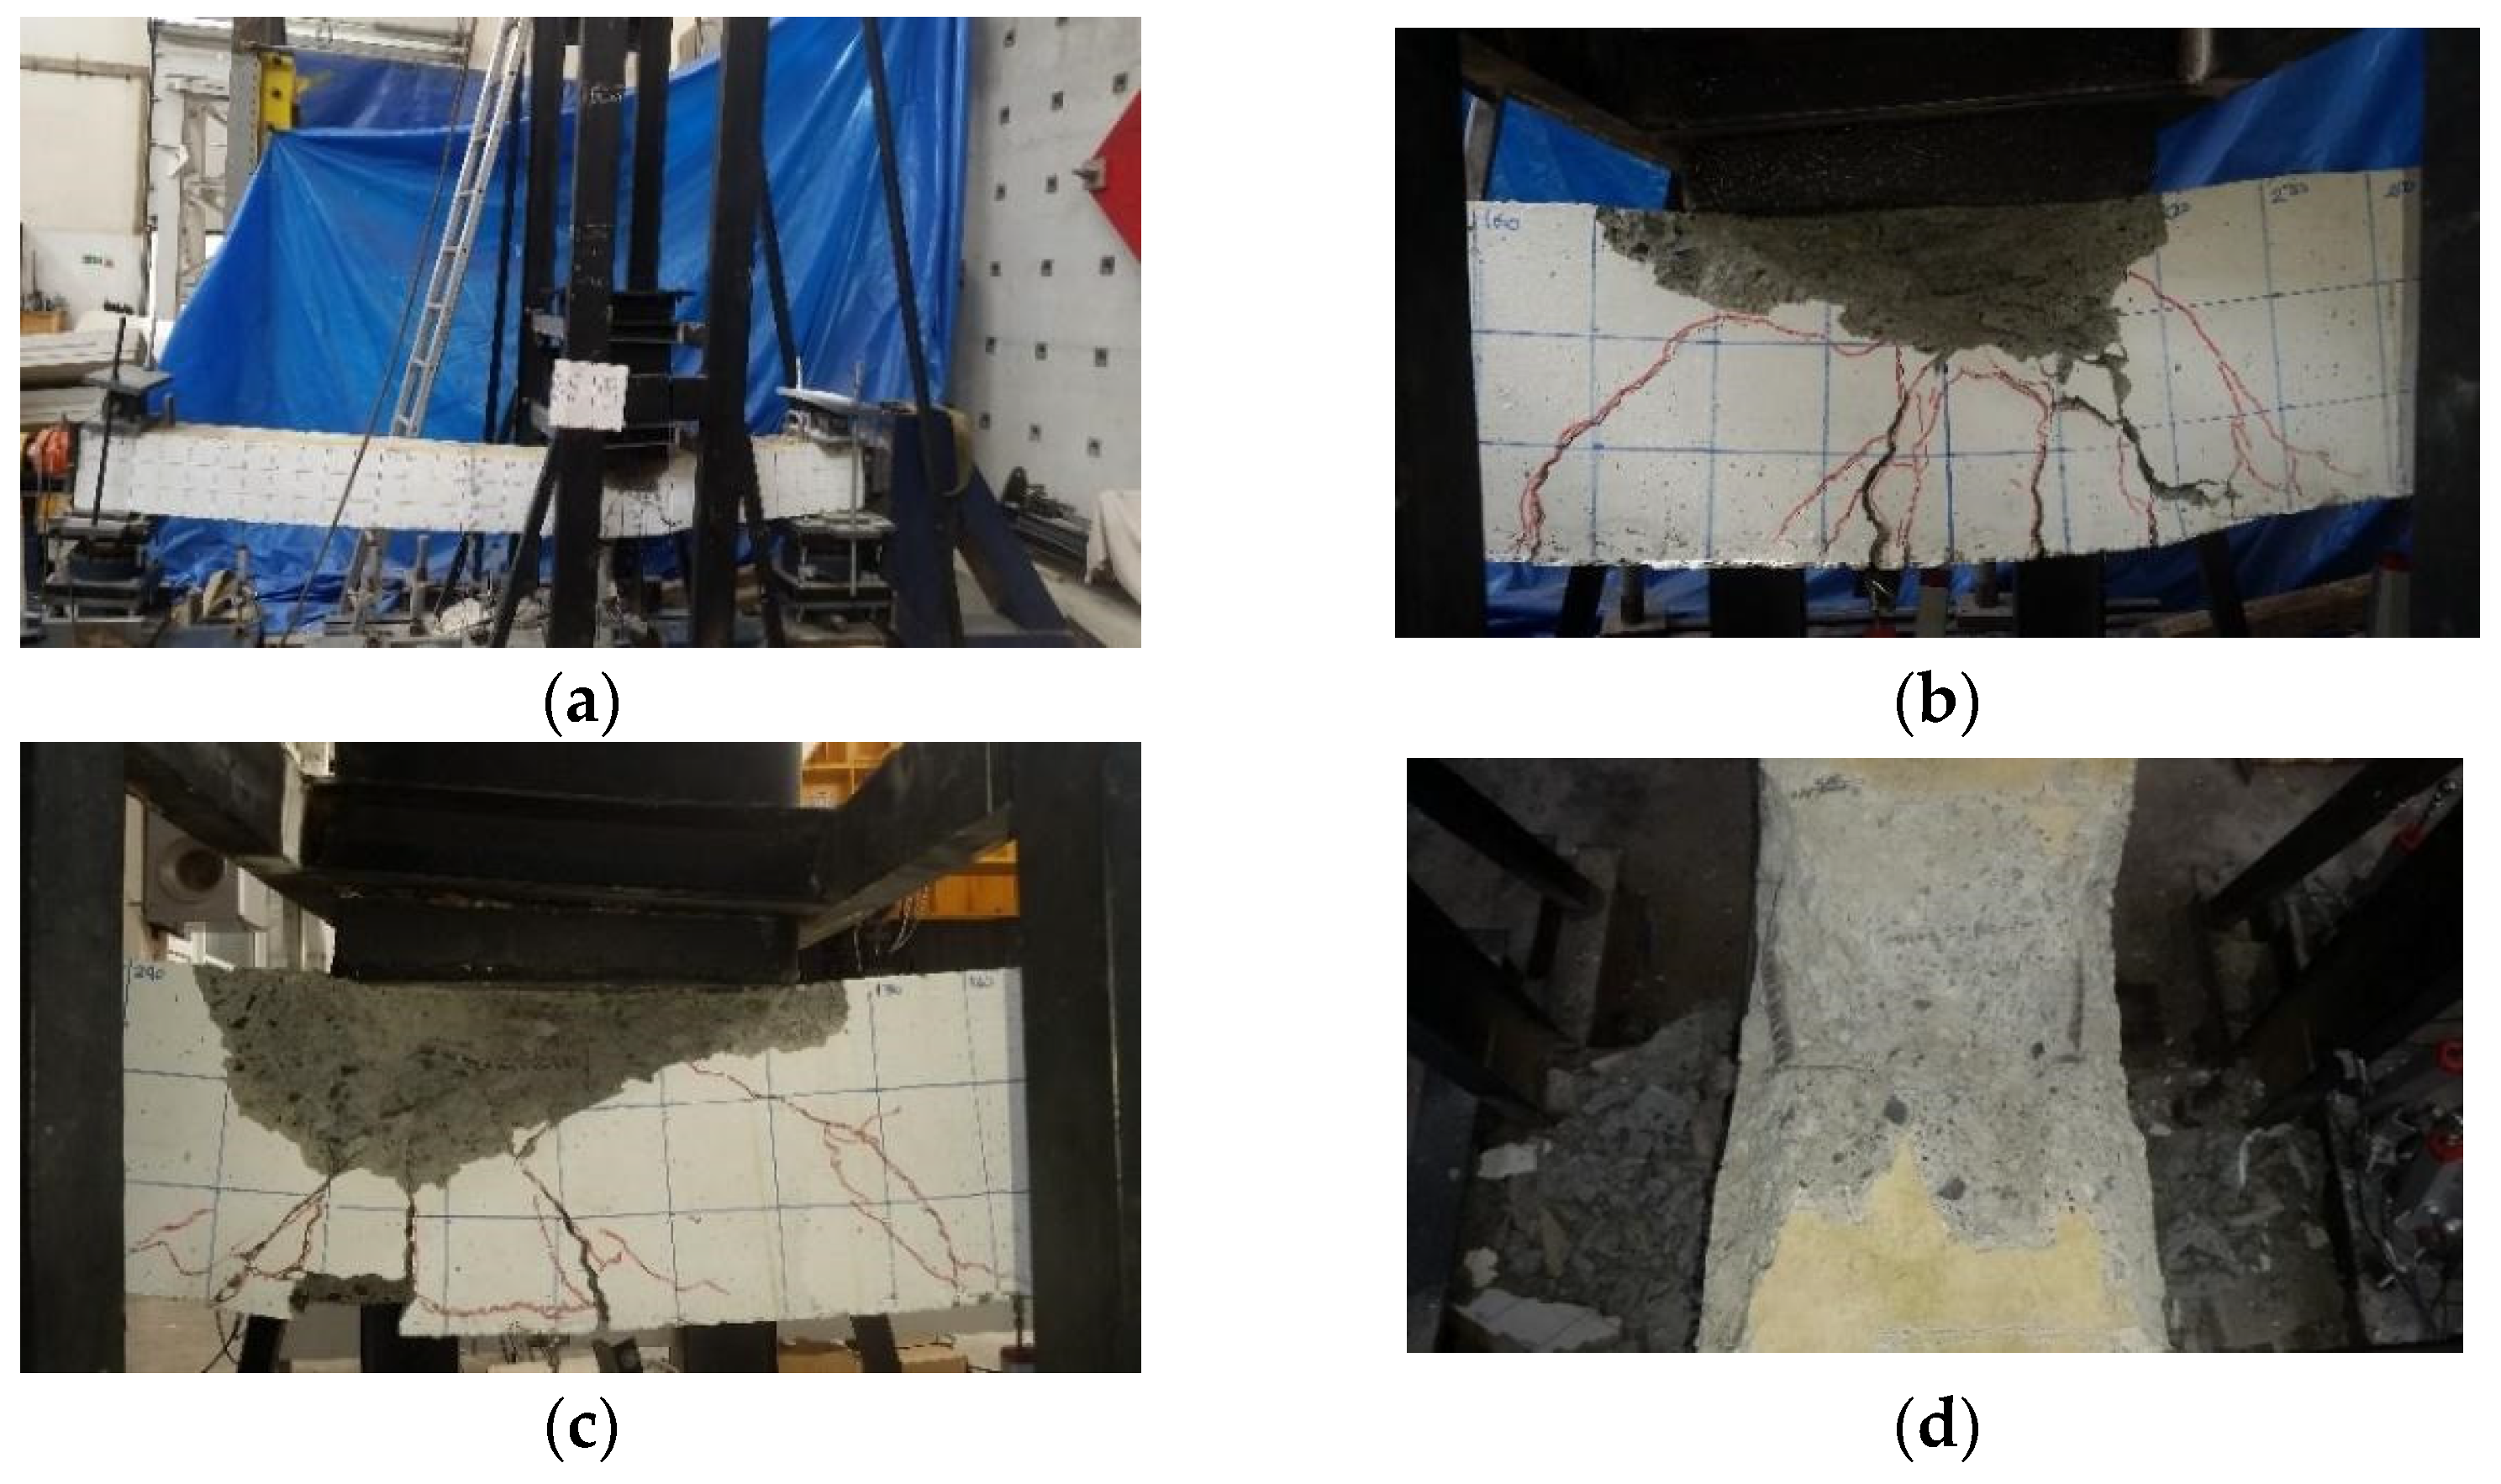
3.1. Static Test Results

During the static tests, the load was applied to the same location (1.0 m from the east support) as the impact loading. The axial load level was 270 kN. The displacements on the reinforced concrete column and the strains of the rebars were measured. The load–displacement curve of the Sta specimen is presented in Figure 14. The load increased incrementally; the first flexural cracks appeared at the load level of 61 kN (point A). When the load reached 166 kN, the reinforcements began to yield; after then, the crack widths and displacements increased rapidly (point B). The specimen reached its load carrying capacity at 176 kN (point C). When the displacements reached 81 mm, crushing of the concrete started at the top (point D). After the crushing, the specimen was unloaded. The residual displacement was measured as 71 mm when the load was completely removed (point E). The deflected shape of the Sta specimen in each loading level is presented in Figure 15, where point E represents the residual deflected shape.
The variations of the strains in the longitudinal rebars (La and Lb) and stirrups (T1a) during the static test are shared in Figure 16. The measurements were stopped by the damage of the strain gauge cables due to the extensive increase in the crack widths after the yielding of the longitudinal rebars. During the static test, when the strain data of the bottom longitudinal reinforcements at the loading region were examined, it was observed that the longitudinal bars began to yield after a load level of 166 kN. This load level can also easily be detected as the yielding load at the load–displacement curve of the Sta specimen (Figure 14). Even after the yielding load, it was observed that the strains in the longitudinal reinforcements increased and exceeded the 1.0% limit. In addition, the transverse reinforcements did not reach their yielding strain. The strain data collected during the static test also confirmed that the failure mechanism under static loading was bending.
At the end of the test, the largest crack width was measured as 15 mm. The crack map is presented in Figure 17, and the specimen photos after the test are also presented in Figure 18. During the static test, flexural cracks appeared first at the bottom side, around the loading region; then, they became widespread with the increased loading, and the width of the flexure cracks increased. In the later stage of the test, when the top concrete reached the crushing strain, the Sta specimen failed by flexure.

3.2. Impact Test Results
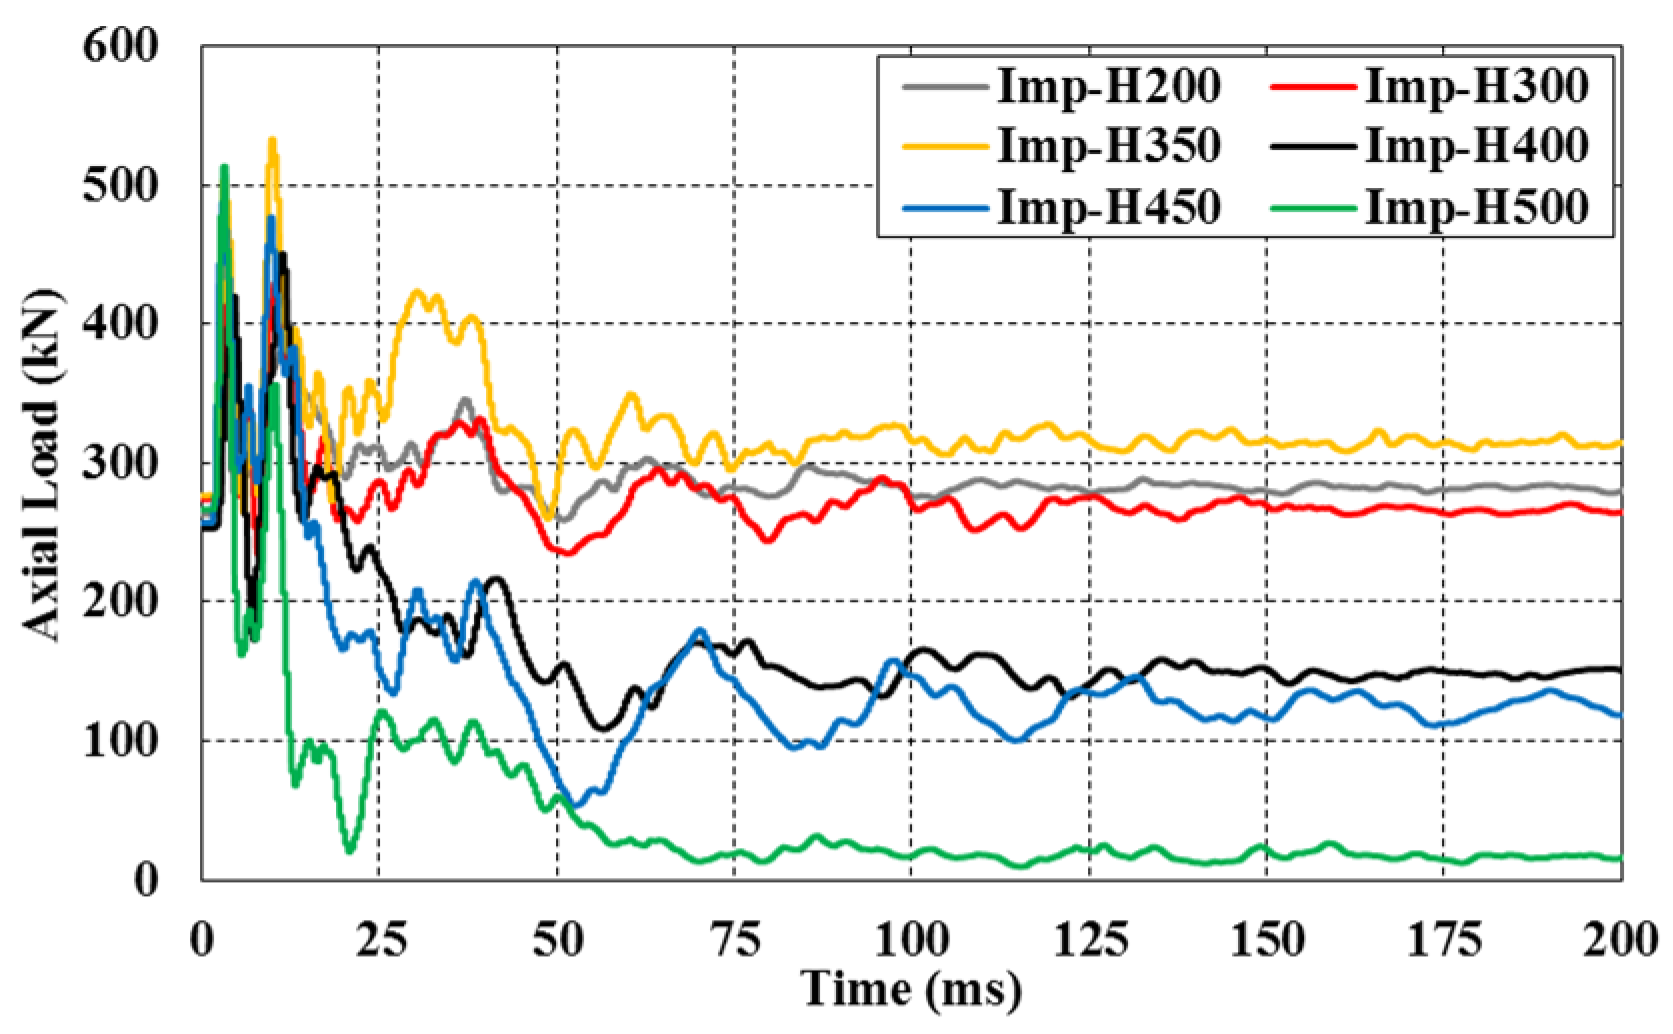
3.2.1. Axial Load

A constant axial load of 270 kN was applied to all specimens. The axial load levels varied during the impact duration, reaching the local maximum values at around 3 ms, 7 ms and 10 ms and the local minimum values at around 5 ms and 8 ms after the time of the impact. The axial load level became almost stable, with small fluctuations after 100 ms to 200 ms (Figure 19). The axial loads in the Imp-H200, Imp-H300 and Imp-H350 specimens reached up to 362 kN, 433 kN and 504 kN, respectively. At 200 ms, the axial load fluctuation almost finalized, and the axial load value of Imp-H200 and Imp-H300 went back to the pre-test level (around 270 kN); additionally, in Imp-H350 and Imp-H400, the axial load level after the test were 315 kN and 225 kN, respectively. The axial load level after the impact dropped dramatically below the pre-test axial load level in the Imp-H450 and Imp-H500 specimens. The residual axial load levels were 117 kN in Imp-H450 and 18 kN in Imp-H500. Since these two specimens were impacted with higher energies, they sustained severe damage and made large deflections. Therefore, their horizontal length was shortened, and their contact with the hydraulic jack at the pinned end was hindered. As a result, the significant decrease in the initial axial load level on these specimens was observed after the tests due to heavy damage and the resulting change in geometry. However, it should be noted that these fluctuations in the axial load levels can also be observed in an actual vehicle collision against axially loaded columns.

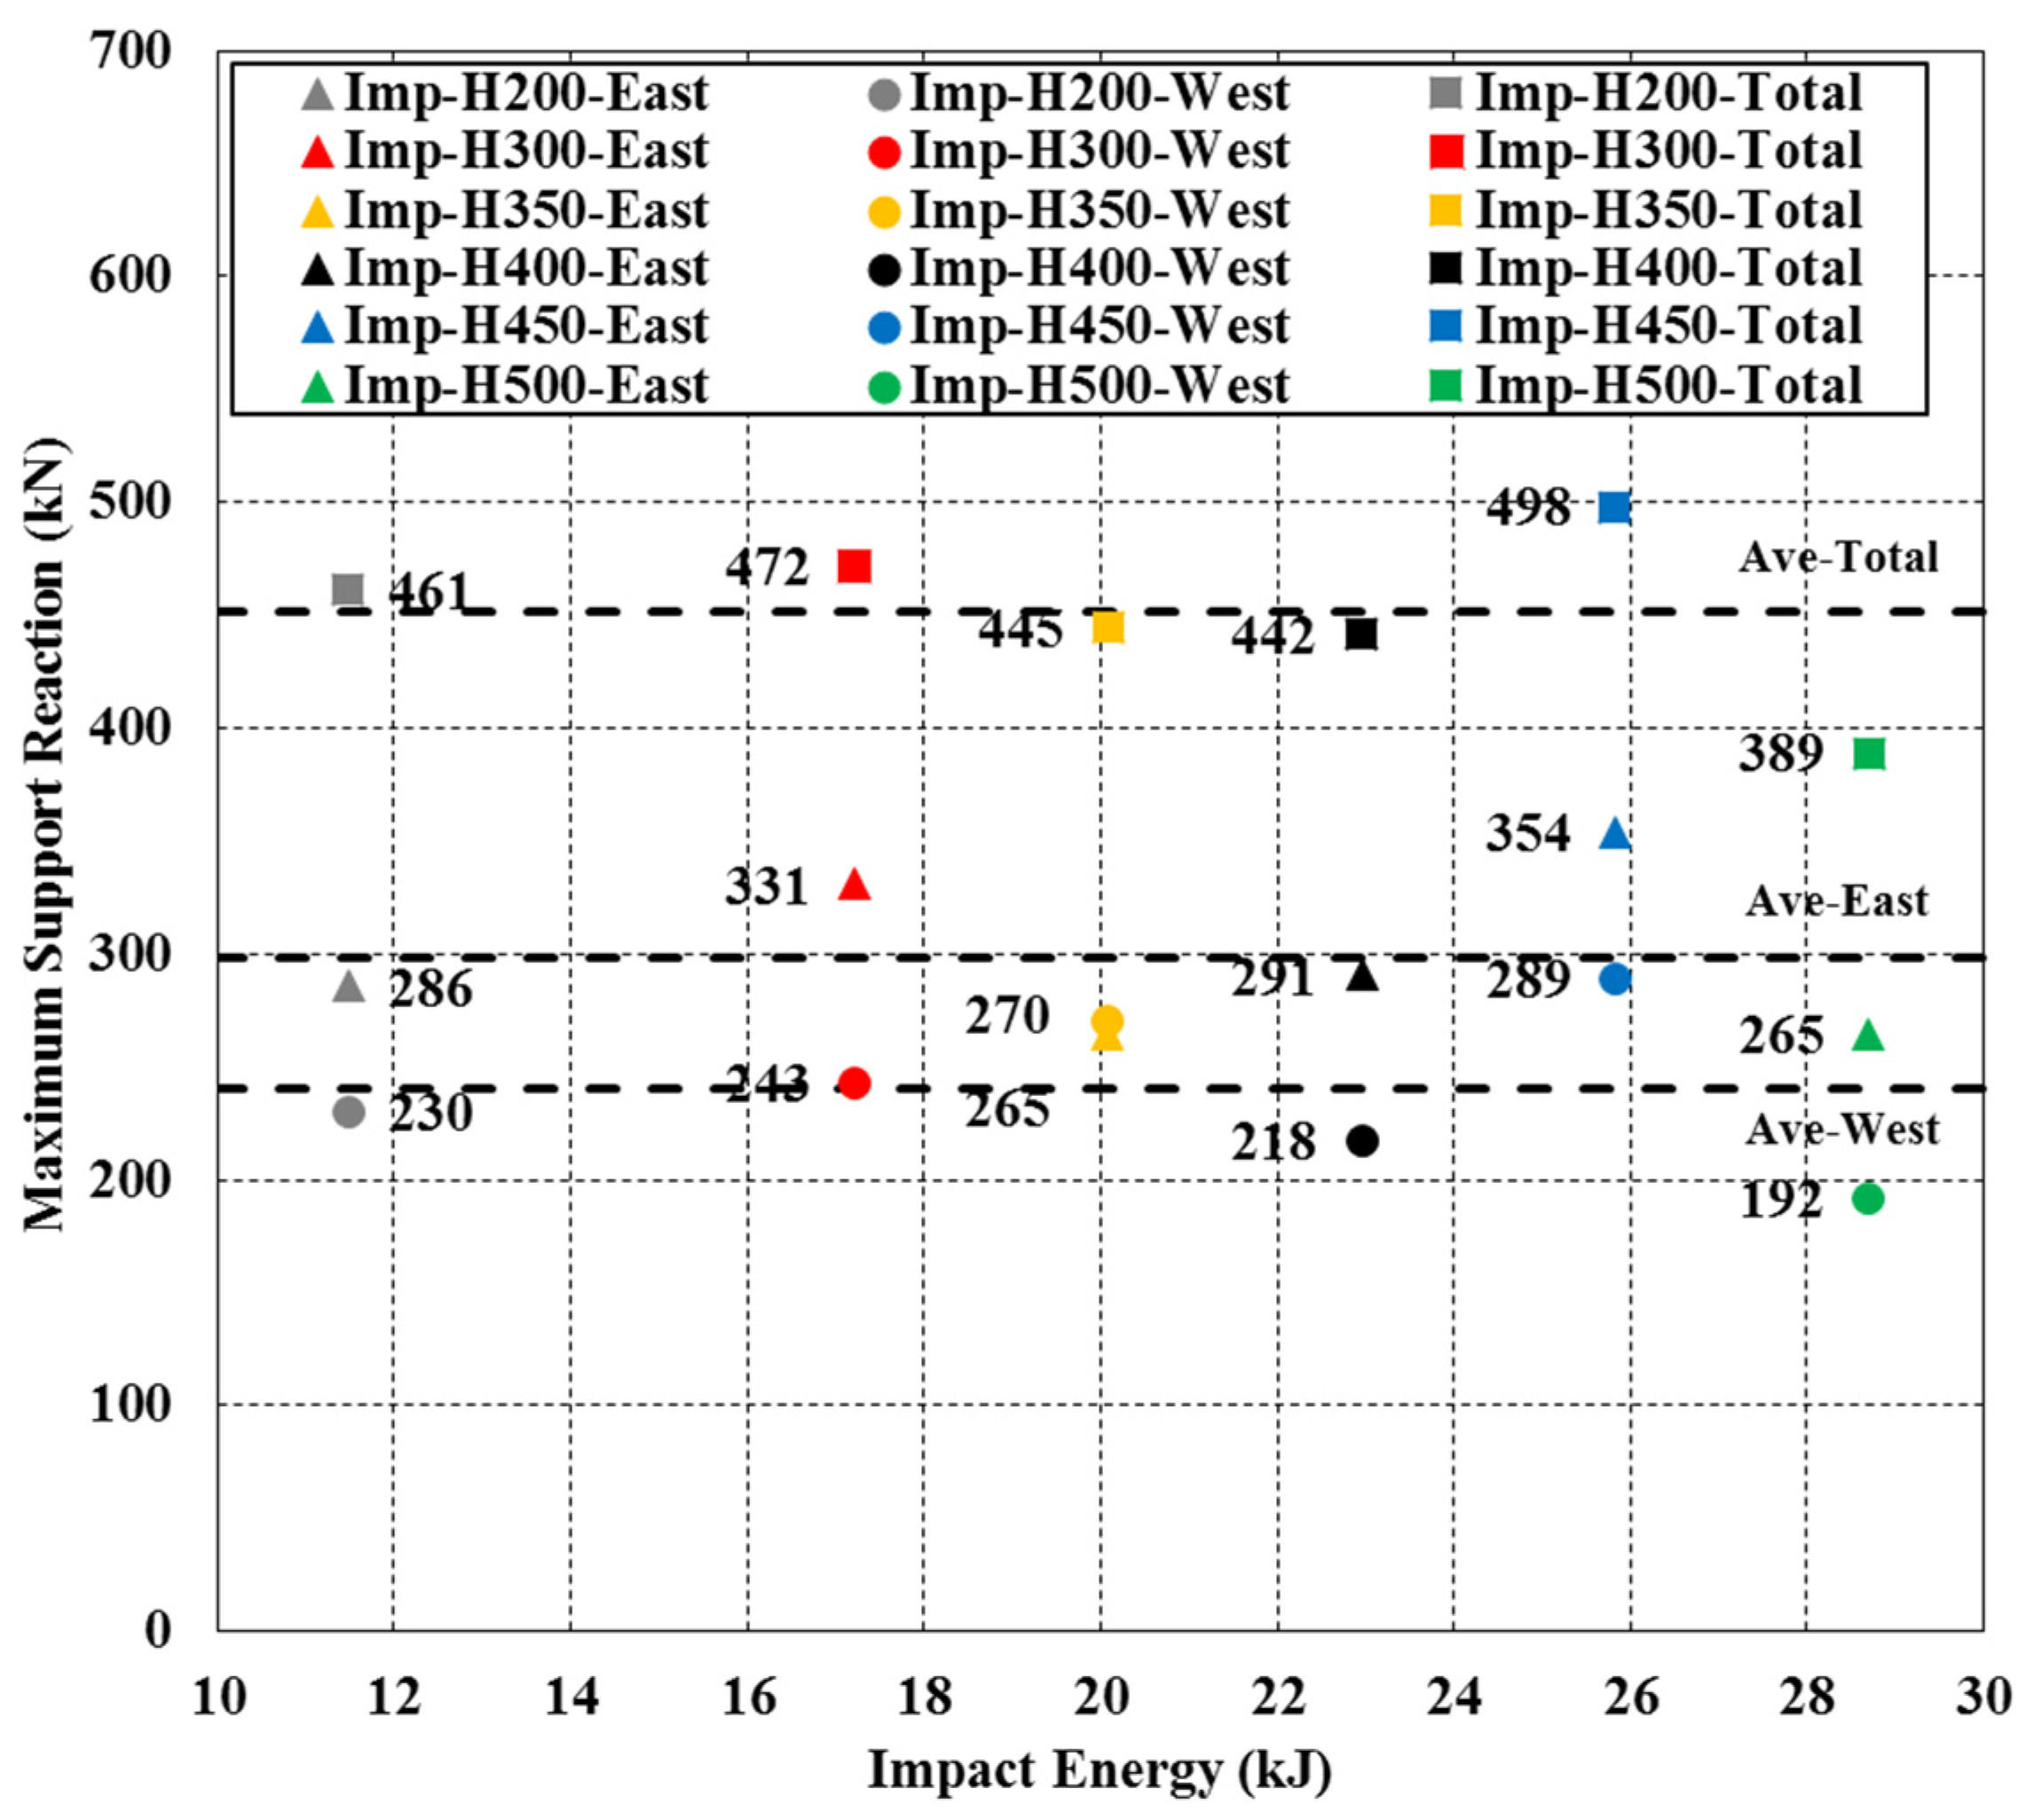
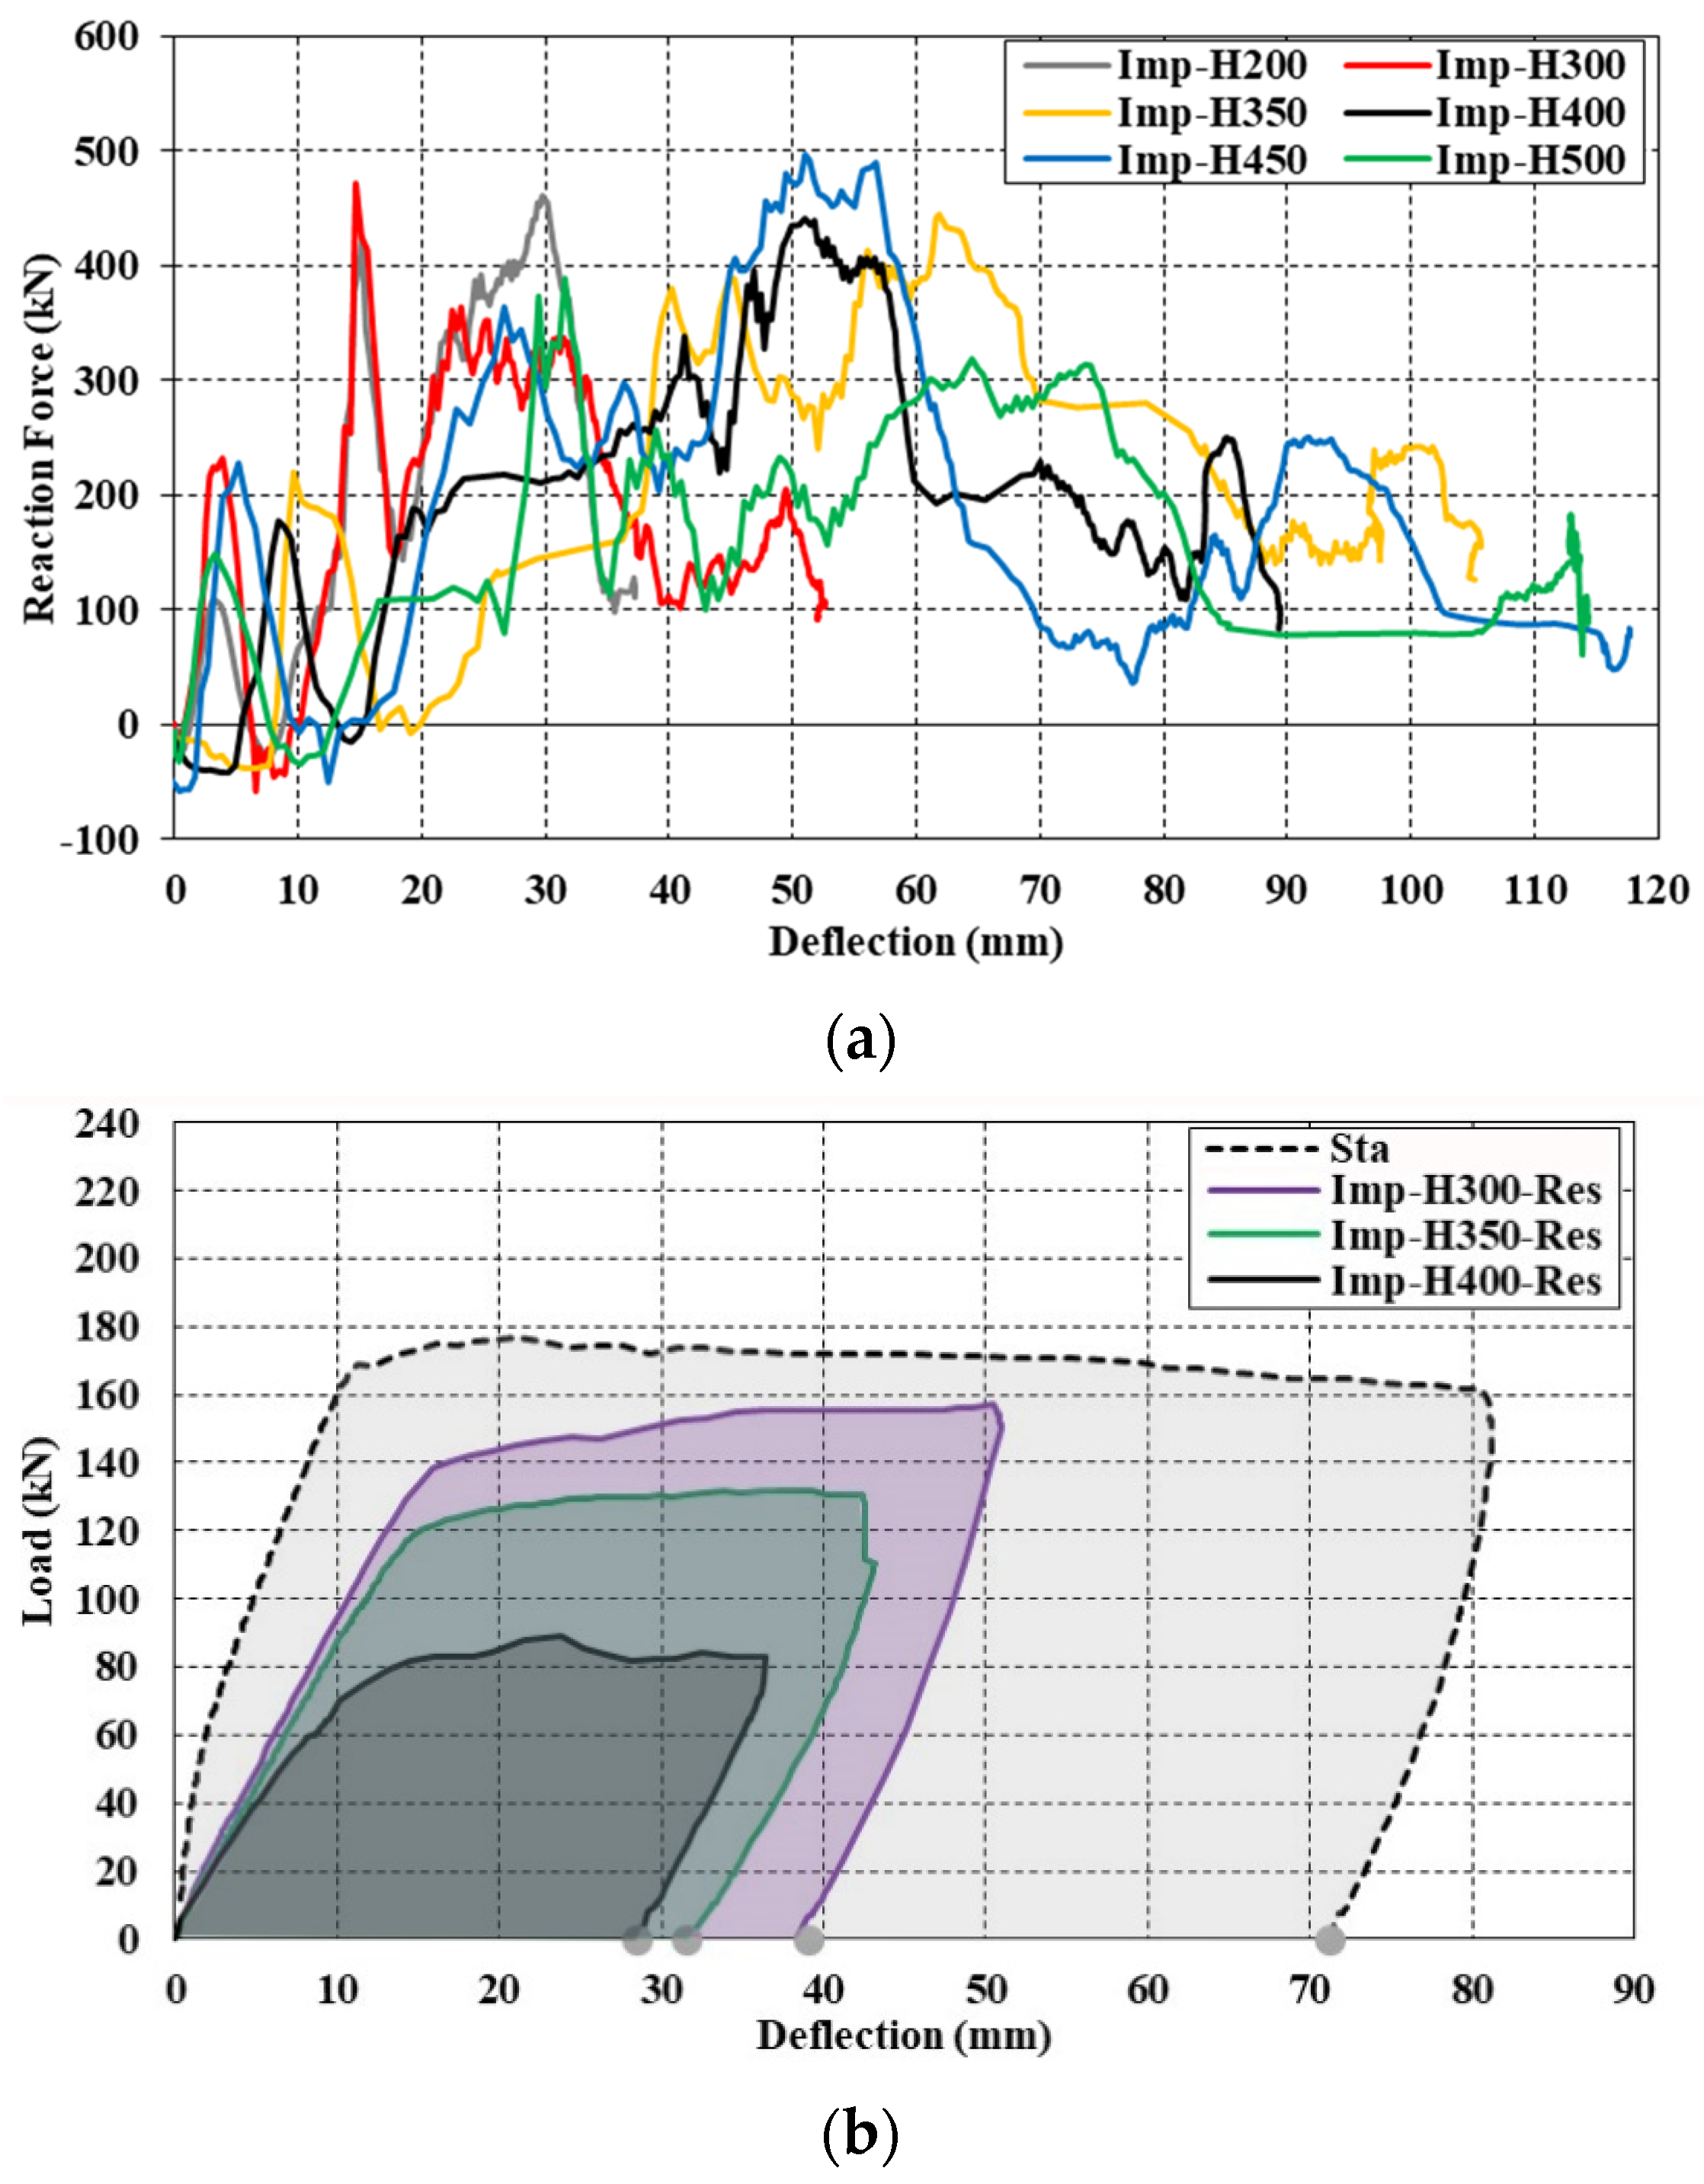
3.2.2. Support Reactions
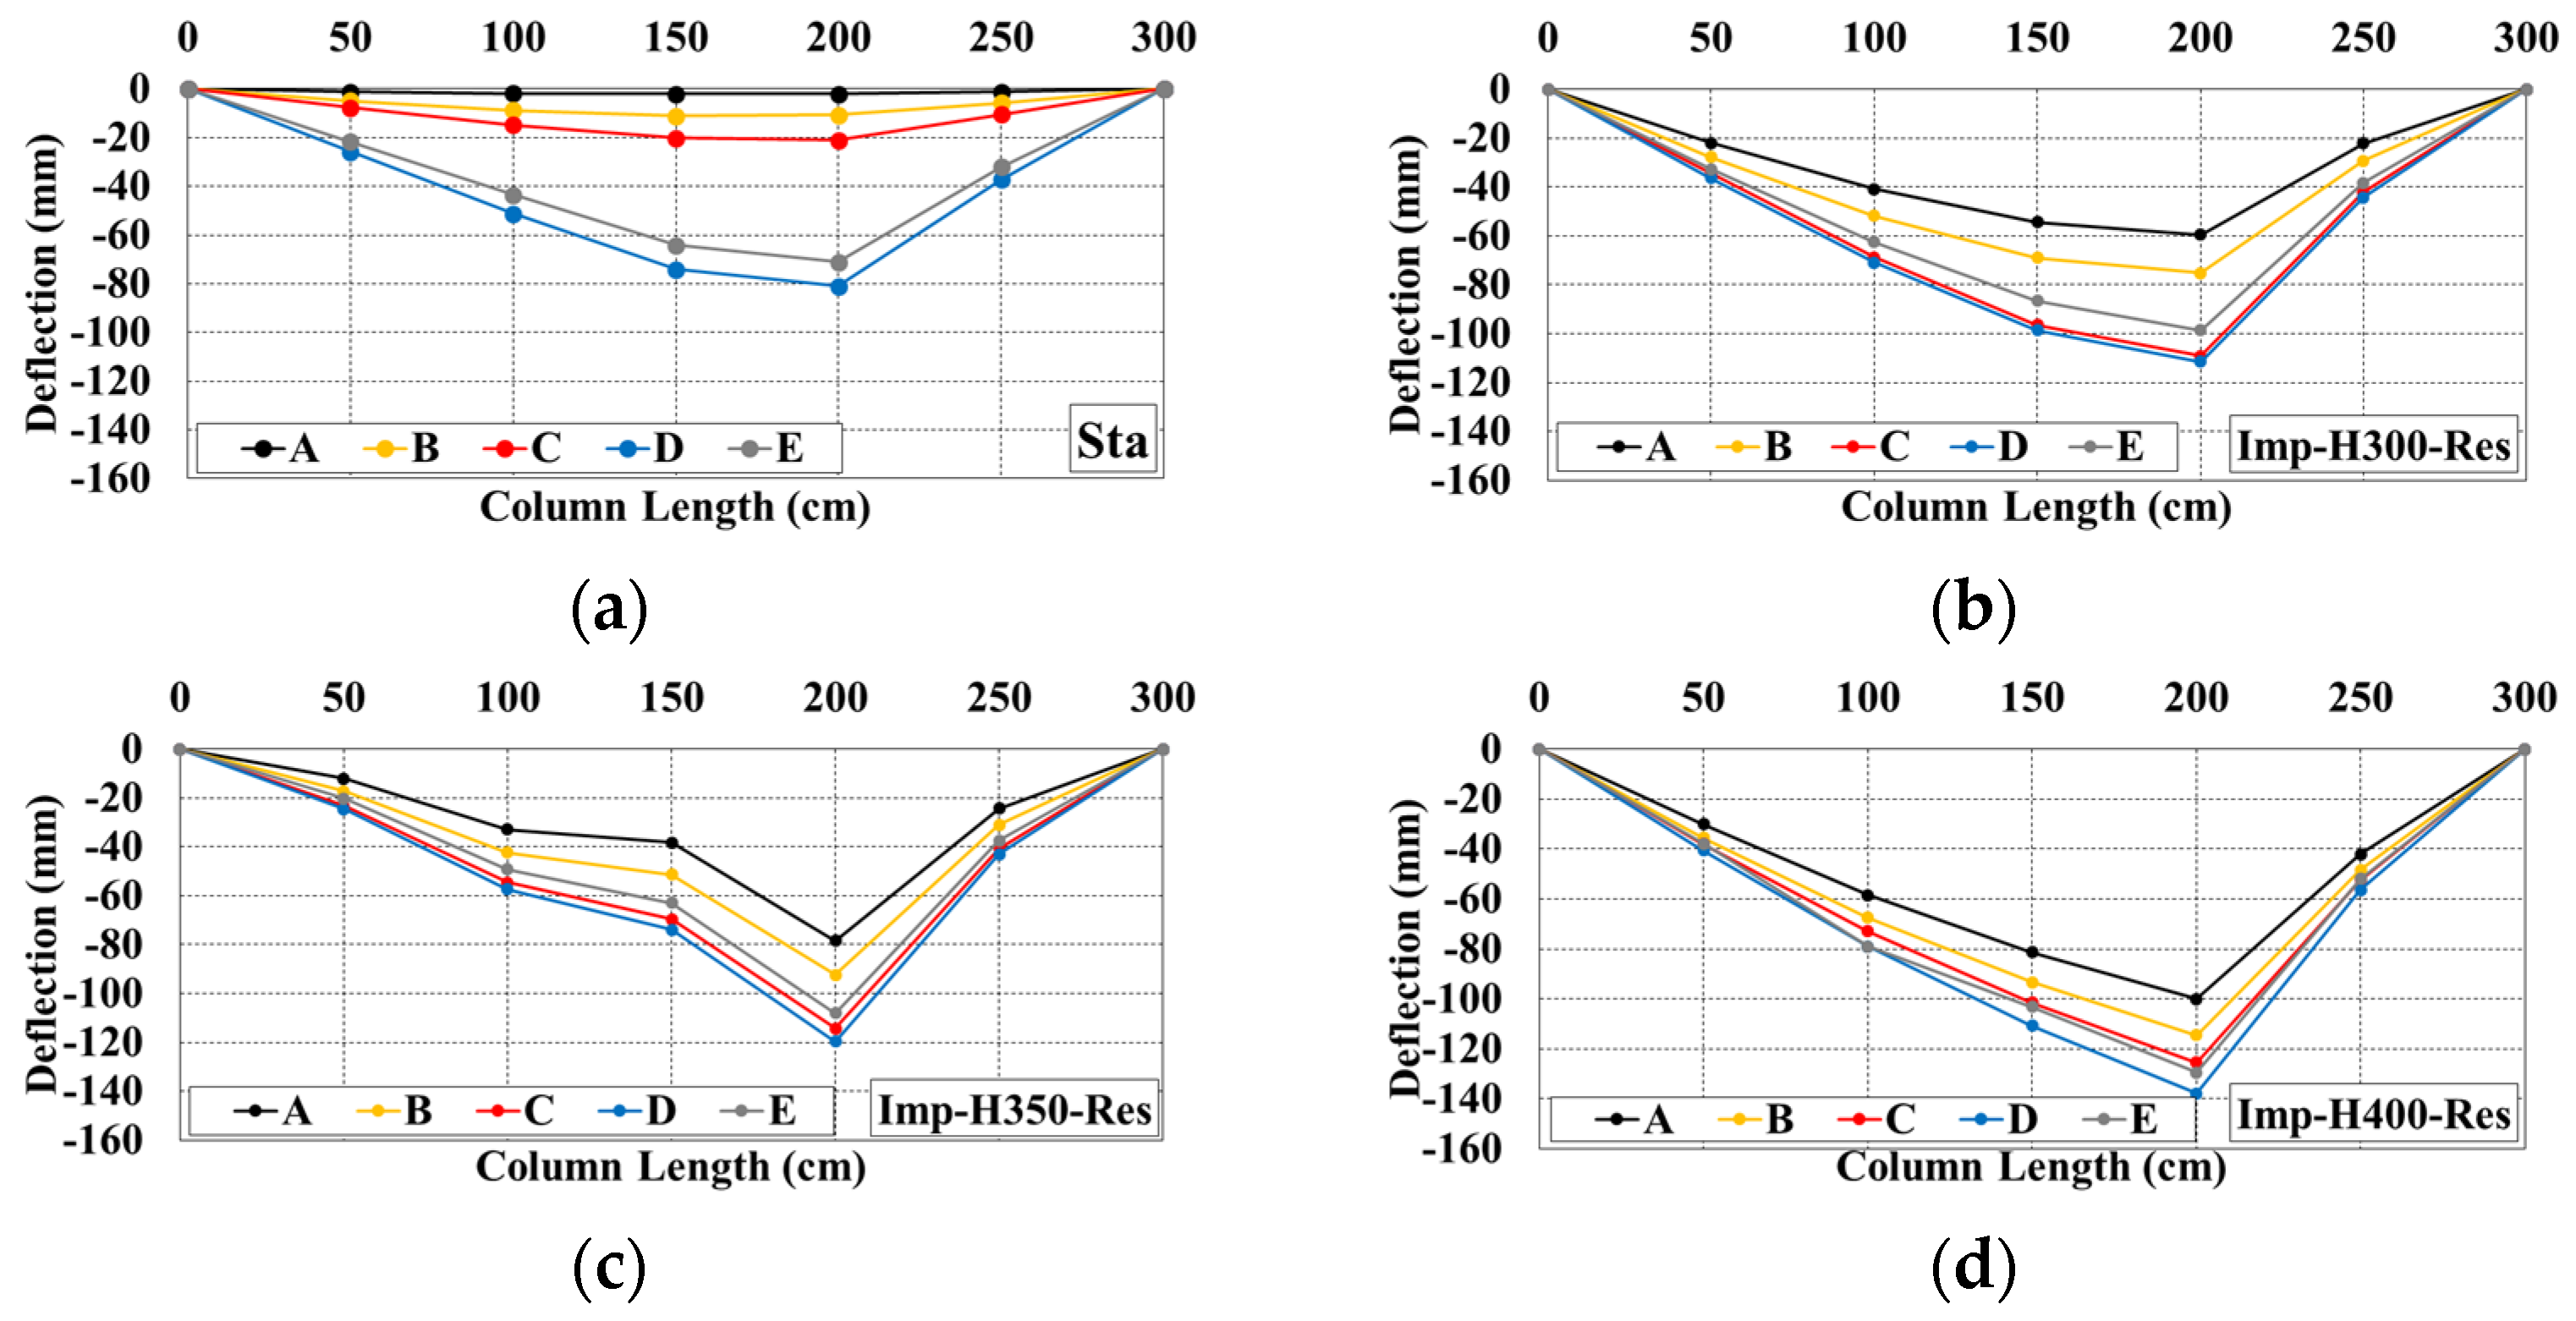
The support reactions of the Imp-H200 specimen are shared in Figure 20a, and the total support reactions of all the specimens are presented in Figure 20b. Immediately after the impact, due to the effect of inertial body forces, tensile reaction forces occurred at the east support, which was closer to the impact area (Figure 20a). The support reaction forces were tension on the east side and compression on the west side at approximately 5 ms after the contact. There was a time lag between the reactions in the east and west supports (Figure 20a). It was observed that there was an average of 7 ms of delay in the reaction forces of the eastern and western supports. The maximum total reaction force appeared after 13 ms on average (Figure 20b); however, the maximum reaction forces were reached after 7 ms in Imp-H300 and Imp-H500. The support reactions presented similar magnitudes, curves and durations for each specimen (Figure 20b).
When the relationship between the impact energy and maximum support response was examined, it was observed that the maximum total support reaction occurred in Imp-H450 (Figure 21). The maximum total support reactions for all the specimens were almost identical (constant). The effect of increasing the impact energy on the support reactions could not be observed directly during the impact experiments. With the increasing level of the impact energy, the support reactions were kept almost constant, since the specimens reached their impact load capacity.

3.2.3. Deflections

Only the displacement time history curves of the Imp-H200 and Imp-H500 specimens, which were tested with the smallest and largest impact loads, are shared in Figure 22. It was observed that, as the applied impact energy increased by adjusting the dropping height in the tests, the deflections of the specimens increased. The maximum displacement during impact was measured as 35 mm in Imp-H200 at 25 ms, and a residual displacement value of 31.5 mm was reached after approximately 200 ms (Figure 22a,b). In the Imp-H500 specimen, a displacement of 107.0 mm was measured at approximately 50 ms. In the impact tests, the damage occurred mostly under the impacted area. This was verified by comparing the deflected shapes of Imp-H200 (Figure 22b) and Imp-H500 (Figure 22d); the permanent deflections increased rapidly at the locations between 150 cm and 250 cm of the Imp-H500 specimen, where the damage was highly concentrated.
The residual deflected shapes of the specimens at the end of the impact tests are presented in Figure 23. The displacement values were close to each other in the Imp-400, Imp-450 and Imp-500 specimens at many locations where the specimens had already reached their ultimate impact capacities.

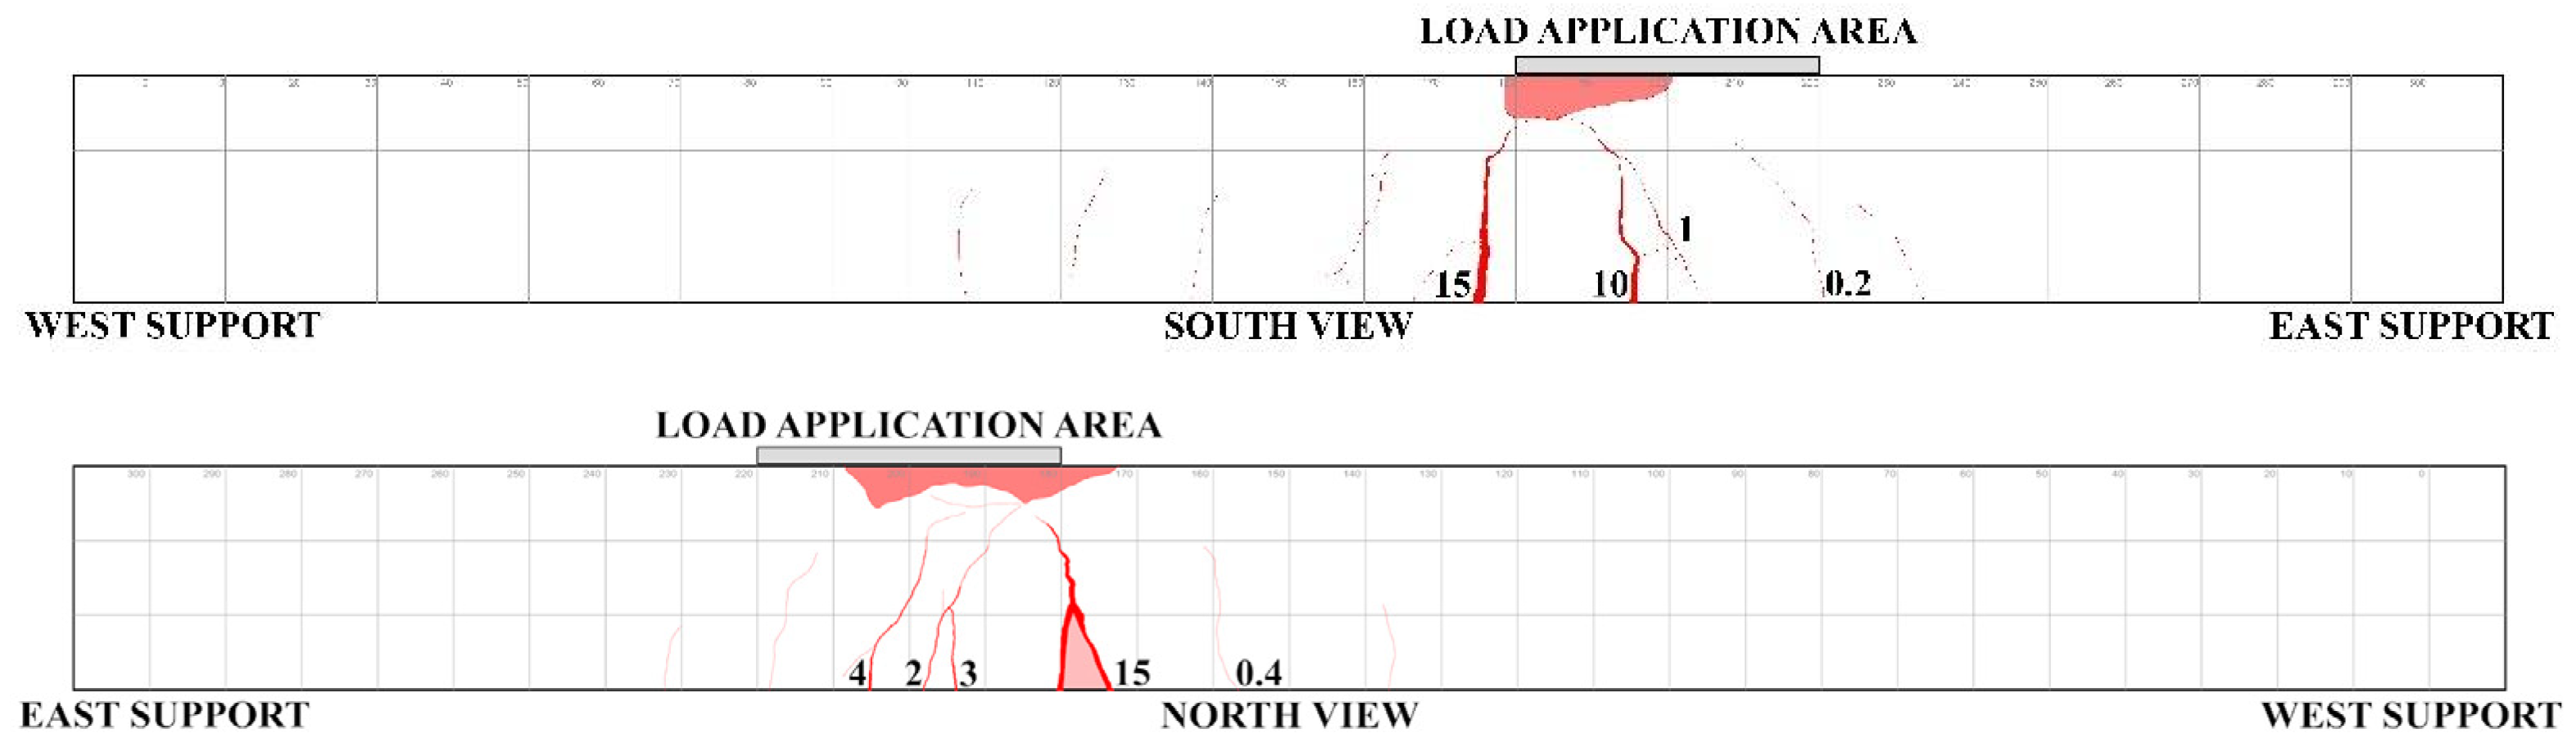
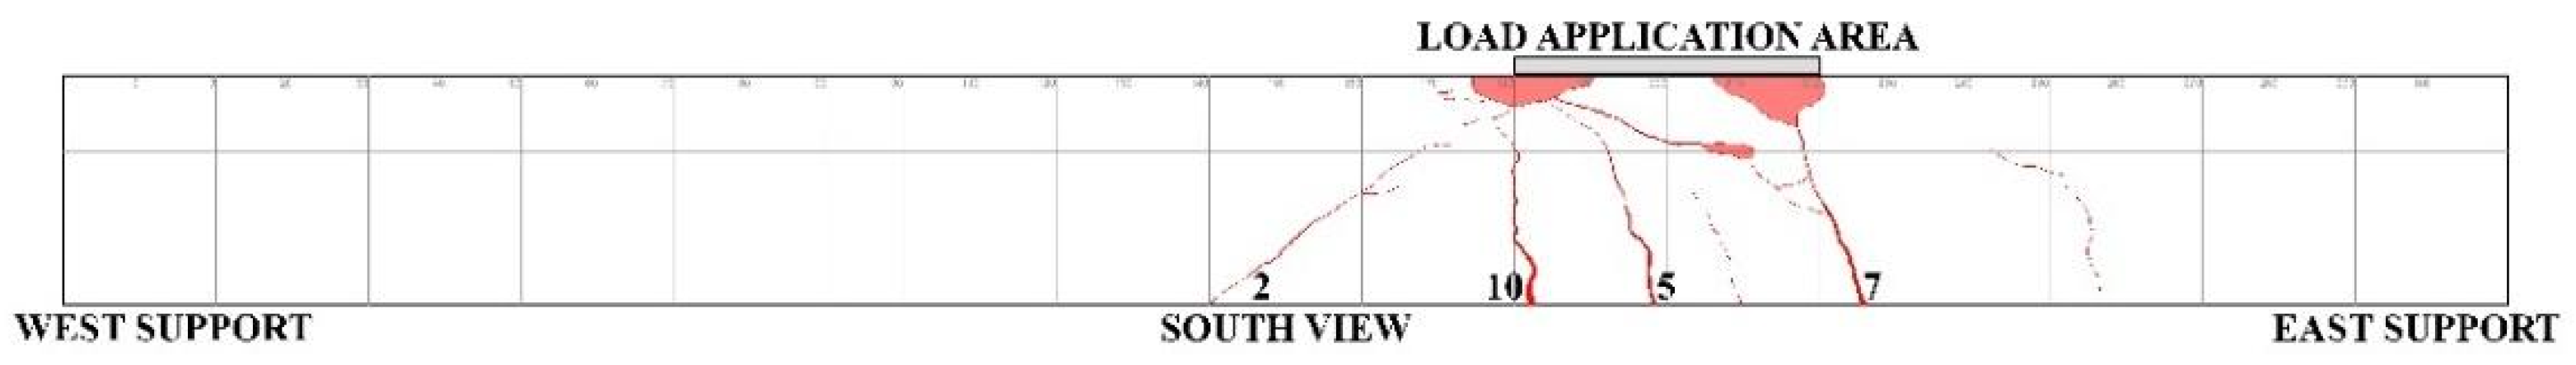
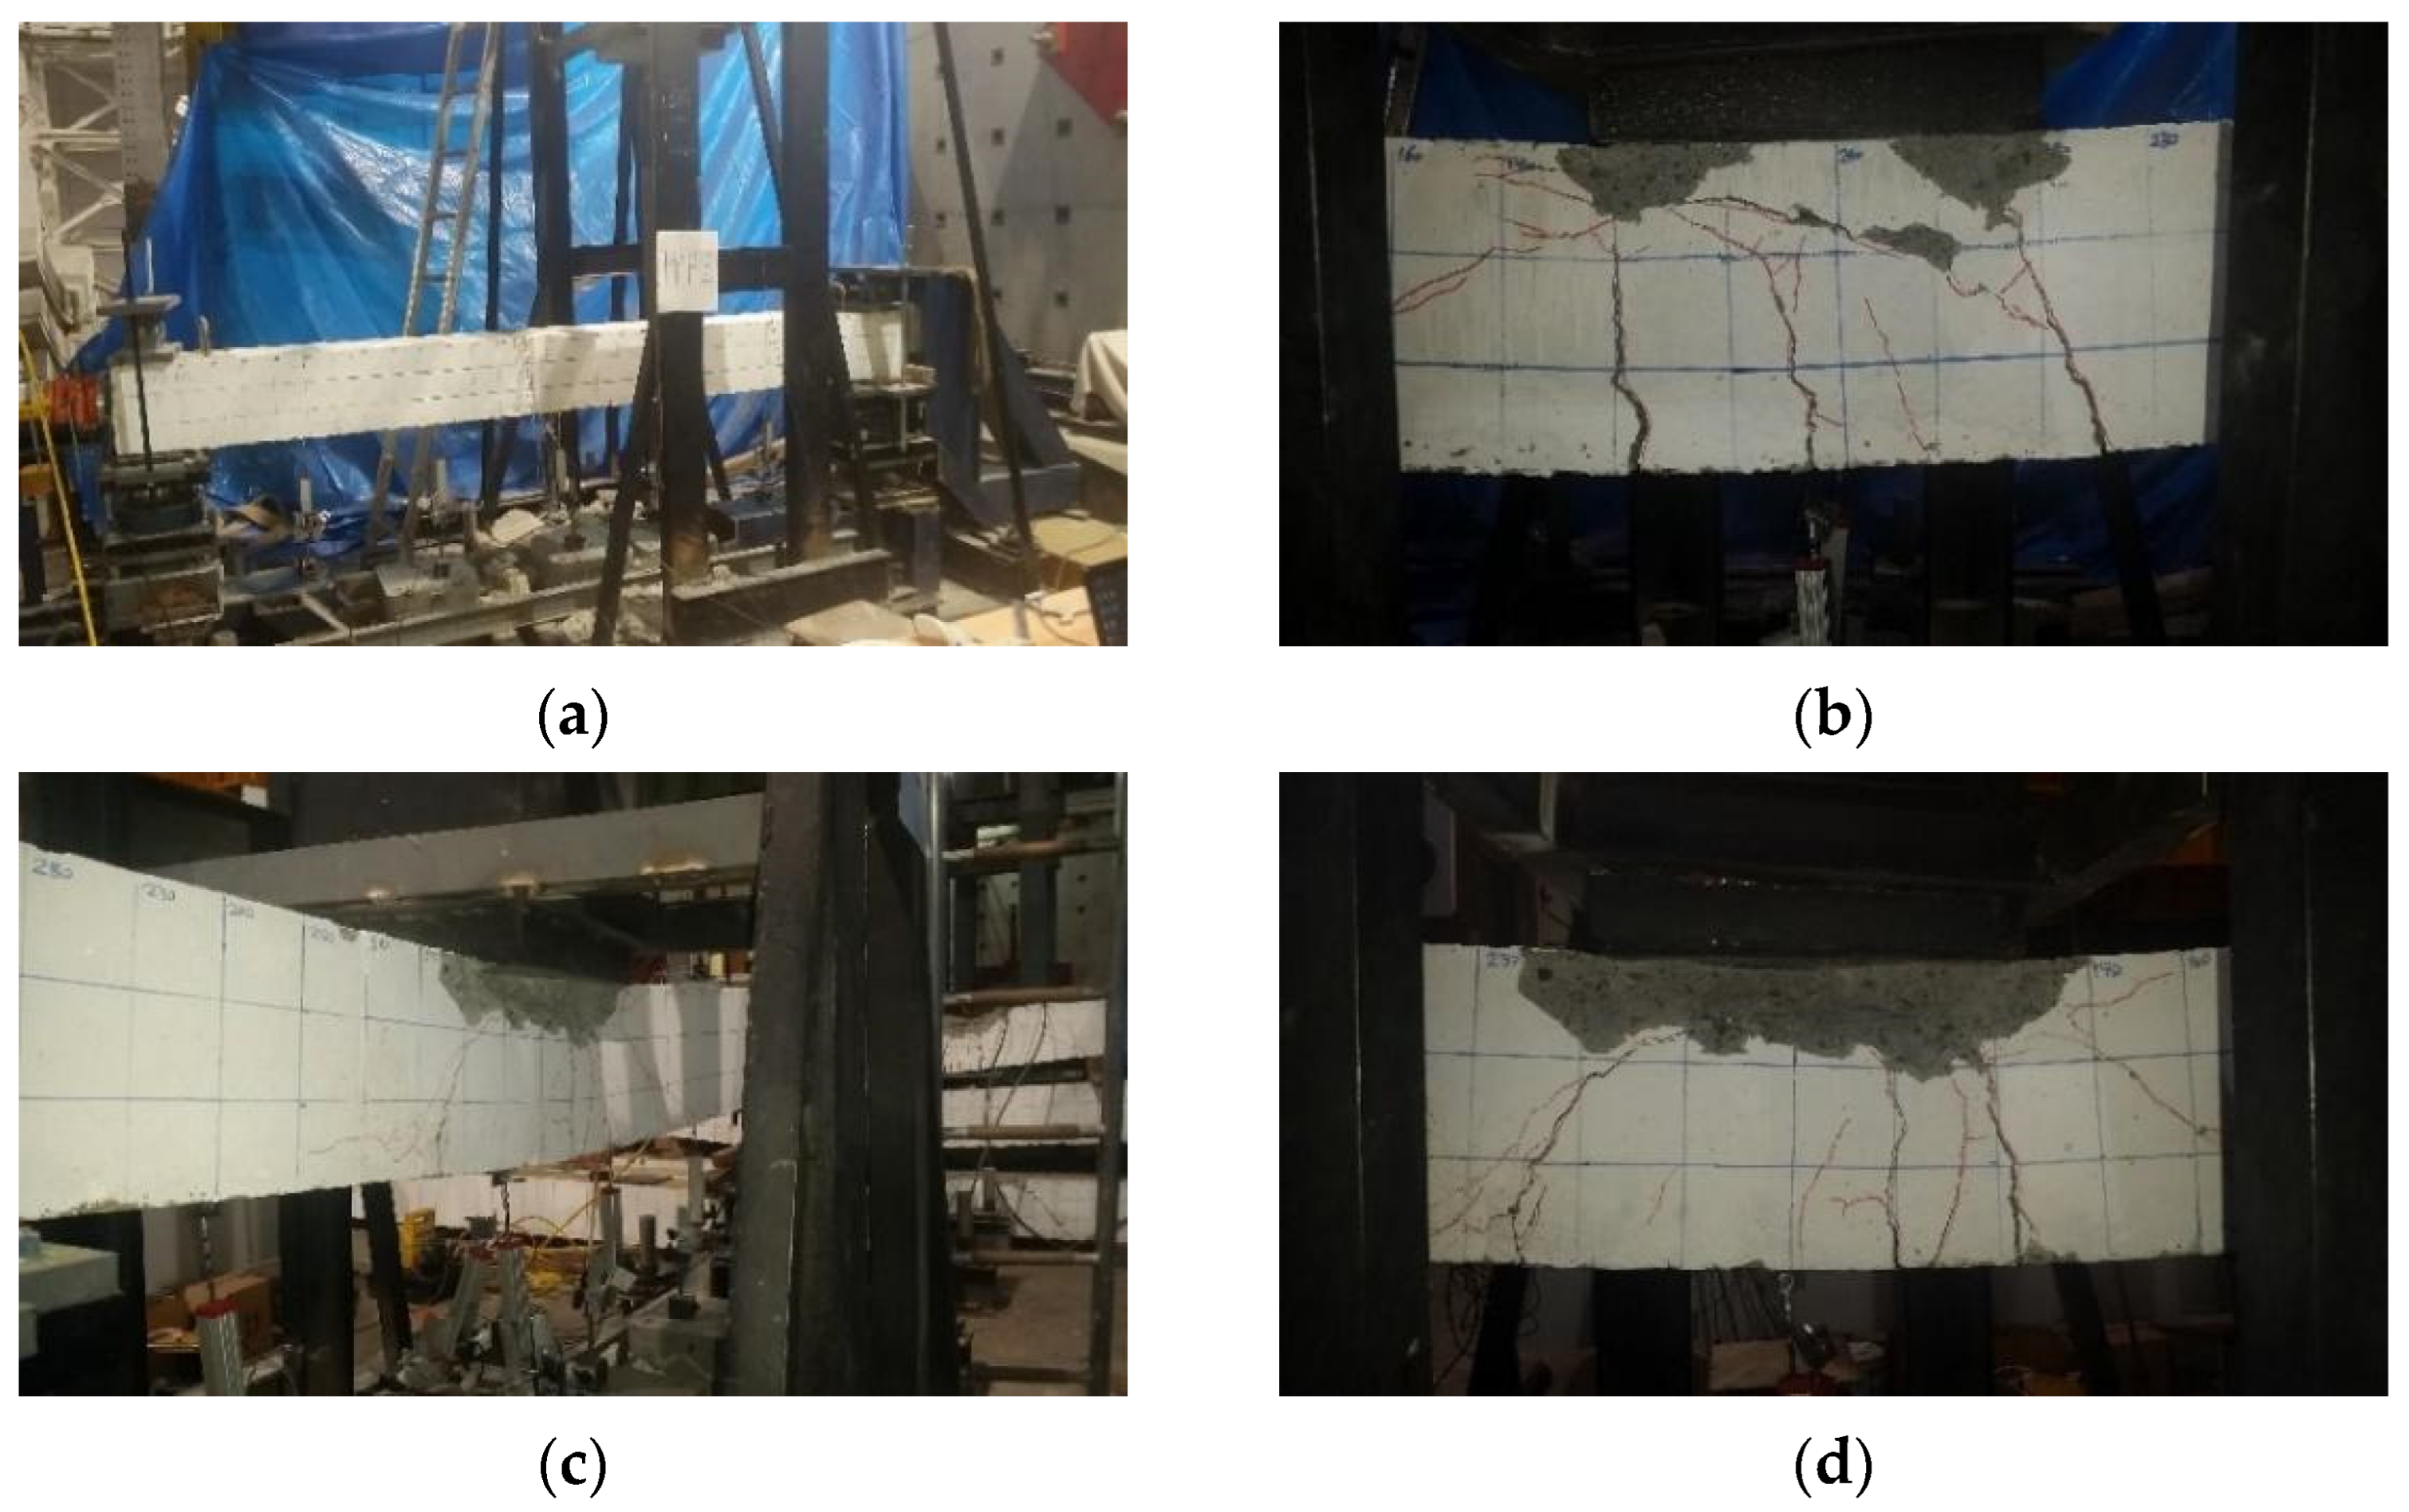
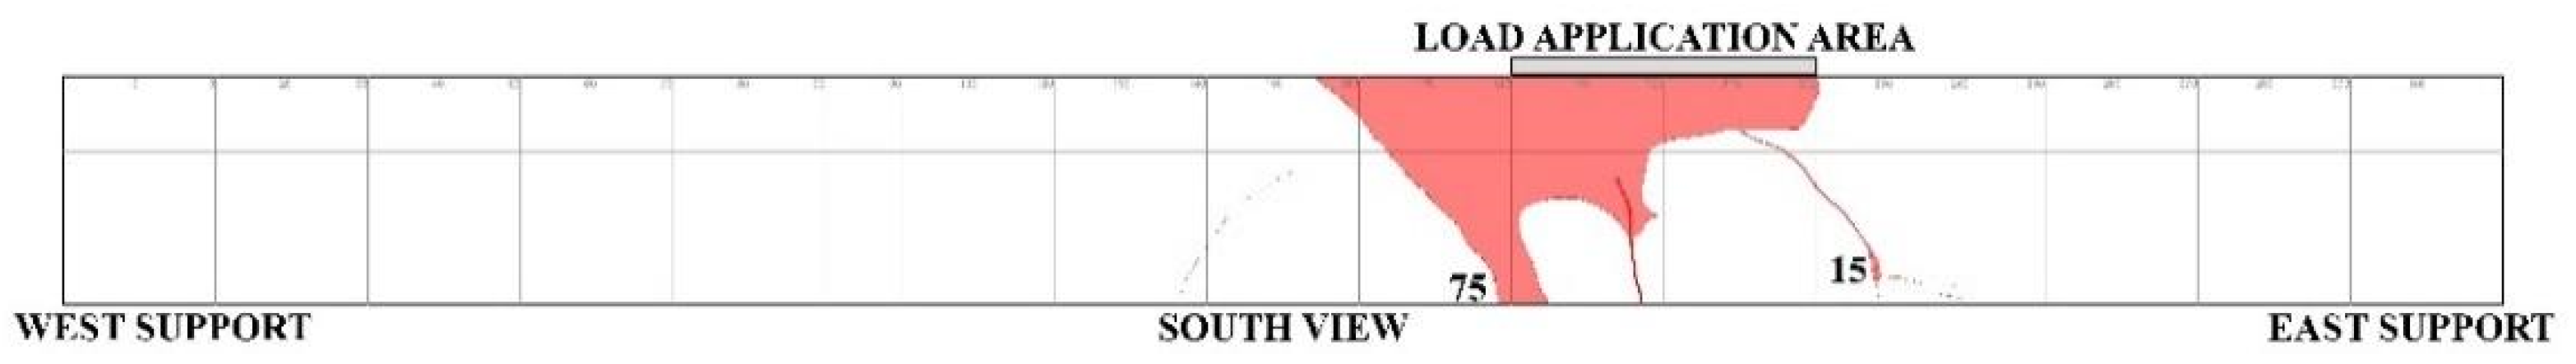
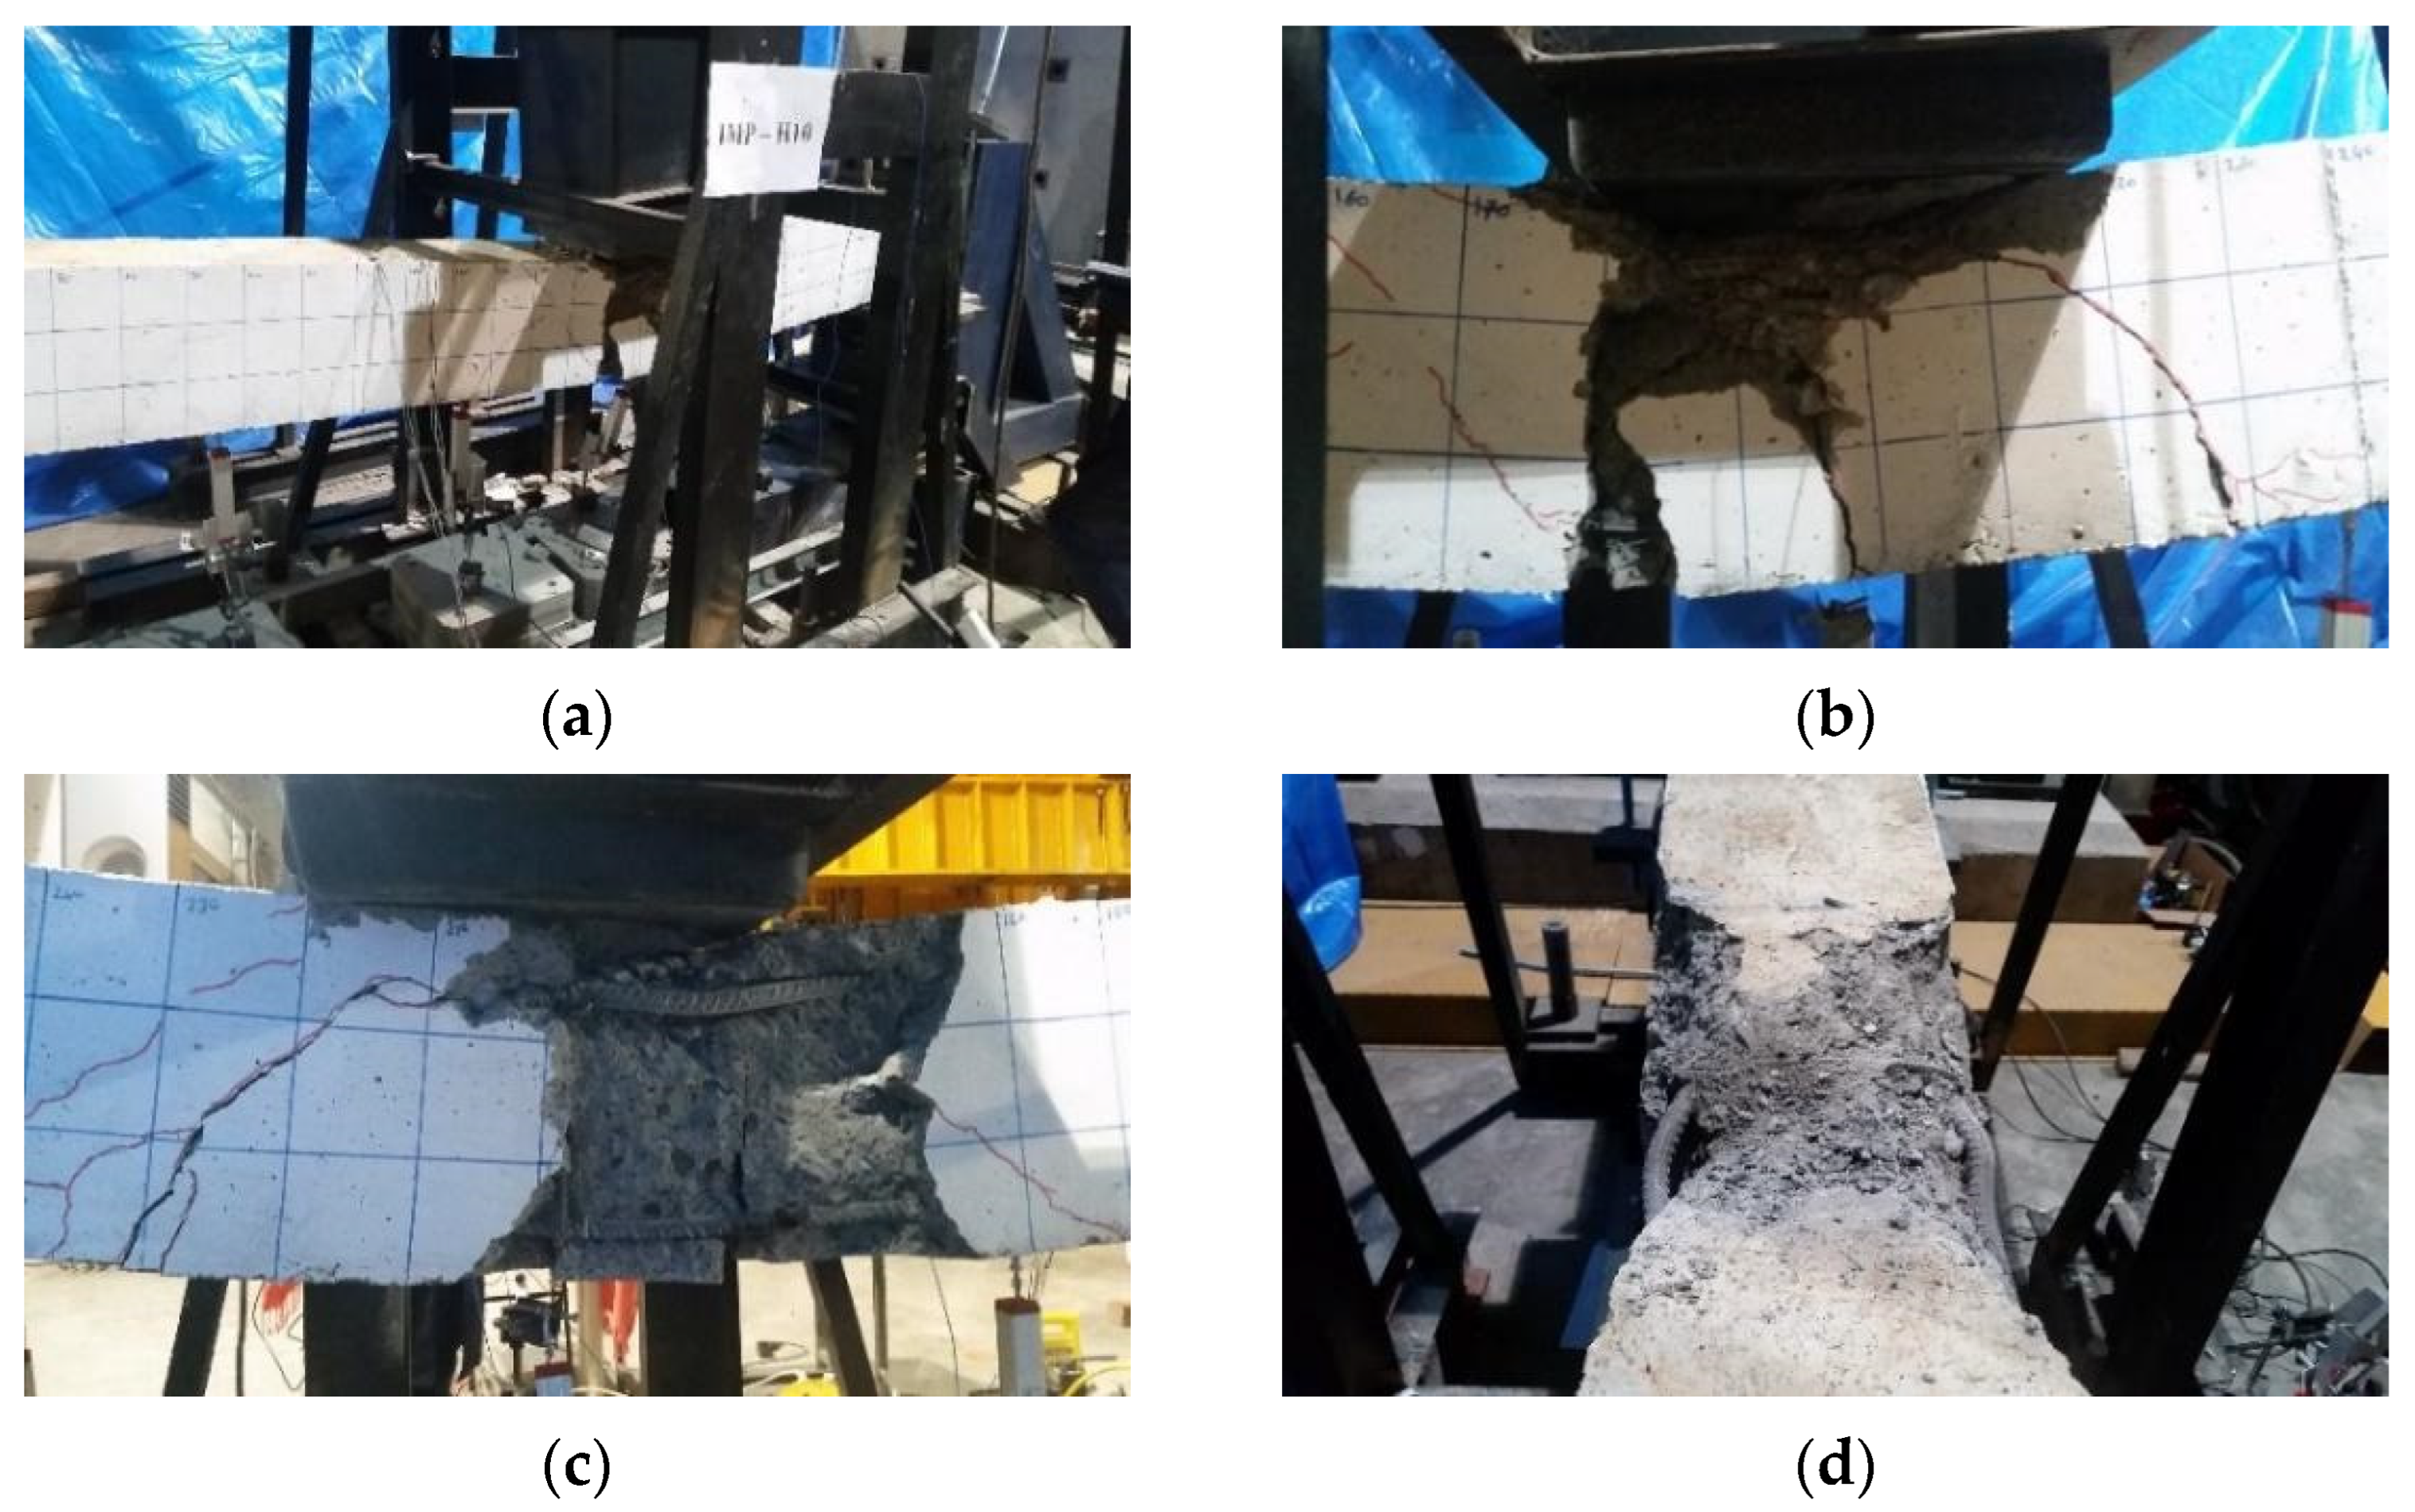
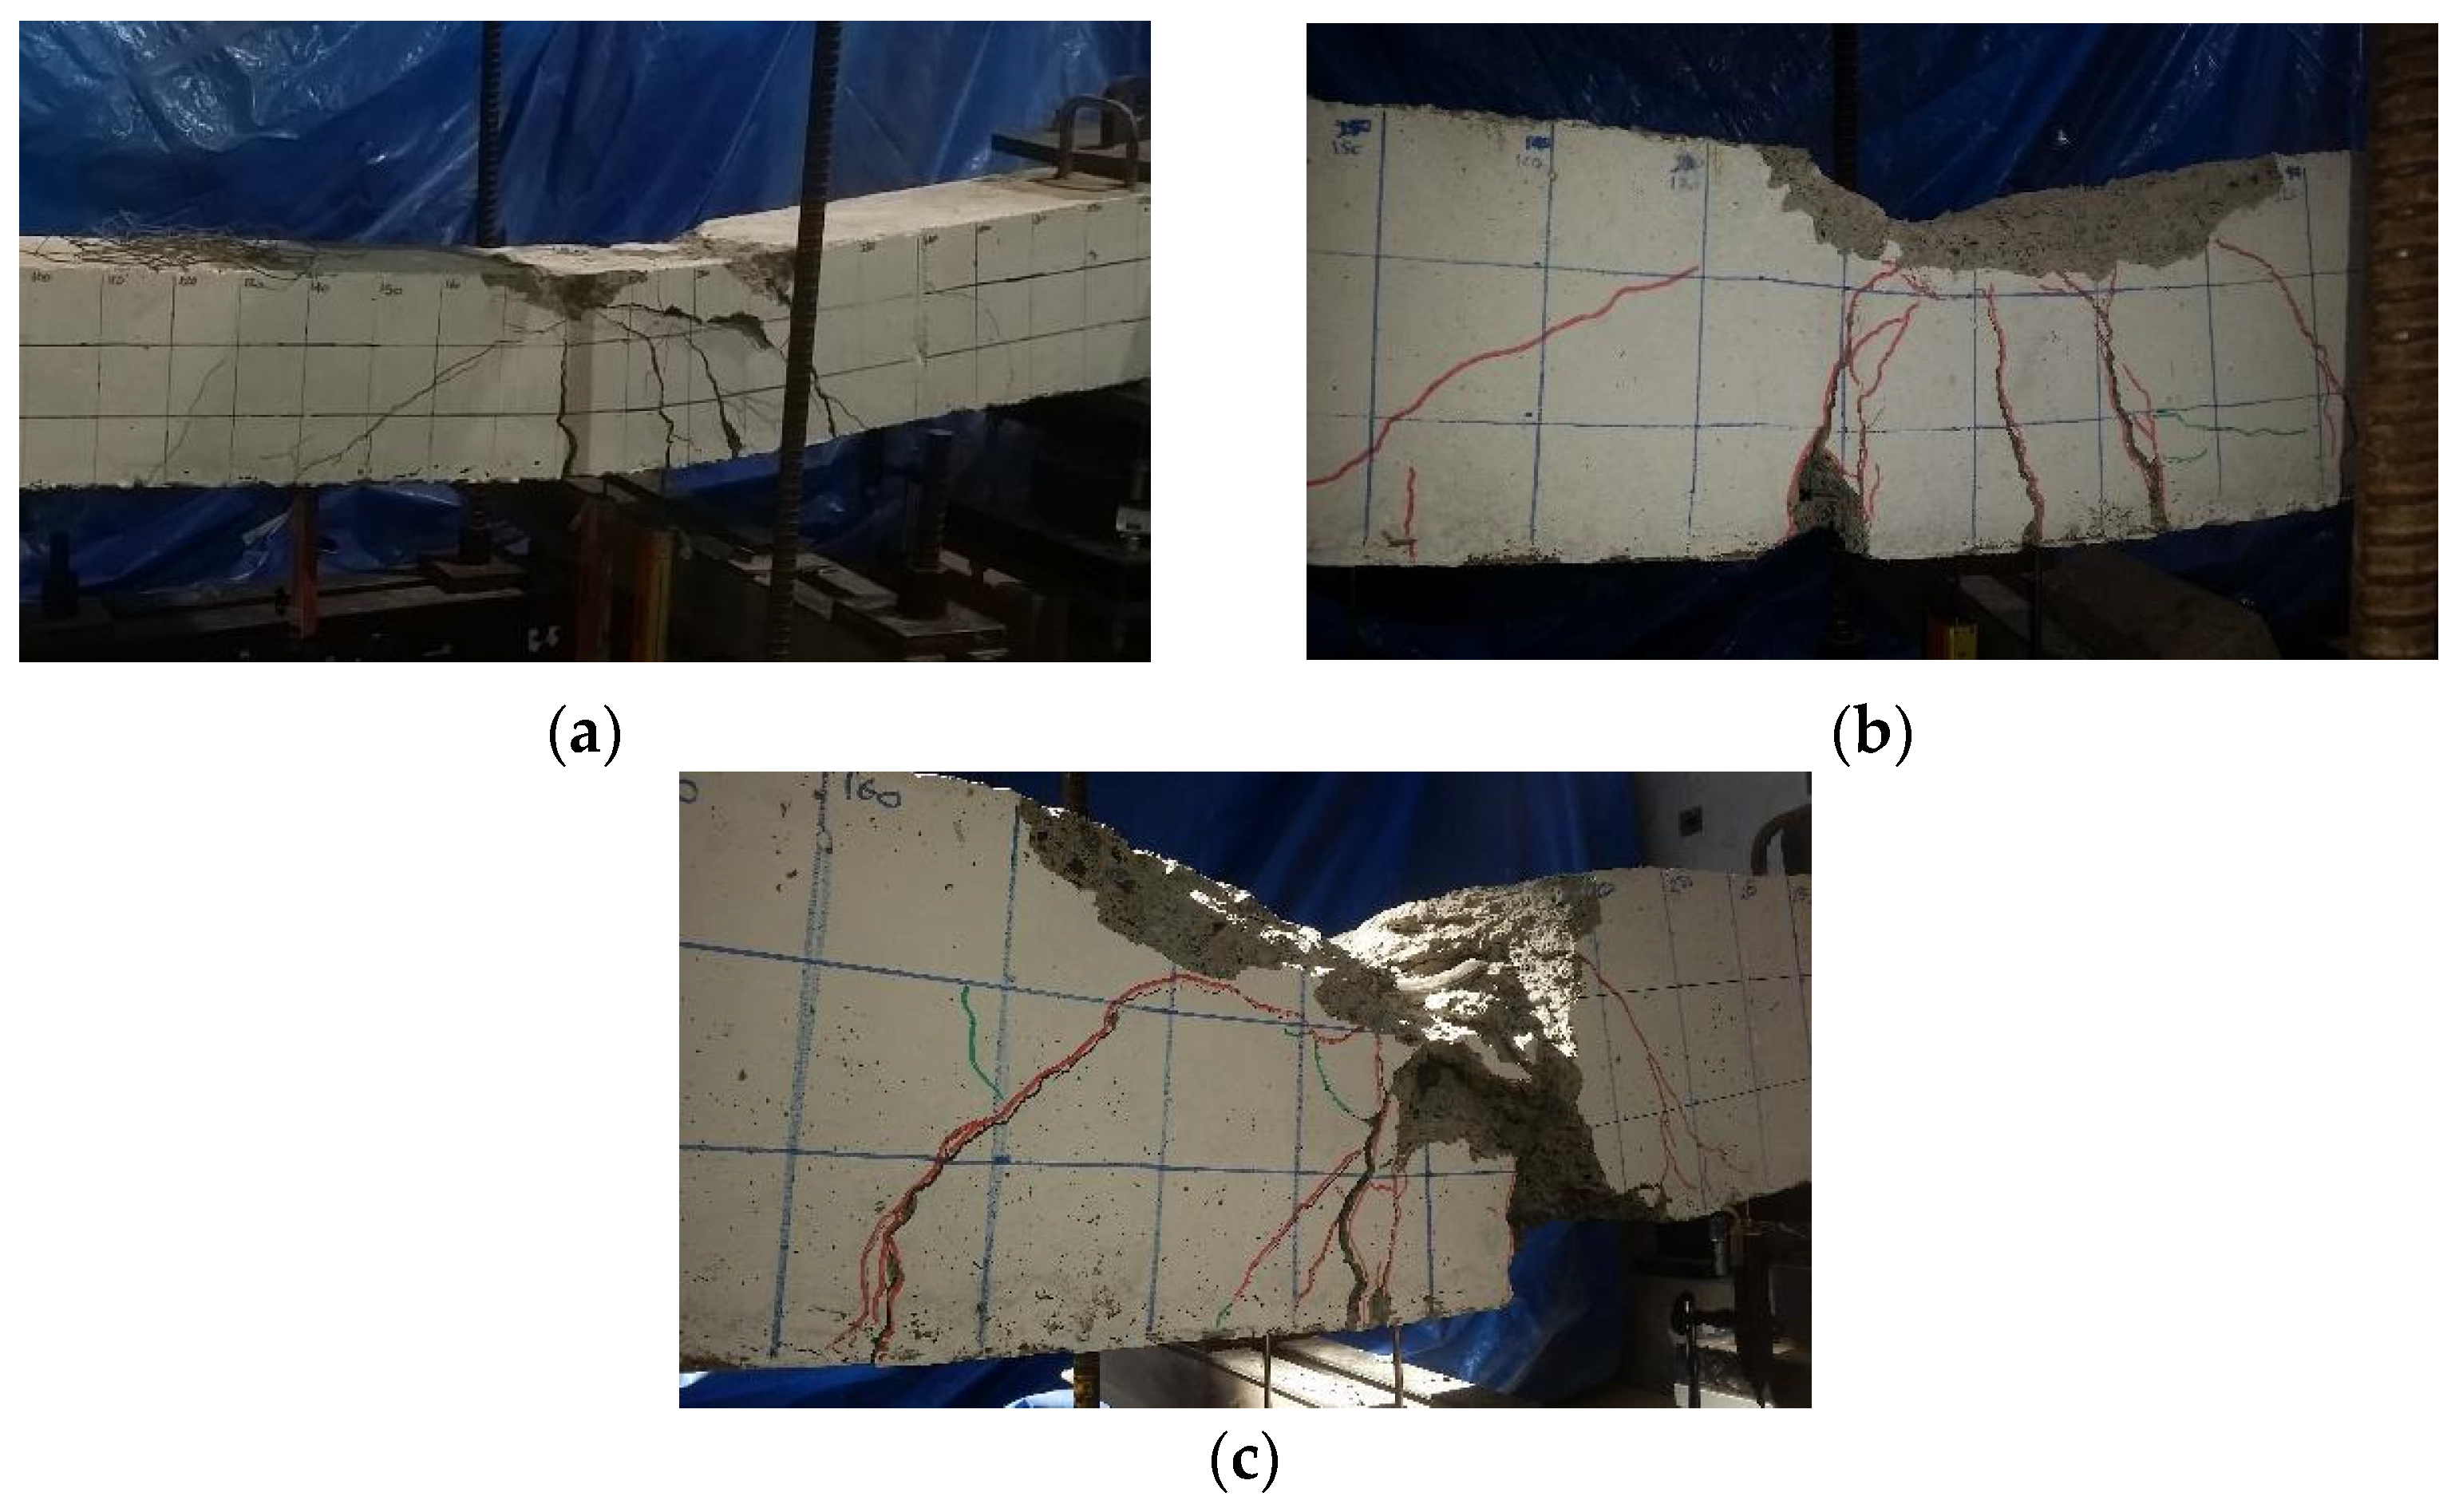
3.2.4. Failure Modes

Imp-H200 was tested by using the smallest impact energy. After the impact, in Imp-H200, a maximum of 8 mm wide flexural cracks were formed at the bottom under the impact area. Cracks were distributed at about 80 cm in length under the impact region. On the impacted top, the initiated concrete crushing with some spalling on the concrete cover was observed. A crack map drawing from the south side of the specimen is presented in Figure 24, and the damage photos of the specimen are presented in Figure 25.
In the Imp-H300 specimen, flexural cracks were formed with a maximum width of 10 mm, and the cracks were extended to a region of 100 cm in length under the impacted area (Figure 26). A shear crack 2 mm wide was formed starting from the impacted side and extending diagonally to the bottom edge. Concrete began to be crushed in the impact area, and concrete spalls were observed along the top concrete cover up to the reinforcement level (Figure 27).
In the Imp-H350 specimen, flexural cracks were a maximum of 13 mm wide, which formed about 100 cm in length under the impacted zone (Figure 28). A shear crack of 3 mm wide was formed starting from the impacted side and extending diagonally to the bottom side. The concrete was crushed on the top of the impact area, and concrete cover spalling from the sides and top was observed. The top longitudinal reinforcements were exposed due to the concrete cover lost (Figure 29).
In the Imp-H400 specimen, flexural cracks were formed with a maximum width of 12 mm, and the cracks were extended to a region 160 cm in length under the impacted area (Figure 30). The width of the shear crack, which was formed diagonally from the top of the impacted region to the bottom side, was about 5 mm. the concrete was crushed in the impact area, and the cover concrete was spalled until half the depth of the section in the vicinity of the impact area. In the impact area, buckling of the longitudinal reinforcing bars was observed on the compression side (Figure 31).
In the Imp-H450 specimen, flexural cracks were formed with a maximum width of 15 mm, and the cracks were extended to a region 120 cm in length under the impacted area (Figure 32). A 15 mm wide shear crack was formed starting from the impacted region and extending diagonally to the bottom side. The concrete was crushed at the top, and the concrete cover was spalled at the top and at the sides of the column around the impacted area. Buckling of the top longitudinal reinforcing bars was observed in the impact area (Figure 33).
In the Imp-H500 specimen, flexural cracks were formed with a maximum width of 20 mm, and they were extended under the impacted zone (Figure 34). A dominant shear crack was formed starting from the impacted side and extending diagonally to the bottom side. The column failed due to the shear mechanism. The concrete was crushed in the impact area, and the cover concrete, as well as a portion of the core concrete, was spalled. In the impact area, buckling and bending of all the longitudinal reinforcing bars were observed (Figure 35).
The behavior of the axially loaded columns under low-elevation impact is significantly influenced by the applied impact energy level. While pure flexure behavior was observed in the tests of the Imp-H200 (Figure 24 and Figure 25) and Imp-H300 specimens (Figure 26 and Figure 27), by increasing the impact energy, the shear/flexure combined behavior became effective in the tests of Imp-H350 (Figure 28 and Figure 29), Imp-H400 (Figure 30 and Figure 31) and Imp-H450 (Figure 32 and Figure 33), and at the maximum applied impact energy level for Imp-H500 (Figure 34 and Figure 35), the behavior was dominated by shear. The number and width of shear cracks increased as the impact energy increased. The area where cracks spread on the column was also increased.
The strain gauge data were evaluated after the impact tests, and it was observed that the longitudinal reinforcements in all the specimens reached their yielding strains, with a maximum strain of 0.003–0.0067 (Figure 36). In the Imp-H200 specimen at the time of impact, transverse reinforcements remained in the linear deformation region, with a maximum strain of −0.0005. In the rest of the specimens, the transverse reinforcements reached their yielding strain with a maximum strain of 0.0022 to 0.0071 (Figure 36). The stirrups yielded close to the impacted area; however, the strain values in the stirrups were highly influenced by the location of the formed shear cracks. The stirrups were insufficient to prevent shear damage, since there were too-few stirrups to limit the shear cracking. No rupture was observed in the reinforcing bars. As the impact energy increased, buckling occurred in the top longitudinal reinforcements. While buckling was not observed in the Imp-H200, Imp-H300 and Imp-H350 specimens, the top longitudinal reinforcements buckled in the Imp-H400, Imp-H450 (Figure 33) and Imp-H500 (Figure 35) specimens. The fact that the longitudinal reinforcements and stirrups reached the yielding strain value in all the specimens (except Imp-H200) verified that the columns were about to reach their impact load capacities with the applied impact loads during the tests. This behavior can also be observed by the almost constant total support reactions of the specimens impacted by varied dropped heights presented in Figure 21 and in Table 3. While the total support reactions remained approximately constant under the increased impact energy in all specimens, the columns also reached their maximum displacement capacities after the impact height of 4.0 m (Table 3).
The progress of the damage in the impacted specimens is presented in Figure 37 by marking the axes before the impact (blue) and the deformed axes during the impact (red). The impact test results are also summarized in Table 3.

3.3. Residual Capacity Tests

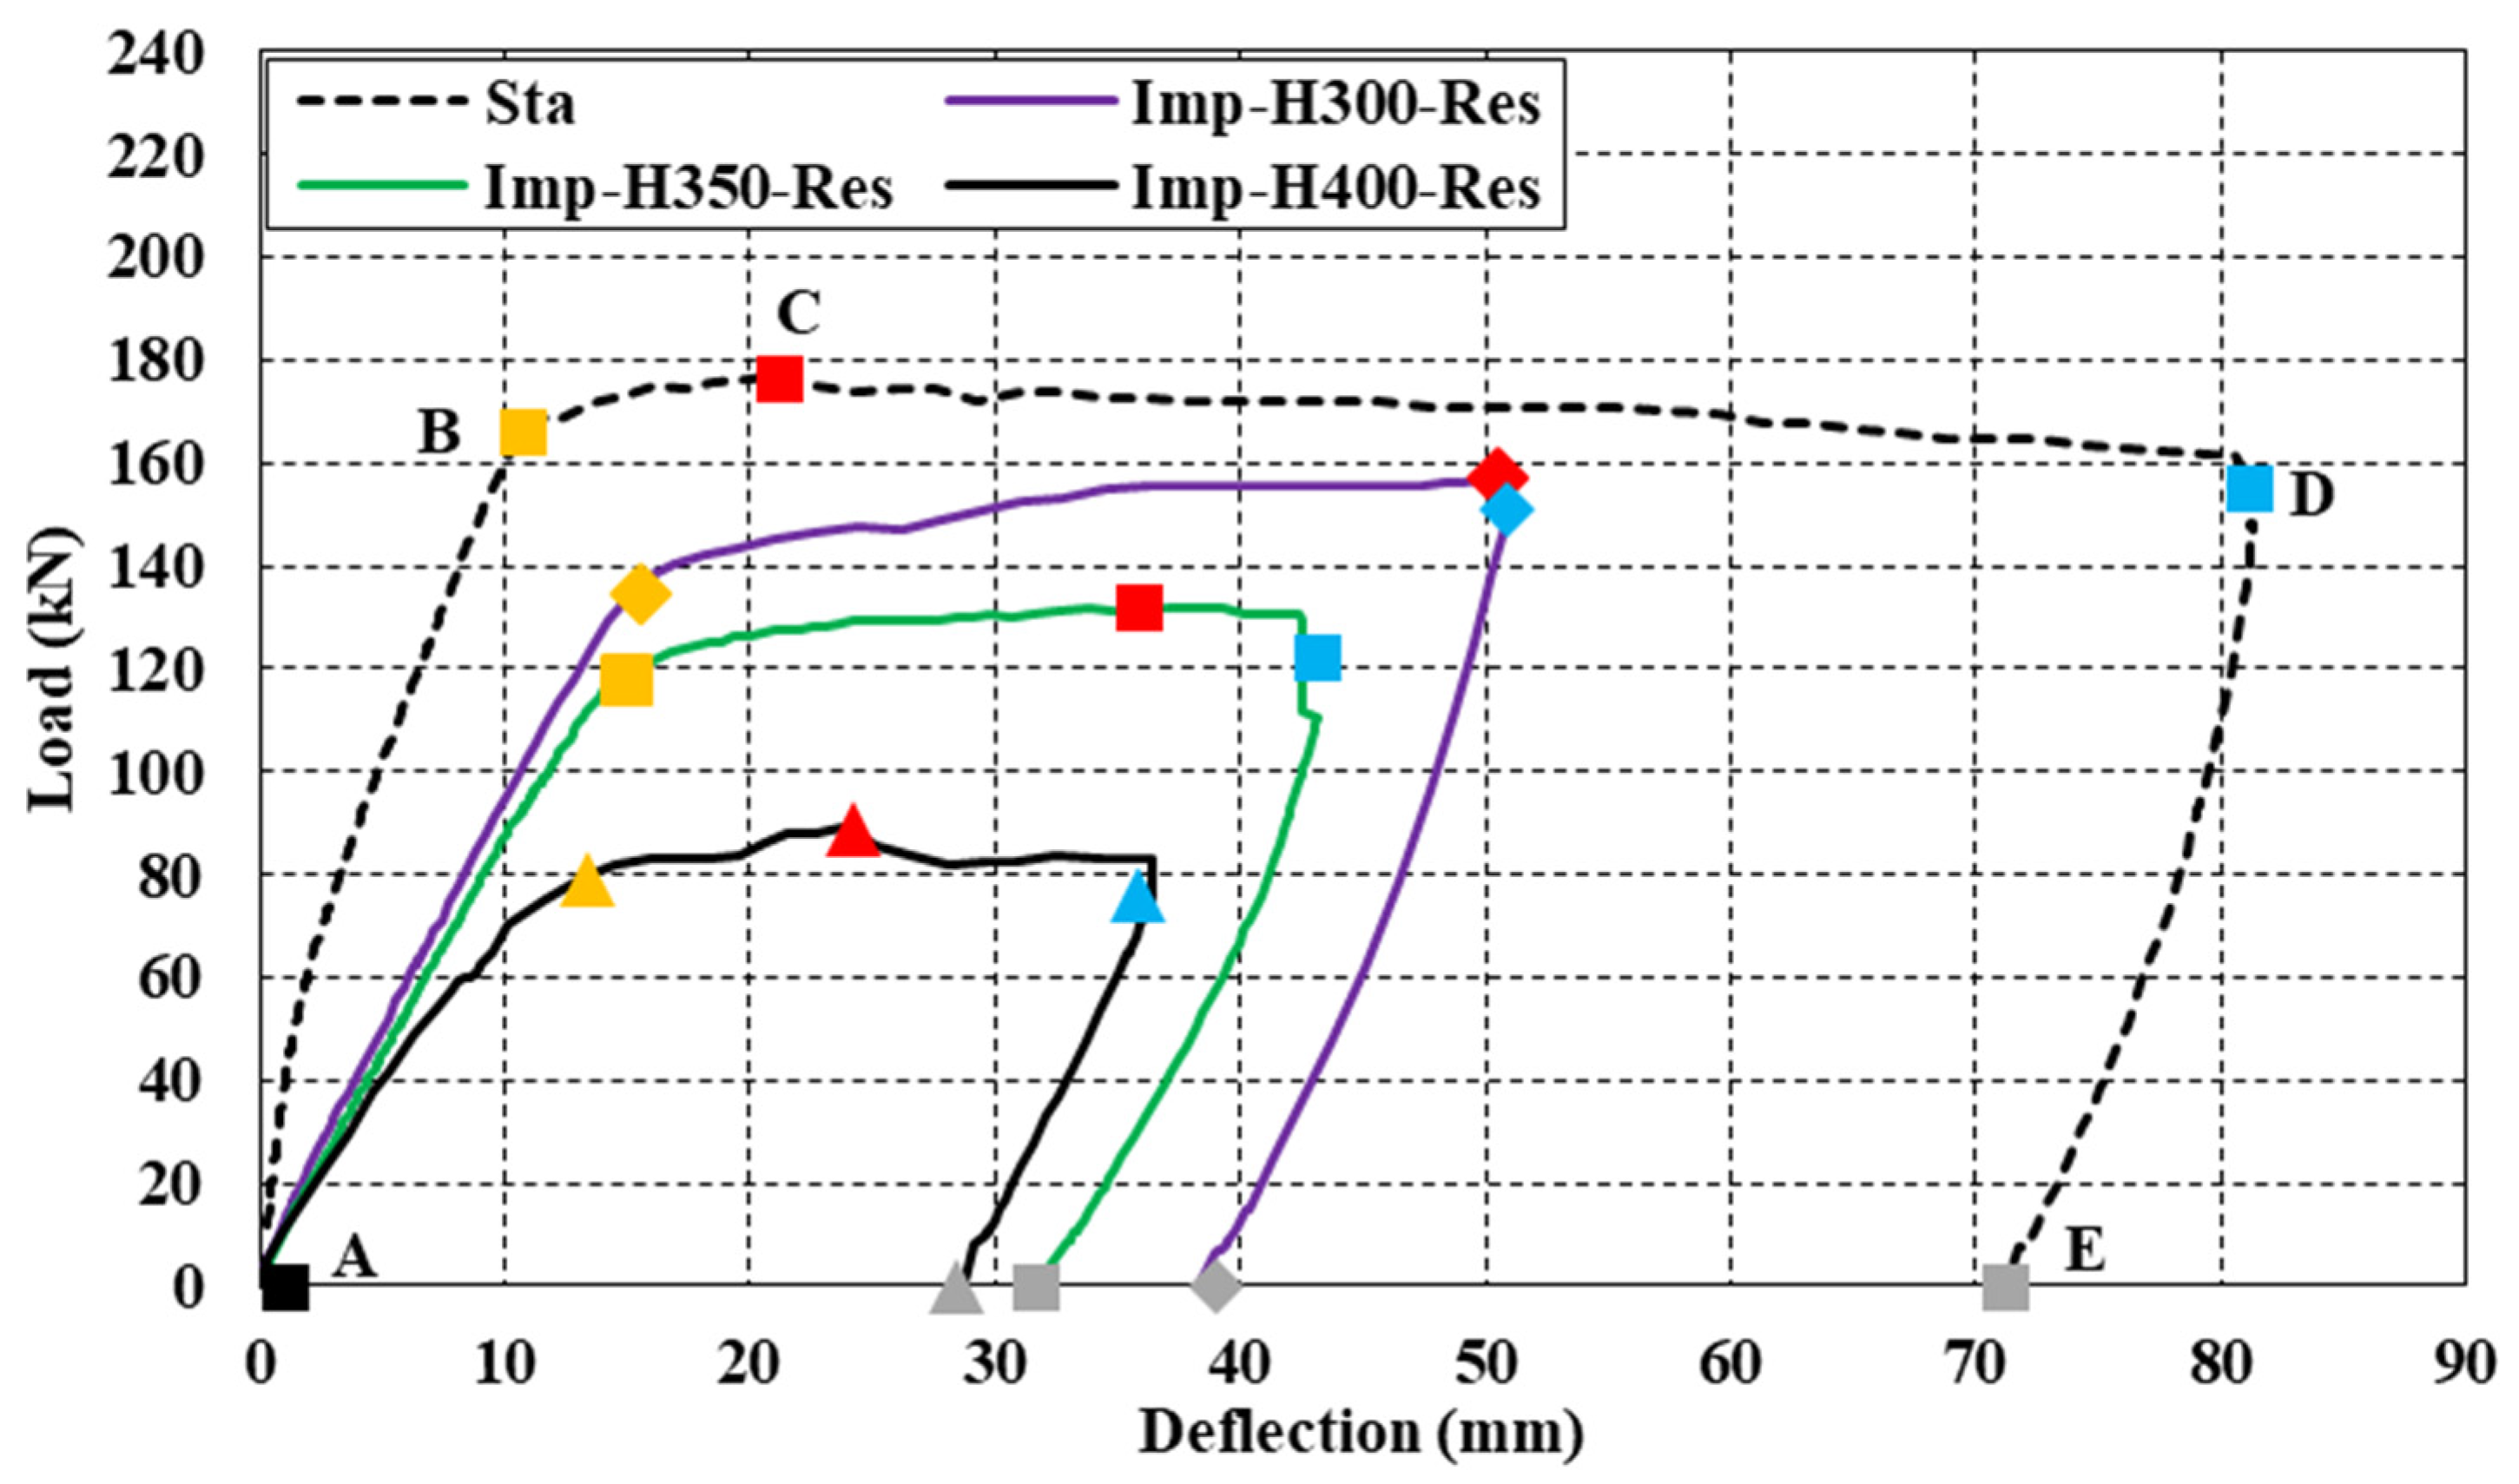
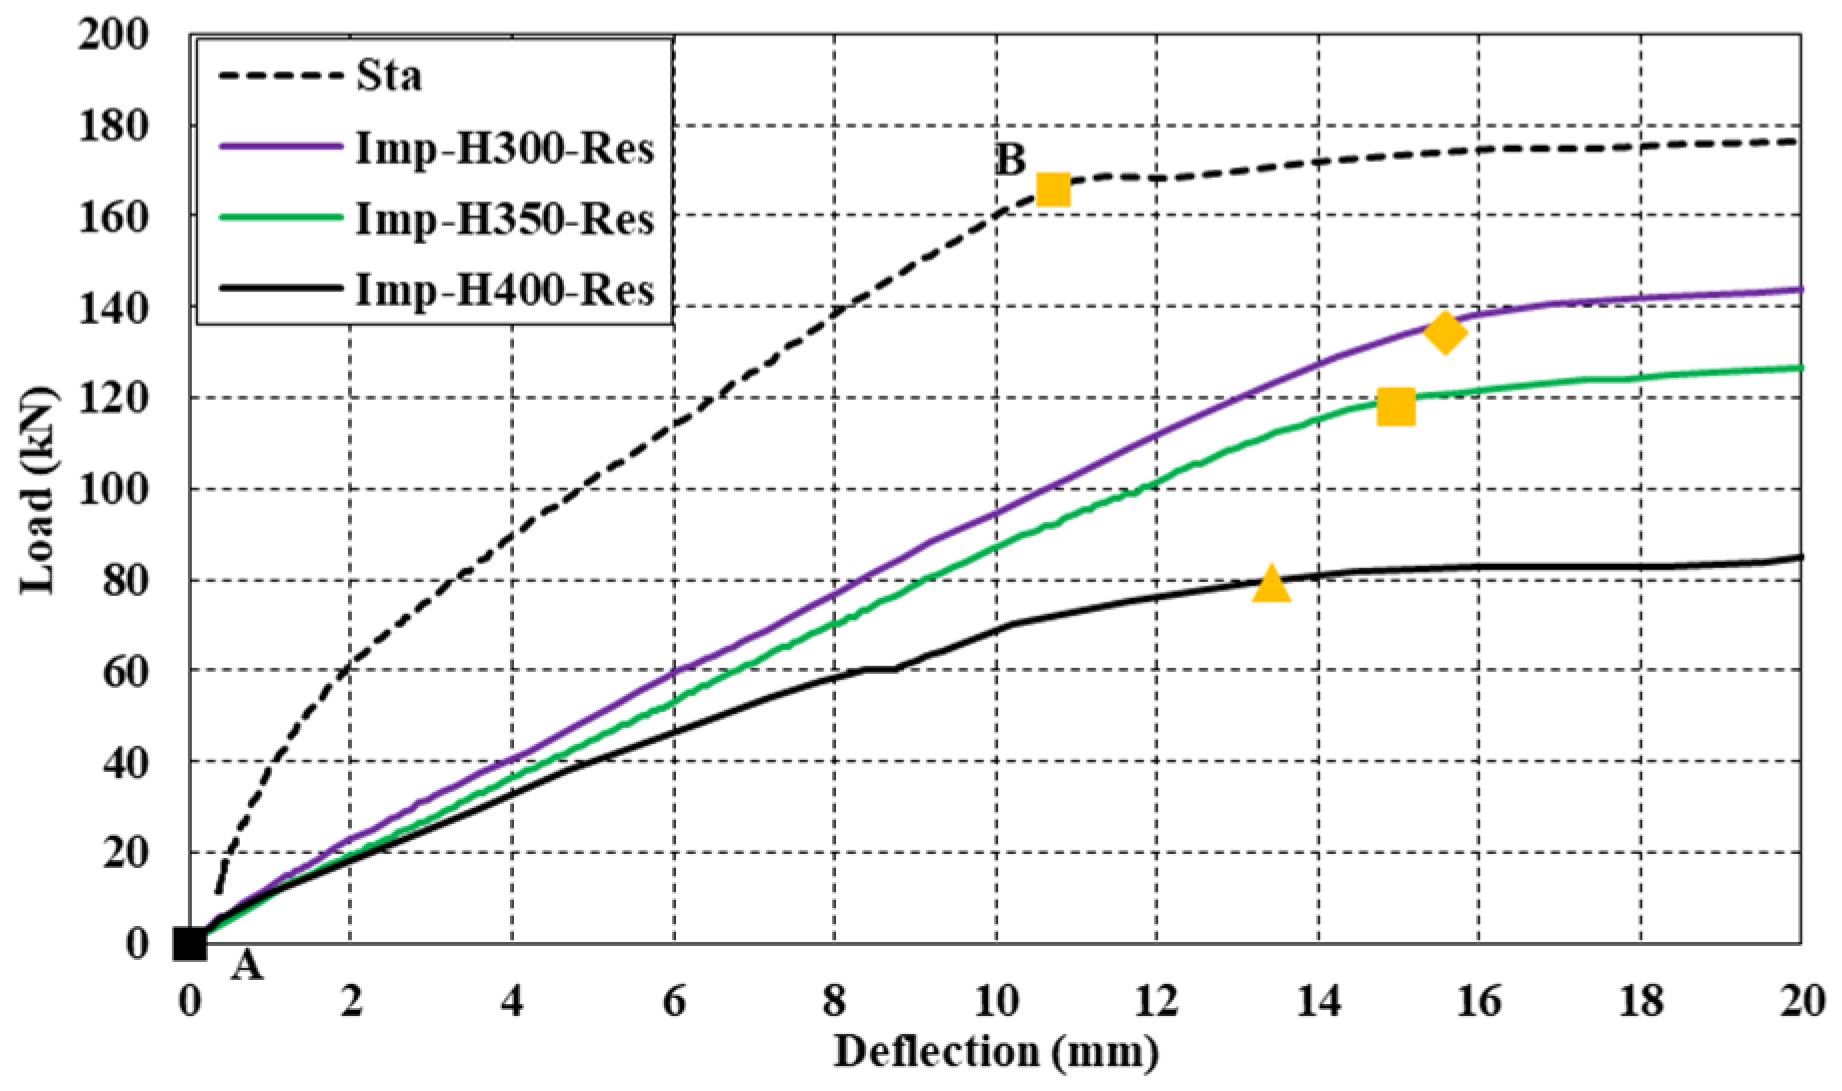
3.3.1. Residual Capacities

Static tests were performed on the Imp-H300, Imp-H350 and Imp-H400 specimens after the impact tests to determine their residual capacities. Since the Imp-H450 and Imp-H500 specimens were heavily damaged during the impact tests, they were not subjected to the residual static testing. The load displacement relationships of the post-impact static tests are presented in Figure 38, along with the static test of the unimpacted Sta specimen.
When the residual load displacement graphs of the impacted columns are compared to the unimpacted Sta specimen, it is observed that both the load carrying and displacement capacities of the impacted specimens have decreased (Figure 38). As the impact height increases, the residual displacement, residual load carrying capacities and the stiffnesses of the specimens decrease more remarkably.
Figure 39 presents the deflections along the length of the column at certain loading levels, which are also marked in the curves given in Figure 38. In this figure, all the curves pass from the origin (A) to obtain and to compare the reduced stiffness of the specimens after the impact tests; therefore, the residual deflections after the impact are not presented in the figure. However, the black “A” curves in Figure 39 present the residual deflected shape of each specimen after the impact (and before the residual loading tests). Both in Figure 38 and Figure 39, “B” represents the yielding load level, where the member secant stiffness decreases dramatically, point “C” represents the maximum load level, point “D” corresponds to the displacement at which unloading starts due to concrete crushing and point “E” presents the residual displacement at the end of the static loading.
Figure 40 presents the initial part of the load–deflection curve. The secant stiffness of the reference specimen (Sta) at point “B” (shown with yellow dot), where the yielding of the reinforcing bars in tension starts, is 15.516 MPa (EIsta). The secant stiffness for the impacted columns (EIres) was calculated as 8.619 MPa for the Imp-H300-Res specimen, 7.916 MPa for the Imp-H350-Res specimen and 5.912 MPa for the Imp-H400-Res specimen (Table 4) from the load–deflection curves obtained from the residual static tests.
It was observed that the load carrying capacity decreased by 11.2%, 25.4% and 49.7% for the Imp-H300, Imp-H350 and Imp-H400 specimens, respectively (Table 5). The displacement capacities (residual static) decreased by 45%, 58% and 59% for the Imp-H300-Res, ImpH350-Res and Imp-H400-Res specimens, respectively, compared to the Sta (reference) specimen.
Under higher applied impact energies, the rate of decrease in the load carrying capacity and stiffness is increased. When Figure 40 and Table 4 are examined, it is observed that the reduction in stiffness of the specimens after the impact tests is more significant than the reduction in the load carrying capacity. While their secant stiffness (at yield) was almost halved in the Imp-H300 and Imp-H350 specimens, the stiffness decreased to 38% of the undamaged secant stiffness of the Sta specimen in Imp-H400, where the dropping height was slightly increased by 50 cm. In addition, compared to the Sta specimen, the residual static load capacity of the Imp-H400 specimen was halved after the impact test.
The crack maps of the pre-impact damaged columns after the residual static tests are presented in Figure 41. The impact damages are indicated in red color, while the static test damages are presented in purple. It was observed that the cracks formed during impact loading increased in width and length during the static loading (Figure 41 and Figure 42). Concrete cover spalling was also observed on the columns during the residual capacity tests.

3.3.2. Energy Dissipation

The total reaction force–deflection relationships obtained for the impact tests and the load–deflection relationships of the columns recorded during the post-impact static loading are presented in Figure 43a,b. By calculating the areas under these curves, the dynamic and static energy dissipation values were calculated, respectively.
During the impact tests, 9.65, 13.53 and 17.41 kJ of energy were absorbed in the Imp-H300, Imp-H350 and Imp-H400 specimens, respectively. These values are presented by a red line in Figure 44a. In the residual static tests, these values were calculated as 6.16, 4.32 and 2.39 kJ, respectively, which are presented by a green line in Figure 44a. The total static energy dissipation capacity of the Sta specimen was calculated as 13.04 kJ (Figure 43b). The black line in Figure 44a presents the difference between the total static (13.04 kJ) and residual static energy levels, which is the static energy dissipation capacity loss for the impacted specimens. Regarding the post-impact static tests, the Imp-H400-Res specimen lost 81.7% of its static energy dissipation capacity during the impacts compared to the specimen Sta, and the loss was 66.90% and 52.78% for the Imp-H350-Res and Imp-H300-Res specimens, respectively (Figure 44b). The ratio of the impact energy dissipation to the static energy dissipation capacity loss for the Imp-H300, Imp-H350 and Imp-H400 specimens were 1.40, 1.55 and 1.63, respectively, which represent the dynamic increase factors (DIFs) for the specimens.

4. Numerical Study

Within the scope of this research, three-dimensional finite element models are developed in order to compare the experimental results with that of numerical studies. The effects of the impacts on the failure modes, displacements, support reactions and reinforcement strains were compared by conducting dynamic analyses on the three-dimensional finite element models. The nomenclature of the models with the same size and material properties as the tested reinforced concrete columns is shown in Figure 45.
Ansys LS-DYNA [59] software was used in the numerical analysis, which is based on explicit time integration, to perform the nonlinear transient dynamic analysis, where a high strain rate pulse effect can be modeled accurately in short time intervals. The software, with its superior capabilities, such as wide-range material models, contact algorithms and varied finite element model libraries, provides great convenience and benefit to users to develop and conduct sophisticated three-dimensional dynamic finite element models analyses.

4.1. Developing the Finite Element Models

While forming the geometric model of the column, the concrete and impactor were modeled as solid elements and divided into 25 × 25 × 25 mm meshes, and the reinforcing bars were modeled as beam elements and divided into 25 mm long meshes. Since the shell concrete thickness was 25 mm and smaller mesh sizes would increase the calculation time significantly, the mesh size was chosen as 25 mm.
The boundary conditions at the column ends were formed through nodes defined in the support regions in order to save calculation time. The exact supporting frames and the test setup were not included in the finite element model. The reaction forces and rotations that occurred in the supports were obtained in the analysis. A constant axial load was defined in the east support region.
Considering the plasticity and strain rate effects, the material model used for the reinforcing steel was Mat-003-Plastic_Kinematic and, for concrete, was Mat-159-Cscm_Concrete. Since the impactor was not deformed during the tests, Mat-020-Rigid was used for the material model [60,61].
The contact interface between the concrete and reinforcement was defined by Con-strained-Lagrange_in_Solid, and considering the rigidity difference, the contact surface was defined by Automatic-Surface_to_Surface [60,61].

4.2. The Validation of the Model

The finite element model was validated by using the experimental results of Imp-H200 and Imp-H500. The effective plastic strain distributions at t = 12 ms and t = 200 ms in the models are presented in Figure 46. It was observed that the damage patterns of the experiments (Imp-H200 and Imp-H500) and the FEA-H200 and FEA-H500 models are compatible (Figure 24, Figure 25 and Figure 37a and Figure 34, Figure 35 and Figure 37f).
The strain distribution along the reinforcements at the time of impact in the models (Figure 47) was compared to the test results (Figure 36a–d). The longitudinal reinforcements and stirrups strains in the model were quite similar to the experimental measurements.
The deflection time histories and the residual deflected shape of specimens were also compared in Figure 48, where the straight and dashed lines present the test and the model results, respectively. It was observed that the residual deflections close to the impact area were almost the same for FEA-H200 with Imp-H200 and FEA-H500 with Imp-H500 (Figure 48). In the reaction force–time history graph, it was observed that the maximum support reaction was measured as 430.38 kN at t = 2 ms in FEA-H200, while, in the experiment Imp-H200, the maximum total support response was measured as 461.06 kN at t = 13 ms (Figure 49a). Also, the maximum support reaction was measured as 430.38 kN at t = 2 ms in FEA-H500, while, in the experiment Imp-H500, the maximum total support response was measured as 289.14 kN at t = 2 ms (Figure 49b). Therefore, it could be concluded that the developed finite element model of the RC columns was successfully validated by using the test results of Imp-H200 and Imp-H500.

4.3. Finite Element Analysis: The Effect of the Impact Energy on the Structural Behavior

The validated finite element model was used to investigate the effect of the magnitude of the impact energy on the behavior of axially loaded reinforced concrete columns. The magnitude of the impact energy was increased incrementally by adjusting the dropping height. In modeling the impact tests, the drop height was increased in 50 cm intervals, starting from 200 cm and up to 600 cm. The investigation was conducted on square columns with identical geometric properties and a constant axial load level of 10% (270 kN).
The effective strain distributions on the columns at the time of impact and after the impact (T = 200 ms) are presented in Figure 50. It was observed that the number of flexural cracks increased when the dropping height increased from 200 cm to 400 cm (from FEA-H200 to FEA-H400), the shear behavior became more dominant towards the east support and the buckling of the longitudinal reinforcements dominated the behavior in the columns after the dropping height of 450 cm (FEA-H450-H500-H550) (Figure 50).
In FEA-H550, which represents the pre-collapse state, yielding occurred in the bottom and top longitudinal reinforcements. Buckling occurred at the top reinforcements in the impacted area, and the strains at the top of the reinforcements close to the eastern support reached the maximum strain limit. Yielding occurred in the stirrups close to the impact area (Figure 51).
The effective plastic strain and residual strain distributions at the time of impact and after impact from a dropping height of 600 cm (FEA-H600) are presented in Figure 52. Shear damage was observed starting from both top sides of the impact area and extending diagonally towards the bottom. FEA-H600, with a 600 cm dropping height, reached its final failure state under the impact load.
FEA-H600, which represents the collapsed state, yielding occurred in the bottom and top longitudinal reinforcements, while buckling occurred in the top reinforcements at the eastern side of the impact area. The longitudinal reinforcements and the stirrups ruptured close to the impact area (Figure 53).

4.4. Comparison of the Numerical and Experimental Results

The finite element model results of the specimens tested with different dropping heights were also compared to the experimental results (Table 6). When the maximum support responses between the experimental and the numerical study were compared, it was observed that there was a maximum difference of 9.84% (Imp-H450) and a minimum difference of 0.68% (Imp-H400). The average relative error was calculated as 5.45% (Figure 54).
When the maximum displacements were compared, the maximum difference was 26.04% (Imp-H450), the minimum 4.29% (Imp-H200) difference was obtained in the specimens and the average relative error was calculated as 14.65% (Figure 55a). In the residual displacements, where similar results were obtained with the maximum displacements, the average relative error was calculated as 15.08% (Figure 55b). In a single-specimen validation conducted in a previous study [44], there was a relative error of 18.3% for the maximum displacement and 32.8% for the residual displacements.
These differences between the experimental study and the numerical study are thought to be due to the assumptions made in the support conditions in the numerical study and the incompatibility of the behavior between the material models used and the materials used in the experiment.
It was observed that the developed finite element model highly represented the yielding and buckling behaviors of the reinforcements. Compared to the model, in the experimental study, the strains of the reinforcements were different in the Imp-H300 specimen for the longitudinal rebars and in the Imp-H200 specimen for the transverse rebars. These differences in the reinforcement strains could be attributed to the fact that, under the high loading conditions, the strains could not be collected accurately from the rebars, since the strains were measured at a very short length from the reinforcement surface (5 mm) during the experiments.
The finite element simulations matched the experimental data quite well, which again verifies the accuracy of the model. The simulations conducted with the finite element model once again exhibited that, with the increasing impact energy (conducting by increasing the dropping height), the shear effect began to dominate the behavior of the axially loaded reinforced concrete columns.

5. Conclusions

In this study, the behavior of axially loaded reinforced concrete columns under low-elevation impact loads was investigated both experimentally and numerically. Although the behavior of full-scale axially loaded RC columns under low-elevation impact loads was previously investigated by Gurbuz et al. [47], in this research, the aim was to clearly present the change in the behavior of reinforced concrete columns while gradually increasing the applied impact energy level by adjusting the dropping height. In addition, the impacted RC columns were tested again statically to observe the change in the load carrying, deflection and energy absorption capacities and, also, the stiffnesses of the pre-damaged RC columns after the impact. Additionally, to the authors’ knowledge, this research was the first to determine the post-impact capacity of axially loaded full-scale reinforced concrete columns.
The results obtained from this study are summarized below.
  • By the increasing impact energy, the dominant behavior changed gradually from flexure to shear in axially loaded columns under low-elevation impacts.
  • The displacement and damage levels in the specimens continued to increase until the specimens reached their failure state, and at the highest impact energy levels, buckling occurred in the top longitudinal reinforcements, causing total failure.
  • Under higher applied impact energies, the rate of the decrease in the stiffnesses, residual load carrying and deflection capacities increased.
  • By increasing the impact energy, the ratio of the impact energy dissipation to the static energy dissipation capacity loss (DIF) for the specimens increased from 1.40 to 1.63.
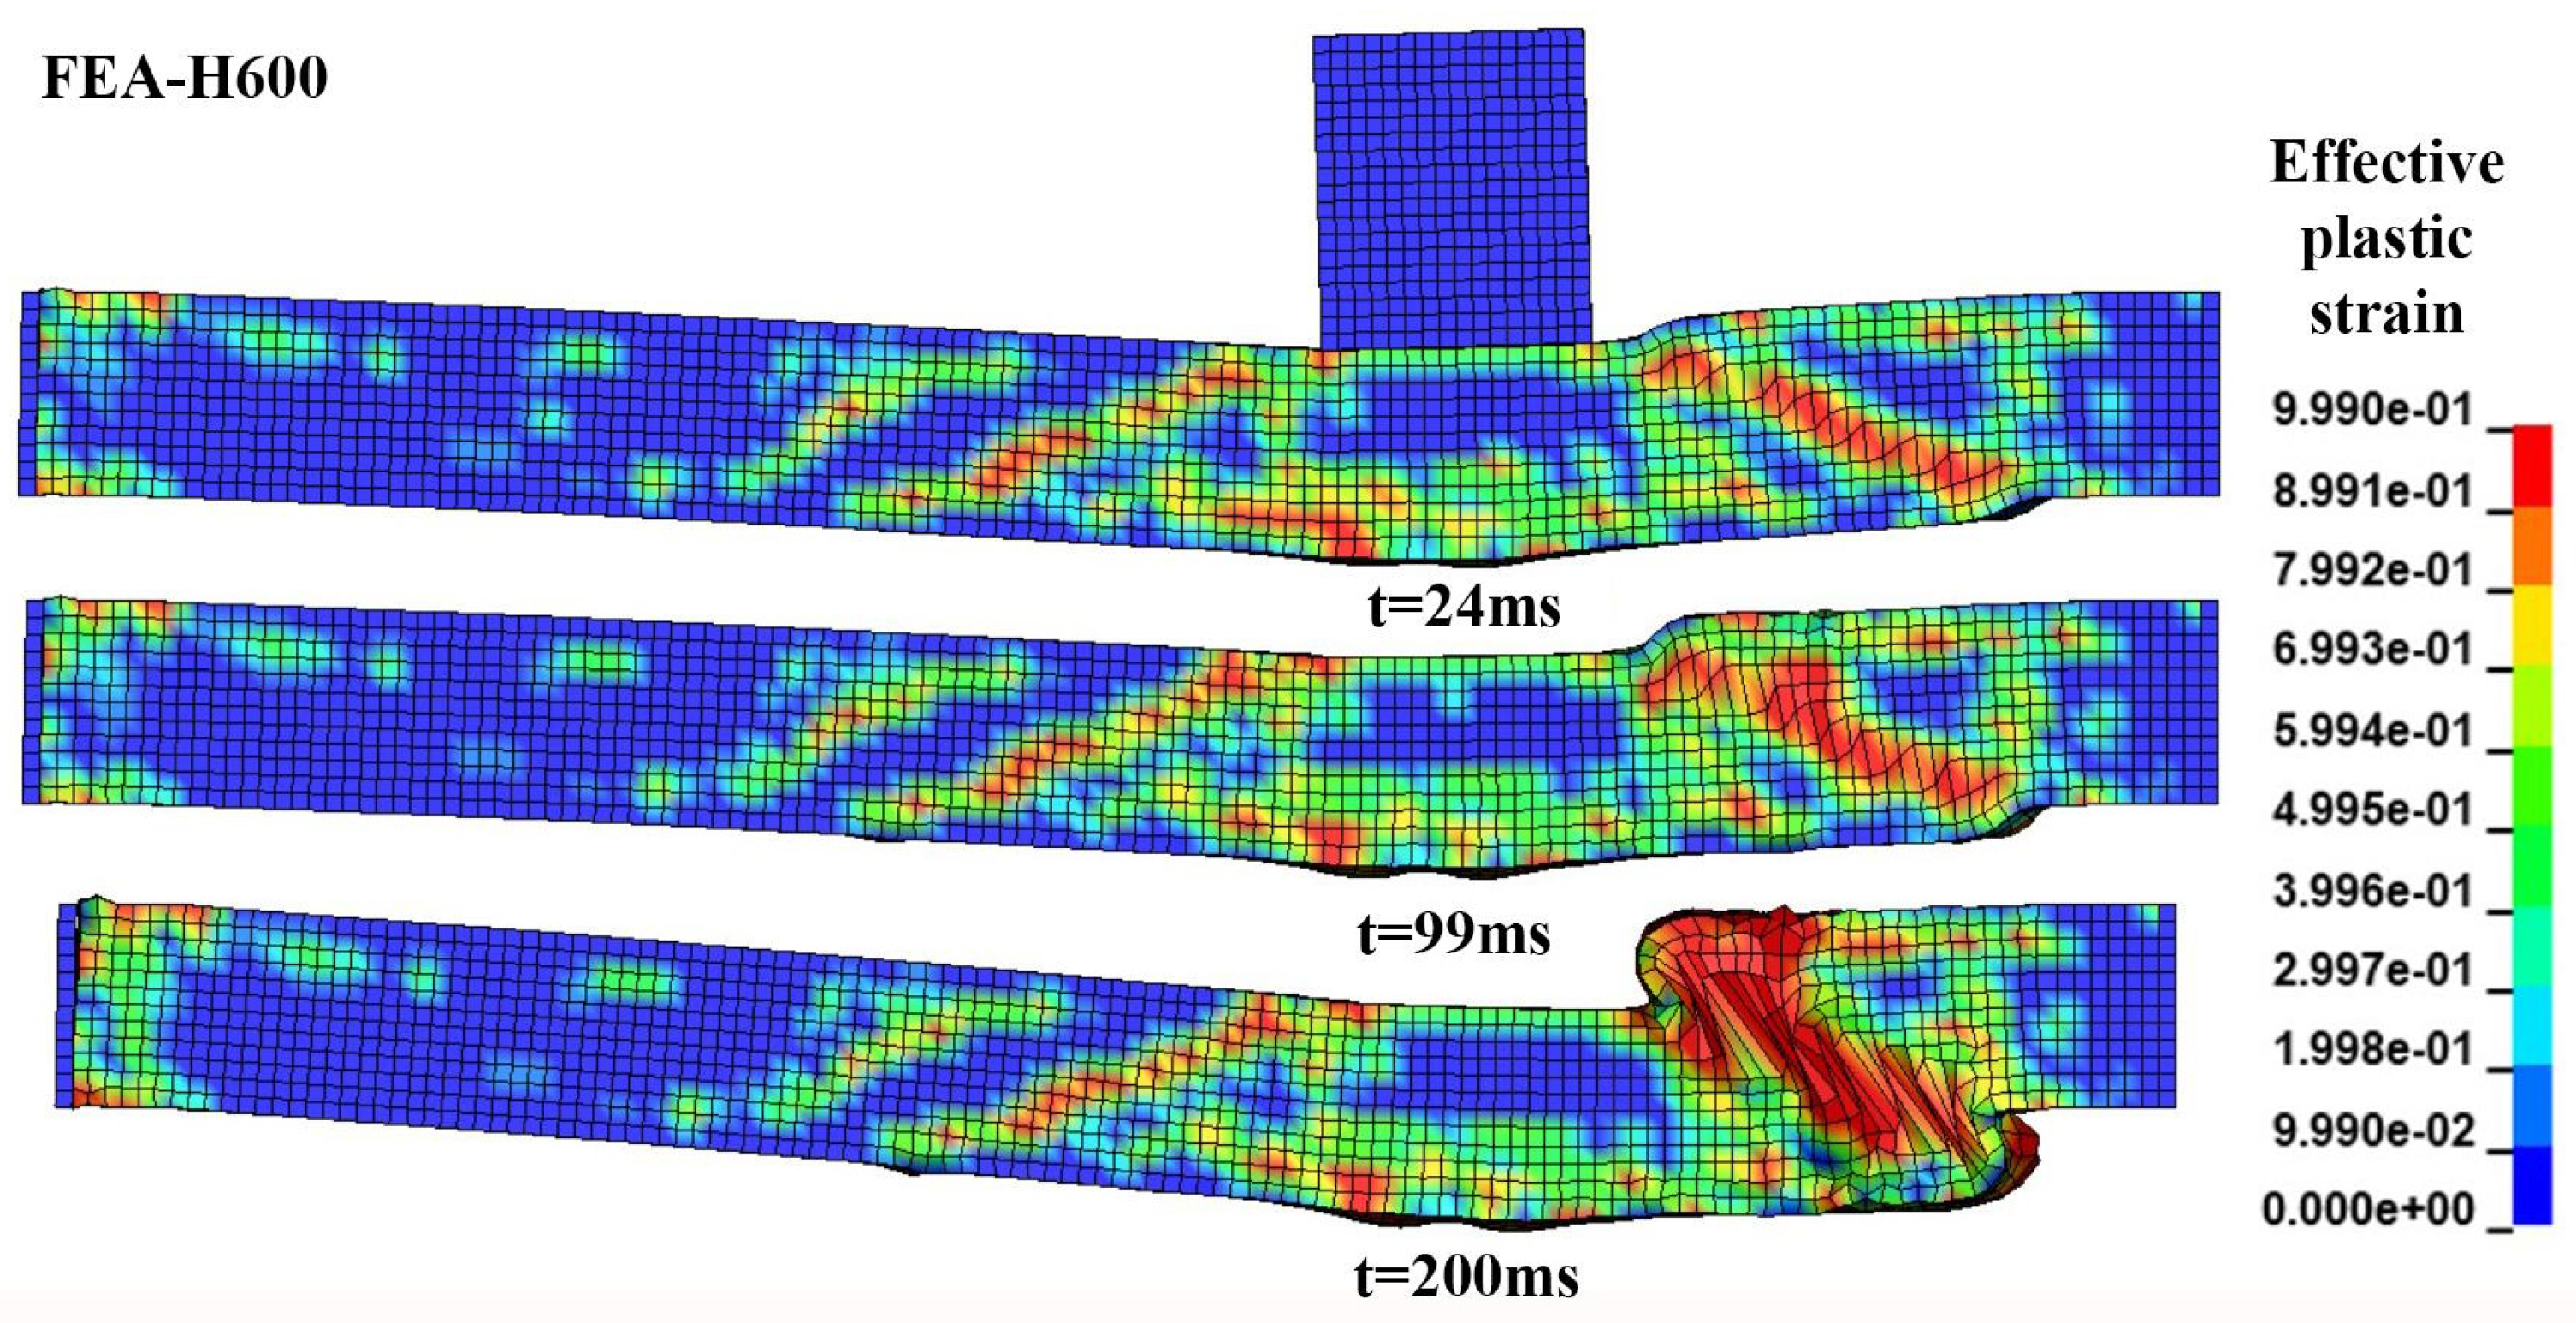
  • A good agreement was observed between the developed FE model and the test results. Based on the simulation results, axially loaded reinforced concrete columns with similar properties reached the impact capacity with a dropping height of 600 cm, where remarkably reduced stiffness, strength and displacement capacities, as well as obvious heavy damages, observed.
Regarding the residual static tests, it was observed that there was a remarkable decrease in the stiffness of the axially loaded columns after the impacts. Considering the ground-level columns of roadside buildings or columns in car parking areas, the columns would experience a great loss of rigidity after any impact effect. It is obvious that the columns should continue to carry conventional service loads after the experienced impact. Therefore, the reduction in the stiffness of the columns should be taken into account in the design in terms of the safety of the structures.

6. Recommendations

This study can provide an important reference on the behavior of axially loaded full-scale reinforced concrete columns under impact. Based on the conclusions drawn from the study, the following recommendations can be shared.
i
This research provided many findings regarding the impact behavior and post-impact behavior of reinforced concrete columns; however, the study should be expanded by examining the effects of different axial load levels, reinforcement configurations, impact energies and boundary conditions for future research.
ii
The developed FE model can be used in future studies to investigate the effects of different parameters on the impact behavior of RC columns.
Both the experimental and numerical studies outlined in this paper present part of an ongoing research project. Further research on enhancing the impact performance of reinforced concrete columns by strengthening is still underway.

Author Contributions

Conceptualization, A.C., T.G. and A.I.; Methodology, A.C., T.G and A.I.; Software, A.C.; Validation, A.C.; Formal analysis, A.C.; Investigation, A.C.; Resources, A.C.; Data curation, A.C.; Writing—original draft preparation, A.C.; Writing—review and editing, T.G., A.I. and M.A.; Visualization, A.C.; Supervision, M.A.; Project administration, M.A. and A.I.; Funding acquisition, M.A. All authors have read and agreed to the published version of the manuscript.

Funding

This research was funded by the Scientific Research Projects Department of Istanbul Technical University, project number MGA-2018-41191.

Data Availability Statement

The data used to support the findings of this study are available from the corresponding author upon request.

Acknowledgments

The authors wish to acknowledge the staff of the Istanbul Technical University Structural and Earthquake Engineering Laboratory, whose facilities were used during the experiments.

Conflicts of Interest

The authors declare no conflicts of interest.

References

  1. Zhang, C.; Gholipour, G.; Mousavi, A.A. State-of-the-Art Review on Responses of Structures Subjected to Lateral Impact Loads. Arch. Comput. Methods Eng. 2021, 28, 2477–2507. [Google Scholar] [CrossRef]
  2. Saatci, S.; Vecchio, F.J. Effects of Shear Mechanisms on Impact Behavior of Reinforced Concrete Beams. ACI Struct. J. 2009, 106, 78–86. [Google Scholar] [CrossRef]
  3. Banthia, N.P. Impact Resistance of Concrete. Ph.D. Thesis, Department of Civil Engineering, University of British Columbia, Vancouver, BC, Canada, 1987. [Google Scholar]
  4. Yankelevsky, D.Z.; Karinski, Y.S.; Feldgun, V.R. Damage and Failure of a Column-Supported RC Flat Slab Subjected to Impulsive Loading. Appl. Sci. 2023, 13, 1933. [Google Scholar] [CrossRef]
  5. Yankelevsky, D.Z.; Karinski, Y.S.; Feldgun, V.R. Dynamic punching shear failure of a RC flat slab-column connection under a collapsing slab impact. Int. J. Impact Eng. 2020, 135, 103401. [Google Scholar] [CrossRef]
  6. Mougin, J.P.; Perrotin, P.; Mommessin, M.; Tonnelo, J.; Agbossou, A. Rock fall impact on reinforced concrete slab: An experimental approach. Int. J. Impact Eng. 2005, 31, 169–183. [Google Scholar] [CrossRef]
  7. Zineddin, M.; Krauthammer, T. Dynamic response and behavior of reinforced concrete slabs under impact loading. Int. J. Impact Eng. 2007, 34, 1517–1534. [Google Scholar] [CrossRef]
  8. Dok, G.; Caglar, N.; Ilki, A.; Yilmaz, C. Effect of impact loading on residual flexural capacity of high-strength reinforced concrete beams. Structures 2020, 27, 2466–2480. [Google Scholar] [CrossRef]
  9. Yilmaz, C.; Kirtel, O.; Dok, G.; Ilki, A. Experimental Investigation on the Post-impact Behavior of Normal-Strength Reinforced Concrete Beams Subjected to Drop-Weight Impact Loads. Arab. J. Sci. Eng. 2023, 48, 13241–13258. [Google Scholar] [CrossRef]
  10. Adhikary, S.D.; Fujikake, K.; Li, B. State-of-the-art review on low-velocity impact response of reinforced concrete beams. Mag. Concr. Res. 2016, 68, 701–723. [Google Scholar] [CrossRef]
  11. Soleimani, S.M.; Banthia, N.; Mindess, S. Behavior of RC beams under impact loading: Some new findings. In Proceedings of the 6th International Conference on Fracture Mechanics of Concrete and Concrete Structures; Taylor & Francis: London, UK, 2007; Volume 2, pp. 867–874. Available online: https://framcos.org/FraMCoS-6/195.pdf (accessed on 10 November 2023).
  12. Wang, X.; Zhang, Y.; Su, Y.; Feng, Y. Experimental Investigation on the Effect of Reinforcement Ratio to Capacity of RC Column to Resist Lateral Impact Loading. Int. Conf. Risk Eng. Manag. 2011, 1, 35–41. [Google Scholar] [CrossRef]
  13. Remennikov, A.; Kaewunruen, S. Impact Resistance of Reinforced Concrete Columns: Experimental Studies and Design Considerations. University of Wollongong Research Online. 2006. Available online: http://ro.uow.edu.au/engpapers/379 (accessed on 10 November 2023).
  14. Yilmaz, A.; Kiraç, N.; Anil, Ö. Experimental investigation of axially loaded reinforced concrete square column subjected to lateral low-velocity impact loading. Struct. Concr. 2019, 20, 1358–1378. [Google Scholar] [CrossRef]
  15. Li, H.; Chen, W.; Huang, Z.; Hao, H.; Ngo, T.T.; Pham, T.M. Influence of various impact scenarios on the dynamic performance of concrete beam-column joints. Int. J. Impact Eng. 2022, 167, 104284. [Google Scholar] [CrossRef]
  16. Cai, J.; Ye, J.-B.; Chen, Q.-J.; Liu, X.; Wang, Y.-Q. Dynamic behaviour of axially-loaded RC columns under horizontal impact loading. Eng. Struct. 2018, 168, 684–697. [Google Scholar] [CrossRef]
  17. Song, Y.; Wang, J.; Han, Q. Dynamic performance of flexure-failure-type rectangular RC columns under low-velocity lateral impact. Int. J. Impact Eng. 2023, 175, 104541. [Google Scholar] [CrossRef]
  18. Zhu, X.; Zhao, P.; Tian, Y.; Wang, R. Experimental study of RC columns and composite columns under low-velocity impact. Thin-Walled Struct. 2021, 160, 107374. [Google Scholar] [CrossRef]
  19. Yunlei, W.; Lu, Z.; Hai, F.; Weiqing, L.; Yifeng, M. Experimental testing and numerical simulations of ship impact on axially loaded reinforced concrete piers. Int. J. Impact Eng. 2019, 125, 246–262. [Google Scholar] [CrossRef]
  20. Liu, B.; Fan, W.; Guo, W.; Chen, B.; Liu, R. Experimental investigation and improved FE modeling of axially-loaded circular RC columns under lateral impact loading. Eng. Struct. 2017, 152, 619–642. [Google Scholar] [CrossRef]
  21. Chen, L.; Xiao, Y.; El-Tawil, S. Impact Tests of Model RC Columns by an Equivalent Truck Frame. J. Struct. Eng. 2016, 142, 04016002. [Google Scholar] [CrossRef]
  22. Fan, W.; Shen, D.; Yang, T.; Shao, X. Experimental and numerical study on low-velocity lateral impact behaviors of RC, UHPFRC and UHPFRC-strengthened columns. Eng. Struct. 2019, 191, 509–525. [Google Scholar] [CrossRef]
  23. Lee, J.-Y.; Aoude, H.; Yoon, Y.-S.; Mitchell, D. Impact and blast behavior of seismically-detailed RC and UHPFRC Strengthened columns. Int. J. Impact Eng. 2020, 143, 103628. [Google Scholar] [CrossRef]
  24. Zhou, X.; Ming, Z.; Luo, D.; Wu, B.; Liu, L. Study on the nonlinear response and shear behavior of RC columns under lateral impact. Structures 2021, 34, 3834–3850. [Google Scholar] [CrossRef]
  25. Yuan, P.; Harik, I.E. Equivalent Barge and Flotilla Impact Forces on Bridge Piers. J. Bridge Eng. 2010, 15, 523–532. [Google Scholar] [CrossRef]
  26. Tantrapongsaton, W.; Hansapinyo, C.; Limkatanyu, S.; Zhang, H.; Vimonsatit, V. Nonlinear Response of RC Columns Subjected to Equal Energy-Double Impact Loads. Buildings 2022, 12, 1420. [Google Scholar] [CrossRef]
  27. Li, X.; Yin, Y.; Li, T.; Zhu, X.; Wang, R. Analytical Study on Reinforced Concrete Columns and Composite Columns under Lateral Impact. Coatings 2023, 13, 152. [Google Scholar] [CrossRef]
  28. Auyeung, S.; Alipour, A.; Saini, D. Performance-based design of bridge piers under vehicle collision. Eng. Struct. 2019, 191, 752–765. [Google Scholar] [CrossRef]
  29. Do, T.V.; Pham, T.M.; Hao, H. Impact force profile and failure classification of reinforced concrete bridge columns against vehicle impact. Eng. Struct. 2019, 183, 443–458. [Google Scholar] [CrossRef]
  30. Abdelkarim, O.I.; ElGawady, M.A. Performance of bridge piers under vehicle collision. Eng. Struct. 2017, 140, 337–352. [Google Scholar] [CrossRef]
  31. Thilakarathna, H.M.I.; Thambiratnam, D.P.; Dhanasekar, M.; Perera, N. Numerical simulation of axially loaded concrete columns under transverse impact and vulnerability assessment. Int. J. Impact Eng. 2010, 37, 1100–1112. [Google Scholar] [CrossRef]
  32. Sharma, H.; Hurlebaus, S.; Gardoni, P. Performance-based response evaluation of reinforced concrete columns subject to vehicle impact. Int. J. Impact Eng. 2012, 43, 52–62. [Google Scholar] [CrossRef]
  33. Sohel, K.M.A.; Al-Jabri, K.; Al Abri, A.H.S. Behavior and design of reinforced concrete building columns subjected to low-velocity car impact. Structures 2020, 26, 601–616. [Google Scholar] [CrossRef]
  34. Do, T.V.; Pham, T.M.; Hao, H. Impact Response and Capacity of Precast Concrete Segmental versus Monolithic Bridge Columns. J. Bridge Eng. 2019, 24, 04019050. [Google Scholar] [CrossRef]
  35. Hu, B.; Cai, J.; Jiabin, Y. Numerical Simulation of Dynamic Response and Evaluation of Flexural Damage of RC Columns under Horizontal Impact Load. Appl. Sci. 2021, 11, 11223. [Google Scholar] [CrossRef]
  36. Wang, W.; Chen, J.; Zhou, R.X.; Zhong, J. A simplified coupled model for predicting dynamic processes of vehicle impact on pier columns. Structures 2022, 41, 997–1013. [Google Scholar] [CrossRef]
  37. Zhao, W.; Ye, J. Dynamic behavior and damage assessent of RC columns subjected to lateral soft impact. Eng. Struct. 2022, 251, 113476. [Google Scholar] [CrossRef]
  38. Xie, R.; Fan, W.; Liu, B.; Dongjie, S. Dynamic behavior and vulnerability analysis of bridge columns with different cross-sectional shapes under rockfall impacts. Structures 2020, 26, 471–486. [Google Scholar] [CrossRef]
  39. Gholipour, G.; Zhang, C.; Mousavi, A.A. Effects of axial load on nonlinear response of RC columns subjectedto lateral impact load: Ship-pier collision. Eng. Fail. Anal. 2018, 91, 397–418. [Google Scholar] [CrossRef]
  40. Do, T.V.; Pham, T.M.; Hao, H. Dynamic responses and failure modes of bridge columns under vehicle collision. Eng. Struct. 2018, 156, 243–259. [Google Scholar] [CrossRef]
  41. Zhao, W.; Qian, J. Resistance mechanism and reliability analysis of reinforced concrete columns subjected to lateral impact. Int. J. Impact Eng. 2020, 136, 103413. [Google Scholar] [CrossRef]
  42. Wang, W.; Morgenthal, G. Dynamic analyses of square RC pier column subjected to barge impact using efficient models. Eng. Struct. 2017, 151, 20–32. [Google Scholar] [CrossRef]
  43. Demartino, C.; Wu, J.G.; Xiao, Y. Response of shear-deficient reinforced circular RC columns under lateral impact loading. Int. J. Impact Eng. 2017, 109, 196–213. [Google Scholar] [CrossRef]
  44. Li, R.W.; Zhou, D.Y.; Wu, H. Experimental and numerical study on impact resistance of RC bridge piers under lateral impact loading. Eng. Fail. Anal. 2020, 109, 104319. [Google Scholar] [CrossRef]
  45. AL-Bukhaiti, K.; Liu, Y.; Zhao, S.; Abas, H.; Xu, N.; Yang, L.; Yan, X.; Han, D. Experimental Study on Existing RC Circular Members Under Unequal Lateral Impact Train Collision. Int. J. Concr. Struct. Mater. 2022, 16, 39. [Google Scholar] [CrossRef]
  46. Chen, A.; Liu, Y.; Ma, R.; Zhou, X. Experimental and Numerical Analysis of Reinforced Concrete Columns under Lateral Impact Loading. Buildings 2023, 13, 708. [Google Scholar] [CrossRef]
  47. Gurbuz, T.; Ilki, A.; Thambiratnam, D.P.; Perera, N. Low-Elevation Impact Tests of Axially Loaded Reinforced Concrete Columns. ACI Struct. J. 2019, 116, 17–449. [Google Scholar] [CrossRef]
  48. Ye, J.-B.; Cai, J.; Chen, Q.-J.; Xinpei, L.; Tang, X.-L.; Zuo, Z.L. Experimental investigation of slender RC columns under horizontal static and impact loads. Structures 2020, 24, 499–513. [Google Scholar] [CrossRef]
  49. Ye, J.; Wang, Y.; Cai, J.; Chen, Q.; He, A. Evaluation of Residual Lateral Capacities of Impact Damaged Reinforced Concrete Members. Buildings 2022, 12, 669. [Google Scholar] [CrossRef]
  50. Fan, W.; Liu, B.; Consolazio, G.R. Residual Capacity of Axially Loaded Circular RC Columns after Lateral Low-Velocity Impact. J. Struct. Eng. 2019, 145, 04019039. [Google Scholar] [CrossRef]
  51. Wei, J.; Li, J.; Wu, C. An experimental and numerical study of reinforced conventional concrete and ultra-high performance concrete columns under lateral impact loads. Eng. Struct. 2019, 156, 375–393. [Google Scholar] [CrossRef]
  52. AL-Bukhaiti, K.; Liu, Y.; Zhao, S.; Abas, H.; Yu, Y.X.; Xu, N.; Han, D.; Lang, Y. Failure mechanism and static bearing capacity on circular RC members under asymmetrical lateral impact train collision. Structures 2023, 48, 1817–1832. [Google Scholar] [CrossRef]
  53. DEWE-43A; Technical Reference Manual. DEWESoft: Trbovlje, Slovenia, 2023. Available online: https://downloads.dewesoft.com/manuals/dewesoft-dewe-43a-manual-en.pdf (accessed on 10 November 2023).
  54. TDS-540; Data Logger Catalog. Tokyo Measuring Instruments Laboratory Co., Ltd.: Tokyo, Japan, 2023. Available online: https://www.tml.jp/eng/documents/Catalog/TDS-540_E3011F.pdf (accessed on 10 November 2023).
  55. DEWESoft X. User Manual; DEWESoft: Trbovlje, Slovenia, 2023; Available online: https://downloads.dewesoft.com/manuals/dewesoftx-getting-started-manual-en.pdf (accessed on 10 November 2023).
  56. TDS-7130v2; Static Measurement Software Catalog. Tokyo Measuring Instruments Laboratory Co., Ltd.: Tokyo, Japan, 2023. Available online: https://tml.jp/eng/documents/software/TDS-7130v2_E8002A.pdf (accessed on 10 November 2023).
  57. TS EN 12390-3; Testing Hardened Concrete-Part 3: Compressive Strength of Test Specimens. Turkish Standards Institution: Ankara, Turkey, 2019.
  58. TS 708; Steel for the Reinforcement of Concrete-Reinforcing Steel. Turkish Standards Institution: Ankara, Turkey, 2016.
  59. LS-DYNA. Theory Manual; Livermore Software Technolog: Livermore, CA, USA, 2019. [Google Scholar]
  60. LS-DYNA. Keyword User’s Manual Volume 1; Livermore Software Technolog: Livermore, CA, USA, 2021. [Google Scholar]
  61. LS-DYNA. Keyword User’s Manual Volume 2; Livermore Software Technolog: Livermore, CA, USA, 2021. [Google Scholar]
Figure 1. Specimen nomenclature.
Buildings 14 00092 g001
Figure 2. Details of the specimens (all dimensions are in mm).
Buildings 14 00092 g002
Figure 3. Strain gauge locations fixed on the reinforcement.
Buildings 14 00092 g003
Figure 4. Specimen preparation: (a) strain gauge installation, (b) reinforcement cage in the mold, (c) concrete casting and (d) concrete curing.
Buildings 14 00092 g004
Figure 5. Schematic view of the drop weight test setup: (a) 3D view of the drop weight test setup and (b) a general view.
Buildings 14 00092 g005
Figure 6. Placement of the instrumentation.
Buildings 14 00092 g006
Figure 7. Test setup: (a) general view, (b) drop weight, (c) west support and (d) east support.
Buildings 14 00092 g007
Figure 8. Schematic view of the static test setup.
Buildings 14 00092 g008
Figure 9. Static test setup: (a) general view and (b) loading frame.
Buildings 14 00092 g009
Figure 10. (a) Dynamic test, (b) static test, (c) dynamic test data analysis and (d) static test data analysis.
Buildings 14 00092 g010
Figure 11. Concrete compression test and stress–strain relation.
Buildings 14 00092 g011
Figure 12. Tensile strength test and stress–strain relation of the stirrup rebars.
Buildings 14 00092 g012
Figure 13. Tensile strength test and stress–strain relation of the longitudinal rebar.
Buildings 14 00092 g013
Figure 14. Load–deflection curve in the static test of the Sta specimen.
Buildings 14 00092 g014
Figure 15. Change in deflection due to damage during the static test of the Sta specimen.
Buildings 14 00092 g015
Figure 16. Strain–load curve during static loading. (a) Longitudinal rebars. (b) Transverse rebars.
Buildings 14 00092 g016
Figure 17. Crack maps of the Sta specimen.
Buildings 14 00092 g017
Figure 18. Damage after the static loading test of Sta.
Buildings 14 00092 g018
Figure 19. Axial load–time relations during impact tests.
Buildings 14 00092 g019
Figure 20. Support reactions: (a) Imp-H200 specimen and (b) total support reactions of all specimens.
Buildings 14 00092 g020
Figure 21. Maximum support reaction–impact energy relation.
Buildings 14 00092 g021
Figure 22. Deflection time histories for (a) Imp-H200 and (c) Imp-H500, and deflections along the column for (b) Imp-H200 and (d) Imp-H500.
Buildings 14 00092 g022
Figure 23. Residual deflections at the end of the impact tests.
Buildings 14 00092 g023
Figure 24. Crack map of specimen Imp-H200.
Buildings 14 00092 g024
Figure 25. Damage after the impact test of the Imp-H200 specimen: (a) south view, (b) south view around the impact zone, (c) north view and (d) north view around the impact zone.
Buildings 14 00092 g025
Figure 26. Crack map of specimen Imp-H300.
Buildings 14 00092 g026
Figure 27. Damage after the impact test of the Imp-H300 specimen: (a) south view, (b) south view around the impact zone, (c) north view and (d) north view around the impact zone.
Buildings 14 00092 g027
Figure 28. Crack map of specimen Imp-H350.
Buildings 14 00092 g028
Figure 29. Damage after the impact test of the Imp-H350 specimen: (a) south view, (b) south view around the impact zone, (c) north view around the impact zone and (d) top view around the impact zone.
Buildings 14 00092 g029
Figure 30. Crack map of specimen Imp-H400.
Buildings 14 00092 g030
Figure 31. Damage after the impact test of the Imp-H400 specimen: (a) south view, (b) south view around the impact zone, (c) north view around the impact zone and (d) top view around the impact zone.
Buildings 14 00092 g031
Figure 32. Crack map of specimen Imp-H450.
Buildings 14 00092 g032
Figure 33. Damage after the impact test of the Imp-H450 specimen: (a) south view, (b) south view around the impact zone, (c) north view around the impact zone and (d) top view around the impact zone.
Buildings 14 00092 g033
Figure 34. Crack map of specimen Imp-H500.
Buildings 14 00092 g034
Figure 35. Damage after the impact test of the Imp-H500 specimen: (a) south view, (b) south view around the impact zone, (c) north view around the impact zone and (d) top view around the impact zone.
Buildings 14 00092 g035
Figure 36. Reinforcement rebar strains of the (a) Imp-H200 longitudinal rebars, (b) Imp-H200 transverse rebars, (c) Imp-H500 longitudinal rebars and (d) Imp-H500 transverse rebars.
Buildings 14 00092 g036
Figure 37. Progress of the damage: (a) Imp-H200, (b) Imp-H300, (c) Imp-H350, (d) Imp-H400, (e) Imp-H450 and (f) Imp-H500.
Buildings 14 00092 g037
Figure 38. Comparison of the load–deflection curves.
Buildings 14 00092 g038
Figure 39. Change in deflection: (a) Sta, (b) Imp-H300-Res, (c) Imp-H350-Res and (d) Imp-H400-Res.
Buildings 14 00092 g039
Figure 40. Change in secant stiffness for columns subjected to impacts with different magnitudes.
Buildings 14 00092 g040
Figure 41. Crack map of specimens (a) Imp-H300-Res, (b) Imp-H350-Res and (c) Imp-H400-Res. (The red marked areas show the impact damage, while the purple marked areas show the static loading damage.)
Buildings 14 00092 g041
Figure 42. Damages after the static loading: (a) Imp-H300-Res, (b) Imp-H350-Res and (c) Imp-H400-Res.
Buildings 14 00092 g042
Figure 43. Energy dissipation: (a) impact tests and (b) residual static tests.
Buildings 14 00092 g043
Figure 44. (a) Energy dissipation. (b) Static energy dissipation capacity loss curves.
Buildings 14 00092 g044
Figure 45. Nomenclature of the FEA models.
Buildings 14 00092 g045
Figure 46. Strains in the specimens at the time of impact and at t = 200 ms: (a) FEA-H200 and (b) FEA-H500.
Buildings 14 00092 g046
Figure 47. Strain distribution of the rebars at t = 200 ms: (a) FEA-H200 and (b) FEA-H500.
Buildings 14 00092 g047
Figure 48. Comparison of the deflections. (a) Deflection time history of Imp-H200 and FEA-H200. (b) Residual deflection of Imp-H200 and FEA-H200. (c) Deflection time history of Imp-H500 and FEA-H500. (d) Residual deflection of Imp-H500 and FEA-H500.
Buildings 14 00092 g048
Figure 49. Comparison of the reaction force time history: (a) Imp-H200 and FEA-H200 and (b) Imp-H500 and FEA-H500.
Buildings 14 00092 g049
Figure 50. Effective plastic strains of the columns (a) at the time of impact and (b) after impact (t = 200 ms).
Buildings 14 00092 g050
Figure 51. Strain distribution of the rebars on FEA-H550 at t = 200 ms.
Buildings 14 00092 g051
Figure 52. Effective plastic strain distribution of the FEA-H600 specimen at the time of impact and at t = 200 ms.
Buildings 14 00092 g052
Figure 53. Strain distribution of the rebars on FEA-H600 at the maximum deflection.
Buildings 14 00092 g053
Figure 54. Experimental and numerical comparisons of the maximum total reactions.
Buildings 14 00092 g054
Figure 55. Experimental and numerical comparison of (a) the maximum deflection and (b) residual deflection.
Buildings 14 00092 g055
Table 1. Test matrix.
Specimen NameDrop Height
(m)
Impact Velocity
(m/s2)
Impact Energy
(kJ)
Residual Static Capacity Test
StaStatic LoadingStatic LoadingStatic LoadingStatic Loading
Imp-H2002.006.2611.48-
Imp-H3003.007.6717.22Imp-H300-Res
Imp-H3503.508.2920.09Imp-H350-Res
Imp-H4004.008.8622.96Imp-H400-Res
Imp-H4504.509.4025.82-
Imp-H5005.009.9028.69-
Table 2. Mechanical properties of the concrete and steel-reinforcing bars.
Mix proportion and compressive strength of concrete.
Cement
(kg/m3)
Water
(kg/m3)
No. I aggregate and sand
(kg/m3)
No. II aggregate
(kg/m3)
Max aggregate size
(mm)
Compressive
strength, fc’
(MPa)
24516238415732230.9
Mechanical properties of steel rebars.
Rebar typeDiameter
(mm)
Yield Strength
(MPa)
Ultimate Strength
(MPa)
Modulus of
Elasticity
(GPa)
Longitudinal rebar18459538200.5
Transverse rebar8501630202.9
Table 3. Test results.
Specimen NameDrop Height (m)Governed
Behavior
Max. Total Support
Reactions (kN)
Deflections at P200 Potentiometer (mm)Maximum Crack Width (mm)Maximum Strains on Rebar (%)Buckling on Longitudinal Rebar
MaximumResidualShearFlexureLongitudinal Transverse
StaStaticFlexure--------
Imp-H2002.00Flexure46135.031.5<18+0.30−0.05-
Imp-H3003.00Flexure47261.059.6210+0.56+0.37-
Imp-H3503.50Shear/Flexure44478.578.4313+0.56+0.67-
Imp-H4004.00Shear/Flexure442102.0100.1512+0.53+0.22+
Imp-H4504.50Shear/Flexure498111.0105.51515+0.50+0.71+
Imp-H5005.00Shear389107.0105.71520+0.67+0.32+
Table 4. Secant stiffness ratios.
SpecimenEIsta or EIres
(MPa)
EIres/EIsta
Sta15.516-
Imp-H300-Res8.61955.55%
Imp-H350-Res7.91651.02%
Imp-H400-Res5.91238.10%
Table 5. Residual load–deflection test results.
SpecimenP200 Deflection (mm)Static Residual Load
Carrying
Capacity (kN)
Impact LoadingStatic Loading
MaximumResidualMaximum
(Imp + Sta)
Residual
(Imp + Sta)
Sta0.00.081.171.2176.9
Imp-H300-Res62.059.6111.598.7157.1
Imp-H350-Res78.578.4119.6108.0132.0
Imp-H400-Res102.0100.1137.9129.589.0
Table 6. Comparison of the FEA models and experiments.
SpecimenMax. Support
Reaction
(kN)
Maximum
Deflection
(mm)
Residual
Deflection
(mm)
Longitudinal Rebar Transverse Rebar
YieldingBucklingYielding
Imp-H20046135.031.5+
FEA-H20043033.530.2++
Imp-H30047261.059.6++
FEA-H30046154.552.5++
Imp-H35044478.578.4++
FEA-H35044760.360.0+++
Imp-H400442102.0100.1+++
FEA-H40045982.279.5+++
Imp-H450498111.0105.5+++
FEA-H45044982.179.5+++
Imp-H500389107.0105.7+++
FEA-H500425102.499.6+++
Disclaimer/Publisher’s Note: The statements, opinions and data contained in all publications are solely those of the individual author(s) and contributor(s) and not of MDPI and/or the editor(s). MDPI and/or the editor(s) disclaim responsibility for any injury to people or property resulting from any ideas, methods, instructions or products referred to in the content.

