Article

Performance of a Single Source of Low-Grade Clay in a Limestone Calcined Clay Cement Mortar

1
Research Institute for Clean Growth and Future Mobility, Coventry University, Coventry CV1 5FB, UK
2
School of Energy, Construction & Environment, The College of Engineering, Environment and Science, Coventry University, Coventry CV1 5FB, UK
3
Concrete Corrosion Tech Ltd., Birmingham B17 0JN, UK
4
Institute of Advanced Study, Collegium Basilea, 4053 Basel, Switzerland
5
Building Research Establishment (BRE), Watford WD25 9XX, UK
*
Author to whom correspondence should be addressed.
Buildings 2024, 14(1), 93; https://doi.org/10.3390/buildings14010093
Submission received: 23 November 2023 / Revised: 20 December 2023 / Accepted: 25 December 2023 / Published: 29 December 2023

Abstract

:
The high kaolinite content of metakaolin makes it valuable to other industries, thereby affecting its availability and affordability for the production of limestone calcined clay cement (LC3). This work presents a study on the potential utilization of low-grade clay in place of pure metakaolin in the preparation of LC3 for mortar formulations. CEM I was partially substituted with calcined clay and limestone by 20, 30, 40, and 50 wt.%. The weight ratio of calcined clay and limestone was maintained at 2:1 for all mixes and the water-to-binder ratio was 0.48. X-ray diffraction (XRD), thermogravimetric analysis (TGA), and isothermal conduction calorimetry were used to study the hydration process and products after 28 days. Mechanical and durability assessments of the LC3 mortar specimens were conducted. LC3 specimens (marked LC20%, LC30%, LC40%, and LC50%) trailed the control sample by 1.2%, 4%, 9.8%, and 18%, respectively, at 28 days and 1.6%, 2.3%, 3.6%, and 5.5%, respectively, at 91 days. The optimum replacement of OPC clinker, calcined clay, and limestone was 20% (LC20%).

1. Introduction

The issue of sustainability in the cement industry has necessitated the development of several technologies that aim to reduce the cement industry’s contribution of CO2 to the environment. One breakthrough has been the development and utilization of supplementary cementitious materials (SCMs) such as calcined clay, fly ash, silica fume, metakaolin, etc. [1]. The use of more than one SCM in cementitious systems has also been reported as an excellent technology that harnesses the individual and synergistic properties of the SCMs involved [2]. One such ternary blended composite that has gained massive popularity in the construction industry in recent times is limestone calcined clay cement (LC3).
Since its introduction, LC3 has been accepted as an alternative sustainable binder for construction applications due to its technical properties and environmental benefits [3]. The popularity of LC3 stems from the readily available, less processed materials that can replace cement clinker at a comparatively high rate. This leads to a composite cement that has lower embodied energy and releases less carbon dioxide during its production than Portland cement [4]. LC3 is typically composed of limestone, calcined clay, cement, and gypsum in proportions of 15%, 30%, 50% and 5%, respectively [4]. A substantial amount of metakaolinite in the calcined clay is essential for the development of LC3 properties, with clays with kaolinitic content of around 40% or greater performing well [1]. Metakaolinite is the reactive aluminosilicate phase formed after pure kaolinitic clays are calcined at the appropriate temperature [5].
Concrete prepared with LC3 has been reported to develop similar 7-day compressive strength results as CEM I, with a clinker replacement of 50%. It must, however, be emphasized that a high kaolinite content (about 40%) is essential for achieving such impressive mechanical properties [6]. The high kaolinite increases the reactivity of the calcined clay and causes a dense structure to be achieved in the LC3 concrete, improving early strength while decreasing porosity and permeability [7]. One other factor that has been reported to contribute to the strength development of LC3 systems is the reaction between limestone powder and calcined clay to produce carbo-aluminate phases [3].
Unfortunately, pure kaolinitic clay, suitable to produce metakaolin and LC3 formulations has also suffered stiff competition from other industries due to its use in the manufacture of paint, paper, and ceramic products. This has made pure kaolinitic clays scarce and expensive [3]. As a result, recent studies have focused on the use of low-grade clays (with kaolinite content of less than 20%) in cementitious systems to achieve comparable results to other established and accepted supplementary cementitious materials (SCMs) such as coal fly ash and ground granulated blast-furnace slag (GGBS) [2].
Cardinaud et al. [8] examined the degree of hydration as well as types of hydration products formed when low- and high-grade clays were used in binary and ternary systems involving limestone and calcined clay, with 50% of cement replaced with 30% calcined clay, 25% limestone powder, and 5% gypsum. The results from the ternary blended components showed a significant impact on hydration. The extent of the pozzolanic reaction in the blended cement containing low-grade calcined clay was higher than that of pure metakaolin. This proved that low-grade clays also have the potential to be utilized in LC3 systems without compromising essential concrete properties. To improve the performance of LC3, Hay and Celik [9] used two limestone powders with different fineness levels in the preparation of LC3 containing hemihydrate. The results indicated that LC3 mixes containing the finer limestone powder and 3% hemihydrate showed a significant improvement in mechanical properties, with 90-day strength test results trailing the control sample by only 12.3%. Blouch et al. [10] also studied the hydration and performance of LC3 produced with low-grade clay and mixed clay. The mixed clay comprised quartz, illite, and some amount of kaolinite. Similarly, LC3 concrete containing low-grade clay exhibited high pozzolanic reactivity and compressive strength, comparable to the reference concrete.
Most studies involving LC3 systems have focused on utilizing pure clays possessing high kaolinite content. It has already been established that the use of pure clays in LC3 systems results in excellent mechanical properties of the resultant concrete. However, pure clays are scarce and can only be found in specific places, making them expensive. Little attention has been given to the performance of low-grade clay in LC3 systems with varied calcined clay and limestone compositions. This work studied the performance of low-grade clay with a kaolinite content of 17% and calcined at a higher temperature of 900 °C as the optimum temperature. Four replacement levels (20 wt.%, 30 wt.%, 40 wt.%, and 50 wt.%) were adopted in determining the performance of the resultant paste and mortar. Physical properties including soundness, setting time, and normal consistency were determined. Characterization techniques such as X-ray diffraction (XRD), thermogravimetric analysis (TGA), and isothermal conduction calorimetry were used to monitor hydration and hydration products after 28 days. Mechanical and durability assessments, such as compressive strength, drying shrinkage, chloride ingress, and water absorption, of the LC3 mortar specimens were conducted after curing for 28 days. The findings of this investigation, if extended to a range of clay sources, would contribute to forming a possible approach for evaluating and gaining the acceptance and utilization of low-grade clays in LC3 systems.

2. Materials and Methods

2.1. Materials

CEM I (Class 52.5 N) having a fineness of 410 m2/kg and a specific gravity of 3.15 was used as the main binder. XRD analysis of the cement is shown in Figure 1. Cretaceous brick-making clay from a pit in the south of England, having a kaolinite content of 17% (determined via thermogravimetric analysis), was calcined for 2 h in a muffle furnace at 900 °C. The calcining temperature was selected based on previous studies [11]. A heating rate of 10 °C/h was adopted for all heat treatments. The calcined clay was milled and sieved to a fineness of 75 µm. Limestone powder of fineness 45 µm was obtained from Elixir Supplies, Morecambe, England. The main crystalline phase observed in the limestone was calcite as shown in Figure 2.
The chemical compositions of the raw materials, as determined via X-ray fluorescence (XRF), are shown in Table 1. The particle size distribution of the cement, calcined clay, and limestone powder are presented in Figure 3. The fine aggregate used for the mortar mixes conformed to the ASTM C778 standard [12].

2.2. Methods

2.2.1. Mix Proportion and Sample Preparation

LC3 pastes were prepared, using water requirements obtained from the normal consistency test, to determine the heat of hydration and conduct thermogravimetric and XRD analysis of the samples. CEM I was partially substituted with calcined clay and limestone by 20, 30, 40, and 50 wt.%. The weight ratio of calcined clay and limestone was maintained at 2:1 for all mixes [3]. The mix design of the mortar specimens for the compressive strength test is presented in Table 2. The samples were labelled LC20%, LC30%, LC40%, and LC50%. All samples were compared with OPC, which served as the reference mortar and was labelled “control”. The water-to-binder ratio was 0.48 throughout. This was adopted based on trial and error to achieve a workable paste.

2.2.2. Experimental Methods

Isothermal conduction calorimetry was used to examine the hydration kinetics of the LC3 paste samples. The development of the hydration heat rate was monitored using a thermometric TAM air conduction calorimeter. A working temperature of 20 °C was maintained inside the calorimeter after 5 g of the blended cement samples were combined with deionized water. For a maximum of 50 h, the associated computer continuously produced heat of hydration data. Phase identification was carried out using a 3rd generation Malvern Panalytical Empyrean XRD Diffractometer, manufactured by Malvern Panalytical Company Ltd., Worcestershire, UK. X-ray fluorescence (XRF) technique (Spectro X-lab 2000 manufactured by SPECTRO Analytical Instruments Inc., Kleve, Germany) was used to analyse the elemental composition of the starting powders. Thermogravimetric analysis of the clay sample and 28-day hydrated LC3 paste specimens were conducted using the Perkin Elmer DSC 7 analyser, manufactured by PerkinElmer Inc., Waltham, MA, USA. The system was set to 1000 °C, adopting a heating rate of 20 °C/min. To prevent carbonation, a nitrogen gas flow rate of 50 mL/min was introduced into the chamber.
All cement samples were tested for normal consistency and setting times using the Vicat method, as described by the ASTM C191 standard [13]. As required by EN 196-3 [14], the Le-Chatelier apparatus was used to determine soundness. For compressive strength determination, mortar samples were made using the ASTM C305 standard [15] with a 0.48 water-to-binder ratio and a 3:1 sand-to-binder ratio. The pre-prepared blended cement samples containing limestone and calcined clay in their measured quantities were mixed thoroughly with fine aggregate in a motorized mixer for 2 min. Water was then added and allowed to mix for another 3 min until uniformity was achieved. The mortar was placed in 50 × 50 × 50 mm steel moulds and left on the laboratory shelves for 24 h. All samples were de-moulded, water-cured, and tested after 3, 7, 28, and 91 days for compressive strength.
The ASTM C157 [16] standard was followed in determining drying shrinkage. After three hours of curing, the initial reading was obtained and was marked as L0. Final readings (Lf) were recorded after 3, 7, 28, and 91 days. Equation (1) was used to calculate the drying shrinkage, with the effective length of the samples being 250 (mm).
ε t = L f L 0 250
The rapid chloride penetration test (RCPT) and water absorption tests were conducted with reference to the ASTM C 1202 [17] and ASTM C642-13 [18] standards, respectively.

3. Results and Discussion

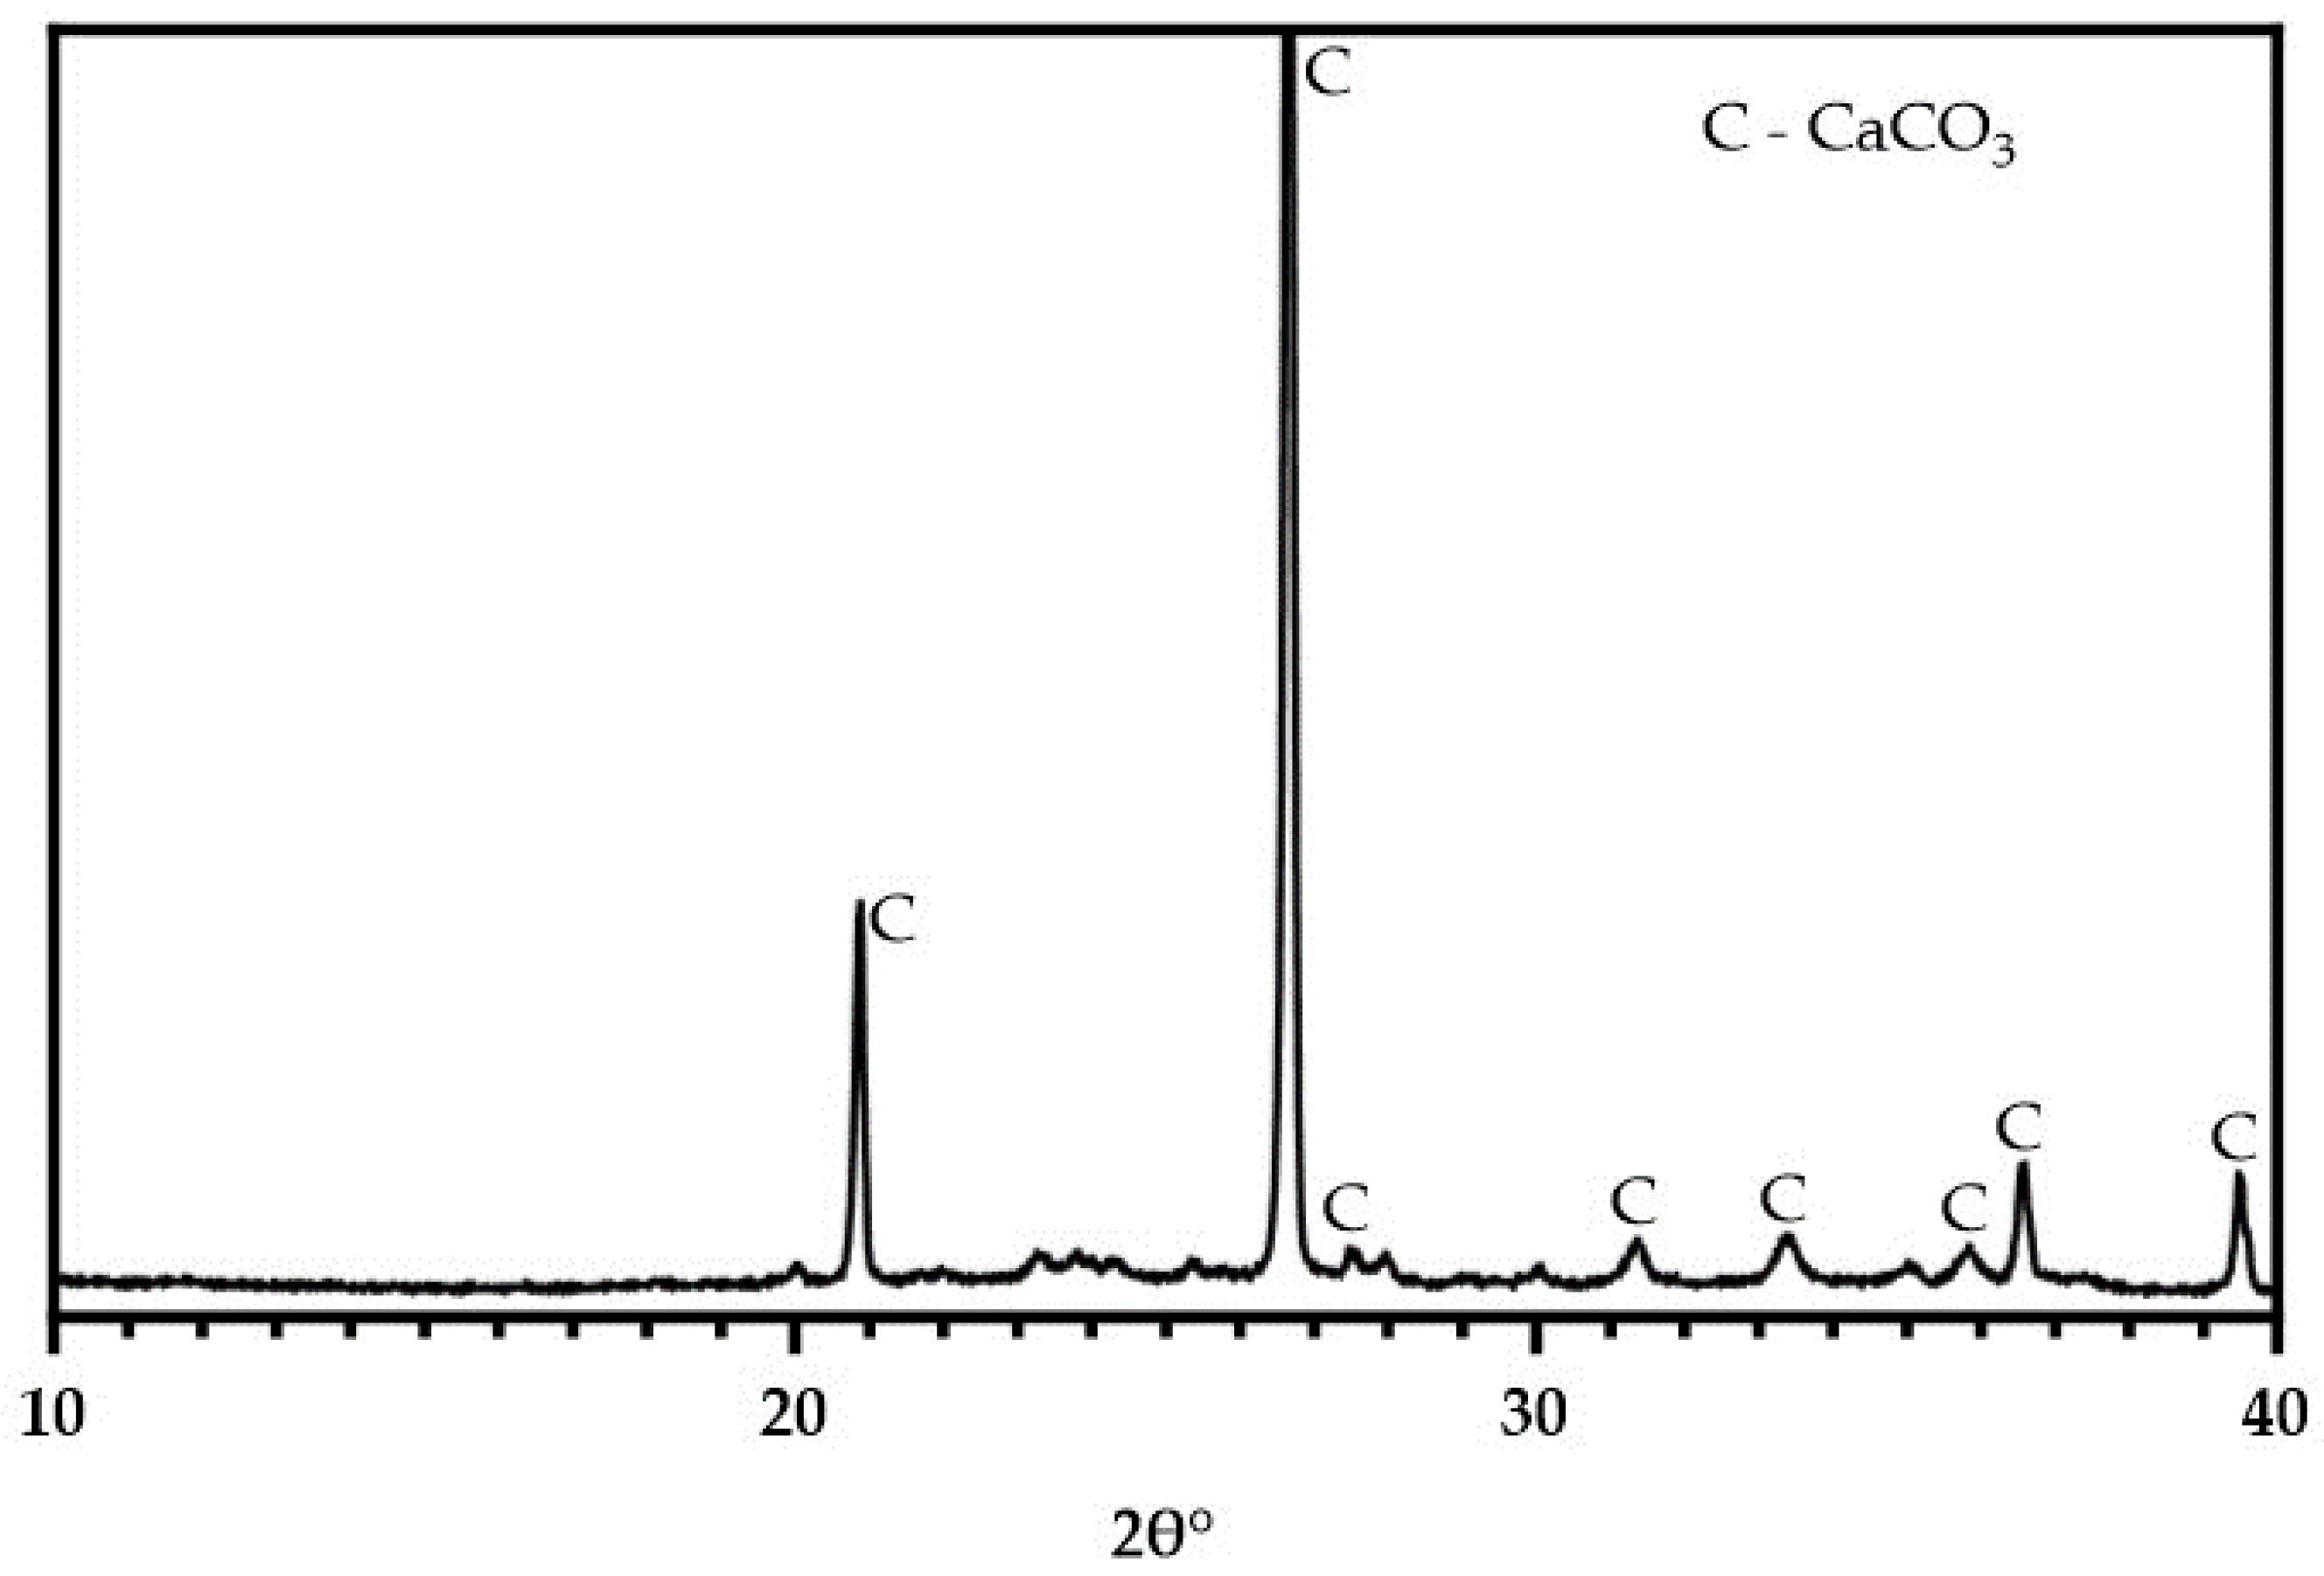
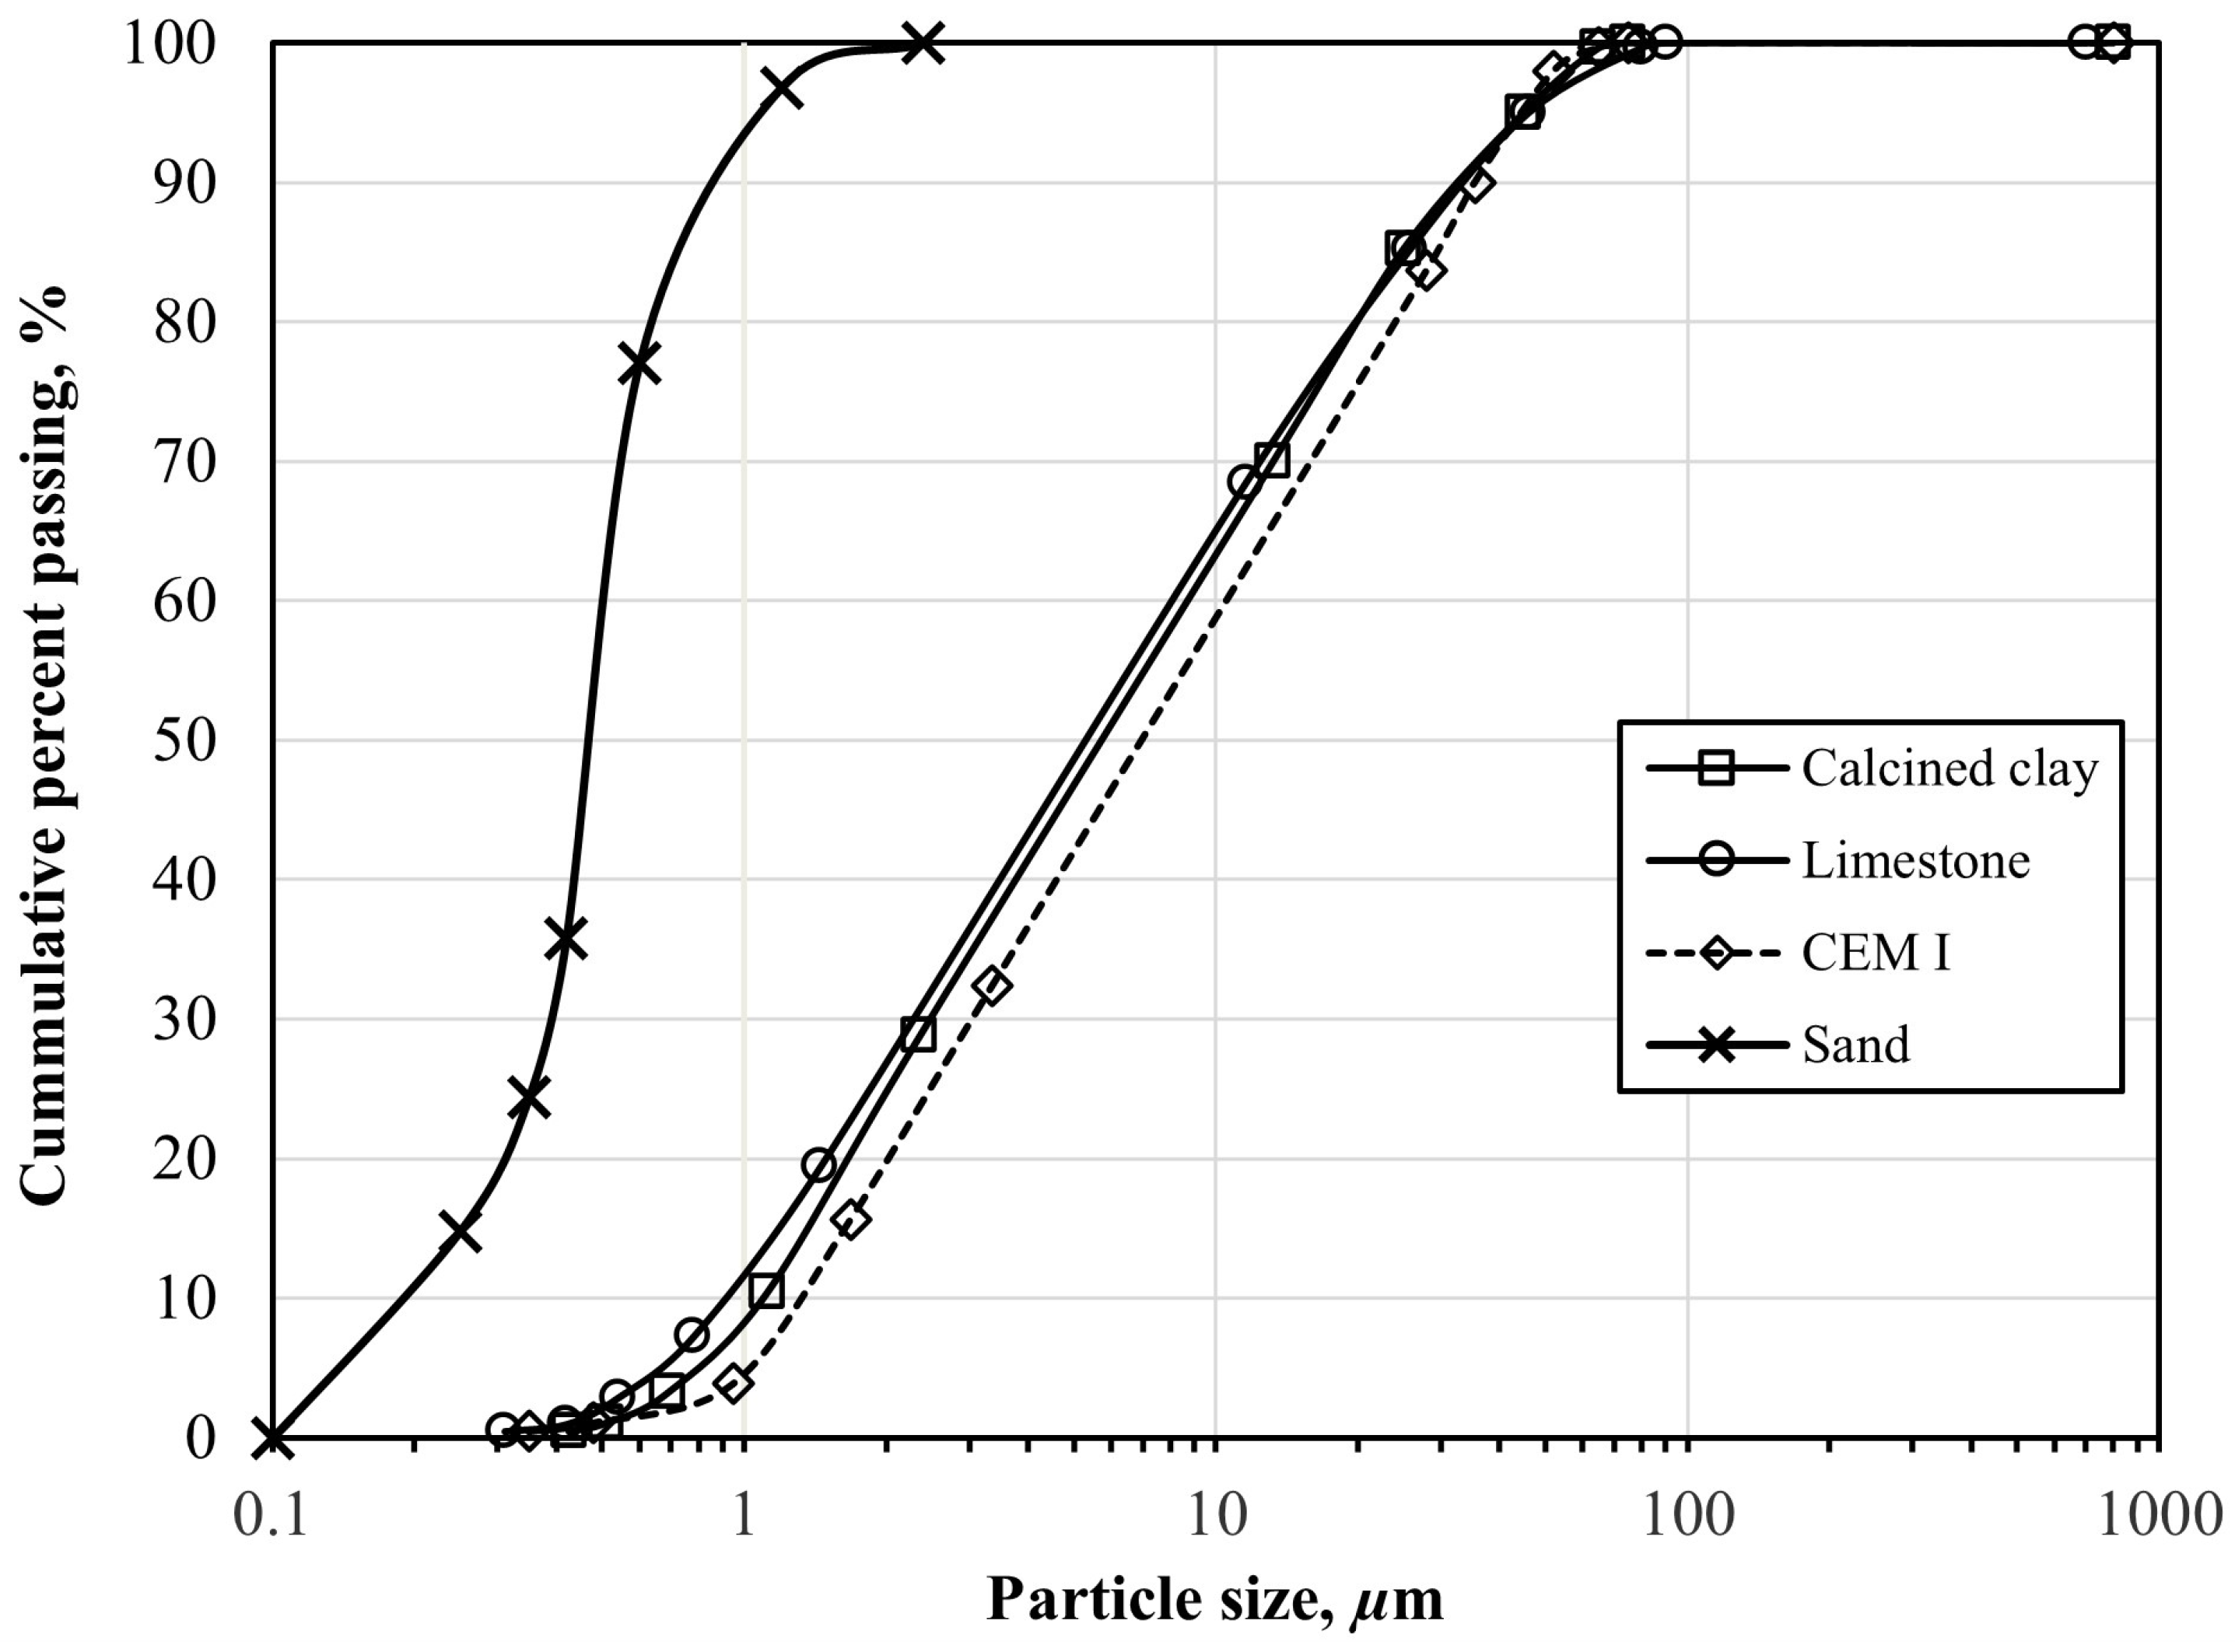
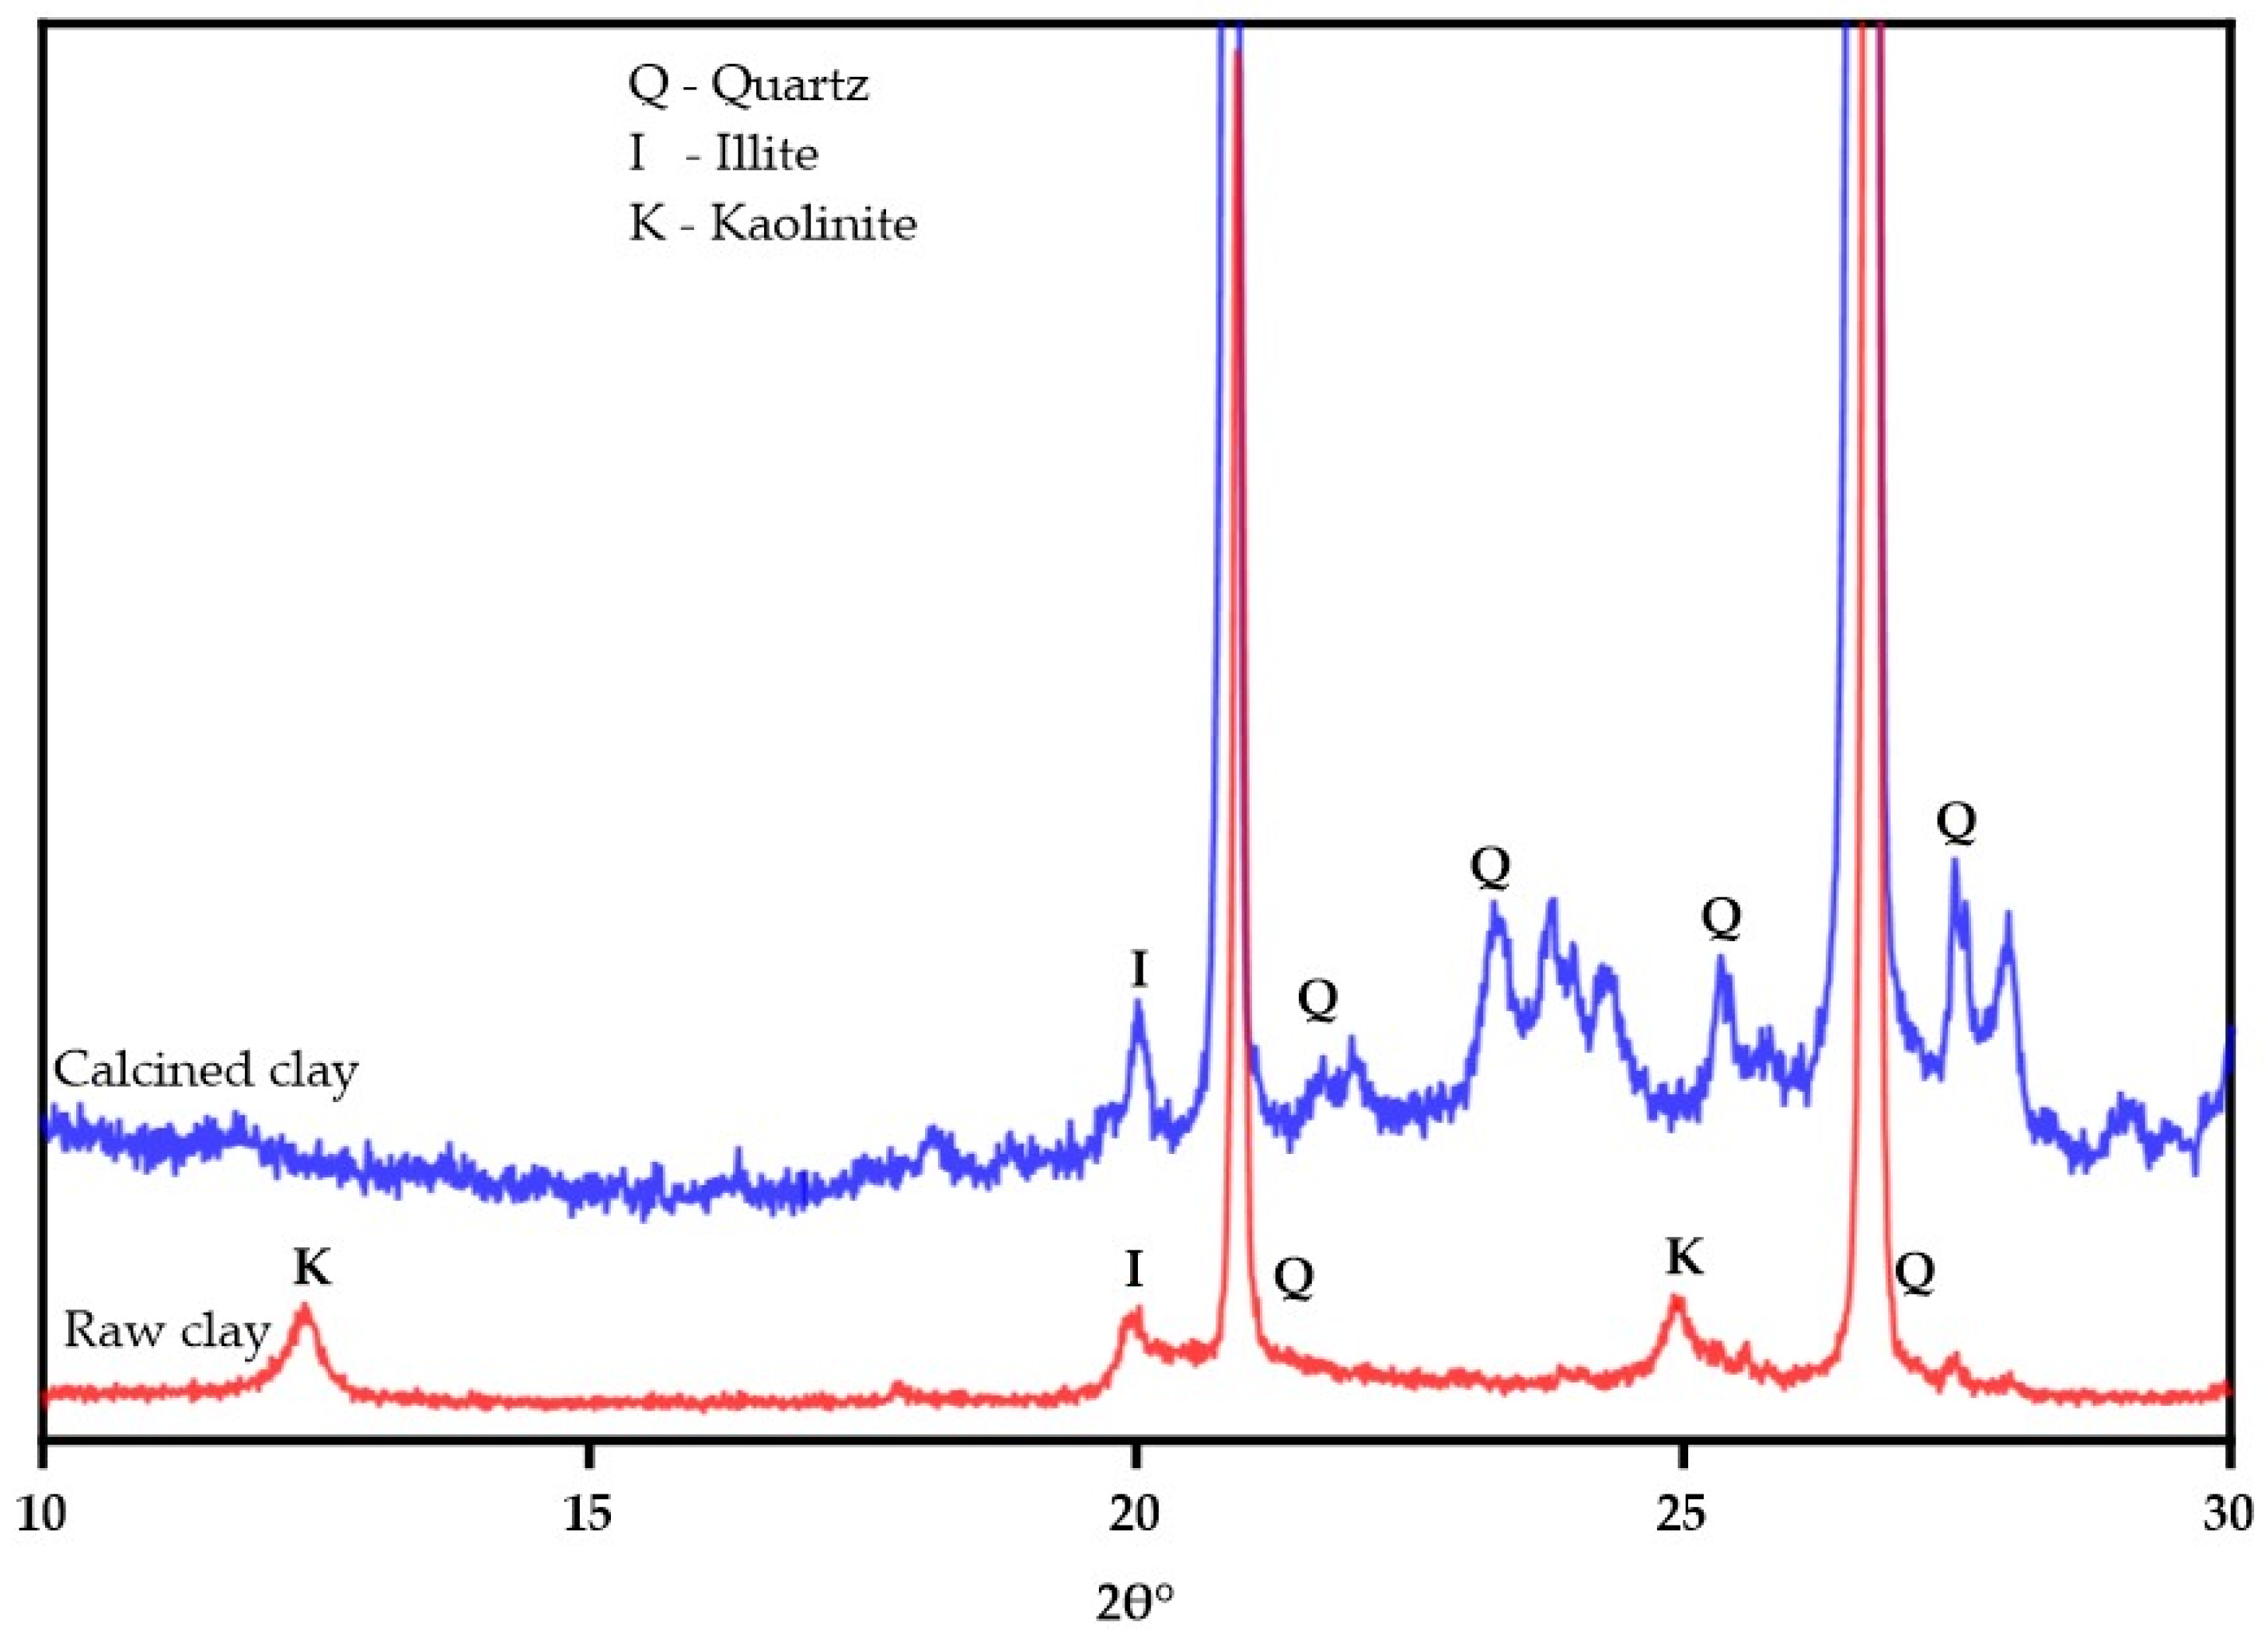
3.1. Characterization of Raw Materials

Figure 4 presents the weight loss (TGA) and differential weight loss (DTG) data of the raw clay with increasing temperature. Dehydroxylation is observed between 500 and 600 °C, which leads to structural transformation of kaolinite to metakaolinite. The XRD spectra of the raw and calcined clay samples are shown in Figure 5. The uncalcined clay reveals the presence of kaolinite, illite, and the dominant phase quartz. After calcining at 900 °C, the peak corresponding to kaolinite significantly diminished, almost disappearing, signifying the decomposition of kaolinite. Pozzolanic reactivity is known to be associated with the structural disorder resulting from dihydroxylation and kaolinite decomposition [19].
The results for soundness, normal consistency, and setting times are shown in Table 3. The water requirement and setting times of each LC3 mix varied according to the material composition. It was observed that normal consistency (water demand) for the control sample was at least 3% lower than the LC3 samples, depending on the calcined clay content. Normal consistency increased with increasing calcined clay content in the mix. The same trend was observed for the setting time which was within the allowable limits according to the BS 196-3 [14] standards. Calcined clay is known to require excess water to form a workable paste [20]. When cement paste maintains its volume within defined limits after solidifying, the cement is said to be “sound” [14]. When observed, SO3 and MgO are mainly responsible for the anomalous expansion of cement [21]. From Table 3, all the LC3 mixes can be considered sound since their expansions were within acceptable limits of 5 mm as prescribed by the EN BS 196-3 standard [14]. The reference cement provided lower soundness measurements than the LC3 mixes. This is consistent with results presented by previous researchers [11].

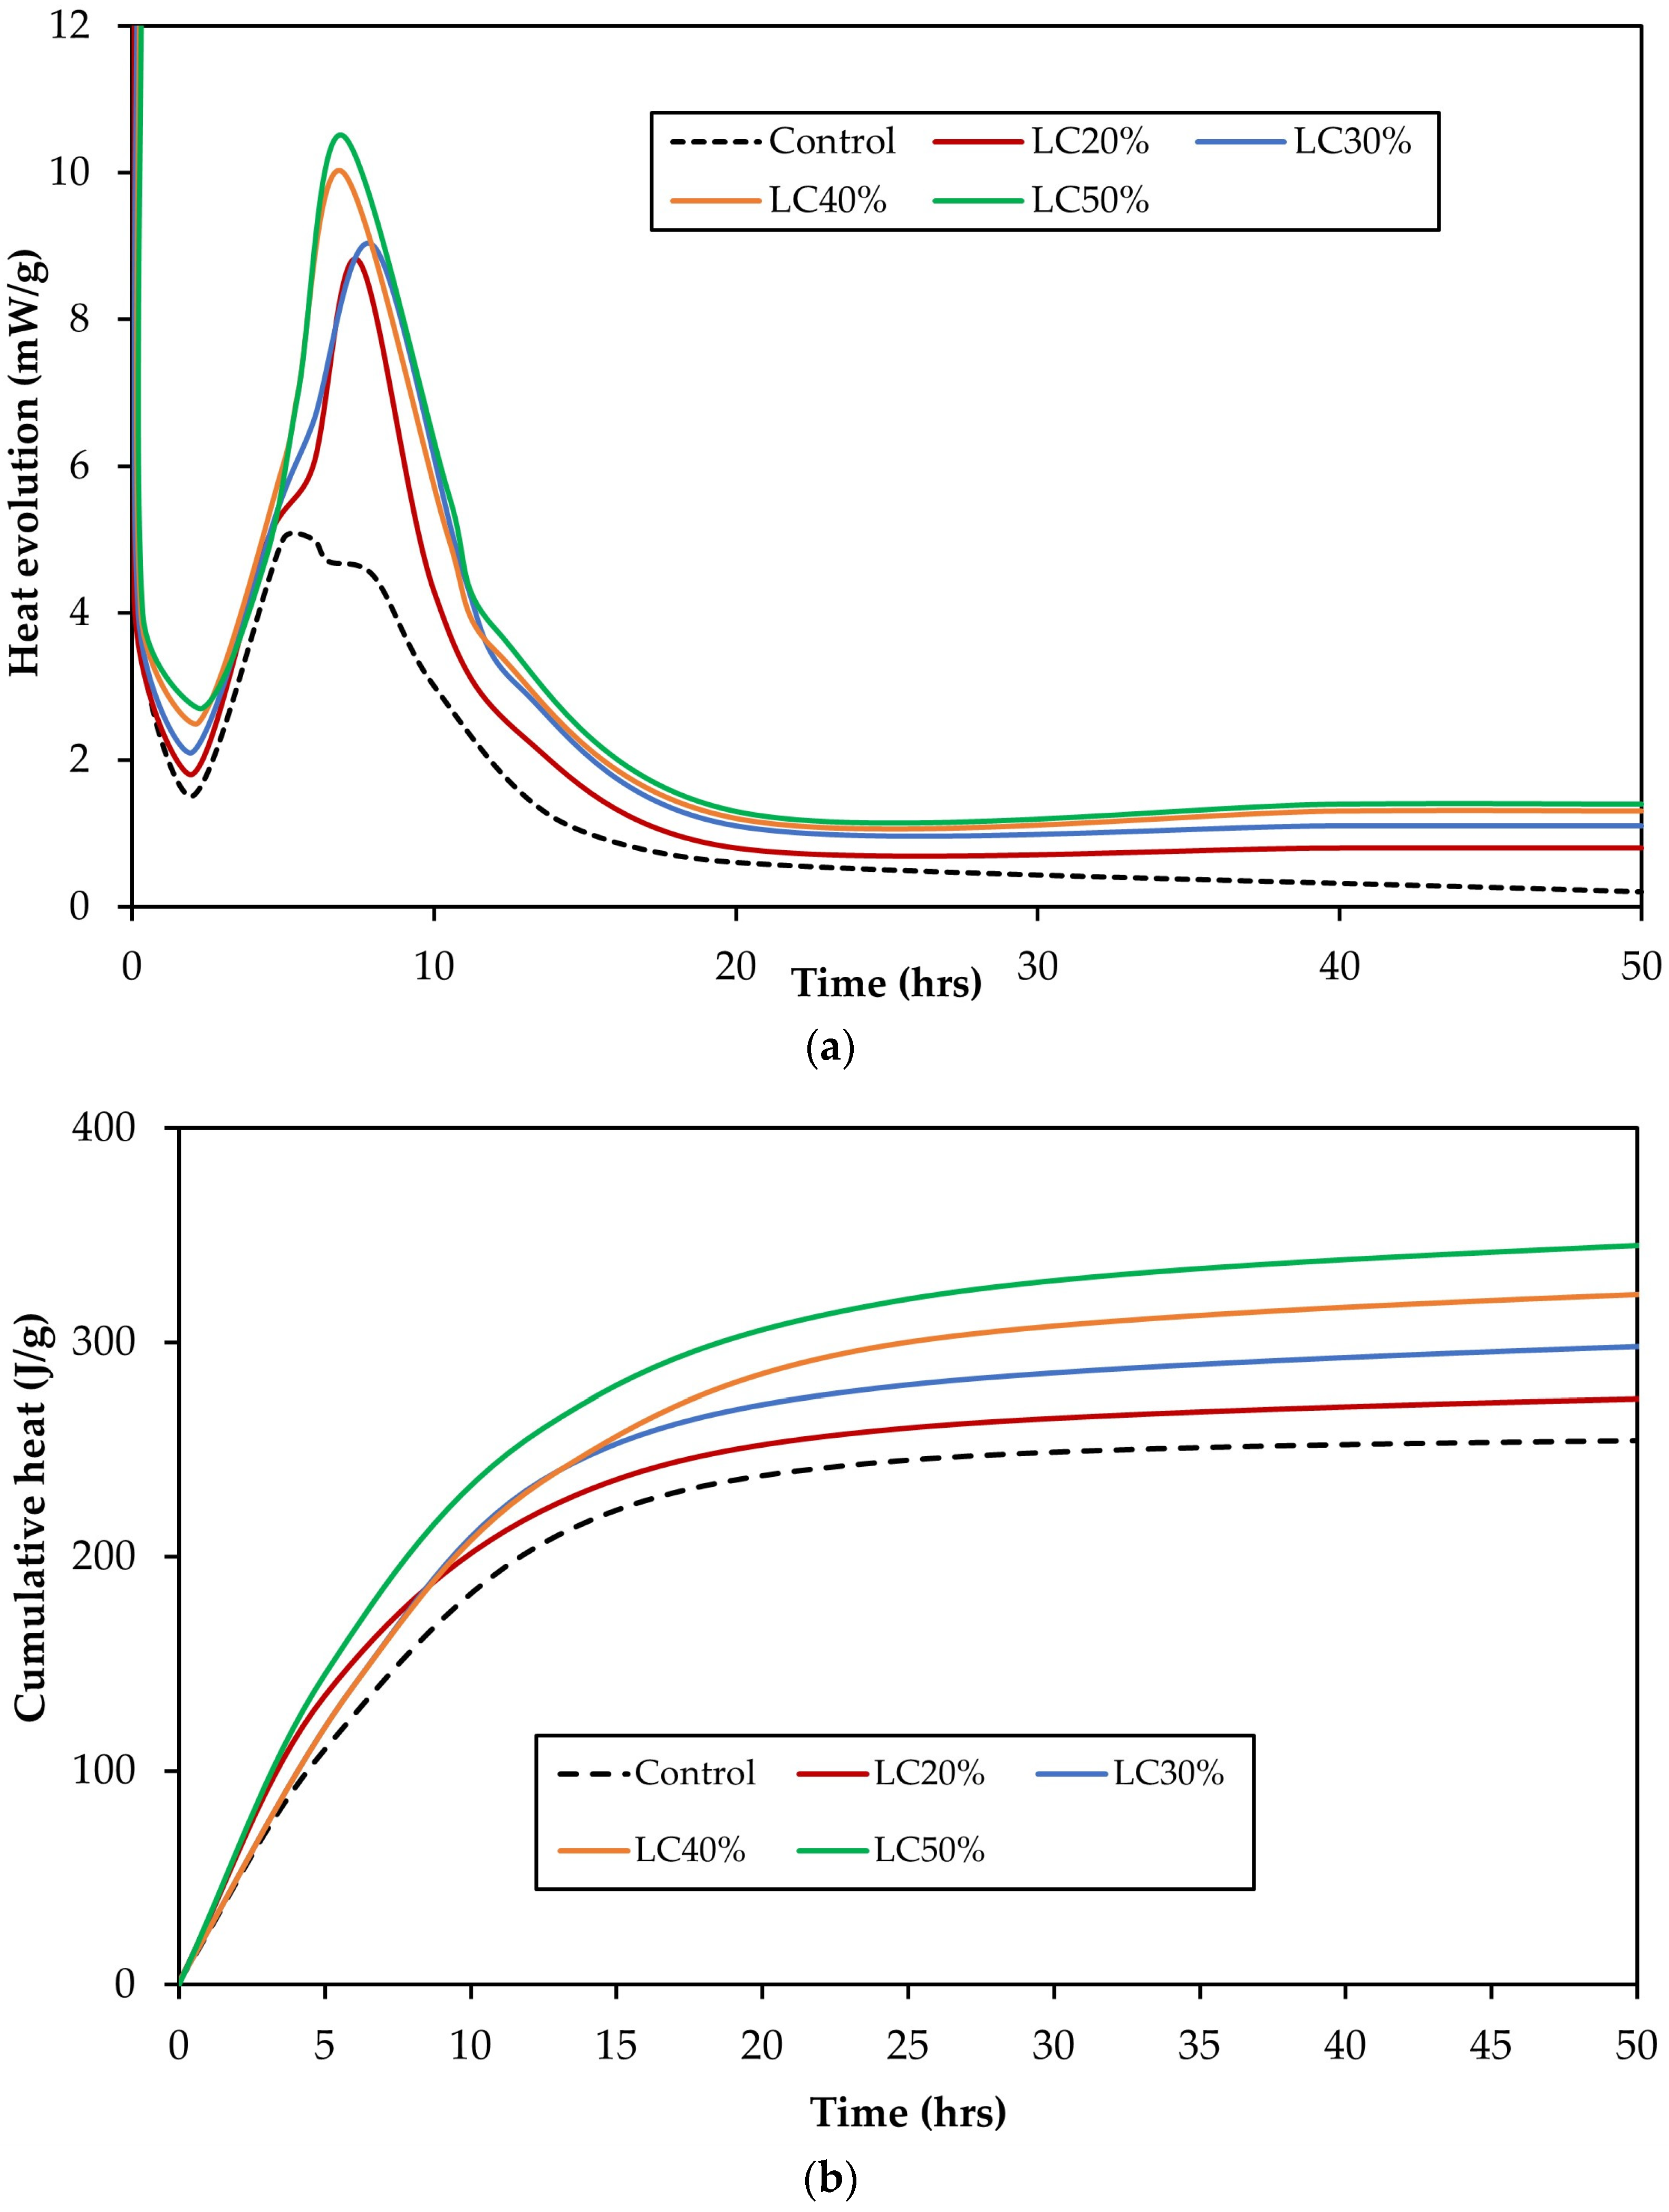
3.2. Heat of Hydration and Reaction Mechanics

The heat evolution and cumulative heat of the reference cement and LC3 mixes are shown in Figure 6a,b, respectively. Excessive initial heat is released because of the breakdown of ions during the initial hydration period to form calcium aluminate silicate hydrates (C-A-S-H) and ettringite [22]. There was, however, no significant reactivity during the dormant phase, which followed the initial hydration phase [9]. This was followed by the acceleration phase, where the reduction in ion concentration causes the dissolution of tricalcium silicate (C3S). This is indicated by the consistent rise in peak as shown on the heat evolution curve. The control sample curve revealed two peaks in the acceleration phase that correspond to the formation of ettringite and monosulphate due to the hydration of tricalcium silicates (C3S) and tricalcium aluminate (C3A) [23].
In the LC3 systems, the addition of calcined clay and limestone reduced the induction period and raised the slope of the acceleration period because of the filler effect. This leads to the creation of additional room for the cement particles to react and generate nucleation sites for the development of hydration products. Because of the large surface area of the limestone powder, as its content increased in the mix, the intensities of the peaks also increased due to the formation of more nucleation sites and hydration products [2]. The partial replacement of cement with SCM at a constant water-to-binder ratio leads to a dilution effect. Because cement grains are reduced due to replacement, more space is generated for the formation of clinker hydrates; therefore, the extent of the reaction of cement components is greater than the reference cement [2]. Pastes containing calcined clay and limestone showed well-defined aluminate peaks compared with the reference cement paste. The peaks showed more intensity with increasing calcined clay and limestone powder content. Five reasons have been assigned to this phenomenon: (i) the formation of ettringite and monosulphate due to the reaction between the cement and the calcined clay; (ii) the formation of calcium silicate hydrates from the reaction of calcined clay and portlandite from the cement; (iii) the formation of carboaluminates from the reaction of calcite from the limestone and calcium aluminate hydrates; (iv) filler effect caused by the pozzolans involved; and (v) the transformation of ettringite into monosulphate at the initial stages of hydration [9]. From Figure 6b, cumulative heat increased with increasing calcined clay and limestone content in the mixes. This is comparable to results obtained from previous studies [9].

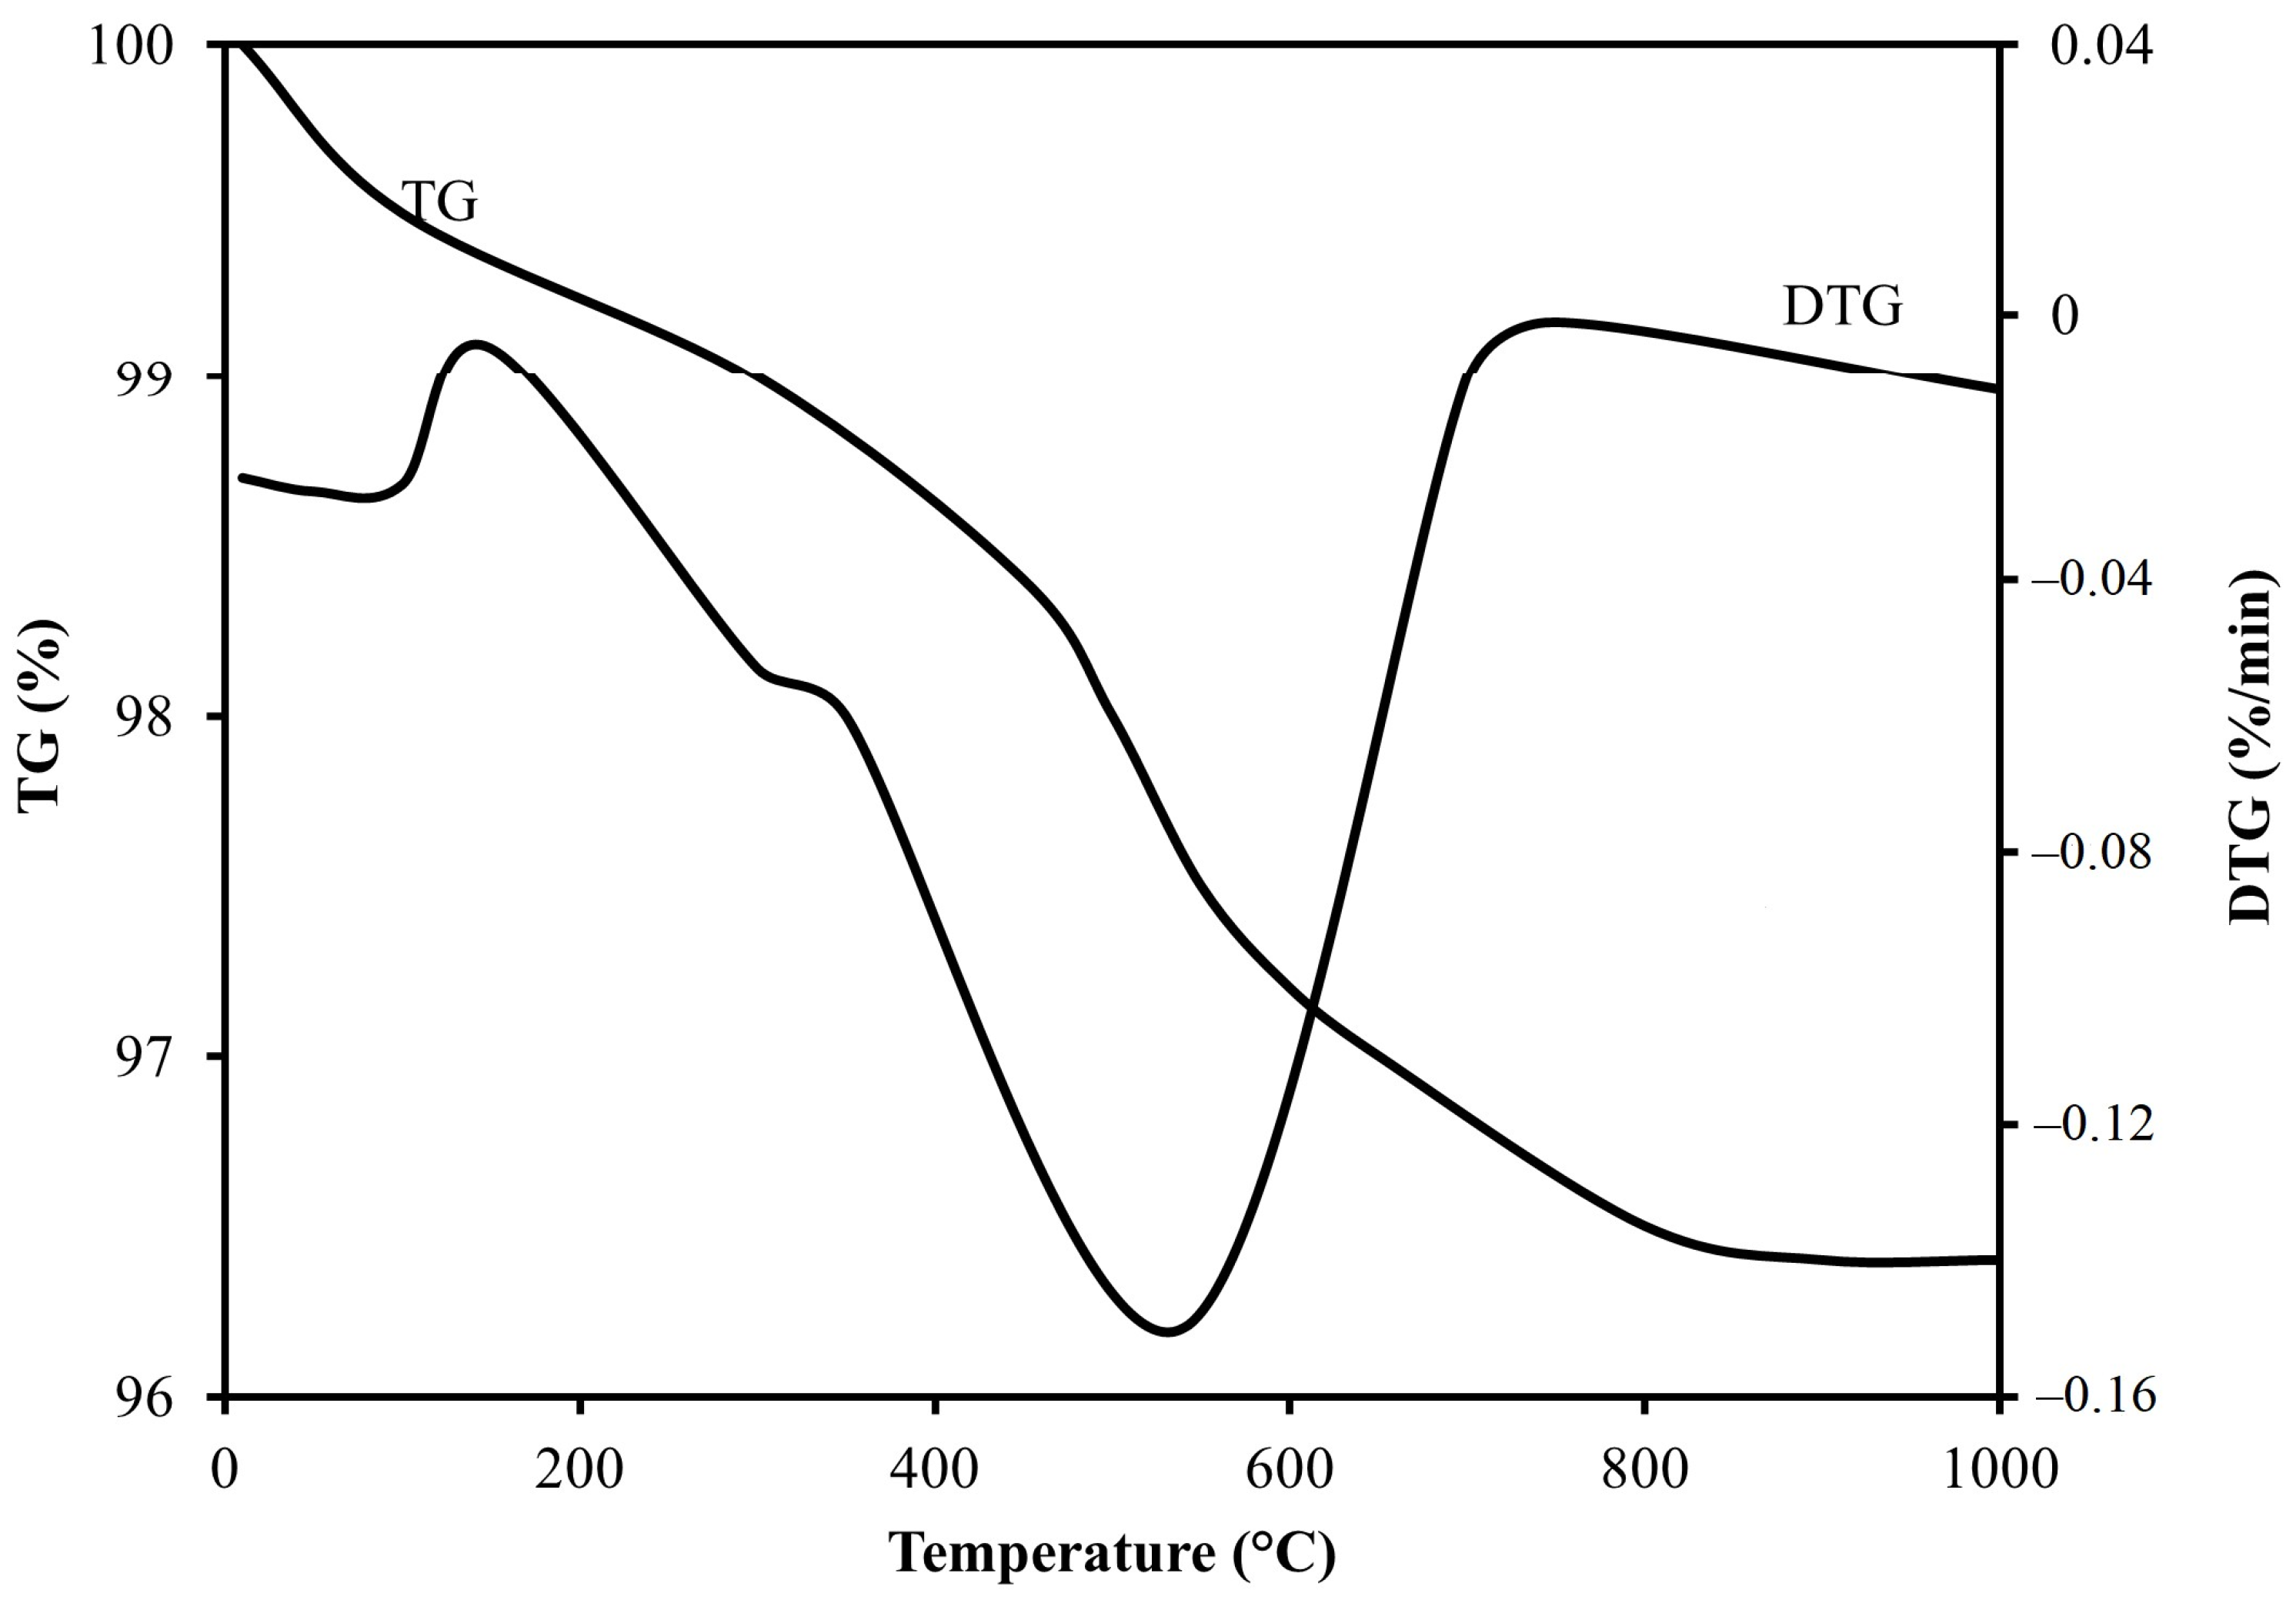
3.3. Thermogravimetric Analysis

Figure 7 presents the weight loss and differential weight loss of the reference cement paste and LC3 mixes after subjecting them to heat treatment up to 1000 °C. Considering the reference cement paste, an endothermic peak is seen around 90 °C, which is an indication of the loss of interlayer water, also known as dehydration. Decomposition of ettringite also occurs at this point [24]. An endotherm appears at 150 °C, which is potentially the breakdown of monosulphates and carboaluminates that typically decompose around similar temperatures [9]. More portlandite was formed as the hydration process went on, leading to a greater endothermic peak at about 350 °C [25].
Decomposition of calcite (CaCO3) was observed to occur at approximately 700 °C [3]. In the case of LC3 specimens, dehydration or loss of structural water was more intense at 90 °C, which led to the appearance of stronger peaks compared with the control sample. This is largely due to lower amounts of calcium silicate hydrates at this point, caused by the pozzolanic reaction [6]. The peaks representing the decomposition of monosulphates and carboaluminates in the LC3 specimens appear to be more intense than those of the control sample. There were lower amounts of portlandite consumed, which is evidenced by peak intensities relatively similar to the control sample. This is confirmed by the XRD data of the 28-day hydrated LC3 samples. In all the LC3 specimens, the addition of limestone resulted in more noticeable peak intensities of calcite. The more limestone powder in the mix, the greater the calcite peak intensity. This is, however, expected to decrease as curing age increases due to the pozzolanic reaction [2].
The breakdown of calcium silicate hydrates to form CaSiO3 [26] was seen at approximately 850 °C, evidenced by a shallow endothermic peak for all samples, irrespective of replacement level. Previous researchers [9] have reported on the appearance of an endothermic peak that occurs at approximately 200 °C. This peak has typically been assigned to the breakdown of limestone to form stratlingite in LC3 mixes [21]. Evidently, this peak is missing in Figure 7. This could be attributed to the use of low-grade calcined clay with insufficient reactivity as opposed to high-grade metakaolin in this study. This outcome is consistent with the results of other studies that have incorporated low-grade calcined clays in LC3 formulations [9].

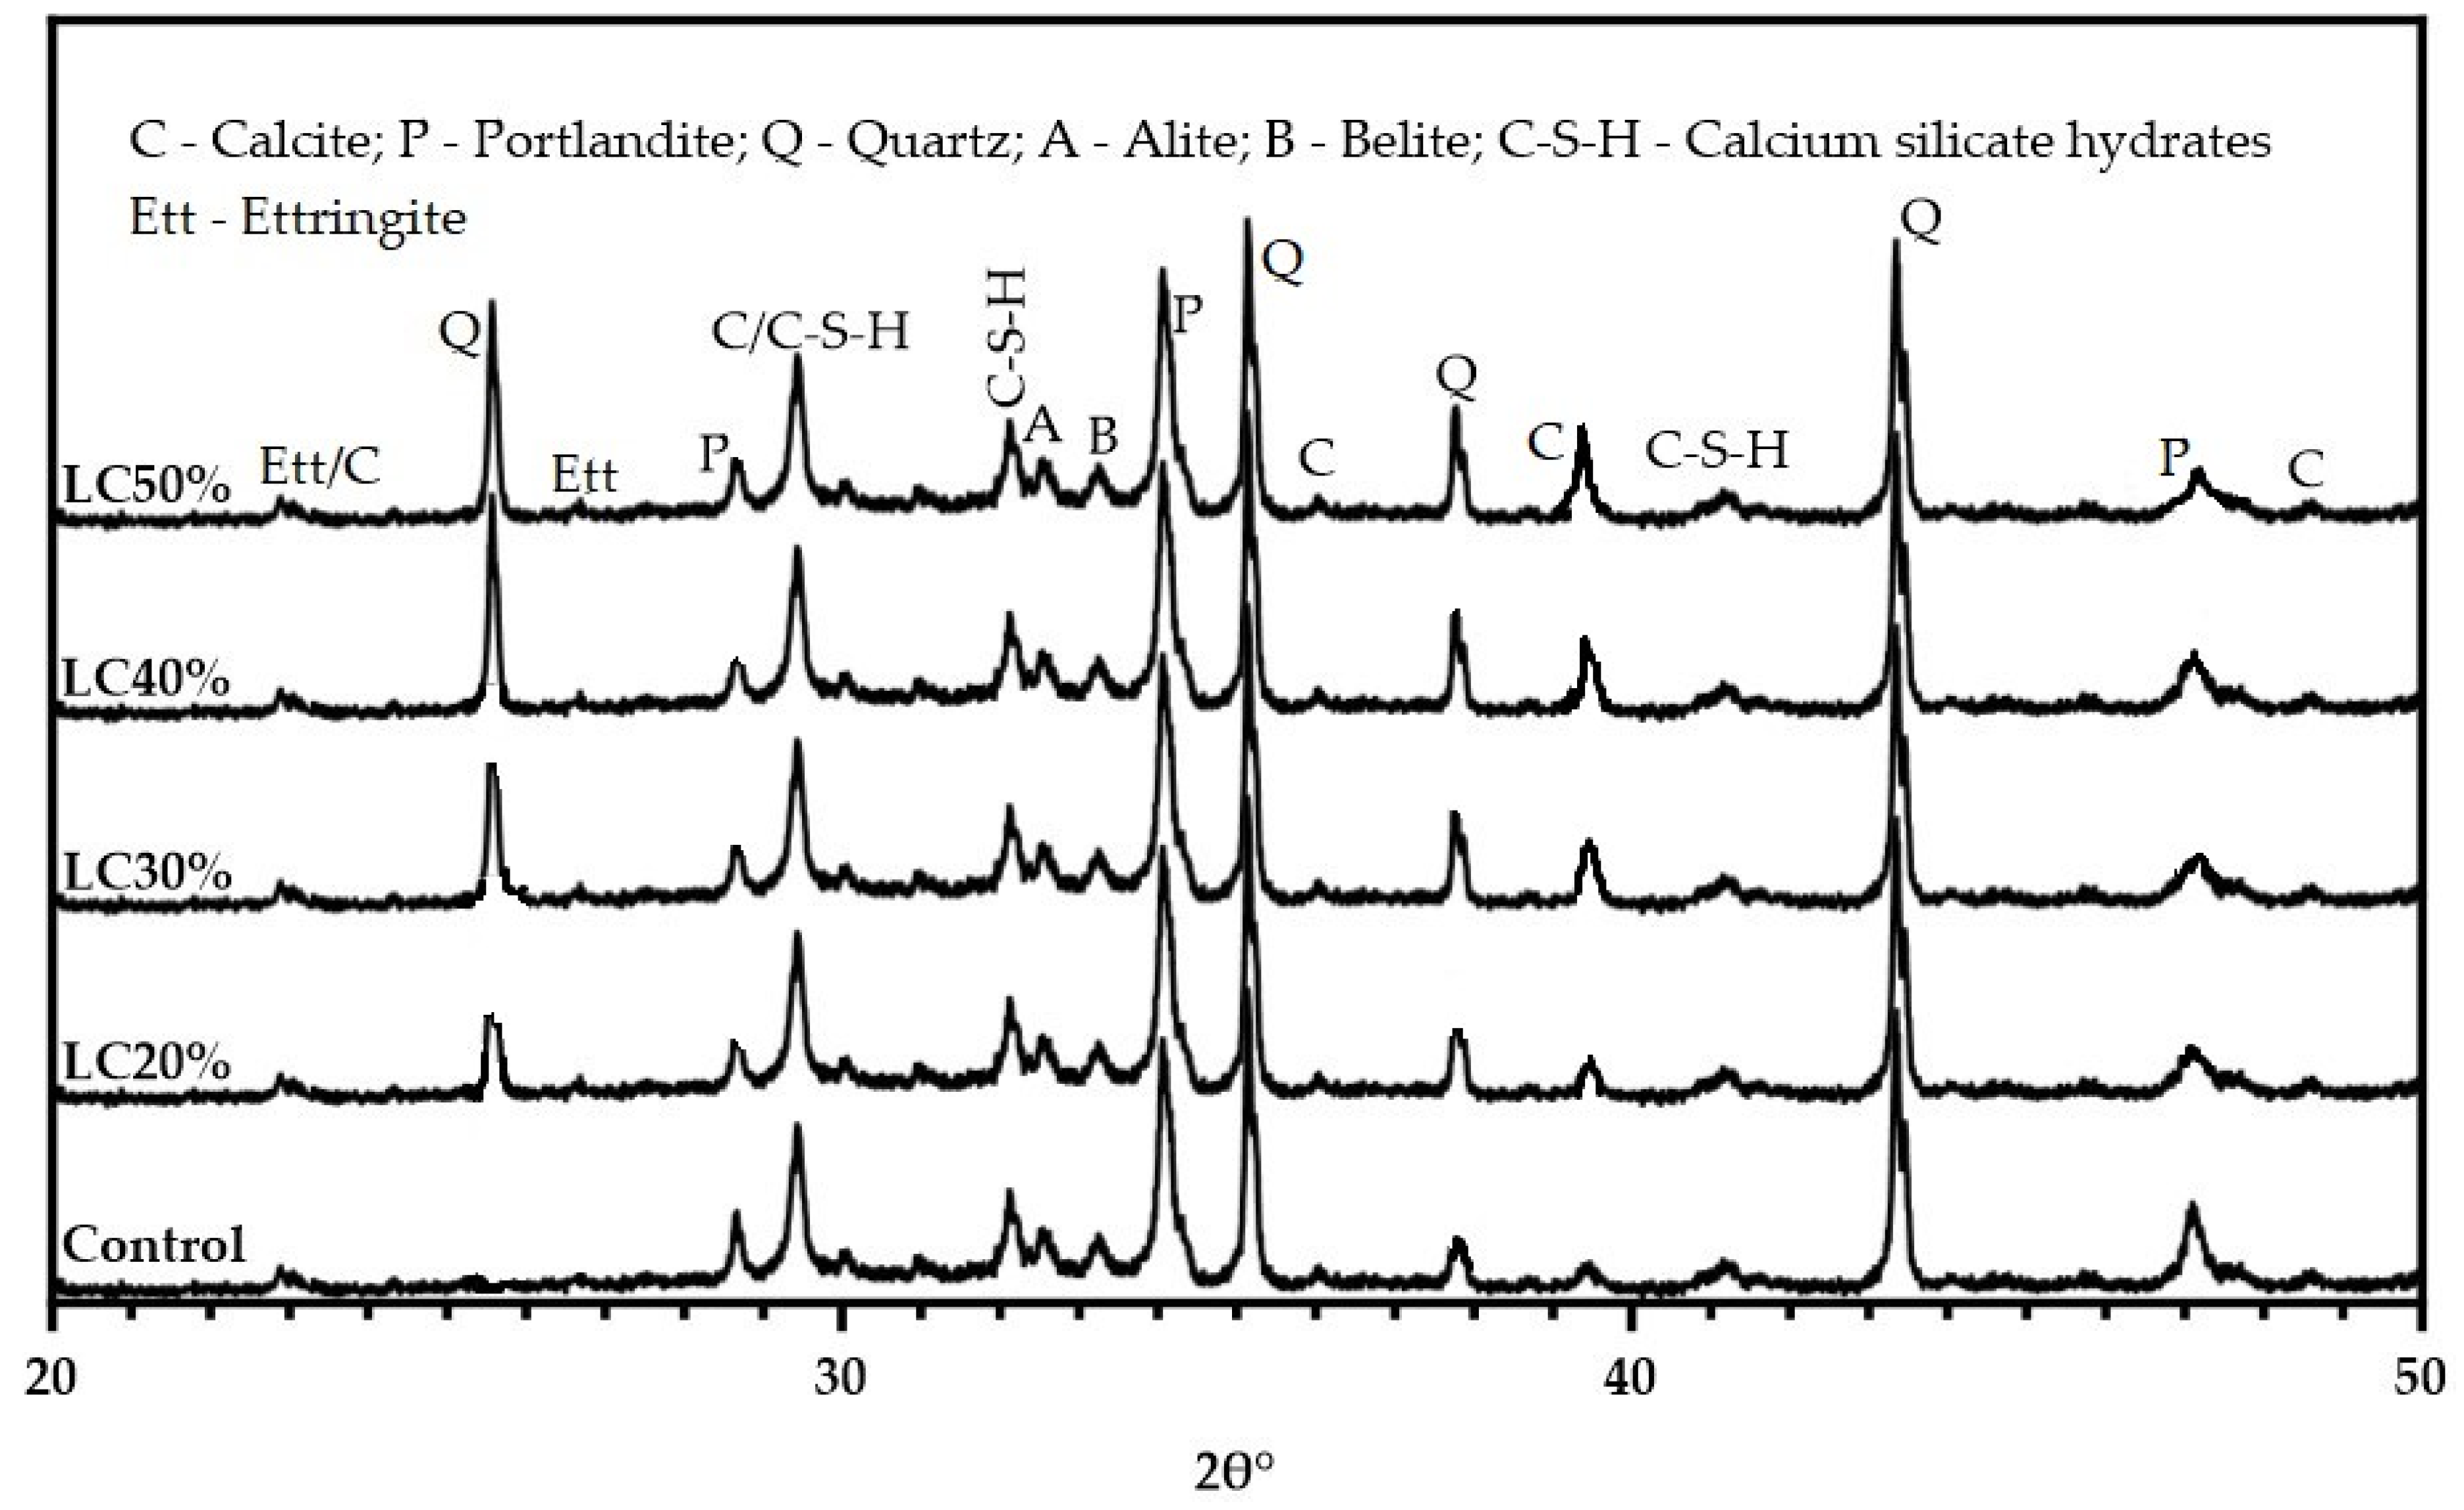
3.4. Hydration Kinetics via XRD

The XRD patterns for the control and blended LC3 samples are shown in Figure 8. The control paste, after 28 days of hydration, showed more distinct peaks denoting portlandite as a product of the hydration process. Portlandite peaks, though present in the LC3 pastes, had lower intensities compared with the control sample. This is due to the pozzolanic reaction between the calcined clay and excess Ca(OH)2 producing calcium silicate hydrates (C-S-H). The peaks denoting quartz and illite are still observed after 28 days in the LC3 pastes. This is because their crystal phases do not take part in the hydration process [19]. At 37.9 2θ° and 39.5 2θ°, the peaks denoting quartz (SiO2) and calcite (CaCO3) showed a continuous increase in intensity as their respective content increased in the mixes [19]. A similar trend for quartz was observed at 25.5 2θ°. The strong presence of limestone peaks is an indication that limestone was still not unreactive, even at 28 days. Overlapping peaks of calcite and calcium silicate hydrates were observed at 29.8 2θ°. Alite (3CaO·SiO2) and belite (2CaO·SiO2), responsible for early and late strength development, respectively, were found in both the control and blended cement pastes. Earlier studies involving limestone and other aluminate-rich pozzolans, such as fly ash, have shown a reaction between limestone and the aluminate phases; this reaction produces calcium carboaluminate hydrates that cause the stabilization of ettringite and potentially leads to the reduced porosity and improved mechanical properties [11]. Similar trends in peak intensities and patterns have been reported in previous studies [9].

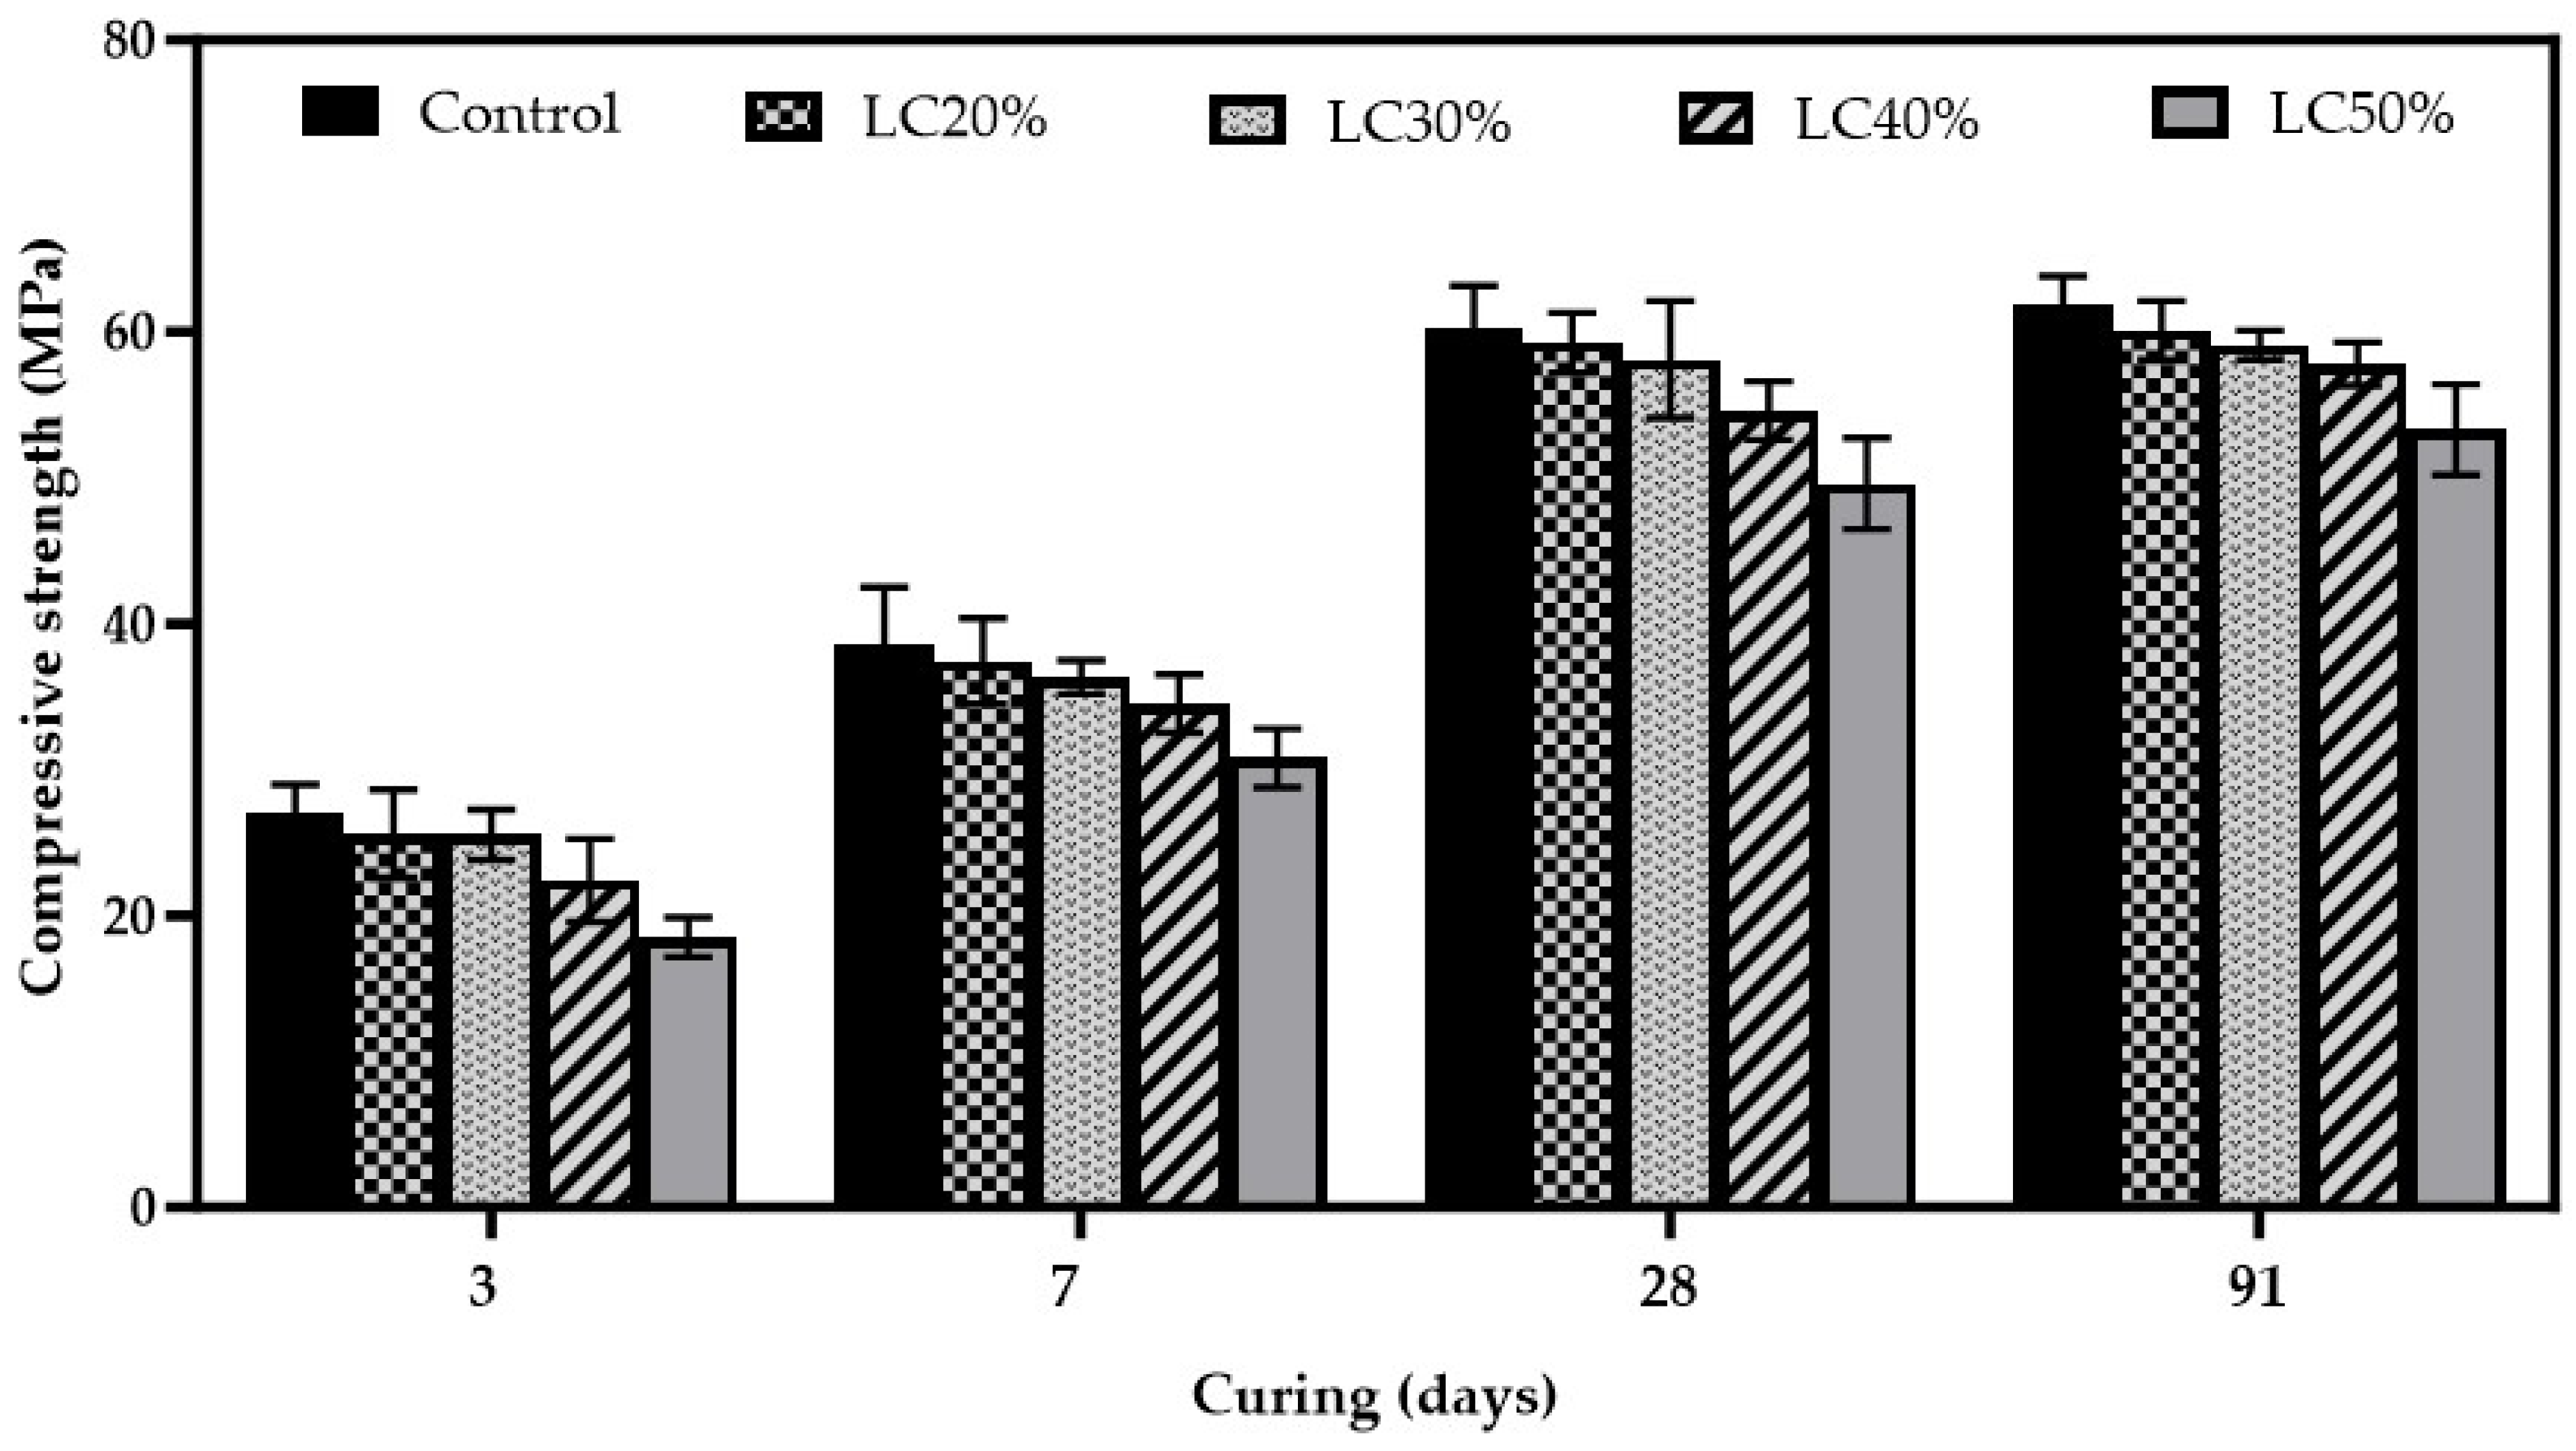
3.5. Compressive Strength

Figure 9 presents the compressive strength development of the control and LC3 specimens after curing for 3, 7, 28, and 91 days. Generally, compressive strength at all ages was found to be lower than the reference mortar. At 3 and 7 days, the control sample obtained compressive strength of 27 MPa and 39 MPa, respectively. The addition of the calcined clay and limestone powder could not compensate for the loss in clinker due to material replacement. This is partly due to the slow reaction between the pozzolan constituents and cement at early ages [26], which sometimes renders the pozzolans inert. LC20%, LC30%, LC40%, and LC50% recorded compressive strengths of 25.6, 25.6, 22.3, and 18.0 MPa, respectively, at 3 days and 37.4, 37, 34.5, and 30.8 MPa, respectively, at 7 days. There was significant improvement in strength as the curing age increased to 28 and 91 days but was not enough to match the results of the reference mortar. LC3 specimens (LC20%, LC30%, LC40%, and LC50%) trailed the control sample by 1.2%, 4%, 9.8%, and 18%, respectively, at 28 days and 1.6%, 2.3%, 3.6%, and 5.5%, respectively, at 91 days. Even though strength values were found to be lower than the control, there appeared to be a significant improvement at 91 days. This low-strength development is due to the dilution effect caused by the decrease in clinker content in the mix [5]. This affects the formation of tricalcium silicates (C3S), which are responsible for strength development in cementitious matrices. Again, the low-grade calcined clay affects the pozzolanic reaction between portlandite and SiO2 from the calcined clay. Similar results were reported by Hay and Celik [9].

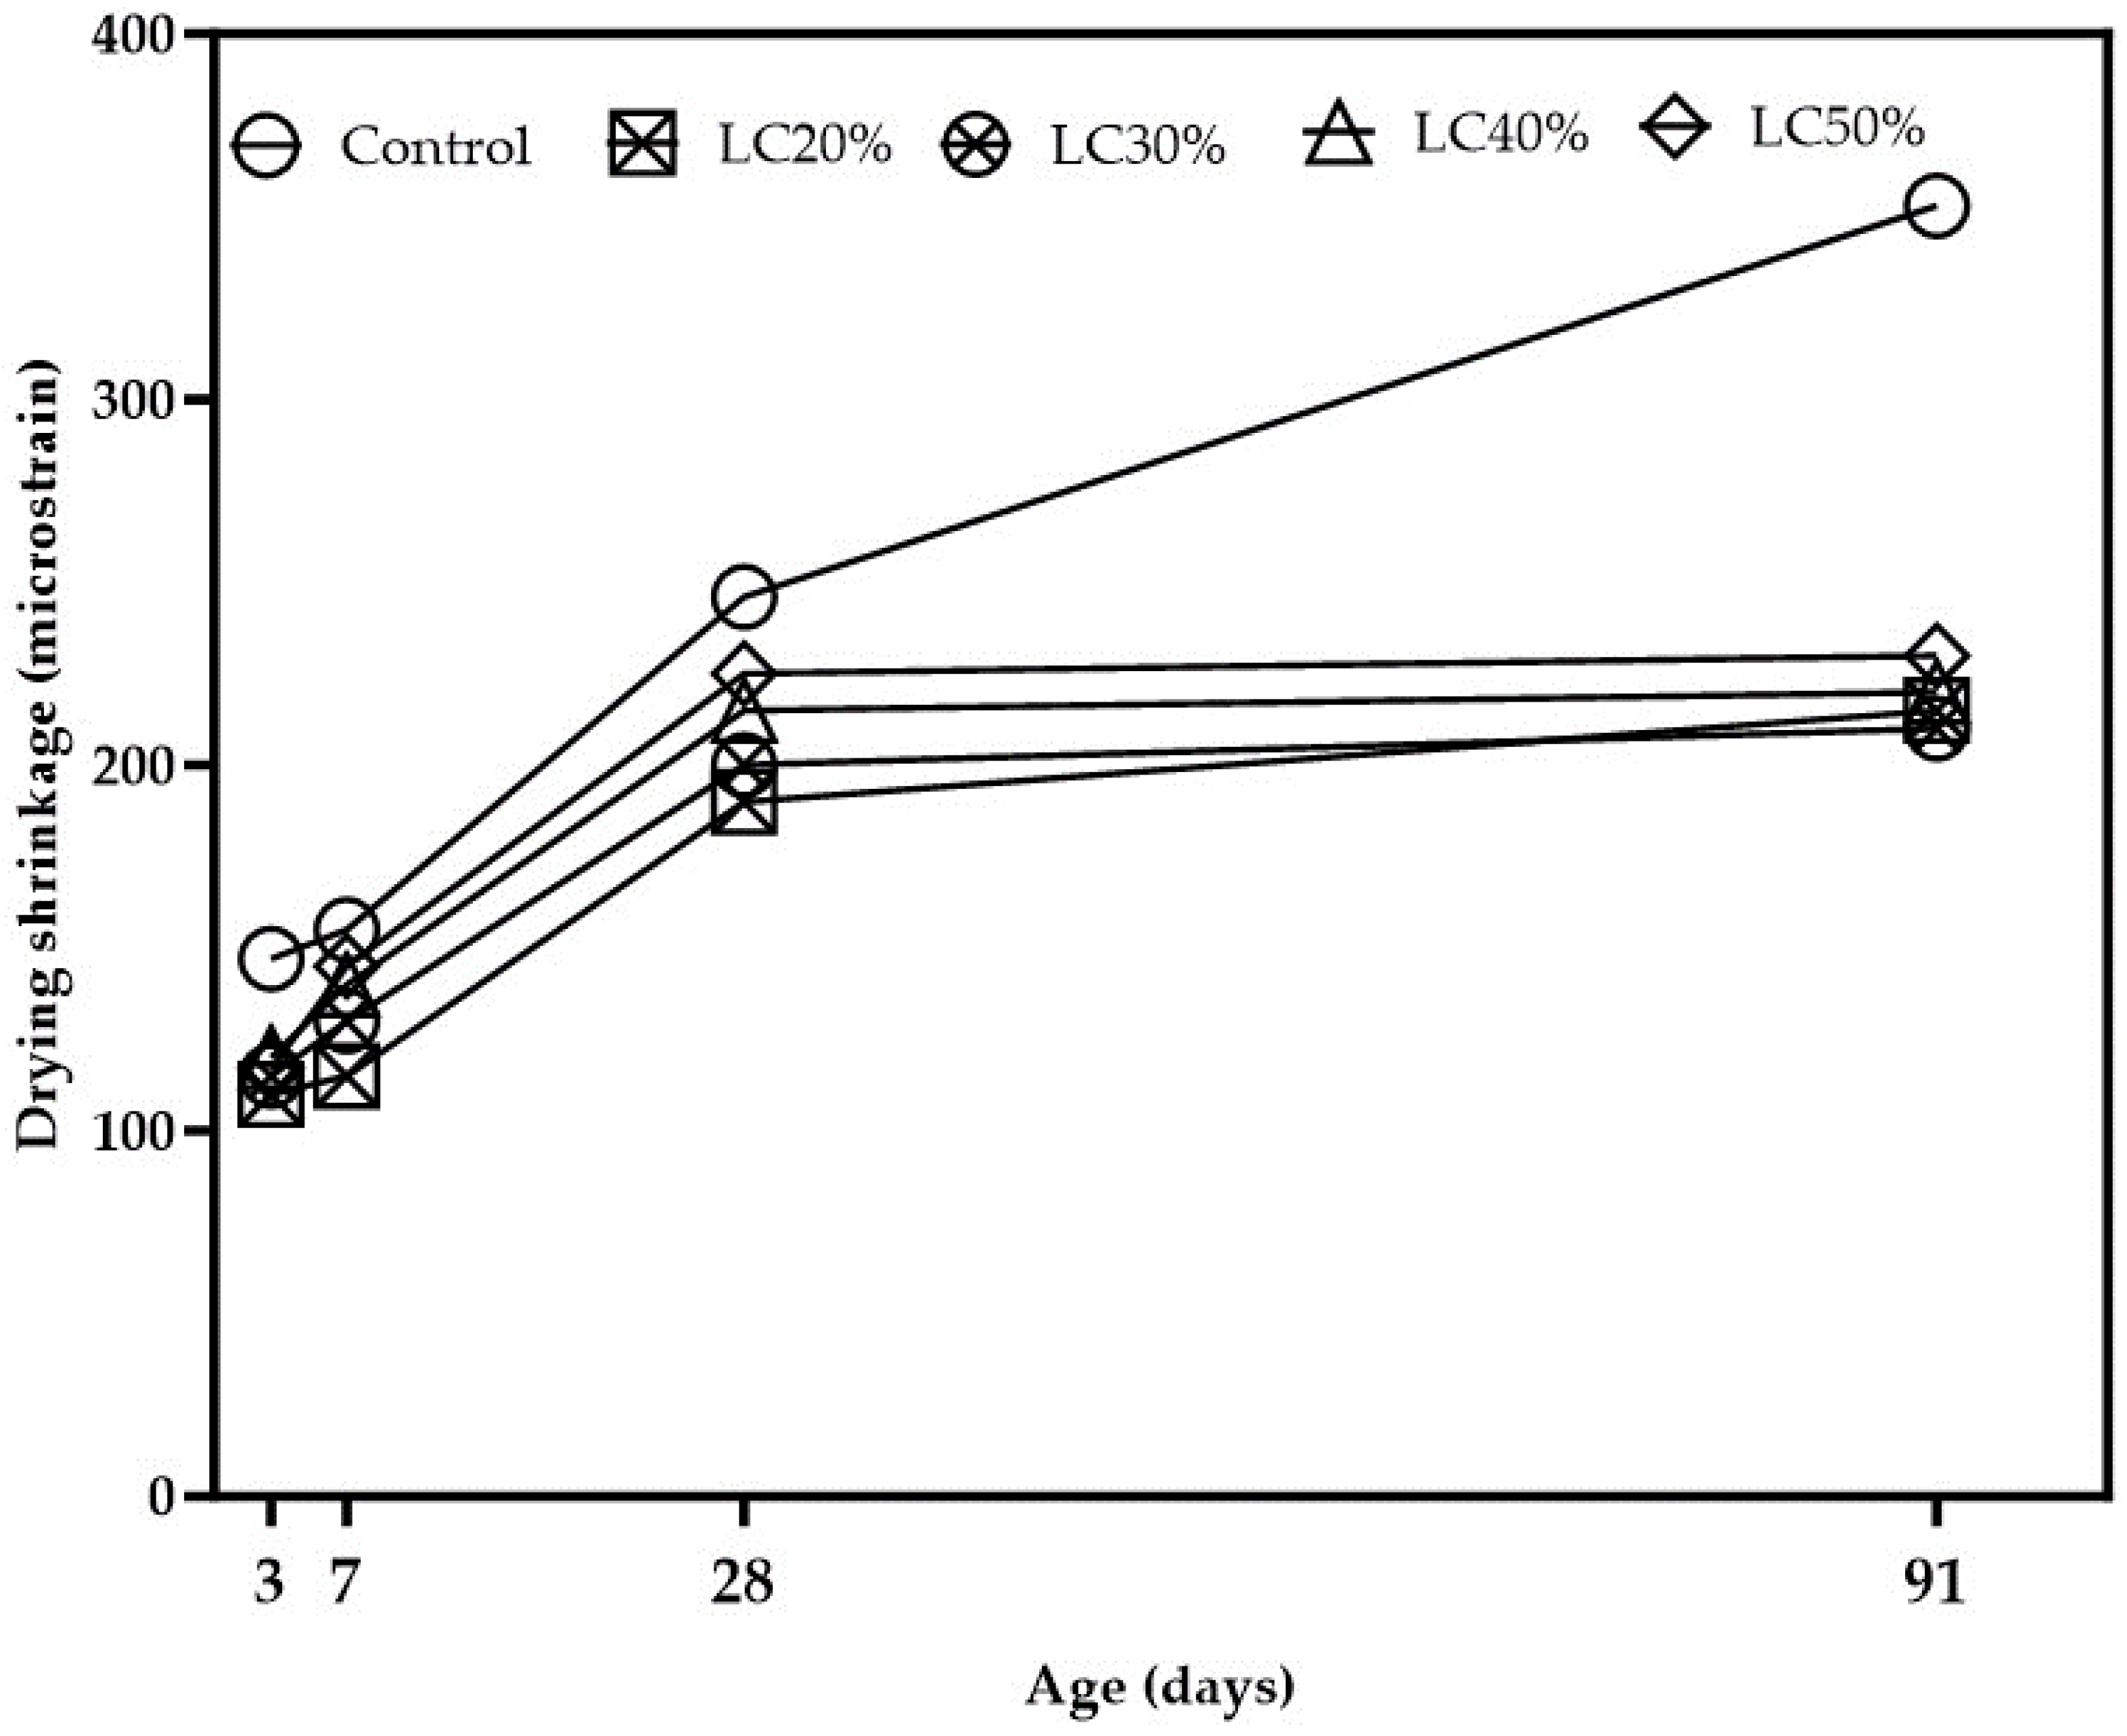
3.6. Drying Shrinkage

Drying shrinkage of concrete occurs as a result of the loss of water through capillary action leading to a reduction in length. Removal of water during the drying process causes the release of internal stresses, which becomes more significant in cementitious systems containing extremely fine components [19]. Figure 10 shows the drying shrinkage of LC3 mixes containing varying calcined clay and limestone content. Readings were taken up to 91 days. Drying shrinkage in the reference cement mortar samples at all curing ages was observed to be higher than in the LC3 specimens. At 3, 7, 28, and 91 days, the control samples recorded drying shrinkage values of 147, 155, 246, and 353 micro-strains, respectively. By 91 days, drying shrinkage in the control sample had increased by 58.4%. This is attributed to the quick setting and drying in ordinary Portland cement compared with blended cement containing calcined clay which has a slower setting and hardening process [11]. The LC3 mixes, irrespective of their composition, did not show significant disparities in drying shrinkage after 91 days. Drying shrinkage values recorded for all the LC3 samples were found within the range of 215 and 230 micro-strains. It is worth mentioning that drying shrinkage in the LC3 samples was about 34.5% lower than that of the reference cement paste. Du and Pang [19] obtained similar results and attributed them to the interactions between the calcined clay and limestone, which inhibits the loss of water from the pores of concrete caused by a refined pore structure. Additionally, metakaolin, when incorporated into concrete, has been reported to reduce drying shrinkage because of its refined pore structure [19]. In a similar study, Dhandapani et al. (2018) reported an increase in drying shrinkage in LC3 mixes than other binders, contrary to the findings of this study. The disparity in drying shrinkage could be due to the difference in mineralogy of the clays used for the LC3 preparation. Dhandapani et al. (2018) attributed the high drying shrinkage to a higher water-to-binder ratio selected for the LC3 concrete mixes [27].

3.7. Chloride Penetration Resistance and Water Absorption

The rapid chloride penetration test (RCPT) is an indirect method used to determine the chloride resistance of concrete to the ingress of chloride ions. Typically, total charges between 1500–3000 Coulombs are regarded as moderate, whereas charges below 1500 Coulombs are considered low [27]. Generally, a lower charge passed is an indication of a better resistance to chloride penetration [27]. RCPT is still often used for assessing the chloride resistance abilities of concrete, despite being subject to several critiques. From Figure 11, LC3 specimens showed lower amounts of total charge passed at 28 days compared with the reference mortar, demonstrating significant chloride penetration resistance. This is due to the comparatively fine pore structure of the LC3, especially at the early stages of hydration [27]. Another reason for the high chloride penetration resistance in the LC3 specimens is the presence of reactive aluminates in the calcined clay, which results in more chloride binding compared with the reference mortar due to the difference in hydration products [27].
Water absorption, as an indicator of connected porosity, was also used to indirectly analyse the pore network of the LC3 specimens via capillary action. Figure 12 presents the water absorption of the mortar specimens after 28 days of curing. The incorporation of calcined clay and limestone, with an added advantage of filler effect, in the LC3 mortar specimens resulted in a reduced number of pores and, consequently, minimal absorption. This demonstrates how the LC3 binder system enhances resistance to capillary absorption. This is consistent with results reported by Dhanpadani et al. [27], which confirmed the superiority of LC3 concrete in resisting capillary water absorption ahead of OPC. A comparable performance was observed in concrete containing 30% fly ash.

4. Conclusions

This work studied the potential use of low-grade calcined clay and limestone powder to partially substitute Portland cement by 20, 30, 40 and 50 wt.% in the production of LC3 mortar. The kaolinitic content of the clay was lower than that typically used and advocated for LC3. The weight ratio of calcined clay and limestone was maintained at 2:1 for all mixes. The influence of calcined clay and limestone on hydration kinetics, mechanical properties, and some durability properties were evaluated. Based on the experimental results, the following conclusions were drawn:
  • In the LC3 systems, the addition of calcined clay and limestone reduced the induction period and raised the slope of the acceleration period due to the filler effect. This led to the creation of additional room for the cement particles to react and generate nucleation sites for the development of hydration products (C-S-H). The rate of reaction and cumulative heat increased with increasing calcined clay and limestone content in the LC3 mixes.
  • X-ray diffraction (XRD) and thermogravimetric analysis (TGA) confirmed the decomposition of monosulphates and carboaluminates in the LC3 specimens. Contrary to what was expected, lower amounts of portlandite were consumed, which could potentially affect the formation of C-(A)-S-H. The more limestone powder in the mix, the greater the calcite peak intensity.
  • LC3 mortar specimens obtained relatively lower compressive strength at 3 and 7 days compared with the reference cement. There was a slight improvement in strength as the curing age increased to 28 and 91 days but it was not enough to match the results of the reference mortar.
  • LC3 mortar specimens (LC20%, LC30%, LC40%, and LC50%) trailed the control sample by 1.2%, 4%, 9.8%, and 18%, respectively, at 28 days and 1.6%, 2.3%, 3.6%, and 5.5%, respectively, at 91 days. Even though strength values were found to be lower than the control, there appeared to be a significant improvement at 91 days.
  • The optimum replacement of OPC clinker, calcined clay and limestone, was 20% (LC20%).
  • Drying shrinkage values recorded for all the LC3 samples were found within the range of 215 and 230 micro-strains. Drying shrinkage in the LC3 samples was about 34.5% lower than that of the reference cement mortar. LC3 specimens showed lower amounts of total charge passed at 28 days compared with the reference mortar, demonstrating significant chloride penetration resistance.
  • The incorporation of calcined clay and limestone, with an added advantage of filler effect in the LC3 mortar specimens resulted in a reduced number of pores and, consequently, minimal absorption. This demonstrates how the LC3 binder system enhances resistance to capillary absorption.
Although this paper reflects the properties of clay from a single source, these findings offer important new information about the applicability of low-grade clay LC3 systems and contribute to the development of sustainable binders for construction applications. It is recommended that SEM/EDS should be used to study the hydration products of the LC3 mortar. Further investigations should also be conducted into the carbonation resistance and long-term durability performance of LC3 systems. The limitation of this study is the use of one type of clay sample.

Author Contributions

Conceptualization, M.K. and M.T.; Methodology, E.G.; Validation, M.S., E.G. and A.D.; Investigation, M.S. and A.D.; Data curation, M.K.; Writing—original draft, K.B.; Visualization, M.T.; Supervision, M.K. and M.S. All authors have read and agreed to the published version of the manuscript.

Funding

This research received no external funding.

Data Availability Statement

The data presented in this study are available on request from the corresponding author. The data are not publicly available due to ongoing research.

Conflicts of Interest

Author Eshmaiel Ganjian was employed by the company Concrete Corrosion Tech Ltd. Author Andrew Dunster was employed by the company Building Research Establishment (BRE). The remaining authors declare that the research was conducted in the absence of any commercial or financial relationships that could be construed as a potential conflict of interest.

References

  1. Juenger, M.C.G.; Snellings, R.; Bernal, S.A. Supplementary cementitious materials: New sources, characterization, and performance insights. Cem. Concr. Res. 2019, 122, 257–273. [Google Scholar] [CrossRef]
  2. Lothenbach, B.; Scrivener, K.; Hooton, R.D. Supplementary Cementitious Materials. Cem. Concr. Res. 2011, 41, 1244–1256. [Google Scholar] [CrossRef]
  3. Scrivener, K.; Martirena, F.; Bishnoi, S.; Maity, S. Calcined clay limestone cements (LC3). Cem. Concr. Res. 2018, 114, 49–56. [Google Scholar] [CrossRef]
  4. Sharma, M.; Bishnoi, S.; Martirena, F.; Scrivener, K. Limestone calcined clay cement and concrete: A state-of-the-art review. Cem. Concr. Res. 2021, 149, 106564. [Google Scholar] [CrossRef]
  5. Zunino, F.; Scrivener, K. The reaction between metakaolin and limestone and its effect in porosity refinement and mechanical properties. Cem. Concr. Res. 2021, 140, 106307. [Google Scholar] [CrossRef]
  6. Scrivener, K.; Avet, F.; Maraghechi, H.; Zunino, F.; Ston, J.; Hanpongpun, W.; Favier, A. Impacting factors and properties of limestone calcined clay cements (LC3). Green Mater. 2018, 7, 3–14. [Google Scholar] [CrossRef]
  7. Sui, S.; Wilson, W.; Georget, F.; Maraghechi, H.; Kazemi-Kamyab, H.; Sun, W.; Scrivener, K. Quantification methods for chloride binding in Portland cement and limestone systems. Cem. Concr. Res. 2019, 125, 105864. [Google Scholar] [CrossRef]
  8. Cardinaud, G.; Rozière, E.; Martinage, O.; Loukili, A.; Barnes-Davin, L.; Paris, M.; Deneele, D. Calcined clay—Limestone cements: Hydration processes with high and low-grade kaolinite clays. Constr. Build. Mater. 2021, 277, 122271. [Google Scholar] [CrossRef]
  9. Hay, R.; Celik, K. Performance enhancement and characterization of limestone calcined clay cement (LC3) produced with low-reactivity kaolinitic clay. Constr. Build. Mater. 2023, 392, 131831. [Google Scholar] [CrossRef]
  10. Blouch, N.; Rashid, K.; Ju, M. Exploring low-grade clay minerals diving into limestone calcined clay cement (LC3): Characterization—Hydration—Performance. J. Clean. Prod. 2023, 426, 139065. [Google Scholar] [CrossRef]
  11. Boakye, K.; Khorami, M.; Saidani, M.; Ganjian, E.; Dunster, A.; Ehsani, A.; Tyrer, M. Mechanochemical characterisation of calcined impure kaolinitic clay as a composite binder in cementitious mortars. J. Compos. Sci. 2022, 6, 134. [Google Scholar] [CrossRef]
  12. ASTM C. 778; Standard Specification for Standard Sand. Annual Book of ASTM Standards. ASTM International: West Conshohocken, PA, USA, 2006; p. 4.
  13. ASTM C. 191; Standard Test Methods for Time of Setting of Hydraulic Cement by Vicat Needle. ASTM International: West Conshohocken, PA, USA, 2013.
  14. Standard B. BS EN 196-3; 1995-Methods of Testing Cement-Part 3: Determination of Setting Time and Soundness. BSI: London, UK, 1999.
  15. ASTM C. 305; Standard Practice for Mechanical Mixing of Hydraulic Cement Pastes and Mortars of Plastic Consistency. Annual Book of ASTM Standards. ASTM International: West Conshohocken, PA, USA, 1995; pp. 188–190.
  16. ASTM C. 157/C 157M-08; Standard Test Method for Length Change of Hardened Hydraulic-Cement Mortar and Concrete. ASTM International: West Conshohocken, PA, USA, 2014.
  17. ASTM C. 1202; Standard Test Method for Electrical Indication of Concrete’s Ability to Resist Chloride Ion Penetration. ASTM International: West Conshohocken, PA, USA, 2019.
  18. ASTM C. 642; Standard Test Method for Density, Absorption, and Voids in Hardened Concrete, Annual Book of ASTM Standards. ASTM International: West Conshohocken, PA, USA, 2006; p. 4.
  19. Du, H.; Pang, S.D. High-performance concrete incorporating calcined kaolin clay and limestone as cement substitute. Constr. Build. Mater. 2020, 264, 120152. [Google Scholar] [CrossRef]
  20. Tagbor, T.A.; Boakye, K.A.; Sarfo-Ansah, J.; Atiemo, E. A study of the pozzolanic properties of Anfoega Kaolin. Int. J. Eng. Res. Appl. 2015, 5, 28–33. [Google Scholar]
  21. Scrivener, K.L.; Lothenbach, B.; De Belie, N.; Gruyaert, E.; Skibsted Snellings, R.; Vollpracht, A. TC 238-SCM: Hydration and microstructure of concrete with SCMs. Mater. Struct. 2015, 48, 835–862. [Google Scholar] [CrossRef]
  22. Bullard, J.W.; Jennings, H.M.; Livingston, R.A.; Nonat, A.; Scherer, G.W.; Schweitzer, J.S.; Scrivener, K.L.; Thomas, J.J. Mechanisms of cement hydration. Cem. Concr. Res. 2011, 41, 1208–1223. [Google Scholar] [CrossRef]
  23. Celik, K.; Hay, R.; Hargis, C.W.; Moon, J. Effect of volcanic ash pozzolan or limestone replacement on hydration of Portland cement. Constr. Build. Mater. 2019, 197, 803–812. [Google Scholar] [CrossRef]
  24. Yanguatin, H.; Ramírez, J.H.; Tironi, A.; Tobón, J.I. Effect of thermal treatment on pozzolanic activity of excavated waste clays. Constr. Build. Mater. 2019, 211, 814–823. [Google Scholar] [CrossRef]
  25. Kaminskas RKubiliute, R.; Prialgauskaite, B. Smectite clay waste as an additive for Portland cement. Cem. Concr. Comp. 2020, 113, 103710. [Google Scholar] [CrossRef]
  26. Trojer, F.J. The crystal structure of parawollastonite. Z. Krist.-Cryst. Mater. 1968, 127, 291–308. [Google Scholar]
  27. Dhandapani, Y.; Sakthivel, T.; Santhanam, M.; Gettu, R.; Pillai, R.G. Mechanical properties and durability performance of concretes with Limestone Calcined Clay Cement (LC3). Cem. Concr. Res. 2018, 107, 136–151. [Google Scholar] [CrossRef]
Figure 1. XRD of CEM I.
Buildings 14 00093 g001
Figure 2. XRD of limestone powder.
Buildings 14 00093 g002
Figure 3. Particle size distribution of raw materials.
Buildings 14 00093 g003
Figure 4. TGA and DTG curves of raw clay.
Buildings 14 00093 g004
Figure 5. XRD spectra of raw and calcined clay.
Buildings 14 00093 g005
Figure 6. (a) Heat evolution of LC3 mixes. (b) Cumulative heat of LC3 mixes.
Buildings 14 00093 g006
Figure 7. Thermogravimetric analysis of LC3 pastes after 28 days of curing.
Buildings 14 00093 g007
Figure 8. XRD patterns for 28-day hydrated LC3 pastes.
Buildings 14 00093 g008
Figure 9. Compressive strength of LC3 mortar.
Buildings 14 00093 g009
Figure 10. Drying shrinkage of LC3.
Buildings 14 00093 g010
Figure 11. RCPT—total charge passed in LC3 mortar samples.
Buildings 14 00093 g011
Figure 12. Water absorption of different LC3 mixes at 28 days.
Buildings 14 00093 g012
Table 1. Chemical composition of cementitious materials.
Composition, %SiO2A12O3Fe2O3MgOCaONa2OK2OMnOTiO2P2O5ClSO3LOI
Calcined clay62.718.7211.691.880.260.022.10.450.40.020.21.55
Limestone0.450.050.061.0585.60.070.212.6
CEM I18.93.563.351.8859.654.62.10.150.20.2304.90.52
Table 2. Mix proportions for mortars.
Materials (kg/m3)ControlLC20%LC30%LC40%LC50%
OPC600480420360300
Calcined clay80120160200
Limestone406080100
Total binder600600600600600
Fine aggregate18001800180018001800
Water-to-binder ratio0.480.480.480.480.48
Water288288288288288
Table 3. Physical properties of LC3 samples.
Physical PropertiesControlLC20%LC30%LC40%LC50%
Normal consistency (%)29.532.532.933.434.7
Initial setting time (min)128135148153158
Final setting time (min)251289315328335
Soundness (mm)0.80.20.30.20.1
Disclaimer/Publisher’s Note: The statements, opinions and data contained in all publications are solely those of the individual author(s) and contributor(s) and not of MDPI and/or the editor(s). MDPI and/or the editor(s) disclaim responsibility for any injury to people or property resulting from any ideas, methods, instructions or products referred to in the content.

