1. Introduction
The global environmental landscape has been undergoing profound changes in recent decades [
1]. With the growing recognition of the adverse impacts of climate change, the need to transition towards sustainable and environmentally responsible energy sources has become increasingly urgent. As the world grapples with the consequences of greenhouse gas emissions, the pursuit of cleaner and more efficient energy systems has emerged as a central focus of research, policy, and innovation. At the heart of this transformation lies the imperative to harness renewable energy sources. Renewable energy, characterized by its sustainability and low environmental impact, offers a promising avenue for reducing carbon footprint and mitigating the effects of climate change. Solar, wind, hydro, and geothermal energy, among others, have all emerged as key players in the global effort to shift away from fossil fuels. As these sources become more accessible and cost-effective, they present unprecedented opportunities to transform the energy landscape and combat the environmental challenges.
Environmental sustainability has become a central focus, particularly in the building sector and the related energy consumption. This is evidenced by the European Union’s recent “Fit for 55%” package, which set ambitious targets, including a 55% reduction in greenhouse gas emissions by 2030, compared to 1990 levels. This legislative commitment underscores the growing urgency to address climate-related challenges. Specifically, the Fit for 55% package underlines the pivotal role of HVAC systems in achieving these goals. The legislation encourages the optimization of existing HVAC systems to bolster energy efficiency [
2].
Buildings represent one-third of the world’s energy consumption and have the potential to significantly reduce carbon emissions [
3,
4]. In order to achieve this goal, “smart buildings” equipped with innovative air conditioning systems and renewable sources need to be implemented [
5].
Heat pumps combined with solar energy (solar-assisted heat pumps) offer high sustainability. Recent research and field applications have made the use of heat pumps necessary as they are efficient, reliable, and environmentally friendly generators for annual air conditioning. Additionally, combining solar power with heat pumps offers a dual advantage. It maximizes the use of solar energy and increases the efficiency of the heat pump, thus optimizing and rationalizing the use of renewable sources [
6,
7]. The versatility in usage that allows for the provision of both heating and cooling as well as the production of domestic hot water with a single device makes heat pumps particularly suitable for the conditioning of civil buildings. The emission-mitigating potential of heat pumps is contingent upon various factors, including the specific technology employed, geographical location, and the composition of the electricity source [
8,
9].
In recent years, many researchers have focused on integrating heat pumps with solar collectors, photovoltaic panels, and hybrids for domestic heating. M. S. Bucker et al. and X. Wang conducted reviews on systems that combined heat pumps with solar collectors, photovoltaic panels, and hybrids. They classified these systems based on their components, the type of use, and the performance achieved in various case studies [
10].
Dikici et al. conducted an experimental analysis to evaluate the performance of heat pumps at different sources for domestic heating. They subsequently analyzed the performance of multi-heat pump sources to provide a comparison between the various configurations [
11]. In another study, F. Huide et al. [
12] investigated the performance of an integrated system consisting of a helios-assisted heat pump with photovoltaic/thermal collectors made of heat pipes. The system was used to heat water directly or to act as a heat pump evaporator, depending on different weather conditions [
12].
For solar-assisted heat pumps, thermal and electric energy storage systems are pivotal for enhancing self-consumption, narrowing the gap between energy demand peaks and troughs, and increasing the stability of the grid. Over recent years, the widespread adoption of thermal energy storage has been driven by its ability to address the dual requirements of electricity and space heating, while also ameliorating the irregularities in energy demand [
13].
Storage systems contribute to enhancing the integration of renewable energy sources into the power grid while boosting system flexibility, all without compromising the security of the transmission and distribution network [
14].
Aneli et al. conducted a study to assess how well an energy system, which included an electric heat pump powered by a photovoltaic generator, as well as thermal and electric energy storage, performed. The analysis results showed that systems with around 1000 L of thermal storage and 5.0 kWh of electrical storage can reach self-consumption and self-sufficiency rates of about 80%, which is three times greater than what an energy system lacking storage can achieve. Additionally, this system configuration substantially decreased grid power exchange [
15].
Pinamonti et al. [
16] conducted a study on a system that integrated a water-water heat pump with short- and long-term storage, using a dynamic simulation carried out with TRNSYS. The purpose of the long-term storage was to store the surplus solar energy collected by solar collectors during the summer season, which could then be utilized for space heating during the winter months. As a result, the utilization of this system increased the solar fraction by five percentage points [
16].
Bellos et al., conducted an energy and cost comparison between a solar-assisted heat pump heating system utilizing flat plate collectors, an insulated tank, and a standard air source heat pump system across twenty European cities through the TRNSYS simulation tool for the entire winter season. The solar-assisted heat pump system demonstrated significant electricity savings, ranging from 30% to 40%, across various insulation scenarios. In these systems, the coefficient of performance (COP) was approximately 4, while for conventional air source systems, it was about 2.5. Notably, the solar-assisted heating system emerged as the financially optimal choice for most of the studied cities, particularly in areas characterized by low insulation levels in buildings [
17].
Miglioli et al. [
18] provided the state-of-the-art photovoltaic-thermal (PV/T) solar-assisted heat pumps designed for fulfilling thermal energy requirements in buildings. The primary emphasis was given to integration methodologies, potential system configurations, utilization of diverse energy sources, and the design of subsystem components. General guidelines suggested sizing the PV/T area to cover peak thermal demand during the sunniest month and the heat pump according to peak thermal load. Energy storage choices should align with project objectives, favoring water thermal storage (WTS) and advanced control logic for enhanced PV electricity self-consumption and reduced grid dependency. Integrating WTS into the solar circuit for direct user or heat pump requirements is advised for optimal solar energy utilization [
18].
Furthermore, the integration of heat pumps with thermal storage systems coupled with phase change materials has also been extensively studied. Ning et al. analyzed the combination of phase change thermal storage technology with air-source heat pumps, improving the performance coefficient and stability of air-source heat pumps operating in a low-temperature environment. The findings indicated that incorporating phase change materials (PCMs) led to a substantial enhancement in heating time by up to 30.6% and an increase in COP of up to 33.9% at a temperature of 35 °C. However, at 55 °C, this inclusion may trigger an adverse effect [
19]. Furthermore, the operation time of the compressor can be reduced by as much as 16.5% at 35 °C, but it increases by up to 15.7% at 55 °C. The study emphasized the importance of balancing sensible and latent heat storage. J. Yao et al. performed a numerical simulation to analyze the performance of a system that combined the use of a heat pump associated with solar/photovoltaic panels and thermal storage with PCM [
20].
Instead, E. Georges et al. developed an optimization system that allowed load modulation of heat pumps installed in residential buildings to quantify their flexibility of use by adjusting consumption to electricity prices [
21]. Finally, L. Kreuder et al. analyzed the combination of heat pump use with demand side management (DSM) strategies [
22].
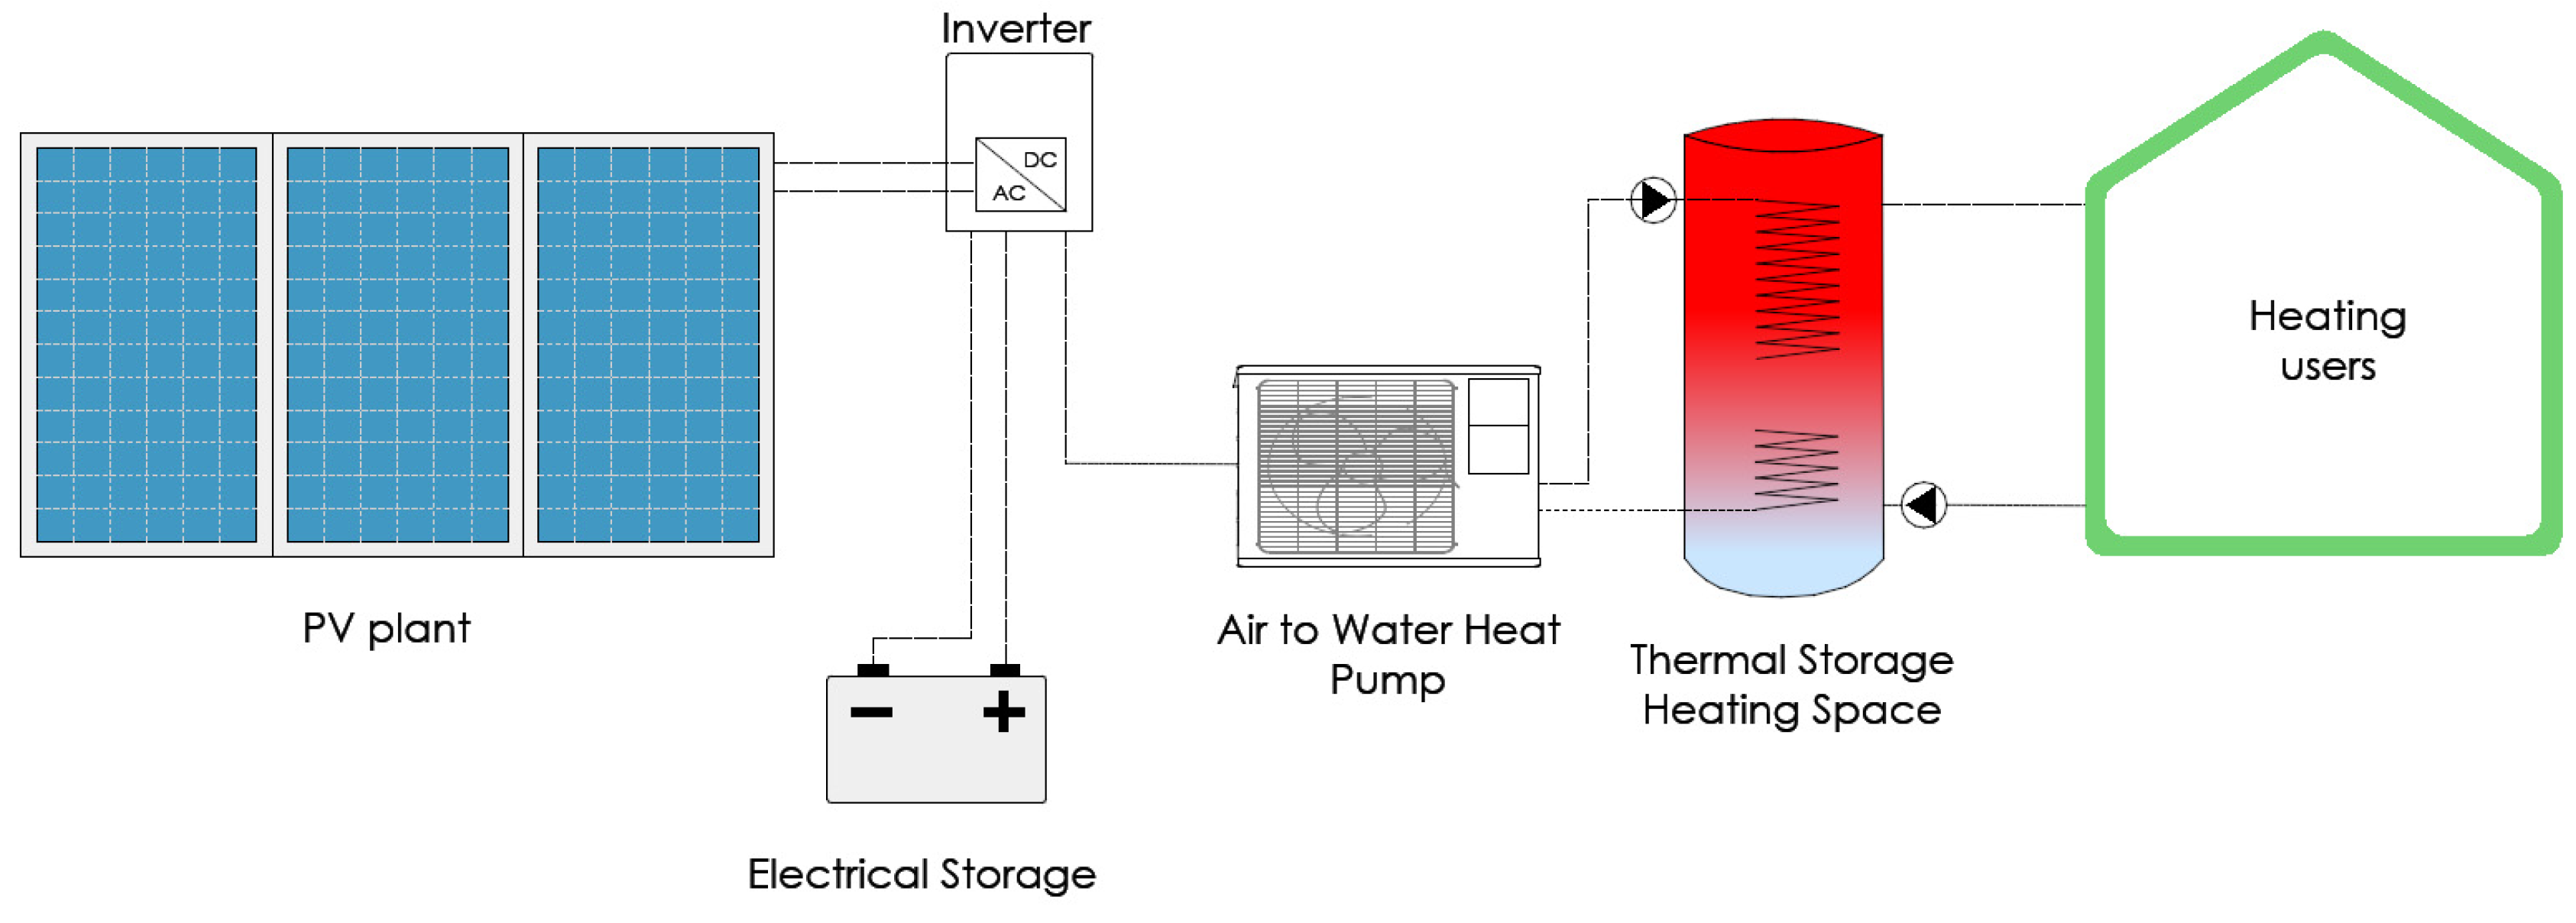
While previous research primarily focused on the effectiveness of the technologies employed, this work aimed to explore the simultaneous impact of combined electrical and thermal storage systems with a control logic aimed at maximizing the utilization of excess renewable energy on the overall performance of solar-assisted heat pump systems. In order to overcome this gap, this paper focused on the possibility of combining an air-to-water heat pump with other renewable sources to increase the use of renewable energy and self-consumption. The proposed system included an air-to-water heat pump, a field of photovoltaic panels with electrical storage, a thermal solar collector, and an insulated tank as thermal storage. The domestic hot water (DHW) is also provided by the tank supplied via thermal solar collectors working in forced convection. The paper’s aim was the development of suitable control strategies targeted to optimize the employment of the free solar source. In particular, two different control logics were compared: in the first, the heat pump kept the tank at the set-point temperature, regardless of the presence of renewable energy, whereas the second allowed it to surpass the set point even when the demand for renewable electricity was exceeded in order to store thermal energy in tanks via an appropriate management of renewable surpluses. Simulations were conducted, in the TRNSYS environment for two distinct Italian cities, Milan and Messina, with opposite climatic conditions (heating dominates the first, cooling dominates the second). This analysis also aimed to underscore any potential drawbacks associated with the proposed solution. To quantify the performances of the proposed system, efficiency was chosen as a reference parameter and determined through the analysis of:
Self-consumption and electricity supplied by the national grid.
CO2 equivalent emissions.
Domestic hot water (DHW) supplied by solar collectors.
2. Methodology
In this section, the reference building-plant system and numerical setup are presented. The main characteristics of the air-to-water heat pump, PV generator, thermal solar collectors, and thermal and electrical storage are introduced. Successively, the implemented control strategies are described. Finally, the method for determining performance parameters is outlined.
2.1. Case Study Building
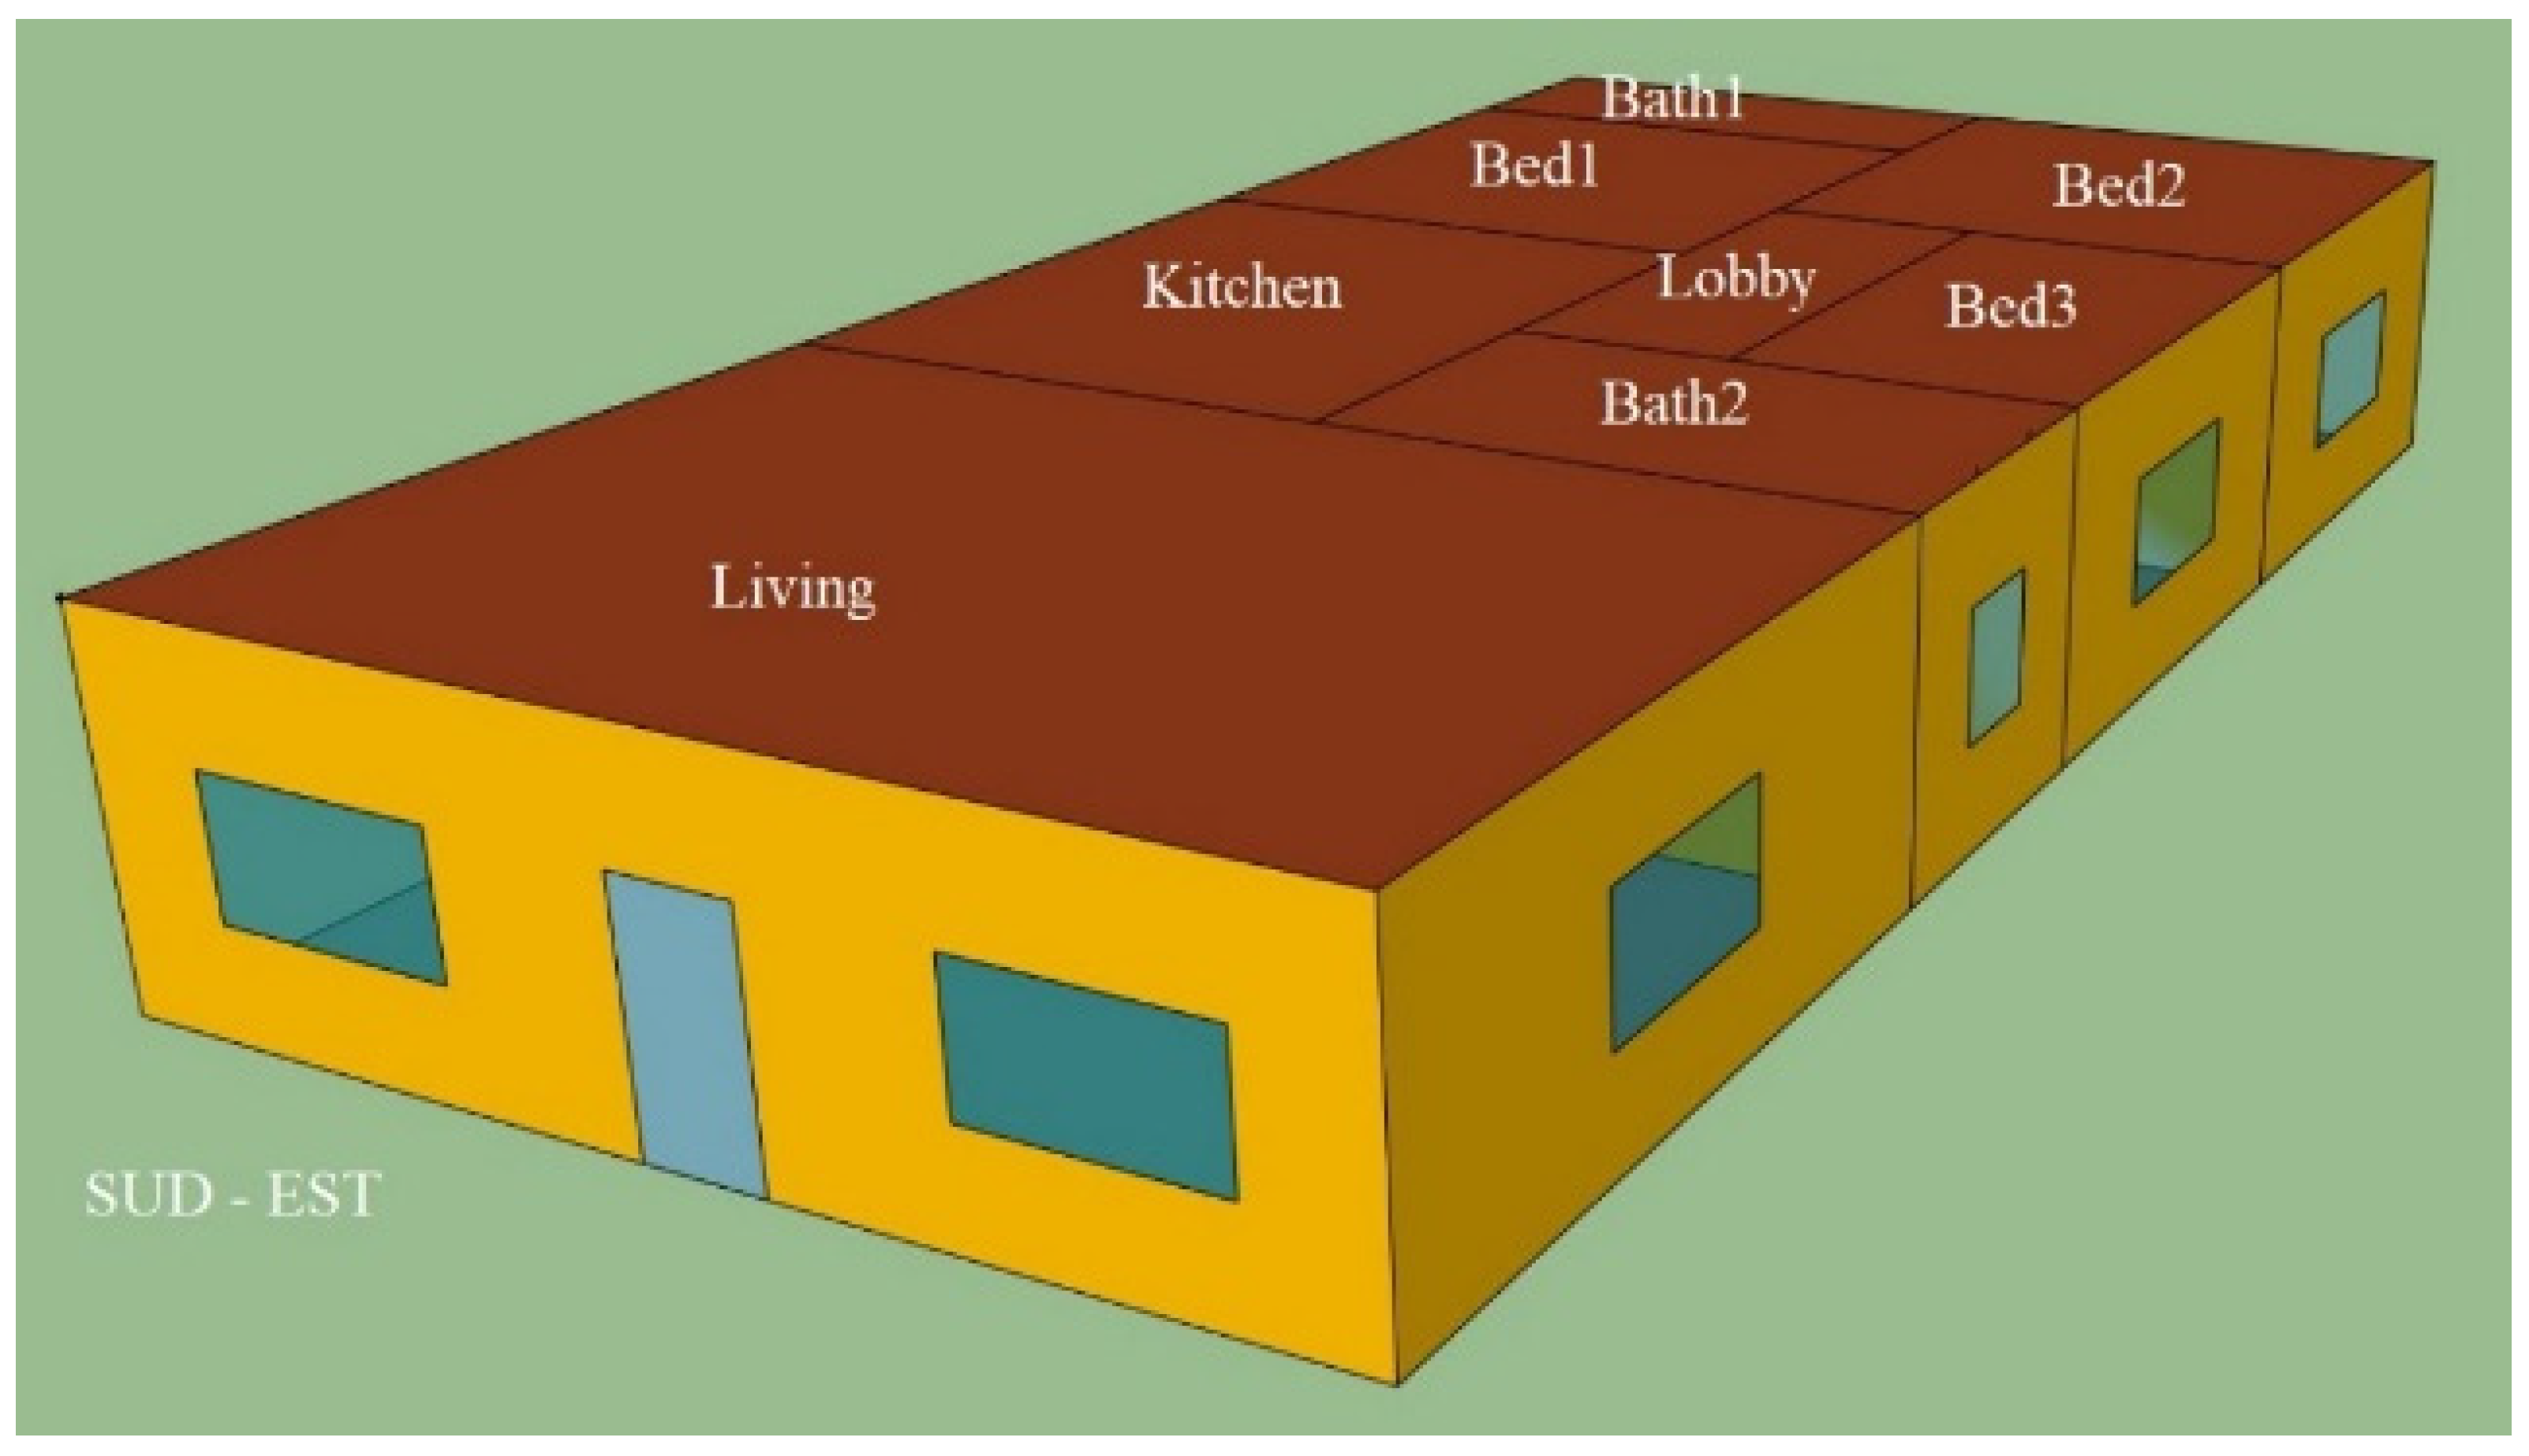
The case study building was a one-story residential structure with a total area of 200 m
2. It was comprised only of thermal zones and had an inter-floor height of 2.7 m (
Figure 1). The building envelope was designed to meet national energy efficiency regulations for buildings currently mandatory in Italy for new constructions [
23]. The U-value of the external walls was 0.34 W/m
2K, with the stratigraphy outlined in
Table 1.
The ground floor and roof slabs had a thermal transmittance of 0.277 W/m
2K and 0.225 W/m
2K respectively. The layers are listed in
Table 2 and
Table 3.
The windows consisted of a double-pane 4/15/4 configuration with an argon fill and a thermal transmittance of 2.2 W/m
2K. They had a frame-to-glazed surface ratio of 0.15. The building was intended for occupancy by 5 individuals, with a designated sensible heat rate of 75 W per person. An infiltration rate of 0.28 air changes per hour (h
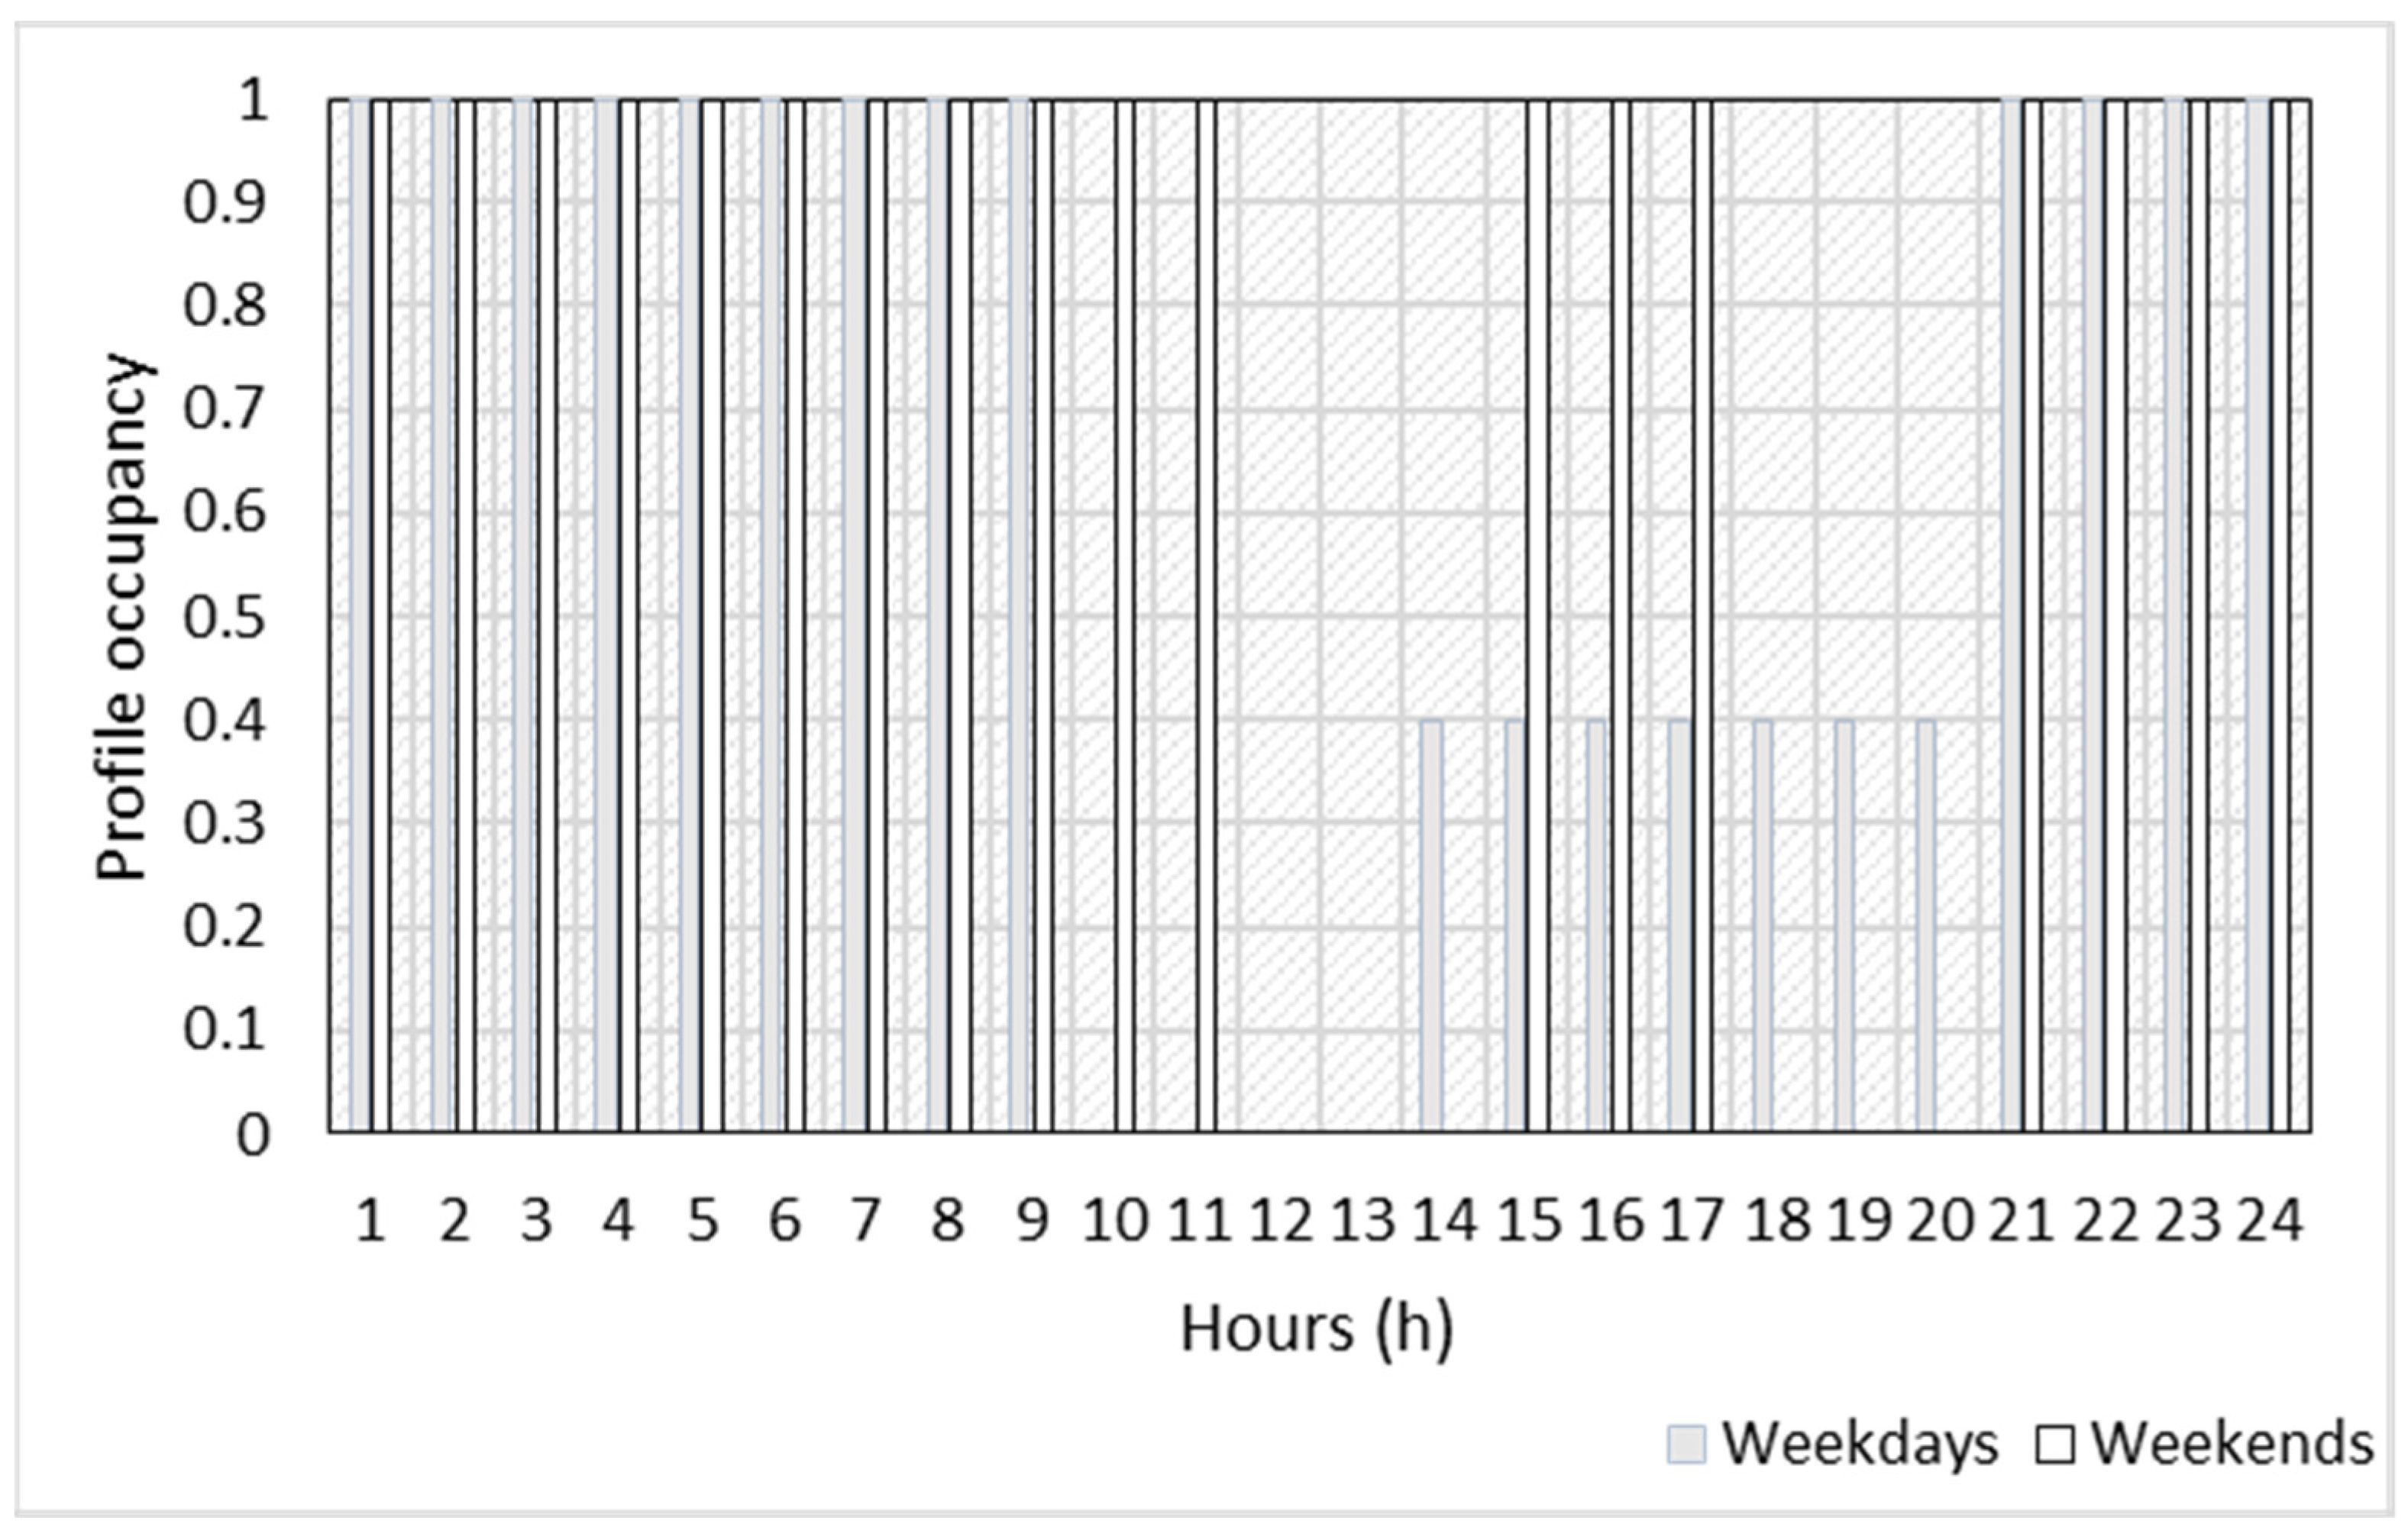
−1) was specified. The winter set-point temperature was established at 21 °C, and in summer, it was set to 26 °C. The occupancy profile followed the schedule depicted in
Figure 2.
Initially, the building was assumed to be located in Milan, characterized by a continental climate classified as subtype ‘CFb’ (marine west coast climate) according to [
19]. Successively, simulations were also conducted in Messina, which features a hot Mediterranean/dry-summer subtropical climate as per the same classification.
2.2. Electrical and DHW Loads Profiles
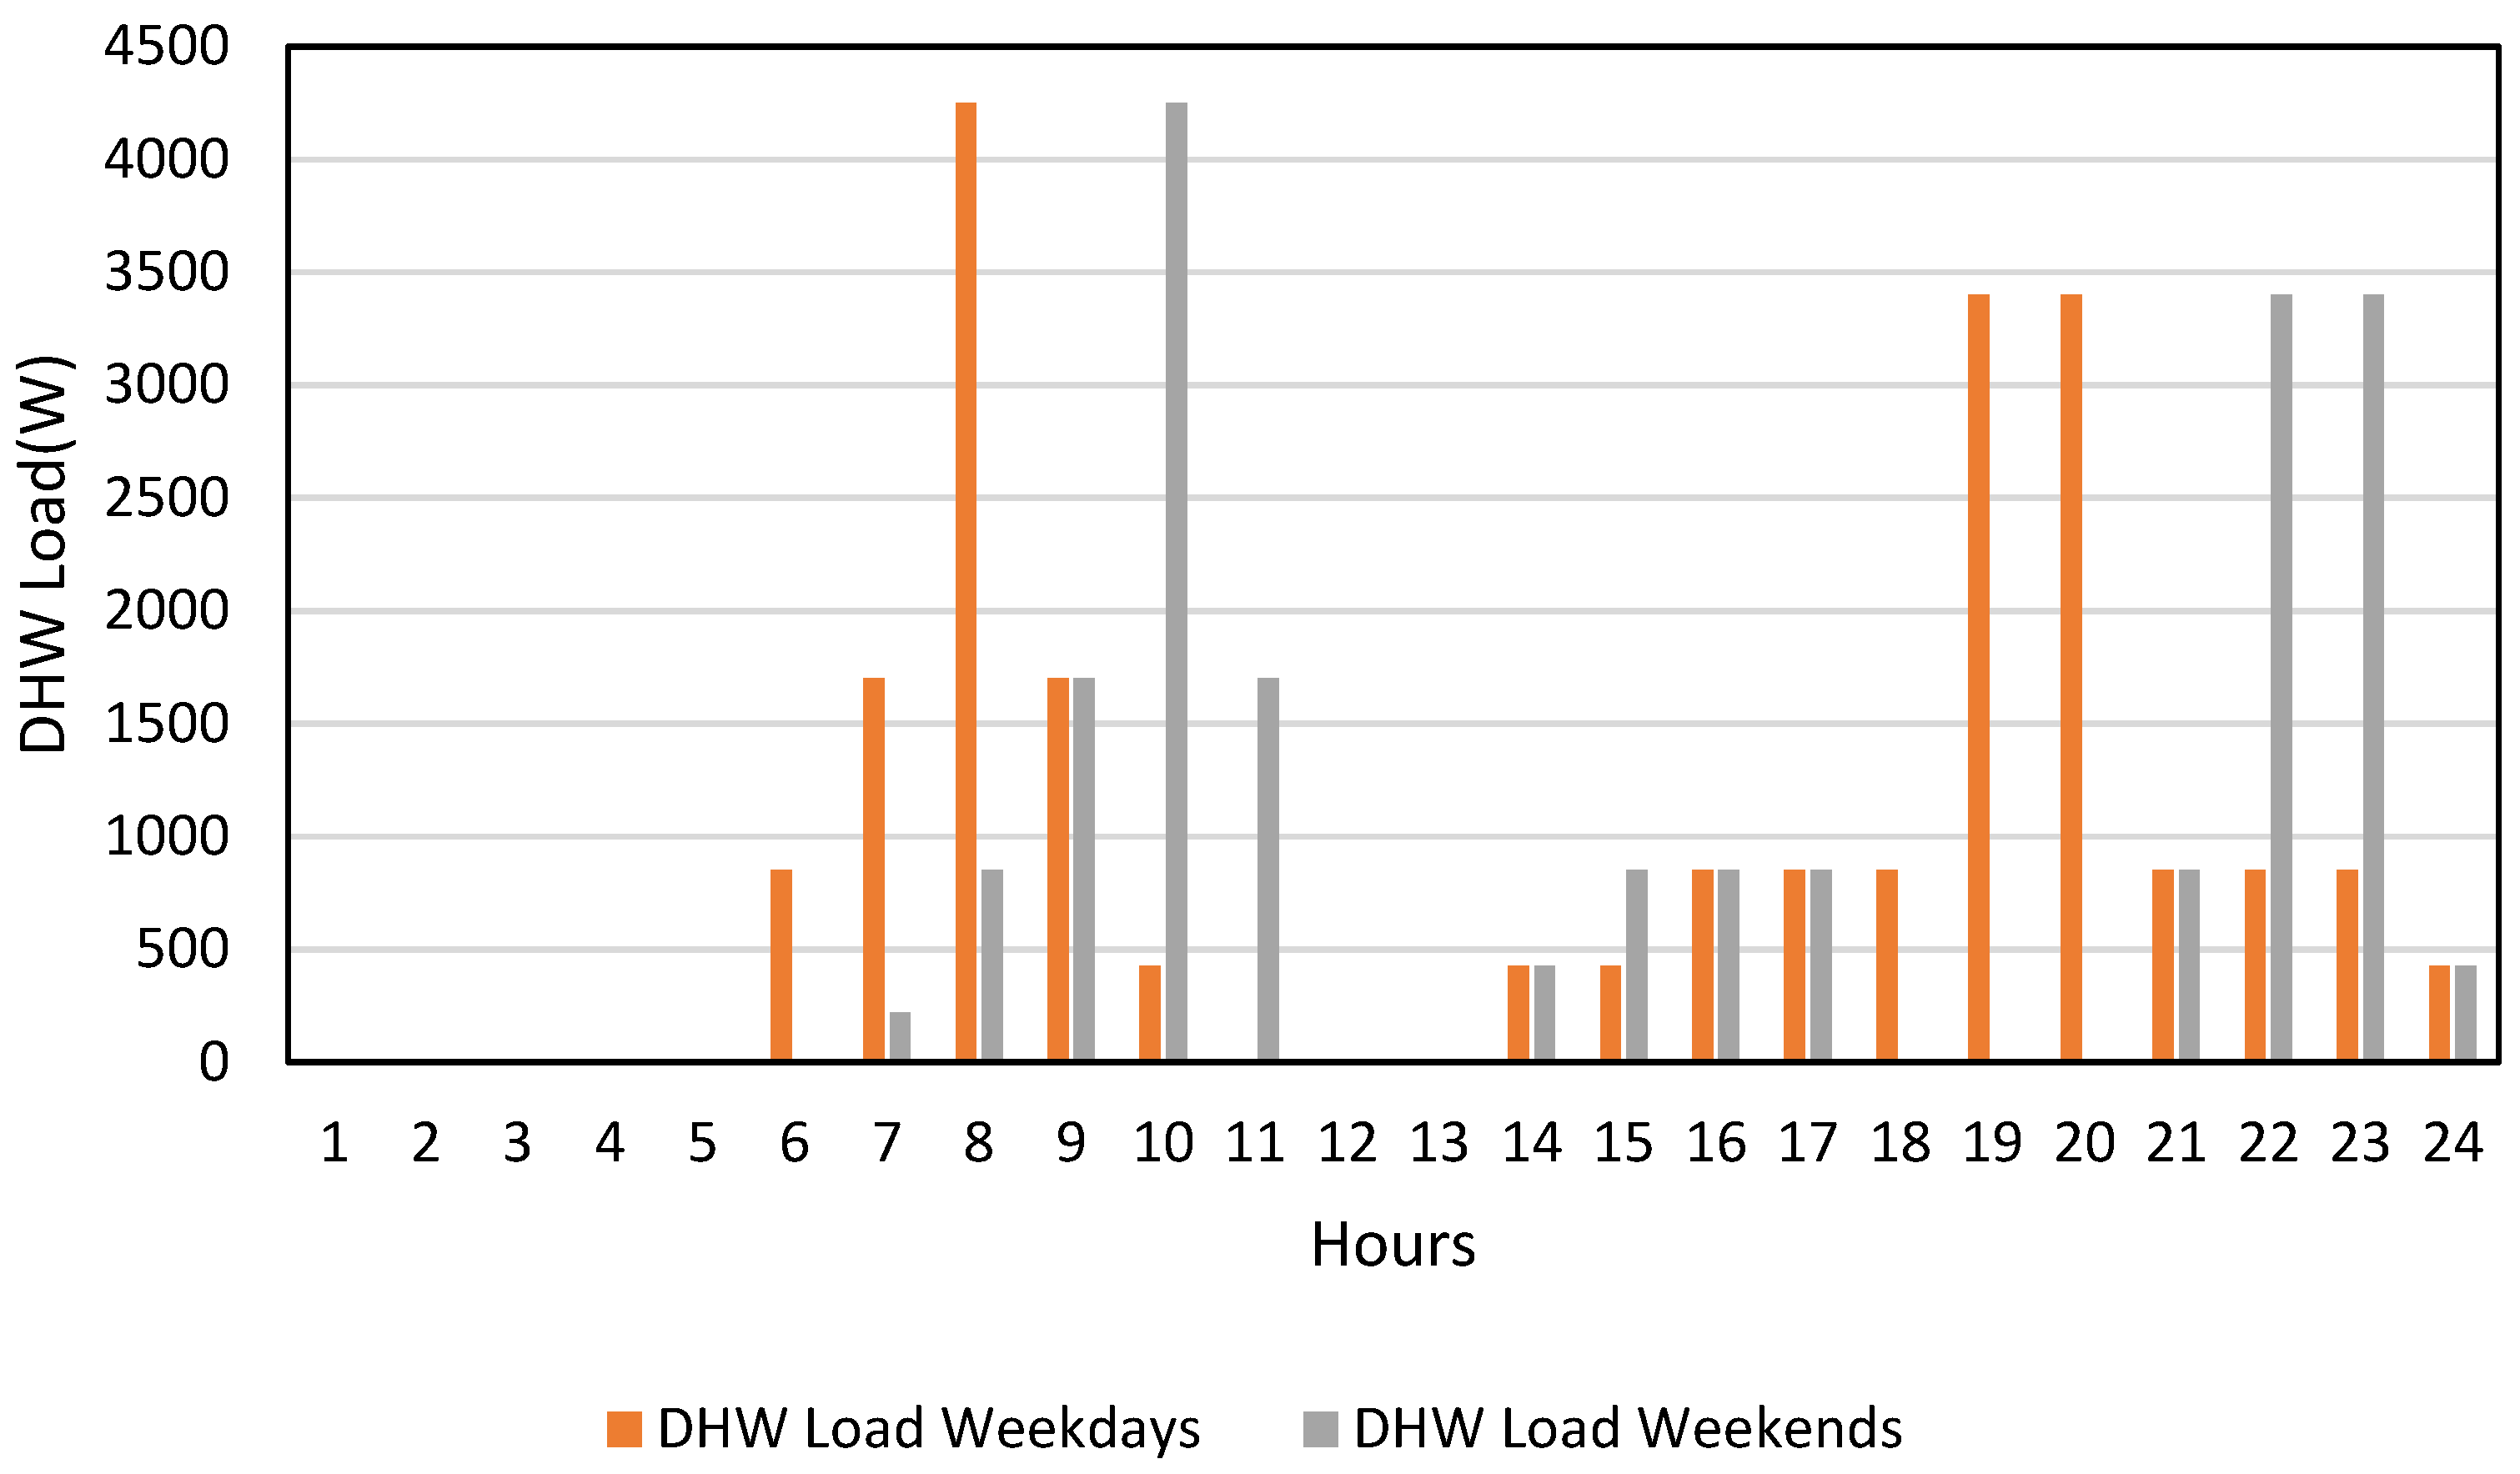
The DHW usage pattern was established based on data collected from residential buildings. Separate profiles were created for weekdays and weekends, and these profiles were used throughout the year. This choice was made as no significant variations were observed in the measured data. The DHW profile, represented in terms of the required thermal energy, is depicted in
Figure 3.
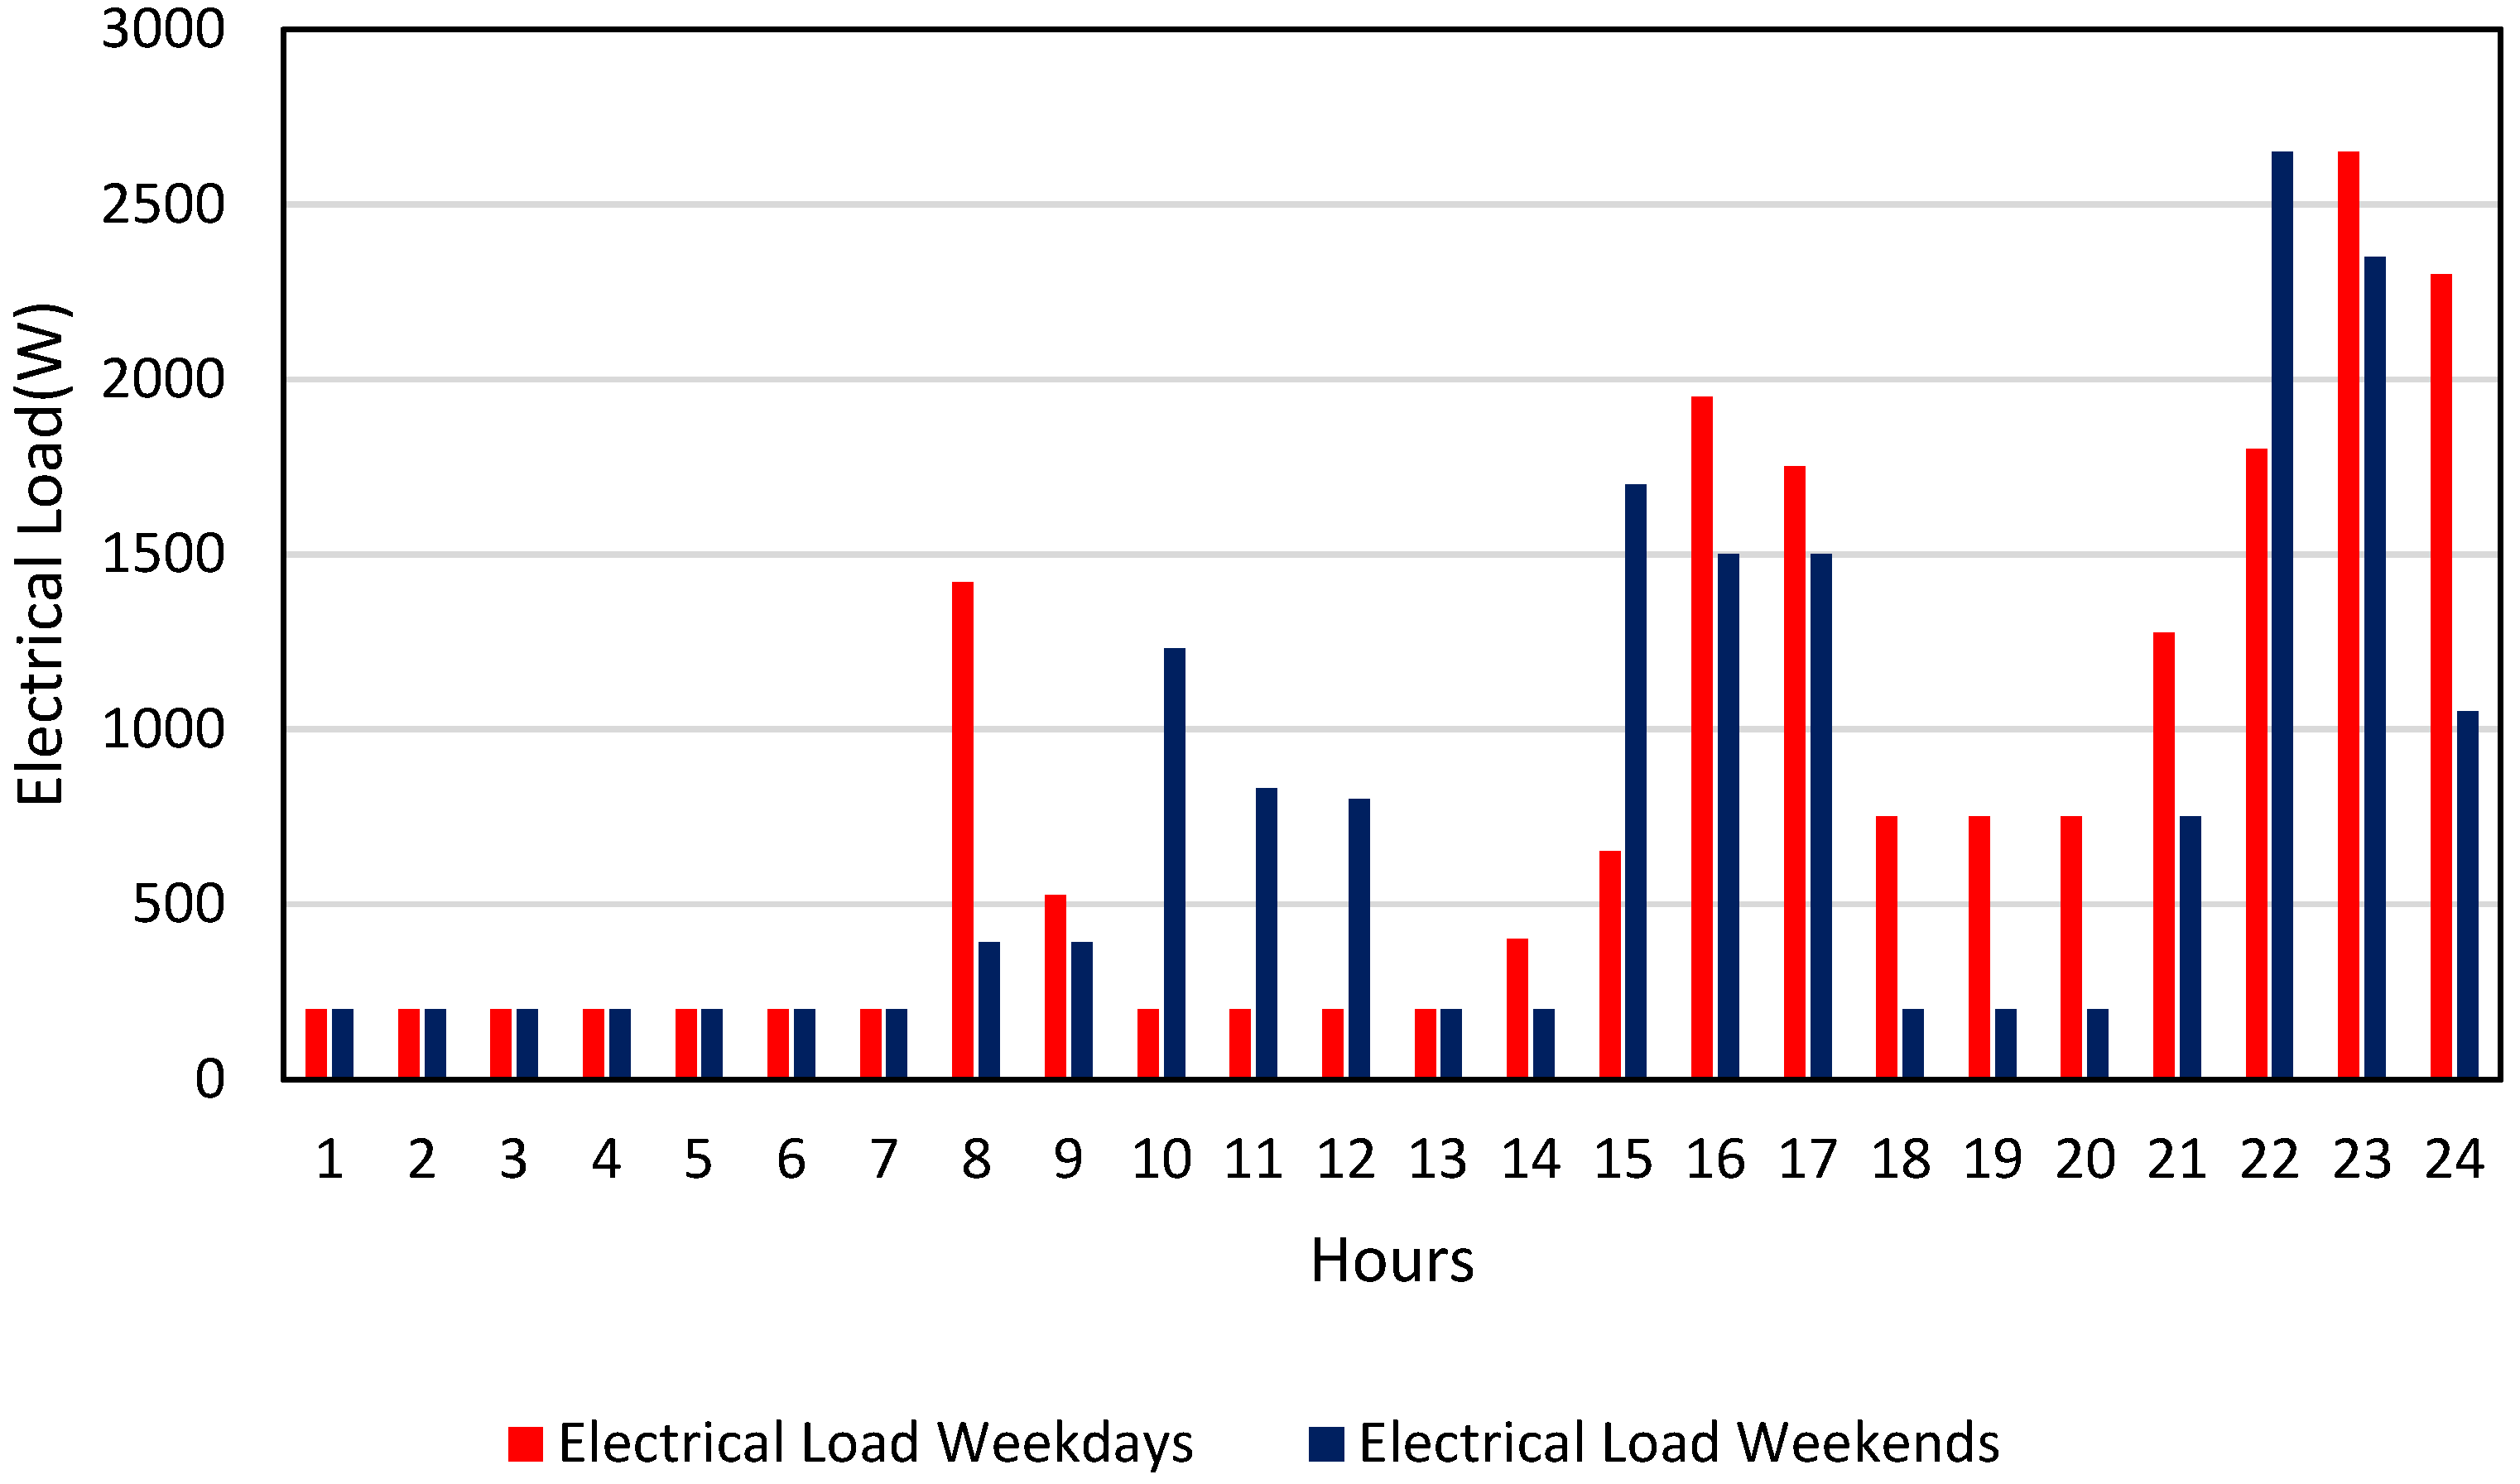
Similarly, measurements taken on the primary appliances in residential buildings were used to establish an appropriate schedule for the building’s electric energy demand. Monitored appliances included the refrigerator, washing machine, dishwasher, phone, iron, personal computers, and television. Data analysis led to the definition of the profiles depicted in
Figure 4, which were categorized for weekdays and weekends.
2.3. Simulation Model and HVAC Plant
In accordance with recent European directives on energy efficiency, the HVAC system used in the case study relied on an air-to-water heat pump. The plant above was implemented in the TRNSYS 18 environment (
Figure 5). TRNSYS 18 is widely recognized as a reliable and versatile tool for energetically simulating complex systems. Its capability to intricately model both the components of the system and their interactions has been crucial in achieving a precise evaluation of the dynamics of the studied system. Additionally, this program incorporates comprehensive libraries of system and technology components, encompassing various types of solar systems, buildings, and heating-cooling loads.
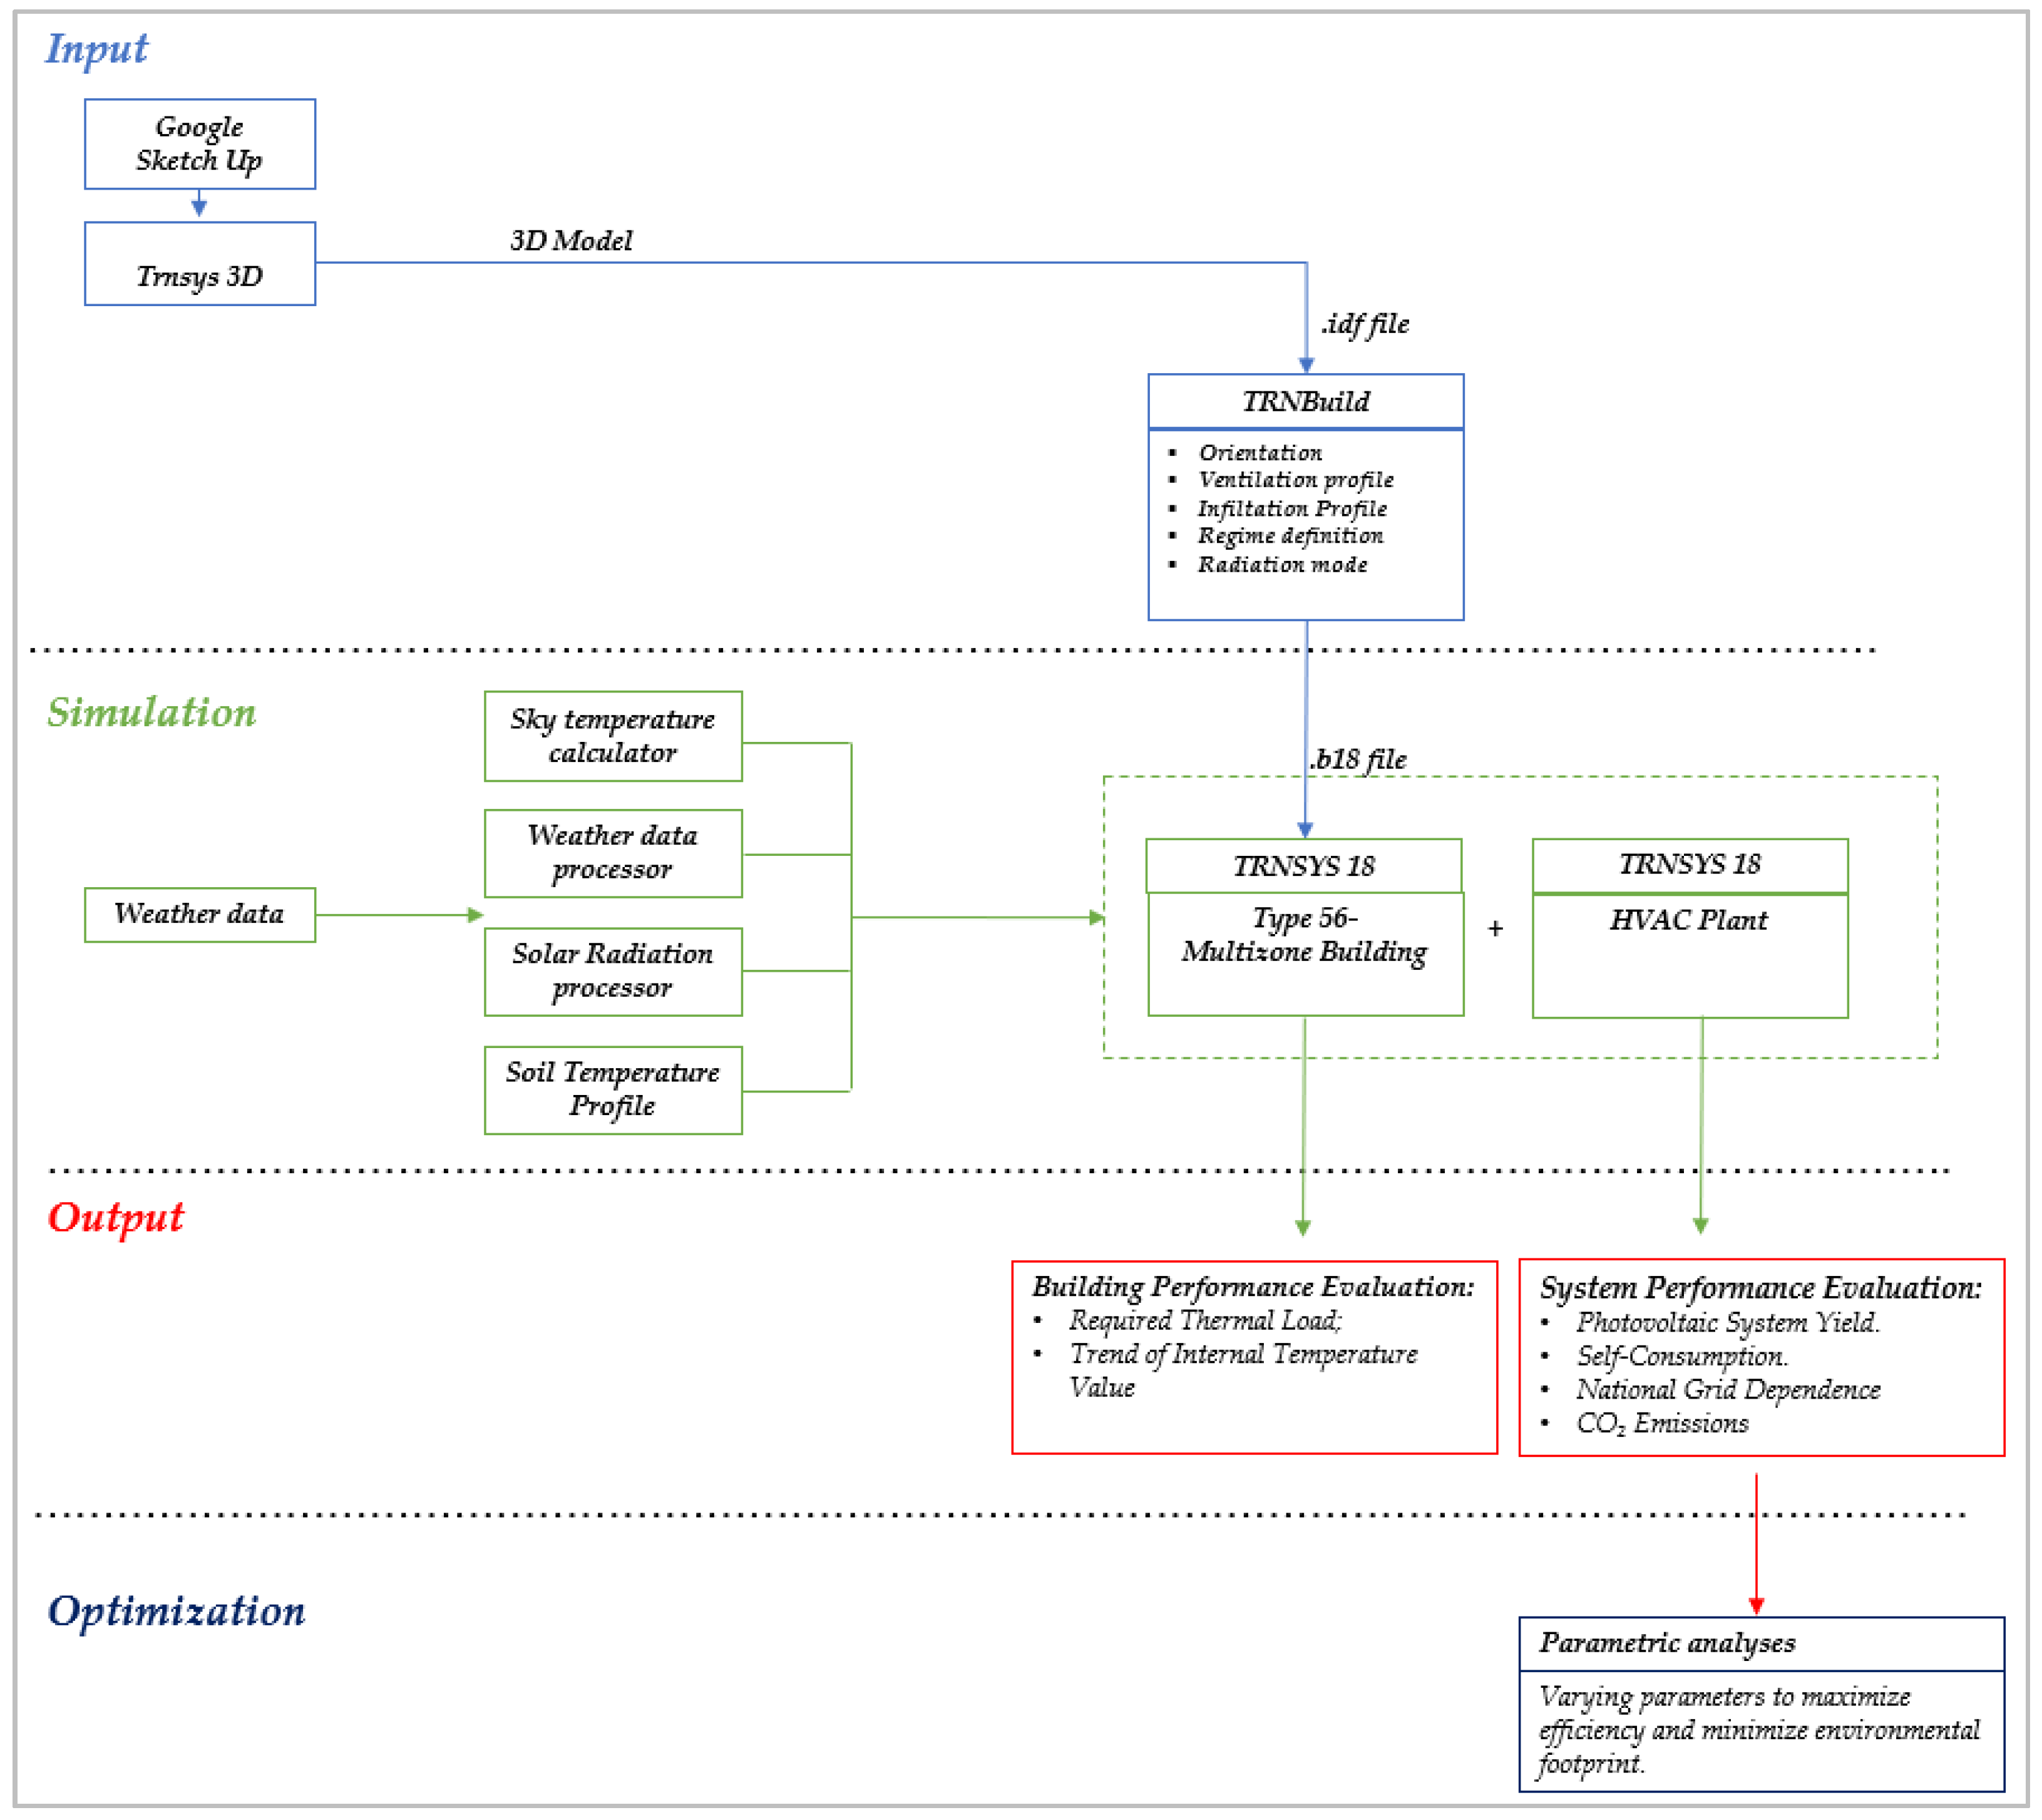
The construction of the model involved the following work-flow (
Figure 6): construction of the 3D model, a thermophysical definition of the reference building and finally, the mathematical definition. The building’s 3D model was created using Sketchup, incorporating the TRNSYS 3D plug-in to facilitate a comprehensive representation of its geometry. TRNBuild establishes the required characteristics of the building envelope and its regime, encompassing radiation mode, infiltration and ventilation, the number of zones/air nodes, as well as the thermal and moisture capacitance of the zone/air node. TRNBuild generates an information file that describes the outputs and inputs required by the Type 56 multizone building that in TRNSYS 18, is completely dedicated to modeling the behavior of even complex buildings. The plant, on the other hand, was primarily modeled using the following types: “type 941” for the air-to-water heat pump, “type 156” for the thermal storage tank, “type 987” to simulate the behavior of the emission system, “type 103b” for the photovoltaic system, “type 47a” for the electric storage battery, and “type 48b” employed to regulate energy flows.
A preliminary building simulation determined the necessary heating capacity of the heat pump, which was then set to 11 kW in set-point conditions for the colder locality.
The heat pump provided direct heating to the thermal storage tank. The key features of the thermal storage are detailed in
Table 4. The tank was equipped with an immersed heat exchanger in the form of a coiled tube. The fluid in the storage tank interacted with the fluid in the heat exchanger (through heat transfer with the immersed heat exchanger), the environment (through thermal losses from the top, bottom, and edges), and up to two flow streams that passed into and out of the storage tank. The tank was divided into isothermal temperature nodes to model water temperature stratification. Each constant-volume node was assumed to be isothermal and interacted thermally with the nodes above and below through fluid conduction and movement.
An on/off differential controller governed the operation of the heat pump based on the difference between two temperature thresholds (Th and Tl) relative to two hysteresis temperature differences (DTh and DTl). The controller incorporated hysteresis as its control function relied on the previous input function value. For winter operation, the controller permitted the heat pump operation between 50 °C and 55 °C at the outlet (first control logic). Additionally, an upper limit condition of 80 °C was in place to prevent the control function from activating if the maximum temperature was exceeded. The building’s conditioning was performed by a fan coil heating or cooling the air as it passed over hot or cold liquid flow streams withdrawn from the thermal storage, allowing the outlet flowrate generated via the fan coil to be sent to the building for heating or cooling. Appropriate input variables, such as inlet temperature, humidity, and flowrate, were defined in the building type, where a maximum outlet temperature of 50 °C was allowed to account for real working conditions. It is achieved by mixing the outlet flowrate from the storage with a fraction of the fain coil returning water after passing through a tempering valve. In summer, the thermal storage volume stores chilled water for cooling services, so it cannot be used for DHW. A thermal storage of 300 L was used for DHW with solar collectors working in a forced convection. The solar collectors had an intercept efficiency of 0.8, a first-order loss coefficient of 3.61 W/m
2K, and a second-order loss coefficient of 0.139 W/m
2K
2. The circulation pump was activated when the temperature difference between the outlet of the solar collector and the storage was less than 20 °C and stopped when the difference reached 10 °C. The water withdrawn from the solar storage was then mixed with a colder flowrate from the supply network to achieve a set point temperature of 45 °C for domestic applications. The necessary area for the solar collectors was determined through a preliminary simulation to be 8 m
2 to fully meet the defined DHW requirements in
Figure 2 for the summer period. In winter, when solar radiation was not sufficient to meet the DHW requirements, the additional energy needed was extracted from the thermal storage connected to the heat pump, giving priority to the solar collectors. To increase efficiency and the share of renewables, a grid-connected photovoltaic plant was included to provide part of the necessary electricity. The PV modules used were made of mono-crystalline silicon type and the main electric characteristics are reported in
Table 5.
The size of the PV plant was left as a parameter for the parametric analysis shown in the following section. Since there is not always synchronization between the required electric loads and the availability of solar radiation, the generator was fitted with an electric storage system—a traditional lead-acid storage battery—in order to better manage the surplus of PV power output. The simulated battery worked in conjunction with a solar cell array and power conditioning components, with the capacity of the battery being a variable in the parametric analysis discussed below. In DC source power systems—such as photovoltaic arrays—two power conditioning devices are necessary. The first is a regulator, which distributes DC power from the source to and from a battery (in energy storage systems) and the second component, an inverter. If the battery is fully charged or only requires a taper charge, excess power is either discharged or not collected by shutting off parts of the source. The inverter converts the DC power to AC, sending it to the load and/or sending it back to the utility. Type 48 simulates a power regulator and inverter which can be used with a PV array and a battery.
2.4. Management Logic
The paper investigated the influence of controllers on the rational use of renewable energy in air-conditioning systems with the aim of improving energy efficiency. Two main control management strategies were proposed. The first strategy activated the heat pump based on the temperature levels monitored on its outlet and the thermal storage, in order to maintain the tank at the desired set-point temperature, irrespective of the availability of renewable energy. This approach is currently the most commonly used logic in air-conditioning systems, although it gives little attention to the optimization of renewable sources. The second strategy, referred to as smart control, allowed for the tank temperature to exceed the set point, as the heat pump was activated even when the renewable electricity exceeded the demand. This meant that the tank could function as an electric storage unit for any PV surpluses in terms of hot/cold water produced through the heat pump. In other terms, PV surpluses were transformed into heating/cooling loads by the heat pump and stored in the tank for deferred uses. In this case, the combination of a heat pump and tank is considered an electrical storage system for managing excess photovoltaic electricity, therefore it can be exploited also when heating or cooling loads are not required. If the storage tank is saturated, thermal energy can be stored in the building structure by modifying the internal set-point values with strategies such as overheating in winter or undercooling in summer. To avoid eventual discomfort, indoor temperatures cannot exceed 22 °C in winter and 25 °C in summer. Thus, the implemented smart control strategy has the potential to optimize the use of renewable energy and improve energy efficiency in air-conditioning systems. In this paper, only the system’s performance during the winter season was analyzed.
2.5. CO2 Equivalent Emission
The equivalent emissions were calculated through the factors listed in
Table 6 as a function of the energy carrier [
24]. The calculation process involved multiplying the respective emission factor for each energy carrier by its corresponding energy consumption in kilowatt-hours.
3. Results
A study was conducted to identify the optimal configuration for each management strategy using parametric analysis. Various parameters were tested, including thermal storage volume, number of photovoltaic panels, and battery capacity. Photovoltaic system simulations were conducted using 18, 36, and 72 panels for peak powers of 6, 12, and 24 kW, respectively. Electrical storage was tested with two different capacities, 1.2 × 10⁴ Wh and 2.4 × 10⁴ Wh. Tank volume was tested with 0.5 m3 and 1 m3 capacities. The results showed that energy efficiency was not significantly affected by tank volume variation and hence not reported in the text. Therefore, only the results of the other two analyzed parameters were reported and referred to a tank storage volume of 1 m3. The efficiency of the system was measured by determining the self-consumption of photovoltaic electricity, the percentage of electricity supplied by the grid and CO2 emissions. The study also examined the percentage of DHW supplied by solar collectors.
3.1. Calculation of the Heating Loads of the Reference Building in the Considered Climate
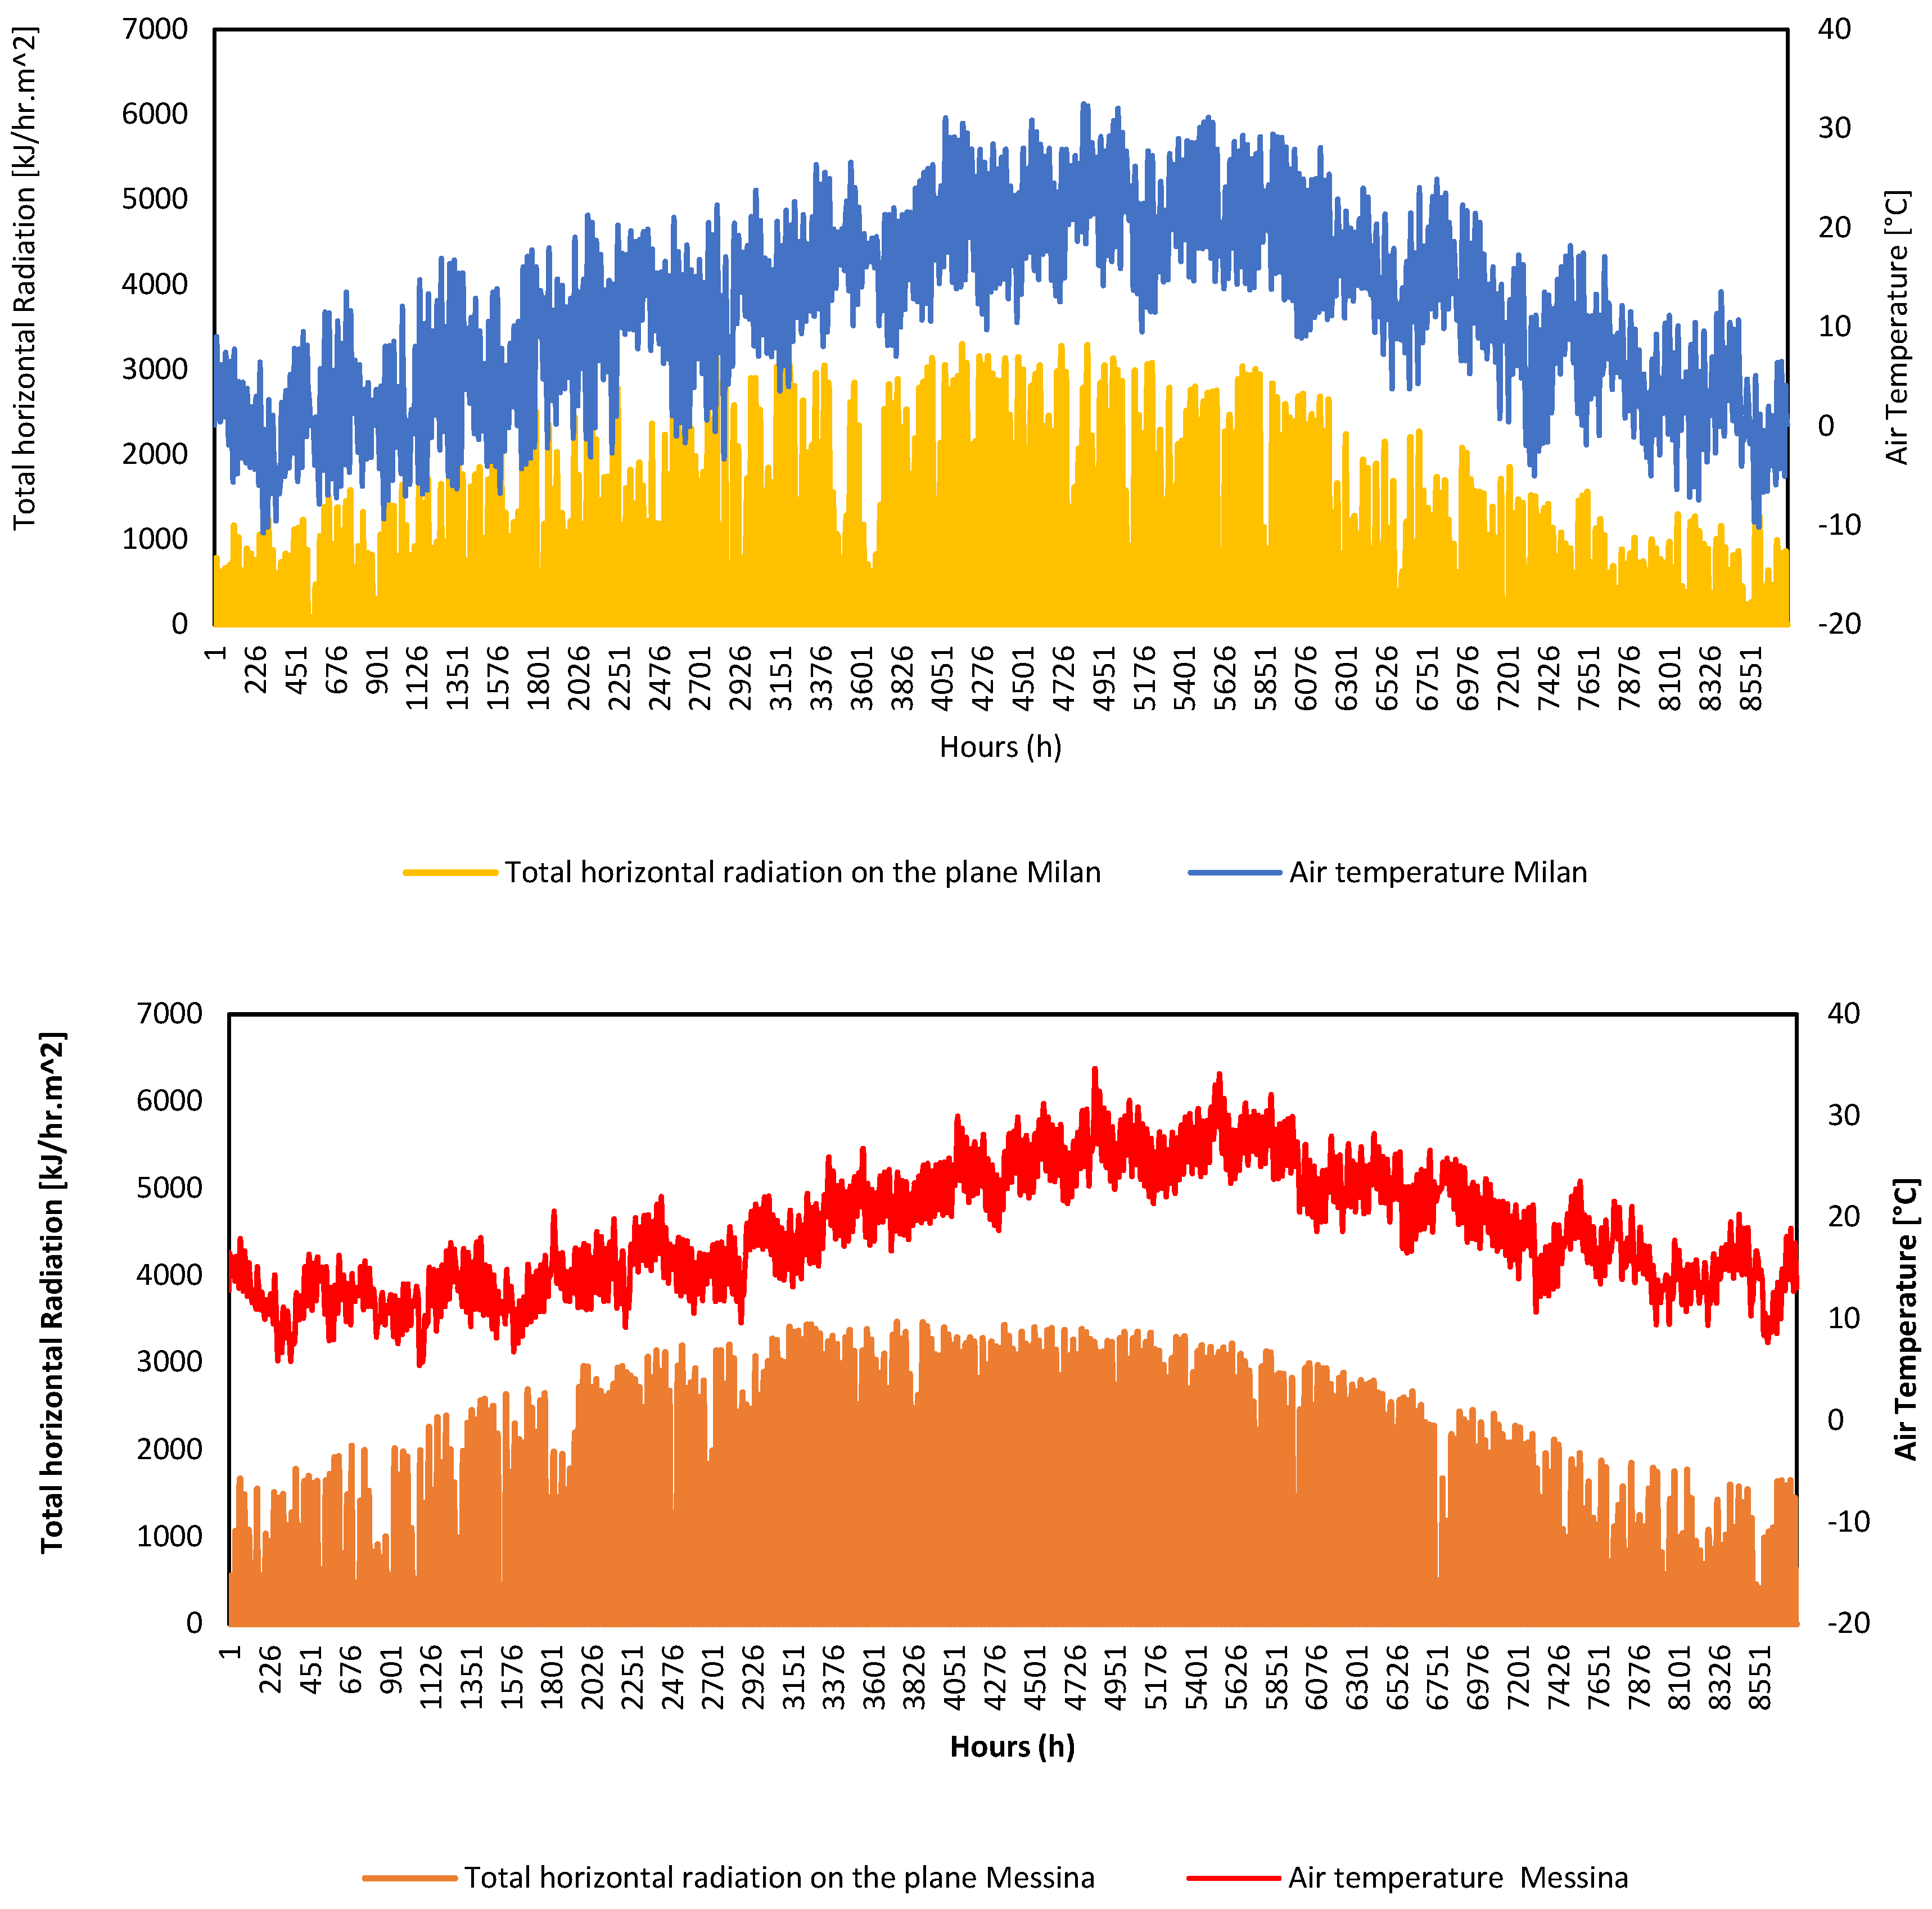
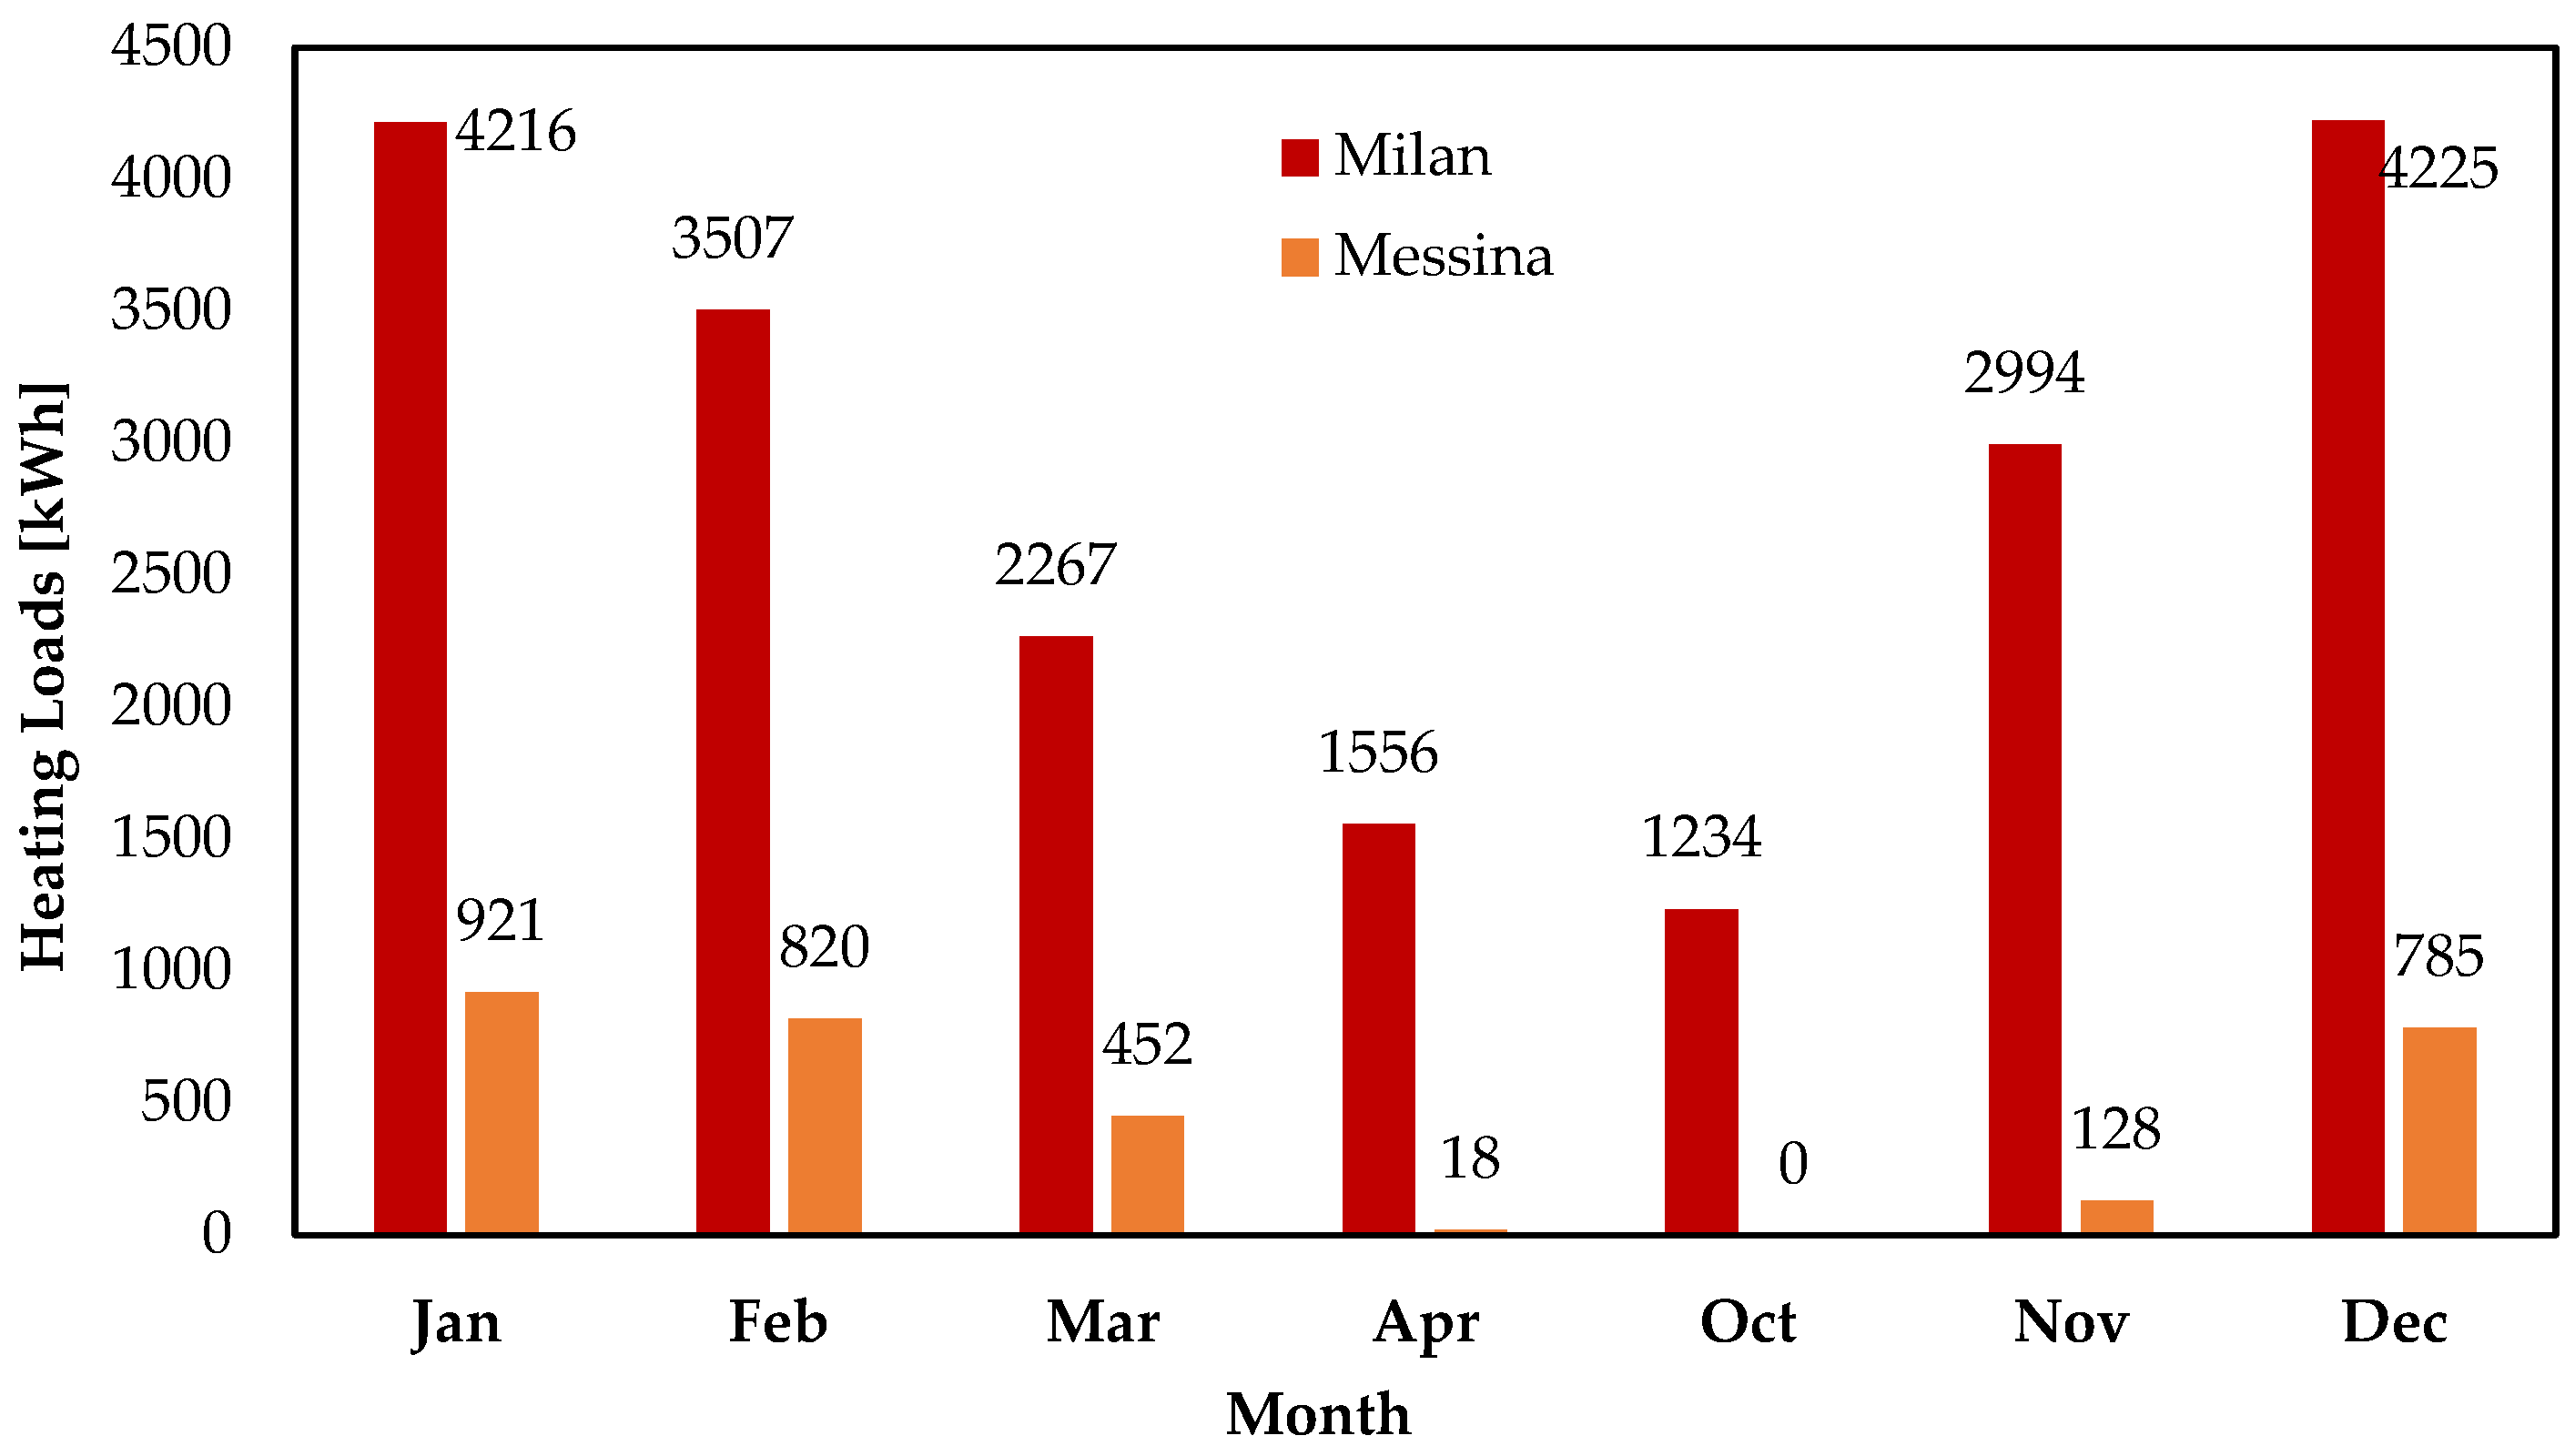
In
Figure 7, the thermal loads for the building are illustrated, with Milan depicted in red and Messina in orange.
The monthly load data presented represents the dynamic simulation results obtained through TRNSYS for a building based on actual weather data provided by a typical meteorological year (TMY) that is a collation of selected weather data for a specific location, providing hourly records of solar radiation and meteorological elements over a one-year period. These values were derived from a database with a duration significantly longer than a year, typically spanning at least 12 years. The selection was specifically tailored to encompass the full range of weather phenomena for the given location, while still providing annual averages that aligned with the long-term averages for that particular geographic area.
The load data for the building in Milan reveals significant variations throughout the year. Notably, the highest heating demands were observed during the winter months (January, February, and December), with substantial values reaching up to 920.70 kWh. These load patterns aligned with Milan’s continental climate, characterized by cold winters and warm summers. In contrast, the load data for the building in Messina reflected a substantially different climatic profile. The heating demands in Messina were considerably lower than in Milan, with minimal winter loads that almost reached zero. This discrepancy was due to Messina’s Mediterranean climate, featuring mild winters and hot summers.
The graphs in
Figure 8 depict meteorological variations between Milan and Messina, presenting a comparison of air temperature (°C) and solar radiation on the horizontal plane (kJ/h·m
2). These data provide insights into the availability of solar energy in their respective regions.
This analysis underscores the importance of tailoring HVAC systems to the specific climatic conditions of each location. In Milan, the focus should be on effective heating solutions for winter, while in Messina, a strong emphasis on cooling systems is essential to address the summer heat. These insights were crucial for optimizing energy efficiency and ensuring occupant comfort in both regions.
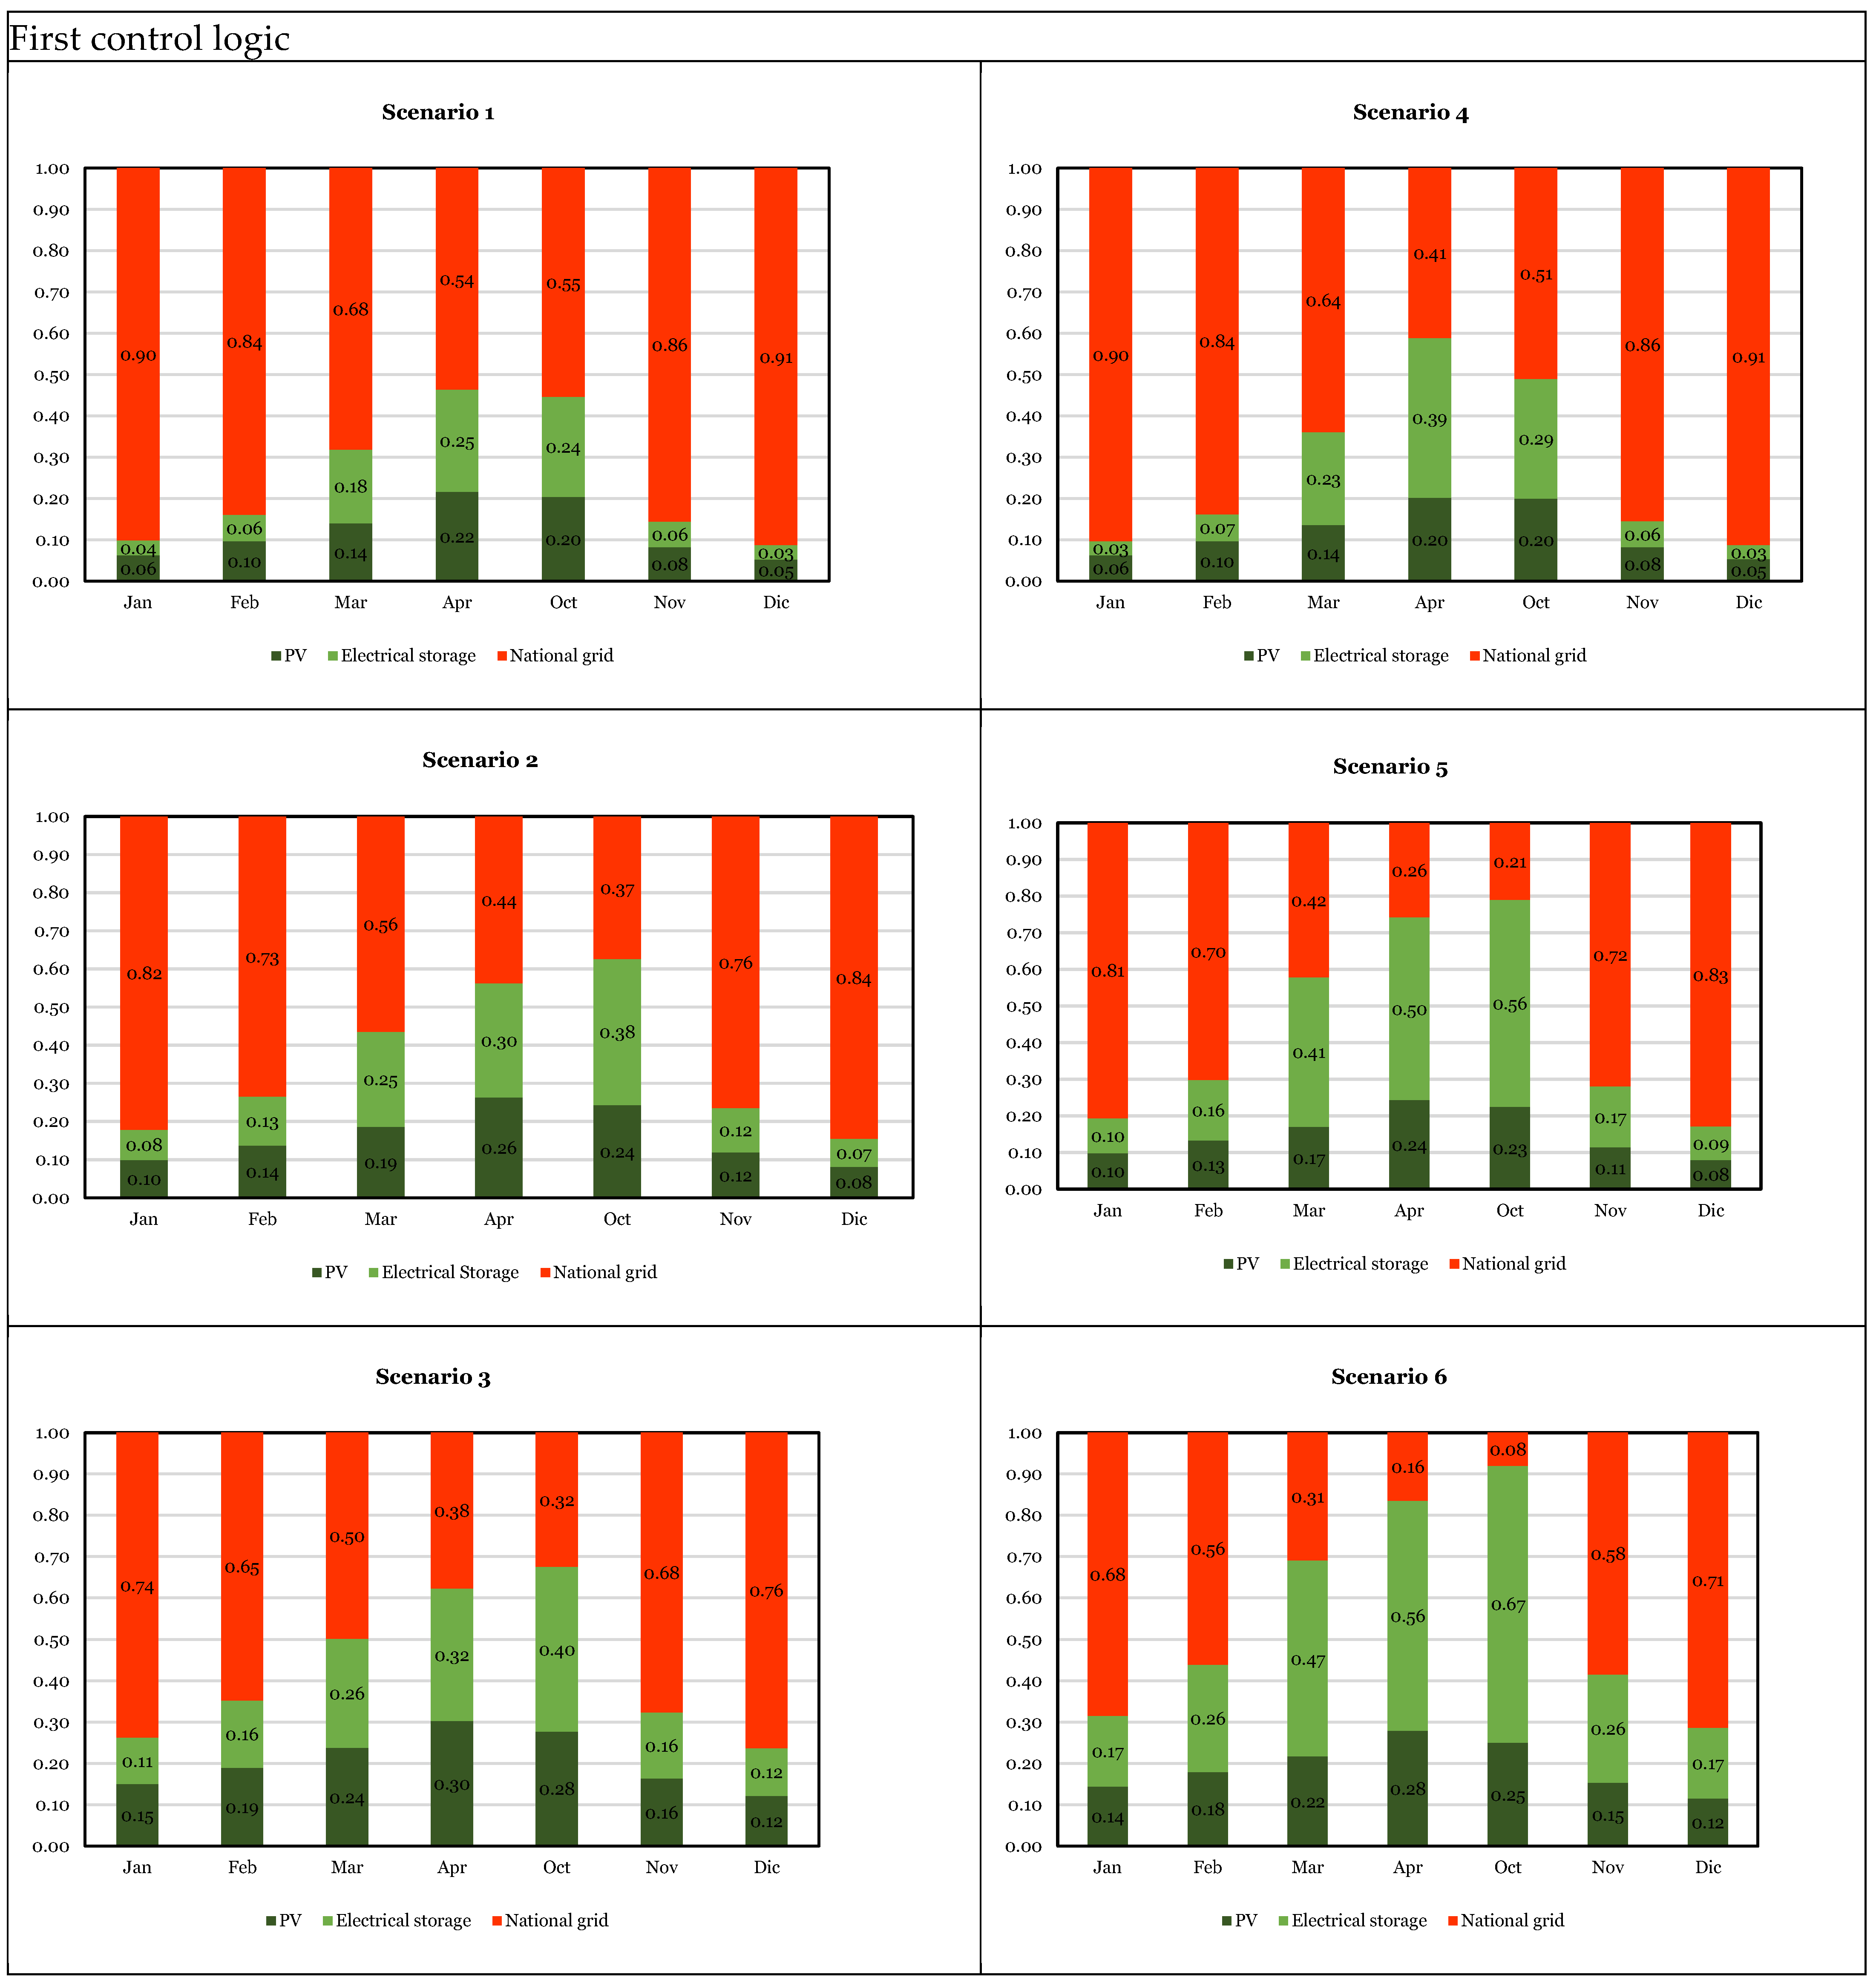
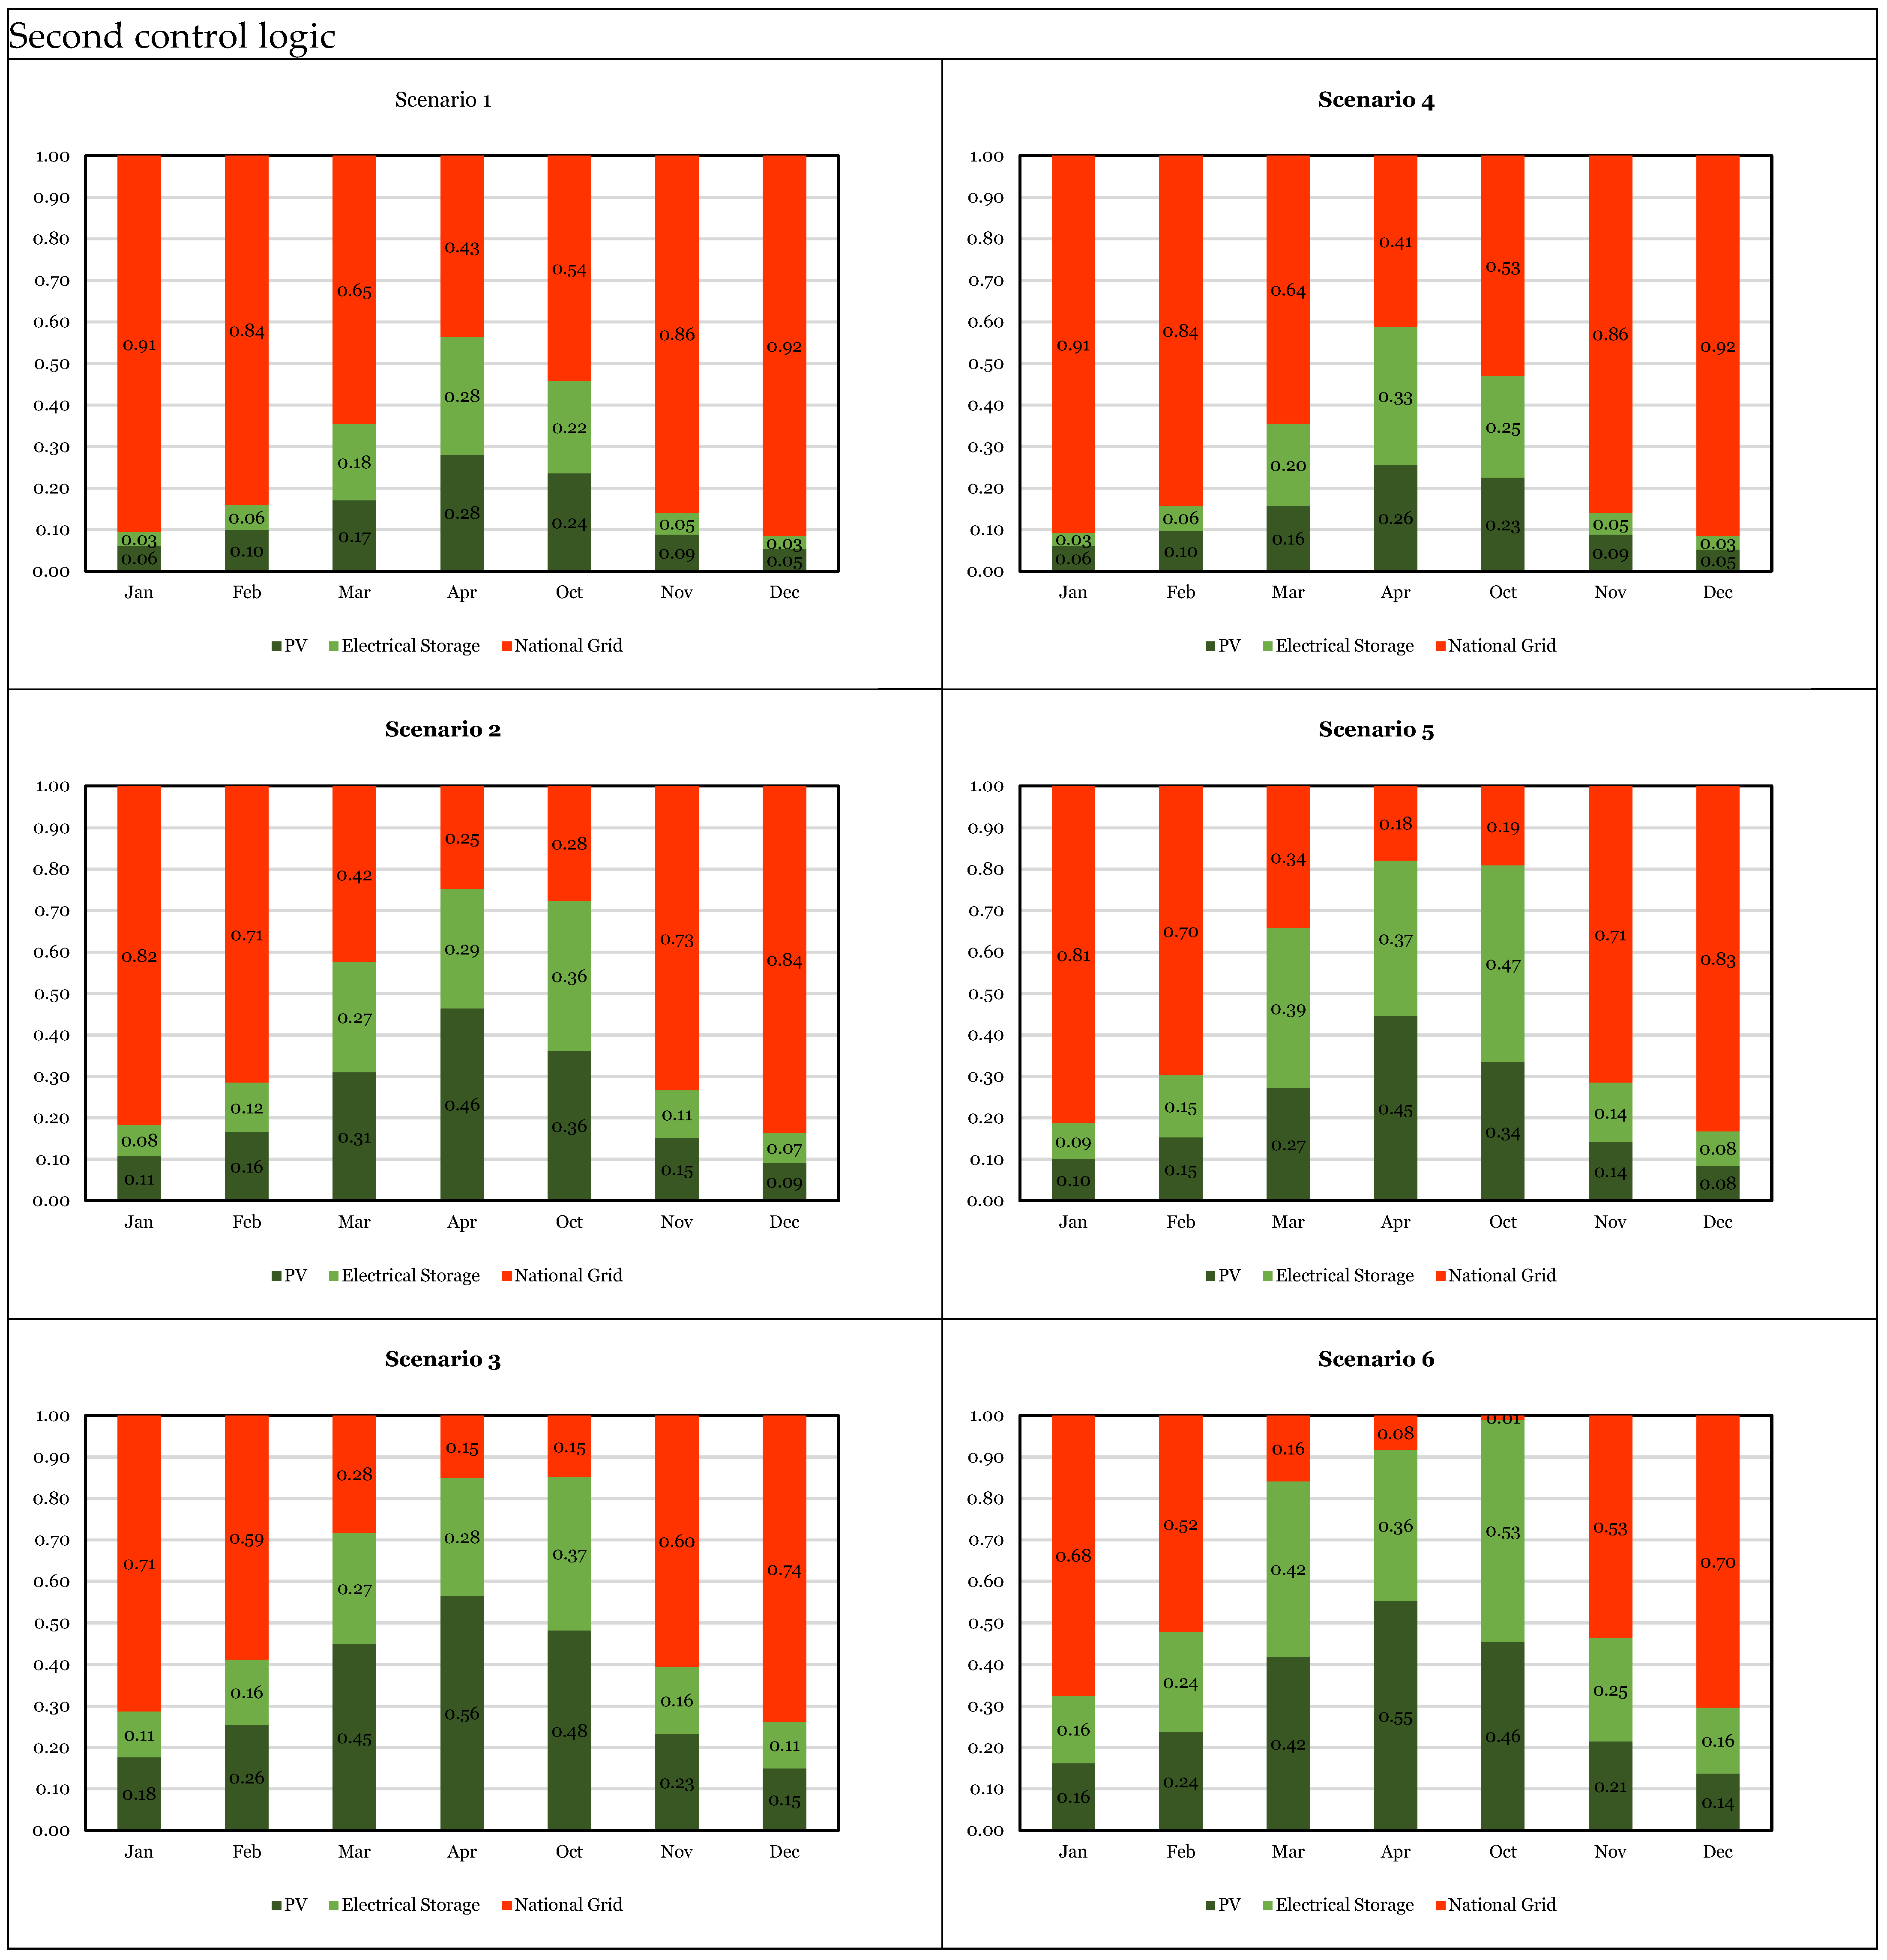
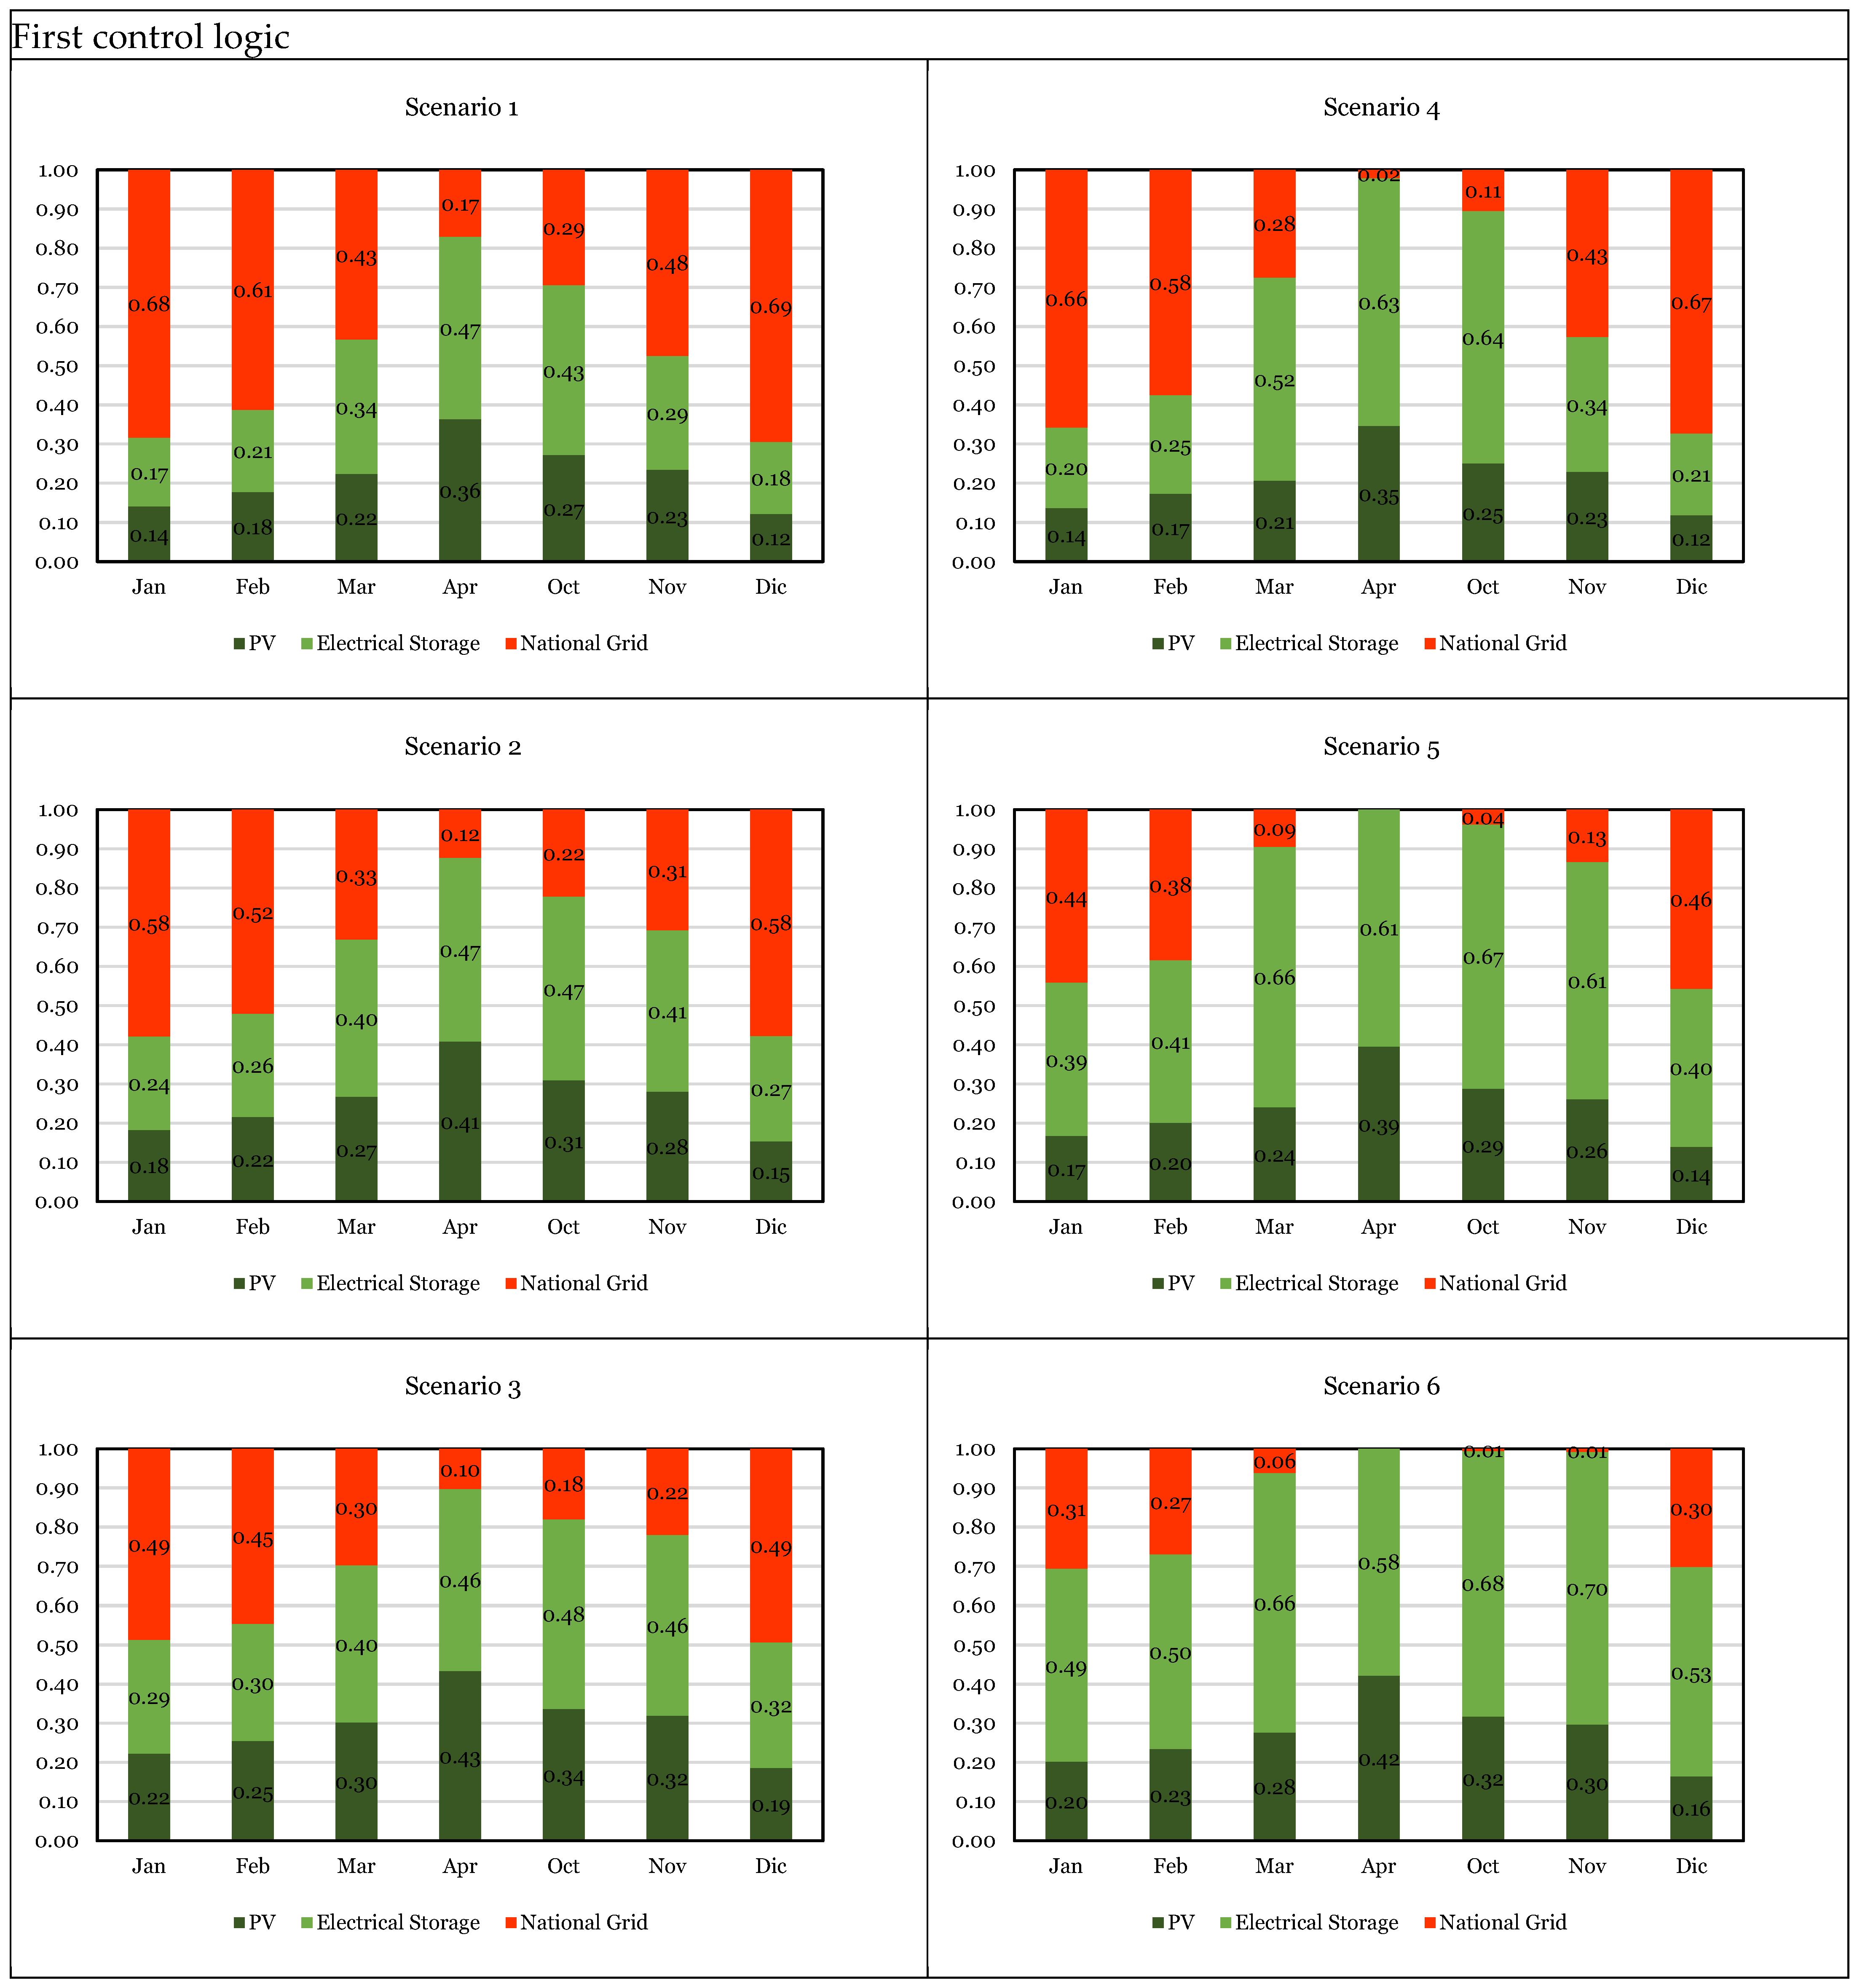
3.2. Self-Consumption and Electricity Supplied by the National Grid
This analysis investigated the impact of varying peak installed power (PV panels) and battery capacity on the system’s performance, with a focus on the heating season (from October to April). The key parameters evaluated include PV generation, electrical storage, electricity from the grid, PV self-consumption, and building power consumption. Six scenarios were considered: Scenario 1: 18 PV panels and 1.2 × 10⁴ Wh battery capacity. Scenario 2: 36 PV panels and 1.2 × 10⁴ Wh battery capacity. Scenario 3: 72 PV panels and 1.2 × 10⁴ Wh battery capacity. Scenario 4: 18 PV panels and 2.4 × 10⁴ Wh battery capacity. Scenario 5: 36 PV panels and 2.4 × 10⁴ Wh battery capacity. Scenario 6: 72 PV panels and 2.4 × 10⁴ Wh battery capacity.
Simulations were conducted for all the scenarios listed above, carefully examining both the application of the first and the second control logic. In these simulations, the behavior of the systems under different conditions was analyzed, considering both traditional management, based on the first logic, and the more advanced approach of the second control logic. This allowed us to evaluate how each system performed in terms of energy demand coverage, self-consumption, and the use of renewable sources in various scenarios and environmental conditions.
The following charts depict the percentage distribution of the electrical load provided by each component: the contribution from the direct photovoltaic system is shown in green, that of the electrical storage in light green, and finally, the national electrical grid in red.
3.2.1. Milan
From the graphs depicted in
Figure 9 (from Scenario 1 to Scenario 3), it can be seen that as the peak photovoltaic power installed increased, the percentage of energy demand coverage directly from the photovoltaic system and battery increased, consequently the dependence on the national grid decreased. In particular, the maximum percentage of dependence on the grid, recorded in December with 18 panels, decreased to 76% in December with 72 panels installed. By doubling the battery storage capacity (from Scenario 4 to Scenario 6), the use of photovoltaics and batteries increased proportionally to the number of photovoltaic panels. It is particularly noticeable that the benefits were lower in colder months and higher in April, October, and November. In October, with 72 panels and a battery capacity of 2.4 × 10
4 Wh, almost complete energy self-sufficiency was achieved compared to the national grid.
The diagrams in
Figure 10 (from Scenario 1 to Scenario 3) show the percentage of load managed by each component through the implementation of the second control logic, while the number of photovoltaic panels increased and a 1.2 × 10
4 Wh storage battery was used. Comparing it with the graph in
Figure 9, it can be noticed that for 18 panels, the situation remained essentially unchanged. However, the situation was different for the configuration with 36 and 72 panels. In the latter case, it was evident that the storage of excess photovoltaic energy as thermal energy can halve the usage of the national grid, especially in March, April, and October.
The charts in
Figure 10 (from Scenario 4 to Scenario 6) depict the percentage of load regulated by each component via the second control logic, as the quantity of photovoltaic panels increased and a 2.4 × 10
4 Wh storage battery was employed. By comparing the percentages in the graph shown in
Figure 10 with those in
Figure 9 (the same combination but with a different control logic), it can be deduced that in this case as well, a control logic that was more focused on managing the surplus energy produced did not lead to improvements to the configuration with 18 panels. In fact, in this configuration, excess production compared to demand rarely occurred. On the other hand, the situation was different compared to the other two combinations. A smart control strategy allowed for almost always satisfying 50% of the thermal load using renewable energy sources.
In
Figure 11, the annual percentages of self-consumed energy during the heating period are shown relative to the energy produced. It can be observed that this percentage decreased as the peak power installed increased. It was also evident that greater electrical storage capacity allowed for better utilization of solar radiation, resolving the problem of the mismatch between demand and solar radiation presence. Through the use of building envelope overheating strategies (second control logic), it was possible to increase the percentage of self-consumed energy by approximately 10%, maximizing the use of a clean energy source, except for a number of panels equal to 18.
Table 7 provides an annual breakdown of the percentage distribution of electrical load managed by various components within different scenarios. These scenarios were assessed under two distinct management logics: first control logic and second control logic. The results revealed notable variations in energy utilization patterns between the two logics. Under the first control logic, the systems exhibited a significant reliance on the national grid, ranging from 65% to 75% of energy sourced externally, highlighting substantial grid dependency. However, self-consumption rates were remarkable, surpassing 70% in certain scenarios, particularly during colder months. Conversely, the second control logic’ showcased a substantial reduction in grid dependence across all scenarios. The percentage of grid-sourced energy significantly diminished, occasionally dropping as low as 38%, emphasizing the efficiency of this logic in optimizing local energy utilization. Moreover, self-consumption levels remained notably high, exceeding 70% in several scenarios. These findings underscored the reliability of the second control logic’ in maximizing self-generated energy consumption while mitigating dependence on the national grid.
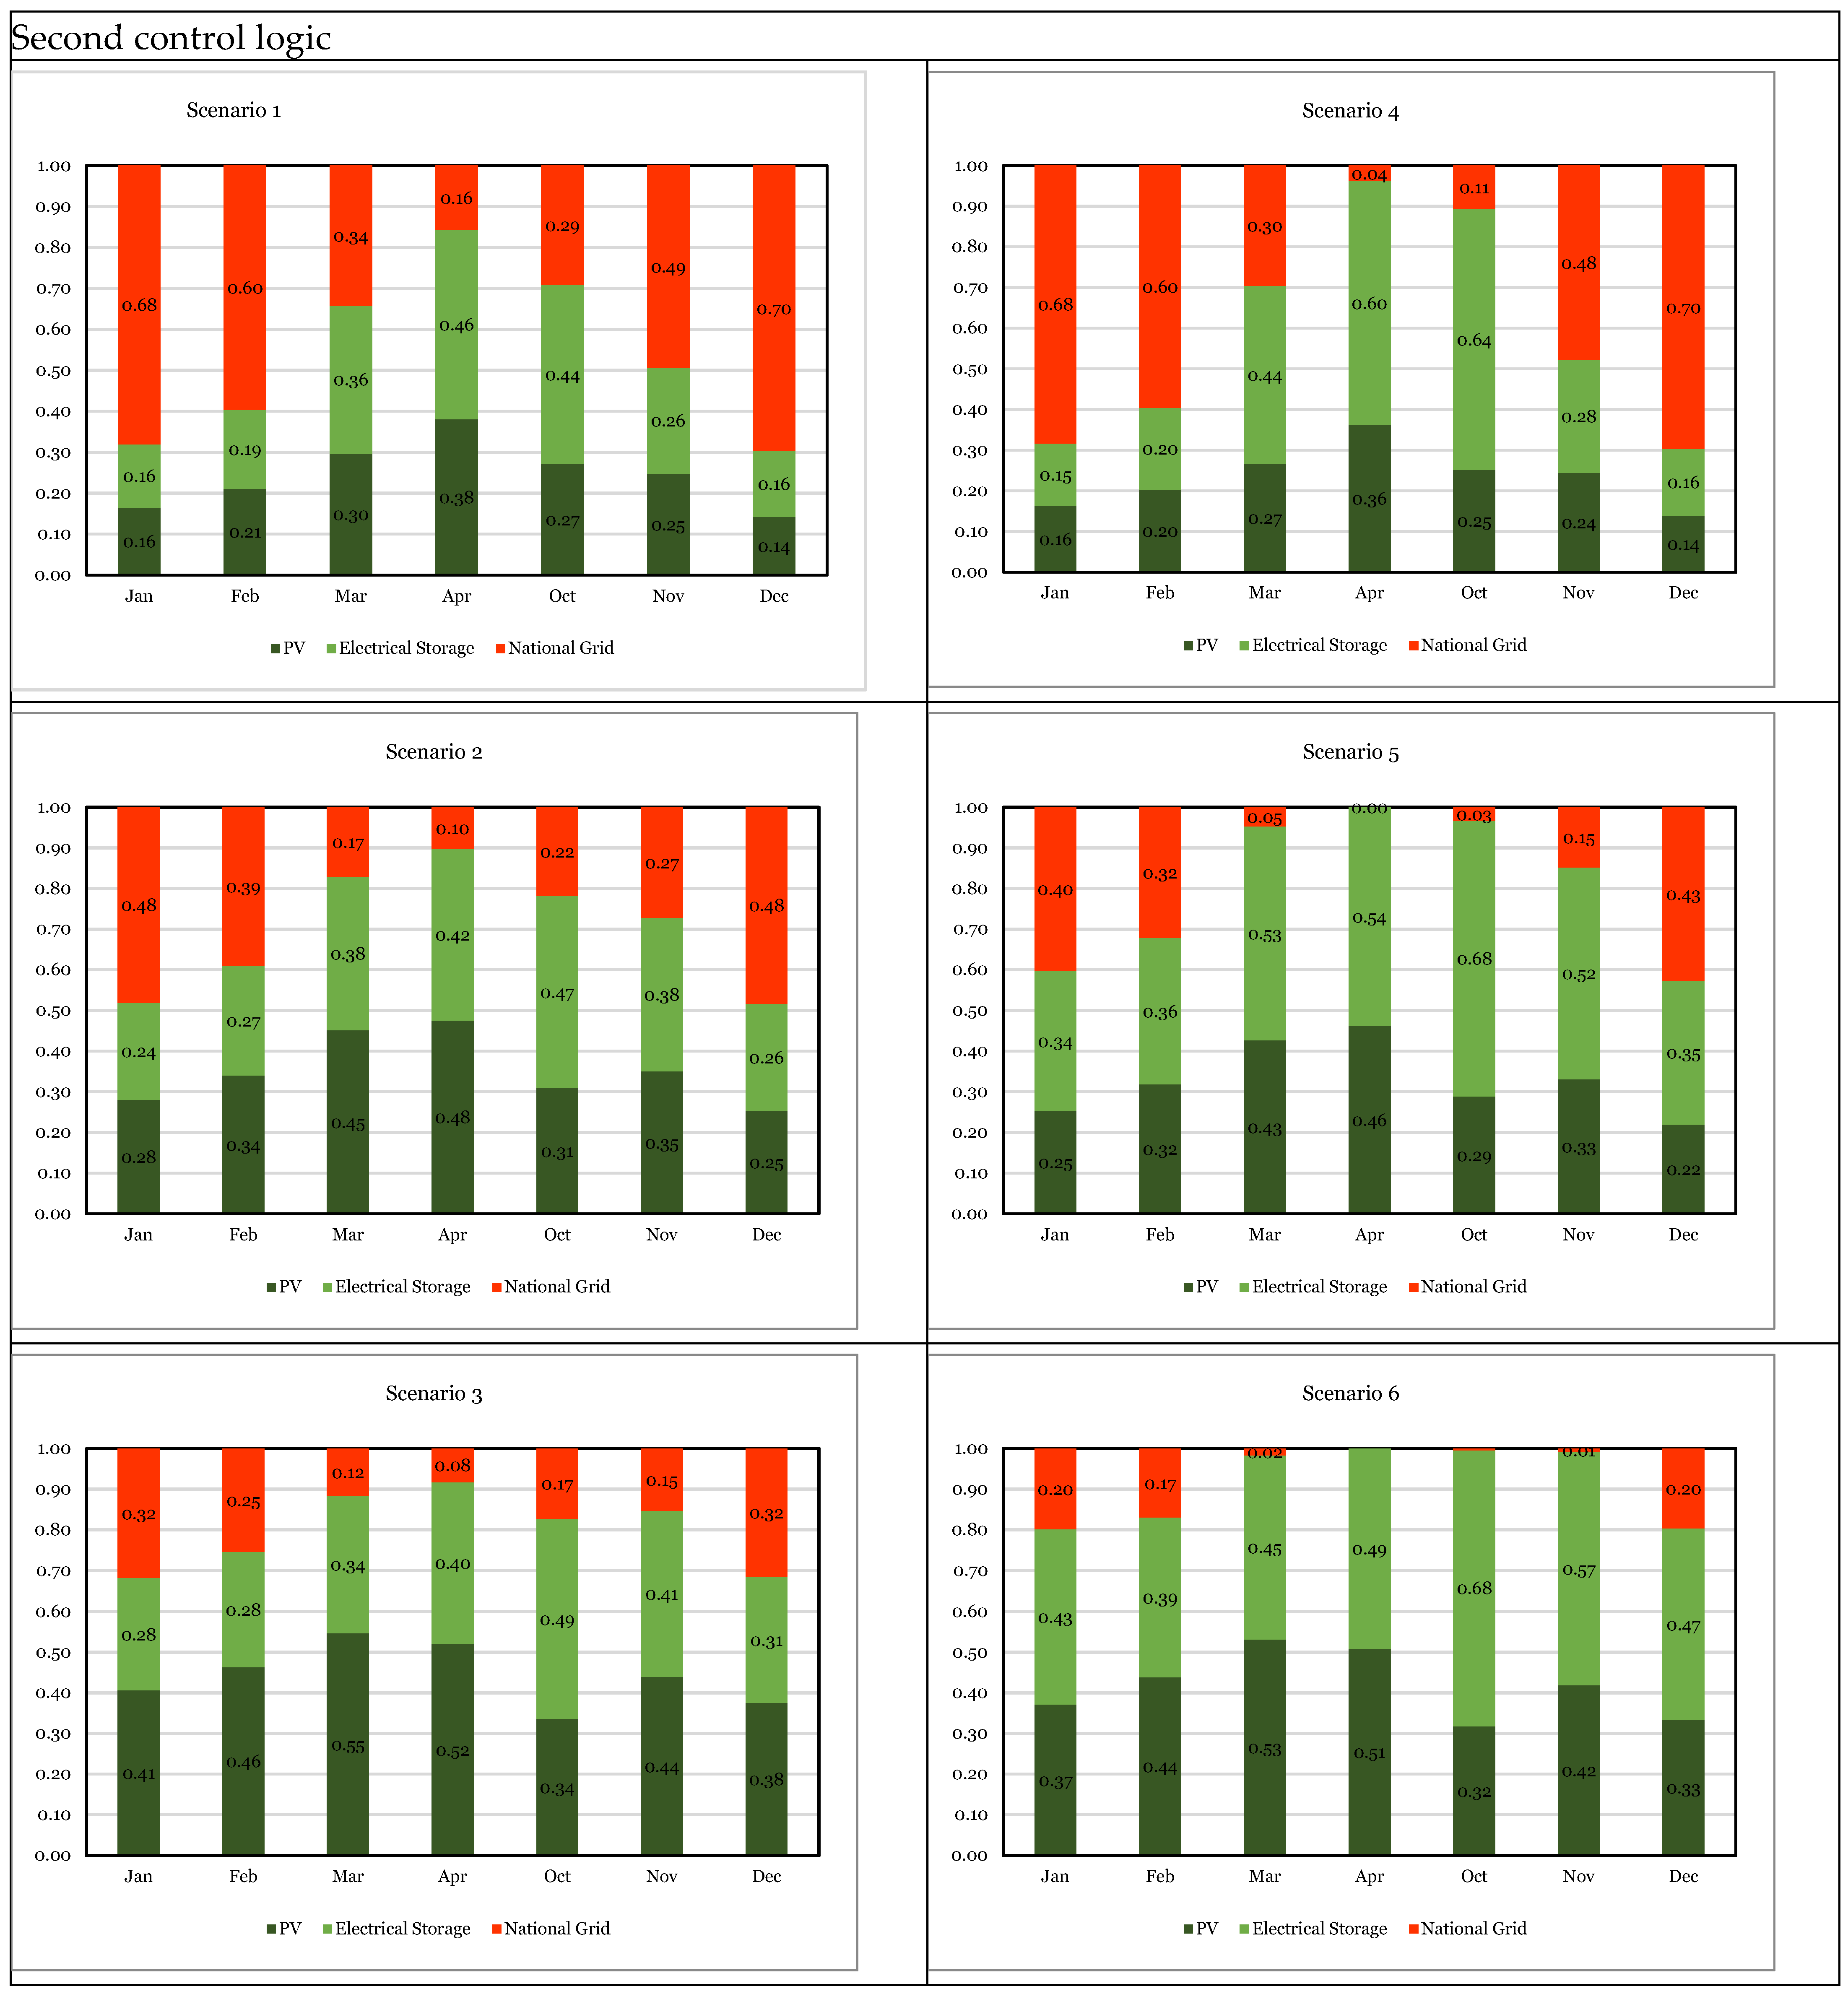
3.2.2. Messina
In the graphs of
Figure 12, the percentages provided by each component of the first control logic are shown concerning the simulations conducted in the city of Messina.
Similar to the simulations conducted in Milan, the data from the Messina simulations also revealed the impact of varying the number of photovoltaic panels while maintaining a constant 1.2 × 10⁴ Wh battery capacity (Scenario 1 to 3) and the influence of doubling the battery capacity (Scenario 4 to 6) with an increasing number of panels.
In the Milan simulations, the results showed that as the peak photovoltaic power installed increased, the percentage of energy demand covered directly by the photovoltaic system and battery increased. Conversely, the reliance on the national grid decreased. For instance, the highest grid dependence in Milan was observed in December with 18 panels, covering 75% of the energy demand. However, with 72 panels installed, this dependence dropped to 49% in January, underscoring the potential for greater energy self-sufficiency as photovoltaic capacity increased.
Similarly to Milan, in the Messina simulations, the trend of increasing photovoltaic power leading to greater self-sufficiency was observed. The percentage of load directly supplied via the photovoltaic system (represented by the green bars) and the contribution of the electrical storage system (light green bars) both grew, while the percentage of grid-supplied energy (red bars) decreased. Notably, in Messina, with 72 panels and a 2.4 × 10⁴ Wh storage battery, nearly complete energy self-sufficiency was achieved in October compared to the national grid, similar to the results obtained in Milan.
Regarding the simulations conducted in Messina during the heating period with the second control logic, the data (
Figure 13) exhibited a similar trend to what was observed in the Milan simulations. Increasing the number of solar panels from Scenario 1 to Scenario 3 while maintaining a constant battery capacity of 1.2 × 10
4 Wh, the percentage of energy supplied directly via the solar panels rose from 16% to 22%, while the battery contribution varied from 16% to 28%. Concurrently, energy drawn from the national grid decreased from 68% to 49%. These results underscore the second control logic’s capacity to promote greater grid independence, in parallel with the increase in solar panels.
Comparing these simulations with those of the first control logic in Messina revealed some significant differences. While the second control logic demonstrated reduced grid dependency, especially with a growing number of solar panels, the first logic maintained a higher percentage of energy supplied by the grid. Furthermore, the effect of doubling the number of panels and battery capacity, from Scenario 4 to Scenario 6, was less pronounced in the first logic, with a more modest variation in the energy drawn from the grid, ranging from 68% to 38%.
Table 8 provides a summarized presentation of the detailed outcomes derived from an analysis of the percentage distribution of electrical load across various scenarios, considering the implementation of two management logics. These data distinctly showcased the disparities between the two logics and their impact on the integration of renewable energy sources in the construction sector. Specifically, the second control logic emerged as the more efficient approach, demanding less energy from the national grid. For instance, in Scenario 1, it allowed for the direct satisfaction of 76% of the load through self-consumption, thereby reducing reliance on the national grid to 47%. This outcome holds profound significance in fostering enhanced integration of renewable energy sources within the building context, thereby aiding in diminishing the reliance on the national grid and optimizing the energy system’s efficiency.
However, it is noteworthy that the results obtained in Messina with the second control logic differed from those in Milan during the heating period. Despite an identical number of solar panels, regional and climatic variables led to considerable variations in the outcomes. This variation underscored the importance of adapting energy management strategies to local specifics to maximize self-consumption and reduce grid dependence.
Within the context of the two control logics under examination, these climatic differences dictated how energy was generated, managed, and utilized within the system. The first control logic was more effective in the mild climate of Messina, where heating demands necessitated lower thermal capacity and thermal storage could be employed more efficiently. Conversely, the second control logic was advantageous in Milan, where lower temperatures required greater thermal capacity, and thermal storage became vital for heating.
These differences hold considerable significance in the design and optimization of the energy system, as they impact efficiency, self-consumption, and grid dependence in a climate-specific manner.
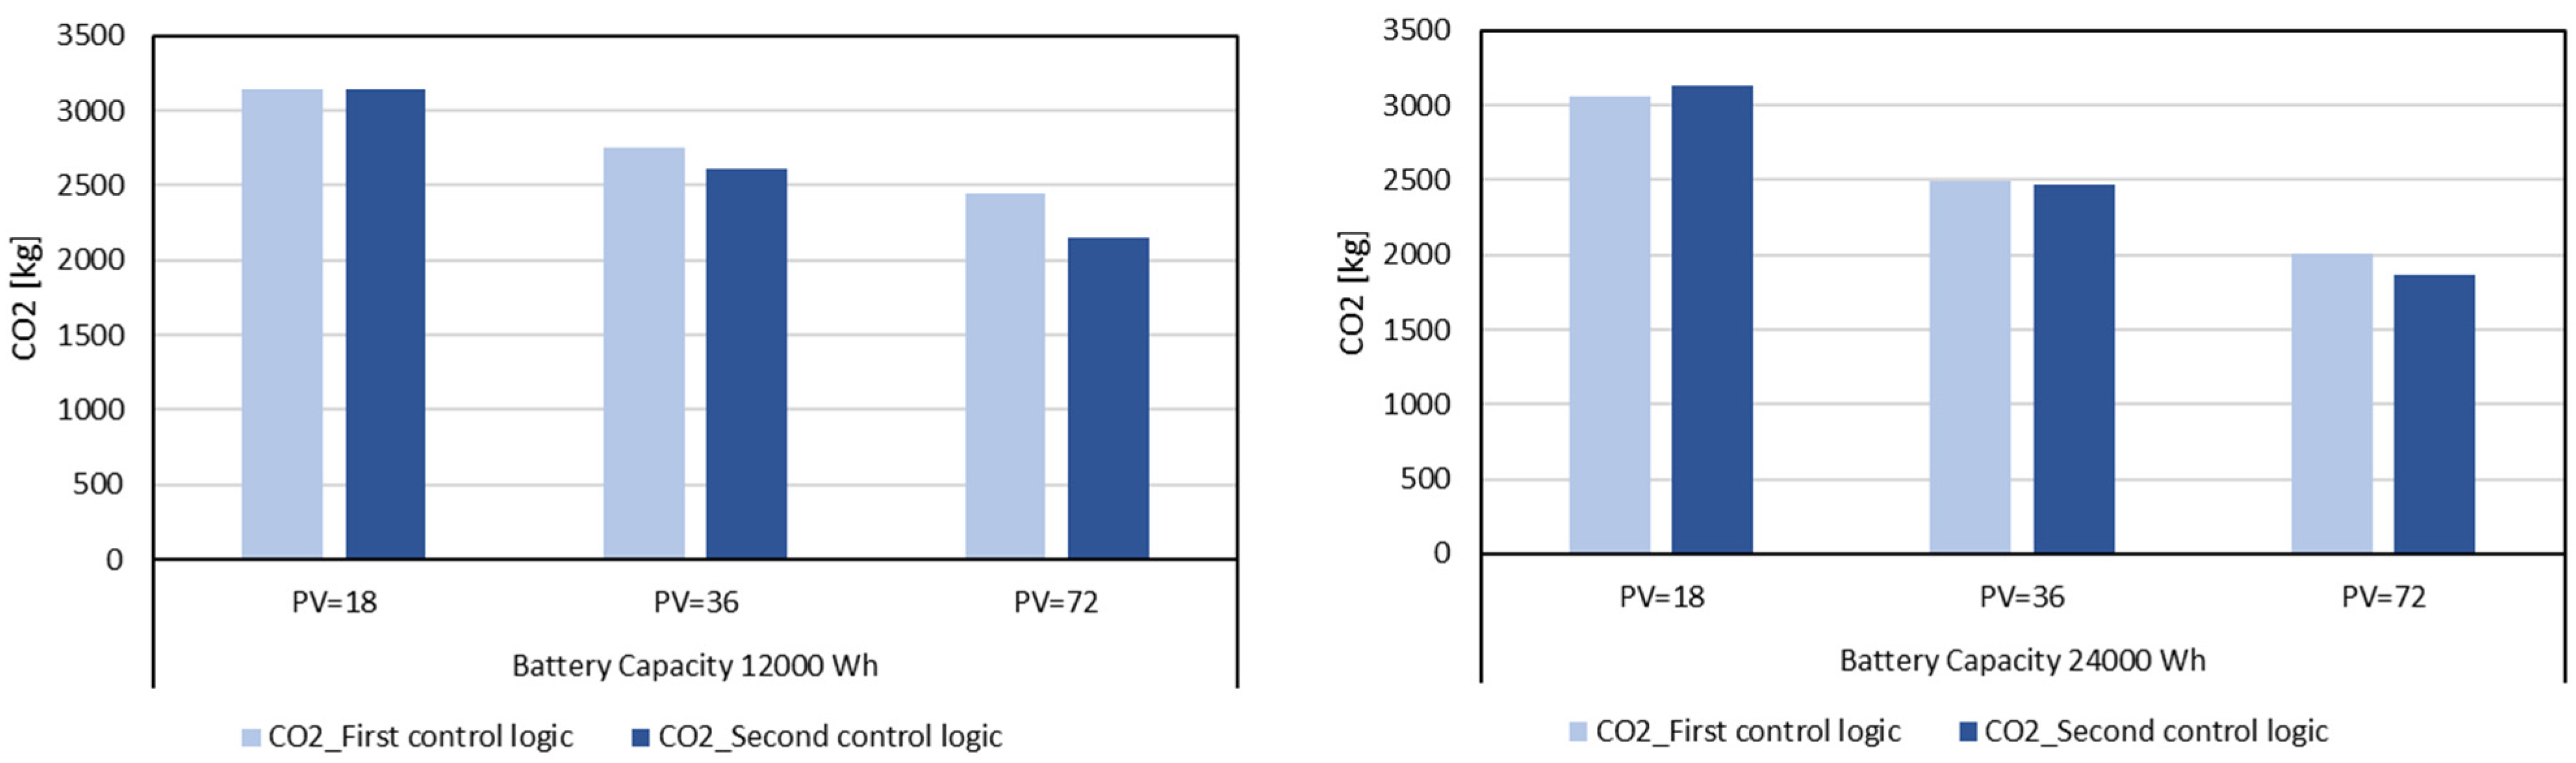
3.3. Calculation of CO2 Equivalent Emissions
In conclusion, the annual equivalent CO
2 emission percentages were calculated using the emission factors reported in
Table 6 for all analyzed configurations. The results are presented in
Figure 14 for Milan.
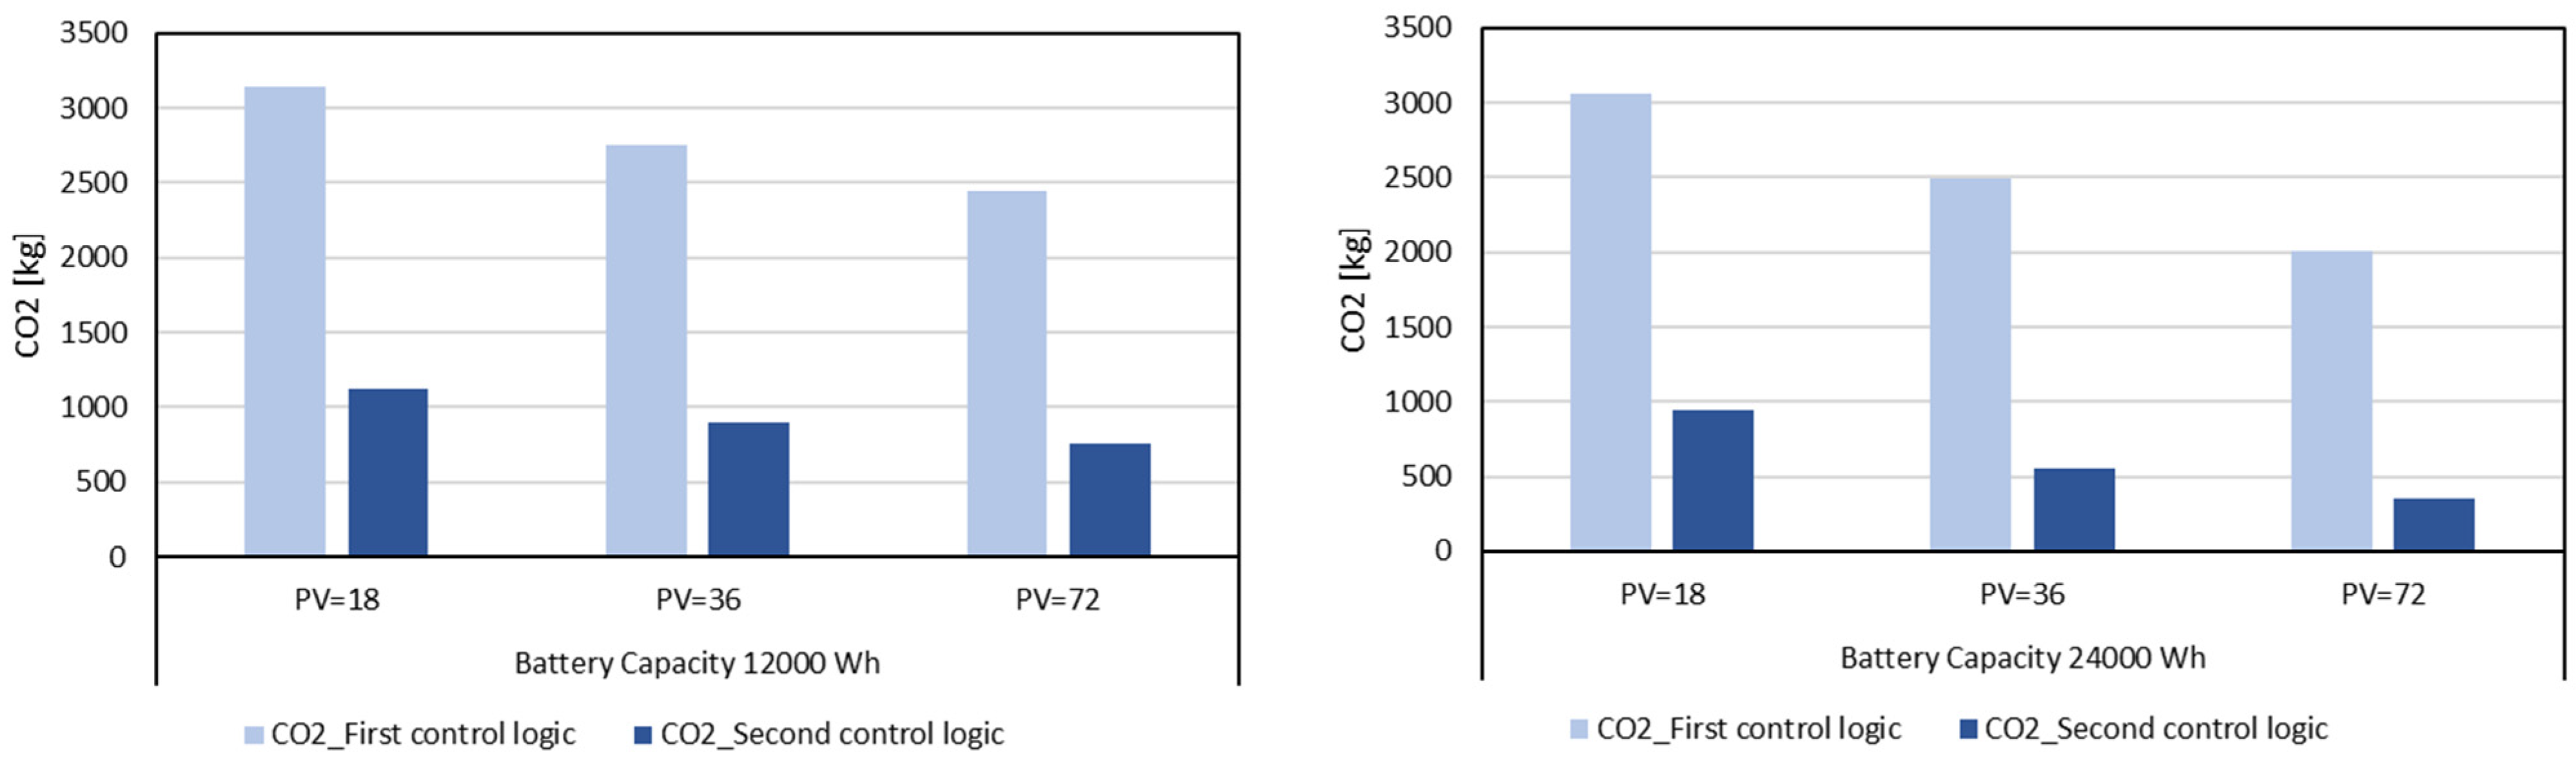
It was found that the highest CO2 production was achieved with 18 photovoltaic panels, regardless of battery capacity and control logic, with an amount of approximately 3.0 × 10³ kg of CO2. However, increasing the battery capacity and peak power installed led to a reduction in this production. On the other hand, the lowest CO2 production was observed with 72 photovoltaic panels and a 2.4 × 10⁴ Wh battery, using the second control logic. In this case, the CO2 production was around 1.86 × 10³ kg. This represents a significant reduction compared to a traditional heating system with a gas boiler, which produces approximately 5.0 × 10³ kg of CO2.
The graphs in
Figure 15 display CO
2 emissions observed during simulations conducted in Messina across various scenarios managed using two distinct control logics: the first traditional logic and the second “smart” logic. A comparative analysis of these two strategies revealed that the second “smart” logic led to a substantial reduction in CO
2 emissions compared to the traditional logic across all considered scenarios. In the initial three scenarios (Scenario 1, 2, and 3), the adoption of the second “smart” logic resulted in reductions of CO
2 emissions by 8%, 23%, and 36%, respectively, in comparison to the traditional logic. This trend continued in subsequent scenarios (Scenario 4, 5, and 6), with reductions in CO
2 emissions amounting to 0.1%, 13%, and 37%, respectively.
The data highlighted that the second “smart” logic had a significant impact on reducing CO2 emissions, particularly in the first three scenarios. These findings underscored the importance of implementing advanced control strategies to enhance energy efficiency and mitigate environmental impact, especially in climatic contexts akin to Messina.
3.4. Domestic Hot Water Supplied by the Solar Collectors
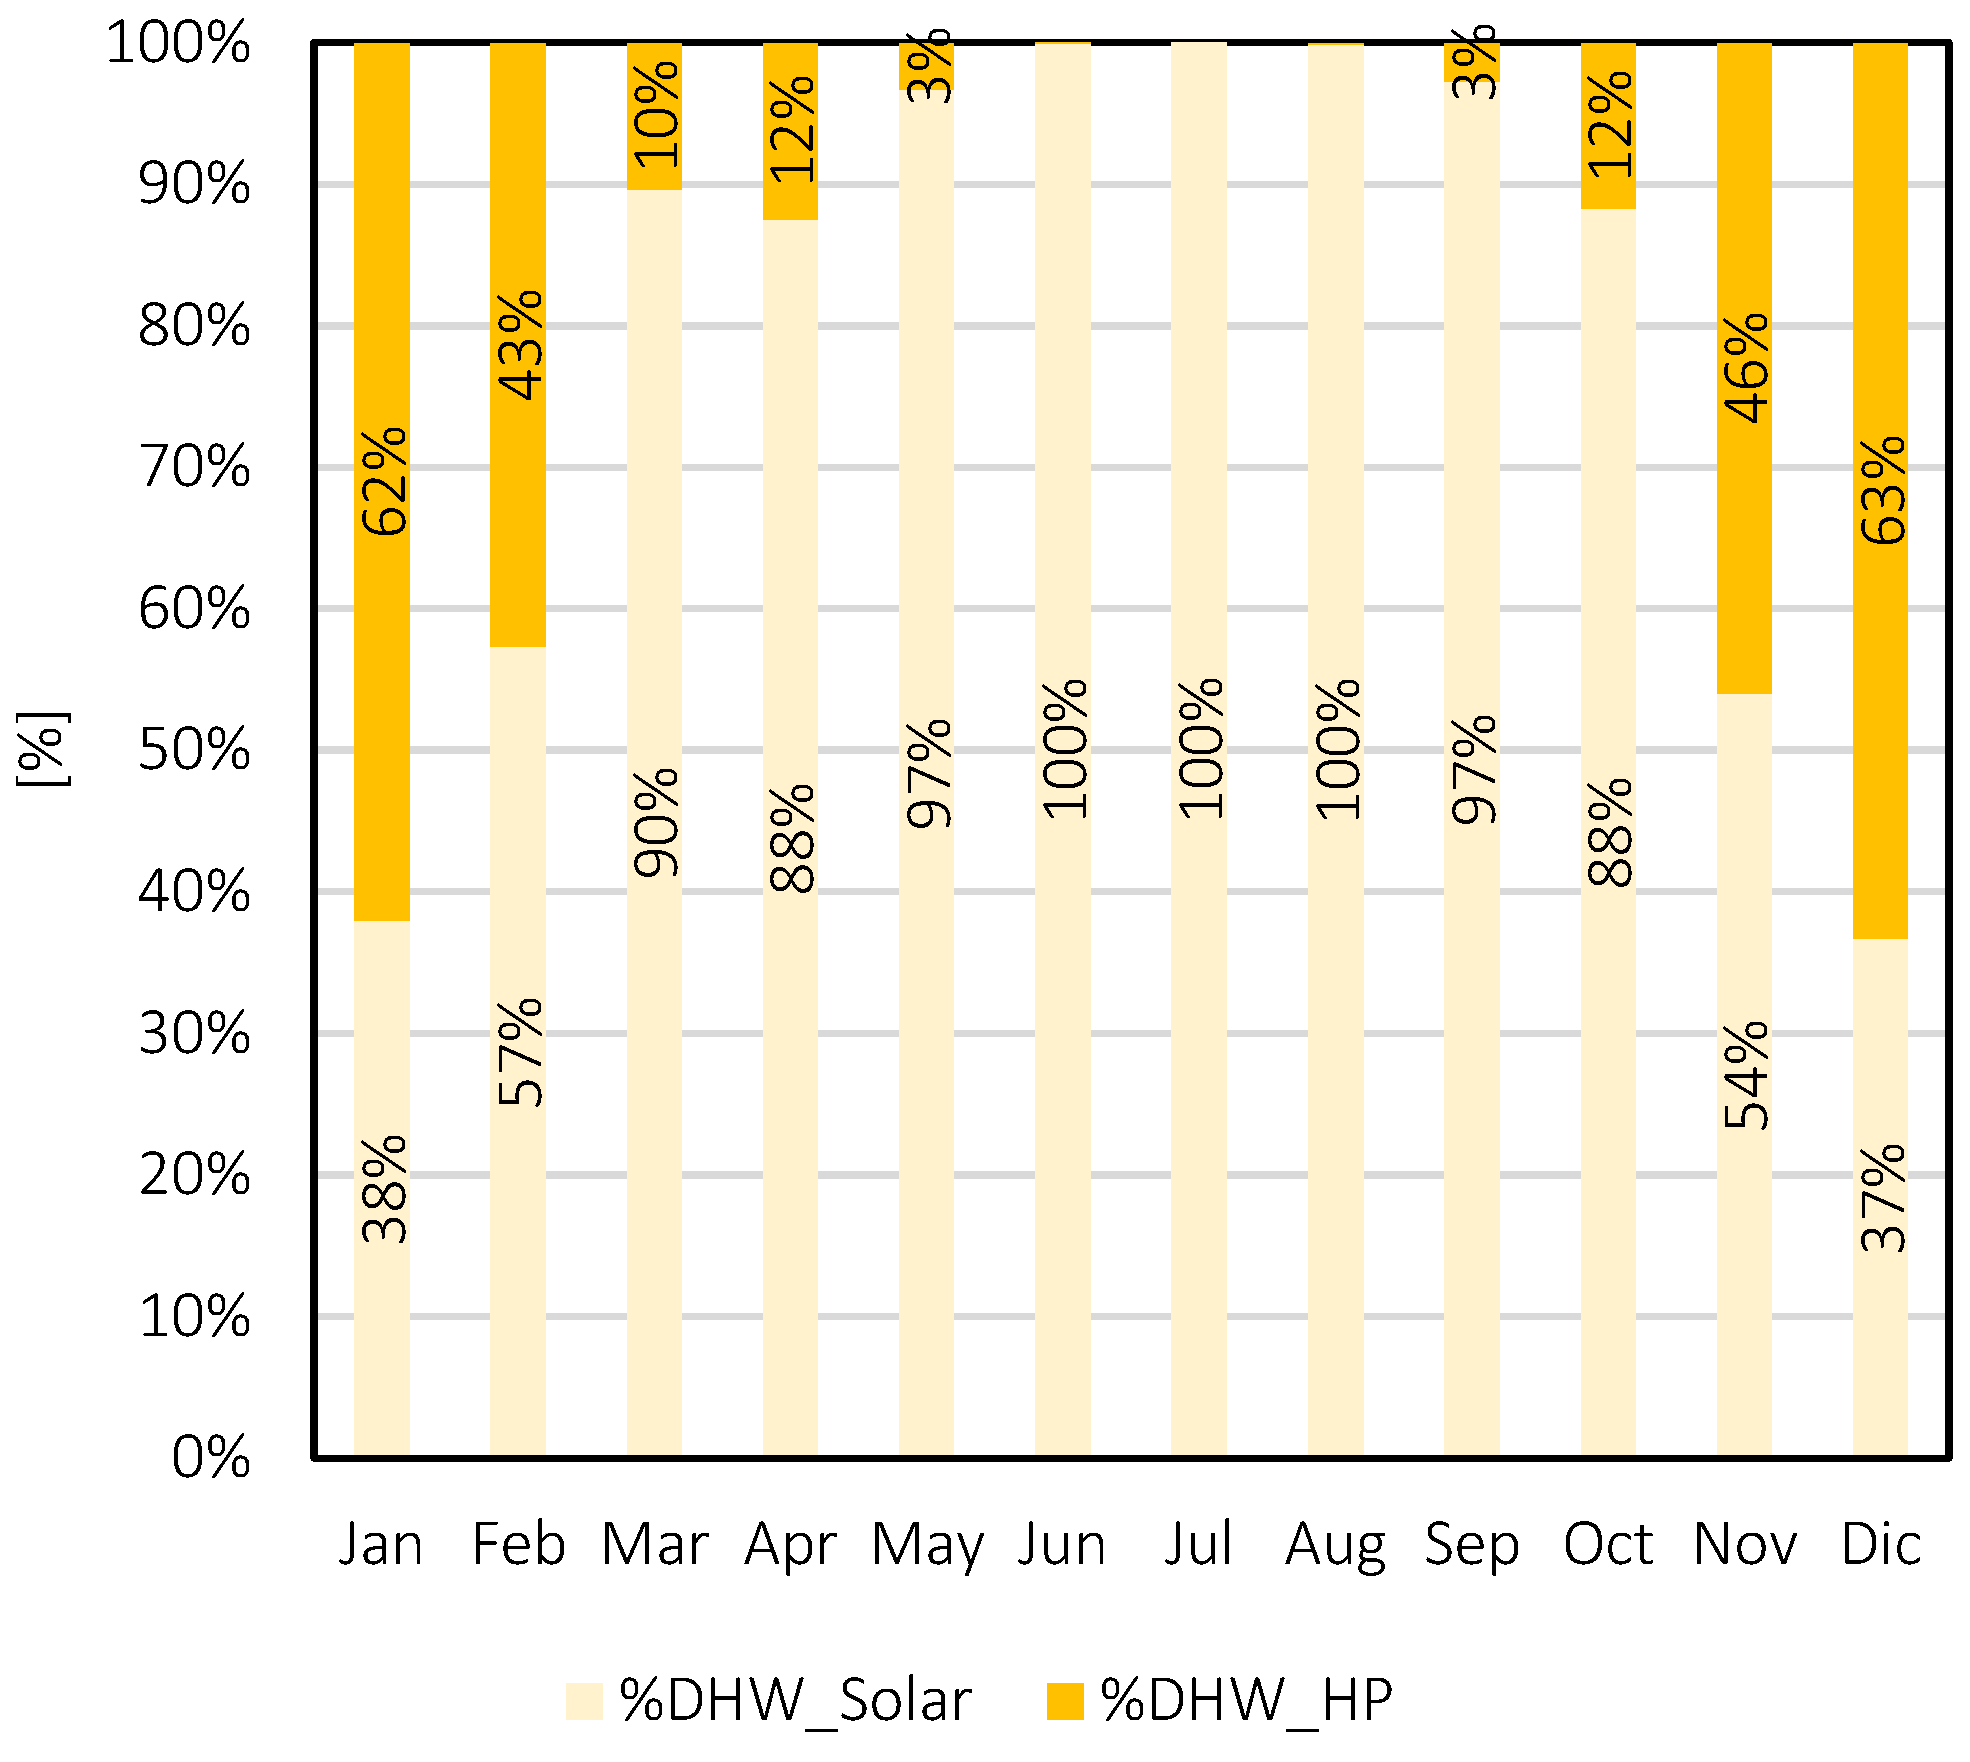
During the summer season, the thermal storage system was used to store chilled water for cooling purposes and cannot be utilized for DHW. For this reason, a supplementary 300 L thermal storage unit was employed with solar collectors to provide DHW. The solar storage output was combined with a cooler flow rate from the supply network to attain a temperature of 45 °C for household usage. In the winter season, when solar radiation was insufficient to meet DHW demands, the heat pump took energy from the thermal storage system, with the solar collectors being given priority.
In
Figure 16, the graph presents the coverage percentages for each component throughout every month of the year in the city of Milan. Furthermore, in
Figure 17, an analogous graph is provided, which pertains specifically to the city of Messina.
In Milan, the data in the table showed that the use of solar collectors covered approximately 38% to 57% of the demand for DHW. However, the city relied more on heat pumps, which satisfied between 43% to 62% of the demand. This suggested that in Milan, the efficiency of solar collectors in providing hot water was relatively lower compared to Messina. The colder climate in Milan led to a higher dependence on heat pumps to heat water, resulting in less reliance on solar collectors.
Turning our attention to Messina, the data indicated that solar collectors were significantly more effective in covering the demand for hot water. In Messina, the use of solar collectors ranged from 74% to 100% in meeting the demand, highlighting the city’s ability to harness solar energy efficiently. The use of heat pumps in Messina remained notably low, ranging from 0% to 26%. This outcome underscored the favorable climate conditions in Messina, which allowed for extensive utilization of solar energy and a reduced reliance on heat pumps for water heating.
4. Conclusions
In this study, the energy and environmental implications of a system that combines the use of an air-water heat pump with photovoltaic panels and electric and thermal storage systems were analyzed. Performances were compared between two different control strategies, the first commonly used for the management of air-conditioning systems, and the second one specifically conceived to maximize the employment of renewable solar sources.
A comprehensive parametric analysis was conducted to determine the optimal configuration for energy management strategies, considering various parameters such as thermal storage volume, the number of photovoltaic panels, and battery capacity. Increasing peak photovoltaic power enhanced direct coverage of energy demand by the photovoltaic system and battery, reducing reliance on the national grid. Comparative analysis of traditional and advanced “smart” control logics underscored the latter’s efficiency in optimizing local energy utilization, significantly reducing grid dependence. The “smart” logic maximized self-generated energy consumption, mitigating national grid dependence. CO2 equivalent emissions analysis revealed substantial reductions, especially in initial scenarios, emphasizing the advanced control’s role in enhancing energy efficiency and environmental sustainability in climates akin to Messina.
Evaluation of domestic hot water supply highlighted differences between Milan and Messina. In Milan, solar collectors covered 38–57% of demand, while heat pumps satisfied 43–62%. Conversely, Messina exhibited higher solar efficiency, covering 74–100% of demand with less reliance on heat pumps. Results underscored local climatic influence on solar energy effectiveness for water heating.
In conclusion, the study emphasized tailoring energy management to regional climates. Advanced control logic benefits energy efficiency, reduces carbon emissions, and promotes sustainable energy use in Milan and Messina. These insights can guide optimal energy systems and enhance environmental sustainability in diverse climatic contexts.
5. Future Research Directions
Building on the findings of this study, several potential avenues for future research emerge:
Performance in Cooling Demand: investigating the system’s performance concerning cooling demand is an intriguing area for future research. Given the substantial variations in heating and cooling requirements across different climates, understanding how these systems can efficiently provide cooling, especially in regions with high cooling demands, is essential.
Integration of Renewable Energy Sources: exploring the integration of various renewable energy sources, such as wind and geothermal energy, in addition to photovoltaic systems, can provide insights into further reducing the carbon footprint and enhancing energy efficiency. Assessing the interplay between these sources and their impact on system performance is a promising research direction.
Seasonal Energy Storage: the development of advanced energy storage solutions tailored to seasonal variations in energy supply and demand is critical. Future studies could investigate the feasibility and effectiveness of such long-term storage options, ensuring a reliable and continuous energy supply throughout the year.
User Behavior and Adoption: understanding user behavior and the factors influencing the adoption of renewable energy systems is essential for broader implementation. Future research could focus on user-centric studies to identify barriers, motivations, and strategies for increasing the adoption of sustainable energy technologies.
Smart Grid Integration: as smart grid technologies continue to evolve, assessing the impact of integrating residential renewable energy systems into these grids is crucial. Investigating the benefits, challenges, and optimal strategies for enhancing grid resilience and energy management is a promising area of study.
Economic and Policy Analysis: conducting economic analyses, including cost-benefit assessments and payback periods, can provide valuable insights into the financial feasibility of renewable energy systems. Additionally, examining policy incentives and regulations that promote the adoption of sustainable technologies is of great relevance.


