1. Introduction
1.1. Research Background
Korea’s energy import dependence rate is 92.8%, and 18.5% of the GDP is spent on purchasing overseas energy (2020) [
1]. In addition, the construction of new thermal power plants, such as coal-fired power plants, has been avoided to achieve the Nationally Determined Contribution (NDC) agreed upon in the Paris Agreement [
2]. This situation has led to high-efficiency energy production and active development of energy-reducing technologies across all industries. As a result in the building sector, renewable energy is mandatory for all buildings from 2025 [
3].
In Korea, subsidies and technical support have been provided to expand the dissemination of nine renewable energy sources, including solar power, solar heat, and wind power, and three new energy sources, including fuel cells, in addition to the government’s support on energy production management (2022).
Table 1 shows the energy produced through new and renewable energy sources in Korea over the last decade; solar thermal, ocean, and hydropower have undergone almost no changes [
4]. In contrast, energy production by solar photovoltaics (PV), wind power, geothermal, and fuel cells have continuously increased, and the dissemination of hydrothermal and integrated gasification combined cycle (IGCC) have begun relatively recently. In particular, the proportion of the power generated by solar PVs increased from 13.2% in 2011 to 56.9% in 2020.
1.2. Zero Energy Building (ZEB) Certification
In Korea, a detailed roadmap for stepwise mandatory zero-energy construction was announced in June 2019, and the legal basis for mandatory zero-energy construction certification was developed by revising the Green Building Act. Since then, a program for mandatory ZEB certification has been implemented in stages for public buildings. ZEB is defined as a green building that minimizes the energy load required by the building and minimizes energy requirements through power generation using renewable energy. From 2020, new public buildings with a total floor area of more than 1000 m
2, public buildings with a total floor area of more than 500 m
2, general buildings with a total floor area of more than 1000 m
2, and apartment buildings with more than 30 households will be included in the program. From 2030, all buildings with a total floor area of more than 500 m
2 will be included. As the realization of 100% zero energy construction in high-density urban development leads to prohibitive costs, a stepwise certification from Class 1 (100% independence rate) to Class 5 (20% independence rate) has been performed according to the ratio of new and renewable energy production to energy consumption, i.e., the energy independence rate. This system is intended to consider the market situation and introduce the concept of ZEB, which has associated cost limitations compared to technology, into the social system. The following two conditions are required for certification in addition to the above energy independence rate. First, the building energy efficiency rating must be maintained at 1++ or higher, with a primary energy consumption of less than 90 kWh/m
2/year for residential buildings and less than 140 kWh/m
2/year for non-residential buildings (
Table 2). Next, a building energy management system (BEMS) or electronic meters for remote readings must be applied at six or more locations. These criteria indicate that building energy consumption must be reduced and power generation must be simultaneously increased.
1.3. Research Purpose
As can be seen from
Table 1, solar PVs have been the most widely applied new and renewable energy source in Korea. As the floor area is smaller than the total facade area for high-rise buildings, applying PV panels only on rooftops imparts limitations in increasing power generation. As it is easy to acquire solar radiation for high-rise buildings due to the large facade area and fewer surrounding obstacles, installing building-integrated photovoltaics (BIPV) on building facades effectively improves the energy independence rate. The acquisition of high solar radiation through the facade windows of high-rise buildings, however, increases the cooling energy consumption of the buildings. Therefore, it is necessary to install efficient shading for transparent windows to control the inflow of high solar radiation. However, the g-value, the solar heat gain coefficient (SHGC = τ(Transmittance) + q
i(secondary heat transfer)), significantly varies depending on the position and type of shading installed. When the g-values are 0.12 and 0.6 under the same outdoor air temperature conditions, the indoor temperatures are 30 °C and 35 °C, respectively, indicating the significance of the g-value on the indoor temperature. As the value increases, cooling energy consumption increases [
5]. Therefore, achieving both an increase in solar PV power generation and a reduction in the inflow of solar radiation can be viewed as essential in improving the energy independence rate of a building.
The power generation efficiency of PV panels varies greatly depending on the installation angle. This study proposes an L-shaped BIPV, which recycles the inherent reflectance of the PV panel surface to improve the power generation efficiency due to the installation angle. Solar PVs are generally installed on the front of a window’s upper part and protrude as external sunshades [
6]. On the other hand, the new concept, the L-shaped solar PV installed on the upper part of a window, is referred to as a bidirectional reflectance photovoltaic (BRPV). It serves two functions: it increases solar PV power generation and blocks direct solar radiation blocking by shading. The protruding structure of BRPVs can secure additional power generation areas beyond the rooftop as it is applied to the upper part of a window and is expected to contribute to a reduction in the g-value by generating shadows, thereby imparting external shading. This study aims to quantitatively analyze the effects of an increase in power generation by new and renewable energy and a reduction in cooling energy consumption on the energy independence rate of a school building.
A school was selected for the simulation to verify the technology’s effectiveness because buildings of this type usually have very short cooling and heating periods due to school vacations during the summer and winter. Therefore, the building’s annual energy consumption per unit area is low. A school was selected because power generation from renewable energy significantly impacts the energy independence rate in these types of buildings.
2. Research Method
This study sought to accurately reflect the special characteristics of school buildings. Simulation data, among the building’s energy usage, cooling, heating, and ventilation, apply calculated values. The lighting and hot water consumption apply actual measured values, and the power generation by PVs and BRPVs apply measured values. Simulations using this approach provide more accurate information on changes in the energy independence rate. In general, the impact of fixed external awnings on building energy consumption can be evaluated through simulations as it is an evaluation of the shading due to the geometric structure of the awning. However, no current simulation model can evaluate the power generation of reflective solar power systems, such as BPRVs. Accordingly, it was necessary to present a new evaluation methodology for BRPVs.
In order to verify the solar-radiation-blocking effect of BRPVs on the external shading, the building’s cooling/heating load and thermal performance were simulated using the DesignBuilder tool. Due to issues with the appropriateness of input values for lighting and hot water supply energy in the school building, actual measurements were applied. Electricity production by PVs and BRPVs used actual measurements of the power generation of the PV array at every minute for one year starting in May 2019.
Applying this approach, three stages of simulation were possible. Case 1 (Stage 1) is a simulation of a universal school building in Korea. The simulation result reflects performance in accordance with the latest Korean building energy conservation design standards for 2022, and renewable energy and external shading were not applied. Case 2 (Stage 2) applies Case 1 standards but reflects the result of solar PVs installed at a 30-degree slope on the rooftop. It is a simulation of the most common school building design in Korea. Lastly, Case 3 (Step 3) applied Case 2 standards and reflected the result of applying the BRPV proposed in this study. As a result, the building’s solar power generation capacity increases, and at the same time, the building’s energy use is reduced by reducing the cooling load due to the shading effect of BRPVs. The difference in the application range for each simulation stage can be seen in
Figure 1.
3. Previous Studies Related to the Improvement in Solar PV Power Generation and BRPV
3.1. Basic Knowledge Concerning Solar Incidence Angles and Power Generation
The most important parameters for the efficiency of PV modules are the solar altitude, which varies by season and time, and the PV module installation angle [
7,
8]. The power generation efficiency of the horizontally and vertically installed panels also differs depending on the latitude [
8]. Seoul is geographically located at 37°33′ N, 126°59′ E. Thus, 100% maximum efficiency occurs at an installation angle of 30° to 35° toward the south. Based on this, 89% for horizontal installation and 63% for vertical installation efficiency is achieved. In a city where the latitude is approximately 4° lower with a similar longitude, the maximum power generation efficiency is 95% for horizontal installation and 54% for vertical installation with a 30° installation angle toward the south.
However, the underlying reason for the difference in the power generation efficiency between the two cities is the angle of incidence (qi). At the same longitude, the latitude difference between the two cities is 4°09′. Therefore, based on the optimal installation angle of 30°–35°, cities with lower latitudes have a higher solar incidence angle, which is why the efficiency of horizontal panels is higher than that of Seoul, and the efficiency of vertical panels is relatively higher in Seoul, where the solar incidence angle is lower.
Another reason is the reflectance of the panel glass surfaces. The reflectance of the glass surface increases as the qi increases. As the qi decreases, the reflectance of the glass surface decreases while the transmittance increases. In other words, the angle of incidence, qi, is highly related to the reflectance of the glass surface. Danks evaluated the reflectance of the most common 6 mm clear glass according to the angle of incidence and observed that the surface reflectance ranged from 8% to 10% for installation at 40°, over 15% at 60°, and over 50% at 80° [
9]. This phenomenon also occurs on smooth PV surfaces. Therefore, as the solar incidence angle increases, the power generation efficiency of the installed PV panel decreases due to increased surface reflectance.
3.2. Effect of the Surface Reflectance According to the Angle of Incidence on Power Generation
The surface of every material has a reflectivity value for incoming light, and as the angle of incidence of light decreases, the reflectance increases. The difference in PV efficiency, depending on the installation angle, is attributed to the change in the absolute area of solar incidence according to the angle of incidence (qi) and the reflectance of the PV surface depending on the solar altitude [
10]. In particular, the surface of the PV panel that absorbs 90% sunlight at 90° reflects up to 60% depending on the angle of incidence. The decrease occurs due to the decrease in the solar incidence area. This generally occurs during the sunrise and sunset hours. Therefore, the reflectance is less than 5%, and the solar incidence area reaches its maximum when the fixed panel directly faces the sun. However, this phenomenon lasts for only a few minutes. Therefore, the reflectance according to the solar incidence angle significantly affects the PV panels’ efficiency.
Consequently, maximum power generation is possible when the angle of incidence (qi) is close to 0°. As the angle increases, the power generation of the PV panel rapidly decreases due to the increase in the reflectance and reduction in the incidence area. This depends on the time of day. The maximum power generation occurs at noon when the angle of incidence is close to 0°; however, the amount of power generated is small in the early morning and late afternoon hours when the angle of incidence is large. When PVs are installed on the rooftop of a building, the angle of incidence and surface azimuth can be optimized. However, in the case of BIPVs installed on facades, such as vertical building walls, it is difficult to optimize the installation angle and surface azimuth for power generation because of the geometry of the existing exterior walls.
3.3. Cases of Improving Power Generation Efficiency Using Concentrators
Glass and aluminum are commonly used for exterior curtain walls in high-rise buildings. Using the refractive index data (refractiveindex.info) that provides the reflectance characteristics of general materials, the reflectance characteristics of glass according to the angle of incidence can be identified. In the case of 5 mm single-pane glass, the reflectance is 6.3% at an incidence angle of 90° and 59.6% at an incidence of 10°, indicating a significant difference in the reflectance depending on the incidence angle. On the other hand, aluminum’s reflectance is 91.2% at an incidence angle of 90° and 98.4% at an incidence of 10°, indicating very high reflectance, regardless of the angle of incidence. Absorption or reflection occurs on metallic surfaces, such as aluminum, as they are non-permeable materials, but the transmittance is relatively high for glass, as it is a permeable material.
The high reflectance of aluminum has been applied to improve the power generation efficiency of PV panels. Various reflective PV systems that maximize the power generation of PV panels have been developed by designing aluminum concentrators to be installed around the panels so sunlight can be concentrated on the PV panel. The installation of such aluminum concentrators increased the amount of power generated by approximately 20%. When a tracking function was applied together with concentrators, the power generation efficiency improved by more than 40%.
Examples of using a fixed concentrator include Jeong, who improved the output of a PV panel by approximately 20% by installing aluminum concentrators on both sides of the panel [
11]. Palaskar increased the amount of power generated by more than 21% by installing aluminum concentrators on both sides of a PV panel [
12], and Bahaidarah also proved that electrical power generation output could be improved by 22.8% by introducing a concentrating system similar to Palaskar [
13]. Khan achieved an output improvement of 28% using aluminum concentrators on both sides of a PV panel [
14,
15]. When such fixed concentrators were installed, maximum output could be achieved during the daytime.
Improved results were derived when applying to track concentrators rather than with fixed concentrators. Kim introduced aluminum concentrators on both sides by integrating them with a tracking PV system that operated within 45° in the left and right directions at a slope of 15° and improved power generation efficiency by up to 42% by maintaining the concentration of light according to the position of the sun [
16]. Using the concentrating PV tracking module (CPVT), Naseer improved the daily average power generation by up to 91% compared to PV installed at a slope of 30° by applying two concentrators and an x-y tracking system [
17].
These new systems to increase the efficiency of PV panels using concentrators improved the actual power generation efficiency by 20% to 28% for the fixed type and by 42% to 91% for the tracking type compared to conventional PV systems; however, it is not easy to find application cases. The main causes are difficulty in standardization and a global rise in the price of raw materials. For new PV systems, it is necessary to use commercially available products, but most have unique structures or designs and thus have limitations in standardization.
Moreover, the price of PV panels reached grid parity in 19 countries in January 2014, and the price is continuously decreasing [
18]. In contrast, the price of aluminum showed no significant change over the same period. In fact, aluminum prices have been continuously increased recently [
19]. The additional coating on the aluminum surfaces to maintain high reflectance further increases the price of aluminum concentrators. In other words, utilizing relatively expensive aluminum concentrators to improve the efficiency of cheap PV panels is not economically feasible. Therefore, PV systems that used aluminum concentrators with high reflectance were unsuccessful in terms of commercialization.
3.4. BRPV Overview and Characteristics
The BRPV proposed in this study comprises two PV panels (top vertical and bottom horizontal panels), as shown in
Figure 1. The angle between the two panels ranges from 90° to 100°, and the panels are installed on the spandrel in the upper part of a window on the building facade. Existing reflective PVs are comprised of a PV panel and an aluminum plate with high reflectance to improve efficiency through the concentration of the reflected light. For BRPVs with two PV panels, on the other hand, mutual reflection is generated according to the constantly changing incidence of sunlight, increasing power generation efficiency, and the horizontal panel provides external shading.
The BRPV system shows the highest power generation efficiency at a solar incidence angle of approximately 45°, the median value of the angle between two PV panels. Because the solar altitude is high in summer in Korea, located in the northern hemisphere’s middle latitude, the power generation efficiency of the horizontal PV panel is higher than that of the vertical panel. In winter, the power generation efficiency of the vertical panel increases because the solar altitude decreases. Therefore, in the BRPV structure, the sunlight reflected from the horizontal panel improves the power generation efficiency of the vertical panel in summer, whereas the sunlight reflected from the vertical panel increases the power generation efficiency of the horizontal panel in winter. Additionally, the geometrical structure allows an increase in the number of PV panels. In particular, for high-rise buildings, the number of PV panels applied as BIPVs increases due to an increase in the facade area. Finally, when BRPVs are applied to the upper part of the outside of a window, the protruding horizontal panel provides external shade that reduces the cooling load caused by solar radiation in summer. Consequently, when applied to the upper part of a window facing south, as shown in
Figure 2, the BRPV increases power generation by increasing the number of PV panels and decreases the cooling energy consumption by reducing the indoor cooling load.
4. Examination of Energy Consumption and Power Generation
4.1. Overview and Modeling of the Target Building
The simulation target is a middle school located in Seoul, Korea. This area corresponds to 4A in the ASHRAE climate zone classification. A 30-day summer vacation (July 27 to August 25), a 35-day winter vacation (January 2 to February 5), and a 10-day spring vacation (February 19 to 28) were reflected in the calculations. During the semester, the entire building, including the general classrooms, was measured from 09:00 to 16:00, and a load generation rate of 25% was considered from 16:00 to 18:00, considering the presence of the teaching staff. During vacation periods, it was assumed that cooling and heating were provided to approximately 20% of the building, including support facilities, such as administration offices and teachers’ rooms.
Figure 3 shows the school building’s first floor and typical floor plans. They are large in the east–west aspect, and most classrooms are on the south side.
Table 3 shows the overview of the building. The building has five above-ground floors and a total floor area of approximately 6219 m
2. The variable refrigerant flow (VRF) system was applied for cooling and heating.
Figure 4 shows the isometric plan of the target building. In the planning stage, external shading was not installed on the southern façade, as shown in
Figure 4a (Cases 1 and 2). In this study, however, external shading that protruded by 1 m was added to the upper part of the windows to examine the effect of applying BRPVs (Case 3), as shown in
Figure 4b.
4.2. Cooling/Heating Energy Consumption Calculation Results and Examination
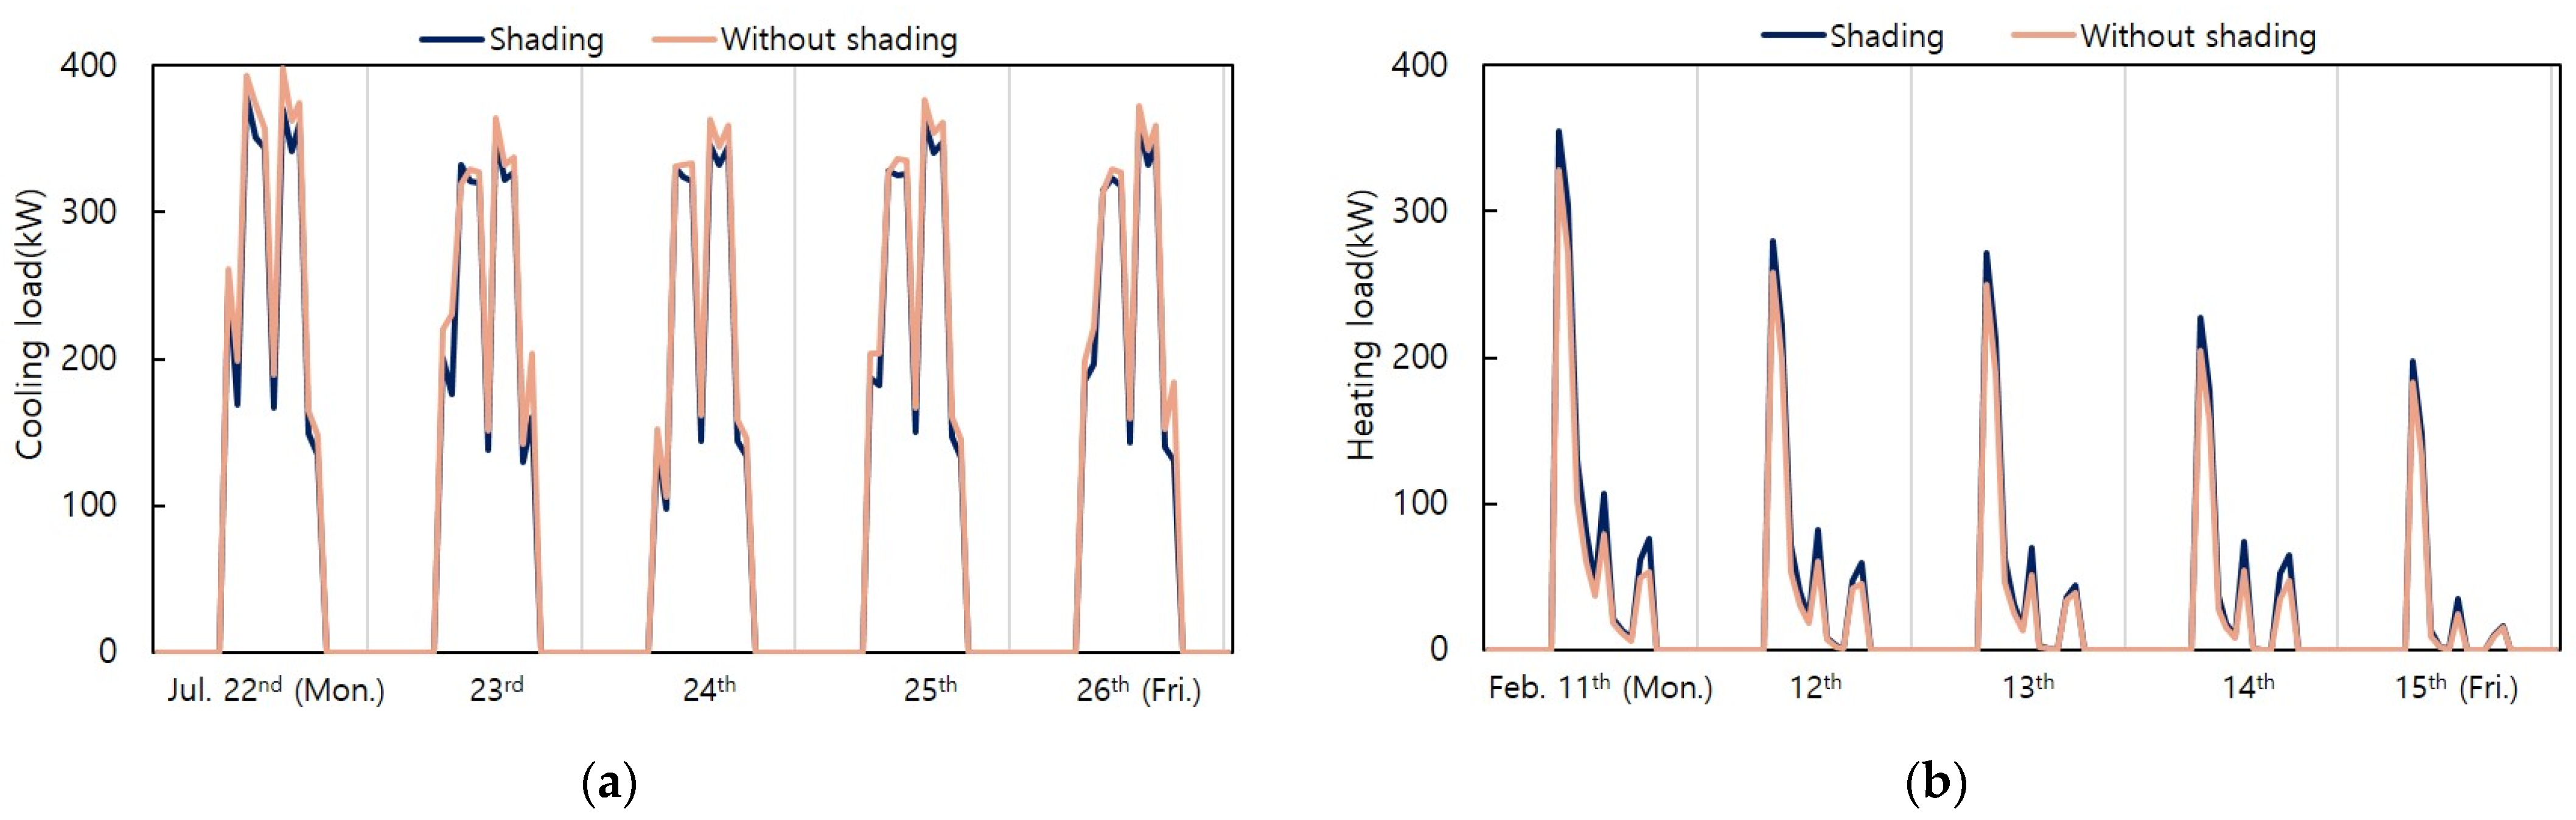
Figure 5 shows the cooling and heating loads for representative weeks during the summer and winter periods, including the presence and absence of shading. The peak time cooling load without shading ranged from approximately 350 kWh to 400 kWh; however, shading reduced the load by approximately 5% to 8% by decreasing the SHGC. The heating load in the morning hours of the representative week ranged from 15 kWh to 328 kWh in the model without shading. However, shading increased the load by approximately 15% to 18% by decreasing the SHGC. Meanwhile, the cooling energy consumptions of the representative week were 3818 kWh and 3560 kWh, depending on the presence/absence of shading, indicating that shading saved 257.9 kWh (approximately 6.7%). Without shading, the heating energy consumption increased by 186.8 kWh (approximately 13.7%) from 1356 kWh to 1542 kWh.
Table 4 shows the annual heating and cooling energy consumption by month, considering ventilation. The annual cooling and heating energy consumptions were found to be 65,177 kWh and 11,393 kWh without shading and 55,225 kWh and 12,762 kWh with shading due to the application of BRPV, respectively. Therefore, external shading decreased the cooling energy consumption by 15.3% but increased the heating energy by 12.0%. When the cooling, heating, and ventilation energy consumptions were combined annually, BRPVs were found to save approximately 11.2%, as the results were 76,060 kWh without shading and 67,987 kWh with shading.
From the perspective of building energy consumption, internal shading is favorable in cold regions, and external shading is preferred in hot regions. However, in the case of warm climate zones, external shading must be applied in summer and internal shading in winter [
20]. When PV panels integrated with fixed external shading are applied in Korea, which belongs to a warm climate zone but has a large amount of solar radiation, a reduction in the inflow of solar radiation leads to a decrease in cooling energy consumption but an increase in heating energy consumption. Because heating energy consumption has decreased over the last 40 years due to the reinforcement of insulation standards, an overall reduction in cooling energy consumption is assumed to be more effective.
4.3. Lighting and Hot Water Supply Energy Consumption Calculations
To examine the feasibility of a zero-energy school, this study referred to the lighting and hot water supply energy consumption of a previous study [
21] that performed energy analysis modeling of a school. This study, which pursues a zero-energy school, can provide more realistic results; the building energy analysis was based on the actual energy consumption observations. The annual lighting energy consumption of the school was 5.1 kWh/m
2, and the hot water supply energy consumption was 7.7 kWh/m
2, excluding the cafeteria’s hot water supply energy consumption, which has distinct characteristics as a separate facility. When these were reflected in the area of the target school building in this study, the annual lighting energy consumption was calculated to be 31,779 kWh/m
2, and the annual hot water supply energy consumption was 47,886 kWh/m
2.
4.4. Examination of Solar PV Power Generation
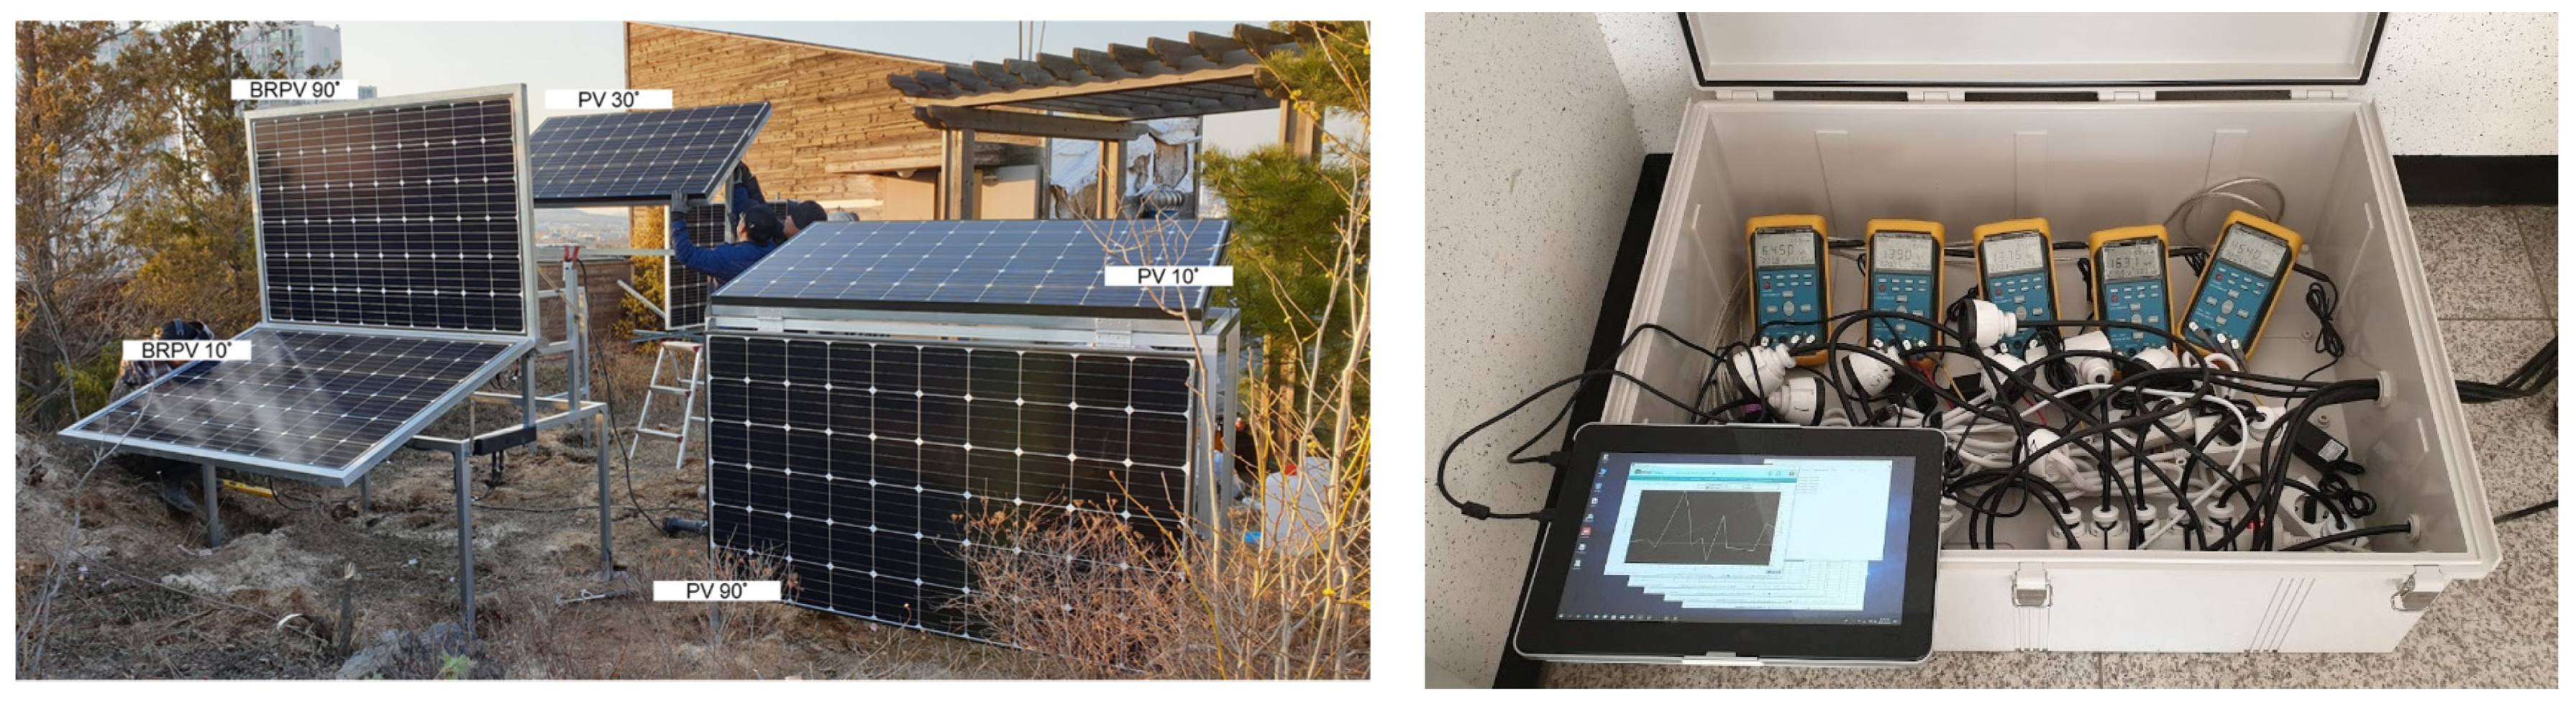
The installation location (37.67° N, 126.74° E) of the PVs for actual measurements was near Seoul, Korea, and the power generation was monitored after installing five PV modules on the building rooftop [
22]. Each panel had a 300 W single crystal type with a power generation efficiency of 17.5% and an area of 1.65 m
2. It was confirmed in advance that the output difference of each panel was 1% or less. The power amount of the five PV modules was measured every minute by five Wattman’s HPM-300A devices. Measurements were performed for one year starting in May 2019. The number of days with valid data was 234 due to the omission of measurements and equipment malfunctions, and the extraction interval of the raw data was 1 min. The five PV panels were installed facing south. The installation angle of each panel was set to 30° (PV 30), which is the most common installation angle in the mid-latitude regions, Horizontal 10° (PV 10), vertical 90° (PV 90), horizontal 10° (BRPV 10), and vertical 90° (BRPV 90) were applied to identify the change in power generation due to reflection. As shown in
Figure 6, each panel was separated by more than 1 m to avoid interference. In addition, the surroundings were arranged so vegetation or other nearby obstacles could not affect power generation.
Figure 7 shows the daily power generation in ascending order. The
y-axis represents the sum of daily power generation, and its value is determined by the total solar radiation of the day. The daily power generation of the horizontal BRPV panel (BRPV 10) was larger than that of the conventional horizontal panel (PV 10) on most days, and it was approximately 8.6% larger on average. The same pattern was observed from the vertical BRPV panel (BRPV 90) and the conventional vertical panel (PV 90); the daily power generation of BRPV 90 was 32.8% on average. The amount of power generated by the horizontal and vertical panels constituting the BRPVs was larger because of the bidirectional reflection. This proves that the design intent was appropriate. Meanwhile, the conventional PV panel (PV 30), installed on the horizontal surface (rooftop) of a building at a fixed angle of 30° in mid-latitude regions, showed the largest power generation on cloud-free days.
Power generation during the valid measurement period of 234 days was found to be 353.6 kWh for the BRPV set (BRPV 10 + BRPV 90) and 247.8 kWh for one unit of PV 30. In addition, it is judged that correcting the power generated during the measurement period will not be significantly difficult as there is no distinction between the rainy and dry seasons in Korea. When the power generation is converted based on 365 days, the expected power generation is 549.2 kWh for one BRPV set and 384.9 kWh for one unit of PV 30.
5. Examination of the Energy Independence Rate of the Building
Based on the above building energy consumption simulation results, the effects of PV and BRPV applications on the energy consumption of the entire building were compared and analyzed, as shown in
Table 5. Case 1 is the default value of the school building that reflected only the building envelope thermal performance of Korea in 2022. Case 2 is the result of installing 138 PV panels (41.4 KW) at a slope of 30° on the rooftop, while the building envelope performance of Case 1 was reflected. The number of PV panels corresponds to 20% of the rooftop area, which is reasonable considering the outdoor unit area of VRF and basic rooftop landscaping. In Case 3, 80 BRPV sets (160 panels, 48 KW) were installed on the outer wall above the windows on the south side of the building in addition to the conditions of Case 2.
First, the total building energy consumption was calculated to be 156,235 kWh for Cases 1 and 2. In Case 3, the total building energy consumption decreased by approximately 5.5% to 147,652 kWh with the reduction in cooling energy consumption and the increase in heating energy consumption due to the external shading effect of the BRPV application in Case 3.
In the simulation results, it was observed that the insulation performance of the building was similar to that of a passive house and that the cooling and heating energy consumptions were lower due to the usage characteristics of the school facility (vacations during the cooling and heating periods). Accordingly, the proportion of hot water supply and lighting energy consumption in the total energy consumption was relatively large, 51.0% in Cases 1 and 2 and 53.9% in Case 3.
In addition, a significant difference was observed in the power generation improvement effect by the application of PV panels. In Case 2, the total power generation by the 138 PV panels installed at an angle of 30° on the rooftop was 53,195 kWh, and the energy independence rate (ratio of new and renewable energy production to building energy consumption) was 34.1%. In Case 3, a total power generation of 97,128 kWh was obtained as the sum of the power generated by the PV panels installed on the rooftop and 80 BRPV sets (annual power generation of 549.2 kWh per set), and the energy independence rate increased to 65.8%.
6. Conclusions
In this study, bidirectional reflectance photovoltaic (BRPV) panels with a shading effect were installed in a school building, and the impact of applying BRPVs on the annual energy consumption and power generation was examined. The main conclusions are as follows.
- (1)
The sum of cooling, heating, and ventilation energy consumptions was 76,060 kWh in Cases 1 and 2 with internal shading and 67,987 kWh in Case 3, indicating that the external shading of BRPVs reduced energy consumption by approximately 11.2%. The total energy consumption of Case 3 (147,652 kWh) is expected to be approximately 5.5% lower than Cases 1 and 2 (156,235 kWh). This appears to be because the proportion of hot water supply and lighting energy consumption is relatively large due to the reinforced insulation level of the envelope.
- (2)
The power generation of BRPVs (BRPV 10 + BRPV 90) was identified through on-site measurements. Compared with conventional horizontal and vertical panels (PV 10 + PV 90), the power generation of BRPVs was improved by 10.7% in winter, 13.4% in spring, and 10.2% in summer.
- (3)
For the target school building, the power generation area can be increased by approximately 75% through the installation of BRPVs on windows compared to the installation of conventional PV30 on the rooftop only. Based on this, the power generation of the BRPVs (549.2 kWh) is expected to be 143% higher than that of PV30 (384.9 kWh).
- (4)
When the new and renewable energy power generation rate was reflected based on the actual measurement results of solar PVs, the energy independence rate was found to be 34.1% in Case 2, where only rooftop PVs were applied, and 65.8% in Case 3 with rooftop PVs and BRPVs. This means the building’s ZEB rating can be improved when BRPVs are additionally applied.
In future climate scenarios, increased electricity consumption in buildings is predicted. Therefore, increasing power generation through the application of new and renewable energy to future buildings will be key in realizing zero-energy buildings. In this study, the power generation performance of BRPV modules for maximizing new and renewable energy application areas in buildings was evaluated, and the effects on the energy consumption and energy independence rate of a school building were verified. The results are expected to be the basis for the future commercialization of BRPVs. However, in order to commercialize BRPVs, various design developments and the standardization of specifications must be secured. The PV modules used in this study were silicon-type single-crystal PV modules; however, additional experiments on the amorphous silicon type and the dye-sensitized type (Dye-TiO2), which is mainly applied to building-integrated photovoltaics (BIPV), will be performed in the future at a newly constructed long-term monitoring experiment facility. Based on this, the BRPV structure that can be applied regardless of the PV module type will be analyzed in various forms.
Author Contributions
Conceptualization, K.H.L.; methodology, K.H.L.; experiment, K.H.L.; simulation, Y.-H.S.; validation, Y.-H.S.; formal analysis, K.H.L. and Y.-H.S.; investigation, K.H.L. and Y.-H.S.; data curation, K.H.L. and Y.-H.S.; writing—original draft preparation, K.H.L. and Y.-H.S.; writing—review and editing, K.H.L. and Y.-H.S.; visualization, K.H.L. and Y.-H.S.; supervision, K.H.L.; project administration, Y.-H.S.; funding acquisition, K.H.L. All authors have read and agreed to the published version of the manuscript.
Funding
This research was funded by the Dong-A University research fund.
Data Availability Statement
The original data are not publicly available because the experiment was funded by Korean state research fund.
Acknowledgments
The authors would like to thank Dong-A University for their financial support.
Conflicts of Interest
The authors declare no conflict of interest.
References
- Yang, E.S. Yearbook of Energy Statistics; Korea Energy Economics Institute: Ulsan, Republic of Korea, December 2022; Available online: https://www.kesis.net/sub/sub_0003_eng.jsp (accessed on 18 October 2021).
- 2030 National Greenhouse Gas Reduction Goal, Republic of Korea Government. 2021. Available online: https://www.ctis.re.kr/en/downloadBbsFile.do?atchmnflNo=7394 (accessed on 18 October 2021).
- Carbon Neutrality Committee. 2050 Carbon Neutral Scenario, Republic of Korea. October 2021. Available online: http://webarchives.pa.go.kr/19th/www.2050cnc.go.kr/base/board/read?boardManagementNo=4&boardNo=101&searchCategory=&page=1&searchType=&searchWord=&menuLevel=2&menuNo=15 (accessed on 18 October 2021).
- 2020 New Renewable Energy Supply Statistics, Korea Energy Agency, Center of Renewable Energy. 2021. Available online: https://www.knrec.or.kr/biz/pds/statistic/view.do?no=120 (accessed on 18 October 2021).
- Daniels, K. Technology in Ecological Building: The Fundamentals and Approaches, Examples and Ideas; Birkhaeuser: Basel, Switzerland, 1997. [Google Scholar]
- Appelbaum, J.; Aronescu, A.; Maor, T. Shading by Overhang PV collectors. Appl. Sci. 2019, 9, 4280. [Google Scholar] [CrossRef]
- Reale, A.; Cinà, L.; Malatesta, A.; De Marco, R.; Brown, T.M.; Di Carlo, A. Estimation of Energy Production of Dye-Sensitized Solar Cell Modules for Building Integrated Photovoltaic Applications. Energy Technol. 2014, 2, 531–541. [Google Scholar] [CrossRef]
- Kim, D.S.; Shin, U.C.; Yoon, J.H. Annual energy yield prediction of building added PV system depending on the installation angle and the location in Korea. KIEAE J. 2014, 14, 67–74. [Google Scholar] [CrossRef][Green Version]
- Danks, R.; Good, J.; Sinclair, R. Avoiding the Dreaded Death Ray: Controlling Facade Reflections Through Purposeful Design. In Proceedings of the 2016 Facade Tectonics Institute World Congress, Los Angeles, CA, USA, 10–11 October 2016. [Google Scholar]
- Yellowhair, J.; Ho, C.K. Assessment of Photovoltaic Surface Texturing on Transmittance Effects and Glint/Glare Impacts. In Proceedings of the ASME 2015 9th International Conference on Energy Sustainability, San Diego, CA, USA, 28 June–2 July 2015. [Google Scholar]
- Jeong, H.J.; Lee, Y.W.; Ju, S.M.; Lee, H.J.; Boo, S.J. Fabrication and Evaluation of Low Concentrator Photovoltaic Modules with Aluminium Reflectors. Korean Soc. New Renew. Energy 2008, 4, 17–22. [Google Scholar]
- Palaskar, V.N.; Deshmukh, S.P.; Pandit, A.B. Deshmukh, Design and Performance Analysis of Reflectors Attached to Commercial PV Module. Int. J. Renew. Energy Res. 2014, 4, 240–245. [Google Scholar]
- Bahaidarah, H.M.; Tanweer, B.; Gandhidasan, P.; Rehman, S. A Combined Optical, Thermal and Electrical Performance Study of a V-Trough PV System—Experimental and Analytical Investigations. Energies 2015, 8, 2803–2827. [Google Scholar] [CrossRef]
- Khan, M.A.; Ko, B.; Alois Nyari, E.; Park, S.E.; Kim, H.J. Performance Evaluation of Photovoltaic Solar System with Different Cooling Methods and a Bi-Reflector PV System (BRPVS): An Experimental Study and Comparative Analysis. Energies 2017, 10, 826. [Google Scholar] [CrossRef]
- Khan, M.A.; Zeb, K.; Uddin, W.; Sathishkumar, P.; Ali, M.U.; Hussain, S.; Ishfaq, M.; Himanshu; Subramanian, A.; Kim, H.-J. Design of a Building-Integrated Photovoltaic System with a Novel Bi-Reflector PV System (BRPVS) and Optimal Control Mechanism: An Experimental Study. Electronics 2018, 7, 119. [Google Scholar] [CrossRef]
- Kim, Y.S.; Kang, G.H.; Sim, S.Y.; Lee, H.R.; Lee, J.S.; Hong, J.K. Demonstration Research of Photovoltaic System with Solar Reflectors. J. Korean Sol. Energy Soc. 2009, 29, 64–69. [Google Scholar]
- Kasim, N.K.; Atwan, A.F.; Oleiwi, F.M.; Hameed, J.S. Study the Performance of V-through PV solar System with Two Axis Tracking. AIP Conf. Proc. 2019, 2144, 030008. [Google Scholar]
- Nemet (2009); International Renewable Energy Agency (IRENA). Available online: https://ourworldindata.org/grapher/solar-pv-prices?time=earliest..latest (accessed on 10 January 2022).
- Henry Sanderson, 9 August 2021. Available online: https://www.ft.com/content/a07c556d-2aa4-4b25-b00f-fdd42a2cf9b8 (accessed on 9 August 2021).
- Lee, K.H. Investigation into the Possibility of Using Double Facades in Highrise Office Buildings with Glass Facades in Extreme Climate Areas. Doctoral Thesis, Technical University Berlin, Berlin, Germany, December 2002. [Google Scholar]
- Yoon, J.H.; Shin, U.; Cho, J.I.; Park, J.W.; Kim, H.J.; Lee, C.S. Energy Evaluation of A Primary School Building for Zero Energy School, The Korean Solar Energy Society. In Proceedings of the KSES 2009 Spring Annual Conference, Daegu, Republic of Korea, 4 October 2009. [Google Scholar]
- Lee, K.H.; Kim, S.J.; Jeong, J.W.; Song, Y.H. Measurement Analysis of Power Generation Change with Bidirectional Reflectance PV Array. J. Korean Inst. Archit. Sustain. Environ. Build. Syst. 2021, 15, 190–199. [Google Scholar]
| Disclaimer/Publisher’s Note: The statements, opinions and data contained in all publications are solely those of the individual author(s) and contributor(s) and not of MDPI and/or the editor(s). MDPI and/or the editor(s) disclaim responsibility for any injury to people or property resulting from any ideas, methods, instructions or products referred to in the content. |
© 2023 by the authors. Licensee MDPI, Basel, Switzerland. This article is an open access article distributed under the terms and conditions of the Creative Commons Attribution (CC BY) license (https://creativecommons.org/licenses/by/4.0/).


