Article

Influence Law of Axis Deflection on the Mechanical Properties of Steel Stranded Short Slings in Arch Bridges

1
College of Civil Engineering and Architecture, Guangxi University, Nanning 530004, China
2
Key Laboratory of Disaster Prevention and Structural Safety of Ministry of Education, Guangxi University, Nanning 530004, China
*
Author to whom correspondence should be addressed.
Buildings 2024, 14(1), 223; https://doi.org/10.3390/buildings14010223
Submission received: 8 December 2023 / Revised: 3 January 2024 / Accepted: 11 January 2024 / Published: 14 January 2024
(This article belongs to the Section Building Structures)

Abstract

:
Most cable arch bridge damage accidents are caused by bridge collapse due to fracture of the short sling of the arch bridge. The service life of the short sling is much lower than the design life, mainly resulting from the action of vehicles and temperature, and the arch rib and the bridge floor will have relative displacement along the bridge direction, which leads to the emergence of bending stress due to the different axes at both ends of the short sling, forming local stress concentration. The stress concentration is coupled with corrosion to accelerate the damage to the sling. To study the influence of shaft deflection on the mechanical properties of short slings of steel strands in arch bridges, this study analyzes the distribution law of the shaft deflection angle of arch bridge slings under the action of vehicle and temperature loads for a medium-bearing arch bridge with a main span of 560 m. The results show that under different vehicle and temperature loads, the axial deflection angle of the short sling is the largest, and the closer it is to the center of the span, the smaller the axial deflection angle. The static and fatigue properties of 1, 3, 7, 9, 12, 19, and 27 strands of whole bunch extruded strand slings were simulated and analyzed under a 0.45 σ b force when the axial deflection angle of the strand slings was 0 mrad, 10 mrad, 20 mrad, and 30 mrad. The results show that the ultimate tensile properties, breaking strength, and fatigue life of the strand slings decreased to a certain extent with increasing shaft deflection angle. The accuracy of the finite element models is verified by the ultimate tensile test and the fatigue test. This study explores the bending deflection results of the short slings of arch bridges due to the different axes of the upper and lower anchorages and provides the necessary theoretical support for the design and fatigue life estimation of the short slings of arch bridges.

1. Introduction

Arch bridges, having a long history and importance relative to most bridge types, are highly competitive in mountainous areas, islands, and other places where the terrain and geological conditions are suitable for bridges [1,2]. In recent years, a surge in arch bridge collapses due to sling fractures has been observed. Notable incidents include the Xiaonanmen Bridge in Yibin, Sichuan Province (2001); Kongque River Bridge in Xinjiang (2011); Wuyishan Mansion Bridge in Fujian Province (2011); Jinsha River Bridge in Panzhihua, Sichuan Province (2012); and Nan’ao Cross-harbor Bridge in Yilan, Taiwan Province (2019), each resulting in varying degrees of losses [3,4]. Studies by Gu Anbang et al. [5] have illuminated that shorter slings undergo heightened shear deformation compared to longer slings. The lower end of shorter slings experiences repeated bending stress, leading to the emergence of micro-cracks, significantly compromising their anti-fatigue capabilities [6,7]. Prolonged service of an arch bridge, coupled with damage to the derrick’s jacket, tends to induce rusting in slings. Yang Jianxi et al. [8] investigated the impact of uneven and escalating local stress on slings under dynamic loads. Their findings revealed that during vehicular excitation, shorter slings predominantly bend across the bridge’s width, experiencing peak stress levels during the free vibration phase following vehicle passage. The lower anchor end of shorter slings endures complex stress patterns, rendering the steel wire susceptible to corrosion and stress, culminating eventually in complete sling failure. Niels J. Gimsing [9], in his work ‘CableSupported Bridges’ (2002), highlighted the significant influence of bending stress on suspension cables, stressing the imperative consideration of bending stress in engineering practices. Fatigue failure emerges as the primary mode of sling malfunction, wherein local bending deformation, corrosion, and wire contact stress profoundly impact fatigue properties. In addition to the axial stress from axial action, steel wires endure additional bending stress during local bending deformation [10,11]. Moreover, geometric shape alterations during sling bending lead to inter-wire compression stress, further diminishing wire fatigue strength [12,13]. Zhou Yiming et al. [14,15,16,17] formulated the bending stress theory of slings, attributing sling bending to longitudinal displacement-induced bending at beam rib ends due to temperature changes. Finite element analyses and experiments demonstrated a substantial reduction in ultimate tensile strength and fatigue resistance of a single seven-wire steel strand post-bending. Yujie Yu [18] proposed a comprehensive three-dimensional finite element model of seven-strand steel strands, facilitating the simulation of axial loads and analysis of uneven stress distribution under longitudinal single-strand action. The frequent occurrence of boom fracture accidents makes it necessary to study the mechanical properties of short slings in arch bridges [19,20]. At present, there are no scholars on the arch bridge strand short sling axis deflection on its mechanical properties of research. Therefore, this paper adopts the method of establishing an arch bridge model by finite element software to study the distribution law of the deflection angle of arch bridge slings and analyze the static and fatigue properties of 1, 3, 7, 9, 12, 19, and 27 strands of 1860 MPa steel strand slings under different axis deflection angles.

2. Deflection Angle of Engineering Arch Bridge Slings

The main bridge is a medium-bearing steel pipe concrete arch bridge with a main span of 575 m (Calculated span 560 m), of which the south approach bridge is 40 m + 60 m + 2 × 35 m, and the north approach bridge is 50 m + 60 m + 50 m + 3 × 40 m. The approach bridges are cast-in situ as prestressed concrete continuous girder bridges, and the total length of the bridge is 1035 m. The main arch adopts the steel pipe concrete truss structure and the system of a whole bunch of extrusion strand slings. The computed sagittal span ratio is 1/4.0, the arch axis coefficient is 1.50, and the center distance of the arch ribs is 30.1 m. The arch structure comprises specific dimensions and materials: the upper section of the arch measures 8.5 m in radial height, while the lower section at the foot measures 17.0 m. The width of each rib is 4.2 m. Each rib consists of two 1400 mm concrete-filled steel tubes serving as chord tubes, one at the upper level and one at the lower level. The concrete used within the tubes is of grade C70. The primary arch rib is constructed using Q420qD steel and is formed by connecting the main pipe with a transverse steel pipe measuring Φ850 mm and two vertical two-belly steel pipes measuring Φ700 mm each. The sling system employs 27 strands of Φ15.2 mm epoxy-sprayed whole beam extruded parallel steel strands. The steel strand utilized possesses an ultimate tensile strength of 1860 MPa. The spacing of the slings and the columns on the arch is 15.5 m. The main girder structure of the steel-concrete combination deck plate is set on the steel lattice girder. The parameters of steel material and concrete are shown in Table 1. This study uses the bridge finite element software Midas Civil 2019 (v 1.1) to establish the steel pipe concrete arch bridge model, which is shown in Figure 1. There are 5433 nodes and 13,546 units in the model, of which 64 truss units were used for the suspension ropes, 9650 girder units were used for the arch ribs and lattice girders, and 3832 plate units were used for the deck slab. The foot of the arch is cemented, and the deck slab and arch ribs are elastically connected. Then, this study analyzes the distribution law of the axial deflection angle of the arch bridge sling under the influence of different factors.

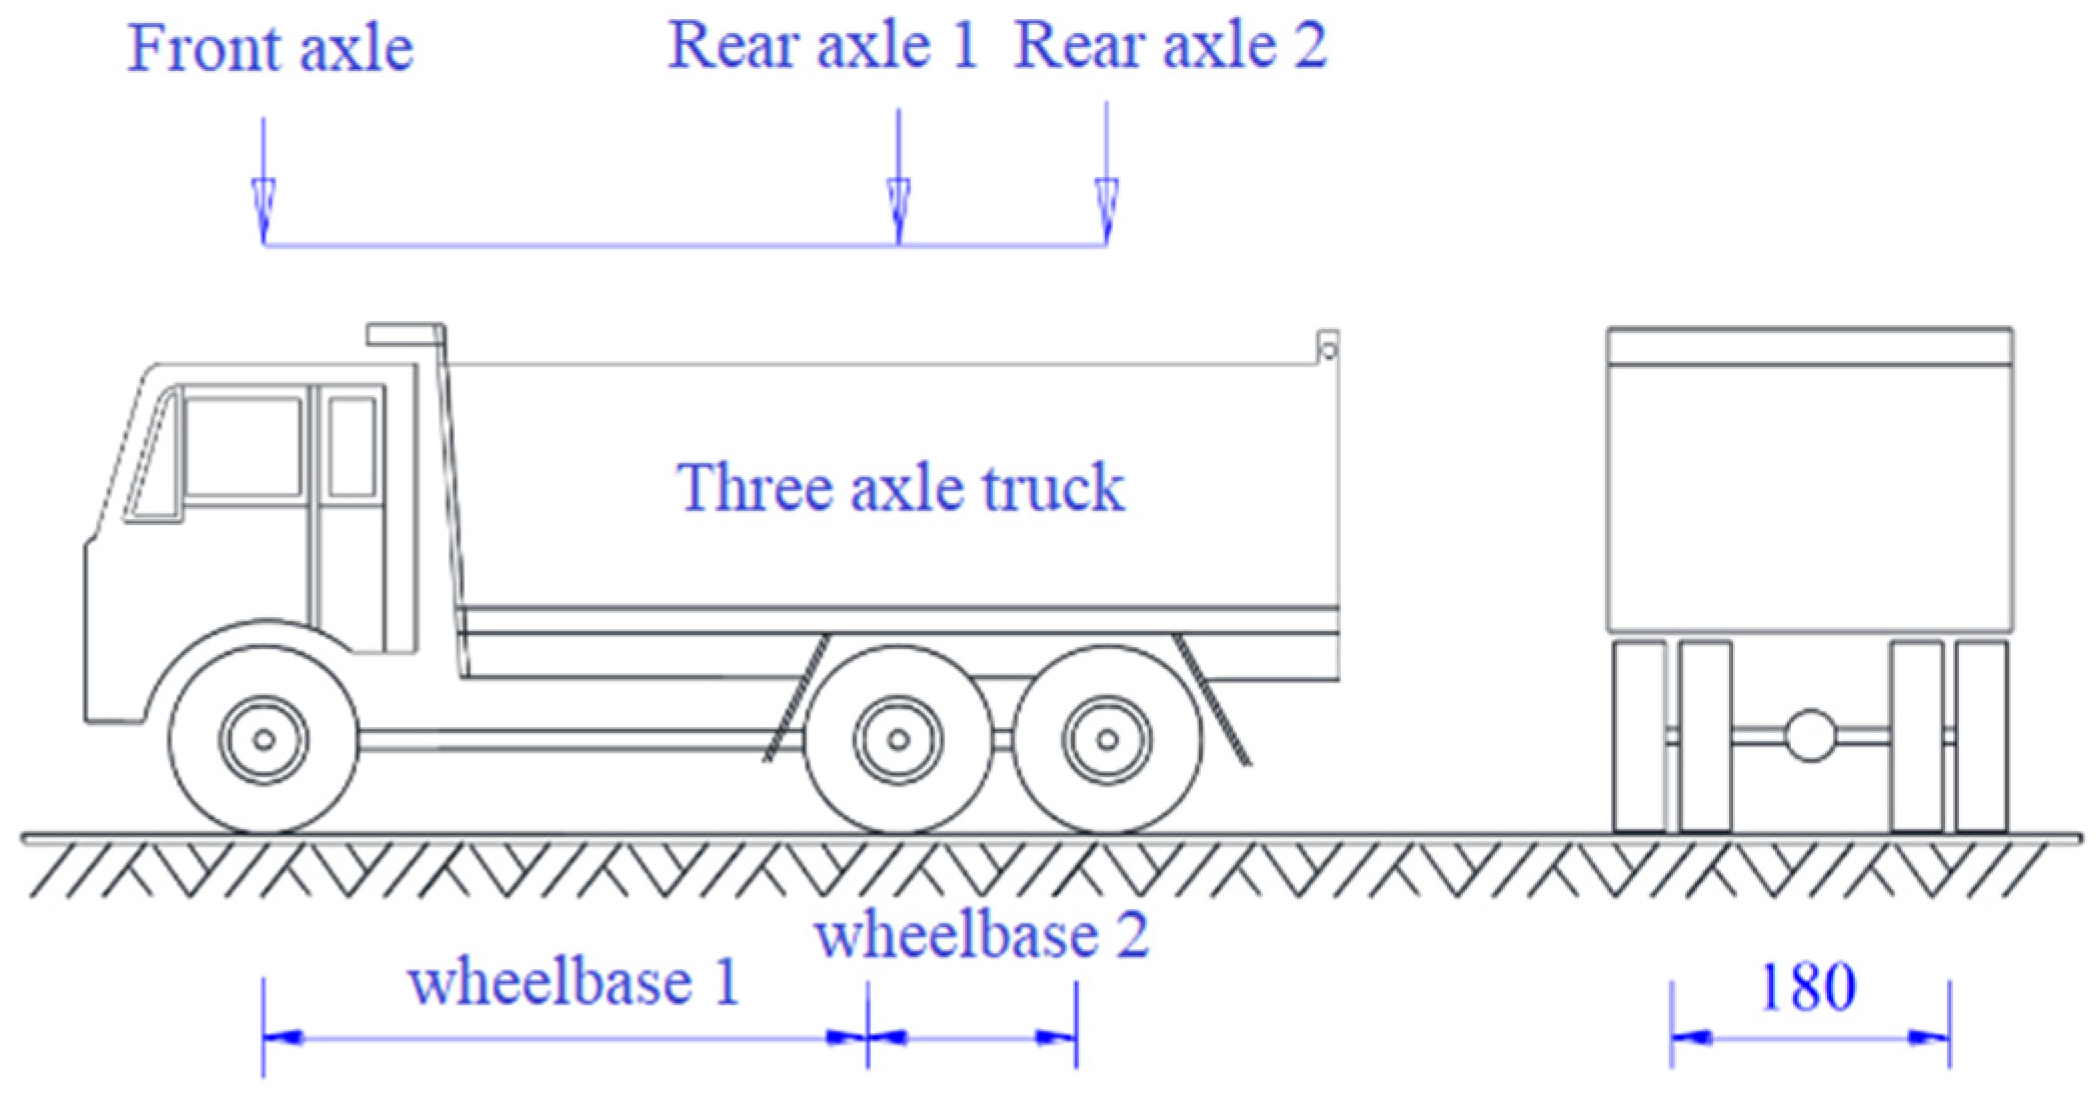
2.1. Distribution Law of the Deflection Angle of Slings under a Full Bridge Load and Deflected Load

Under the action of vehicle load, not only will the arch rib be deflected, but the bridge deck slab will also be deflected. The displacement and rotation between the two will lead to the same displacement at the anchorage end of the sling, and the sling will be deformed and bent at the same time. Based on the “Load Test Methods for Highway Bridge” [21], the equivalent load loading technique during the static load test imitates the application of a complete bridge load. This simulation involves 16 heavy trucks, each equipped with six rear wheels. The weight designated for each vehicle is 330 kN. The specific wheelbase measurements are set as follows: wheelbase 1 at 3.90 m and wheelbase 2 at 1.40 m. For each vehicle, the total weight of the front axle is 44.0 kN, while the total weight of the rear axle is 286.0 kN. Refer to Figure 2 for a visual representation of this setup.
Since the load of the whole bridge is symmetric, one-quarter of the whole bridge is taken for the study of the distribution law of the deflection angle of the sling. As shown in Figure 3, the distribution law of the deflection angle of the sling under full bridge load is the same as that under partial load, and the deflection angle of the short sling under deflected load is slightly larger than that under full bridge load.

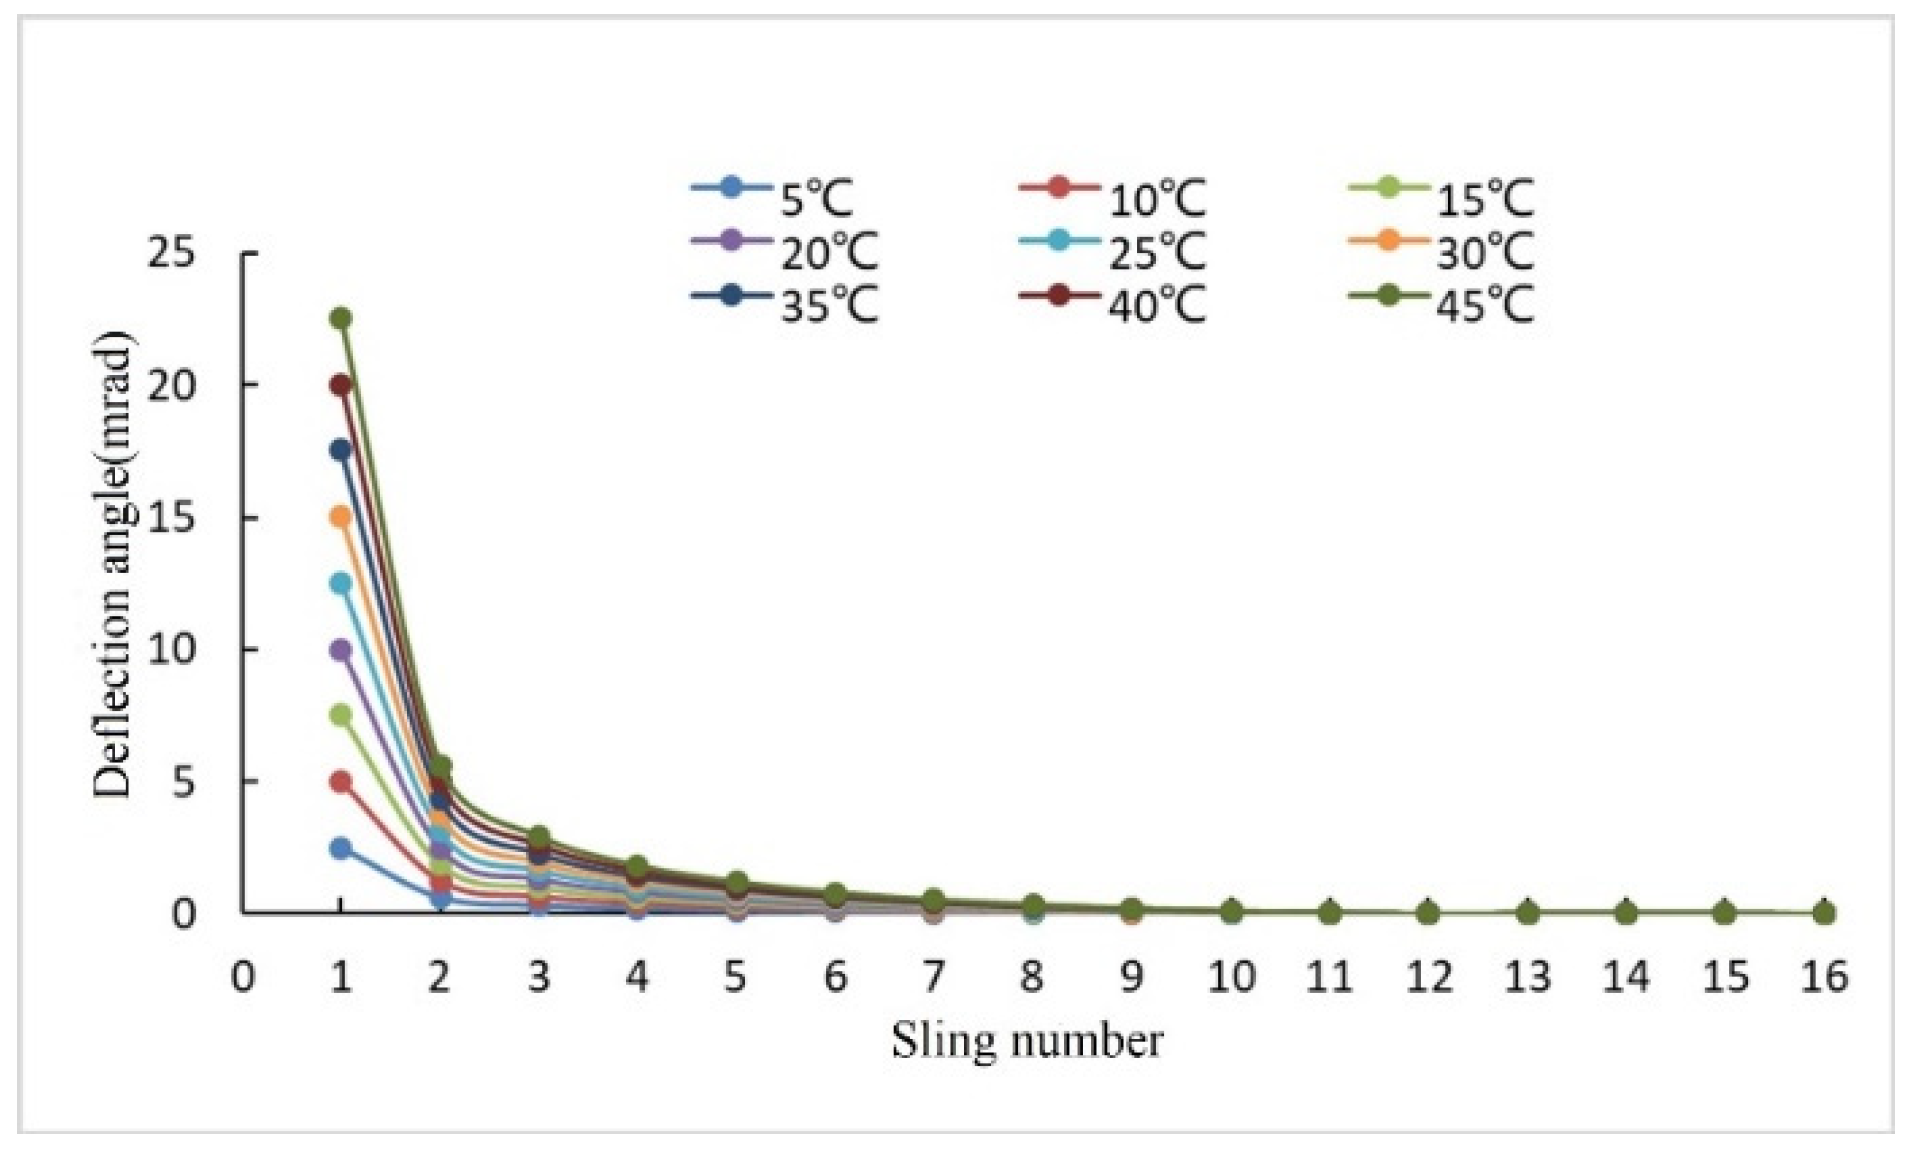
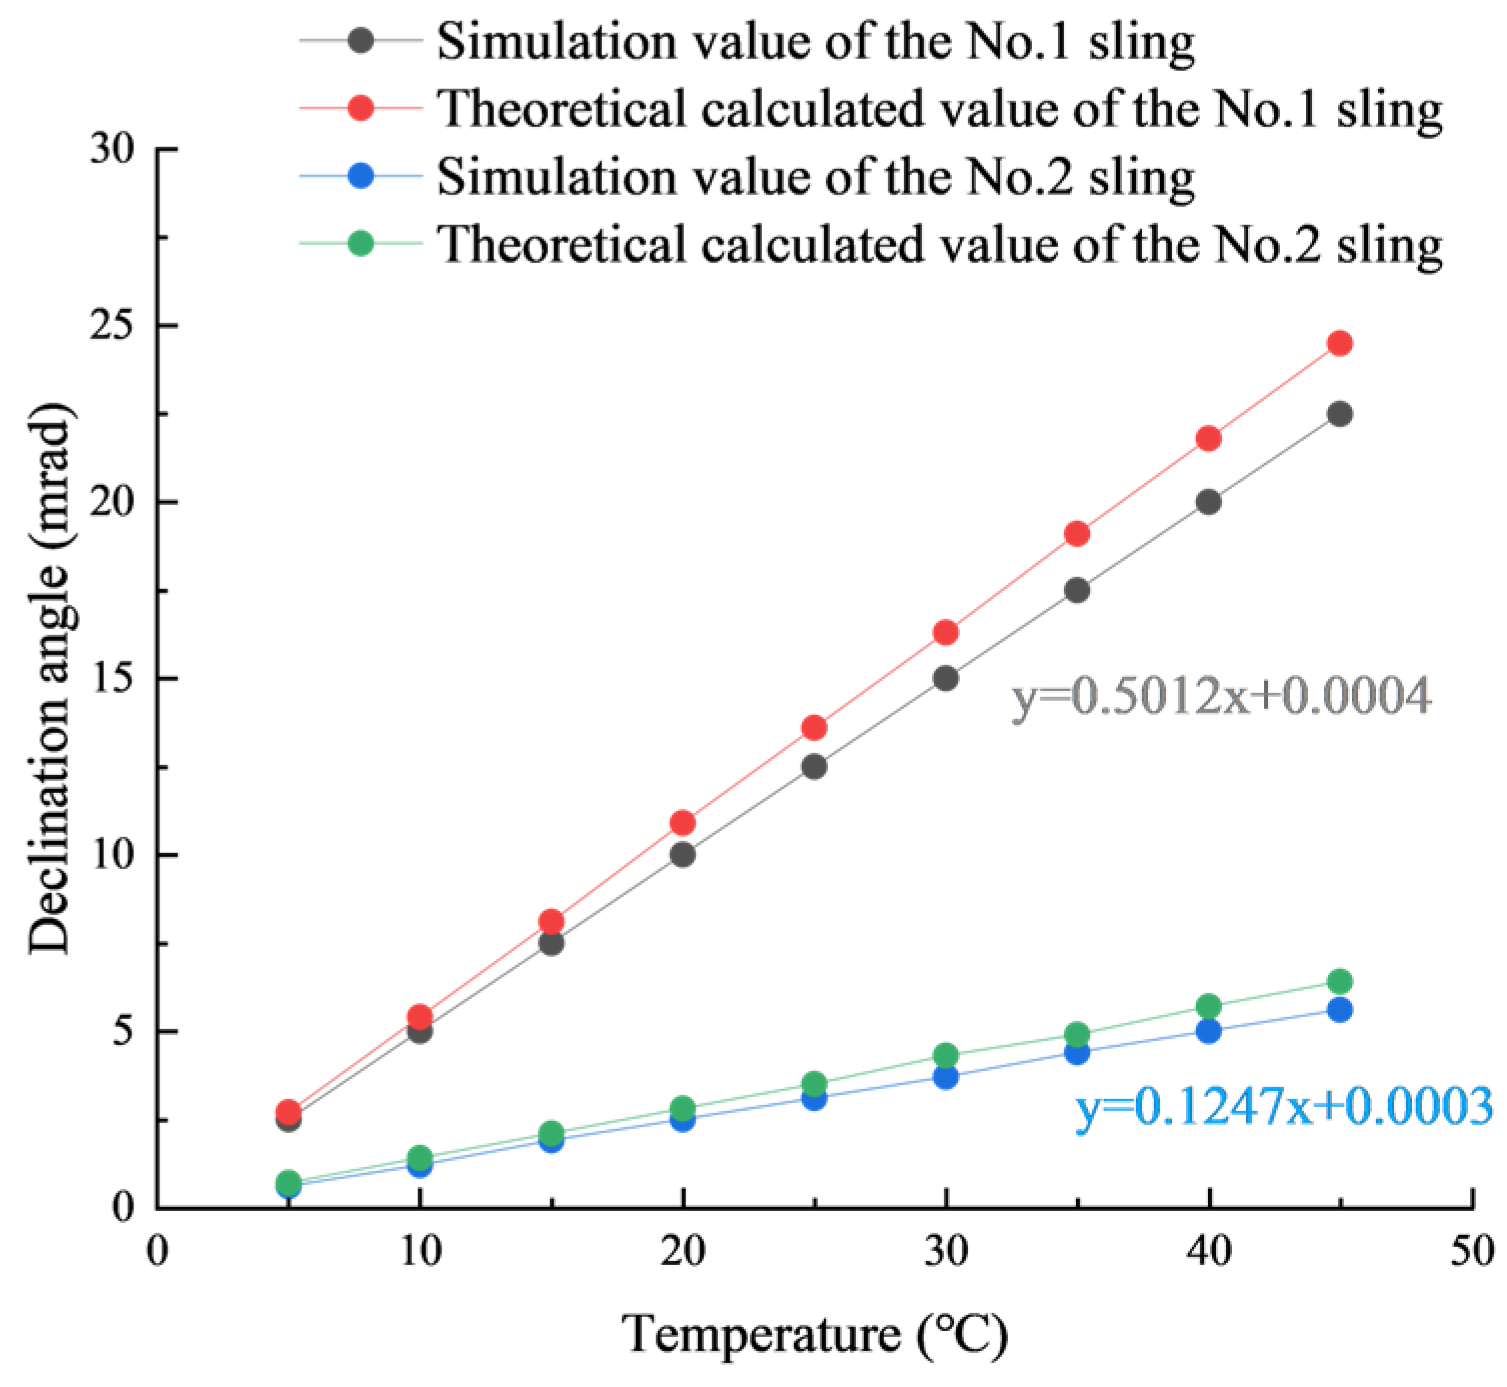
2.2. Distribution Law of the Deflection Angle of Slings under Temperature Loading

The overall temperature change in the bridge can cause bending deformation of the slings. The influence of the overall temperature change on the whole steel pipe concrete arch bridge is very complicated. Under the influence of temperature change, the material, section, etc., will reflect different internal force changes. Consequently, various parts of the arch bridge are affected differently, and the deformation of each part also varies. The short slings intersected with multiple stressed members of the bridge deck, columns, and arch ribs, imposing multiple redundant constraints at the same time. The forces here are more susceptible to overall temperature changes than in the case of the other slings. Therefore, symmetrical structural deformations are more likely to appear here. Due to the high sensitivity coefficient of steel to temperature, the deformation of steel caused by temperature changes will also be large. According to the formula for calculating the deformation of a superstatic structure under the action of temperature in the mechanics of materials, the approximate distribution figure of the deflection angle of the boom on the bridge deck can be obtained, as shown in Figure 4. The calculation formula is as follows:
θ = α Δ t L H
where L is the length of the sling from the centerline of the bridge, α is the temperature expansion coefficient of the material, Δt is the change in temperature, and H is the length of the sling.
The arch bridge deck plate is Q420qD steel, of which the temperature expansion coefficient is 0.000012. Because the arch bridge is a symmetrical structure, one-quarter of the sling is selected as the research object. Because the deformation of the sling caused by overall warming and overall cooling is basically anti-symmetric, this paper only studies the overall warming conditions. The deflection angles of the No. 1 and No. 2 slings caused by overall warming and the deflection angle calculated by the formula are shown in Table 2 below. Based on the data presented in Table 2, the observed deflection angle of the No. 1 sling exhibits a rise of 20 milliradians when the temperature increases from 5 °C to 45 °C. Simultaneously, the theoretically calculated value for this change registers an increase of 21.8 milliradians. The maximum discrepancy between the simulated and theoretical values amounts to 8.3%. Similarly, in the case of the No. 2 sling, the observed deflection angle increases by 5 milliradians as the temperature escalates from 5 °C to 45 °C. Correspondingly, the theoretically calculated value indicates a rise of 5.7 milliradians. The maximum disparity between the observed and theoretical values is recorded at 14.3%.
According to Figure 5, we can see the distribution law of the deflection angle from the short sling to the mid-span sling under different temperatures: the deflection angle of the sling decreases as the length of the sling increases. The decrease in the first 4 slings is quite obvious, while the deflection angles of the other 11 slings are affected very little by the temperature, which is negligible. The degree of deformation of the short sling is approximately 4 fold that of the second-shortest sling. In other words, the deformation of the No. 1 sling is approximately 75% less than that of the No. 2 sling. The degree of deformation of the second-shortest sling is approximately 2 fold that of the No. 3 sling. In other words, the degree of deformation of the No. 1 sling is approximately 7.7 fold that of the No. 3 sling and approximately 12.5 fold that of the No. 4 sling. Therefore, the study of the bending deformation of slings mainly focuses on short slings and subcohort slings. As shown in Figure 6, the deflection angle of the short sling and the second shortest sling increases linearly with the temperature increase, and the deformation of the sling under the action of temperature obtained by finite element simulation is very close to that theoretically calculated.

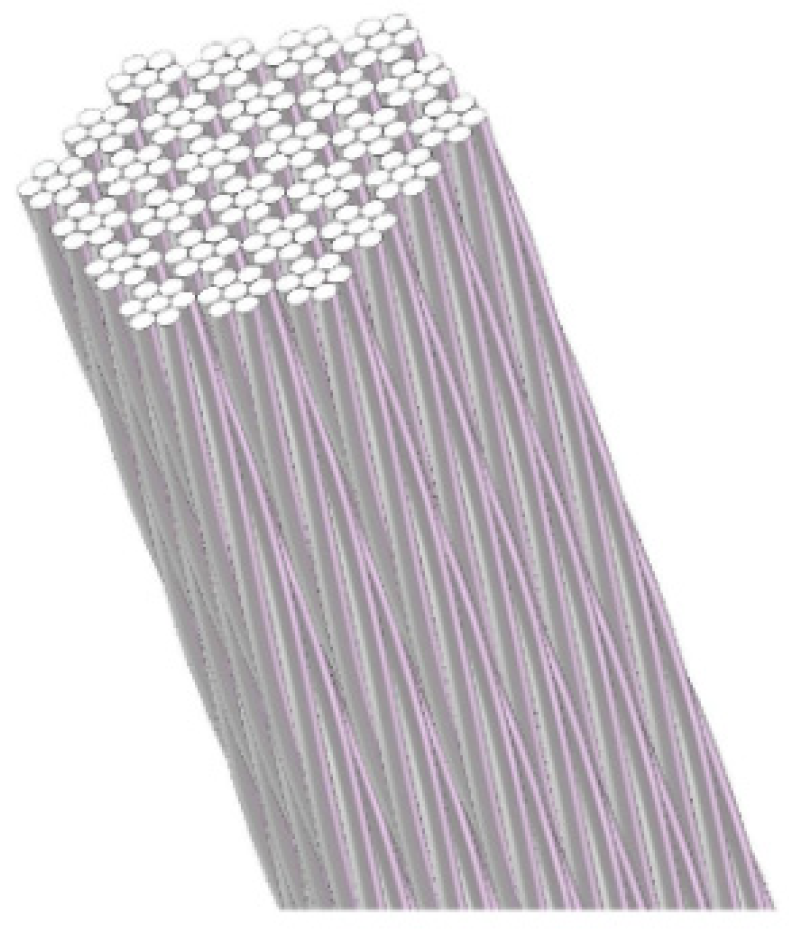
3. Finite Element Analysis of the Static Performance of Steel Stranded Slings with Different Axial Deflection Angles

A whole bunch of extruded strand sling generally consists of 1, 3, 7, 9, 12, 19, and 27 strands of seven 1860 MPa steel stranded wires of 15.2 mm diameter that are arranged in a certain way and are wrapped with anti-corrosive materials on the periphery [22]. The number of strands determines the size of its tensile capacity. The modeling parameters include the center steel wire radius Rc, the outer wire radius Rh, and the steel wire paracord angle α, as shown in Figure 7. Finite element software used ANSYS LS-DYNA (version R19.0). The steel strand model adopts solid cells, and the mesh division is carried out in a sweeping and abbreviated way. The edge size of the end section of each steel wire is adjusted, which is divided into 12 sides, and the mesh is divided along the axial direction of the steel wire by the sweeping method, as shown in Figure 8. The number of partitions corresponding to each edge is 100, and the grid type is quadrilateral or trilateral, which is automatically controlled by the program. The finite element model cell division is shown in Figure 9 below. In this particular cell division process, the orientation of the solid cell end face within the central wire aligns perpendicularly to the cross-section of the tension cable. However, within the twisted wire, the solid cell end face is positioned perpendicular to the axis of the helical wire. Previous literature [23] solely applies axial displacements to the end section nodes under loading in the finite element model. In contrast, the model developed in this study liberates degrees of freedom along the vertical axis to accommodate tie rope rotations. To address the boundary conditions within the prestressed cable, an additional “loading section” is introduced within the finite element model. To ensure common nodes exist at both ends connecting to the cable body, a shared topology is employed. Furthermore, a contact unit is established on select wire surfaces of the cable body with elastic–plastic wire material. The segment labeled the “loading section” on the wire surface lacks a contact unit. In this zone, the wire material is modeled as purely elastic, featuring a high yield strength, and maintaining a perpetual elastic state.
The coefficient of friction determines the critical stress of mutual slip between adjacent steel wires. The normal contact between adjacent steel wires is “hard”, and the tangential friction formula between the stranded steel wire uses the penalty function. The friction coefficient is set at 0.115 [24]. Damage criteria adopt the Von Mises yield criterion and bilinear isotropic strengthening criterion. Usually, the arch bridge sling is made of multistranded wire combinations, and the number of strands is designed according to the span size and bearing capacity of the arch bridge [25]. Both ends of the strand slings are cemented by anchorage, and the outer body of the cable is wrapped with a steel sleeve. Each strand fits tightly together and imparts forces on each other. When there is no shaft deflection angle, the force on the sling is uniform. When there is a shaft deflection angle, the force on the sling is uneven, and the force between the strands will become complicated, which will have an unknown effect on its mechanical properties. The modeling process of a multistranded strand sling is the same as that of a single stranded seven-wire strand, which is combined according to a fixed arrangement. The 27-strand strand sling model is shown above in Figure 9.
In the fabrication process of the slings as well as in the tension and fatigue tests, the maximum load to which the slings were subjected did not exceed 0.45 σ b [26]. To verify that the shaft deflection will cause the stress concentration at the anchorage end of the stranded sling, the tensile simulation of a single strand was carried out at 4 angles (0 mrad, 10 mrad, 20 mrad, and 30 mrad), and the load of 0.45 σ b was applied in the “loading section”. The stress distribution cloud diagram of the cross-section at 1 cm, 4 cm, and 7 cm from the anchorage end was taken. As shown in Figure 10, when the axial deflection angle is 0 mrad, the sling is subjected not only to axial tension but also to a uniform force, and the stress decreases from the inside to the outside in a round shape. However, when the strand as a whole is subjected to axial tension, to adapt to the deformation, there will be a certain tendency of misalignment between the wires. This results in a gripping effect on the outer filament, which causes the center steel wire to be squeezed by the outer wires so that the stress at the point of mutual contact between the outer wire and the center wire is greater than that at the outer side. The local stress value at the end is larger than that at the center because there is a sudden change in stiffness at the connection between the cable body and the anchorage end, and it is close to the position where the load is applied. When the axial deflection angle is 10 mrad, 20 mrad, and 30 mrad, the stress distribution cloud diagram of one strand of the sling is shown in Figure 11, Figure 12 and Figure 13, respectively. When the axial deflection angle is generated, the stress concentration phenomenon occurs at the anchorage end of the sling. The stress value of the stranded outer wire is maximum. The stress value of the sling cross-section shows an obvious distribution in a stepwise manner and decreases gradually from outside to inside. The ratio of the stress in the strand on the side far from the axis (far axis side) to the stress in the strand on the side close to the axis (near axis side) increases with the increase in the angle of axis deflection. When the axial deflection angle is 30 mrad, the stress ratio reaches 5.46 at 1 cm from the anchorage end. The further the distance from the anchorage end is, the lower the strand cross-section stress, which can be seen when the axial deflection angle is generated. The maximum stress occurs at the anchored end of the strands, as shown in Table 3.
The 1860 MPa stranded sling with a 15.2 mm diameter was tensioned at 0.45 σ b . Tensile simulations were performed on 1, 3, 7, 9, 12, 19, and 27 stranded slings at four angles (0 mrad, 10 mrad, 20 mrad, and 30 mrad), and the simulated stresses were taken from the cross-sections at 1 cm, 4 cm, and 7 cm away from the anchorage end, which are shown in Table 3 and Figure 14. The average stress in tension at 0.45 σ b is 837 MPa. The maximum stress of a single strand sling at 1 cm from the anchorage end is 936.4 MPa when the deflection angle is 0 mrad and 1257.3 MPa when the deflection angle is 30 mrad, which increases by 0.34 fold. The maximum stress increased by 0.93 fold from 0 mrad to 30 mrad for the 3-strand sling, 1.05 fold for the 7-strand sling, 1.10 fold for the 12-strand sling, 1.06 fold for the 19-strand sling, and 1.05 fold for the 27-strand sling. The greater the number of strands the greater the effect of the axial deflection angle on the stresses in the cross-section. When the angle of shaft deflection is 30 mrad, the cross-sectional stresses at 1 cm from the anchorage ends of the 3, 7, 12, 19, and 27 strand slings are 40.5%, 42.1%, 48.8%, 41.0%, and 40.3% larger than that of a single strand, respectively. According to the data in Table 3, whether at different shaft deflection angles or for slings with different numbers of strands, the stress concentration phenomenon is somewhat weakened as the distance from the anchorage end increases. The larger the axial deflection angle is, the more obvious the stress concentration phenomenon. The stress cloud of the 27-strand sling cross-section is shown in Figure 15.
The damage pattern of the steel stranded wire at the four axial deflection angles is basically the same. The outer wire at the anchorage end is destroyed first, which will be completely separated from the body of the cable when loaded to the last “load segment”. The breakage form of the multistranded steel strand sling under different axial deflection angles is basically the same, as shown in Figure 16. As seen from Figure 16, similar to the damage pattern of a single strand, the damage pattern of the multistranded sling will also show an “explosion” shape and break along the direction of the strand. The anchorage end of the steel strand on the far axis side of the sling is still the first position at which a break occurs. The ultimate tensile strength of the sling is seriously weakened by the concentrated stress caused by the axial deflection angle.
It is known from the tension tests at different shaft deflection angles that the larger the shaft deflection angle is, the greater the degree of differentiation of the strain values at different locations. It is impossible to extract the strain at a certain position in the finite element simulation, and the stress–strain behavior of the material is generally used to define the whole model. However, under the action of different axis deflection angles, the force of each steel wire is not uniform, so the resulting concentrated stress will cause deformation of the steel wire. Therefore, during the finite element simulation, this study selected three nodes at 3 cm, 6 cm, and 9 cm from the anchored end in the strand model. These three nodes are not on the same steel wire, but all of them are at the end of the steel wire on the far-axis side. The displacement load curve was then extracted for comparison, which can only be extracted to the magnitude of the displacement when the first steel wire breaks and produces the results shown in Figure 17. It can be seen in Figure 17 that the displacement change in the three nodes is extremely close, and not much differentiation occurs when the axis deflection does not occur, which is due to the uniformity of the steel wire axial force. The deformation of the node increases with increasing tensile force. With the increase in shaft deflection angle, the distinction of displacement of the three nodes occurs, of which the degree increases with the increase in the load. The law of change obtained from the test is verified.
For multistranded stranded wire slings, the basic unit used is the same. However, the breaking force increases with the increase in the number of strands, so the breaking strength of the sling is used for direct comparison. Table 4 and Figure 18 show the breaking strength of multistranded steel stranded slings under different axis deflections. Table 4 shows that the tensile strength of the steel stranded slings is almost equal in the absence of deflection, indicating that the force inside the sling is uniform under the action of a vertical tensile force. The variation trend of the breaking strength of the multistranded stranded wire sling is basically the same, as shown in Figure 19. With the increase in the axis deflection angle, the ultimate tensile property decreases, and the breaking strength also has a certain degree of decline. From 0 mrad to 30 mrad, the breaking strength of the 1-strand sling decreases by 13.9%, while that of the 3-strand sling decreases by 15.5%, the 7-strand sling decreases by 13.1%, the 12-strand sling decreases by 10.0%, the 19-strand sling decreases by 15.9%, and the 27-strand sling decreases by 16.3%.
To validate the precision of the finite element analysis applied to the stranded wire cable under varying axial deflections, a tension test was conducted on 19 strands of Φ15.2 mm strand slings, exploring different axial deflections. The static load test took place at the Liuzhou OVM Machinery Co., Ltd.’s experiment center, utilizing the 1200 T static load test stand and specific equipment depicted in Figure 20. The experimental setup utilized an OVM hydraulic oil pump and YCW1200 jack as the tensioning apparatus. The force transducer employed was a CL-YB-12MN anchor force transducer, boasting a maximum range of 12,000 kN and an uncertainty level of 0.02. The Donghua static strain test and analysis system served as the data acquisition system. The test implementation involved modifying the pad of the strand sling to allow deflection of the anchored strand. Deflection angles were set at 0 mrad, 10 mrad, 20 mrad, and 30 mrad, with each strand stretched at these angles until reaching breakage, thereby capturing the breaking force at each deflection angle, as outlined in Table 5. The results presented in Table 5 and Figure 21 illustrate a decreasing trend in the breaking force of the stranded wire sling as the deflection angle increases. Specifically, the breaking force diminishes by approximately 5.7% at a deflection angle of 10 mrad, by about 8.1% at 20 mrad, and notably by approximately 15.5% at 30 mrad. This trend signifies an escalating reduction in the breaking force of the stranded wire sling with increasing deflection angles.

4. Finite Element Analysis of the Fatigue Performance of Steel Stranded Wire Slings under Different Axial Deflections

The forces in multistranded slings are relatively complex, and the interaction forces between strands are uncertain [27]. In long-term repeated loading, the distribution of forces within the sling is relatively complex. Because fatigue damage is brittle damage, when a steel wire inside the sling is broken, although the sling structure can still maintain the stress state, its fatigue mechanism changes [28,29]. The relationship curve between working stress amplitude and fatigue life obtained by the test [30], namely the so-called S-N curve, is the basis for evaluating the fatigue life of the component. When the material is steel wire or steel strand, the S-N curve will appear on the horizontal asymptote segment. The maximum stress S 0 on the horizontal asymptote is called the fatigue limit. The number of cycles corresponding to the maximum stress on the horizontal asymptote segment is represented by N 0 and is called the cycle base point. In practical engineering, N 0 is often used as the cycle base point for metal materials, of which the value is equal to 10 6 . The fatigue strength curve of steel strand is an important parameter for fatigue calculation of arch bridge suspension rods. Ma [31] conducted systematic fatigue tests on 1860-grade steel strands and obtained the following formula for the calculation of the S-N curve of steel strands:
log 10 N = 13.84 3.5 lg S a
where N is the number of cycles of fatigue damage; S a is the fatigue stress amplitude under alternating load.
The Ansys Workbench 2020R2 model uses the solid186 solid unit, which supports plasticity, stress stiffening, nonlinear analysis of large deformations, hyperelasticity, and creep. The material properties are defined inside the software as shown in Table 6 and imported into N code Design through material mapping. The S-N curves are adopted from the stress fatigue life curves of the 1860 grade strand obtained by Ma [31].
Considering the phenomenon of stress concentration at the anchoring end of the steel strand, which has a great impact on the fatigue life, the mesh division at the junction is reasonably encrypted, and multiple element quality indexes of the mesh quality are investigated, including maximum corner angle, the Jacobian ratio, element quality, and aspect ratio, to confirm that the mesh quality is reasonable and fully meets the needs of fatigue durability calculation. A multistranded steel strand sling model was established, and a fatigue simulation was carried out on the model. The fatigue performance of the model under different axial deflection angles was tested and the resulting data was analyzed, and the fatigue life values of multistranded steel strands under different axial deflection angles were obtained, as shown in Table 7 and Figure 22. According to the data in the table, the fatigue life of the strand slings reaches 2 million cycles when no shaft deflection occurs, which is in line with the national standard. With the increase in the shaft deflection angle, the fatigue life of the slings decreased to a certain extent. From 0 mrad to 30 mrad, the fatigue life decreases by 27.8% for 3 stranded slings, 20.6% for 7 stranded slings, 23.6% for 12 stranded slings, 24.3% for 19 stranded slings and 25.4% for 27 stranded slings. Figure 22 shows that the fatigue life of the strand slings decreases at a rapidly increasing rate as the angle of shaft deflection increases. It is necessary to re-evaluate the fatigue performance of the slings. The 27 strands of a stranded wire sling are taken as an example, and the fatigue life cloud of 27 strands of steel stranded wire slings is shown in Figure 23. It can be seen from the fatigue life cloud that the force of a multistranded wire sling is uniform when no shaft deflection occurs, so the life value of the part of the stressed cable body is the same. When there are axis deflection angles, the minimum life value appears at the outmost anchor end of the steel stranded sling. The life of the outer strand away from the axis is the smallest. The change rule is basically the same as that of a single steel strand.
To verify the accuracy of the finite element fatigue analysis of the stranded wire slings under different deflection angles, fatigue tests of 19 strands of Φ15.2 mm strand slings under different deflection angles were carried out as shown in Figure 24 and Figure 25. The fatigue test was carried out in the laboratory of the technology center of Liuzhou Oveum Machinery Co. The model of the fatigue testing machine is 2000KNGPL-2000, and the angles of the slopes of the pads on the test platform for installing the stranded wire slings are 10 mrad, 20 mrad, and 30 mrad. Fatigue testing is carried out after symmetrically tensioning and pretensioning the stranded wire slings two times. The loading frequency was 1~1.5 Hz, and the number of cyclic loading was 2 million times. The test results are shown in Table 8.
According to the data in Table 8, compared with the test fatigue value of the sling under 0 mrad, the fatigue performance of the steel strand sling with a deflection angle of 10 mrad is about 11.1% lower, the fatigue performance of the steel strand sling with a deflection Angle of 20 mrad is about 21.1% lower, and the fatigue performance of the steel strand sling with a deflection angle of 30 mrad is about 35.9% lower. It can be seen that with the increase in deflection angle, the fatigue performance of steel strand sling decreases greatly. The comparison results of the fatigue test and the simulated fatigue test are shown in Figure 26.
According to the requirements of the relevant code, the fatigue life of normal service steel stranded wire specimens should reach 2 million cycles. However, the fatigue life of strand sling under different axial deflection angles decreases significantly, which seriously jeopardizes the safety status of the bridge. Therefore, it is necessary to monitor the safety of bridge slings in service. If shaft deflection occurs, it should be corrected in time to avoid accidents.

5. Conclusions

Under the action of vehicles and temperature, the arch ribs and the bridge deck of the arch bridge will have relative displacement along the direction of the bridge, resulting in bending stresses at the ends of the short slings due to different axes. This paper simulates the whole bridge deflection angle, maximum stress at the working force value, breaking strength at the axis deflection angle, fatigue life, and other properties to obtain the following conclusions:
(1)
Whether under full bridge load or deflected load, the distribution patterns of deflection angles of slings are the same, and the angles of deflection are also similar. The deflection angle of the short slings under the deflected load is slightly larger than that under the full bridge load. From the short sling to the mid-span sling, the distribution pattern of deflection angles under the action of different temperatures is almost the same. The deflection angles of the short sling and second shortest sling increase linearly with increasing temperature. The deflection angle of the sling decreases as the length of the sling increases.
(2)
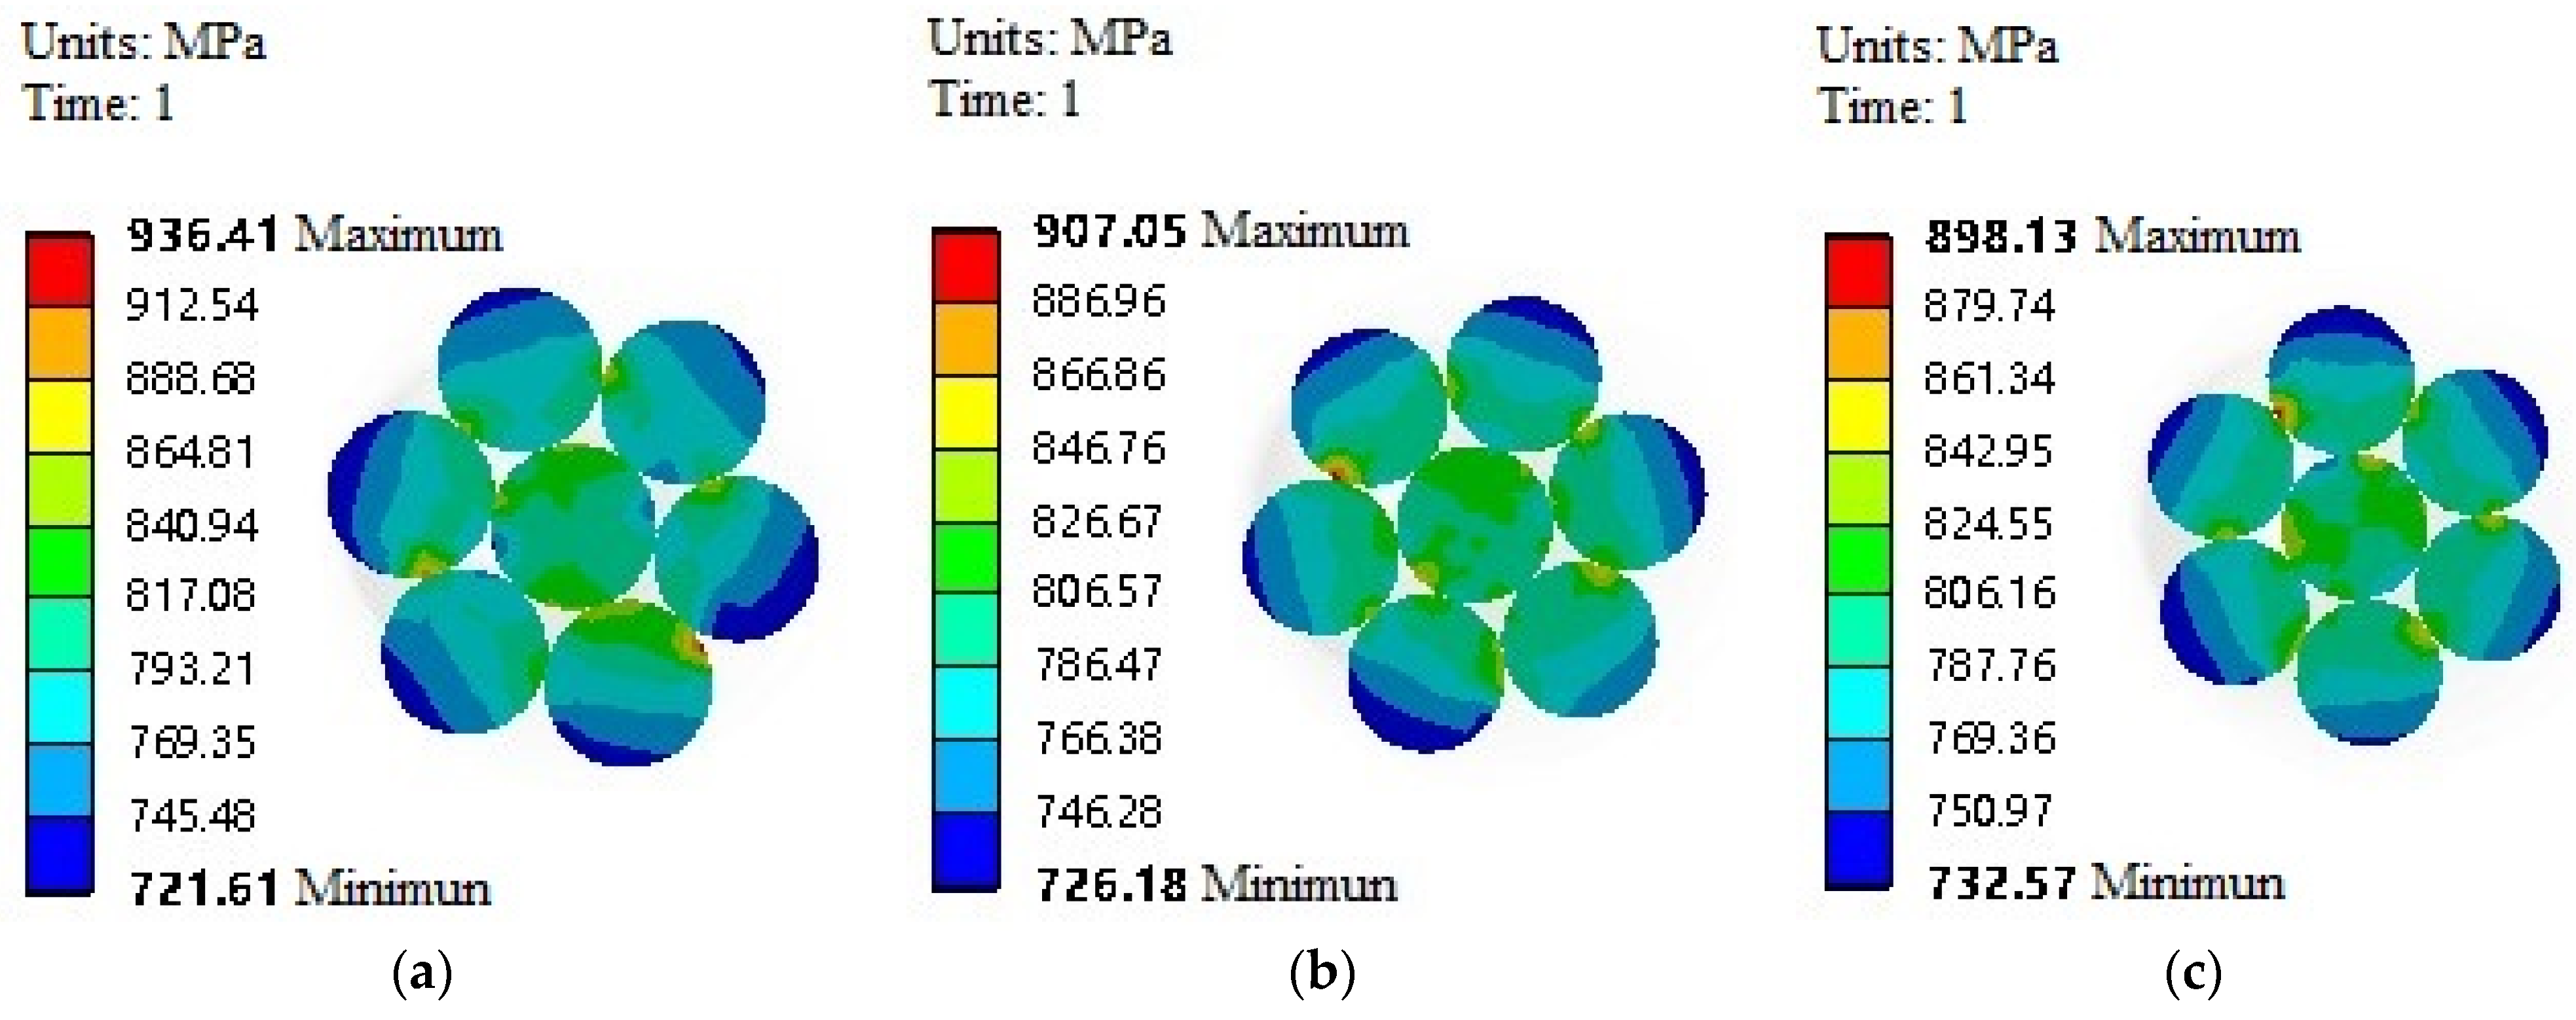
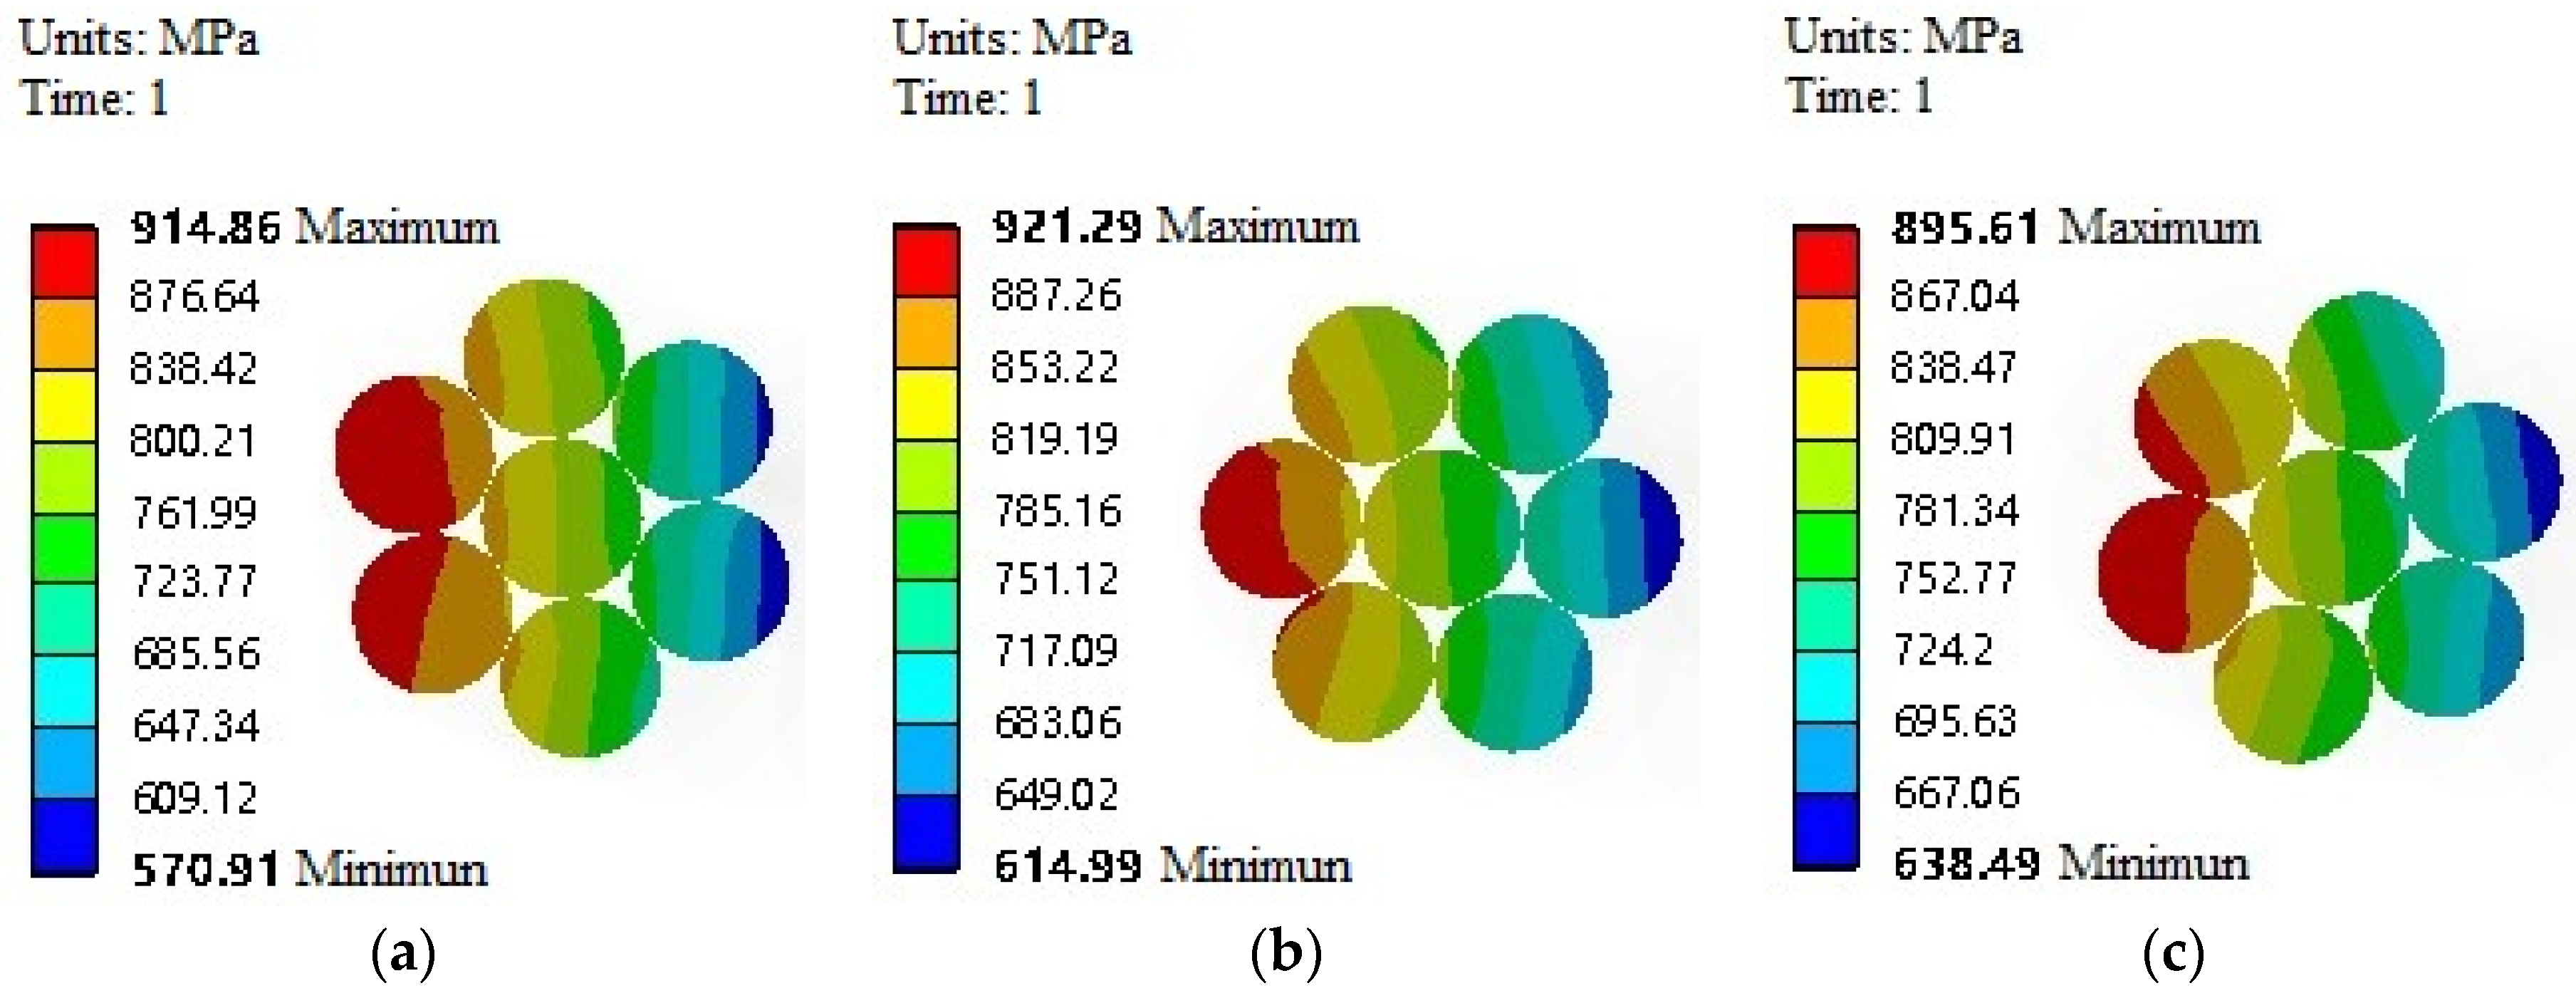
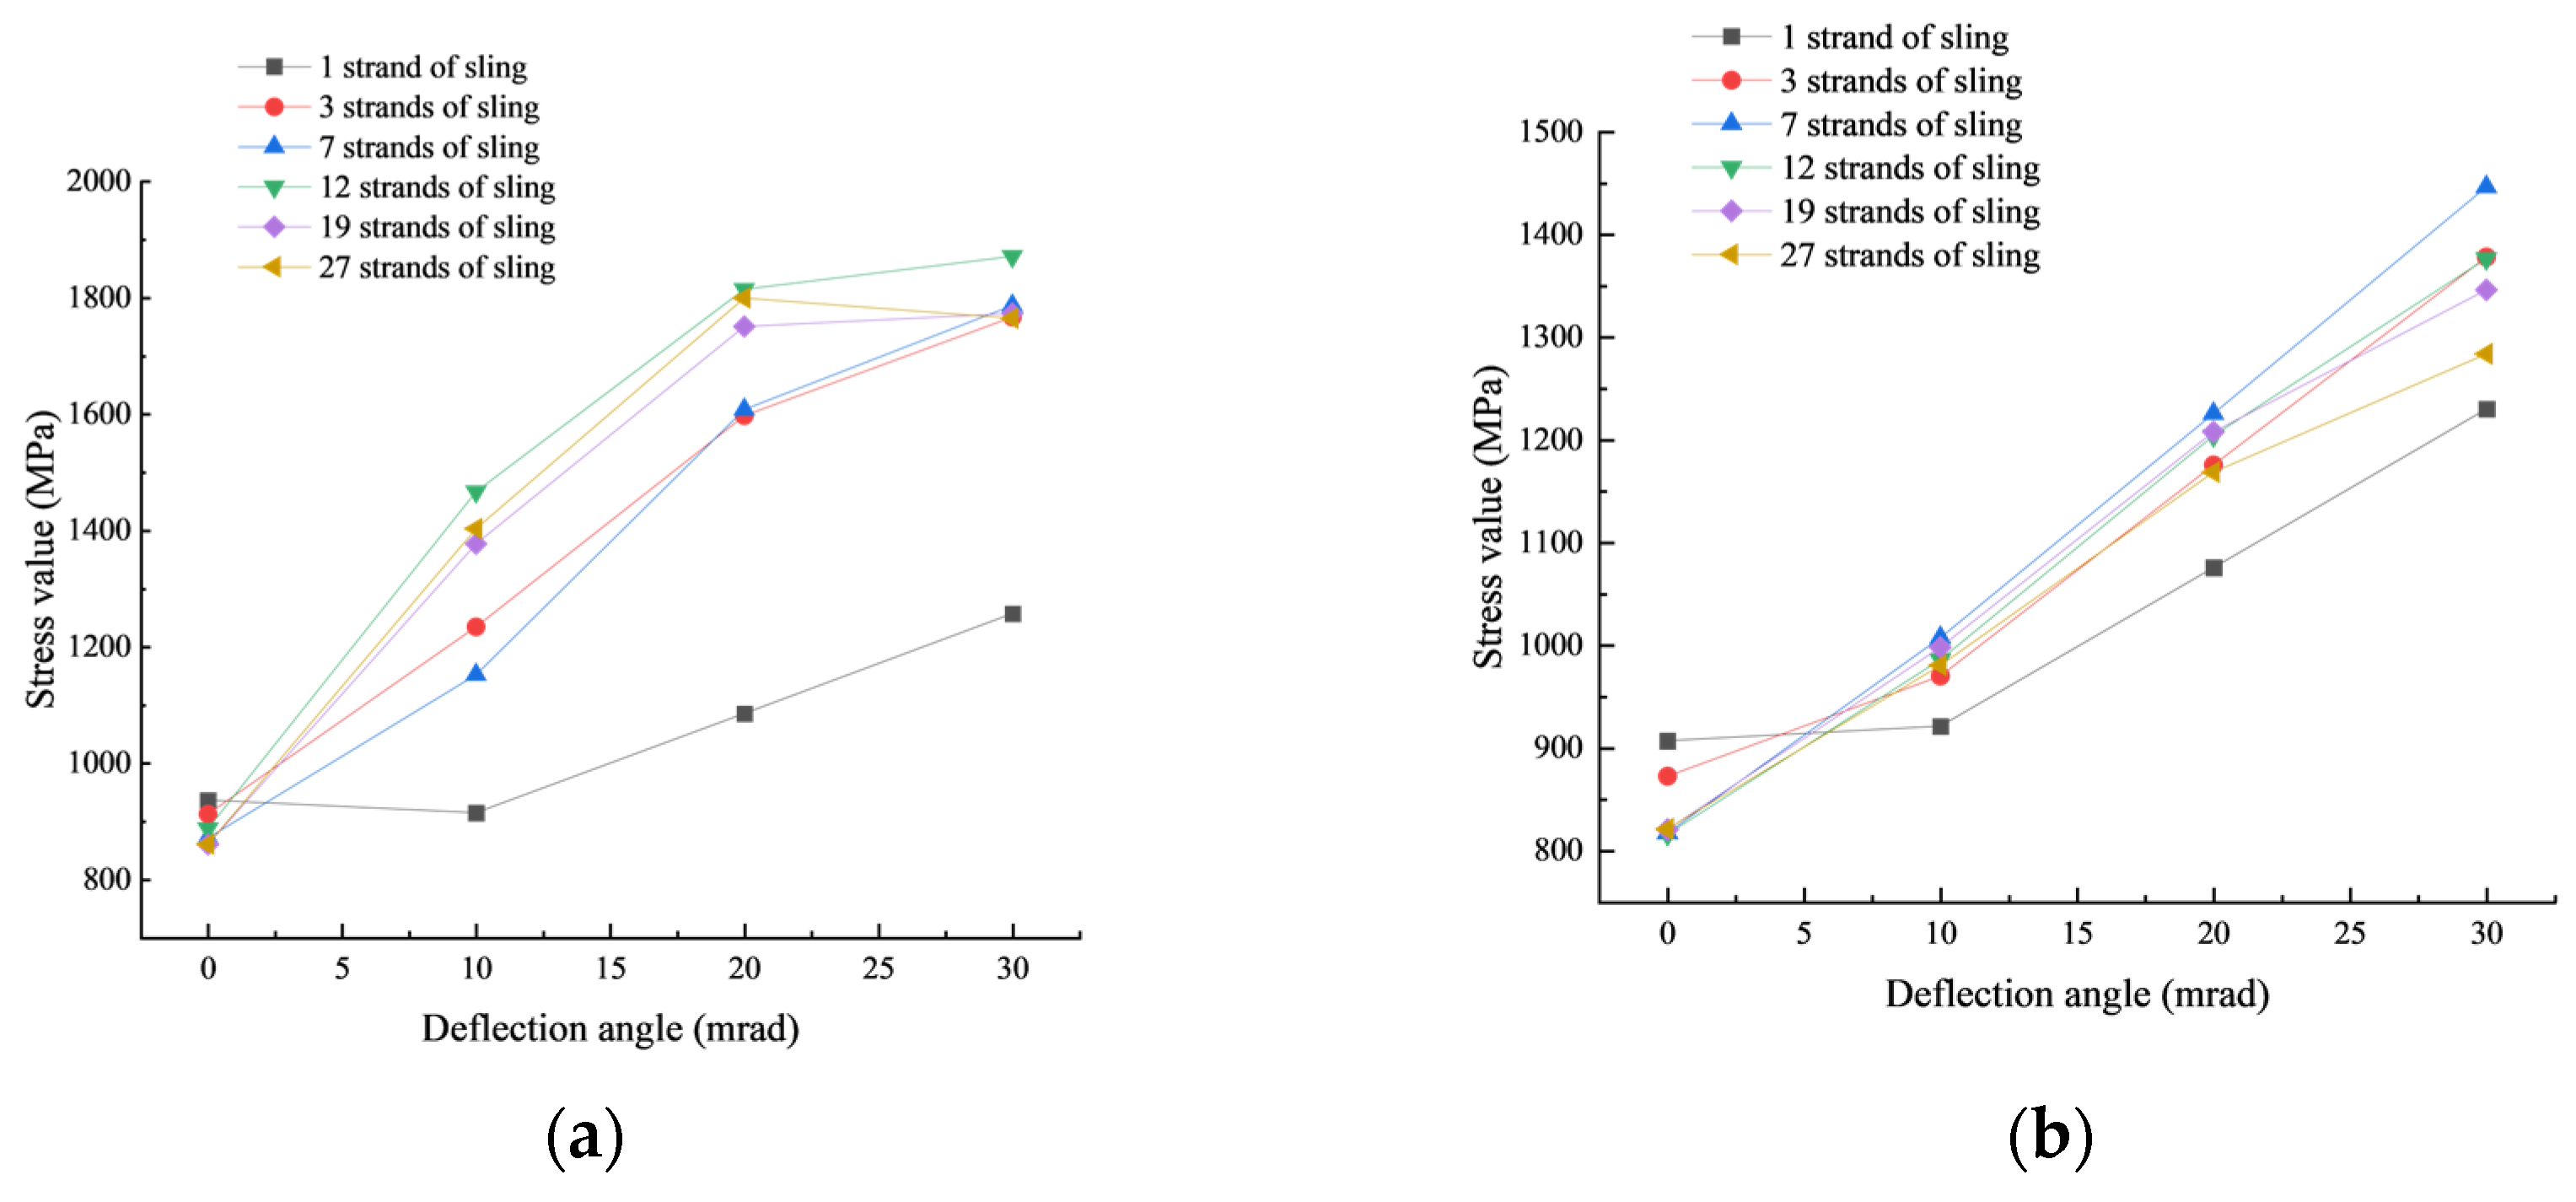
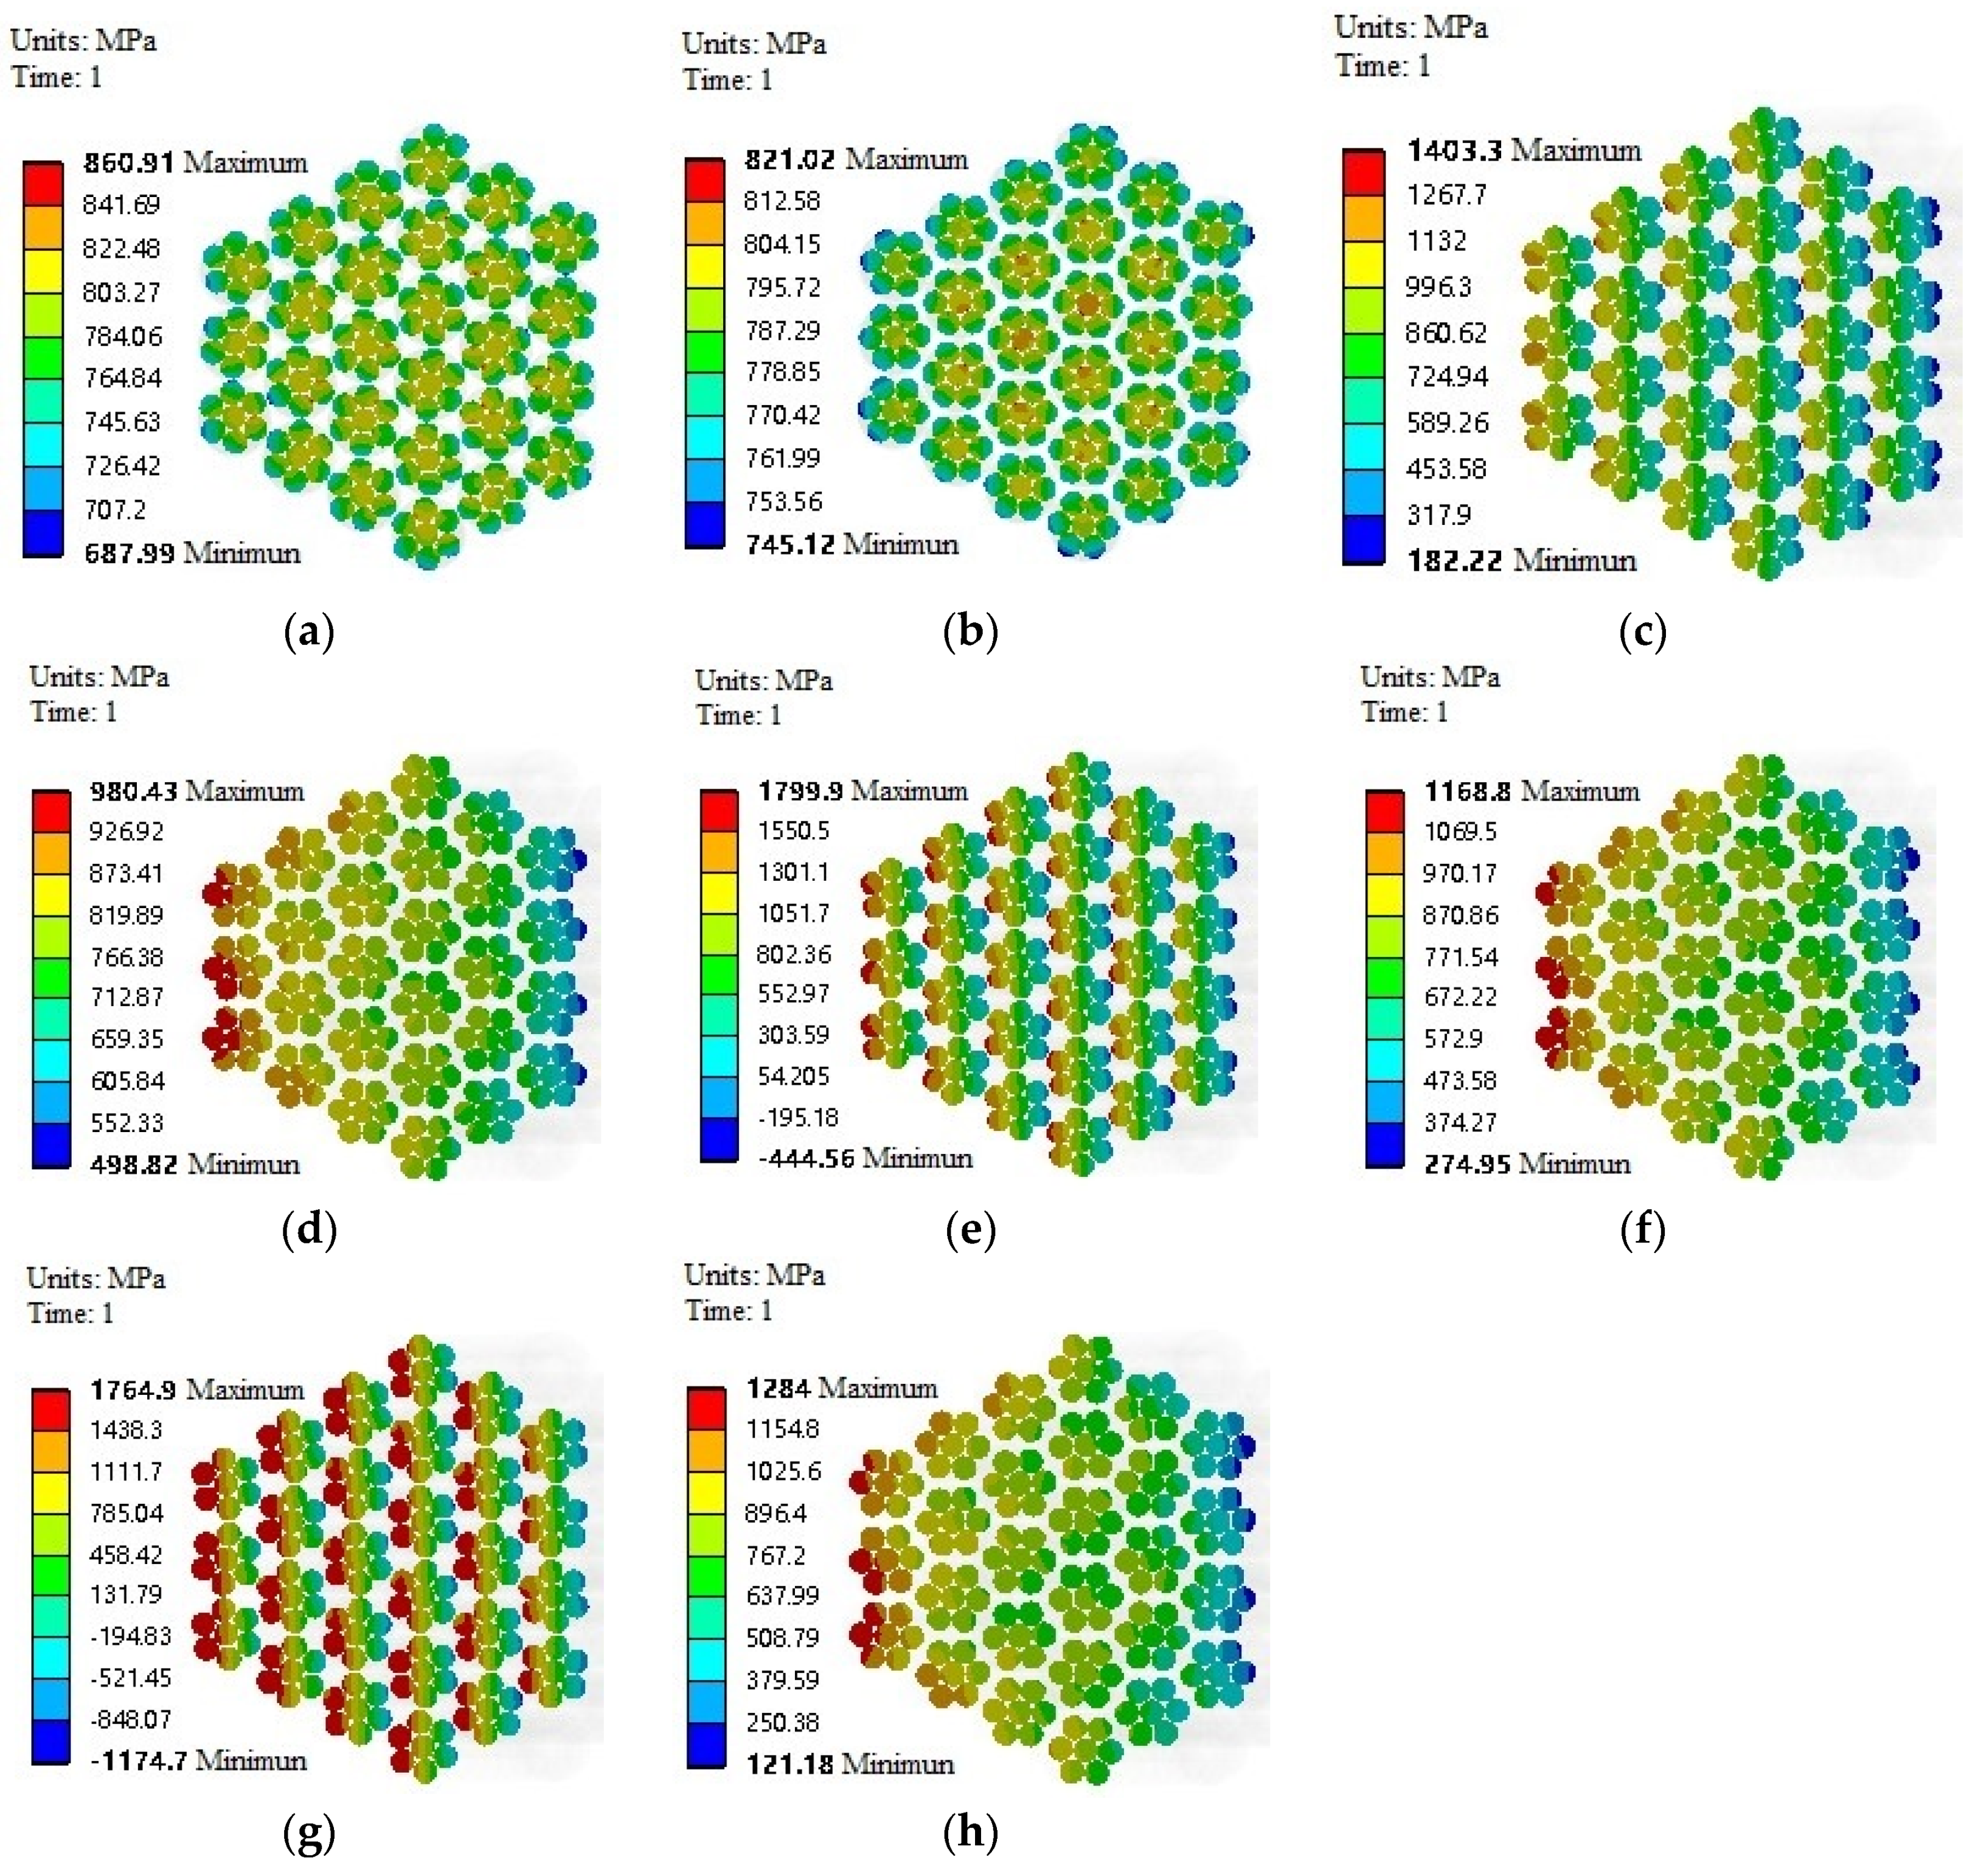
The performances of 1, 3, 7, 9, 12, 19, and 27 strands of 1860 MPa whole bunch extruded strand slings were simulated and analyzed at different axial deflection angles at 0.45 σ b force values. At 1 cm from the anchorage end, the maximum stress of the single-strand sling is 936.4 MPa at a deflection angle of 0 mrad, and the maximum stress is 1257.3 MPa at a deflection angle of 30 mrad, which increases by 0.34 fold. The maximum stress increases by 0.93 fold for the 3-strand sling from 0 mrad to 30 mrad, 1.05 fold for the 7-strand sling, 1.10 fold for the 12-strand sling, 1.06 fold for the 19-strand sling, and 1.05 fold for the 27-strand sling. The ultimate tensile properties decreased with increasing shaft deflection angle.
(3)
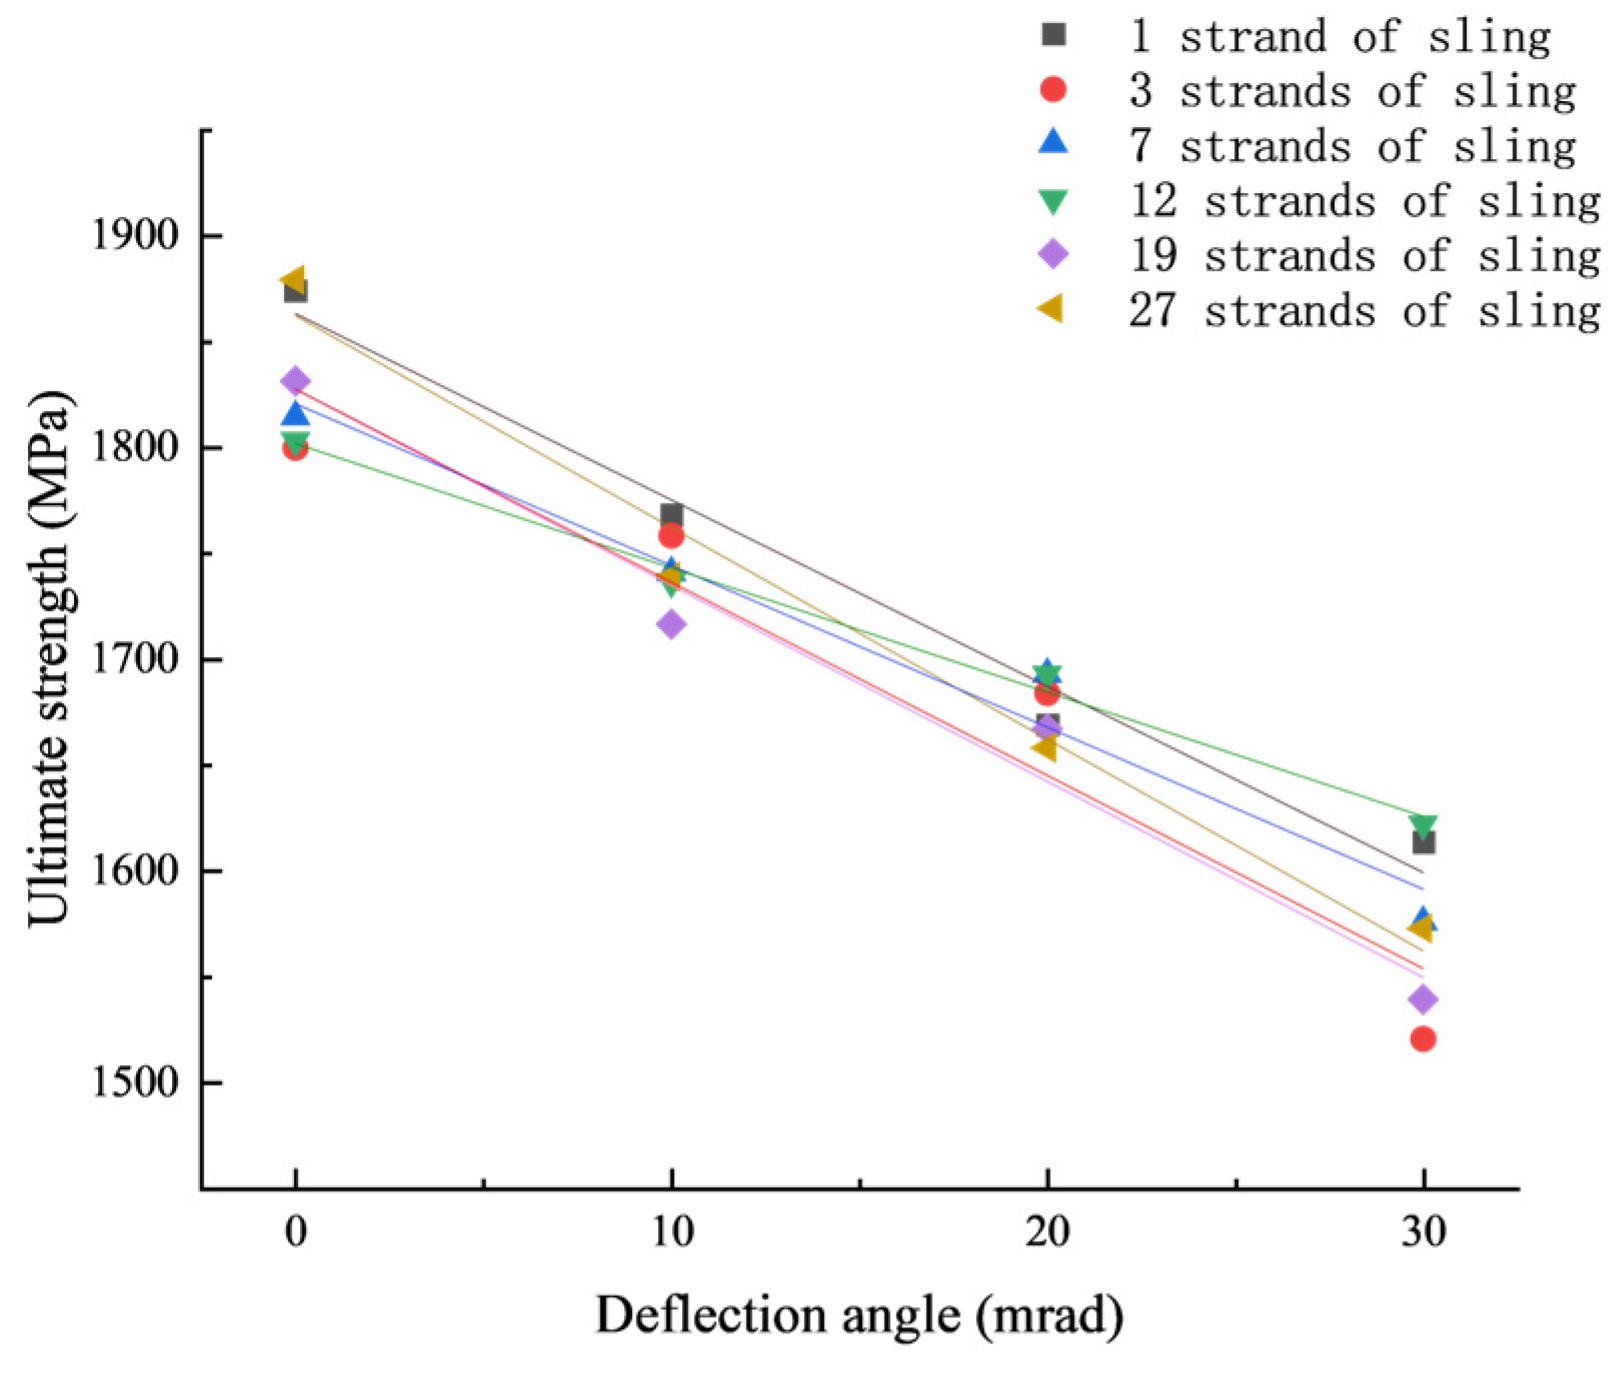
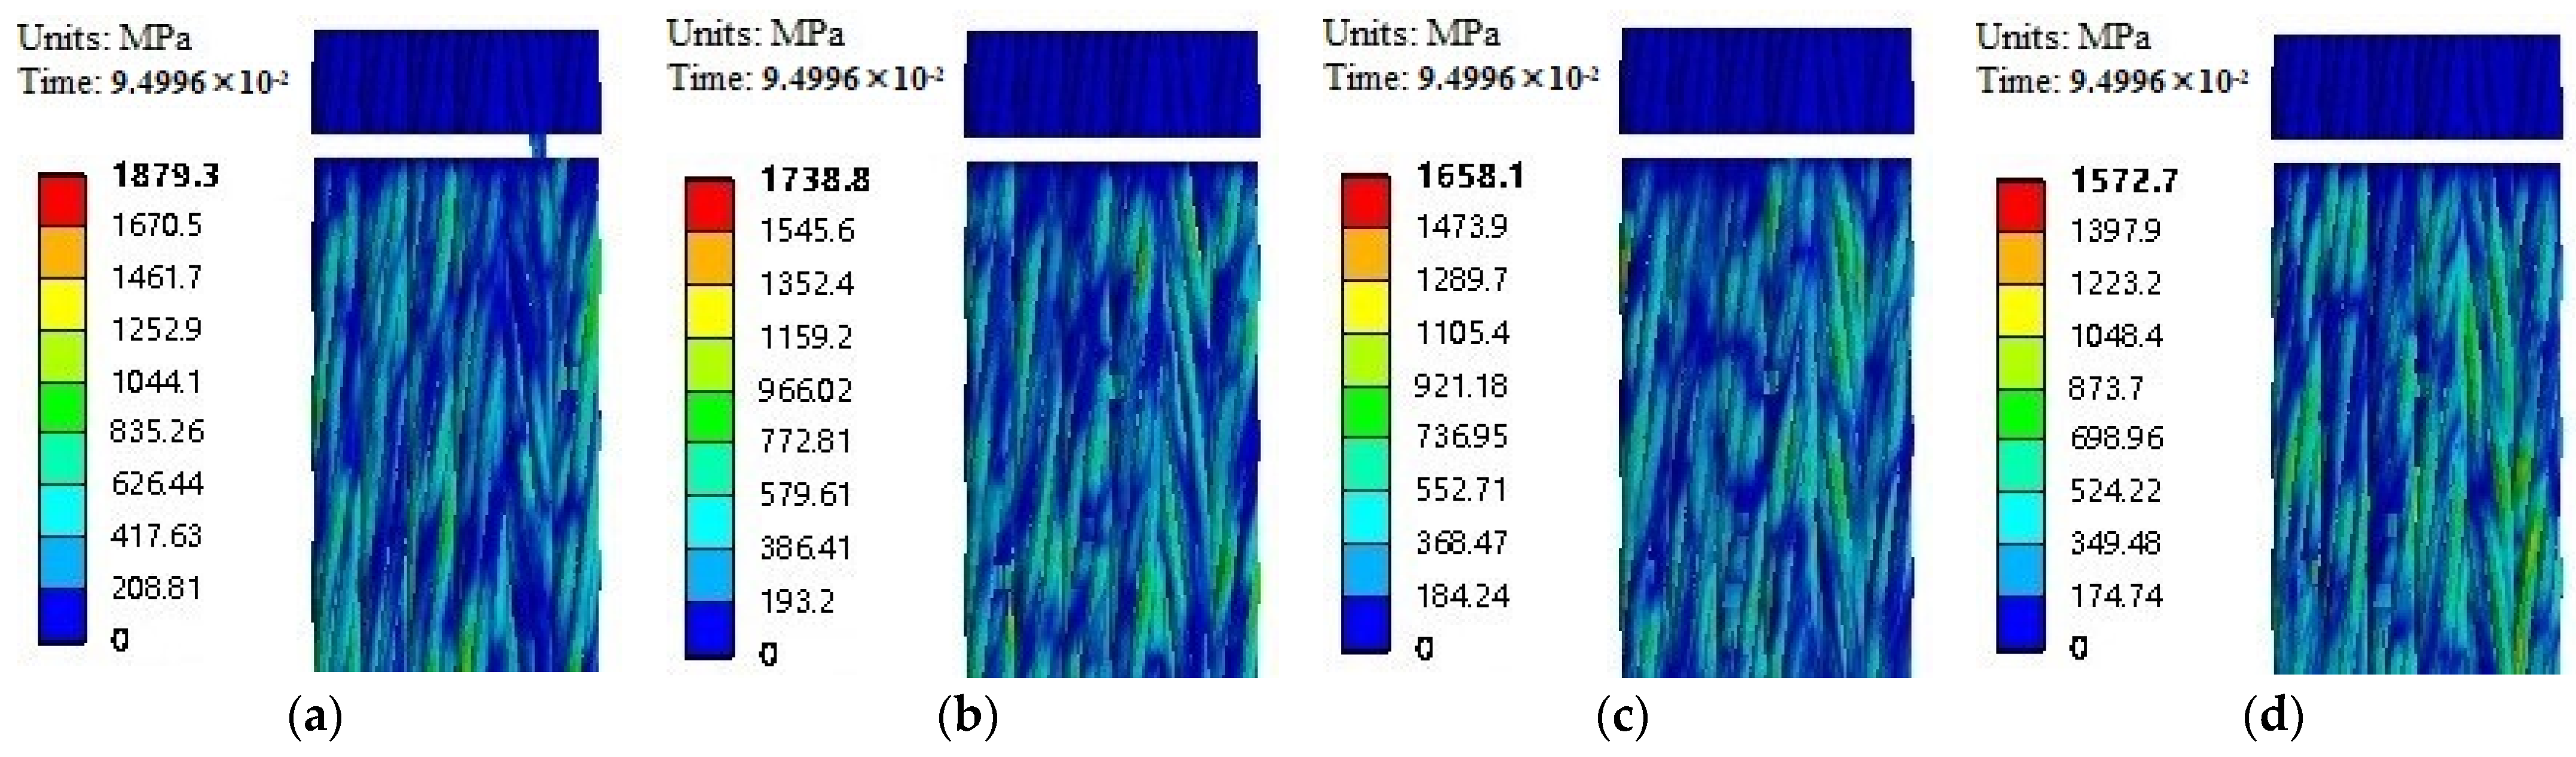
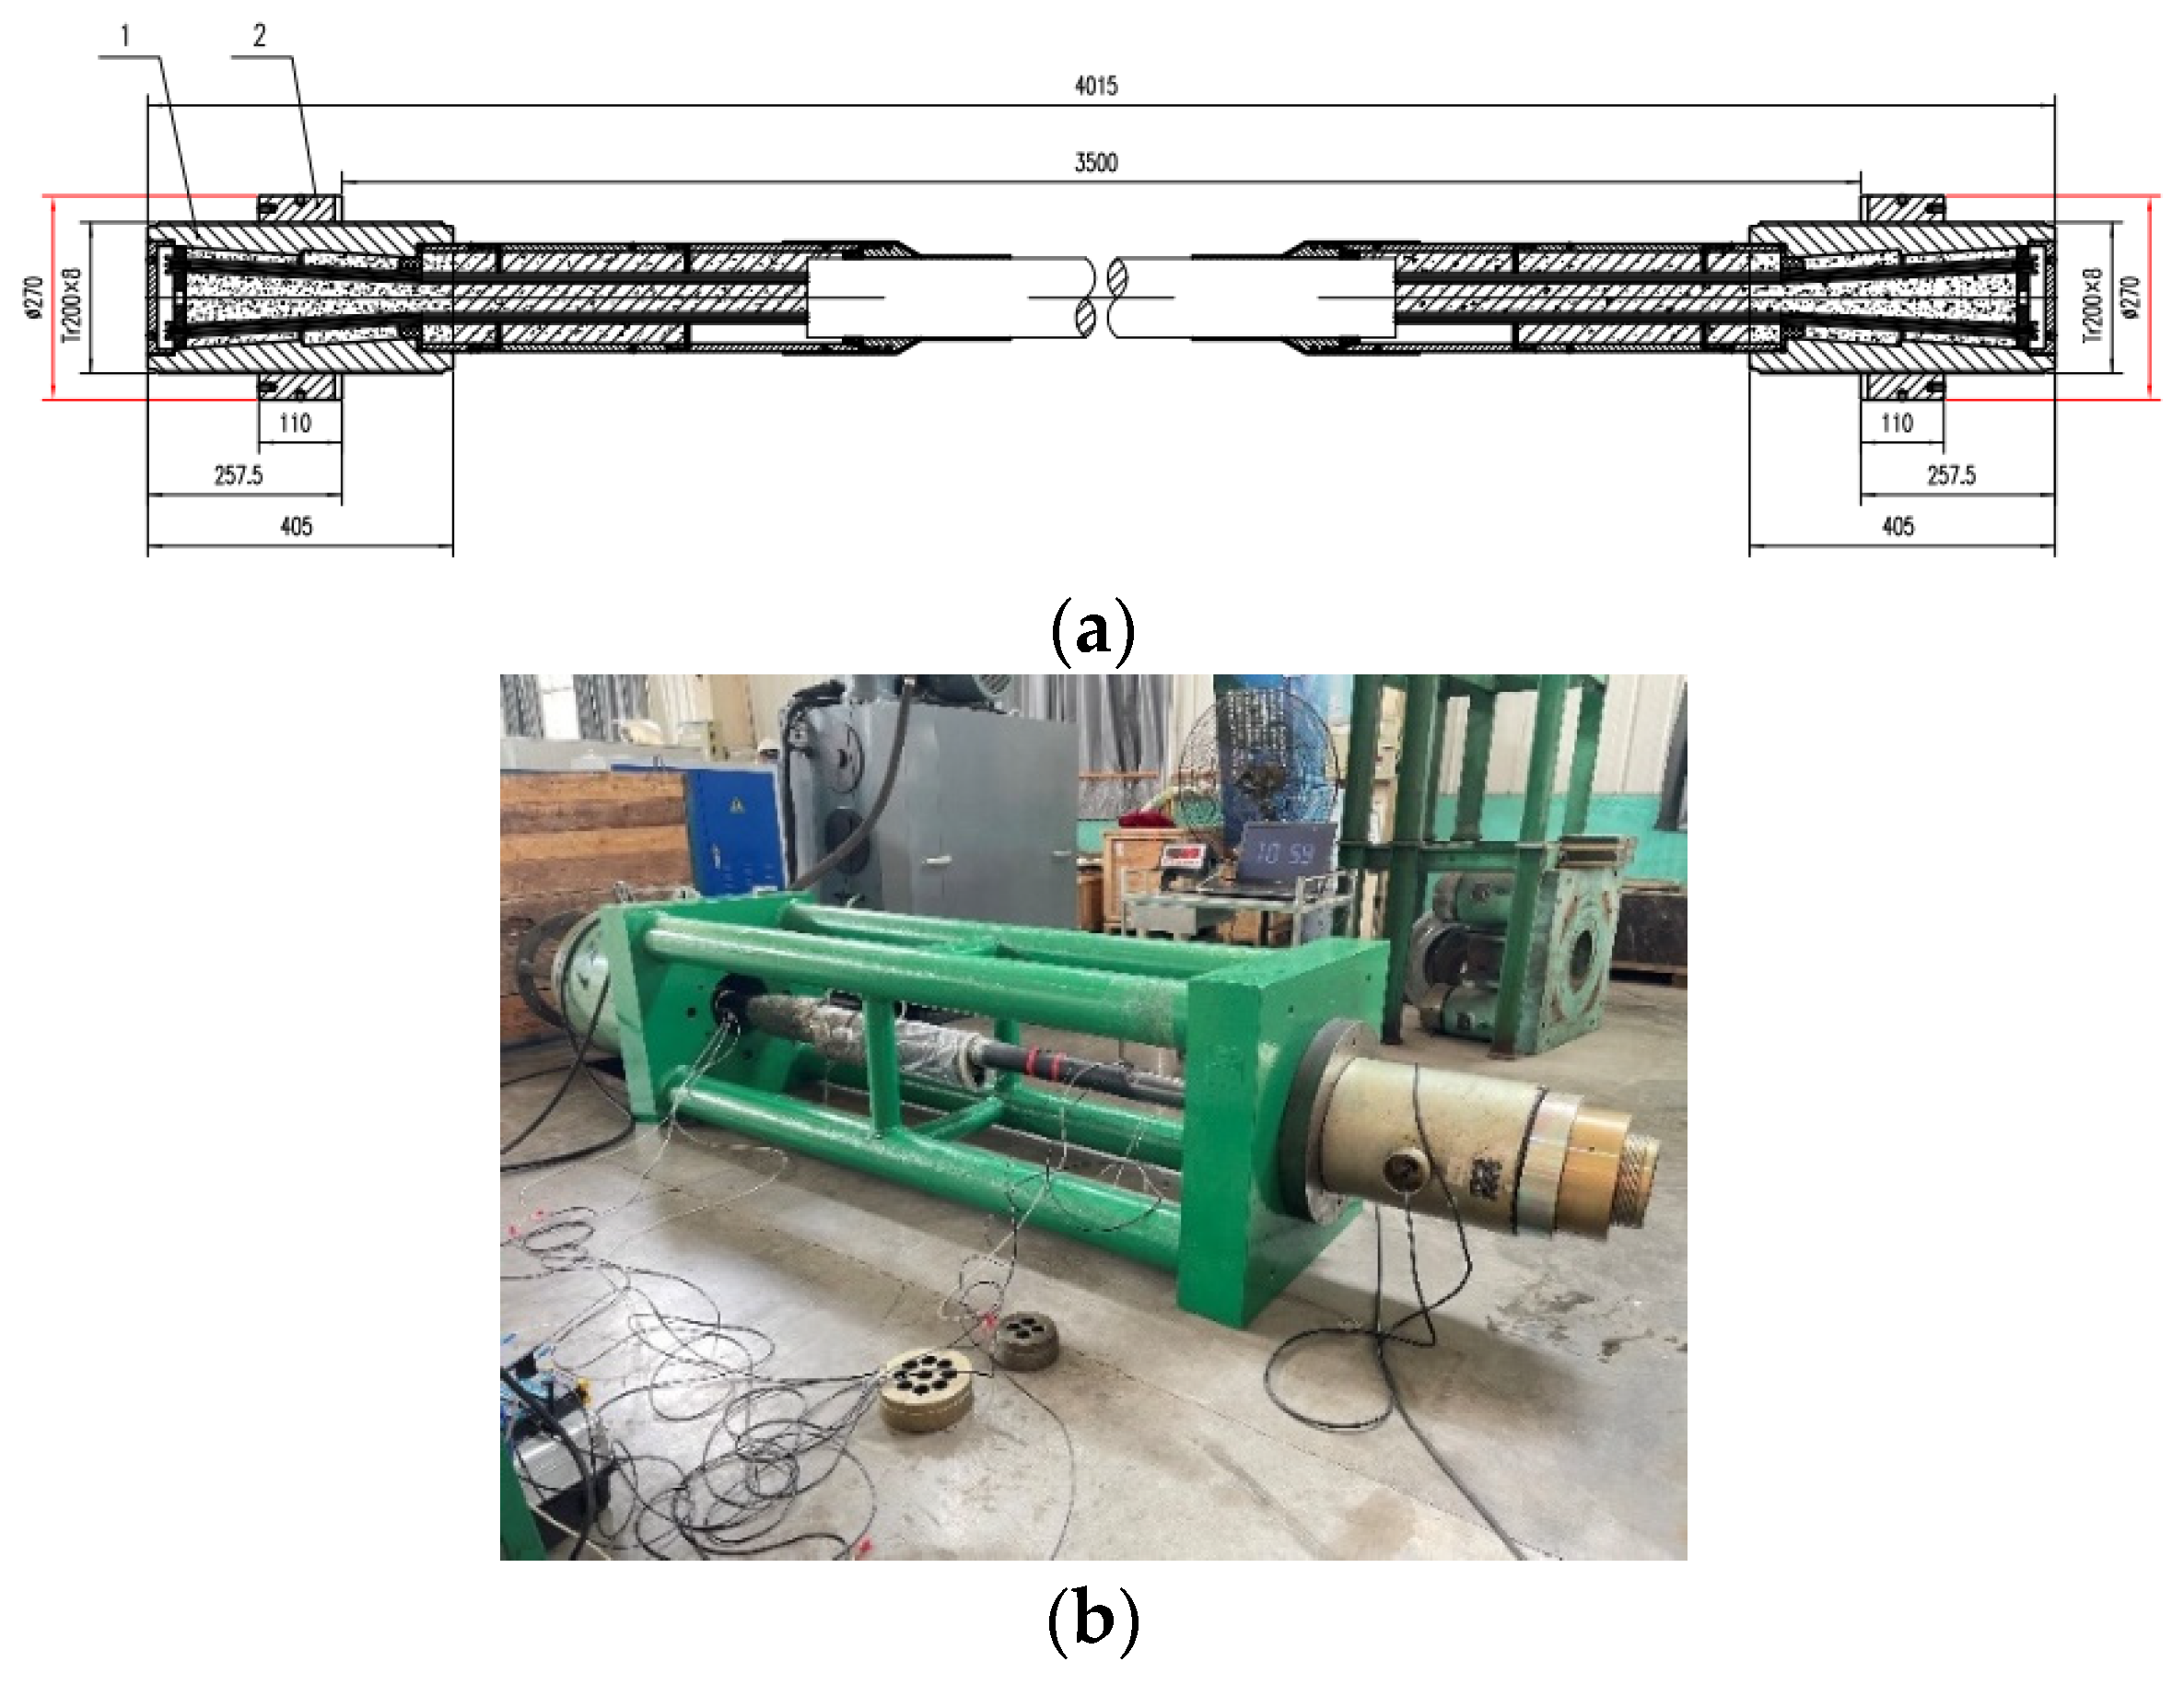
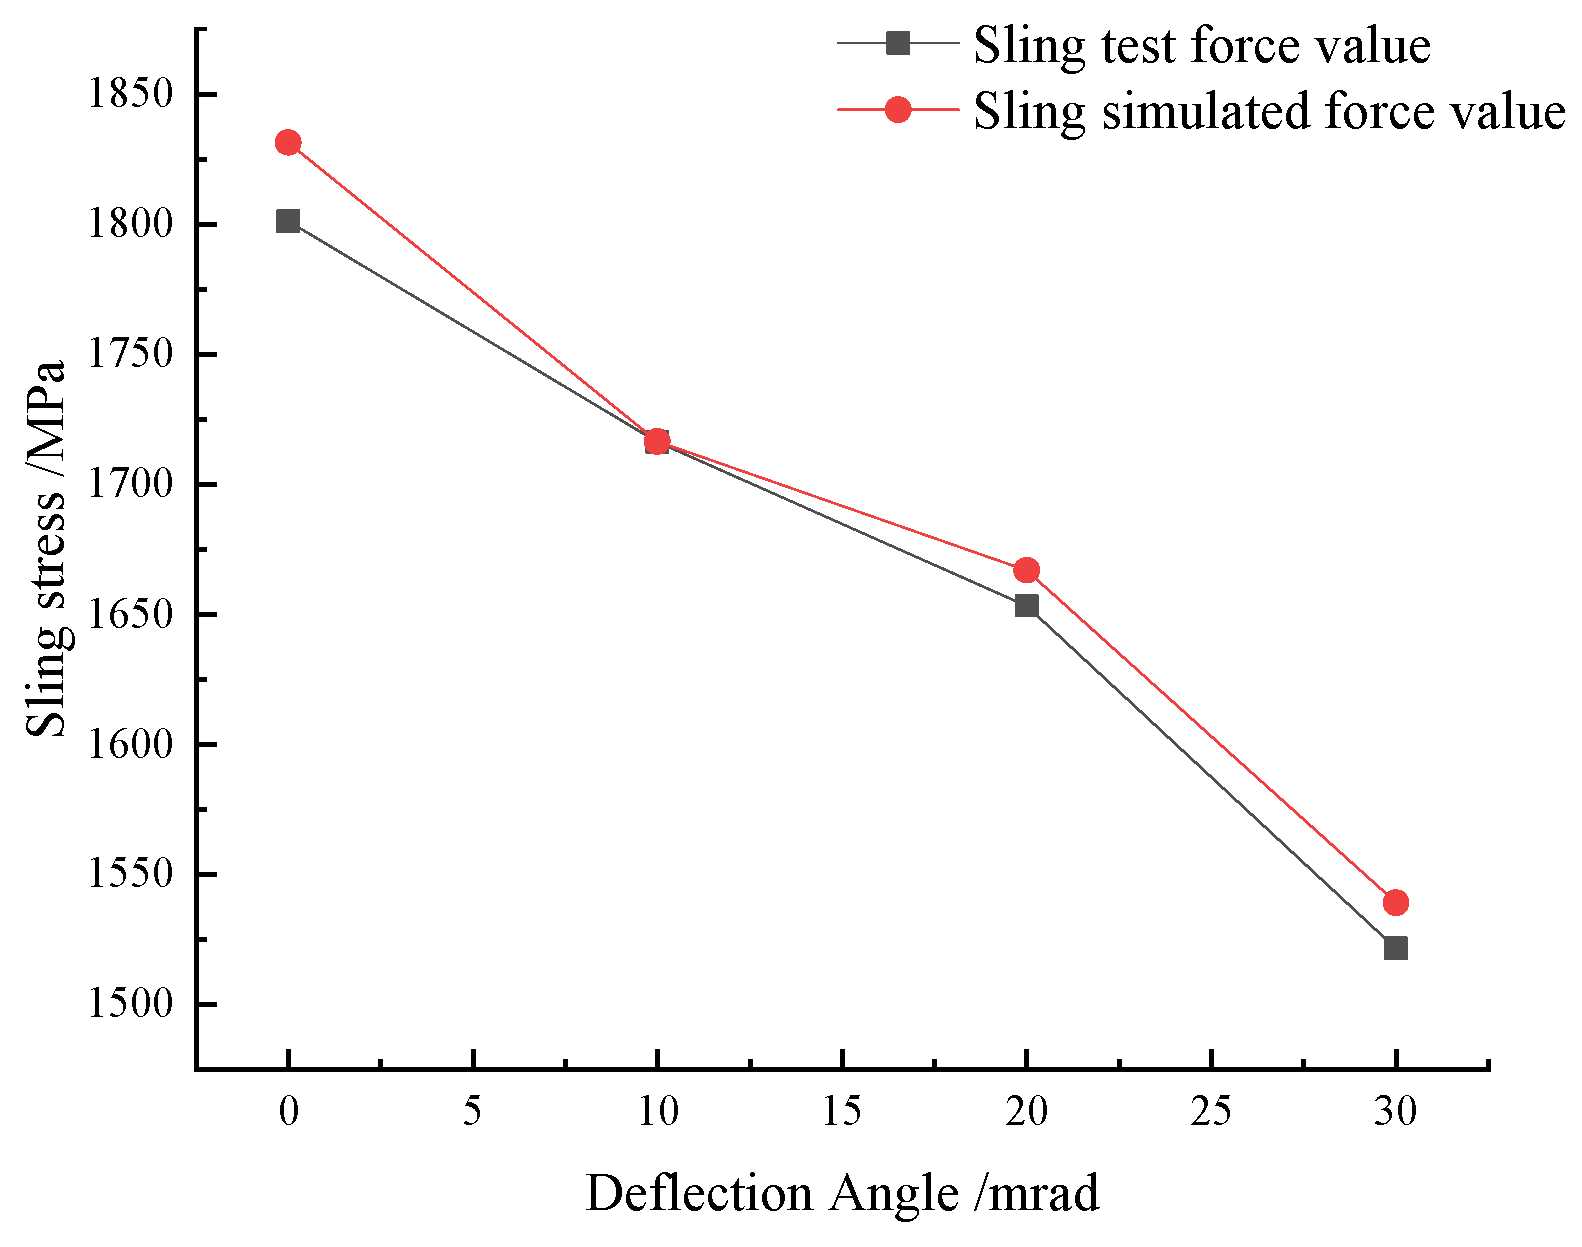
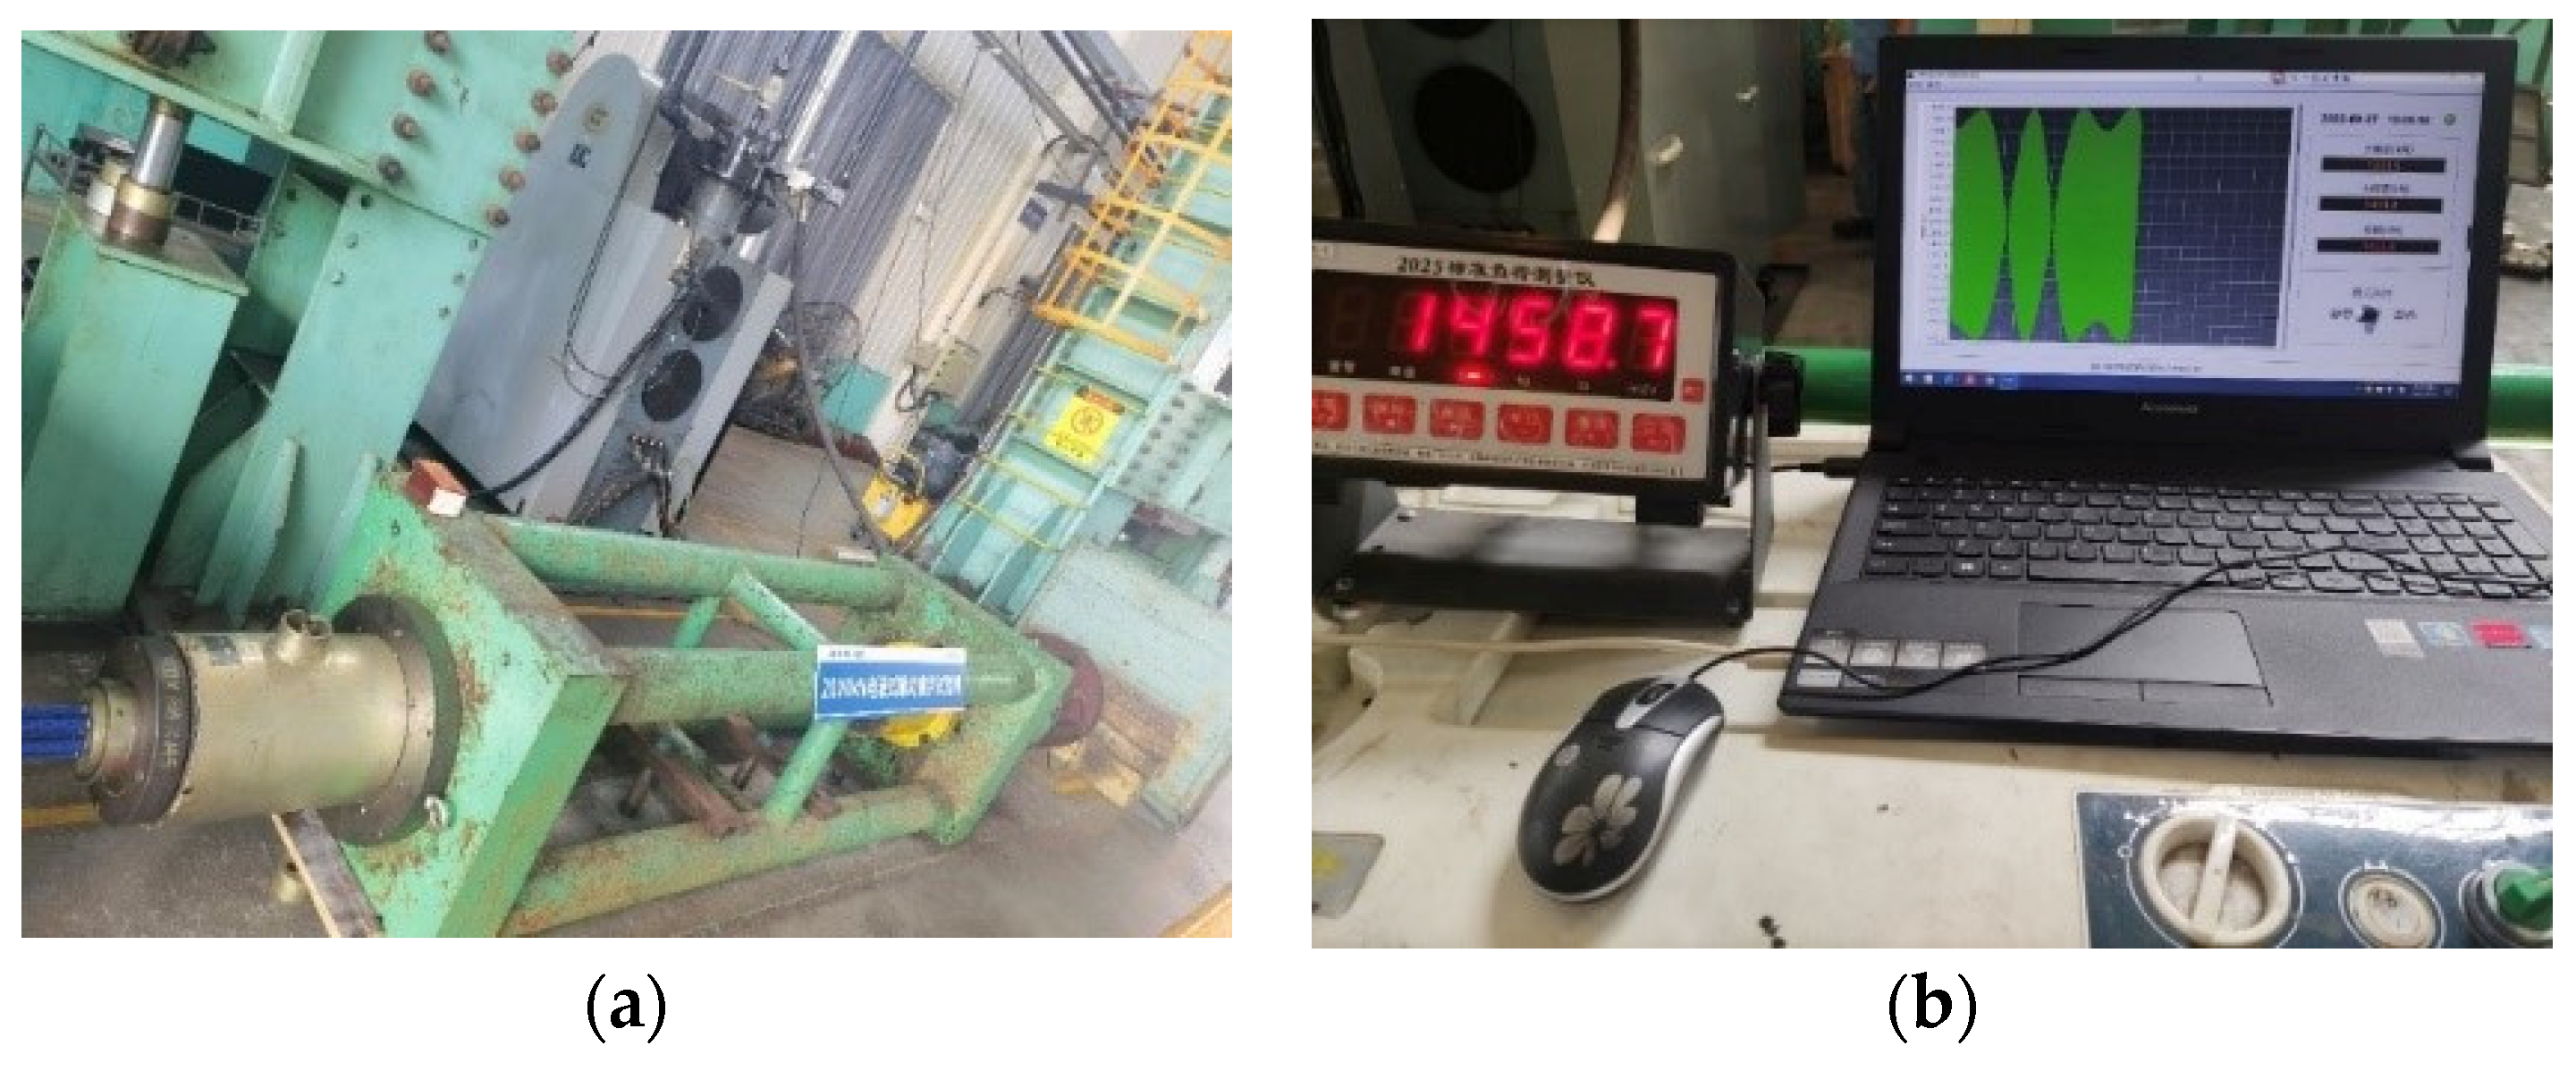
The breaking strength of the stranded wire sling decreases with increasing shaft deflection angle. At the same axis deflection angle, the broken strength of the sling has a certain degree of decline with an increasing number of strands. The broken strength decreases by 13.8% from 0 mrad to 30 mrad for a single strand of steel stranded sling, 15.5% for the 3-strand sling, 13.1% for the 7-strand sling, 10.0% for the 12-strand sling, 15.9% for the 19-strand sling, and 16.3% for the 27-strand sling. The test results of the ultimate tensile properties of 19 strands of Φ15.2 mm strand slings at different axial deflection agree with the simulation results.
(4)
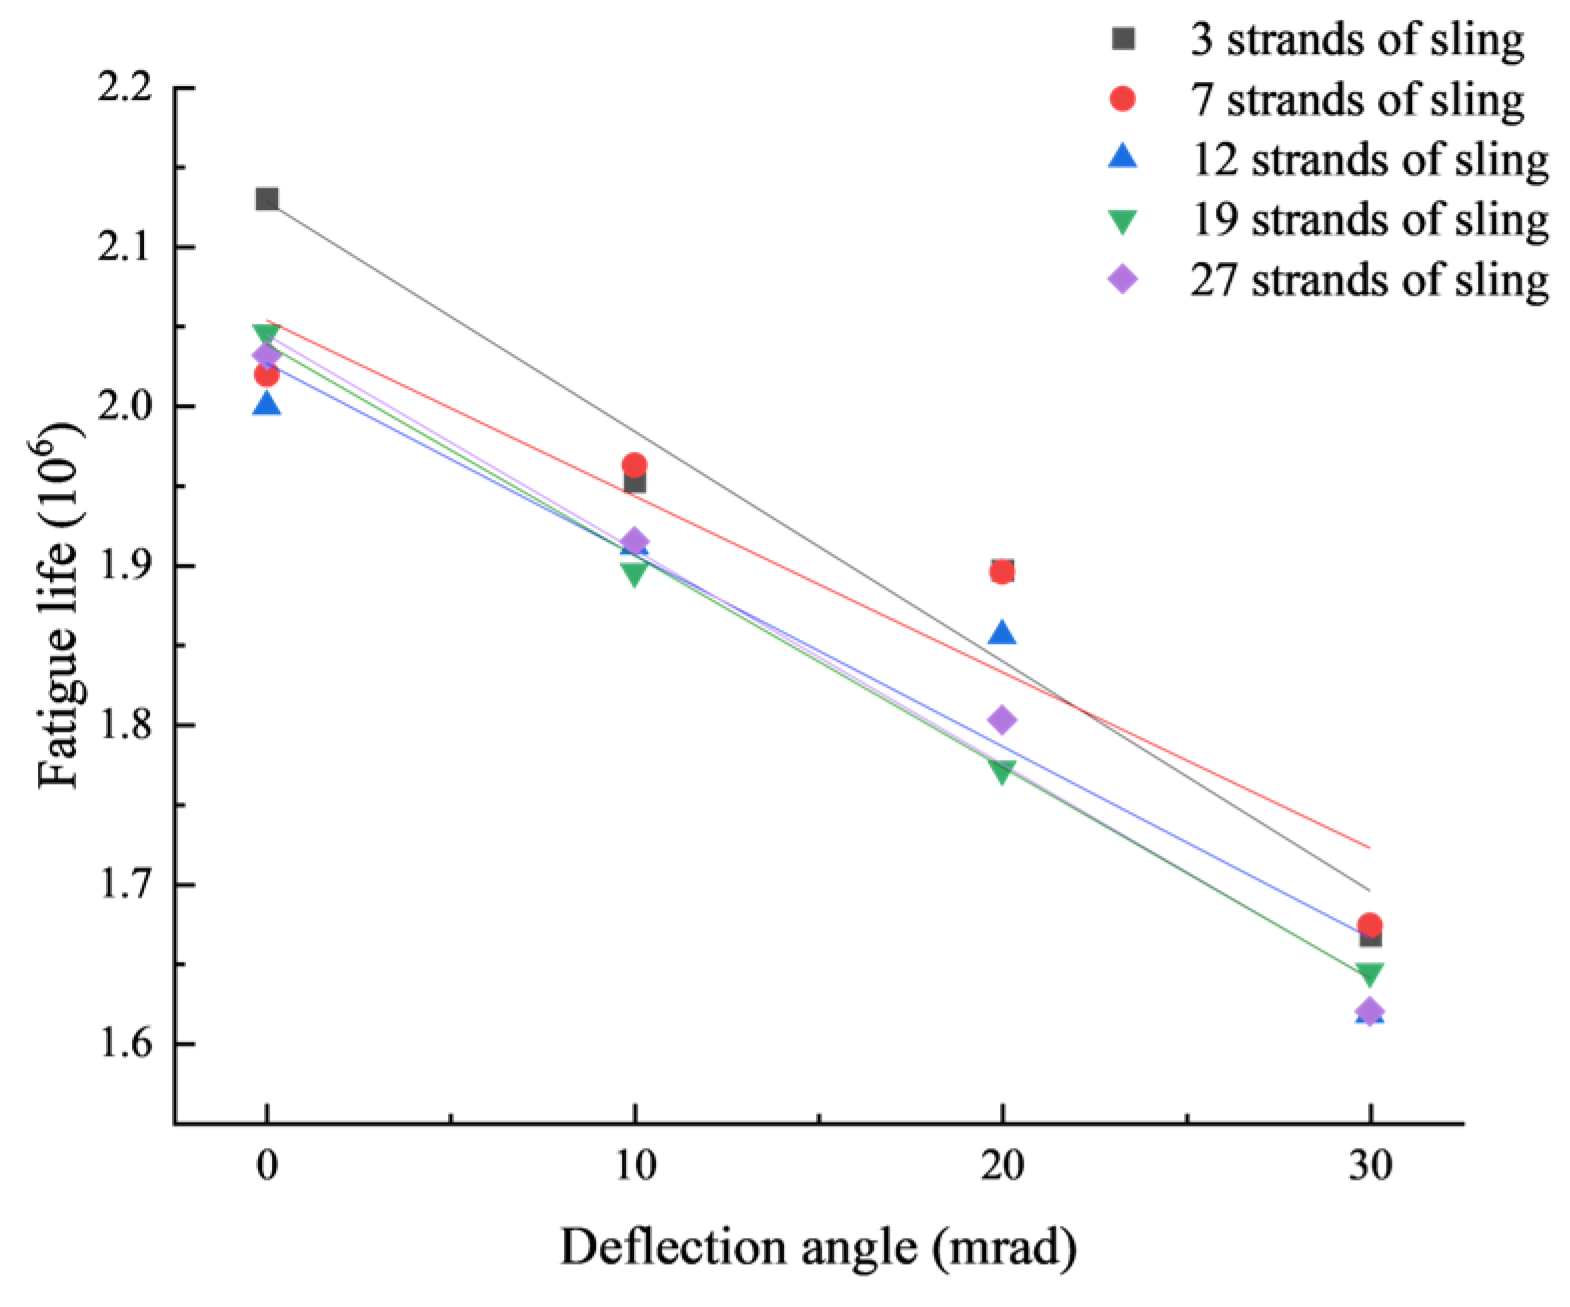
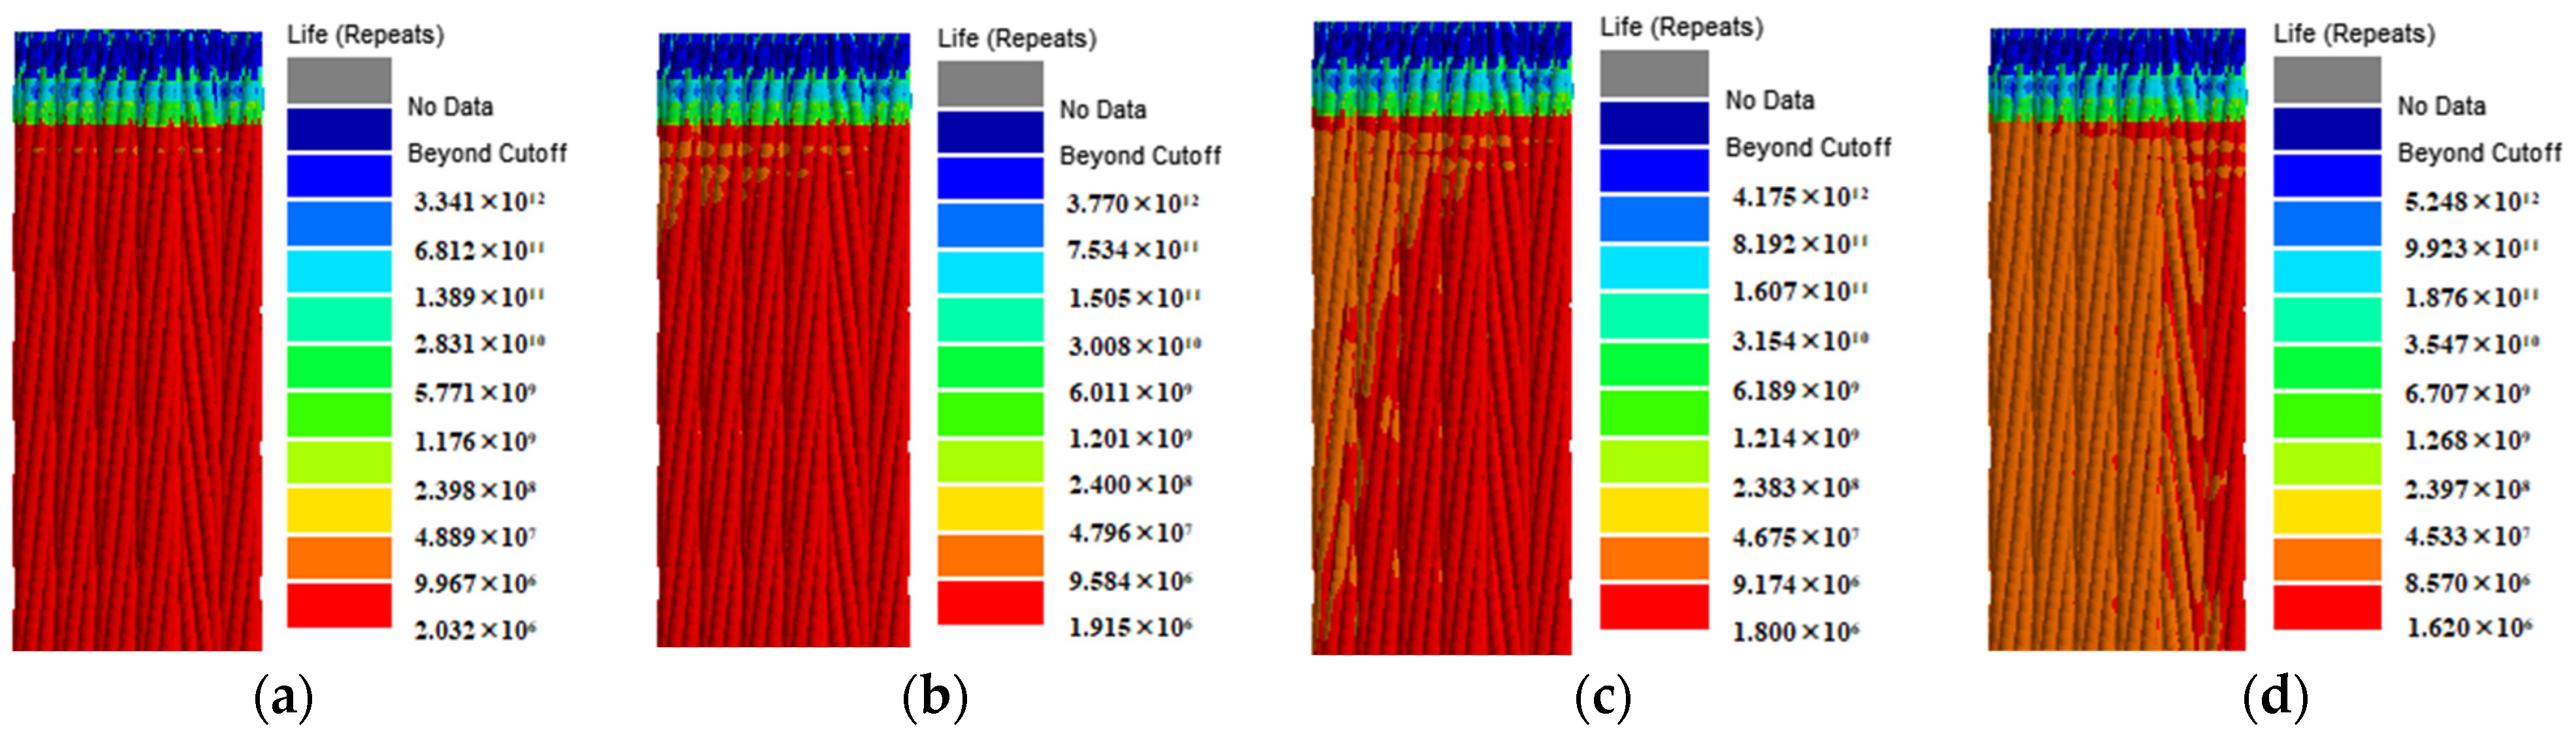
In the normal course of service, the fatigue life of the stranded wire sling reaches 2 million cycles when there is no shaft deflection, which is in line with national standards. With the increase in the shaft deflection angle, the fatigue life of the steel stranded wire sling has a certain degree of decline. The decline rate of the fatigue life of the sling increases rapidly with increasing shaft deflection angle. From 0 mrad to 30 mrad, the fatigue life of the 3-strand sling decreases by 27.8%, while that of the 7-strand sling decreases by 20.6%, 12-strand sling decreases by 23.6%, 19-strand sling decreases by 24.3%, and 27-strand sling decreases by 25.4%.

Author Contributions

N.D. designed the experiments and funded this paper. J.X. and G.Z. conducted the experiments. N.D. and H.L. analyzed the data and wrote this paper. Z.T. audited the content. All authors have read and agreed to the published version of the manuscript.

Funding

This research was funded by the National Natural Science Foundation of China (grant no. 52268048, 51868006) and the Guangxi Science and Technology Major Project of China (Gui Ke AA22068066).

Data Availability Statement

The data that support the research can be obtained from the corresponding author upon reasonable request. The data that support the research can be shared publicly.

Conflicts of Interest

The authors declare no conflict of interest.

References

  1. Chen, B.C.; Liu, J.P. Review of construction and technology development of arch bridges in the world. J. Traffic Transp. Eng. 2020, 20, 27–41. [Google Scholar]
  2. Liu, J.P.; Chen, B.C.; Li, C.; Zhang, M.J.; Tabatabai, H. Recent Application of and Research on Concrete Arch Bridges in China. Struct. Eng. Int. 2023, 33, 394–398. [Google Scholar] [CrossRef]
  3. Zhang, X.C.; Xie, K.; Ren, Y.Y. Analying the reason and renovating project of “little south door Jinsha River bridge of Yibin City” collapsing. J. Henan Univ. Urban Constr. 2002, 11, 15–17. [Google Scholar]
  4. Chen, X.H. Wuyishan Mansion Bridge collapsed life rescue. J. Saf. Health 2011, 39, 9. [Google Scholar]
  5. Gu, A.B.; Xu, J.L. Structural analysis of short slings of half through or through arch bridge. J. Chongqing Jiaotong Univ. Nat. Sci. 2002, 21, 1–3. [Google Scholar]
  6. Vermass, G. Corrosion and Embrittlement of High-Strength Steel Bridge Wires; Columbia University: New York, NY, USA, 2001. [Google Scholar]
  7. Nakamura, S.; Suzumura, K.; Tarui, T. Mechanical properties and remaining strength of corroded bridge wires. Struct. Eng. Int. 2004, 14, 50–54. [Google Scholar] [CrossRef]
  8. Yang, J.X.; Chen, W.Z.; Gu, R. Analysis of Dynamic Characteristics of Short Hangers of Arch Bridge. Bridge Constr. 2014, 44, 13–18. [Google Scholar]
  9. Gimsing, N.J. Cable Supported Bridges; China Communication Press: Beijing, China, 2002. [Google Scholar]
  10. Lu, J.G. Research on the Damage of Hangers of Concrete-Filled Steel Tubular Arch Bridges; Tianjin University: Tianjin, China, 2005. [Google Scholar]
  11. Liu, E.D.; Liao, G.M. The Arch Bridge Sling Breaking Analysis. North Commun. 2013, 11, 61–64. [Google Scholar]
  12. Yu, Y.J.; Chen, Z.H.; Liu, H.B.; Wang, X.D. Finite element study of behavior and interface force conditions of seven-wire strand under axial and lateral loading. Constr. Build. Mater. 2014, 66, 10–18. [Google Scholar] [CrossRef]
  13. Erena, D.; Valeo, J.; Navarro, C.; Domínguez, J. Fatigue and fracture analysis of a seven-wire stainless steel strand under axial and bending loads. Fatigue Fract. Eng. Mater. Struct. 2020, 43, 149–161. [Google Scholar] [CrossRef]
  14. Zhou, Y.M.; Deng, N.C.; Yang, T. A Study on the Strength and Fatigue Properties of Seven-Wire Strands in Hangers under Lateral Bending. Appl. Sci. 2020, 10, 2160. [Google Scholar] [CrossRef]
  15. Zhu, G.C.; Deng, N.C.; Xu, J.; Xie, Q.Q. Effect of Deflection Angle on Mechanical Properties and Pit Stress of Strands with Different Crorrosion Degree. Joural Shijiazhuang Tiedao Univ. (Nat. Sci. Ed.) 2022, 35, 14–20. [Google Scholar]
  16. Jiang, J.W.; Deng, N.C.; Guo, X.; Liu, L.H.; Li, C.S. Influence of short slings’ bending deflection on mechanical properties of arch bridges. China Sci. 2022, 17, 167–173. [Google Scholar]
  17. Deng, N.C.; Xu, J.; Zhu, G.C.; Han, Z.Q. Study on the Mechanical Properties of Corroded Steel Strands at Deflection Angles. Buildings 2023, 13, 795. [Google Scholar] [CrossRef]
  18. Gang, S.; John, M.; Harry, C. Bending Fatigue Life Evaluation of Bridge Stay Cables. J. Eng. Mech. 2022, 148, 04021168. [Google Scholar]
  19. Li, C.C.; Liu, K.; Shen, Y. Common diseases and treatment measures of pulling sling. J. Highw. Transp. Res. Dev. 2013, 9, 4. [Google Scholar]
  20. García-Guerrero, J.M.; Jorquera-Lucerga, J.J. Effect of stiff hangers on the longitudinal structural behavior of tied-arch bridges. Appl. Sci. 2018, 8, 258. [Google Scholar] [CrossRef]
  21. JTG/T J21-01; People’s Republic of China Industry Recommended standards: Load Test Methods for Highway Bridge. Ministry of Transport: Beijing, China, 2015.
  22. Ma, J.; Ge, S.R.; Zhang, D.K. Distribution of wire deformation within strands of wire ropes. J. China Univ. Min. Technol. 2008, 18, 475–478. [Google Scholar] [CrossRef]
  23. Chen, M.C.; Fang, W.; Yang, C.; Xie, L. Bayesian prediction and probabilistic model of fatigue cracks in steel structures. Eng. Fail. Anal. 2019, 103, 335–346. [Google Scholar] [CrossRef]
  24. Qian, H.M.; Zong, Z.H.; Xie, G.Y.; Liao, Y.C.; Du, M.L. Refined simulation of elastic-plastic static behavior of grade 1860 strand wires. J. Southeast Univ. (Nat. Sci. Ed.) 2019, 49, 624–630. [Google Scholar]
  25. Wu, S.B. Fatigue Safety and Design Study of Through and Half-through Arch Bridges’ Sling; Chongqing University: Chongqing, China, 2008. [Google Scholar]
  26. Kong, Q.K. Structural Behavior Study on Short Slings of Half through Arch Bridges with Large Span; Southwest Jiaotong University: Chengdu, China, 2003. [Google Scholar]
  27. Nakamura, S.; Suzumura, K. Experimental study on fatigue strength of corroded bridge wires. J. Bridge Eng. 2013, 18, 200–209. [Google Scholar] [CrossRef]
  28. Zhao, D.; Liu, S.; Xu, Q.; Shi, F.; Sun, W.; Chai, L. Fatigue life prediction of wire rope based on stress field intensity method. Eng. Fail. Anal. 2017, 81, 1–9. [Google Scholar] [CrossRef]
  29. Gaur, V.; Enoki, M.; Okada, T.; Yomogida, S. A study on fatigue behavior of MIG-welded Al-Mg alloy with different filler-wire materials under mean stress. Int. J. Fatigue 2018, 107, 119–129. [Google Scholar] [CrossRef]
  30. Li, X.Z.; Xie, X.; Pan, X.Y.; Sun, W.; Zhu, H. Experimental study on fatigue performance of corroded high tensile steel wires of arch bridge hangers. China Civ. Eng. J. 2015, 48, 68–76. [Google Scholar]
  31. Ma, L. Study on fatigue properties of domestic 1860 grade low-relaxation prestressed steel strand. Railw. Stand. Des. 2000, 20, 21–23. [Google Scholar]
Figure 1. Finite element model of a medium-bearing arch bridge with a span of 560 m.
Buildings 14 00223 g001
Figure 2. Loading vehicle load.
Buildings 14 00223 g002
Figure 3. Distribution law of sling deflection angle under full bridge load and partial load.
Buildings 14 00223 g003
Figure 4. Distribution of the deflection angle of the boom on the bridge deck.
Buildings 14 00223 g004
Figure 5. Distribution law of the deflection angle of the sling under different temperatures.
Buildings 14 00223 g005
Figure 6. Variation rule of the deflection angle of the short sling with temperature.
Buildings 14 00223 g006
Figure 7. One strand of seven steel stranded wires: (a) the center steel wire radius Rc and the outer wire radius Rh; (b) the steel wire paracord angle α.
Buildings 14 00223 g007
Figure 8. The mesh division of one strand of seven steel stranded wires.
Buildings 14 00223 g008
Figure 9. Model of 27 strands of a steel stranded sling.
Buildings 14 00223 g009
Figure 10. Stress cloud of one strand of a sling at 0 mrad: (a) 1 cm from the anchorage end; (b) 4 cm from the anchorage end; (c) 7 cm from the anchorage end.
Buildings 14 00223 g010
Figure 11. Stress cloud of one strand of a sling at 10 mrad: (a) 1 cm from the anchorage end; (b) 4 cm from the anchorage end; (c) 7 cm from the anchorage end.
Buildings 14 00223 g011
Figure 12. Stress cloud of one strand of a sling at 20 mrad: (a) 1 cm from the anchorage end; (b) 4 cm from the anchorage end; (c) 7 cm from the anchorage end.
Buildings 14 00223 g012
Figure 13. Stress cloud of one strand of a sling at 30 mrad: (a) 1 cm from the anchorage end; (b) 4 cm from the anchorage end; (c) 7 cm from the anchorage end.
Buildings 14 00223 g013
Figure 14. Maximum stresses in stranded wire slings with different axial deflections: (a) 1 cm from the anchorage end; (b) 4 cm from the anchorage end.
Buildings 14 00223 g014
Figure 15. Stress cloud of the section of the 27-strand strand sling: (a) 1 cm from the anchorage end at 0 mrad; (b) 4 cm from the anchorage end at 0 mrad; (c) 1 cm from the anchorage end at 10 mrad; (d) 4 cm from the anchorage end at 10 mrad; (e) 1 cm from the anchorage end at 20 mrad; (f) 4 cm from the anchorage end at 20 mrad; (g) 1 cm from the anchorage end at 30 mrad; (h) 4 cm from the anchorage end at 30 mrad.
Buildings 14 00223 g015
Figure 16. Damage form of stranded steel sling: (a) 3 strands of stranded steel sling; (b) 7 strands of stranded steel sling; (c) 12 strands of stranded steel sling; (d) 19 strands of stranded steel sling.
Buildings 14 00223 g016
Figure 17. Load displacement curve: (a) 0 mrad; (b) 10 mrad; (c) 20 mrad; (d) 30 mrad.
Buildings 14 00223 g017
Figure 18. Fitting curves of the breaking strength of the multistranded stranded wire sling.
Buildings 14 00223 g018
Figure 19. Simulated breakage cloud of 27 stranded strand slings: (a) 0 mrad; (b) 10 mrad; (c) 20 mrad; (d) 30 mrad.
Buildings 14 00223 g019
Figure 20. Cold-cast header anchor strand sling static load test equipment: (a) cold-cast header anchor strand sling; (b) static load test stand.
Buildings 14 00223 g020
Figure 21. Breaking force values of 19 stranded wire slings at different axial deflection angles.
Buildings 14 00223 g021
Figure 22. The fatigue life of steel stranded wire slings at different axial deflection angles.
Buildings 14 00223 g022
Figure 23. The fatigue life of 27 strands of steel stranded wire slings: (a) 0 mrad; (b) 10 mrad; (c) 20 mrad; (d) 30 mrad.
Buildings 14 00223 g023
Figure 24. The 19 cold cast heading anchor steel strand slings.
Buildings 14 00223 g024
Figure 25. The 200 T fatigue testing machine: (a) fatigue tension pedestal; (b) control console.
Buildings 14 00223 g025
Figure 26. Comparison results of the fatigue test and the simulated fatigue test.
Buildings 14 00223 g026
Table 1. Steel material and concrete parameters.
ItemTensile Strength/MPaCompressive Strength/MPaYield Strength/MPaPoisson’s RatioModulus of
Elasticity
/MPa
Steel strand1860--0.151.95 × 105
Q420qD steel540-4200.312.06 × 105
C70 concrete2.9944.5-0.233.70 × 104
C40 concrete2.3926.8-0.203.25 × 104
Table 2. Deflection angle values of slings No. 1 and No. 2 under the overall warming effect.
Temperature/°CSimulated Values/mradTheoretical Calculated Value/mrad
No. 1 SlingNo. 2 SlingNo. 1 SlingNo. 2 Sling
52.50.62.70.7
105.01.25.41.4
157.51.98.12.1
2010.02.510.92.8
2512.53.113.63.5
3015.03.716.34.3
3517.54.419.14.9
4020.05.021.85.7
4522.55.624.56.4
Table 3. Maximum stresses of stranded wire sling tensioned at 0.45 σ b at different axial deflection angles.
Name of SlingDeflection Angle
0 mrad/MPa
Deflection Angle
10 mrad/MPa
Deflection Angle
20 mrad/MPa
Deflection Angle
30 mrad/MPa
1 strand of sling 1 cm from anchorage end936.4914.81085.51257.3
1 strand of sling 4 cm from anchorage end907.0921.21075.81230.3
1 strand of sling 7 cm from anchorage end898.1895.61022.11148.6
3 strands of sling 1 cm from anchorage end912.81234.61597.61767.2
3 strands of sling 4 cm from anchorage end872.4970.11175.71378.3
7 strands of sling 1 cm from anchorage end871.41152.01608.31786.9
7 strands of sling 4 cm from anchorage end817.11007.51255.91446.8
12 strands of sling 1 cm from anchorage end887.71467.01814.81871.8
12 strands of sling 4 cm from anchorage end816.1985.91204.31377.0
19 strands of sling 1 cm from anchorage end860.41377.31751.001773.4
19 strands of sling 4 cm from anchorage end820.5998.01207.91346.3
27 strands of sling 1 cm from anchorage end860.91403.31799.91764.9
27 strands of sling 4 cm from anchorage end821.0980.41168.81284.0
Table 4. Breaking strength of multistranded steel strand slings with different axial deflection angles.
Number of StrandsBreaking Strength at Different Shaft Deflection Angles (MPa)
0 mrad10 mrad20 mrad30 mrad
11874.01768.11669.11613.6
31799.91758.41683.91520.5
71814.61740.81692.81575.7
121803.31736.61692.91622
191831.41716.51667.01539.1
271879.31738.81658.11572.7
Table 5. Comparison of test and simulated values for 19 sling breakages.
Shaft Deflection Angle/mradTest Force Value/kNTest Stress Value/MPaSimulated Value of Force/kNSimulated Stress Value/MPa
04791.81801.24871.51831.4
104565.31716.34565.81716.5
204397.71653.34434.21667.0
304047.11521.54094.01539.1
Table 6. Material definitions.
MaterialModulus of Elasticity/GPaPoisson’s RatioTensile Strength/MPaElongation Rate
1860 grade strand1950.31860≥4%
Table 7. Fatigue life values of a multistranded wire sling with different axial deflection angles.
Number of StrandsFatigue Life at Different Shaft Deflection Angles/106
0 mrad10 mrad20 mrad30 mrad
32.1301.9531.8971.668
72.0201.9631.8961.674
122.0001.9121.8561.618
192.0461.8961.7721.645
272.0321.9151.8031.620
Table 8. Fatigue values of different coaxial deflection angles of 19 steel strand slings.
-Stress
Amplitude/MPa
Upper Stress Limit/MPaFatigue Life at Different Axial Deflection Angles/106
0 mrad10 mrad20 mrad30 mrad
Test fatigue value2008372.0001.7781.5781.282
Simulated fatigue value2008372.0461.8961.7721.645
Disclaimer/Publisher’s Note: The statements, opinions and data contained in all publications are solely those of the individual author(s) and contributor(s) and not of MDPI and/or the editor(s). MDPI and/or the editor(s) disclaim responsibility for any injury to people or property resulting from any ideas, methods, instructions or products referred to in the content.

