Article

A Study on the Effects of Punch-to-Span Ratio and Longitudinal Reinforcement Eigenvalues on the Bearing Capacity of RC Slab–Column Connections

1
School of Civil Engineering and Architecture, Nanchang University, Nanchang 330031, China
2
Design and Research Institute, Nanchang University, Nanchang 330047, China
*
Authors to whom correspondence should be addressed.
Buildings 2024, 14(1), 208; https://doi.org/10.3390/buildings14010208
Submission received: 21 November 2023 / Revised: 31 December 2023 / Accepted: 9 January 2024 / Published: 12 January 2024
(This article belongs to the Section Building Structures)

Abstract

:
The region of the RC slab–column connection is subject to complex forces and is susceptible to localized damage, leading to progressive collapse incidents, which has raised considerable concern among the engineering community. At present, the research on slab–column connections exhibits several shortcomings, including a limited number of specimens, incomplete consideration of various factors, and unclear boundaries in defining failure modes. A comprehensive consideration of the punch–span ratio (a/h0) and longitudinal reinforcement eigenvalues (ρƒyc) is lacking, and the calculation formula for load bearing is not subdivided based on distinct failure modes. In this study, finite element software is utilized to construct 42 models of slab–column connections. The variables considered encompass three factors: the punch–span ratio, the longitudinal reinforcement ratio, and concrete strength. The examination and evaluation encompass the analysis of the load–displacement curve, reinforcement stress change curve, section crack distribution pattern, and stress contour map obtained through model loading. The primary parameters defining the boundaries of the three failure modes in the slab–column connection are the punch–span ratio and longitudinal reinforcement eigenvalues. Utilizing the punch–span ratio and longitudinal reinforcement eigenvalues as key parameters, a punching and flexural failure model for slab–column connections without abdominal bars is formulated. The calculation formula for bearing capacity, encompassing flexural, flexural and punching, and punching shear failure, is derived. A comparison between the revised formula and the standard formulas from major countries indicates that the revised formula is more comprehensive, providing a more accurate and secure prediction within the scope of this study.

1. Introduction

The RC slab–column structure, comprising interconnected slabs and columns, represents a two-way stress structural system [1]. With advantages such as flexible spatial arrangement and expedited, straightforward construction, it has widespread applications in engineering projects [2]. However, in structural design, slab–column connections are often subject to combined flexural moments and shear forces, making them prone to localized shear failure, leading to potential instances of progressive collapse accidents [3]. Investigating the structural performance of slab–column connections holds significant importance for engineering structures [4].
The current research on slab–column connections can be broadly categorized into two main aspects: failure modes and load-bearing capacity [5]. Based on the distinct mechanisms of failure and crack propagation during loading, failure modes can be classified into punching, flexural–punching, and flexural failure. The calculation methods for load-bearing capacity primarily rely on empirical formulas derived from experimental data. The key influencing factors on the punching shear resistance of slab–column connections include the punch–span ratio, concrete strength, and the longitudinal reinforcement ratio [6,7]. However, a comprehensive consideration of these three factors is required. Conventional experiments often suffer from limitations such as a limited number of specimens and insufficient consideration of factors, leading to unclear distinctions in failure modes under different parameters. The load-bearing capacity of slab–column connections is closely related to the inclination angle of the failure surface. Scholars both domestically and internationally have not yet reached a unanimous consensus on the fitting formula for the inclination angle [8]. Given the significant deviation between the inclination angles obtained from estimation formulas and experimental values, achieving an ideal fit involves placing the inclination angle separately on the axes of longitudinal reinforcement eigenvalues and the punch–span ratio [9,10,11,12,13]. The commonly used standardized methods for load-bearing capacity calculations exhibit clear limitations, as they do not differentiate between the different failure modes of slab–column connections and fail to comprehensively consider the combined influence of the punch–span ratio and the longitudinal reinforcement characteristic value.
In this study, a three-dimensional solid-to-shell degeneration virtual layer nonlinear finite element program [14] was utilized to establish 42 models of slab–column connections. Considering the combined influence of the punch–span ratio and longitudinal reinforcement eigenvalues, the analysis and assessment of the destructive performance of slab–column connections were conducted. Taking the punch–span ratio and longitudinal reinforcement eigenvalues as parameters, discriminative patterns for three failure modes—flexural, flexural–punching, and punching—were established. Based on experimental data on the inclination angles of the failure surfaces, a formula for the inclination angle related to the punch–span ratio and longitudinal reinforcement eigenvalues was fitted. Integrating the beam shear failure [15], the modified pressure field theory [16], and the plastic hinge line theory [17], a non-mesh-reinforced slab–column connection failure model considering the punch–span ratio, concrete shear zone height, and compression–shear interaction was developed. Formulas for calculating the bearing capacity were established according to the different failure modes of slab–column connections. Upon comparison with standard formulas, the results indicated that the proposed formula in this study considers comprehensive factors, exhibits higher accuracy and better safety, and can effectively predict the punching shear capacity of slab–column connections.

2. Simulation Methods and Comparison with Experiments

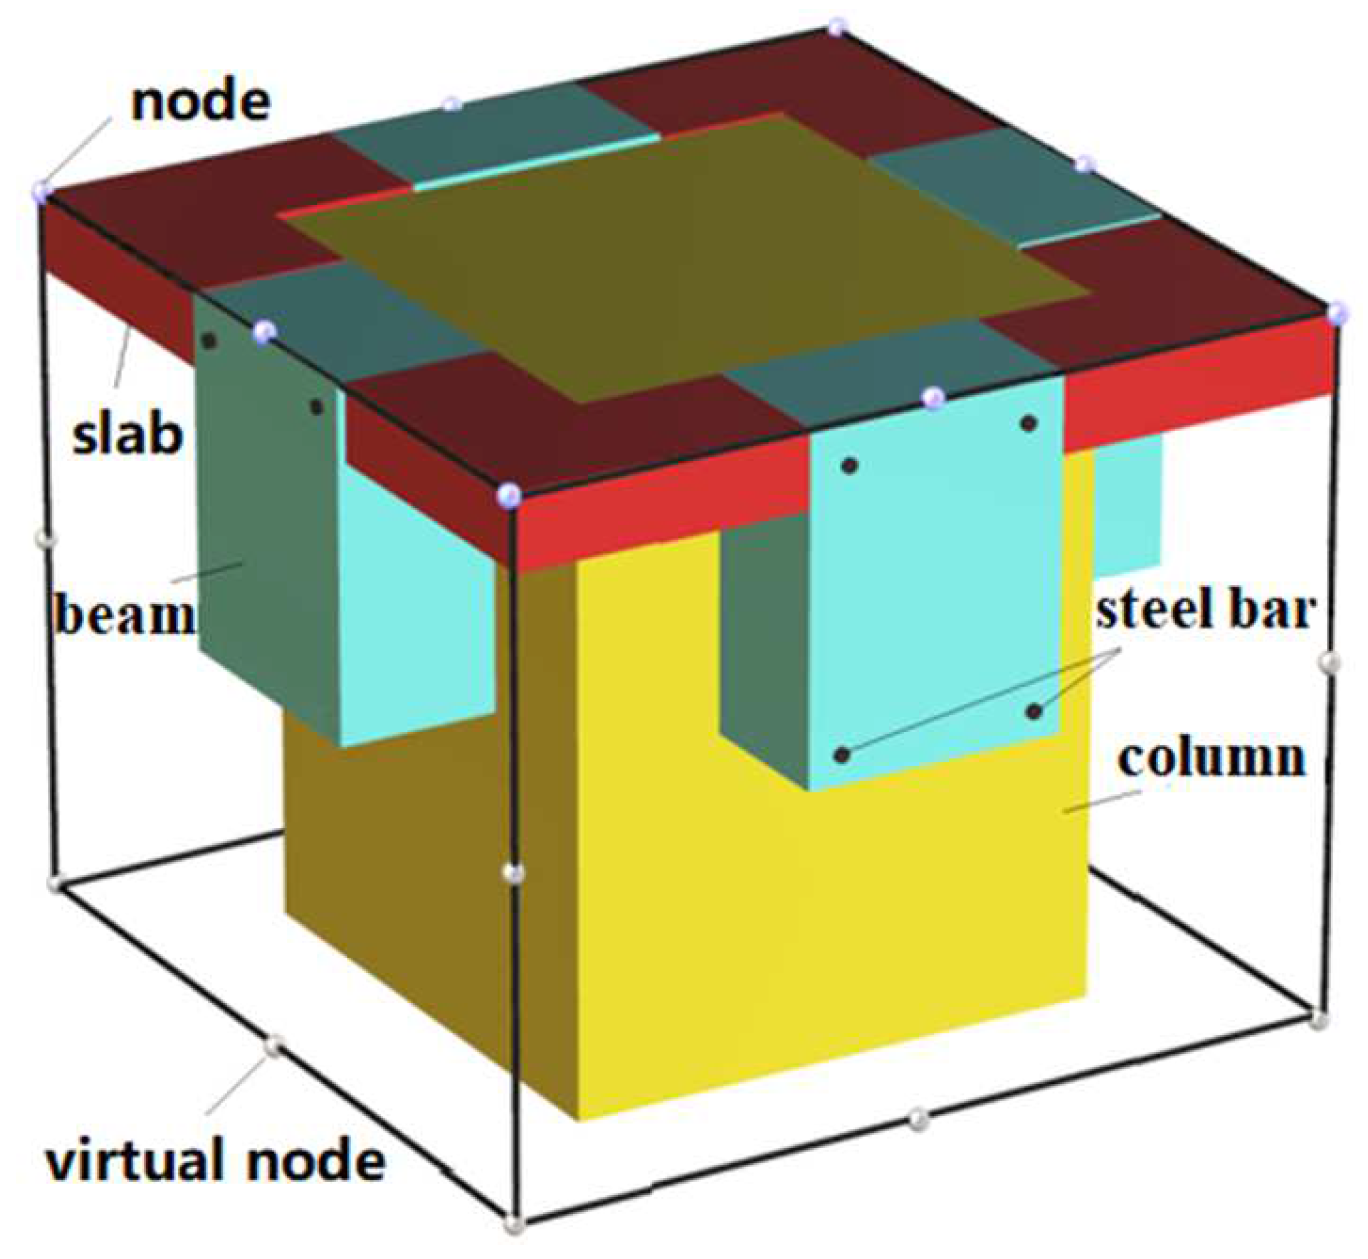
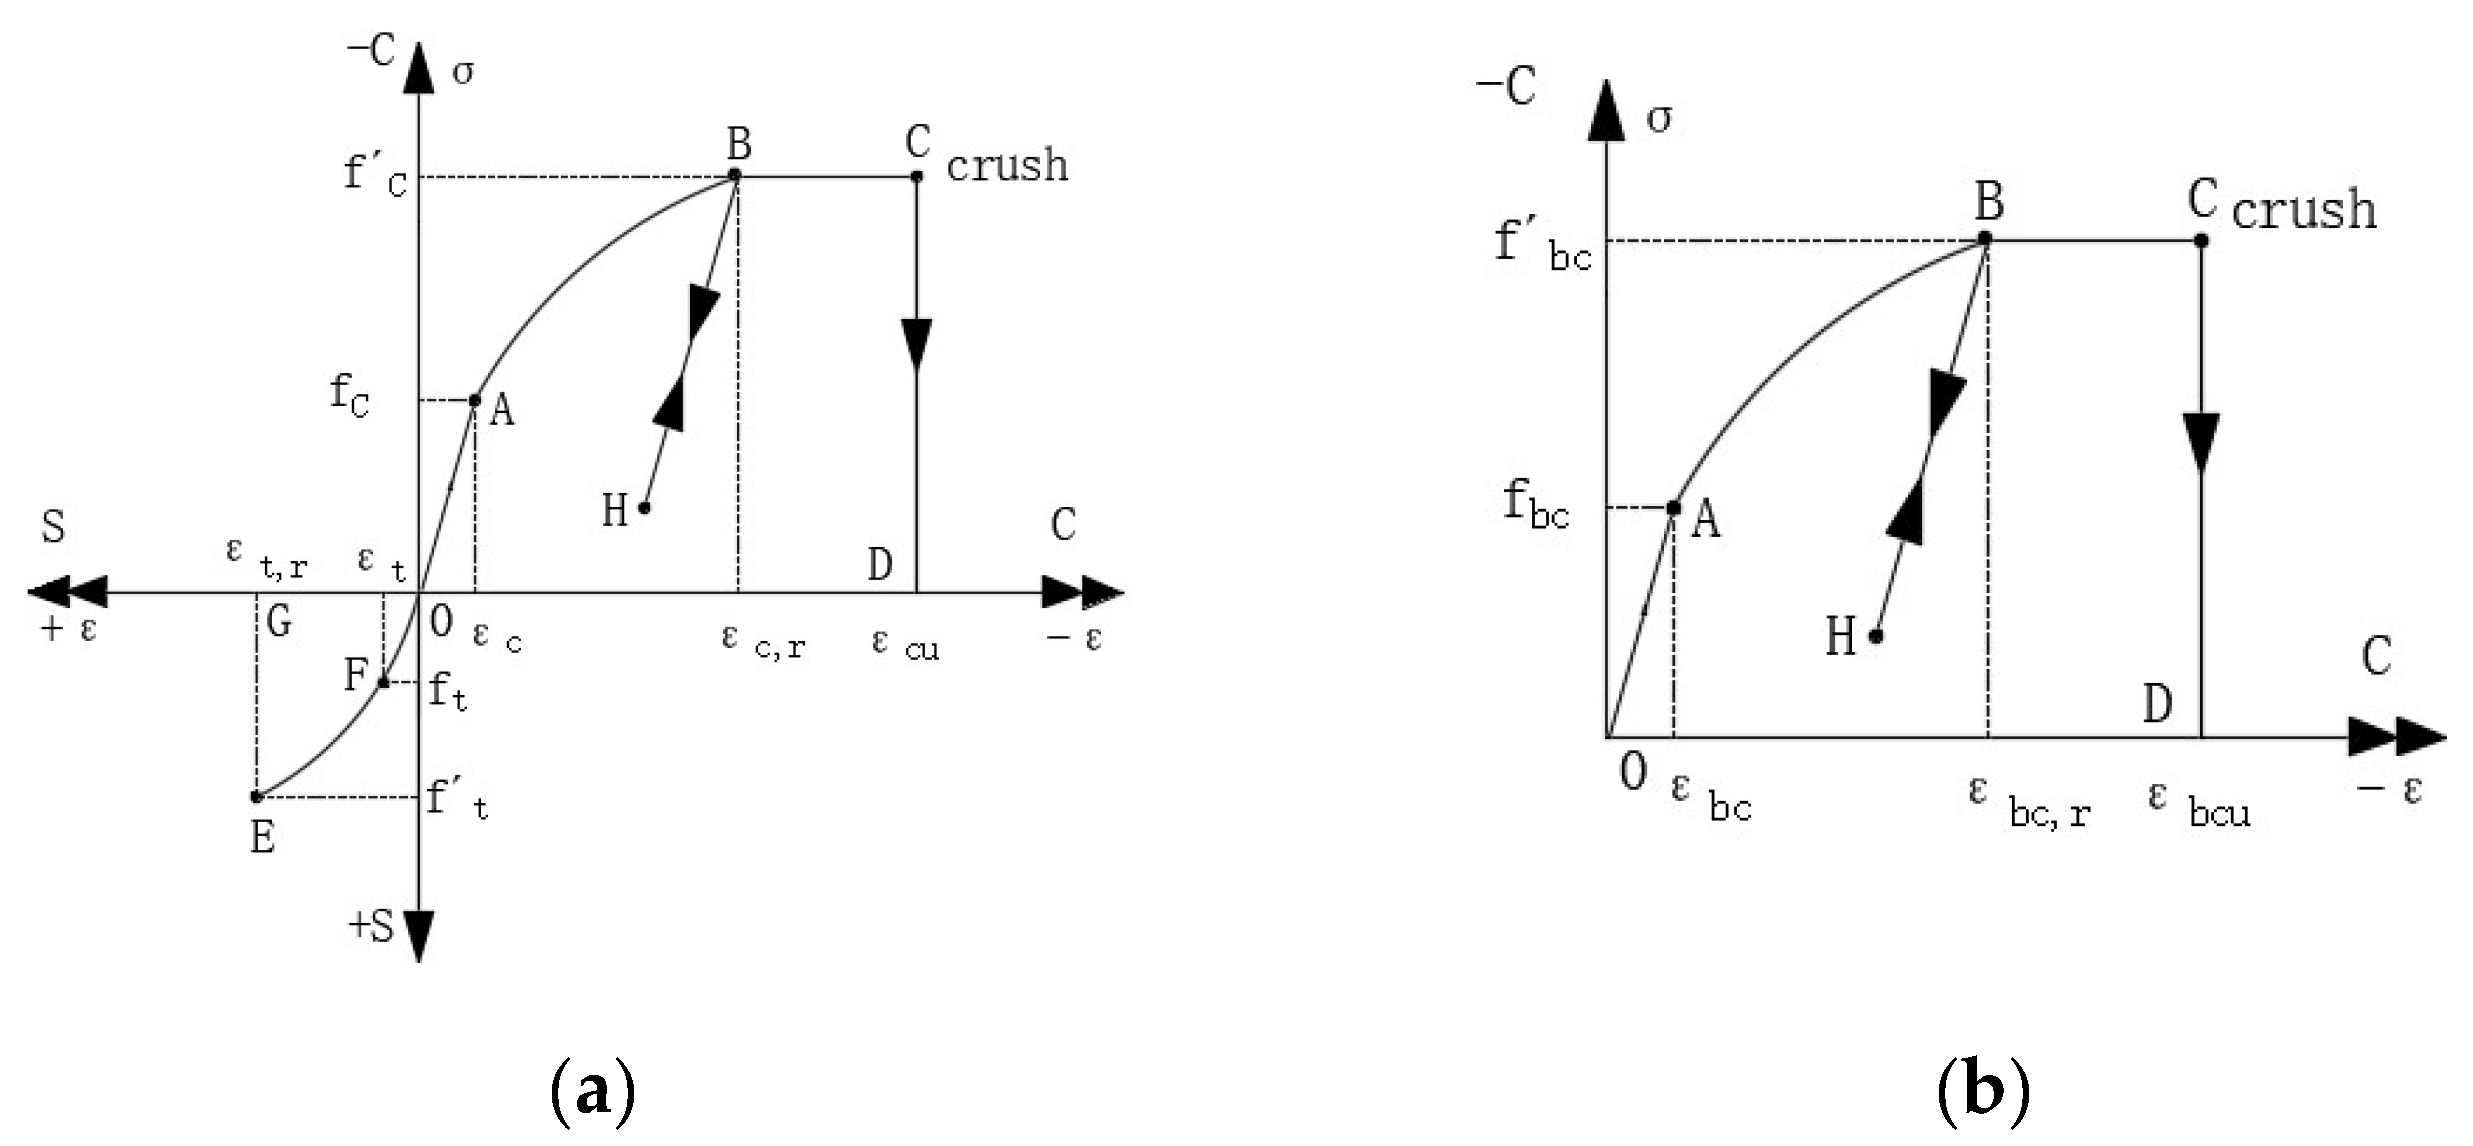
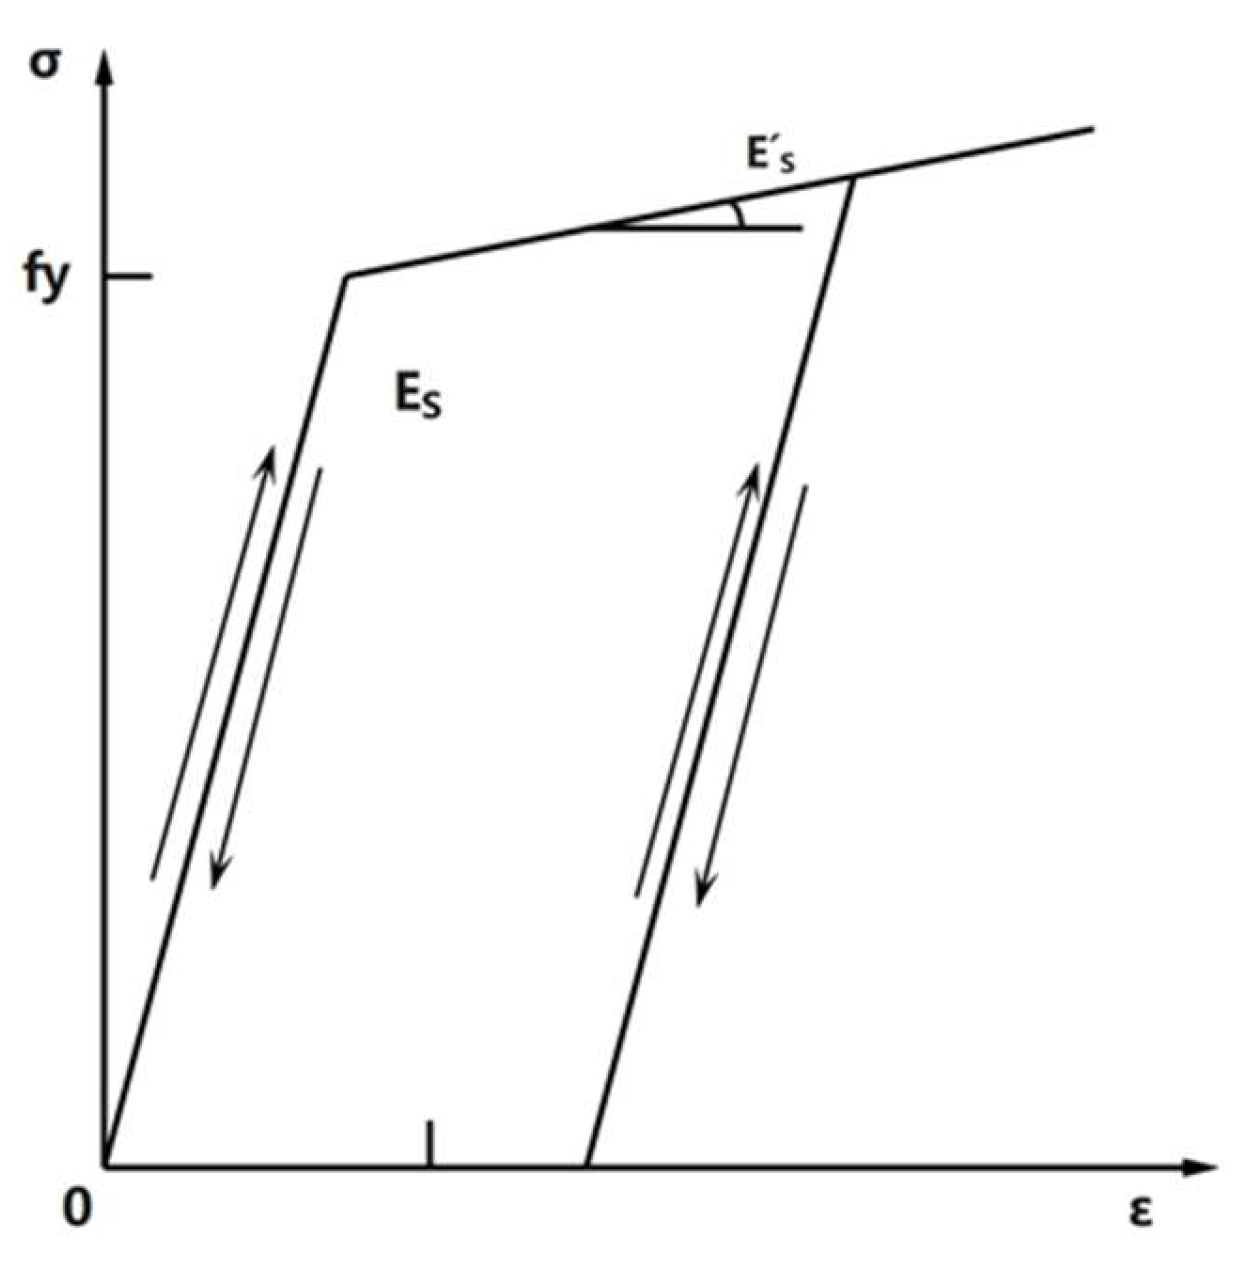
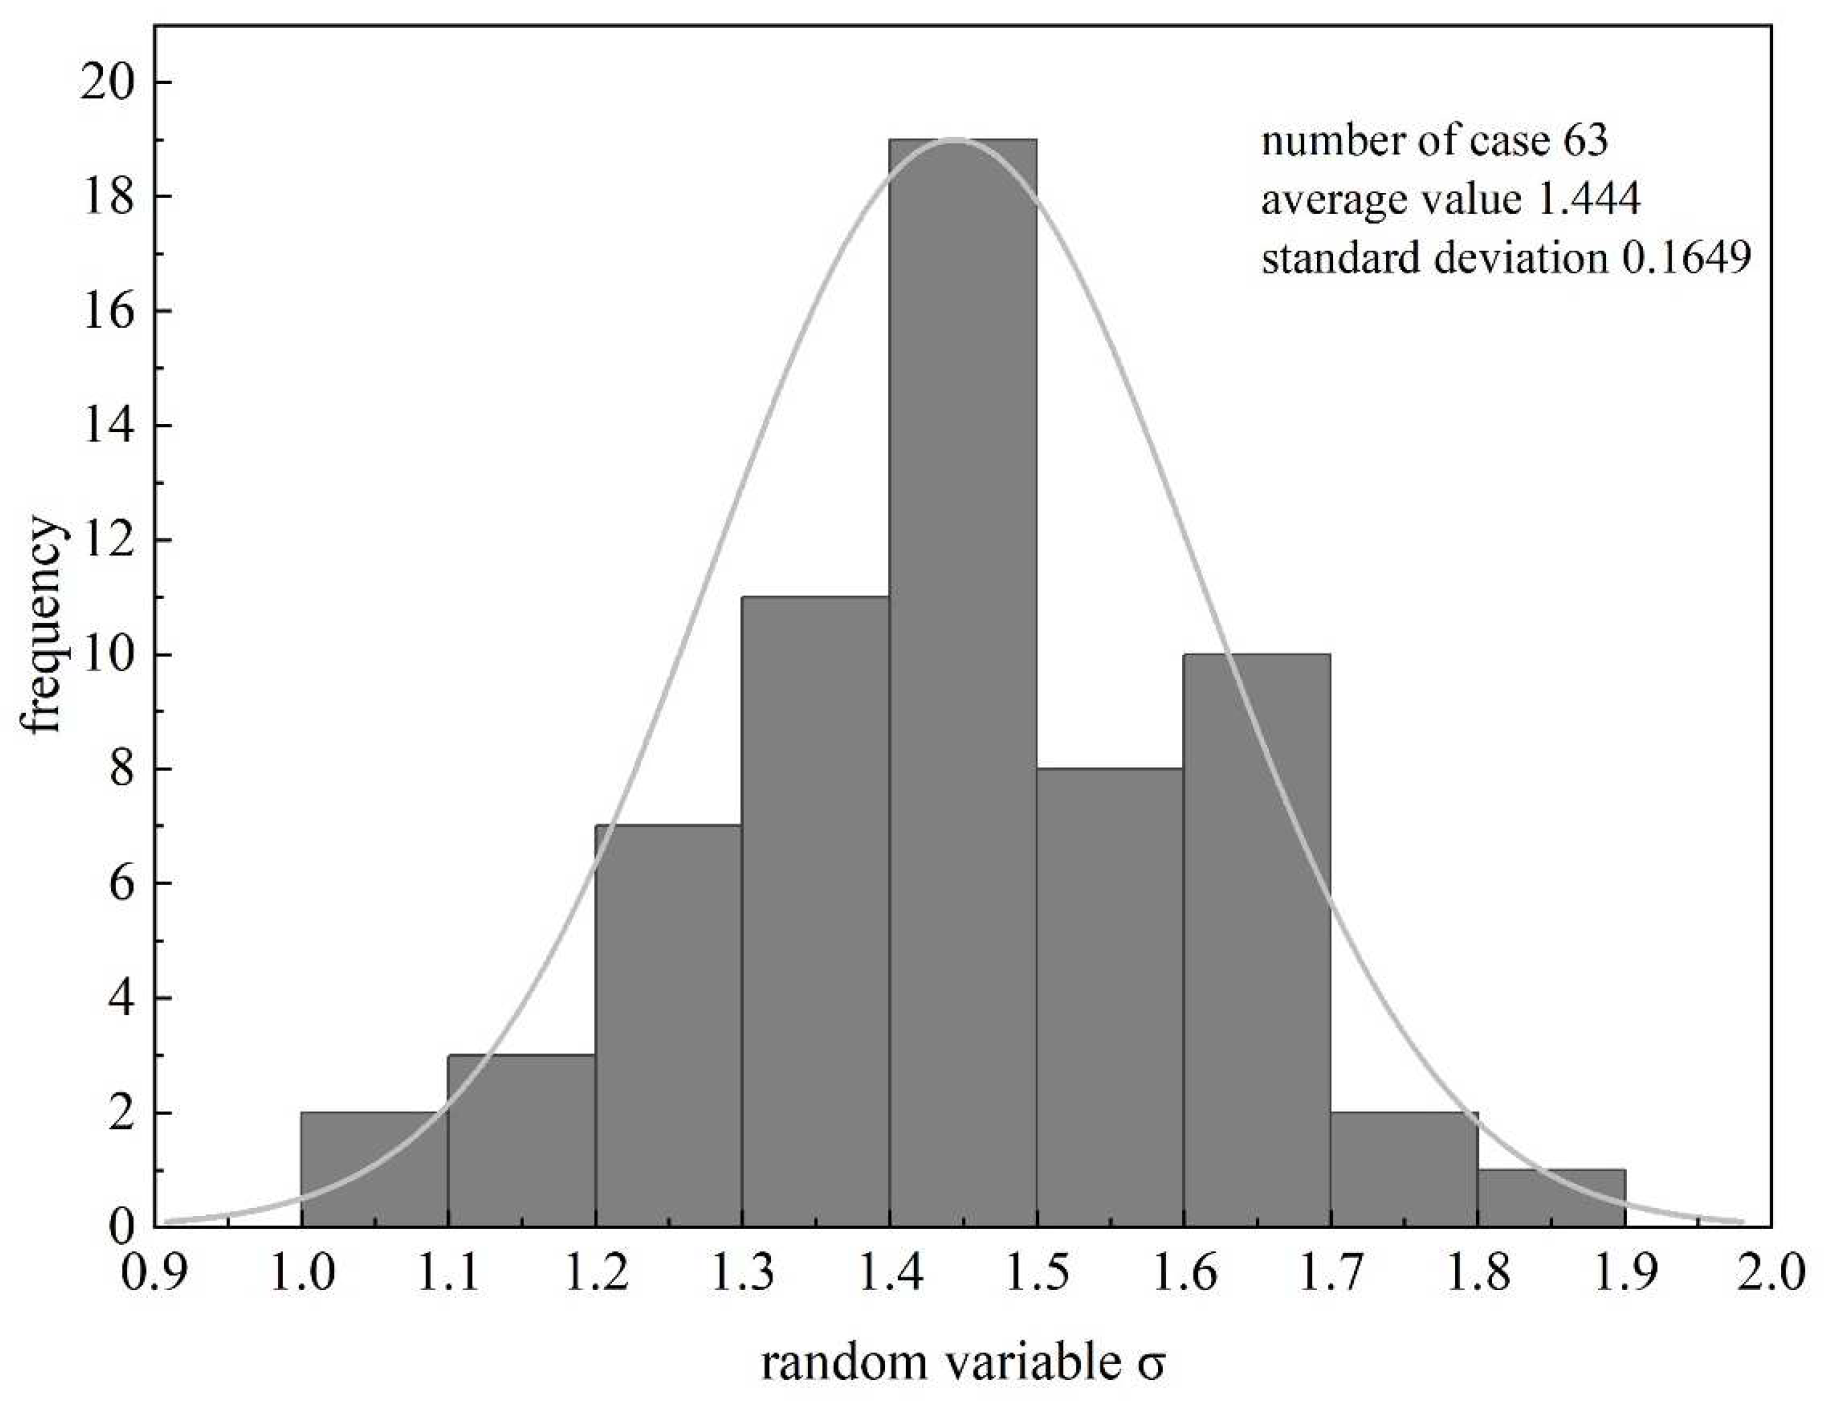
2.1. Simulation Methodology

In this paper, the three-dimensional solid-degraded virtual laminated unit nonlinear finite element VFEAP procedure was used [18] for modeling and analysis. The finite element theory incorporated in this program adequately addresses the spatial effects and failure modes of structures, concurrently enhancing the computational efficiency.
The solid degeneration element is essentially an improved 8–20-node spatial isoparametric element as Figure 1. By dividing the cubic parent element into several blocks, it is assumed that each block is a hexahedron (either straight or curved) defined by 8–20 vertices to represent its geometric shape. The natural coordinates within the block are obtained using the unit coordinate interpolation method.
ζ = i = 1 n k N i ( ξ , η , ζ ) ζ i k
η = i = 1 n k N i ( ξ , η , ζ ) η i k
ζ = i = 1 n k N i ( ξ , η , ζ ) ζ i k
where n k represents the number of fixed points required to describe the first k block, with a range of values from 8 to 20, and ξ [ 1 , 1 ] , η [ 1 , 1 ] , ζ [ 1 , 1 ] are the natural coordinates of the parent blocks. The coordinate transformation between the parent block and each block is based on the Jacobi matrix:
J = ξ ξ η ξ ζ ξ ξ η η η ζ η ξ ζ η ζ ζ ζ
The solid degeneration virtual layer composite element is developed by appropriately introducing the fundamental assumptions of beams, slabs, and shells based on the spatial isoparametric element as Figure 2 and Figure 3. Simultaneously, relative displacement parameters are introduced, and the stiffness matrix is modified to construct a degenerated series of beam, slab, and shell elements. The concept of “virtual nodes” and “virtual regions” is introduced, defining different blocks within the same element and assigning them distinct material properties. This allows the blocks representing different materials and geometric shapes to coexist within the same element. This method significantly improves upon deficiencies in conventional finite element simulation methods, enabling the precise and efficient simulation of irregular shapes, nonlinear displacements, and a large number of elements.
The three-dimensional solid degeneration virtual layer composite nonlinear finite element program used in this paper considers dual nonlinearity, encompassing both geometric and material nonlinearity. Geometric nonlinearity employs a complete Lagrange format for calculating the ultimate bearing capacity, while material nonlinearity introduces the multiaxial reinforced plasticity constitutive model based on Ohtani and Chen [19] to simulate concrete materials. The ideal uniaxial stress–strain curve and the ideal biaxial compression stress–strain curve of the three-dimensional generalized reinforced plasticity concrete constitutive relationship are shown in Figure 4.
The constitutive model for reinforcing bars adopts the elastic reinforcement model proposed by scholar Guo Zhenhai [20], as shown in Figure 5. The stress–strain model of the rebar is divided into two stages: After linear elasticity, the bars yield, followed by a fixed slope (E′S = 0.01 ES) incline that rises to the ultimate strength. The simulation of reinforcing bars employs three-node input for localization (midpoint of the bar and two endpoints). The material properties of the bars are defined by setting parameters such as the elastic modulus, bar density, and cross-sectional area.
Concrete cracks are considered using an orthogonal distribution model, taking into account cracking in different directions at an integration point. The concrete failure criterion adopts the ultimate strain failure condition proposed by Ohtani and Chen [21].
During the computational solution process, the system of nonlinear equations of the 3D solid degeneration virtual laminated element analysis method is solved using the iterative incremental solution method of the m-N-R [22] solution. The loading procedure employs the current stiffness method [23] to apply force load onto the structure for analysis: Initially, during the force application, the structure is in the linear elastic loading phase with a relatively large load increment; in the later stages, when the structure undergoes significant deformation, it enters the nonlinear loading phase with smaller load increments. When the load increment is small and the structure deformation undergoes a sudden change, it is assumed that, at this point, the load is the ultimate load that the structure can withstand. The finite element method used in this paper has been widely proven and applied in civil engineering, bridge construction, and geotechnical and high-rise structure analyses [24,25,26,27,28,29].

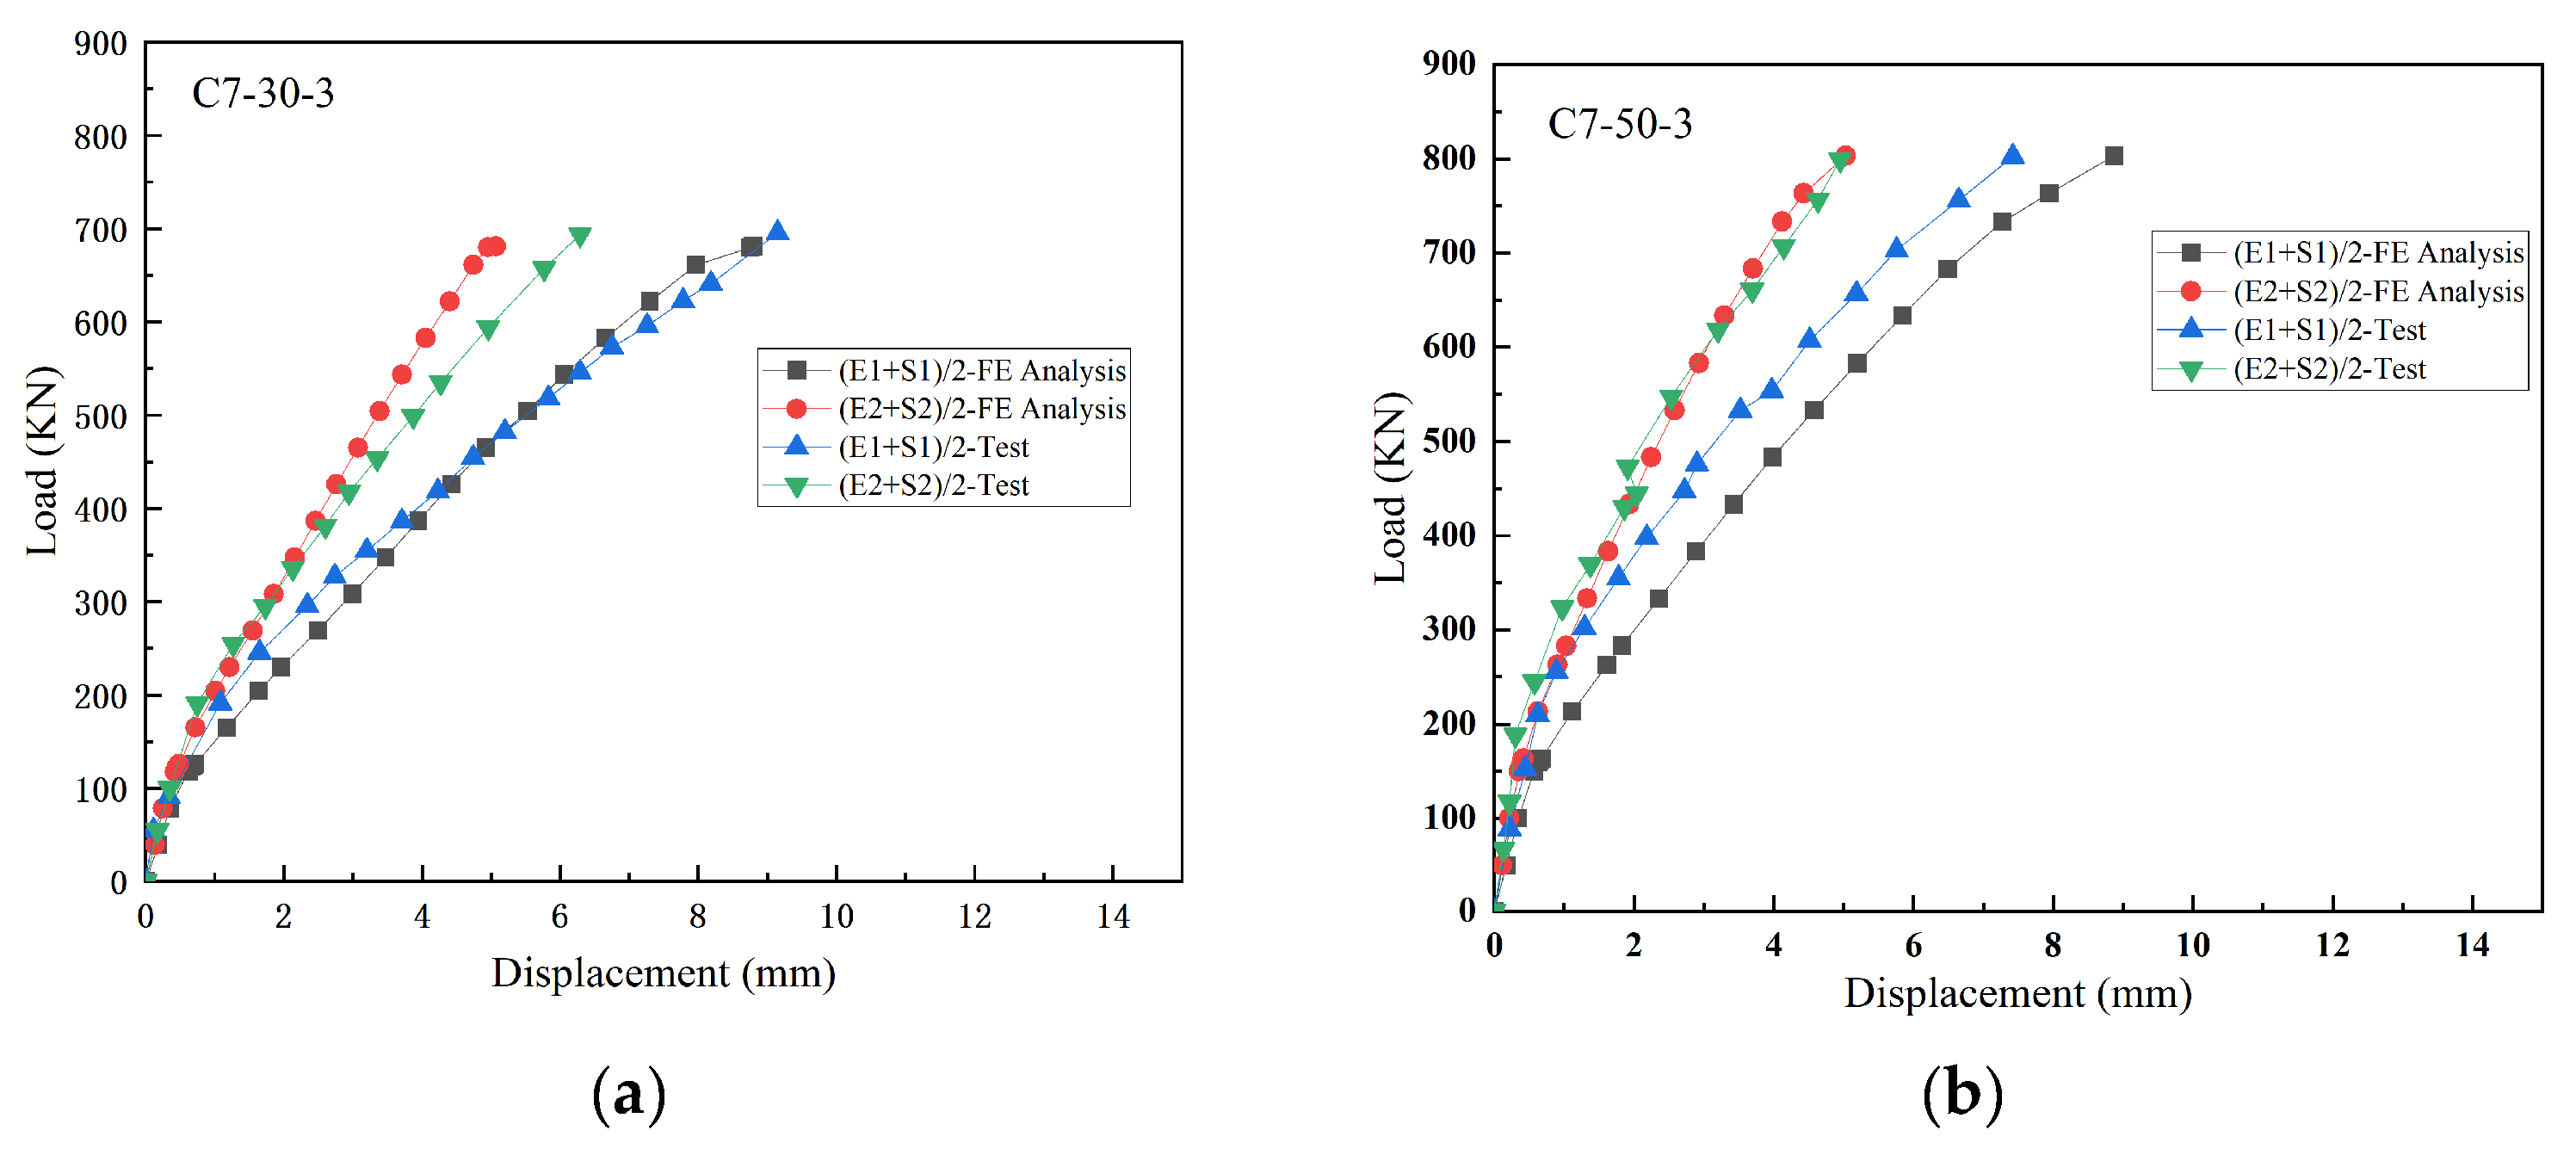
2.2. Comparison with Experiments

The finite element simulation results were compared with the experimental results obtained by scholars such as Yi Weijian and Hong Feng [30]. Five specimens of slab–column connections with a punch–span ratio of 7 were fabricated in the experiments. Two crucial parameters, concrete strength and longitudinal reinforcement ratio, were considered as variables. Using the method of controlling variables, the concrete strength grades and longitudinal reinforcement ratios were varied independently to investigate the influence of these two important parameters on the punching shear failure performance of the slab–column connections.
The detailed parameters of the slab–column connection components designed by Yi Weijian et al. are presented in Table 1. The specimen number is represented as follows: the digit following the letter “C” indicates the punch–span ratio, the middle digit signifies the concrete strength grade, and the final digit represents different reinforcement ratios.
These specimens consisted of reinforced concrete slabs and short square–section columns. The concrete slabs had dimensions of 2550 mm × 2550 mm × 180 mm, and the short square-section columns were centrally positioned on the slabs, each measuring 250 mm × 250 mm. A concentrated load was applied to the column head (Figure 6), and displacement points were strategically placed on the surface of the reinforced concrete slabs. This arrangement facilitated the observation of surface deformations during the loading process, allowing for a comparison to be made with the deformation and damage states of the slabs. By analyzing the morphological changes in the damage process of the slab–column connection through the comparison and observation of the slab surface deformations, we aimed to gain insights into the loading process and damage evolution. The arrangement of the displacement measurement points on the specimen is illustrated in Figure 7.
In the simulation modeling of the slab–column component, the elements were divided based on the component dimensions and displacement measurement points. Components such as the slab, column, and supports were defined according to the different material properties in the finite element software(Virtual Fortran 6.5) as Figure 8. The model specified that the supports were fixed to the ground, with lateral supports fixed in the X and Z directions of the main structural model, and vertical supports fixed in the Y and Z directions. A reinforcement was positioned using three-node input (midpoint and two endpoints), and its material properties were defined by setting parameters such as the elastic modulus, density, and cross-sectional area. The longitudinal reinforcement ratio was determined by changing the spacing between the longitudinal reinforcements. The plan, section, and reinforcement details of component C7-70-1 are shown in Figure 9. Uniform loads were applied on the top surface of the column. To avoid local failure phenomena during loading in the finite element software, an elastic block with a thickness of 20 mm was added on the top surface of the column. The finite element model of the slab–column connection is shown in Figure 8. To minimize errors, displacement values were measured multiple times, and the average values were used to plot the required curves.
The comparison graph in Figure 10, depicting the deflection curves at the load point on the slab center, reveals similar trends in the experimental curves of the five specimens and the numerical simulation curves. This observation suggests that the finite element method employed in this study effectively simulated the loading process of the slab–column connection components. The only notable difference was that during the experimental process, there was a significant drop in the deflection curve after reaching the ultimate state during unloading, a phenomenon that the software could not replicate; therefore, no declining segment was observed in the simulation.
The comparison of the deflection curves at the load point on the center of the slab also indicated good agreement between the simulated and experimental values. The change in deflection showed a close match, with similar curve shapes. The differences between the maximum load and the ultimate bearing capacity were relatively small, demonstrating the software’s capability to accurately simulate the deformation during the loading process of the slab–column connection. A comparison graph of the deflection curves at the load point on the center of the slab is illustrated in Figure 11.
Observing the failure mode diagram of the test slab, at the state of ultimate loading, radial cracks radiated along the corners of the slab, and a ring-shaped crack appeared near the slab–column connection. Comparing this with the stress contour map generated through simulation under the same conditions as Figure 12 it is evident that stress was concentrated near the column head, forming a distinct closed loop. The stress was concentrated in strip-shaped regions extending from the column corner to the slab corner in four directions. This indicates that the location of the stress concentration on the slab surface corresponds to the location of crack initiation.

3. Parametric Simulation Analysis of Impact and Flexural Performance

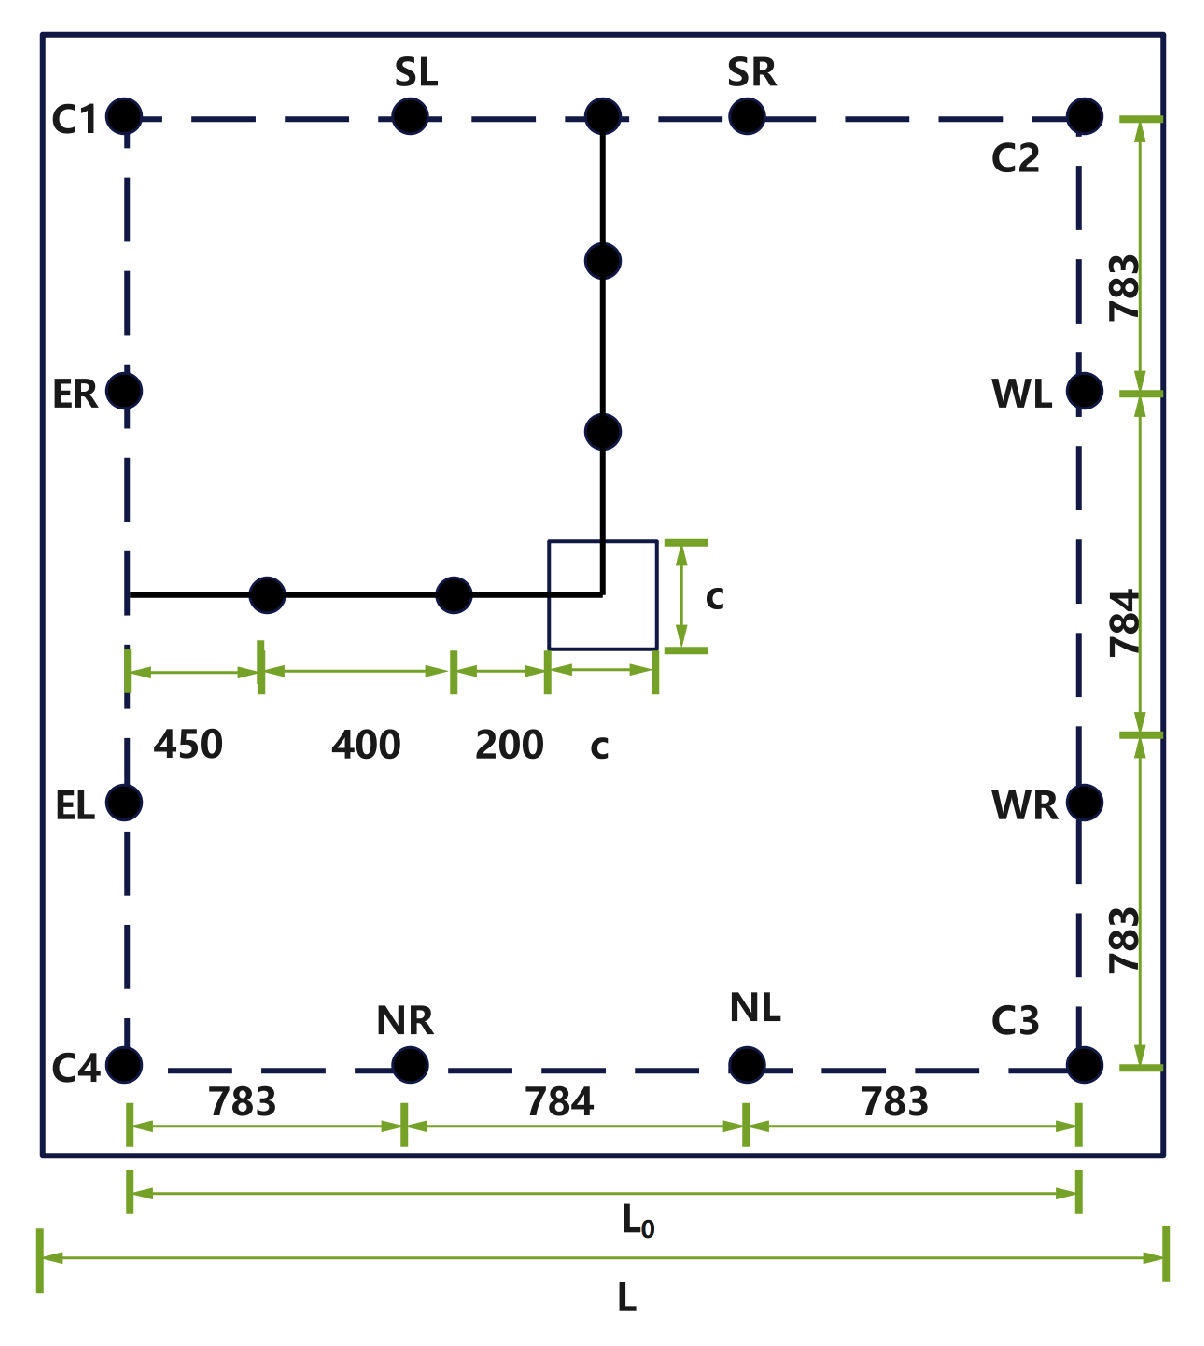
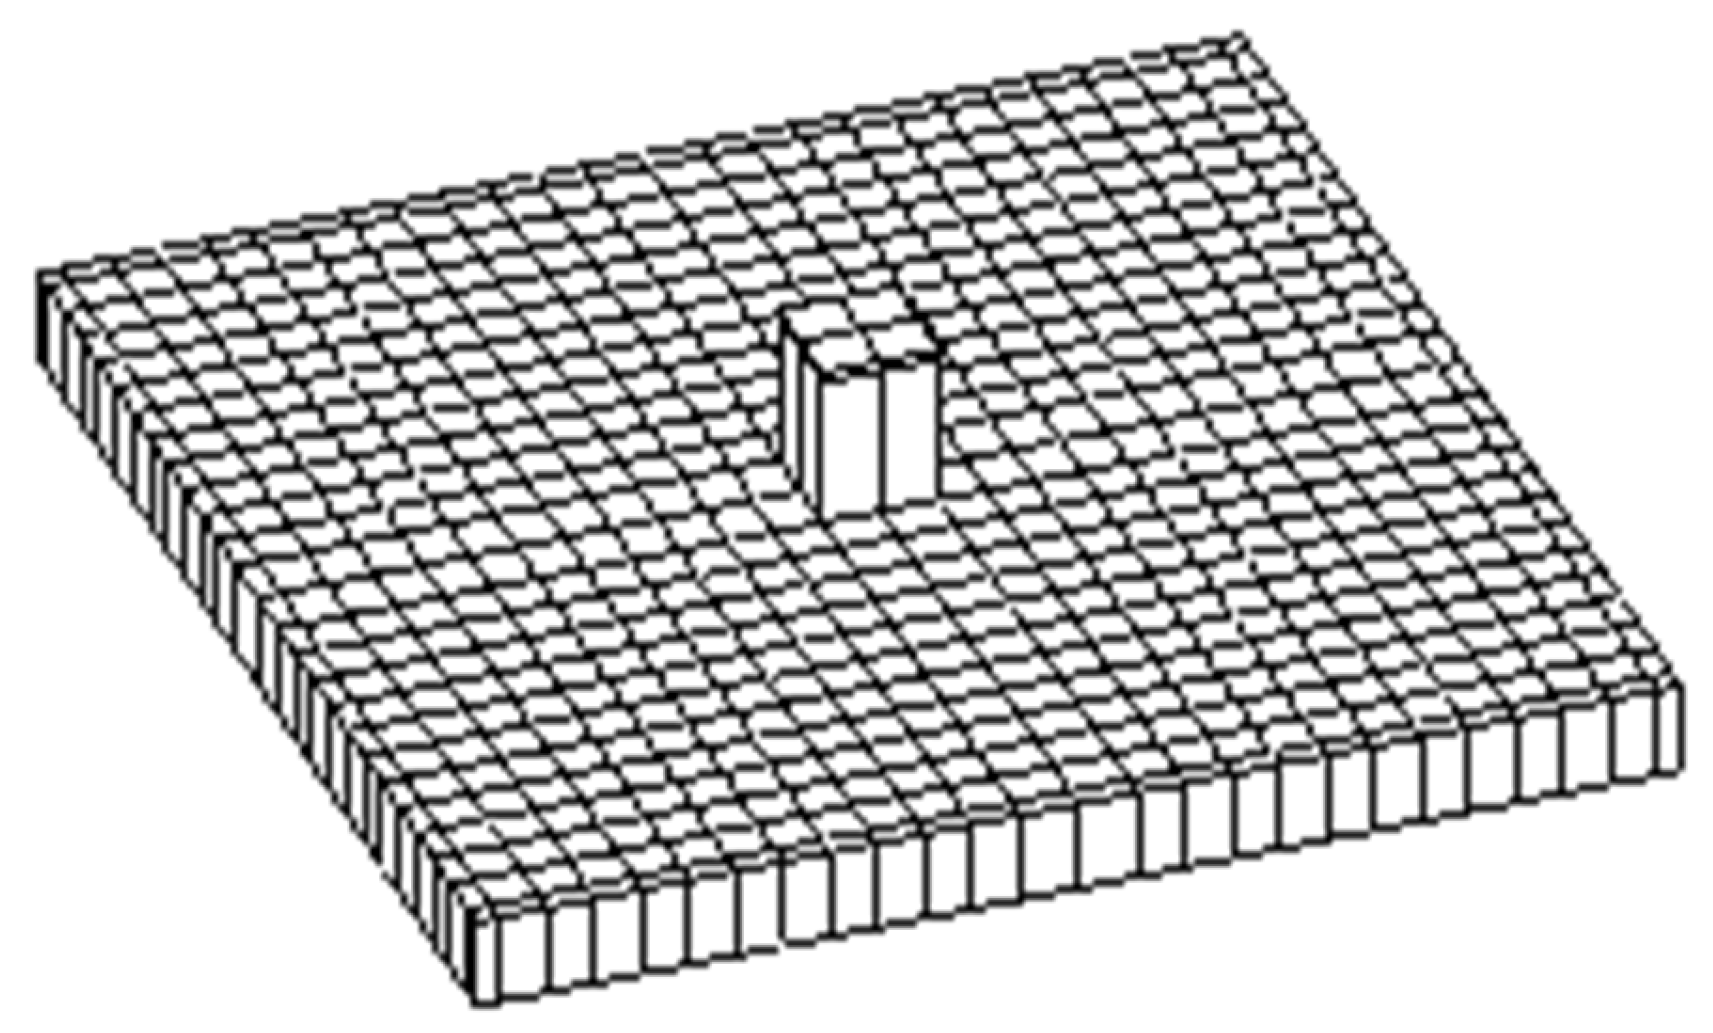
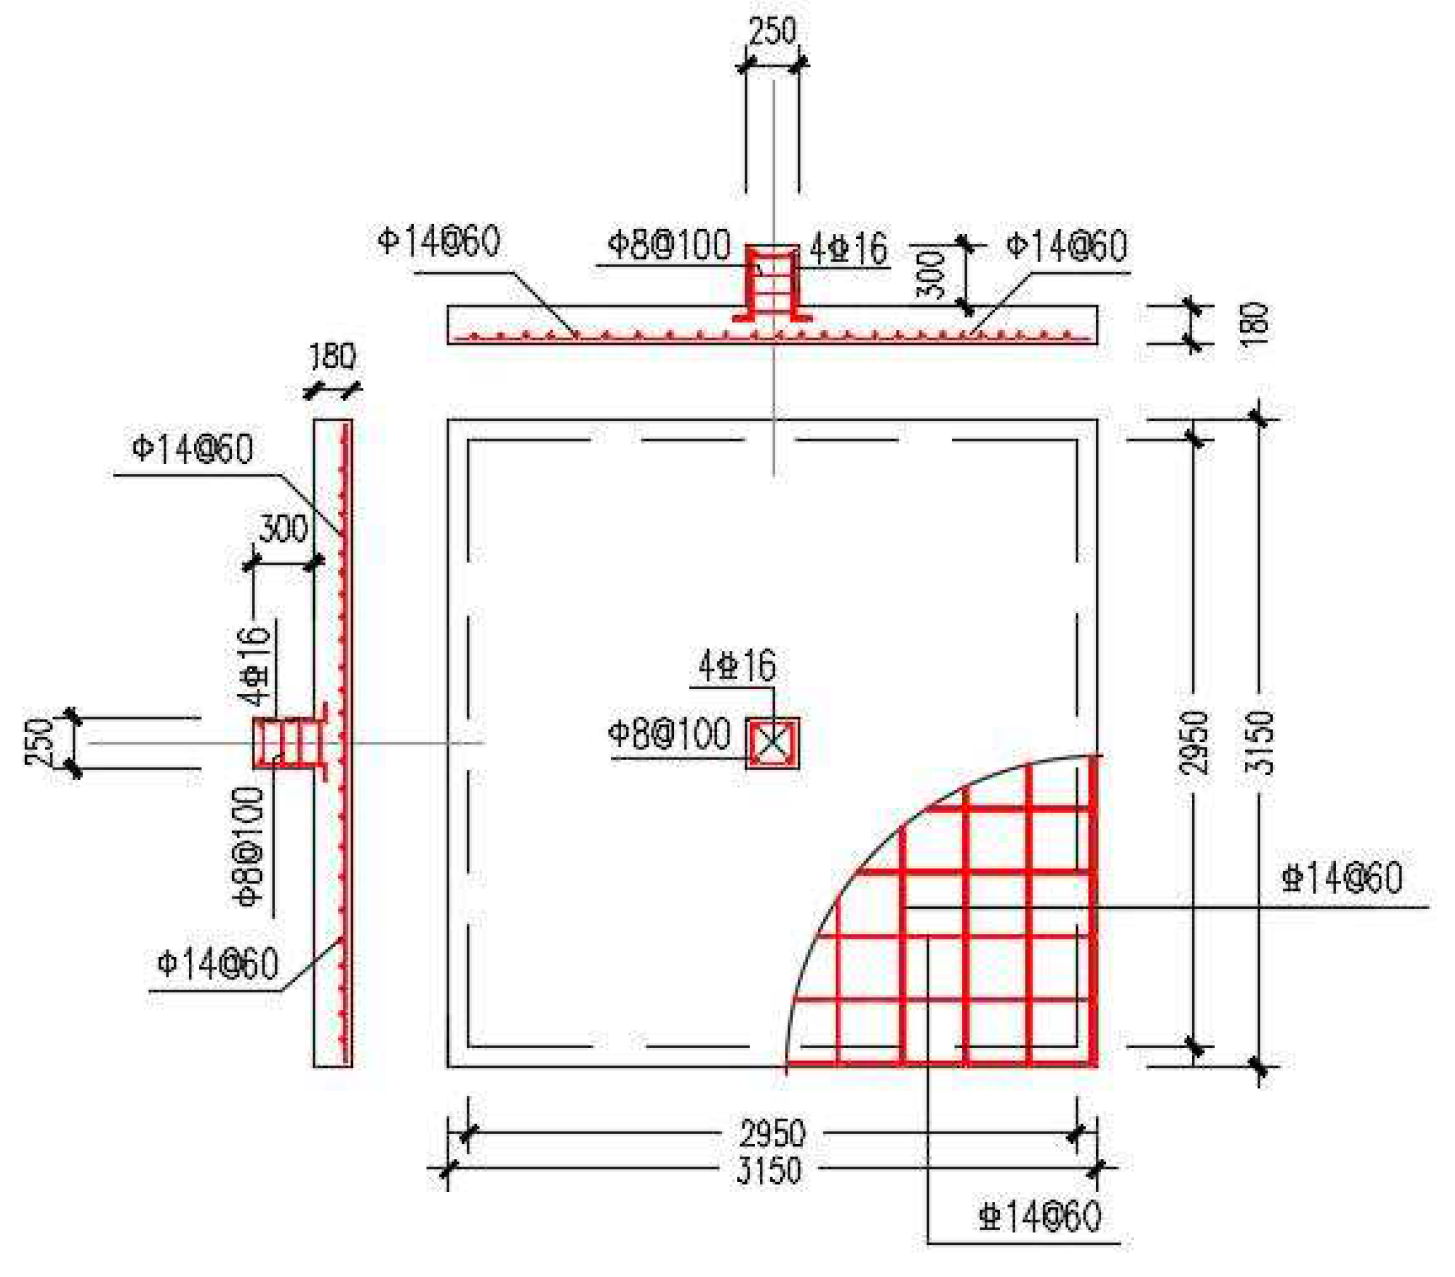
3.1. Model and Parameters

In order to study the combined effects of the punch–span ratio and longitudinal reinforcement eigenvalues on the damage mode of the reinforced concrete slab–column connections, and to explore the critical problems of flexural, flexural–punching, and punching damage, 42 slab–column connection models were designed. The parameters included the punching span ratio (3 to 15), the reinforcement ratio (0.86%, 1.28%, and 1.73%), and concrete strength (C30 and C50). All models had a slab thickness of 180 mm, an effective thickness of 150 mm, and square columns with a side length of 250 mm. The specimen parameters and numbers are shown in Table 2 below. The model was built using the common finite element method in the validation of the examples; the model specimen reinforcement was HRB400 rebar, and the bottom of the slab was arranged in a single layer in both directions. The yield strength of the reinforcement and the concrete strength were both based on the design values [31].

3.2. Analysis of Failure Modes

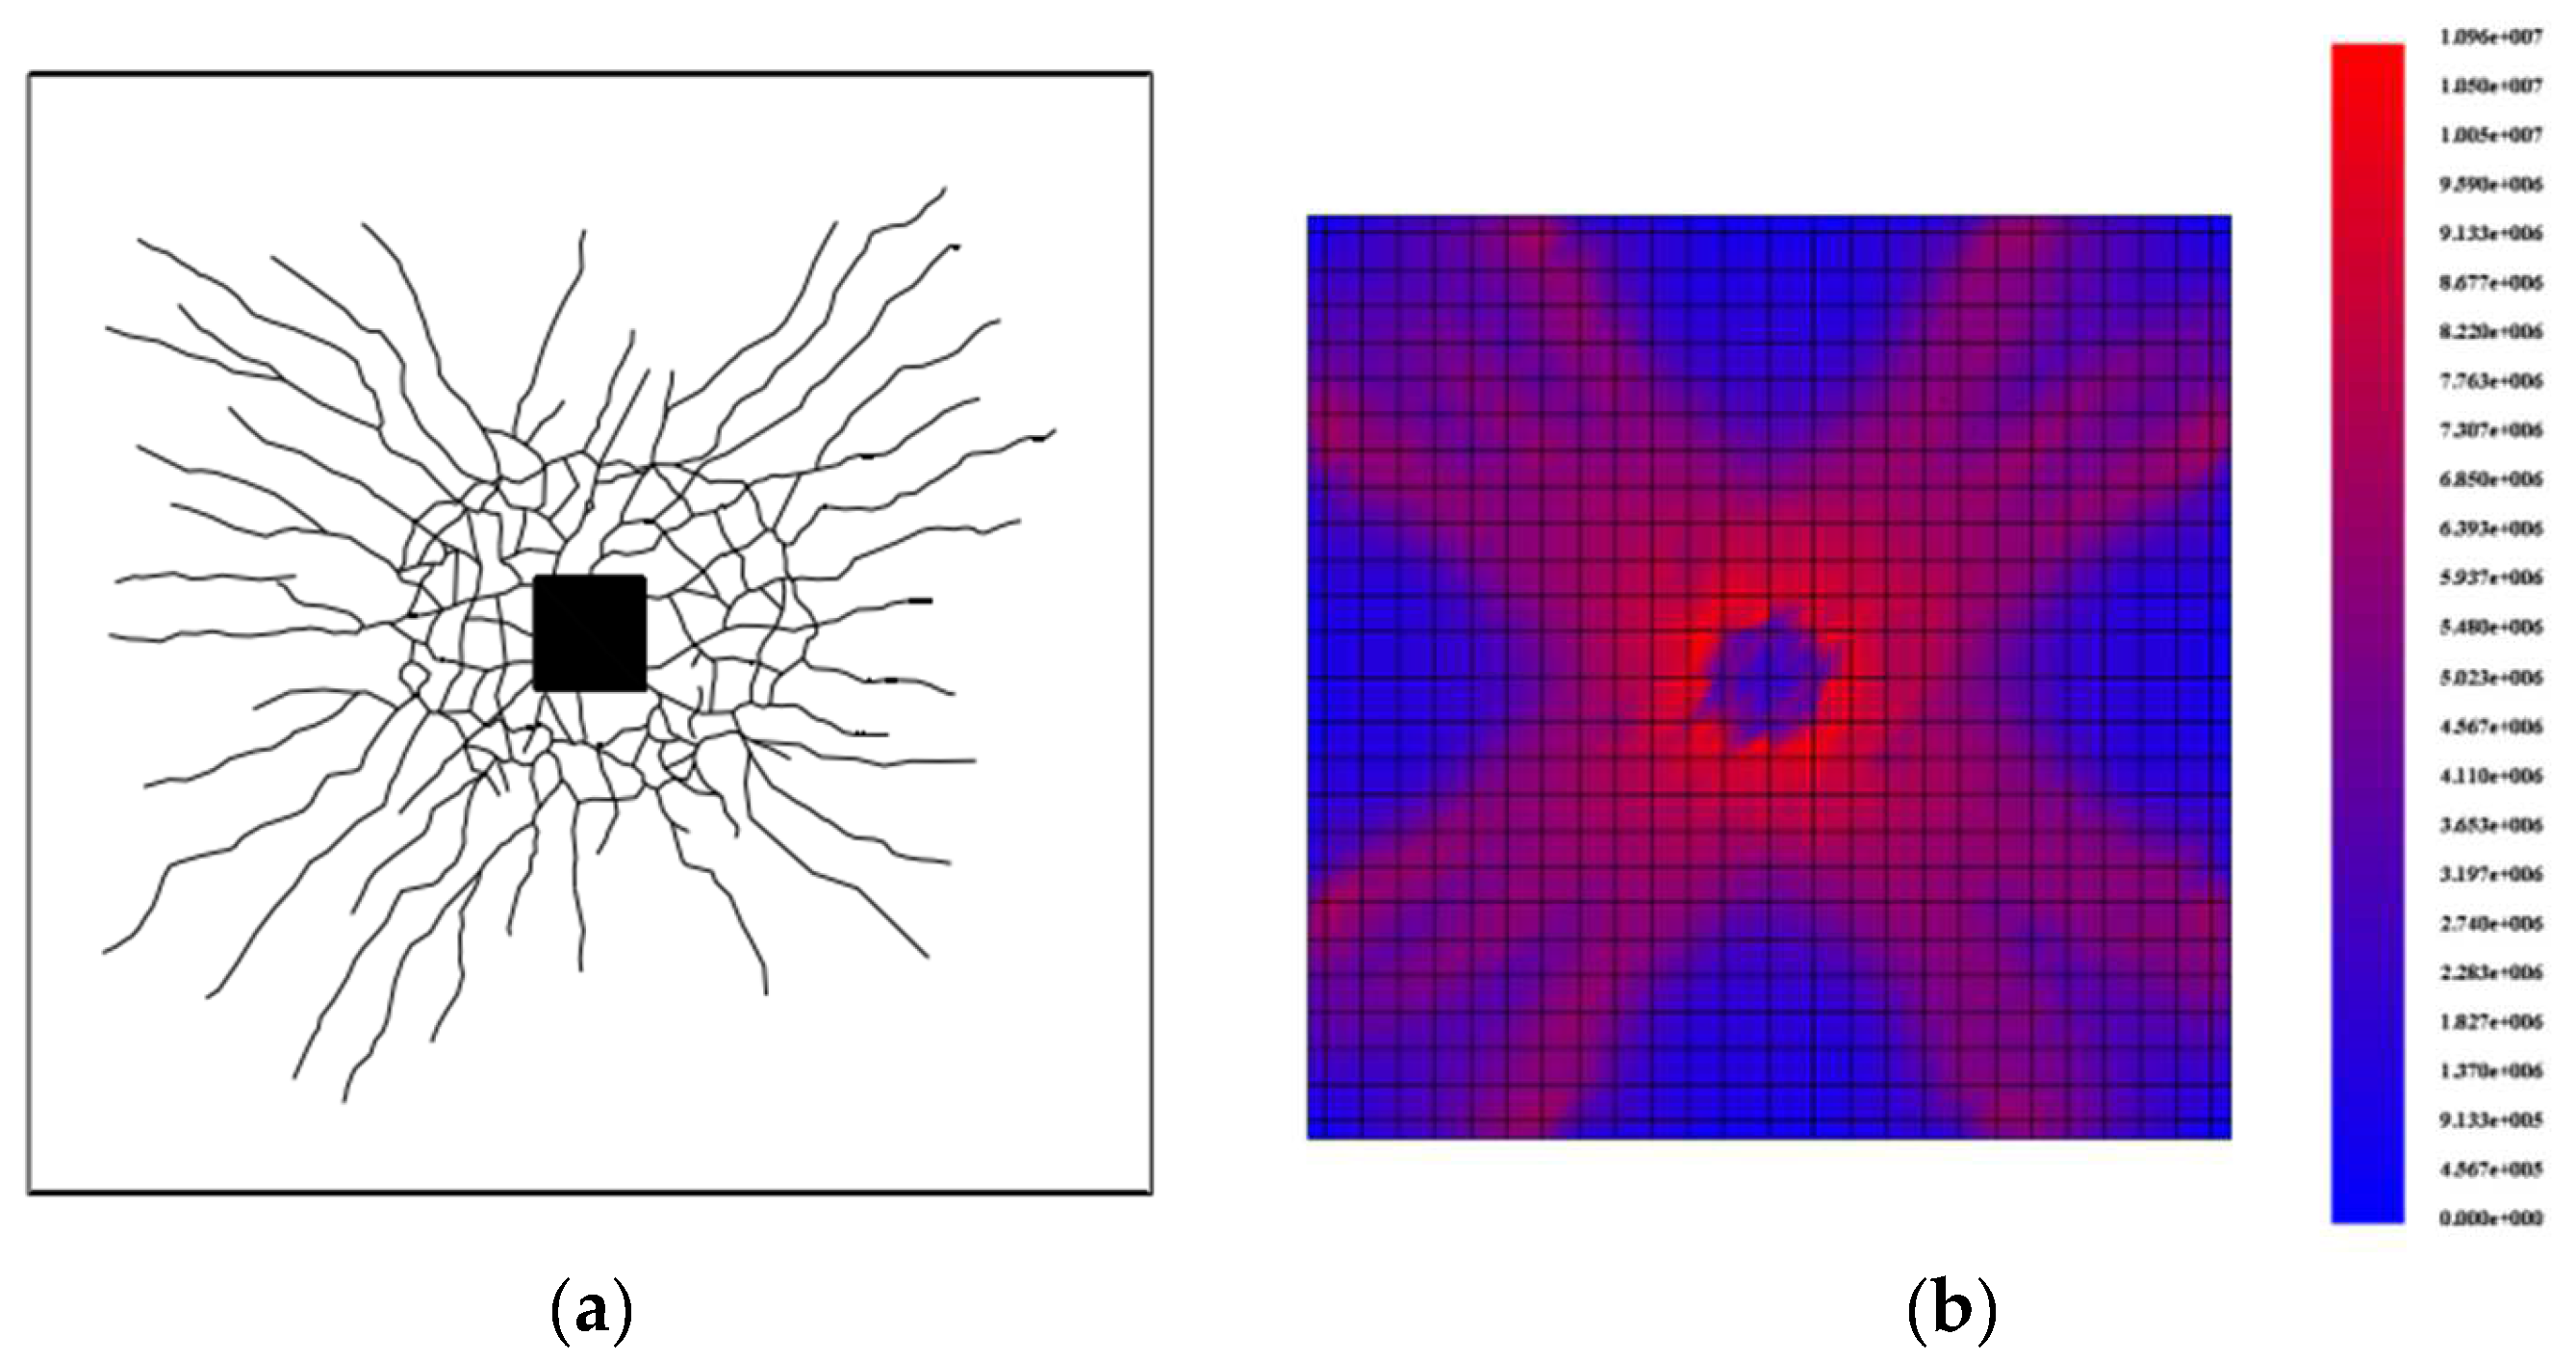
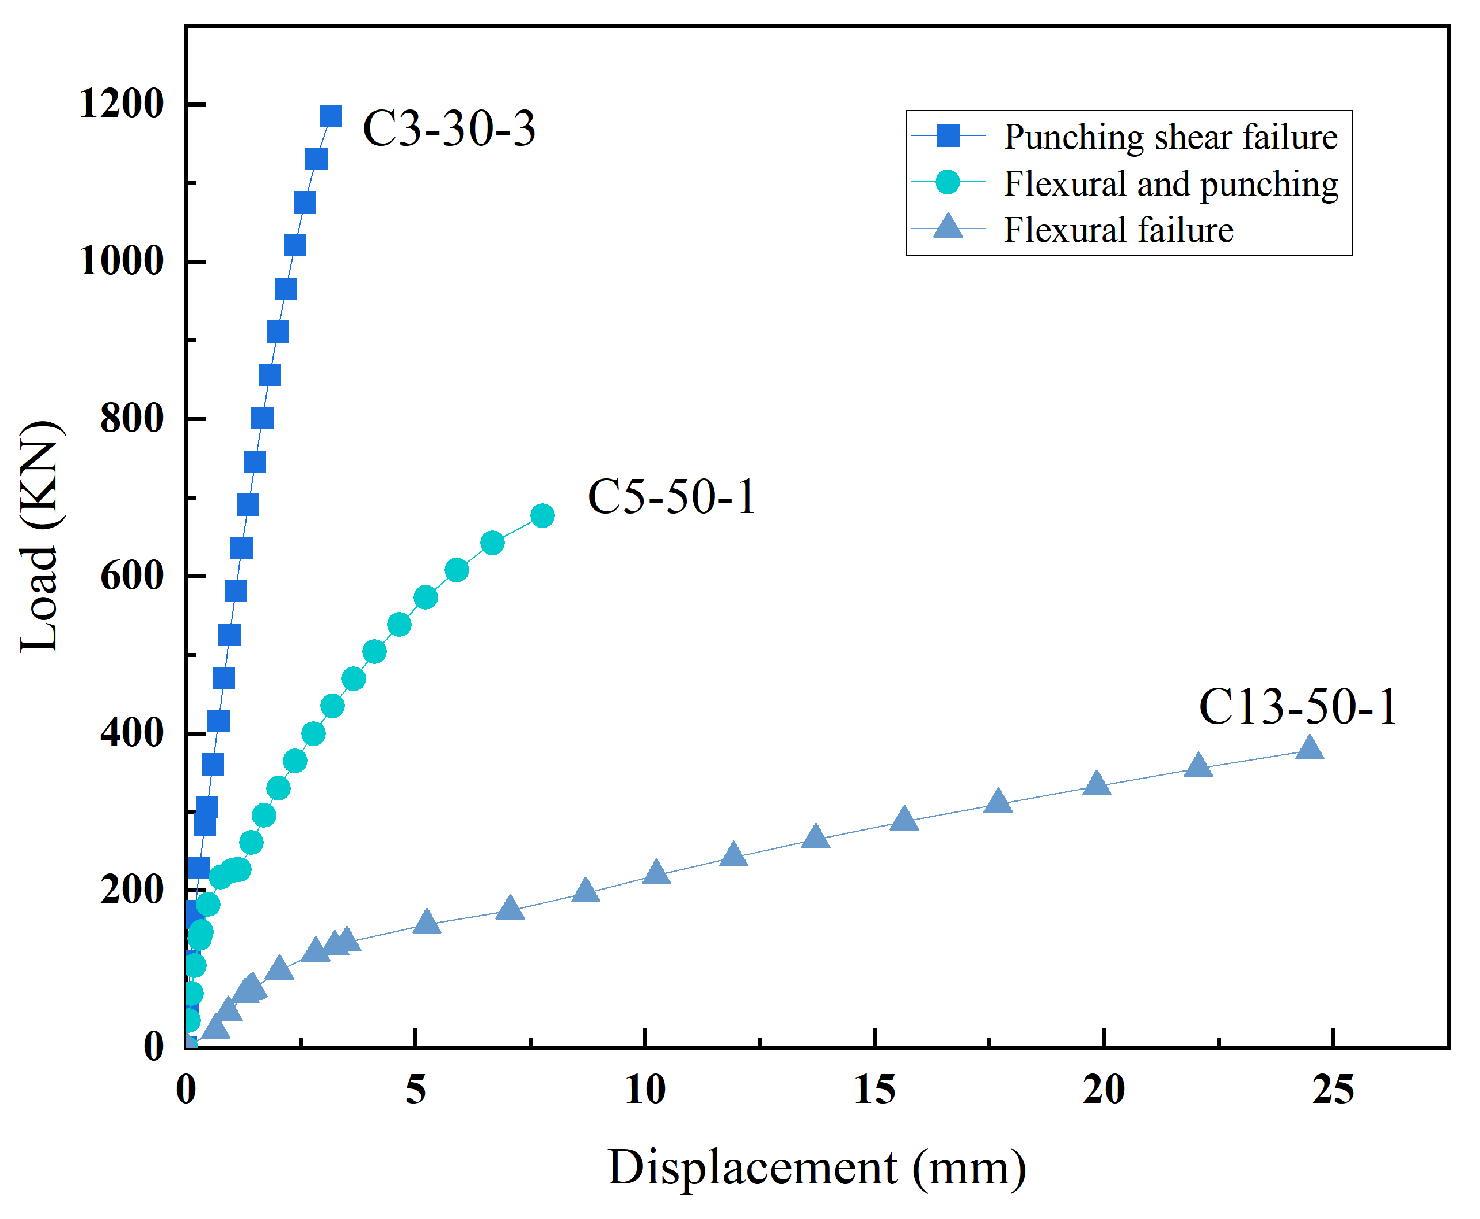
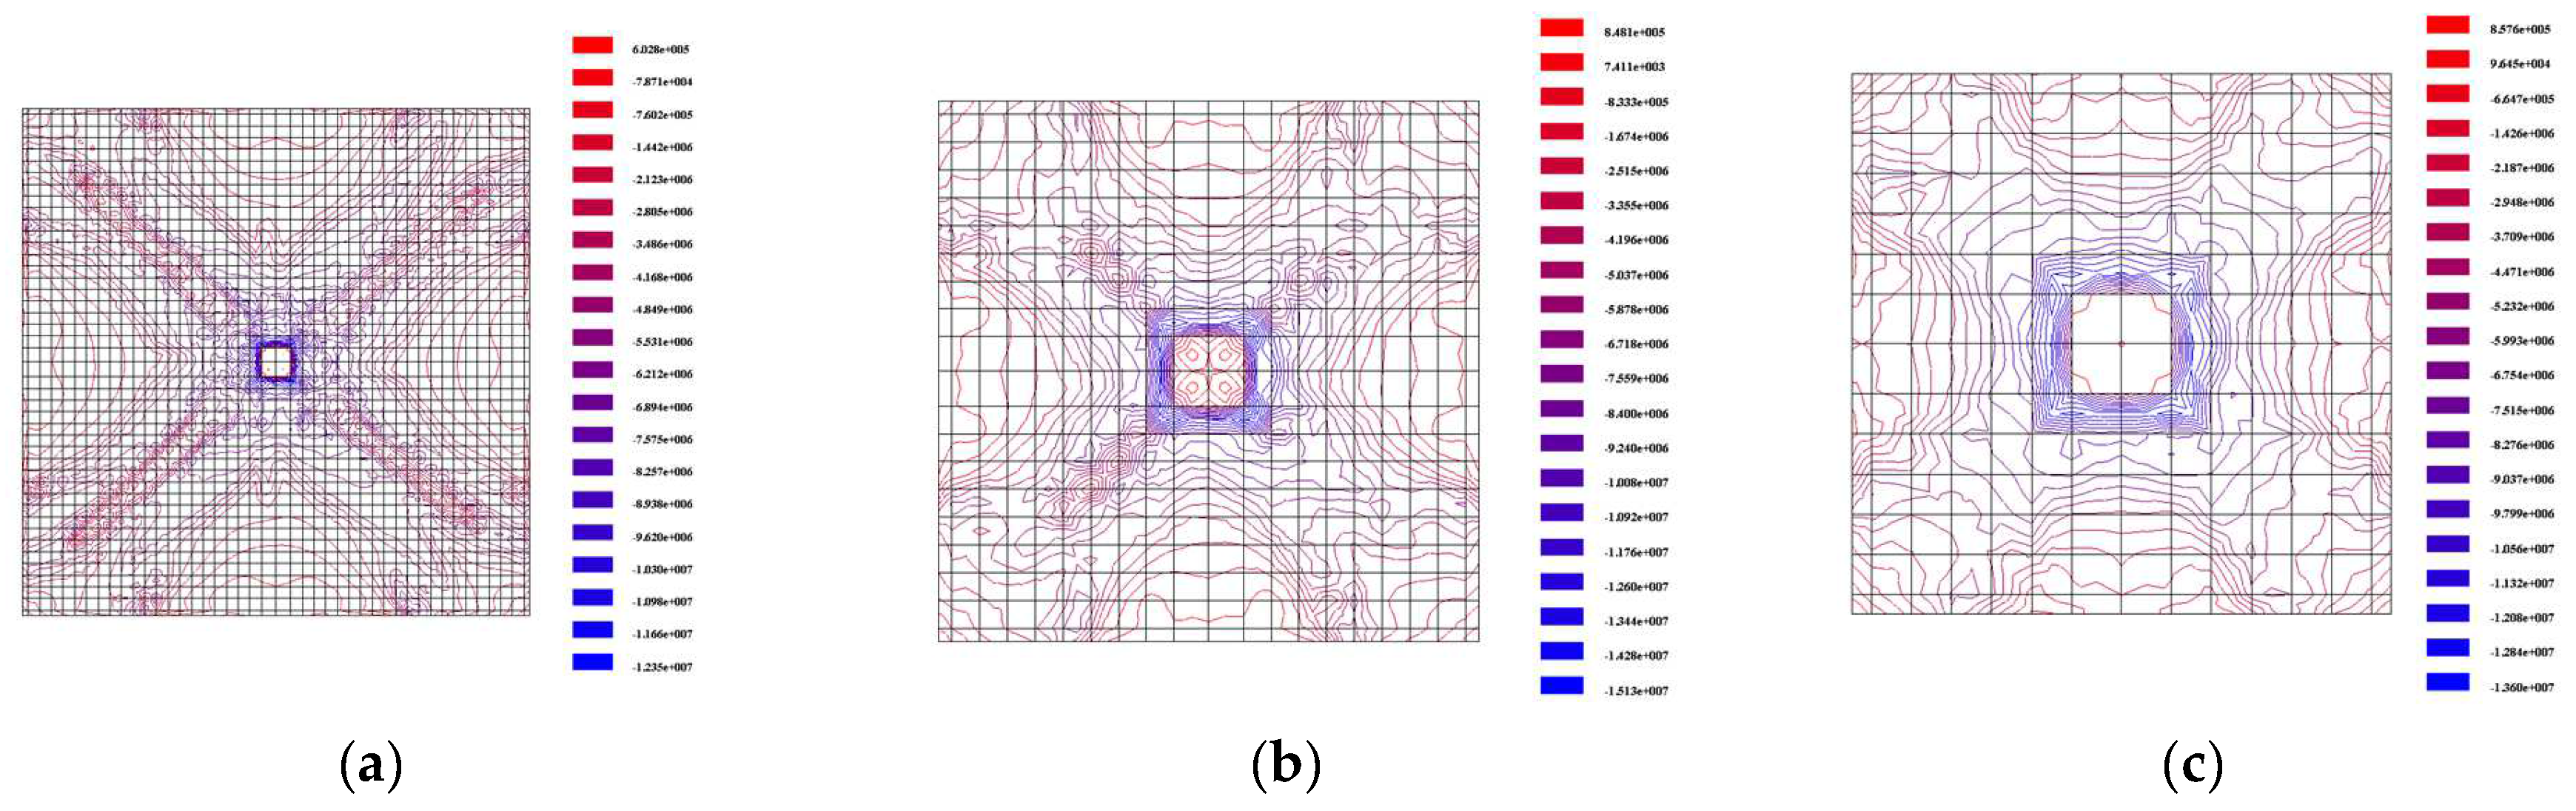
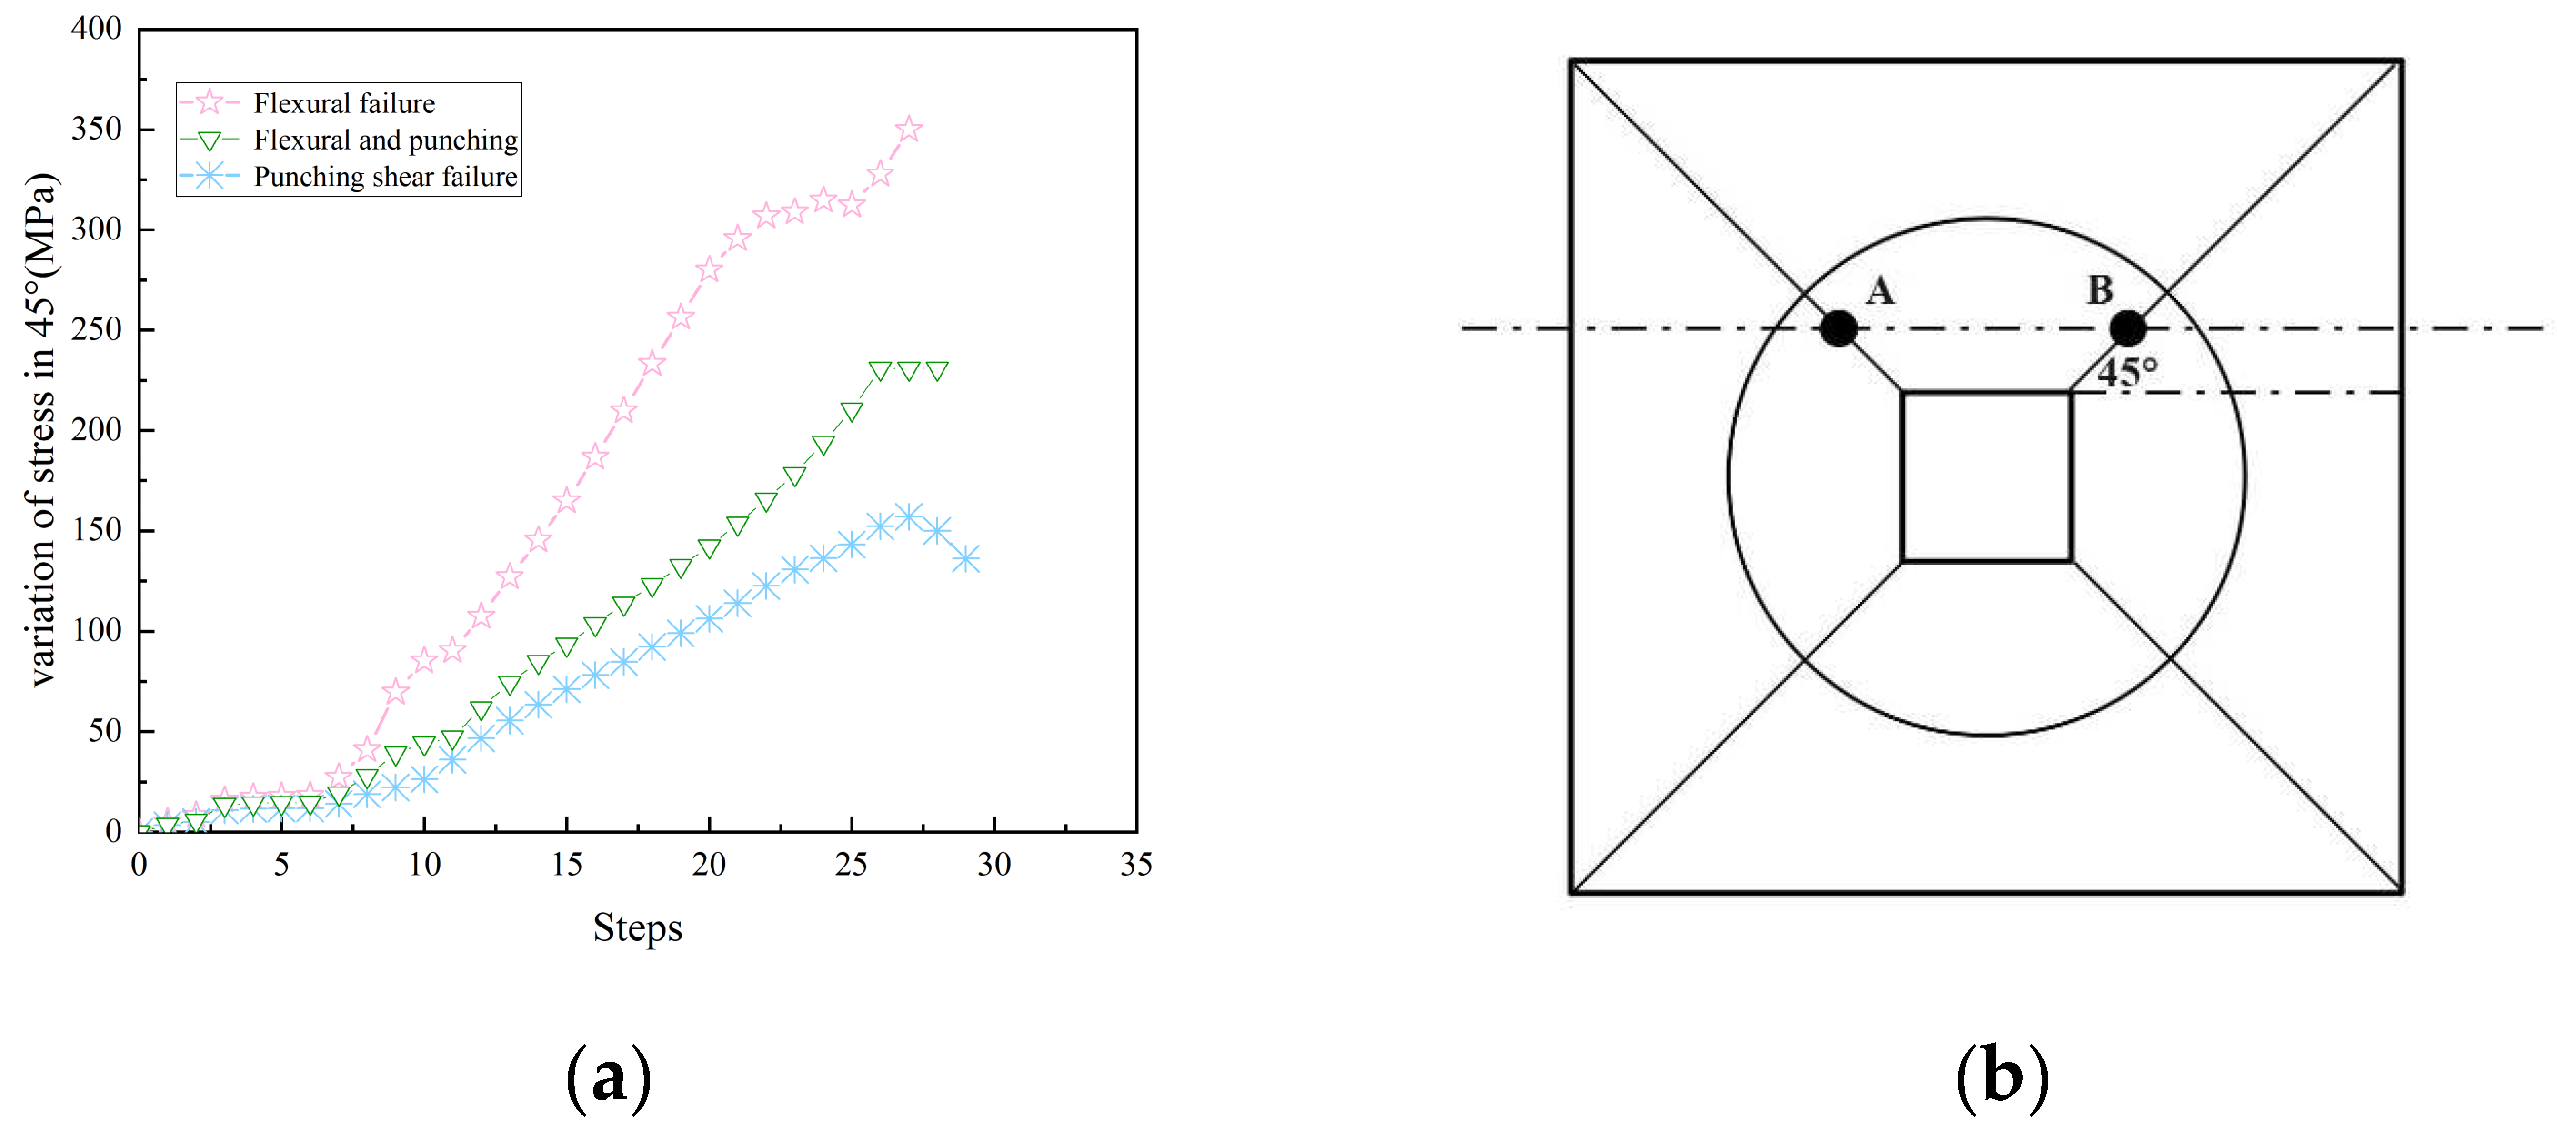
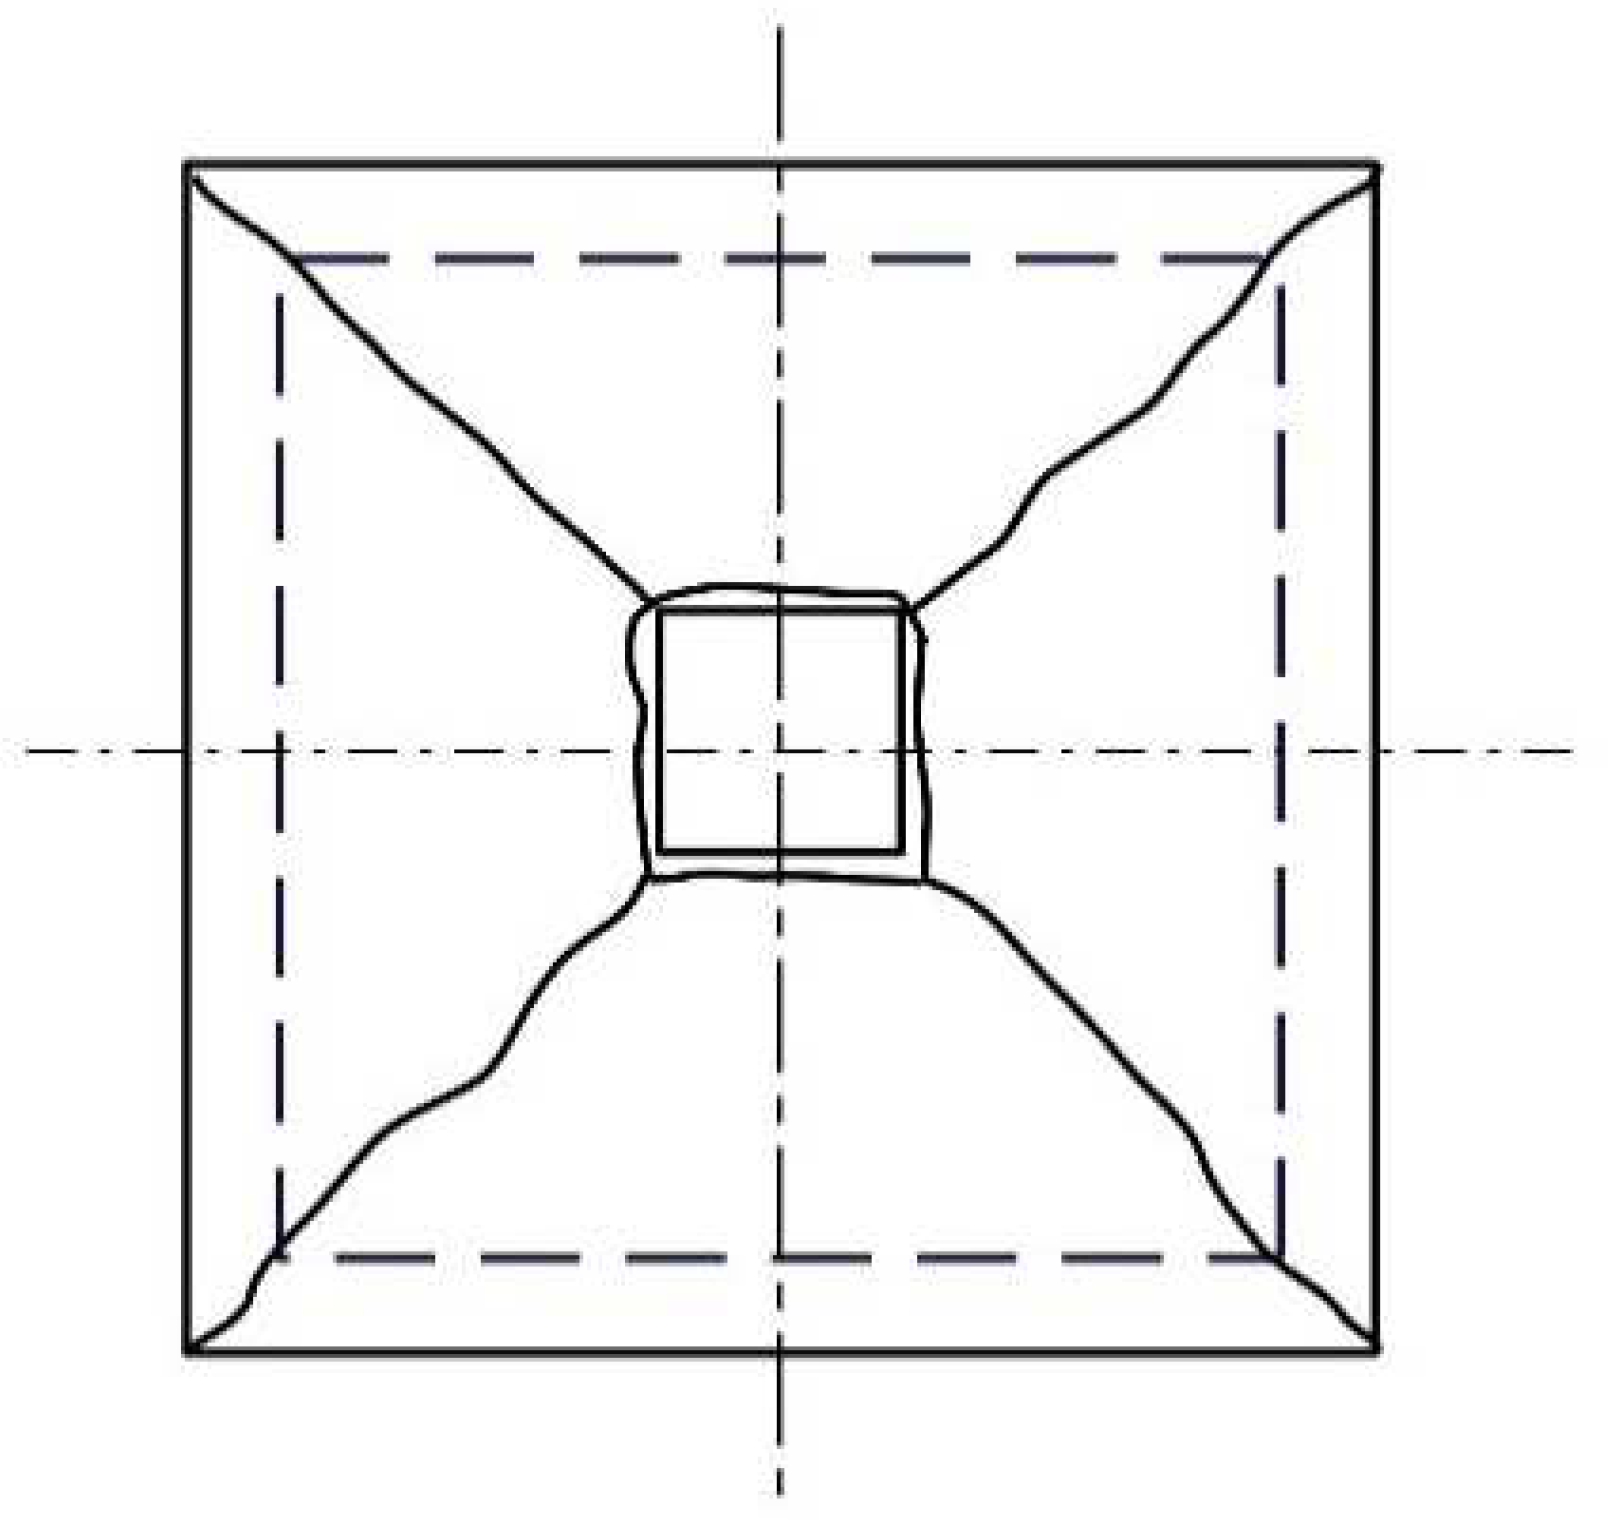
3.2.1. Three Failure Modes

The failure mode of a slab–column connection can be roughly divided into three types: flexural, punching, and flexural–punching failure [32]. During flexural failure, the connection exhibits significant ductility, with substantial flexural deformation in the slab. The longitudinal reinforcement near the column head yields, and overall, the load-carrying capacity of the slab–column connection is relatively low. Flexural failure typically occurs in components with low reinforcement ratios or high punch–span ratios, resulting in a limited number of conspicuous main cracks forming along the perimeter, dividing the specimen into distinct sections. Punching failure is a distinct brittle failure mode where the structural deformation of the slab–column connection is minimal. Radially oriented fine cracks appear on the slab surface, and there is a higher quantity of fine, radial cracks with relatively small variations in crack widths. These cracks propagate from radial cracks to the surrounding areas. Concurrently, diagonal shear cracks originating from the center of the slab extend toward tension and compression zones, forming a ring. This type of failure occurs in specimens with high reinforcement ratios, significant yield strength of the steel reinforcement, and smaller punching spans. Flexural–punching shear failure is an intermediate failure mode that shares similarities with flexural failure. The main difference lies in the fact that, after the yield of the tension reinforcement, the development of diagonal shear cracks results in a reduction in the height of the concrete shear zone, leading to punching shear failure. This forms a conical failure shape with the column head. The entire failure process exhibits a brittle failure pattern. This type of failure typically occurs in components with moderate reinforcement ratios, where the tension reinforcement reaches the yield strength, causing the development of shear cracks and subsequent punching shear failure, forming a conical failure shape.
In this paper, the load–deflection curve of the slab–column connection, the stress curve of the reinforcement near the column head, the stress contour map, the crack pattern map of the profile, and the stress change map of the reinforcement at 45° in the punching cone were plotted using the finite element method to comprehensively identify the three failure modes of the slab–column connection as shown in Table 3.
Table 3. Discriminant table of damage patterns of slab–column connections.
Load–Deflection Curve (Figure 13)Stress Contour Plot (Figure 14)Column Head ReinforcementStress Change in Rebar at 45° (Figure 15)Failure Mode
Formation of a plateau with a significant change in slope and greater ductilityFormation of distinct plastic hinge linesEarly yieldingMultiple rising segments in rebar stressFlexural
Slight change in slope, slightly more ductileNo plastic hinge line formedLate yieldingRebar stresses did not show multiple rising segmentsFlexural–punching
The slope hardly changes and the brittleness phenomenon is obviousNo plastic hinge line formedUnyieldingNo rise in rebar stressPunching
The internal development of the component was studied using the crack distribution maps extracted from the crack.out file obtained from the model calculations as Figure 16. The crack.out file reflects the quantity and development of cracks within each element and block of the slab–column connection under different loadings. A snippet of the crack file data is shown in Figure 16, with nfail representing the crack type: −1000 for uniaxial tensile crack, −2000 for biaxial tensile crack, −3000 for triaxial tensile crack, and 3000 for triaxial compressive crack. Ielem represents the element number, and ibloc represents the block number, where the direction cosines indicate the direction perpendicular to the crack propagation direction.
Different types of cracks are filled with different colors as Figure 17: Pure red represents uniaxial tensile cracks (−1000), blue represents biaxial tensile cracks (−2000), green represents triaxial tensile cracks (−3000), and purple represents triaxial compressive cracks (3000). The crack angles (θ) were approximately calculated based on this coloring scheme.

3.2.2. Influence of Punch–Span Ratio and Longitudinal Reinforcement Eigenvalues on Failure Modes

Based on the failure modes observed during the loading process of the slab–column connections and numerical analysis, their failure modes were determined. Considering the identified influencing factors on the failure modes of the slab–column connections, which are primarily the punch–span ratio and longitudinal reinforcement eigenvalues, a discriminant diagram for the failure modes of the slab–column connections was plotted with the punch–span ratio and longitudinal reinforcement eigenvalues as parameters.
λ 3 , 0.134 < ρ f y / f c 0.436 , punching ; 3 < λ 7 , ρ f y / f c 0.134 , flexural - punching , 0.134 < ρ f y / f c 0.436 , punching 7 < λ 9 , ρ f y / f c 0.270 , flexural - punching , 0.270 < ρ f y / f c 0.4366 , punching 9 < λ 11 , ρ f y / f c 0.217 , flexural ; 0.217 < ρ f y / f c 0.322 , flexural - punching , 0.322 < ρ f y / f c 0.436 , punching 11 < λ 13 , ρ f y / f c < 0.322 , flexural ; 0.322 ρ f y / f c , flexural - punching , 13 < λ , 0.134 ρ f y / f c 0.436 , flexural ;
For all simulation experiment models of the slab–column connections, the longitudinal eigenvalues of reinforcement ρƒyc were within the range of 0.134 to 0.436, and the punch–span ratios λ were from 3 to 15. When λ < 3 and 0.134 ≤ ρƒyc ≤ 0.436, all of the slab–column connections exhibited pure punching failure. For 3 < λ ≤ 7, if ρƒyc ≤ 0.134, the failure mode was flexural–punching, and when 0.134 < ρƒyc ≤ 0.436, the failure mode was punching failure. When 7 < λ ≤ 9, if ρƒyc ≤ 0.270, the failure mode was flexural–punching, and when 0.270 < ρƒyc ≤ 0.436, the failure mode was punching failure; when 9 < λ ≤ 11, if ρƒyc ≤ 0.217, the failure mode was flexural failure; for 0.217 ≤ ρƒyc ≤ 0.322, the slab–column connections exhibited flexural–punching failure; and for 0.322 < ρƒyc ≤ 0.436, the failure mode was punching failure. When 11 < λ ≤ 13 and ρƒyc < 0.322, the failure mode was flexural failure. When 0.322 ≤ ρƒyc, the slab–column connections exhibited flexural–punching failure. When 13 < λ and 0.134 ≤ ρƒyc ≤ 0.436, the slab–column connections exhibited pure flexural failure. As shown Figure 18.
The failure mode discriminant diagram illustrates that as the punch–span ratio increases, and the longitudinal reinforcement eigenvalues decrease, the failure mode of slab–column connections gradually transitions from brittle failure to ductile failure. Within a specific punch–span ratio range, if the ratio is either small or large, the failure mode remains unchanged with variations in the longitudinal reinforcement eigenvalues. However, within a moderately sized punch–span ratio range, the following characteristics are observed: a smaller longitudinal reinforcement eigenvalue makes the slab–column connection more prone to ductile failure, predominantly exhibiting flexural–punching or flexural failure; conversely, a larger longitudinal reinforcement eigenvalue makes the connection more susceptible to brittle failure, primarily manifesting as punching shear failure.

3.3. Analysis of Ultimate Bearing Capacity

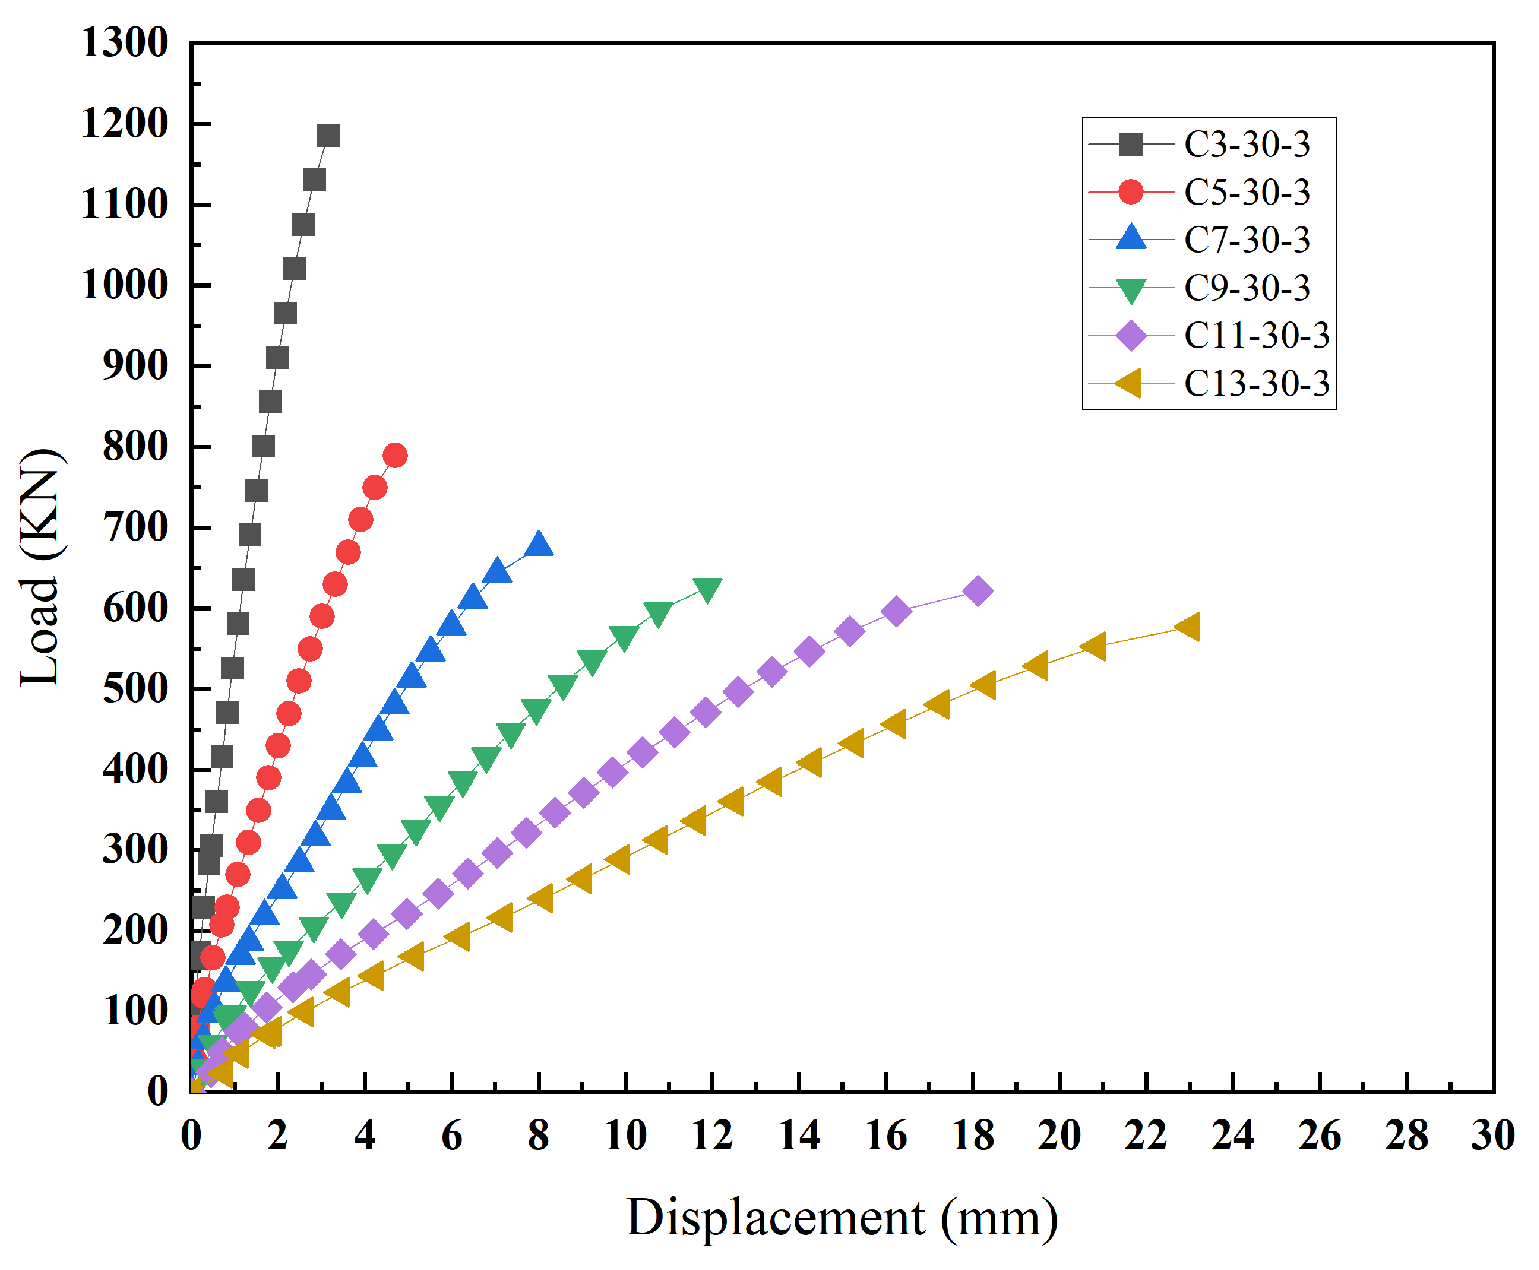
3.3.1. Effect of Punch–Span Ratio

Observing the numerical simulation of slab–column components with different punch–span ratios as Figure 19, constant concrete strength, and longitudinal reinforcement ratio, the model’s ultimate load decreases and the ultimate displacement increases with the increase in the punch–span ratio. The slab–column connection transitions from brittle failure to ductile failure as the punch–span ratio increases. In a punch–span ratio range of less than 7, the load reduction between the different punch–span ratios is approximately 110 KN. However, in a punch–span ratio range greater than 7, the load reduction between the different punch–span ratios is approximately 50 KN. This indicates that the influence of the punch–span ratio on the load-bearing capacity varies with different punch–span ratio ranges, with a greater impact when the punch–span ratio is less than 7.

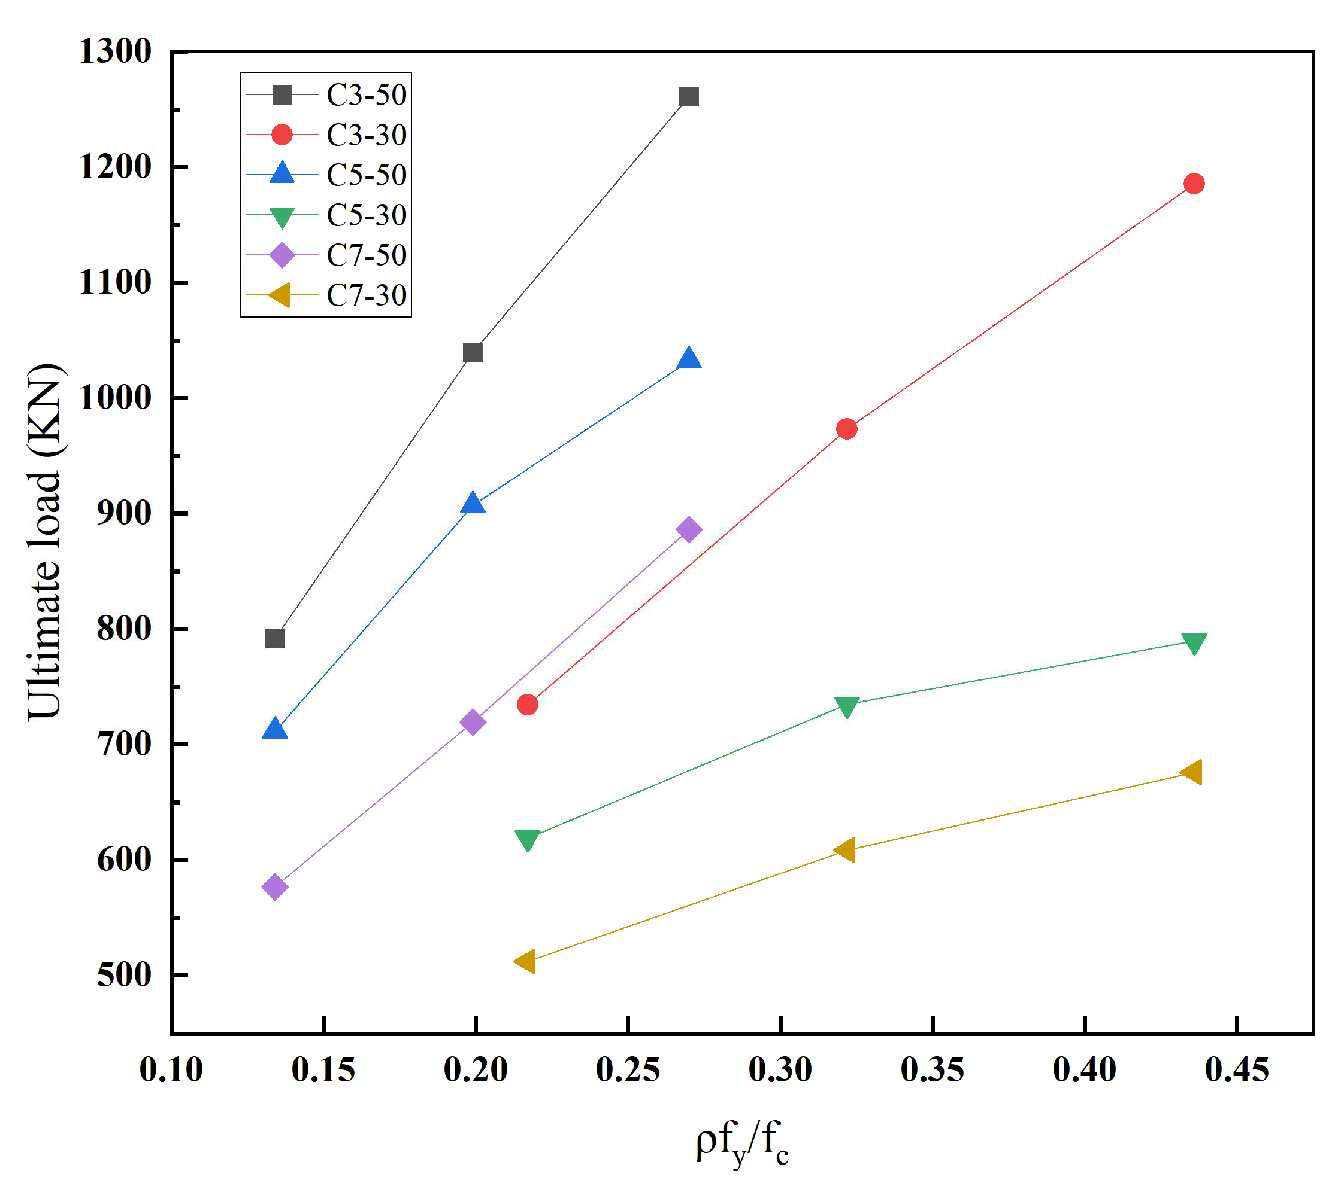
3.3.2. Effect of Longitudinal Reinforcement of Eigenvalues

The longitudinal reinforcement eigenvalue, which encompasses the yield strength of longitudinal reinforcement, reinforcement ratio, and concrete strength, is a comprehensive factor influencing the punching shear capacity of slab–column connections. The relationship between the longitudinal reinforcement eigenvalue and the ultimate load forms a curve as Figure 20, indicating that, under the same punch–span ratio, an increase in the longitudinal reinforcement eigenvalue due to an increase in the reinforcement ratio leads to an increase in the punching shear capacity of the slab–column connection. Concrete strength also affects the ultimate punching shear capacity of the slab–column connection, with a decrease in concrete strength resulting in a decrease in punching shear capacity. However, the impact of the reinforcement ratio on punching shear capacity is greater than the impact of concrete strength.

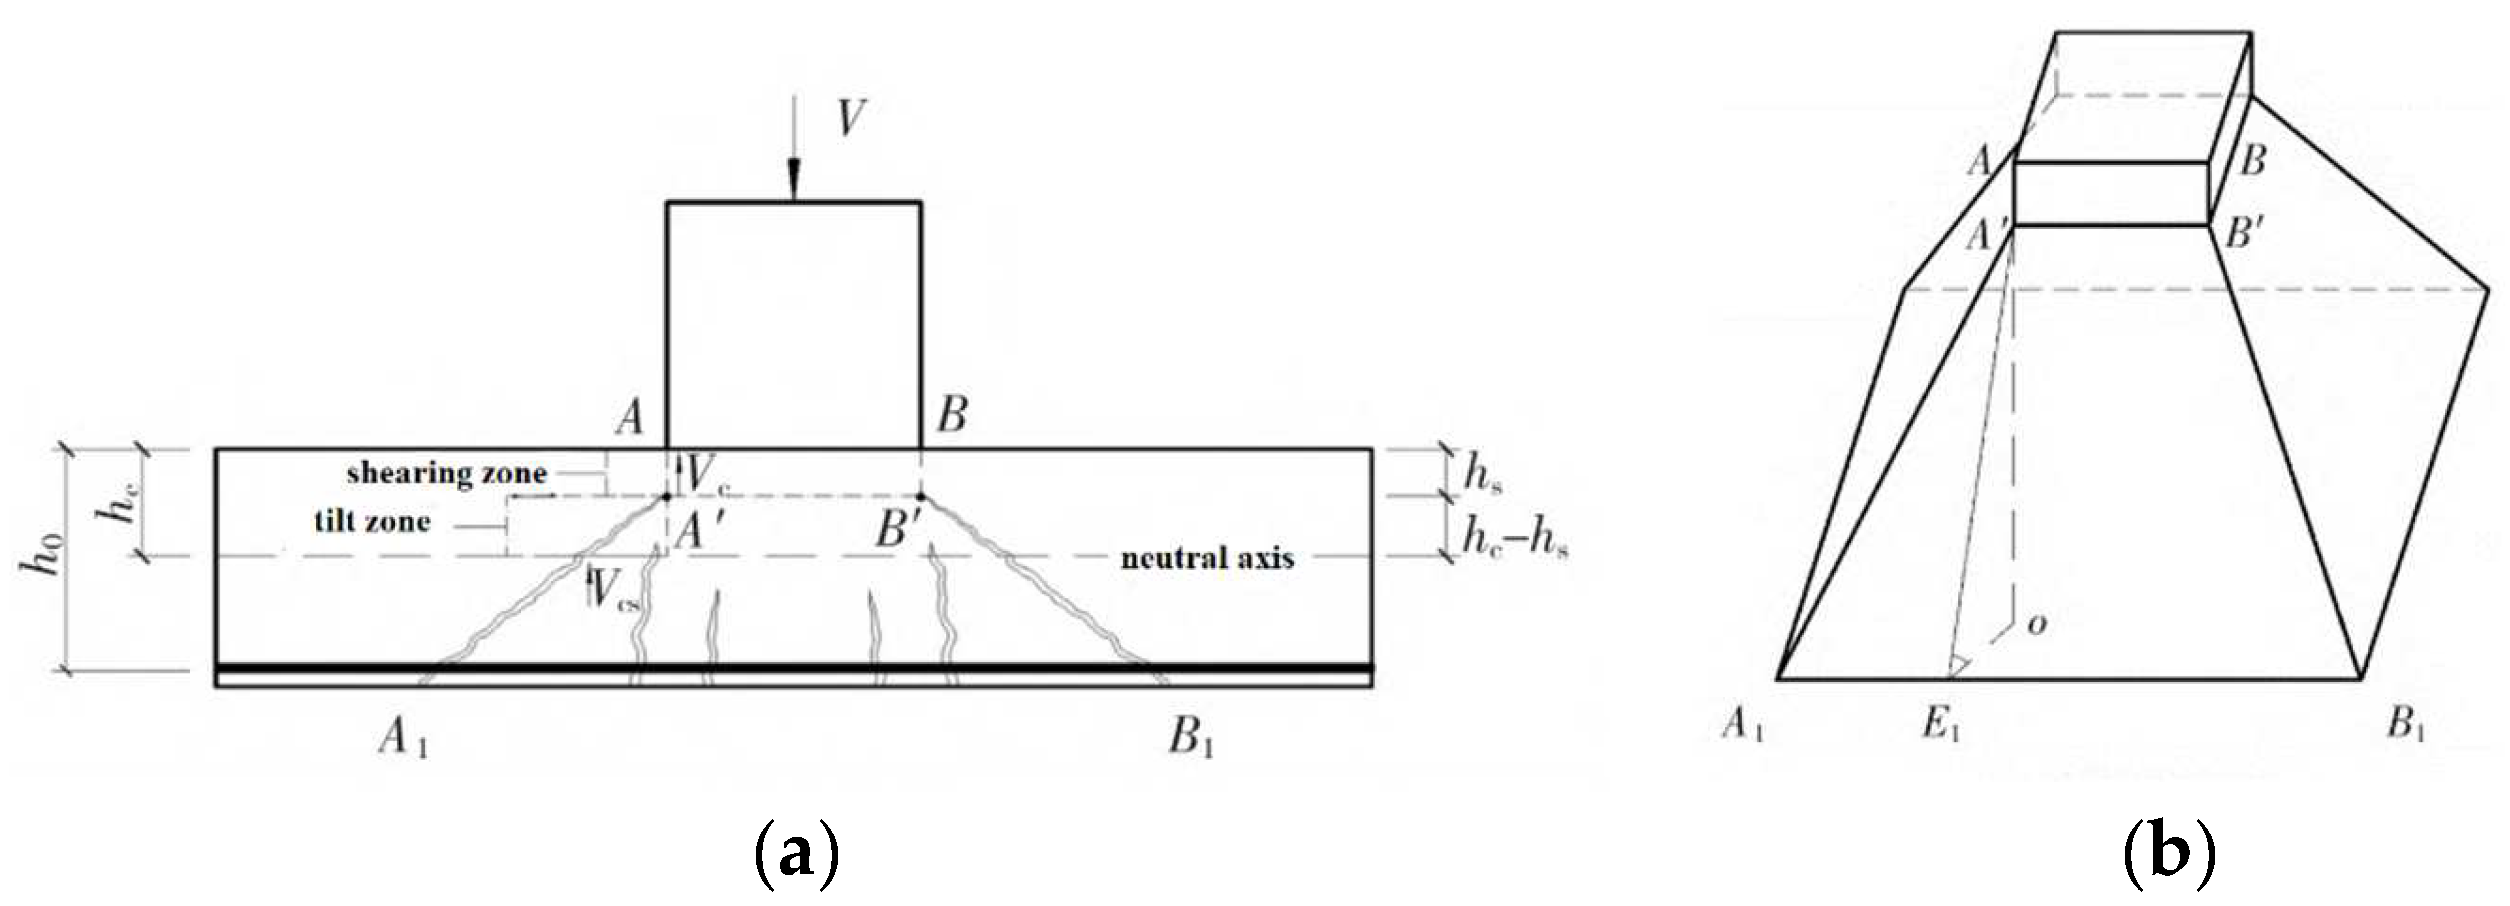
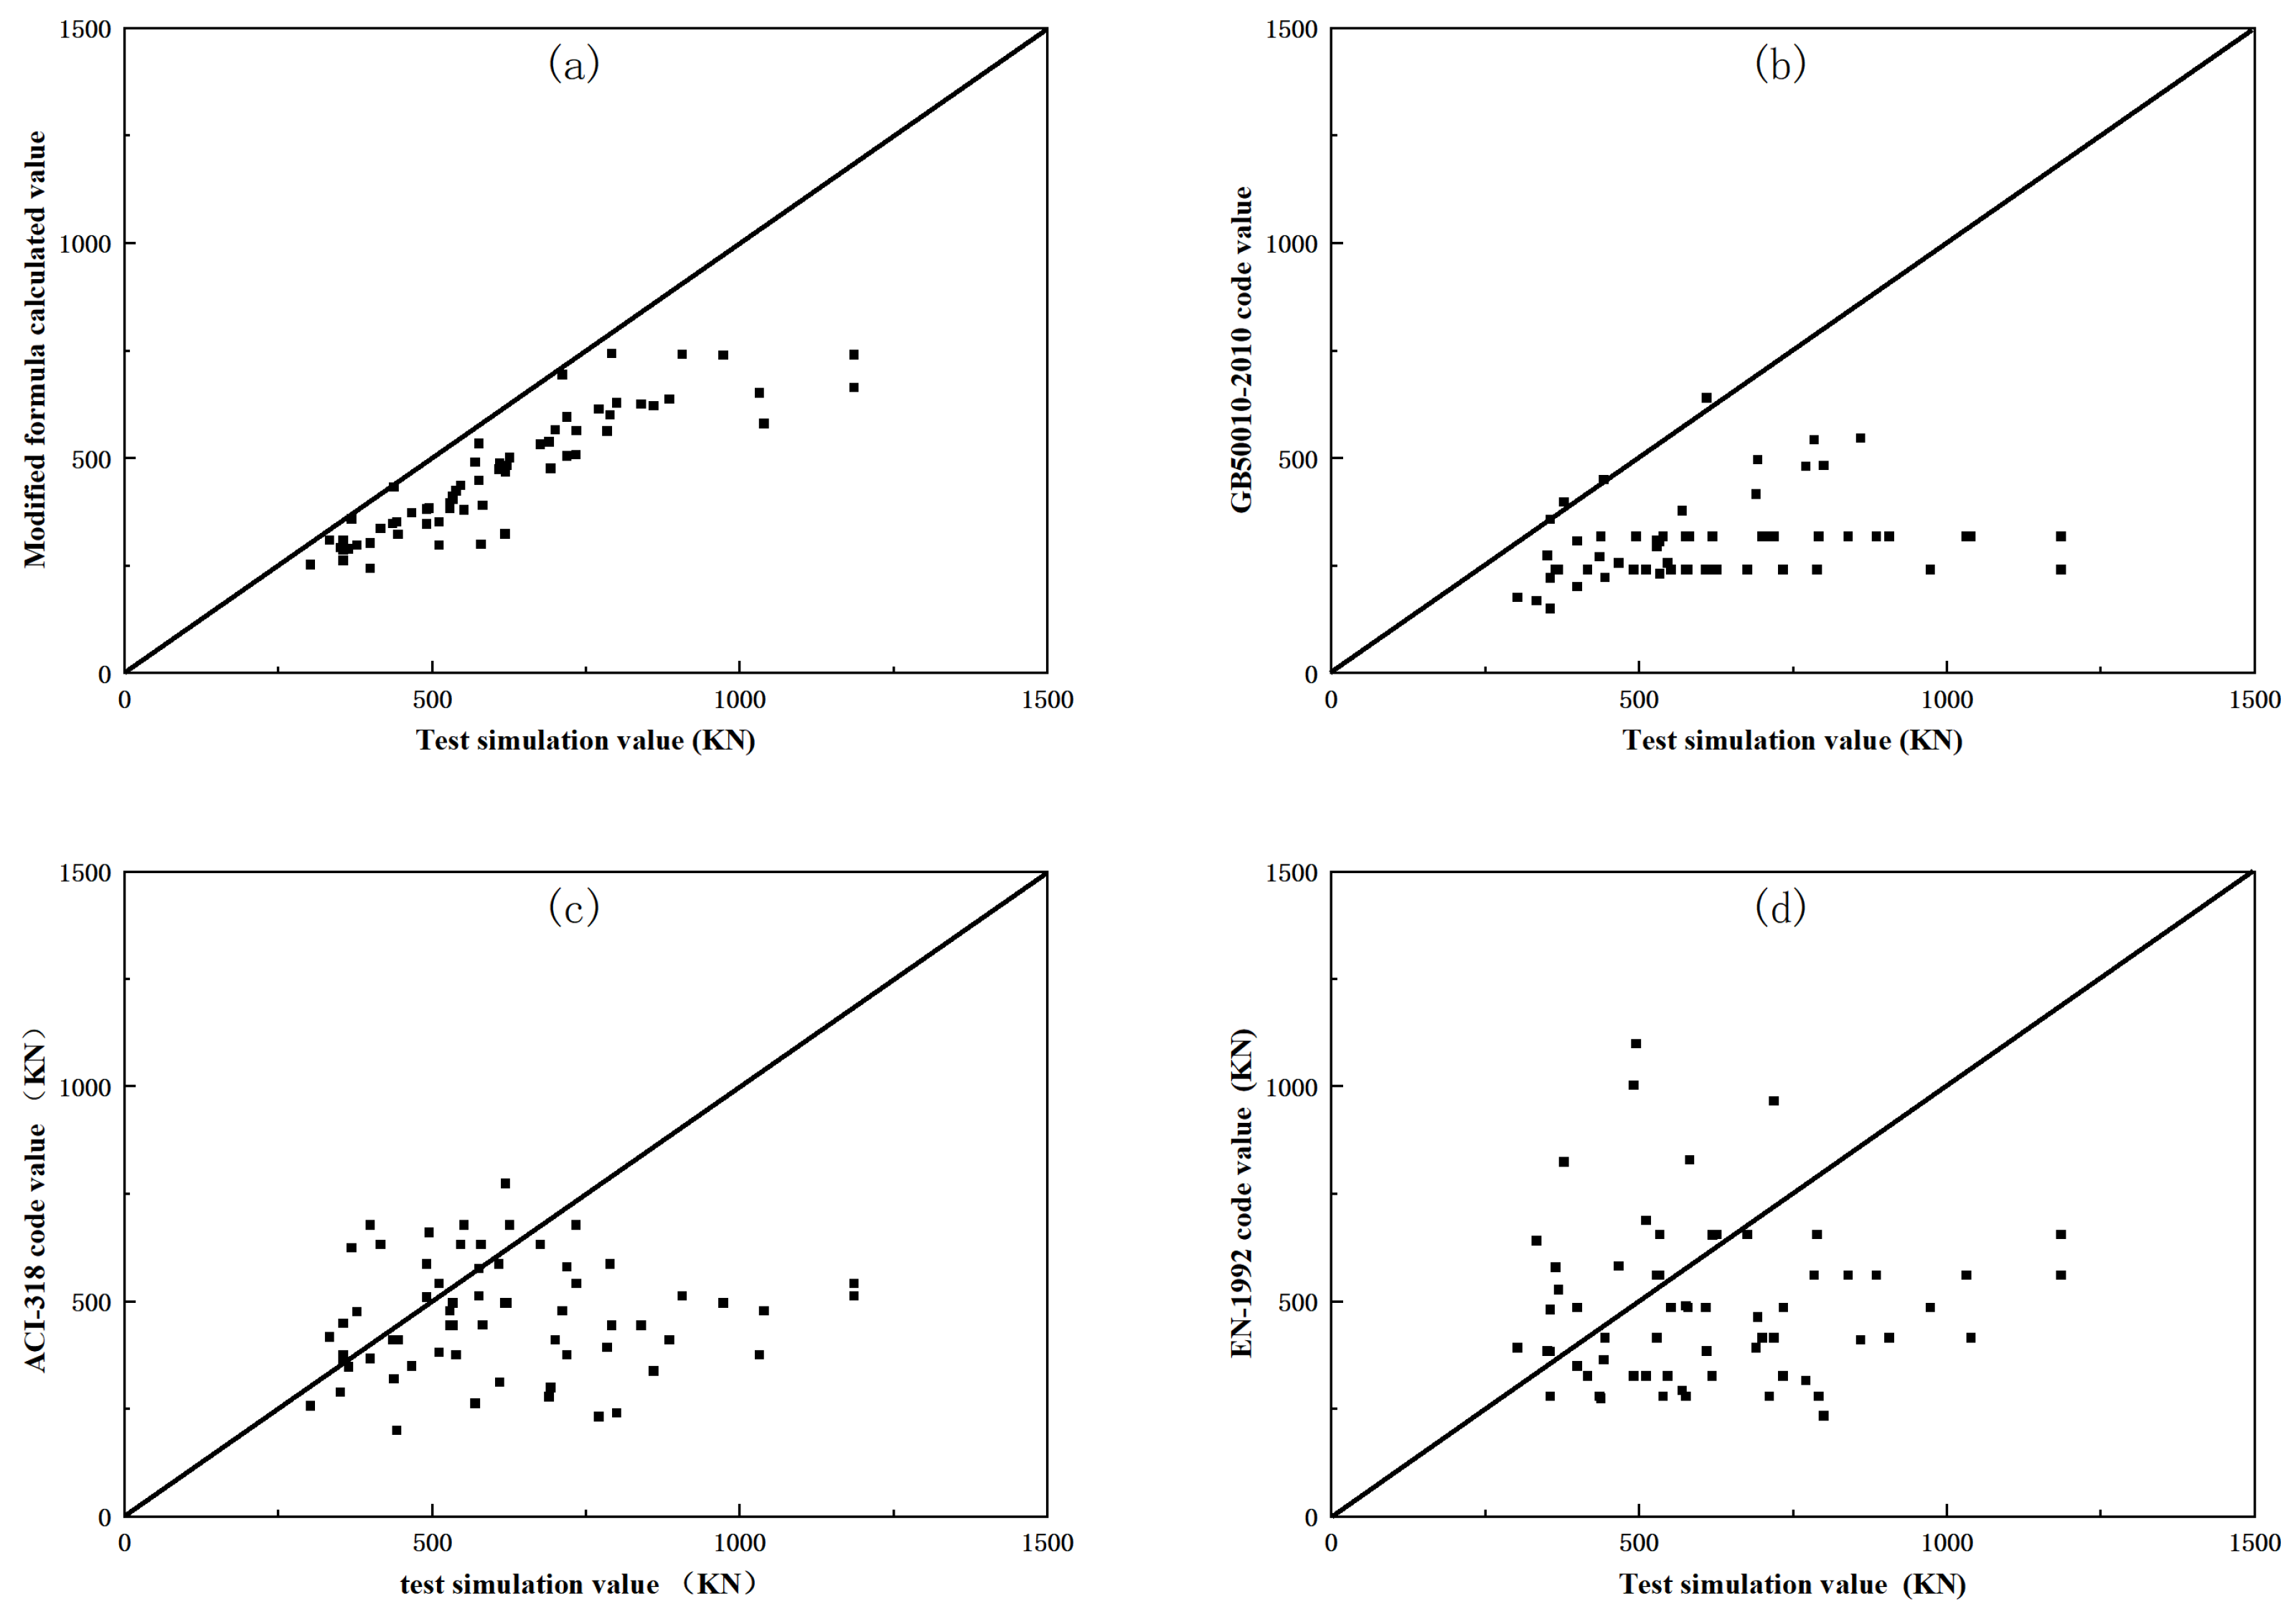
4. Calculation Formula for Ultimate Load Capacity

4.1. Model of Anti-Shear and Formulation of Bearing Capacity

The load-carrying capacity calculation formula for the slab–column connection should be differentiated based on the different failure modes. For flexural failure, it can be calculated using the plastic hinge line theory. For punching shear and flexural–punching failure, which is similar to shear failure in beams, the ultimate load-carrying capacity can be considered as the combined contribution of the uncracked concrete in the shear compression zone, the aggregate interlock force in the critical inclined crack zone, and the dowel action of the reinforcement. The shear capacity Vc provided by the concrete in the shear–compression zone and the shear capacity Vcs provided by the concrete in the critical diagonal crack zone are superimposed to form a failure model, as shown in Figure 21.
In the calculation of punching and flexural–punching capacity, the anchorage effect of the reinforcement is typically neglected. This is due to the sudden occurrence of shear–punching failure, where the reinforcement may not have time to engage before failure. Additionally, neglecting the anchorage effect simplifies the calculations and enhances the safety margins. The flexural capacity is mainly supported by the bending resistance of the reinforcement, and the concrete’s shear effect in flexural failure is not significant. In order to unify the three failure modes, the ultimate capacity formula for the slab–column connection can be expressed as V u = V c + V c s + P , where V c represents the shear capacity provided by the concrete in the shear pressure zone, and V cs represents the shear capacity provided by the concrete in the critical diagonal crack zone. P represents the ultimate capacity of the slab–column connection when a flexural failure occurs. h c represents the height of the compression zone, h s represents the height of the shear zone, and θ represents the inclination of the critical diagonal crack.
The shear capacity V c provided by the concrete in the shear compression zone can be referenced from the shear calculation method for beams, as described in the literature [15]:
V c = 0.5 c f c h c h s h c 2
The relative shear zone height is determined using the following equation:
h s h 0 = 1 + 0.27 cot 2 θ 1 + cot 2 θ h c h 0
( h c h 0 ) 2 + 600 ρ f c h c h 0 600 ρ f c = 0
The aggregate interlock force in the critical inclined crack zone can be derived based on the modified compression field theory (MCFT) proposed by Vecchio and Collins [16].
The aggregate interlock force in the critical inclined crack zone can be obtained from V c s :
V c s = τ c i S = 1 2 × 0.18 f c 0.31 + 24 ω / ( a g + 16 ) 2 c + 2 ( h h s ) cot θ ( h h s )
where S represents the shear stress projection area in the critical inclined crack.
Therefore, the anti-punching shear capacity of the slab–column node (sum of the four shear planes) is given with the following formula:
V u = 2 f c c h s ( h s h c ) 2 + 0.36 f c 0.31 + 24 ω / ( a g + 16 ) 2 c + 2 ( h h s ) cot θ ( h h s )
The formula for the load-carrying capacity of the slab–column connection is closely related to the failure angle θ . Based on the experimental data in this paper, a linear regression was performed using SPSS(SPSS.26), with ρ f y / f c , and λ as the parameters for the failure angle θ .
Based on the regression analysis as Figure 22 and Figure 23, it is observed that R = 0.913, R2 = 0.833, and the adjusted R2 = 0.823. The Durbin–Watson coefficient is 1.343, and the standard estimated error is 10.18533, indicating a good fit of the model. The sum of squares for regression is 17,626.566, the residual sum of squares is 3527.195, and the total sum of squares is 21,153.761. The F-value for the regression equation is 84.955, with a significance coefficient of 0.000. The coefficient table shows that the most significant coefficient in the regression equation is 0.008, which is less than 0.05. The VIF is less than 5, indicating that there is no multicollinearity between the variables. Overall, the independent variables have a significant impact on the dependent variable, suggesting a strong linear relationship. Thus, the correlation expression between the inclination angle θ of the slab–column connection and the punch–span ratio λ and reinforcement eigenvalue ρ f y / f c is obtained:
θ = 48.183 ρ f y / f c + 1.080 λ
Bring θ into V u :
V u = 2 f c c h s ( h s h c ) 2 + 0.36 f c 0.31 + 24 ω / ( a g + 16 ) 2 c + 2 ( h h s ) cot ( 48.183 ρ f y / f c + 1.080 λ ) ( h h s )

4.2. Flexural (Punching) Models and Their Load-Bearing Capacity Expressions

The ultimate bearing capacity of the slab–column connection under flexural failure can be calculated using the plastic hinge line theory formula [32].
P = 8 ρ f y h 0 2 ( 1 0.5 ρ f y / f c m ) c L 0 c + 2 ( 2 1 ) L c L 0 c

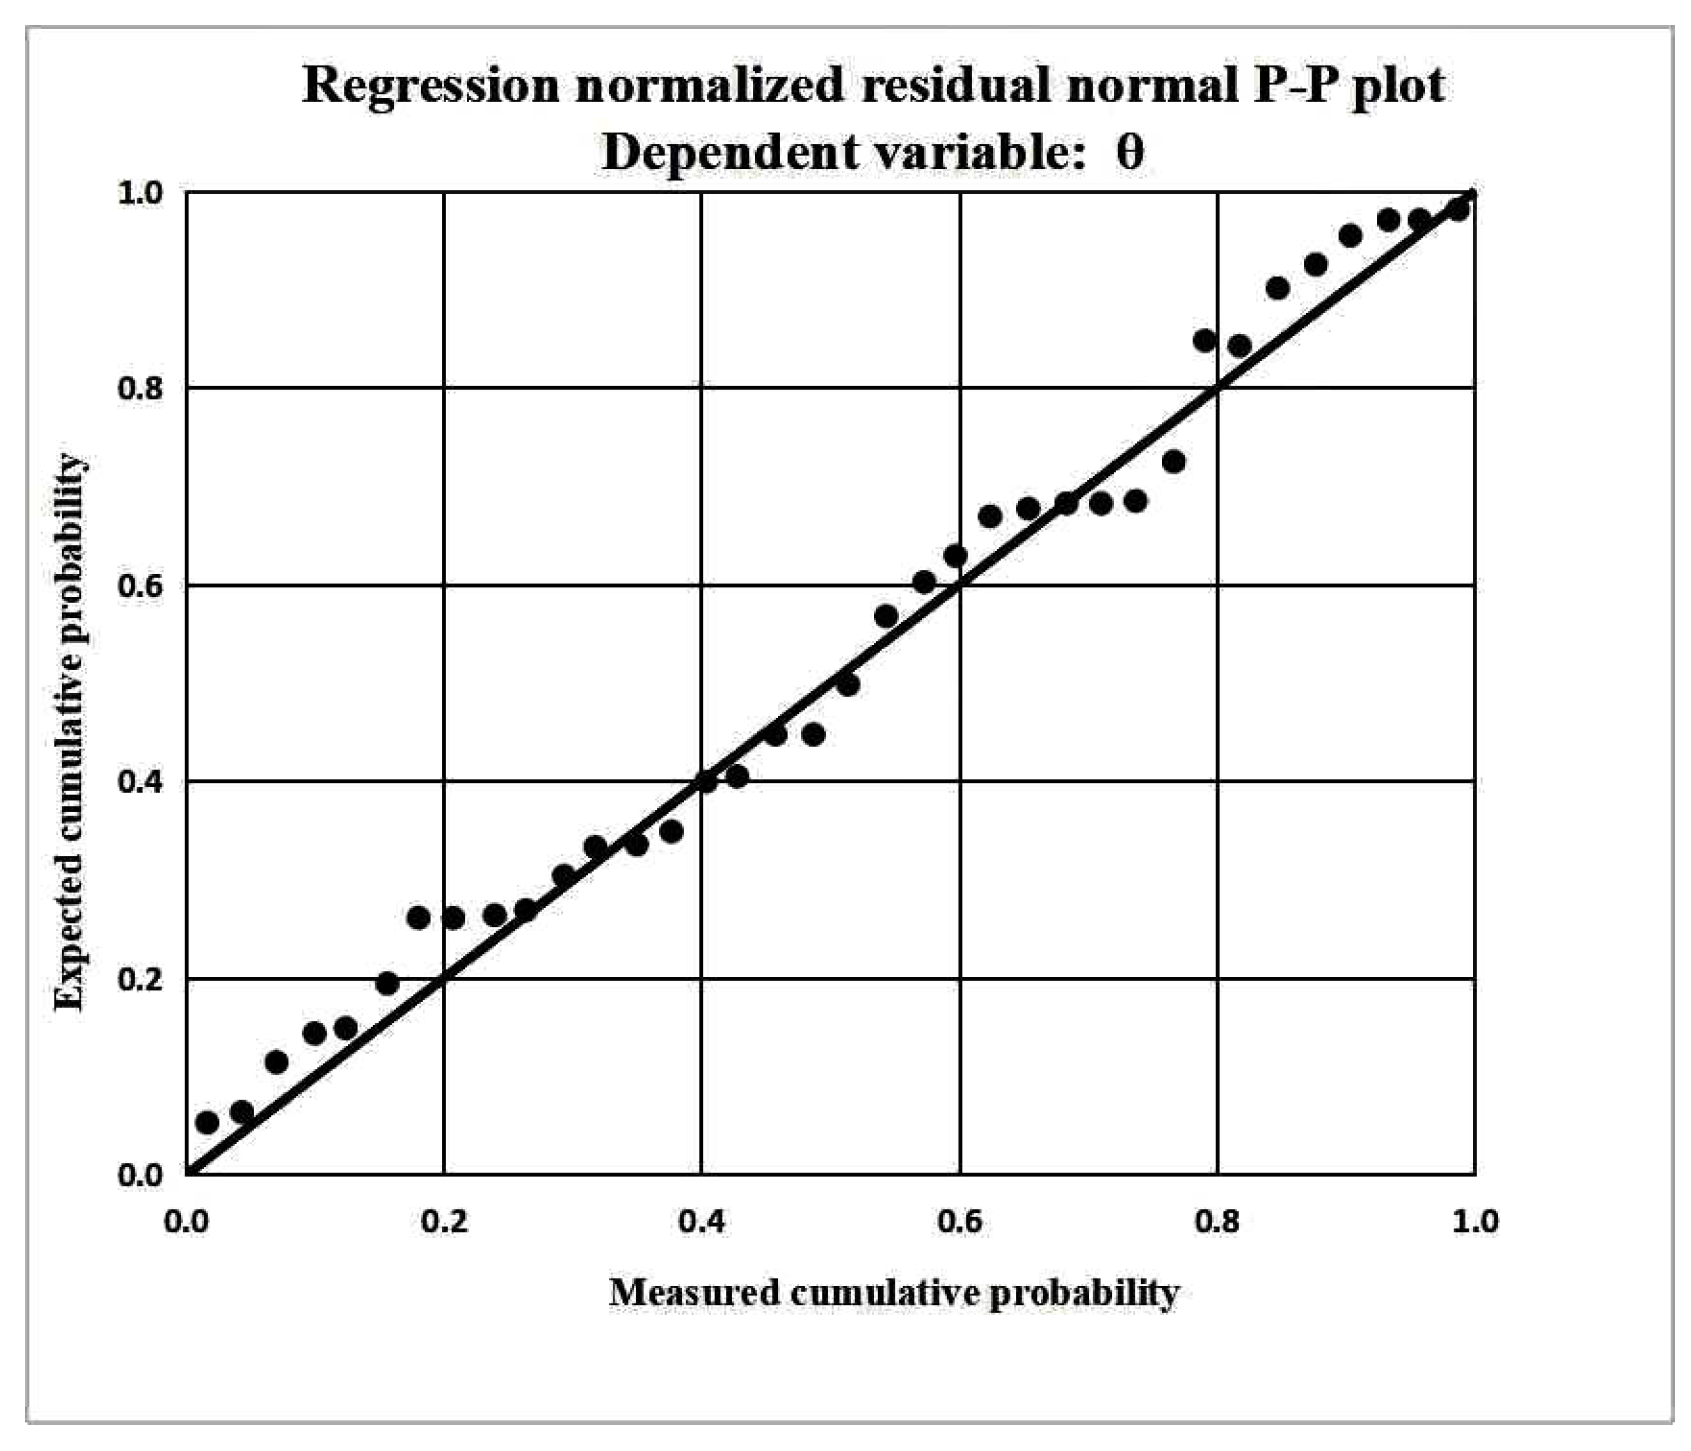
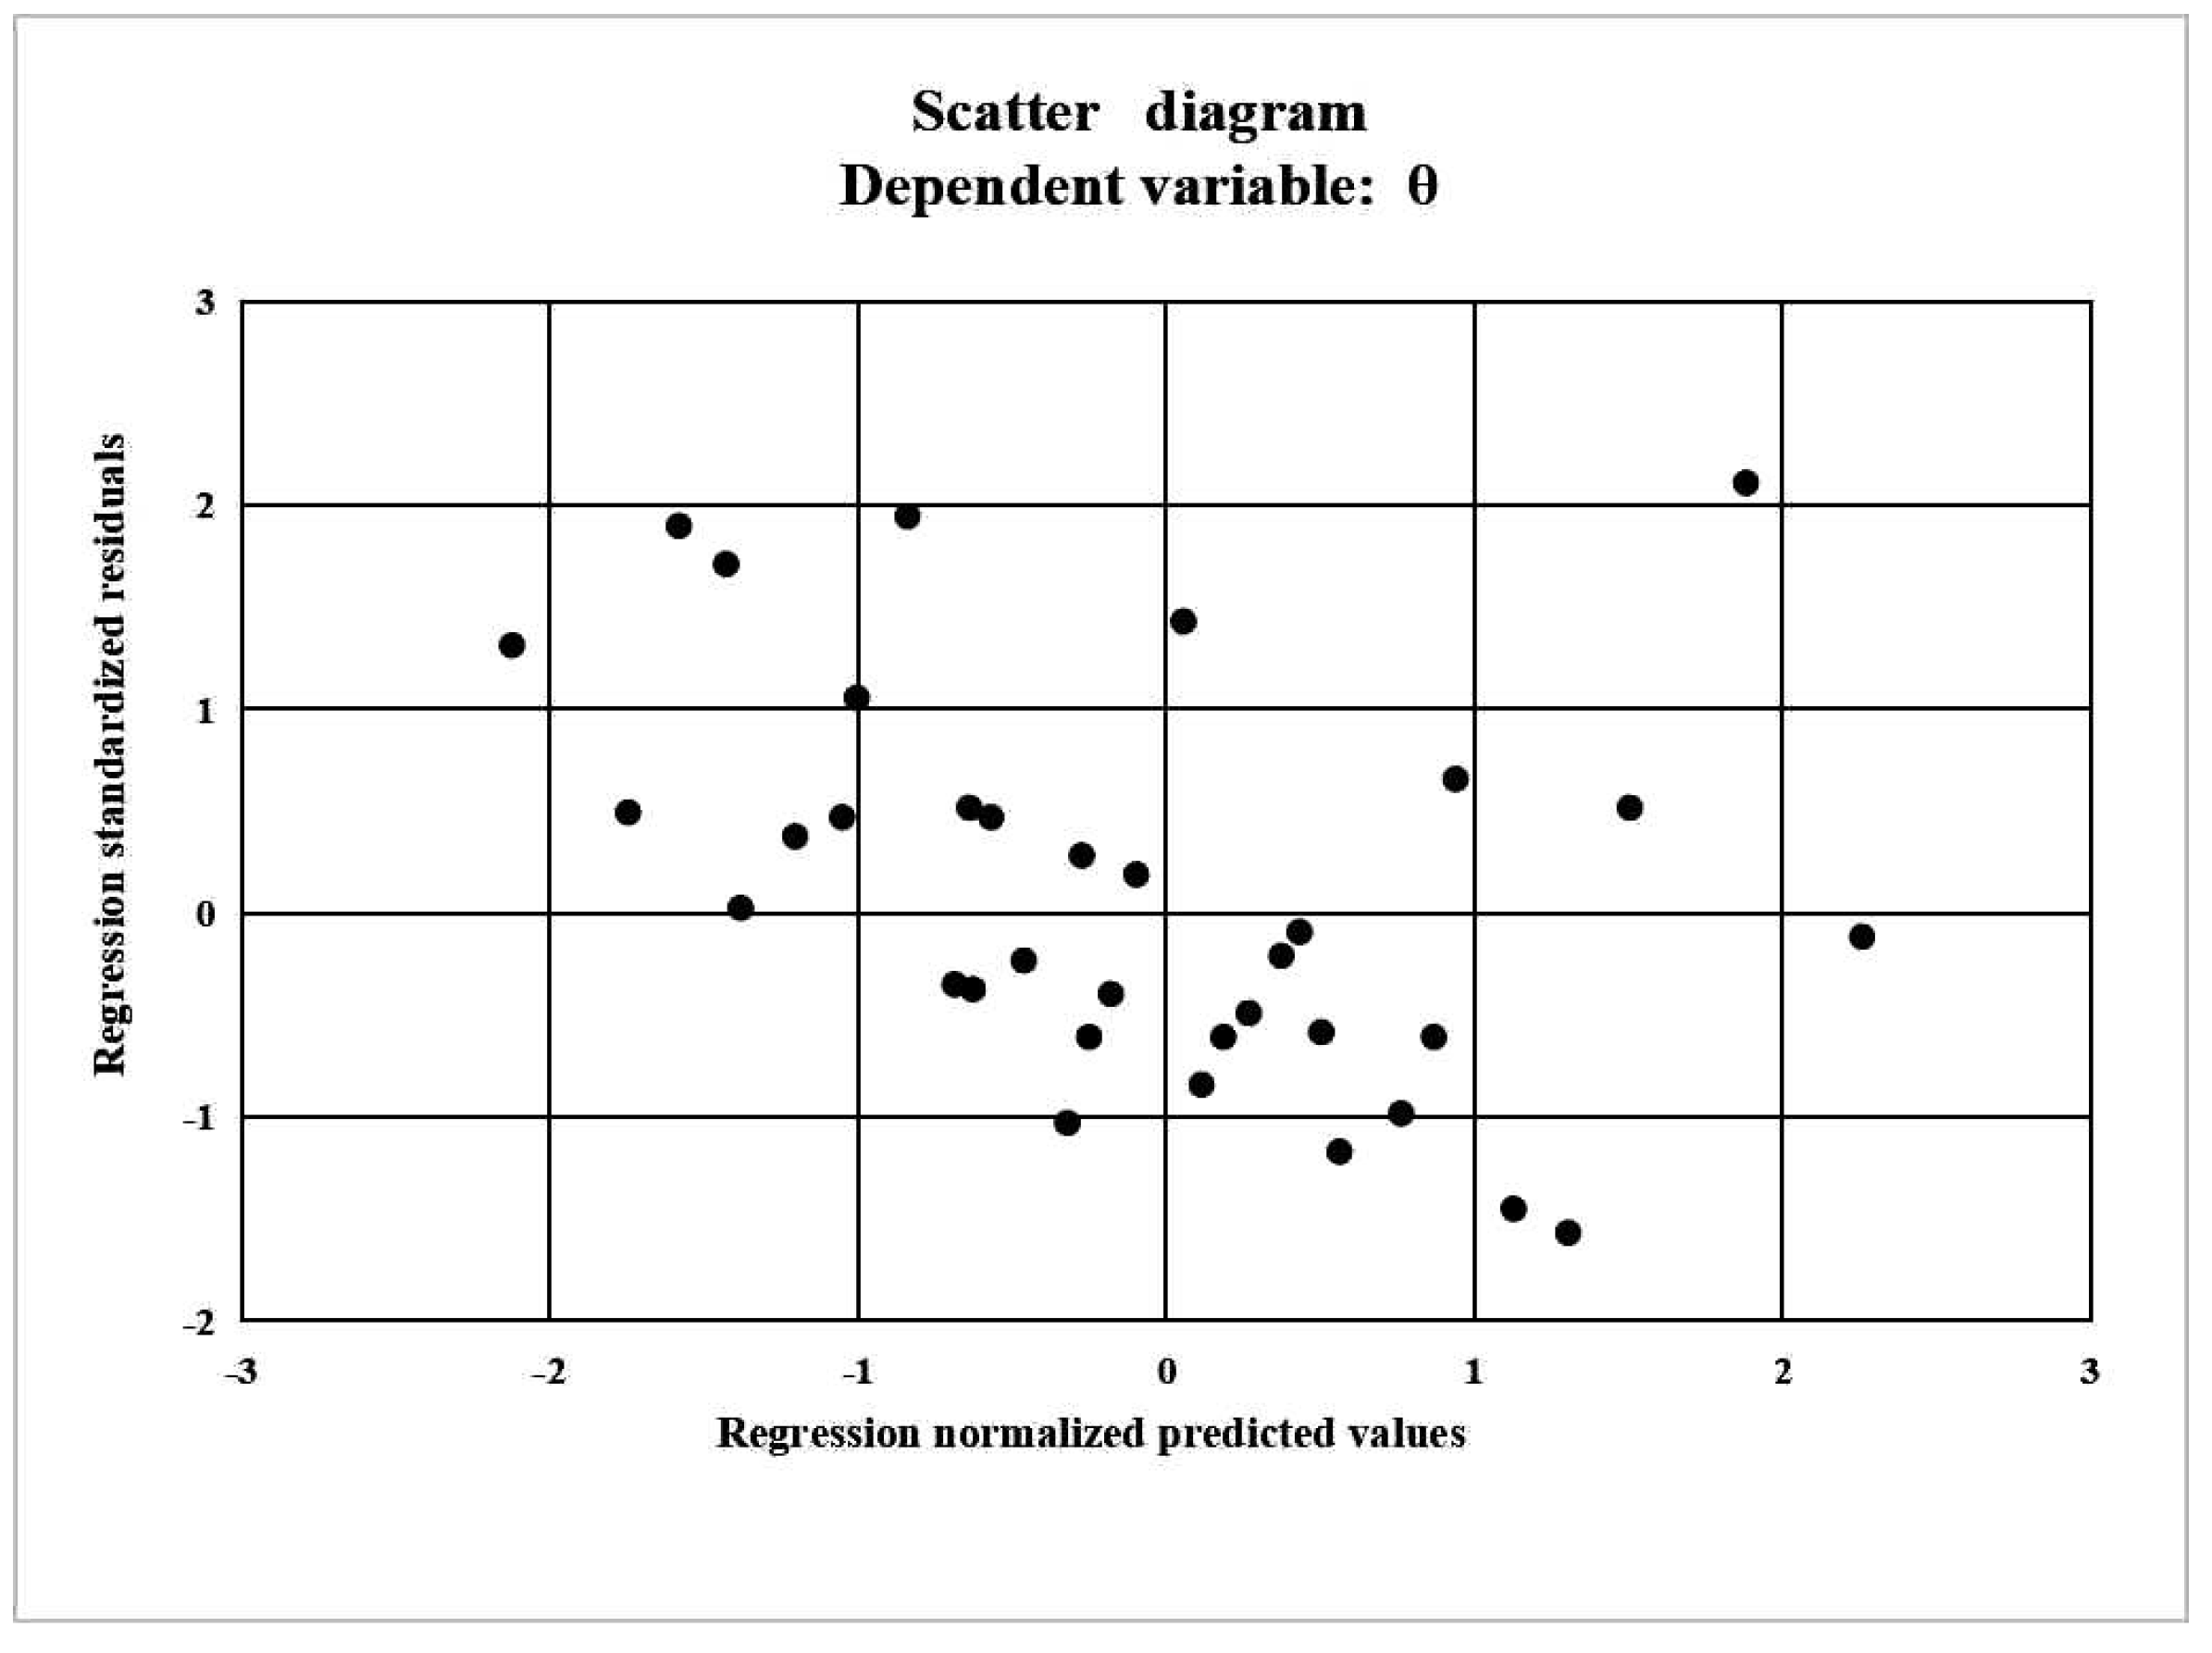
4.3. Fitting and Analysis of the Formulas for Calculating Punching and Flexural Failure Capacity

The suggested calculation formulas for the three failure modes of the slab–column connection can be expressed in segments: when ψ = 0 , it is punching or flexural–punching failure; when ψ = 1 , it is flexural failure as shown in Figure 24.
V u = ψ 2 f c c h s ( h s h c ) 2 + 0.36 f c 0.31 + 24 ω / ( a g + 16 ) 2 c + 2 ( h h s ) cot 48.183 ρ f y / f c + 1.080 λ ( h h s ) + ( 1 ψ ) 8 ρ L f y h 0 2 ( 1 0.5 ρ f y / f c m ) c L 0 c + 2 ( 2 1 ) L c L 0 c
Of which
ψ = 0 , 9 < λ 11 ,   ρ f y / f c 0.217 0 , 13 < λ ,   0.134 ρ f y / f c 0.436 1 , others
The suggested formulas were refined based on the numerical simulations of the components and 27 sets of data from the slab–column connections without anti-punching reinforcement, extracted from the relevant literature, including the studies of Elstner et al. [33] and Weijian Yi et al. [34] As shown in Table 4. The K-S test was conducted to validate these formulas, assuming that the anti-punching shear capacity V follows a normal distribution. A model V = σ V was employed to determine the deterministic results of the slab–column connections’ anti-punching shear capacity. V represents the stochastic variable to account for cognitive uncertainties.
The statistical histogram of the random variable σ is obtained as Figure 25, which intuitively shows that it approximately obeys a normal distribution. Through the statistical analysis, the sample size is n = 63; the maximum value of observation is D 63 = 0.1649 < D 63 0.05 = 0.171 ; the mean value of the random variable σ is obtained as 1.444; and the standard deviation is 0.1649.
The following value is obtained:
V = V ( 1.44 0.1649 × 3.27 ) = 0.9 V
and therefore,
V u = 0.9 ψ 2 f c c h s ( h s h c ) 2 + 0.36 f c 0.31 + 24 ω / ( a g + 16 ) 2 c + 2 ( h h s ) cot 48.183 ρ f y / f c + 1.080 λ ( h h s ) + 0.9 ( 1 ψ ) 8 ρ L f y h 0 2 ( 1 0.5 ρ f y / f c m ) c L 0 c + 2 ( 2 1 ) L c L 0 c
of which,
ψ = 0 , 9 < λ 11 ,   ρ f y / f c 0.217 0 , 13 < λ ,   0.134 ρ f y / f c 0.436 1 , others
The fitting of the modified formula values to the experimental values shows that the calculated values from the modified formula are consistently lower than the experimental values, indicating high safety and low variability. As shown in Figure 26. A comparison with the predictions from the Chinese standard GB50010-2010 [31], the American standard ACI318-19 [35], and the European standard EN 1992-1-1:2004 [36] reveals that the GB50010-2010 standard generally underestimates the capacity of the slab–column connections in flexural failure mode, and it may not encompass certain scenarios. Additionally, it is not suitable for calculating the capacity of slab–column connections under varying punch–span ratios. The predictions from the ACI318-19 and EN 1992-1-1:2004 standards show high variability and are less applicable to various influencing factors. In contrast, most data points from the proposed formula are located near the y = x line, with calculated values consistently lower than the experimental values, indicating high safety and strong applicability. The coefficient of variation for the modified formula is 0.130, which is lower than values from other standards as Table 5, demonstrating that the formula developed in this study can effectively predict the punching shear capacity of slab–column connections and is superior to the calculation formulas in GB 50010-2010, as well as ACI 318-19 and EN 1992-1-1:2004.

5. Conclusions

1. The three-dimensional entity degeneration virtual laminated nonlinear finite element program VFEAP can accurately realize the simulation of the punching and flexural performance of slab–column connections. The test data are in good agreement with the simulated data, which indicates that the program is suitable for simulating the load-bearing performance of slab–column connections.
2. The punch–span ratio and the longitudinal reinforcement eigenvalues have a significant influence on the failure mode of slab–column connections. When ρƒyc ≤ 0.436, λ ≤ 3, all of the slab–column connections show punching failure; when λ ≥ 13, all show flexural failure; when 3 ≤ λ ≤ 13, the three types of failure modes may all occur. However, as the punch–span ratio increases, it becomes more prone to flexural failure with a lower reinforcement ratio. Conversely, as the punch–span ratio decreases, it is more susceptible to punching failure, with a higher reinforcement ratio. Intermediate conditions may also lead to a flexural and punching failure.
3. The capacity calculation formula for slab–column connections should be differentiated based on different failure modes. A model for the punching shear capacity of slab–column connections was proposed, considering the shear force, the critical diagonal crack aggregate interlocking force, and the flexural resistance of the reinforcement. A segmented functional capacity calculation formula was established to encompass the three different failure modes. Based on the simulated analysis data from the model, numerical fitting was performed using SPSS software to derive a formula for the failure surface inclination angle related to the punch–span ratio and longitudinal reinforcement eigenvalues. By incorporating this formula, a comprehensive capacity calculation formula for slab–column connections covering the three failure modes was obtained. The results of the experimental and simulation analysis data fitting indicate a good correlation between the proposed formula and the failure modes of the slab–column connections. Specifically, punching shear failure exhibited the highest capacity, followed by flexural–punching failure, with flexural failure having the lowest capacity.
4. A comparison between the modified formula and the code-based calculation formulas reveals that the capacity calculated using GB 50010-2010 tends to be underestimated, showing a certain deviation from the experimental values. In the graph, some points deviate from the line, indicating potential safety issues when predicting the capacity under the flexural failure mode, and the formula fails to consider the influence of punch–span ratio variation on the slab–column connection capacity. The predictions from ACI 318-19 and EN 1992-1-1:2004 exhibit significant data dispersion and lower safety levels, indicating limited applicability. In contrast, the formula proposed in this study shows a high degree of fitting, with the calculated values being lower than the experimental values, demonstrating superior safety and minimal dispersion. The coefficients of variation are smaller than those of other codes, indicating the effectiveness of the proposed formula in predicting the punching and flexural capacity of unreinforced slab–column connections. It outperforms GB50010-2010, and it is superior to ACI 318-19 and EN 1992-1-1:2004.

Author Contributions

Conceptualization, Y.J., G.W. and X.W.; methodology, G.W. and X.W.; investigation, X.W.; formal analysis, X.W., L.L. and N.K.; validation, Y.J. and G.W.; data curation, X.W.; writing—original draft preparation, X.W.; writing—review and editing, X.W., Y.J. and G.W.; supervision, Y.J. and G.W.; project administration, Y.J. All authors have read and agreed to the published version of the manuscript.

Funding

The authors gratefully acknowledge the research grant provided by the National Natural Science Foundation of China (No. 51268004(2013.01-2016.12), No. 52268050(2023.01-2026.12)).

Data Availability Statement

All data are contained within the article.

Conflicts of Interest

The authors confirm that there are no conflicts of interest.

References

  1. Zheng, W.; Wang, G.; Wang, Y. Research Progress in Bearing Capacity Calculation Methods of Slab-Column Connections. J. Harbin Inst. Technol. 2022, 54, 1–7. [Google Scholar] [CrossRef]
  2. Huang, X.-N.; Li, Q.-H.; Tong, J.-Z.; Xu, S.-L.; Lu, Y.-C. Punching Shear Behavior and Strength Prediction of UHTCC-Enhanced RC Slab-Column Joints. Eng. Struct. 2023, 286, 116162. [Google Scholar] [CrossRef]
  3. Hernández Fraile, D.; Setiawan, A.; Borges Dos Santos, J.; Muttoni, A. Punching Tests on Edge Slab-Column Connections with Refined Measurements. Eng. Struct. 2023, 288, 116166. [Google Scholar] [CrossRef]
  4. Beaulieu, P.M.; Polak, M.A. Finite Element Model for Concrete Slab-Column Connections with Shear Reinforcement. J. Struct. Eng. 2023, 149, 04023177. [Google Scholar] [CrossRef]
  5. Yankelevsky, D.Z.; Karinski, Y.S.; Feldgun, V.R. Damage and Failure of a Column-Supported RC Flat Slab Subjected to Impulsive Loading. Appl. Sci. 2023, 13, 1933. [Google Scholar] [CrossRef]
  6. DI, Z.; Yang, X.; Lin, X. Punching Shear Failure Test and Joint Bearing Capacity Analysis of Building Slab Column Structure. J. JILIN Univ. Eng. Technol. Ed. 2022, 53, 2879–2885. [Google Scholar] [CrossRef]
  7. Liu, L. Experimental Study on Punching Shear Strength of RC Slabs with the Effect of Column Aspect Ratios and Flexural Reinforcement Ratios; Institute of Building Structures China Academy of Building Research: Beijing, China, 2006. [Google Scholar]
  8. Xia, C.; Shi, Q.; Wang, Z. Calculation of Punching Shear Capacity of RC Slab-Columnconnections without Shear Reinforcement. J. HARBIN Inst. Technol. 2022, 54, 18–24. [Google Scholar] [CrossRef]
  9. Tian, Y.; Chen, J.; Said, A.; Zhao, J. Nonlinear Modeling of Flat-Plate Structures Using Grid Beam Elements. Comput. Concr. 2012, 10, 489–505. [Google Scholar] [CrossRef]
  10. Wang, R. Study on Punching Shear Strength of Reinforced Concrete Slabs. Master’s Thesis, Hunan University, Changsha, China, 2013. [Google Scholar]
  11. Li, L. ABAOUS FEM Analysis on Edge Column-Slab Connections. Sichuan Build. Sci. 2013, 39, 32–35. [Google Scholar]
  12. Deng, Q. Study on Punching Shear Behavior and Capacity of Reinforced Concrete Slab-Column Connections. Ph.D. Thesis, Hunan University, Changsha, China, 2018. [Google Scholar]
  13. Tong, Y.; Sun, J.; Wu, L.; Liang, S. Finite Element Analysis of Plate-Column Node Resistance to Finite Element Analysis of Punching Performance. Water Resour. Plan. Des. 2022, 12, 9584. [Google Scholar]
  14. Xu, X.; Guo, Y.; Shen, Y. Nonlinear Finite Element and Programming; Zhejiang University Press: Hangzhou, China, 1993. [Google Scholar]
  15. Zararis, P.D. Shear Compression Failure in Reinforced Concrete Deep Beams. J. Struct. Eng. 2003, 129, 544–553. [Google Scholar] [CrossRef]
  16. Michael, C.P.; Frank, V.J. The Modified Compression-Field Theory for Reinforced Concrete Elements Subjected to Shear. ACI J. Proc. 1986, 83, 219–231. [Google Scholar] [CrossRef]
  17. Yu, Z. Calculation of Ultimate Load Capacity of Reinforced Alkaline Slabs and Foundations and Determination of Damage Types. J. Build. Struct. 1994, 11, 46–54. [Google Scholar] [CrossRef]
  18. Xu, X.; Lin, D. Physical Degradation Unit Series. Chin. J. Solid Mech. 2001, 22, 1–12. [Google Scholar]
  19. Chen, H.; Sapri, A.F. Constitutive Equations for Concrete and Soil; China Architecture & Building Press: Beijing, China, 2004. [Google Scholar]
  20. Guo, Z.; Shi, X. Reinforced Concrete Theory and Analyse; Tsinghua University Press: Beijing, China, 2003. [Google Scholar]
  21. Willam, K. Plasticity in Reinforced Concrete. Comput. Methods Appl. Mech. Eng. 1982, 31, 363. [Google Scholar] [CrossRef]
  22. Wang, X.; Shao, M. Finite Element and Numerical Method; Tsinghua University Press: Beijing, China, 1997. [Google Scholar]
  23. Bergan, P.; Holand, I.; Soreide, T. Use of Current Stiffness Parameter in Solution of Nonlinear Problems, Energy Methods in Finite Element Analysis; John Wiley & Sons: Hoboken, NJ, USA, 1979. [Google Scholar]
  24. Zhan, M. Study on Load-Carrying Mechanism to Resist Progressive Collapse of RC Structures Considering Cast-in-Place Slab. Master’s Thesis, Nanchang University, Nanchang, China, 2021. [Google Scholar]
  25. Wen, Z. Nonlinear Analysis of Temperature Effect to Over-Long RC Frame Structures. Master’s Thesis, Nanchang University, Nanchang, China, 2020. [Google Scholar]
  26. Jia, Y.; Wu, G.; Yang, C.; Zhang, Q.; Yuan, Z. Simulation Analysis on Lateral Stiffness Degradation and Storey Shear Force Redistribution of RC Frame Shear Wall Structure with Different Axial Compression Ratios. Build. Struct. 2016, 46, 50–55. [Google Scholar] [CrossRef]
  27. Wu, G.; Lin, W.; Wang, J.; Jia, Y.; Xiang, Y. Study on the Effect of Effective Prestressing on the Ultimate Bearing Capacity of Large-Span P. C. Bridges. Chin. J. Comput. Mech. 2013, 30, 362–369. [Google Scholar] [CrossRef]
  28. Wang, J.; Wu, G.; Xiang, Y.; Ye, G.; Lin, D.; Xu, X. Nonlinear Simulation Study of Prestressed Concrete Bridge Structures. Chin. J. Comput. Mech. 2010, 27, 1–7. [Google Scholar]
  29. Wu, G. Nonlinearity Analysis Theory and Ultimate Bearing Capacity Calculation Study on Long-Span Pre-Stressed Concrete Bridge. Ph.D. Thesis, Zhejiang University, Hangzhou, China, 2006. [Google Scholar]
  30. Hong, F. Experimental Study on Punching Shear Failure of Reinforced Concrete Slabs-Column Connection. Ph.D. Thesis, Hunan University, Changsha, China, 2015. [Google Scholar]
  31. GB 50010-2010; Code for the Design of Coagulation Structures. China Construction Industry Press: Beijing, China, 2015; pp. 28–30.
  32. Zhen, J.; Zhen, Z. Experimental Study of Punching Strength of Reinforced Concrete Slabs. J. Fuzhou Univ. Sci. 1992, 20, 65–71. [Google Scholar]
  33. Elstner, R.C.; Hognestad, E. Shearing Strength of Reinforced Concrete Slabs. ACI J. Proc. 1956, 53, 29–58. [Google Scholar] [CrossRef]
  34. Yi, W.; Hong, F.; Peng, J. Experimental Investigation of Punching Shear Failure of’ Reinforced Concrete Slab-Column Connections. Build. Struct. 2016, 46, 1–9. [Google Scholar]
  35. ACI 318-19; Building Code Requirements for Structural Concrete. The American Concrete Institute: Farmington Hills, MI, USA, 2019.
  36. EN 1992–1–1:2004; Eurocode 2, Design of Concrete Structures. British Standards Institution: Brussels, Belgium, 2004.
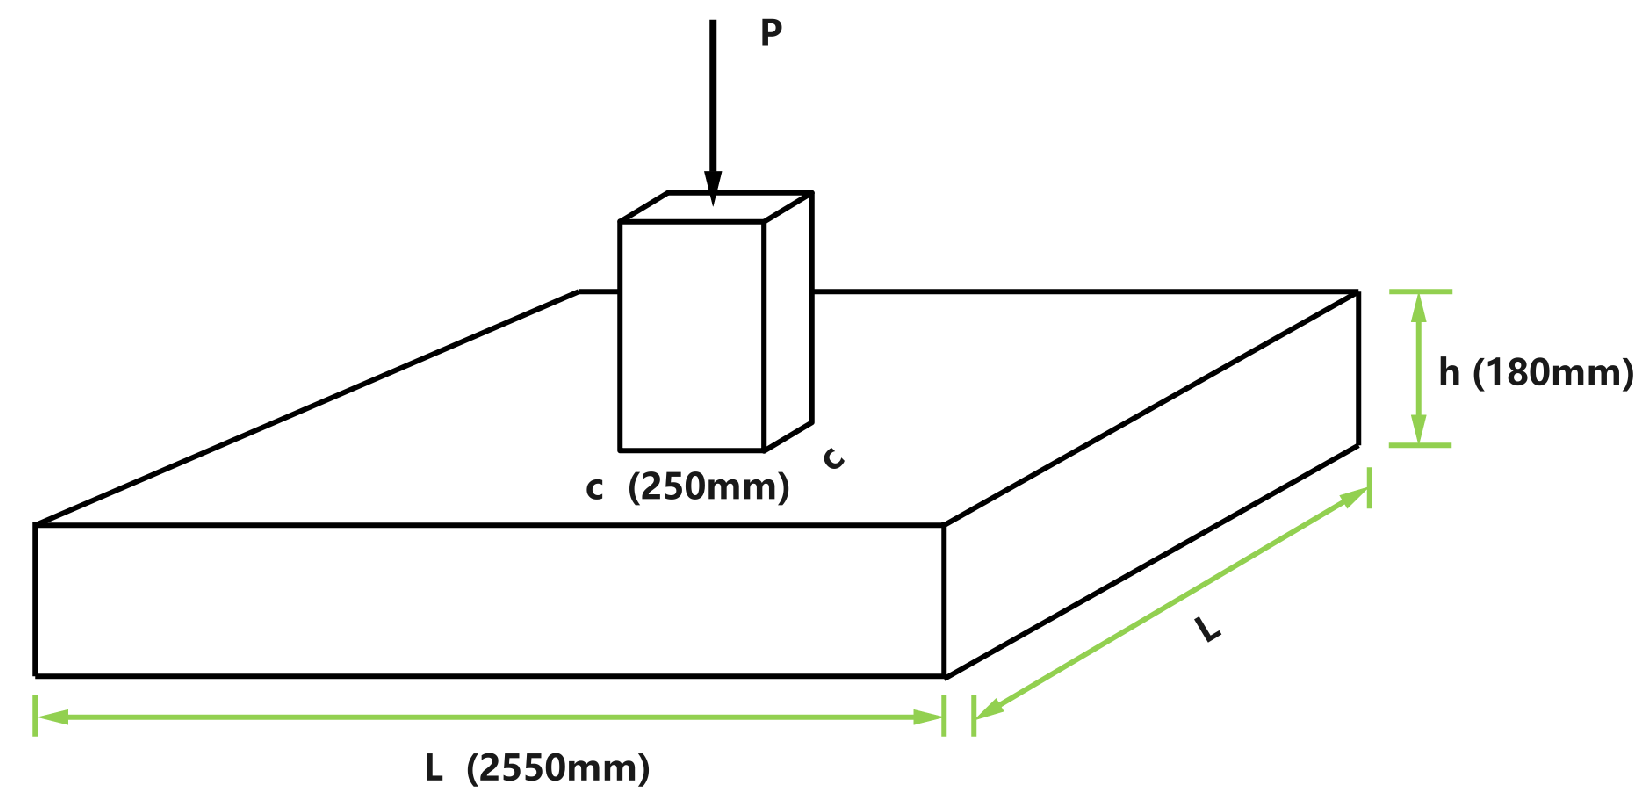
Figure 1. Twenty-node isoparametric element.
Buildings 14 00208 g001
Figure 2. Diagram of 3D solid degeneration virtual layer composite element.
Buildings 14 00208 g002
Figure 3. Blocks within the 3D solid degeneration virtual composite element.
Buildings 14 00208 g003
Figure 4. Constitutive relation of reinforcement: (a) ideal uniaxial stress–strain relationship; (b) ideal iso-biaxial compression relationship.
Buildings 14 00208 g004
Figure 5. Constitutive model of reinforcing bar—elastic reinforcement model.
Buildings 14 00208 g005
Figure 6. Schematic diagram of loading of members.
Buildings 14 00208 g006
Figure 7. Layout of displacement measurement points and numbering of specimens.
Buildings 14 00208 g007
Figure 8. Finite element model meshing diagrams.
Buildings 14 00208 g008
Figure 9. C7-70-1 plan, section, and reinforcement diagrams.
Buildings 14 00208 g009
Figure 10. Comparison of load–deflection curves at measured points in the center of the plate.
Buildings 14 00208 g010
Figure 11. Comparison of load–deflection curves in the middle of some slabs. (a) C7-30-3; (b) C7-50-3.
Buildings 14 00208 g011
Figure 12. Comparison chart between experimental failure mode and stress contour map (C7-30-3). (a) Experiment failure mode; (b) Stress contour map.
Buildings 14 00208 g012
Figure 13. Load–deflection curves of slab–column connections under different failure modes.
Buildings 14 00208 g013
Figure 14. Stress contours of slab–column connections under different failure modes: (a) flexural failure stress contours; (b) flexural–punching failure stress contours; (c) punching–cutting failure stress contours (the plastic hinge lines are clearly evident).
Buildings 14 00208 g014
Figure 15. Stress variation of reinforcement at the 45° position in slab–column connection under different failure modes and plan view: (a) stress variation curve; (b) stress point location.
Buildings 14 00208 g015
Figure 16. Partial crack file data.
Buildings 14 00208 g016
Figure 17. Schematic diagram of crack development in slab−column connection section.
Buildings 14 00208 g017
Figure 18. Discriminant diagram of failure mode for slab–column connection.
Buildings 14 00208 g018
Figure 19. Load–deflection curves of slab–column connections under different punch–span ratios.
Buildings 14 00208 g019
Figure 20. Relationship between eigenvalues of longitudinal reinforcement and ultimate load capacity of slab–column connections.
Buildings 14 00208 g020
Figure 21. Model of punching and flexural failure: (a) sectional view of the slab–column connection; (b) punching failure cone.
Buildings 14 00208 g021
Figure 22. Standard normal PP diagram.
Buildings 14 00208 g022
Figure 23. Data scatter plot.
Buildings 14 00208 g023
Figure 24. Flexural failure model.
Buildings 14 00208 g024
Figure 25. Histogram of random variables σ .
Buildings 14 00208 g025
Figure 26. Comparison of load-bearing capacity formulas and test values: (a) the modified formula vs. the test simulation value; (b) GB50010-2010 vs. the test simulation value; (c) ACI 318-19 vs. the test simulations; (d) EN 1992-1-1:2004 vs. the test simulations.
Buildings 14 00208 g026
Table 1. Detailed design parameters of the specimens.
Specimenh0/mmh/mmL/mmc/mmConcrete
Grade
Longitudinal
Reinforcement
ρ
C7-30-31501802550250C3014@601.73%
C7-50-32550C5014@601.73%
C7-70-32550C7014@601.73%
C7-50-22550C7014@801.28%
C7-30-12550C7014@1200.86%
h0: effective thickness of the slab; h: thickness of the slab; L: length of the slab; c: the dimensions of the column; ρ: longitudinal reinforcement ratio.
Table 2. Specimen numbers and their parameters.
SpecimenL/mmρfy/fcConcrete
Grade
Longitudinal ReinforcementρλFailure Mode
C3-30-113500.217C3014@1200.86%3punching
C3-30-213500.322C3014@801.28%3punching
C3-30-313500.436C3014@601.73%3punching
C3-50-113500.134C5014@1200.86%3punching
C3-50-213500.199C5014@801.28%3punching
C3-50-313500.270C5014@601.73%3punching
C5-30-119500.217C3014@1200.86%5punching
C5-30-219500.322C3014@801.28%5punching
C5-30-319500.436C3014@601.73%5punching
C5-50-119500.134C5014@1200.86%5flexural and punching
C5-50-219500.199C5014@801.28%5punching
C5-50-319500.270C5014@601.73%5punching
C7-30-122500.217C3014@1200.86%7punching
C7-30-222500.322C3014@801.28%7punching
C7-30-322500.436C3014@601.73%7punching
C7-50-122500.134C5014@1200.86%7flexural and punching
C7-50-225500.199C5014@801.28%7punching
C7-50-322500.270C5014@601.73%7punching
C9-30-131500.217C3014@1200.86%9punching
C9-30-231500.322C3014@801.28%9punching
C9-30-331500.436C3014@601.73%9punching
C9-50-131500.134C5014@1200.86%9flexural and punching
C9-50-231500.199C5014@801.28%9flexural and punching
C9-50-331500.270C5014@601.73%9flexural and punching
C11-30-137500.217C3014@1200.86%11flexural
C11-30-237500.322C3014@801.28%11flexural and punching
C11-30-337500.436C3014@601.73%11punching
C11-50-137500.134C5014@1200.86%11flexural
C11-50-237500.199C5014@801.28%11flexural
C11-50-337500.270C5014@601.73%11flexural and punching
C13-30-143500.217C3014@1200.86%13flexural
C13-30-243500.322C3014@801.28%13flexural
C13-30-343500.436C3014@601.73%13flexural and punching
C13-50-143500.134C5014@1200.86%13flexural
C13-50-243500.199C5014@801.28%13flexural
C13-50-343500.270C5014@601.73%13flexural
C15-30-143500.217C3014@1200.86%15flexural
C15-30-243500.322C3014@801.28%15flexural
C15-30-343500.436C3014@601.73%15flexural
C15-50-143500.134C5014@1200.86%15flexural
C15-50-243500.199C5014@801.28%15flexural
C15-50-343500.270C5014@601.73%15flexural
ρƒyc: longitudinal reinforcement eigenvalues; concrete grade: design strength; λ: punch–span ratio, λ = a/h0, a = (L0 − c)/2.
Table 4. Sources of experimental data.
Data SourcesSample SizeRange of λRange of EigenvaluesRange of fcRange of Column Size
Elstner et al. [33]18
Weijian Yi et al. [34] 93~130.074~0.92912.8~55.4 MPa250~354 mm
Numerical simulation in this paper36
Table 5. Analysis of the ratio of tested to calculated load-carrying capacity values.
GB 50010-2010 [31]ACI 318-1 9 [35]EN 1992-1-1:2004 [36]The Formula for this Article
average value0.5131.3551.3410.889
coefficient of variation0.3010.2660.3440.130
Disclaimer/Publisher’s Note: The statements, opinions and data contained in all publications are solely those of the individual author(s) and contributor(s) and not of MDPI and/or the editor(s). MDPI and/or the editor(s) disclaim responsibility for any injury to people or property resulting from any ideas, methods, instructions or products referred to in the content.

