
Microscopic Properties of Asphalt and Polyethylene at an Extraordinary High Dosage through Molecular Dynamics Simulation


Abstract
1. Introduction
2. Computational Parameters and Experimental Methods
2.1. Molecule Models of Asphalt
2.2. Molecule Models of PE
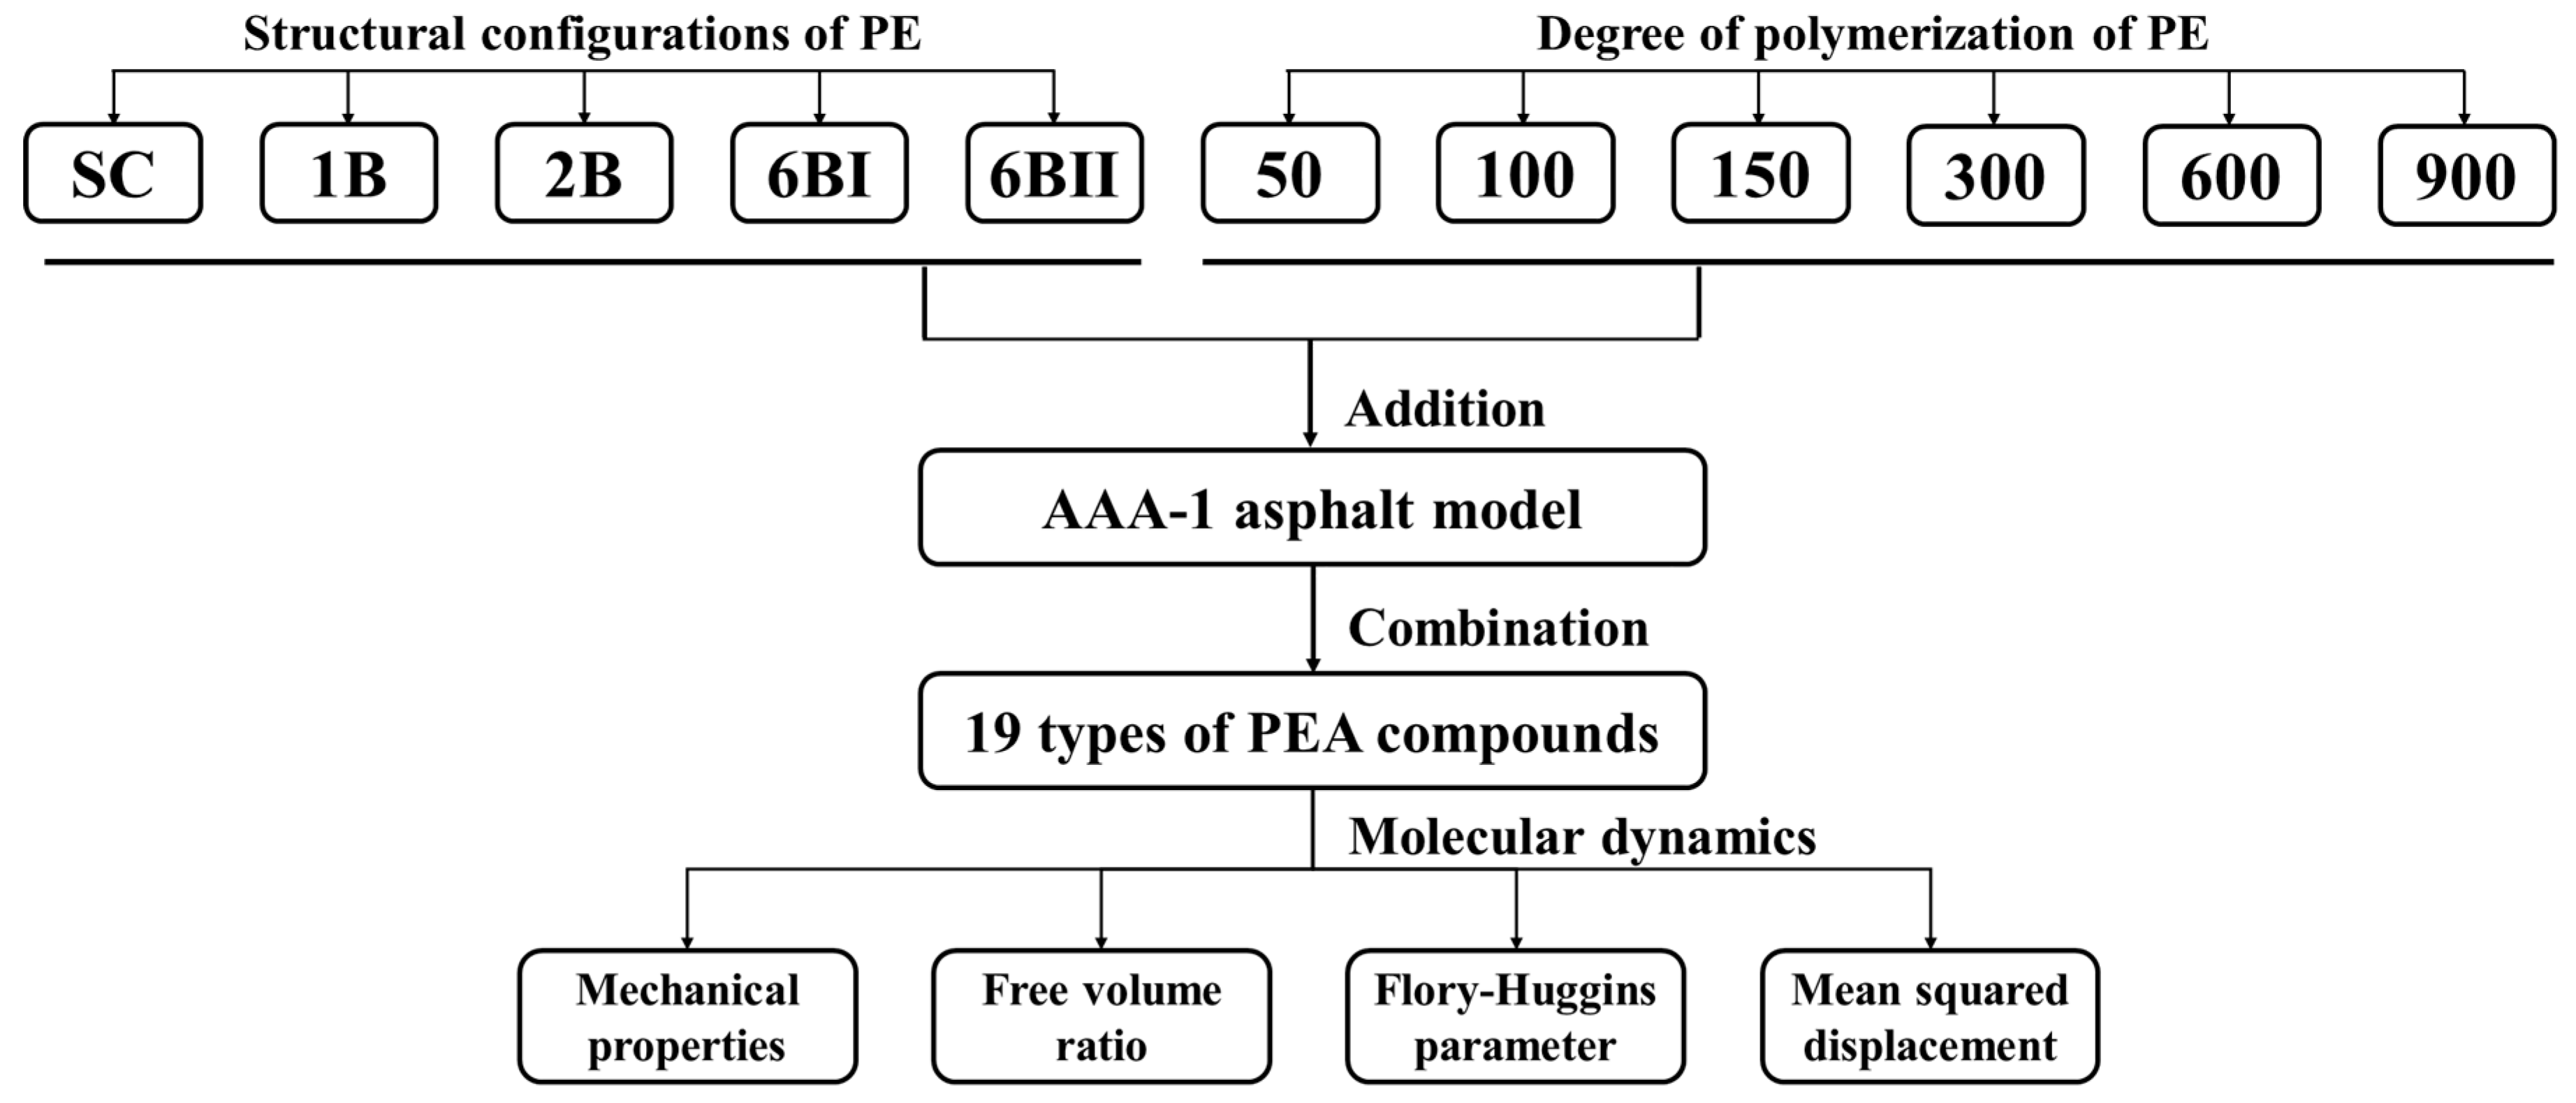
2.3. Construction of PEA Models and Simulation Process
- (1)
- Firstly, 19 types of PEA models were constructed using the COMPASS II force field through the ‘Amorphous cell module, and the initial density of models was set at 0.1 g/cm3. It should be noted that to create 600-SC or 900-SC modified asphalt, the conventional cell of asphalt was expanded to 2 or 3 to achieve a loading content of 20 wt.% of PE in the modified asphalt.
- (2)
- Then, the constructed PEA models were optimized by the Geometric optimization module with the following parameters: the energy convergence criterion was set as 1.0 × 10⁻⁴ kcal/mol, and the maximum force, maximum stress, and maximum displacement were set as 0.005 kcal/mol/Å, 0.005 GPa, and 0.001 Å, respectively.
- (3)
- Afterward, annealing was carried out under an NVT ensemble with an initial temperature of 298 K and a maximum temperature of 500 K, completing 10 cycles to release the energy generated during the modeling process for 1 ns.
- (4)
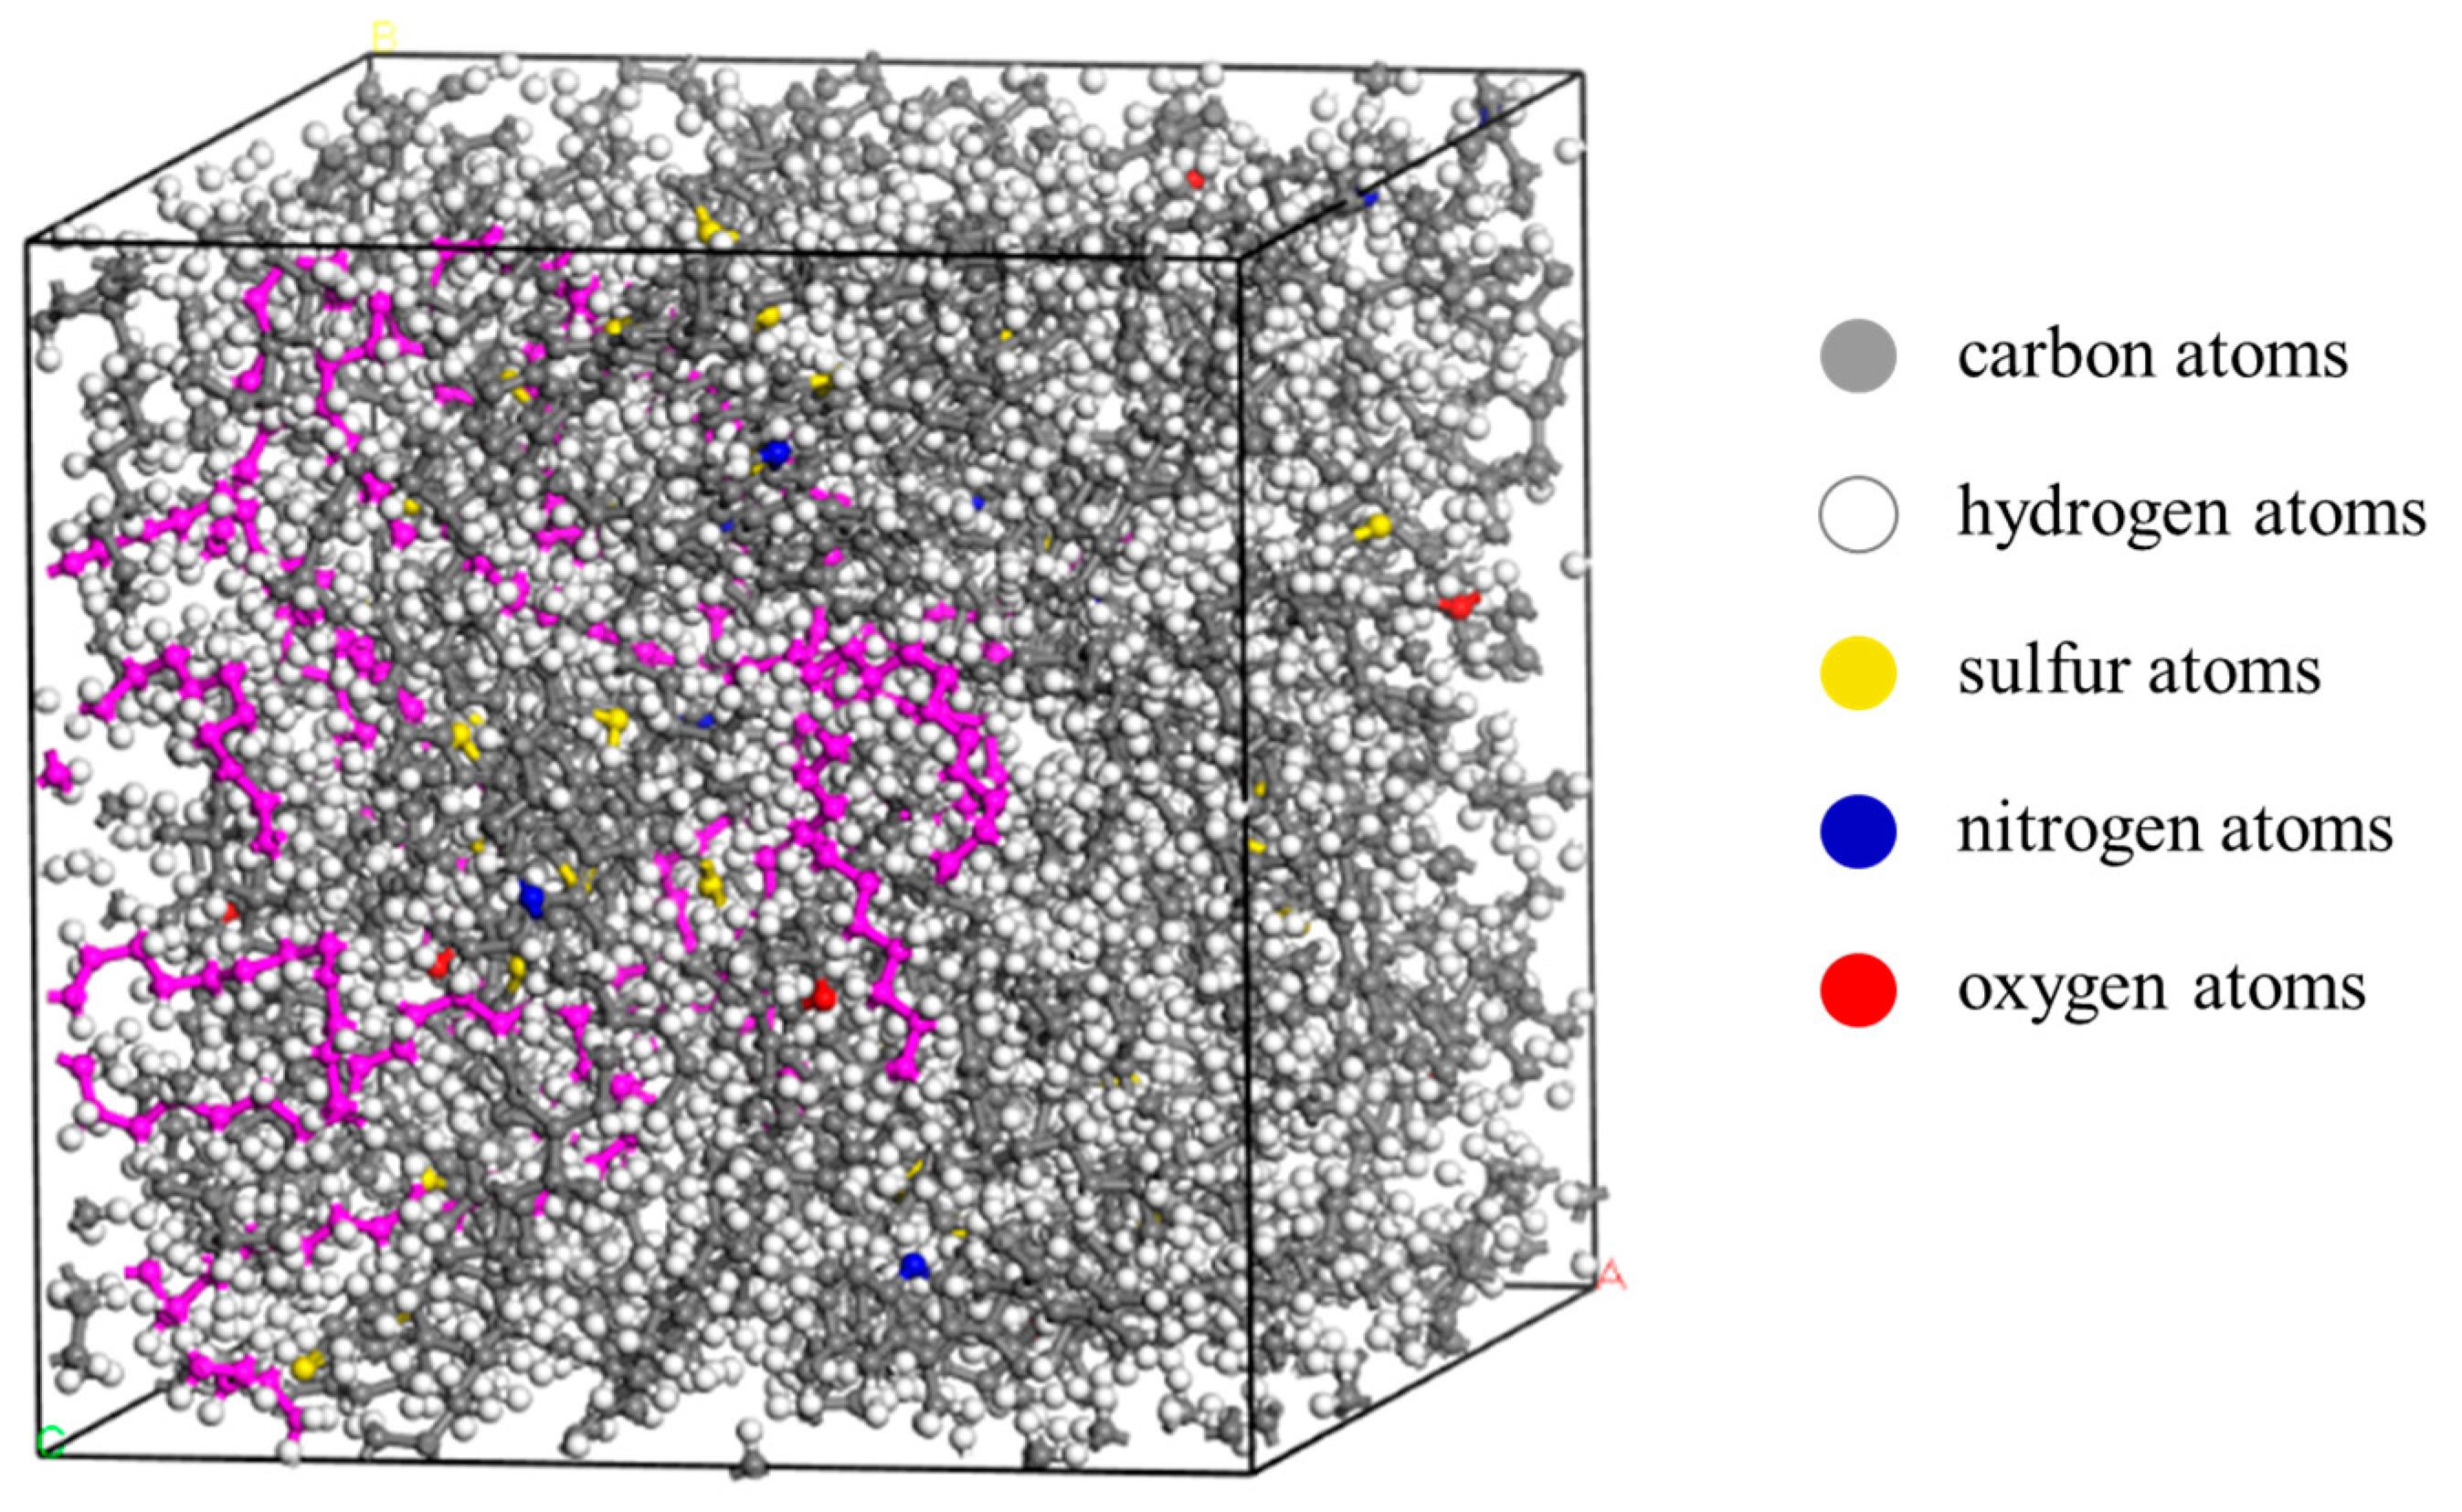
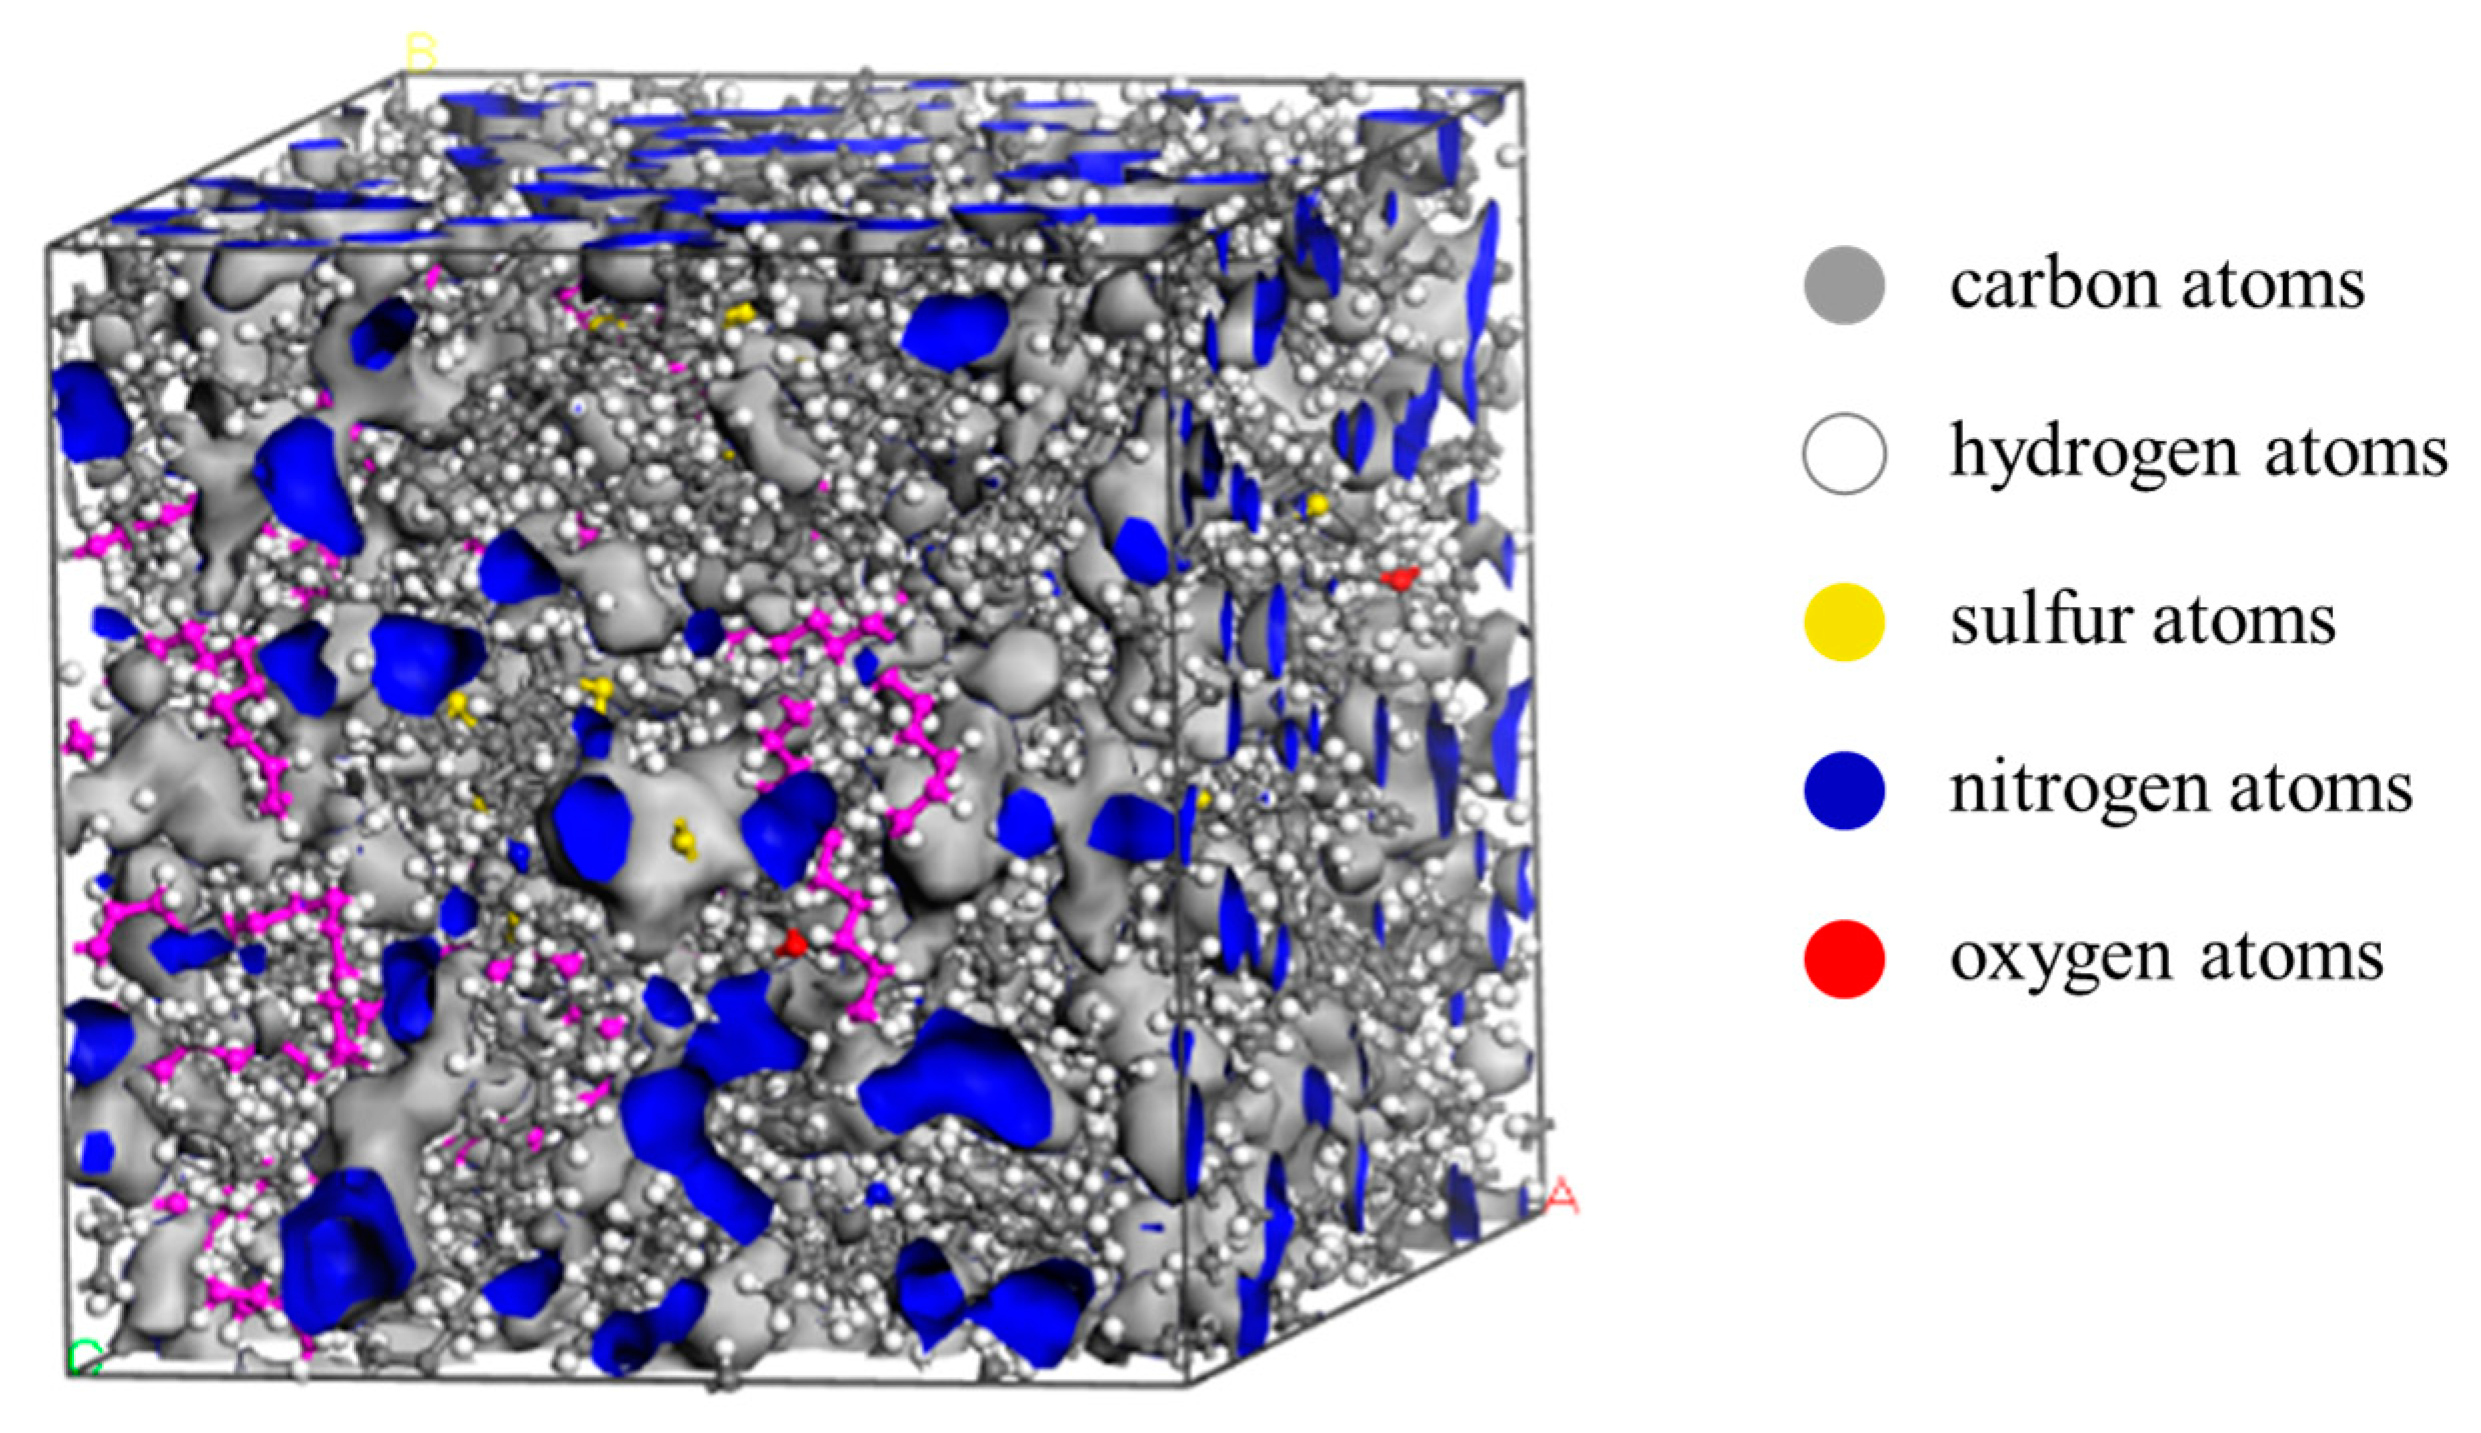
- In the dynamic simulation process, the 19 types of PEA models were simulated under an NPT ensemble for 500 ps at 298 K with a step of 1.0 fs to obtain a more stable structure. The pressure was set at 1.0 × 10⁻⁴ GPa. Finally, MD simulation in the NVT ensemble was performed at 298 K for 500 ps for each model, and all the analyzed data were based on these trajectories. The configuration of the 300-SC model is shown in Figure 2 after dynamic simulation.
2.4. Properties Calculation and Analysis
- (1)
- Mechanical properties
- (2)
- Free volume ratio (FVR)
- (3)
- Flory–Huggins parameter (χ)
- (4)
- Mean squared displacement (MSD)
2.5. Experimental Part: Synthesis of PEA and Microscopic Tests
3. Results and Discussion
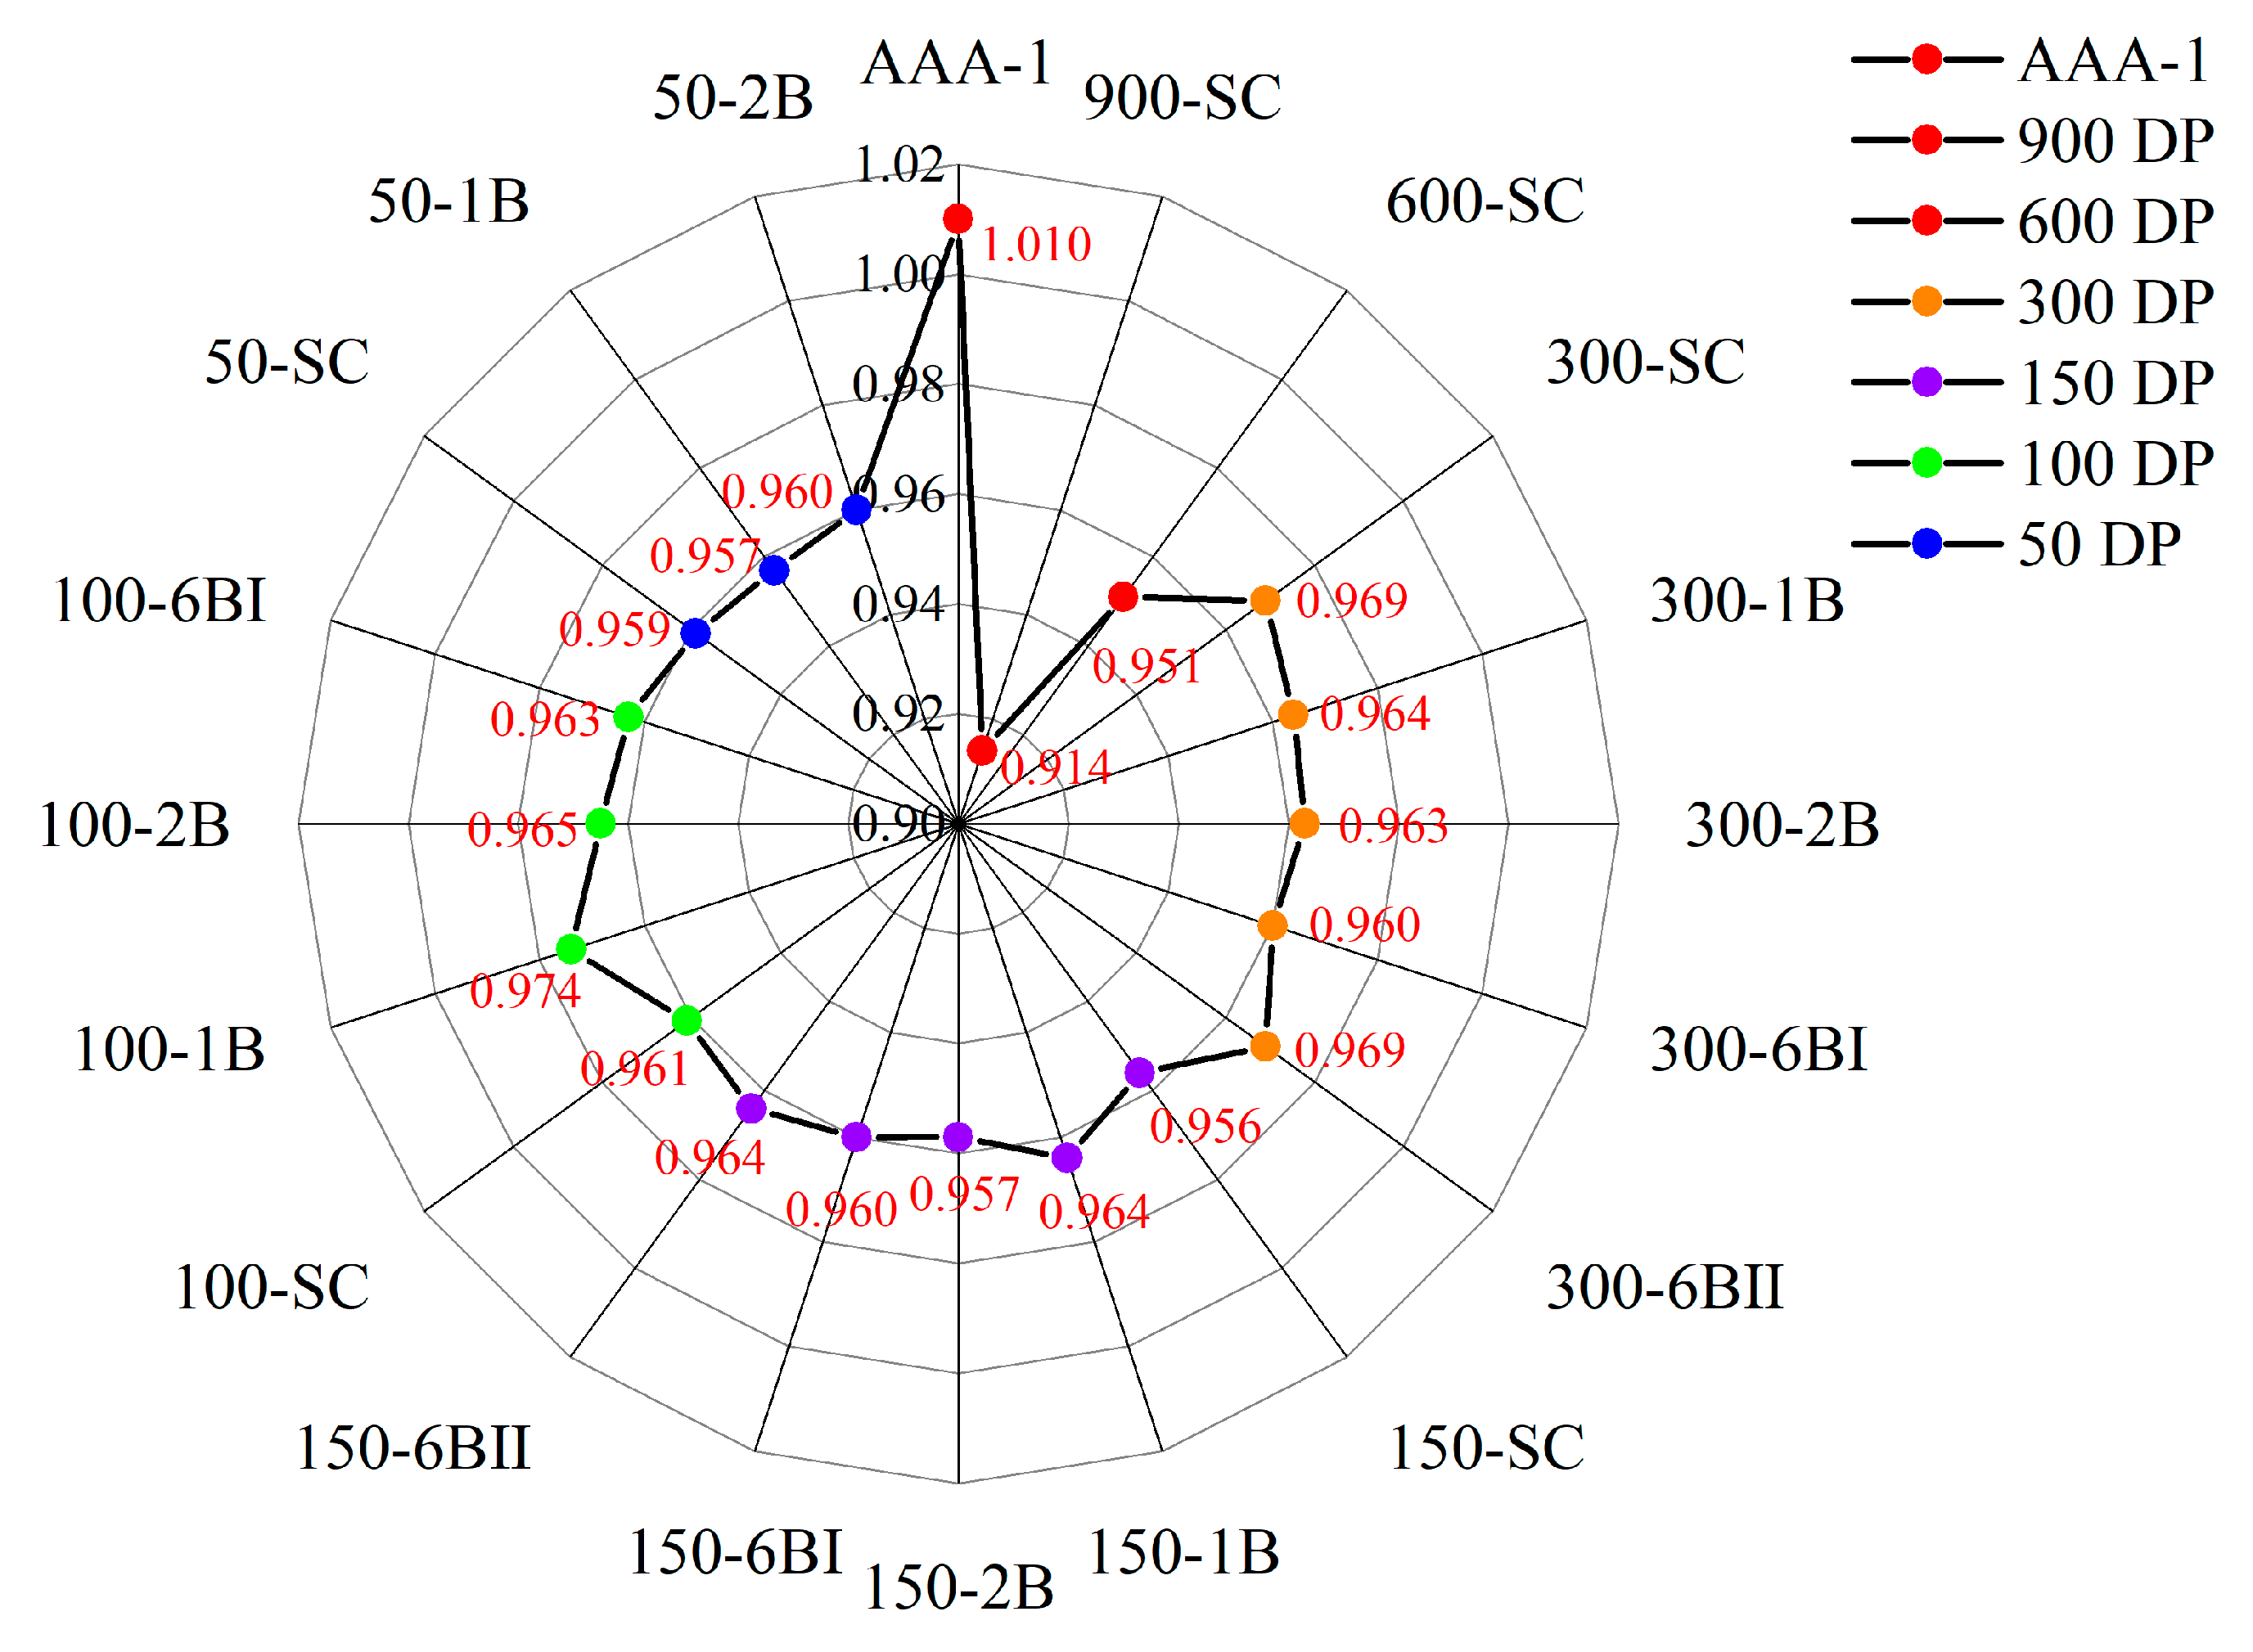
3.1. Density of PEA Models
3.2. Mechanical Properties of PEA Models
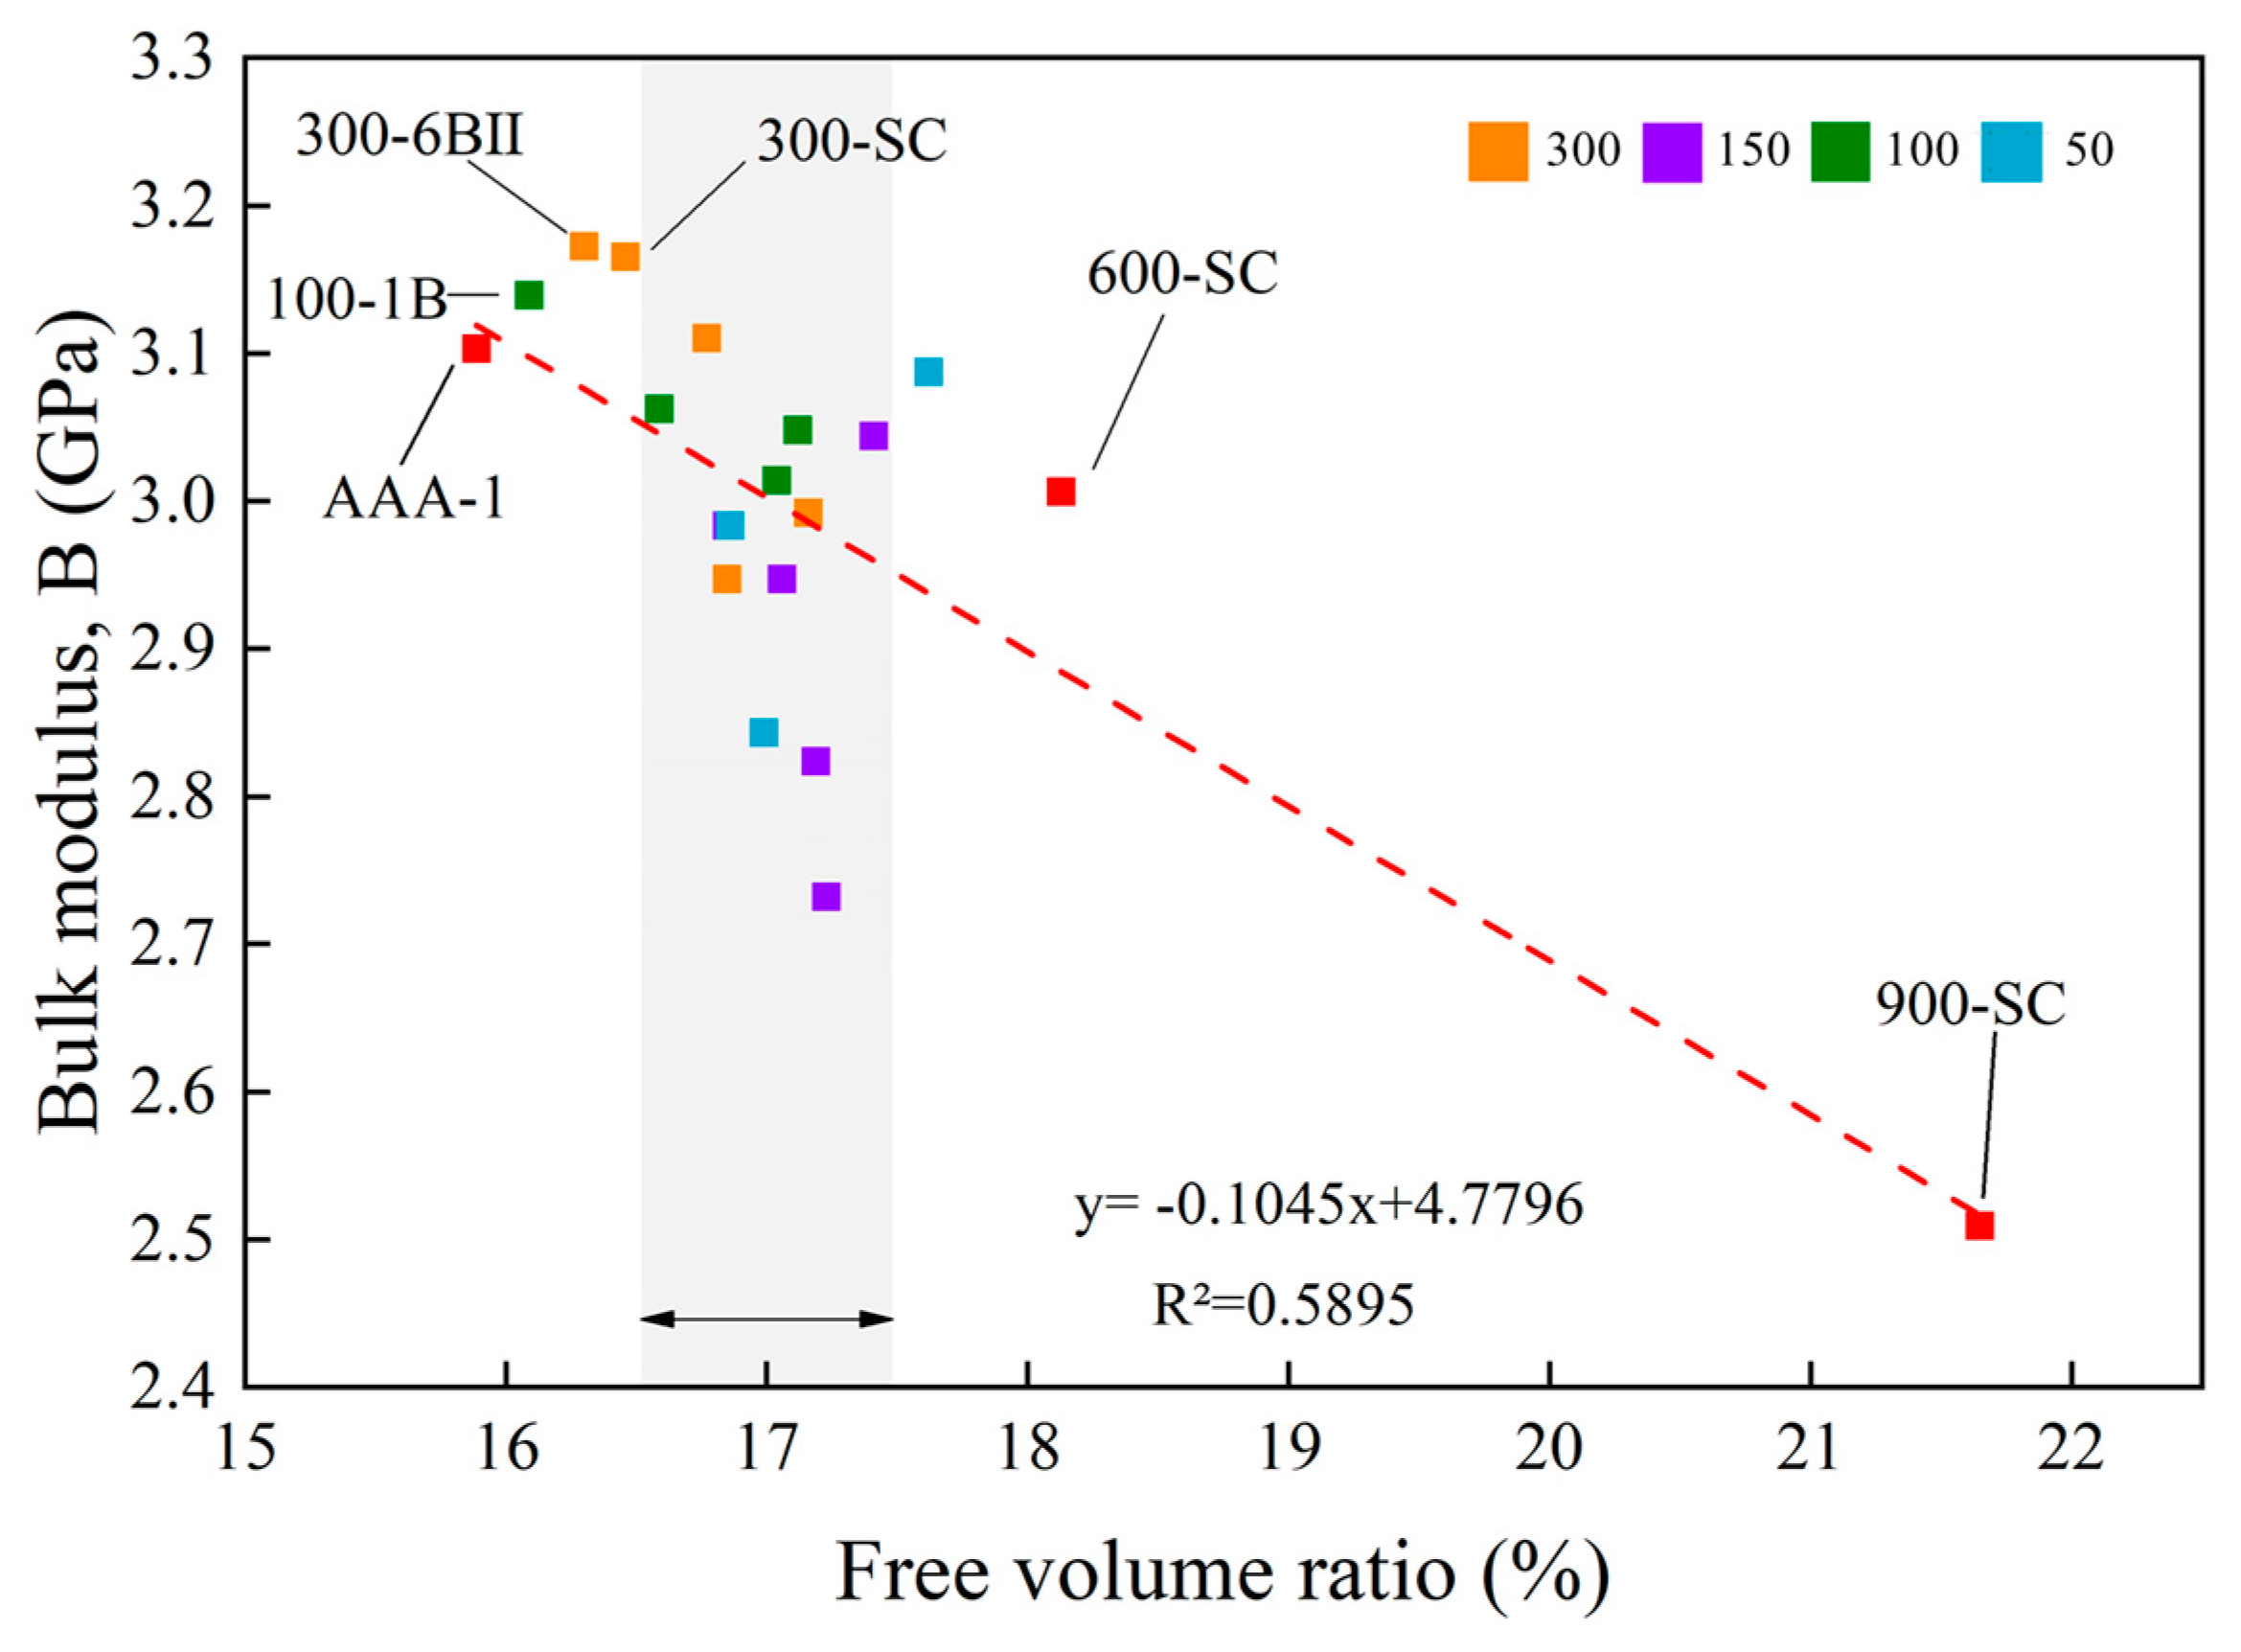
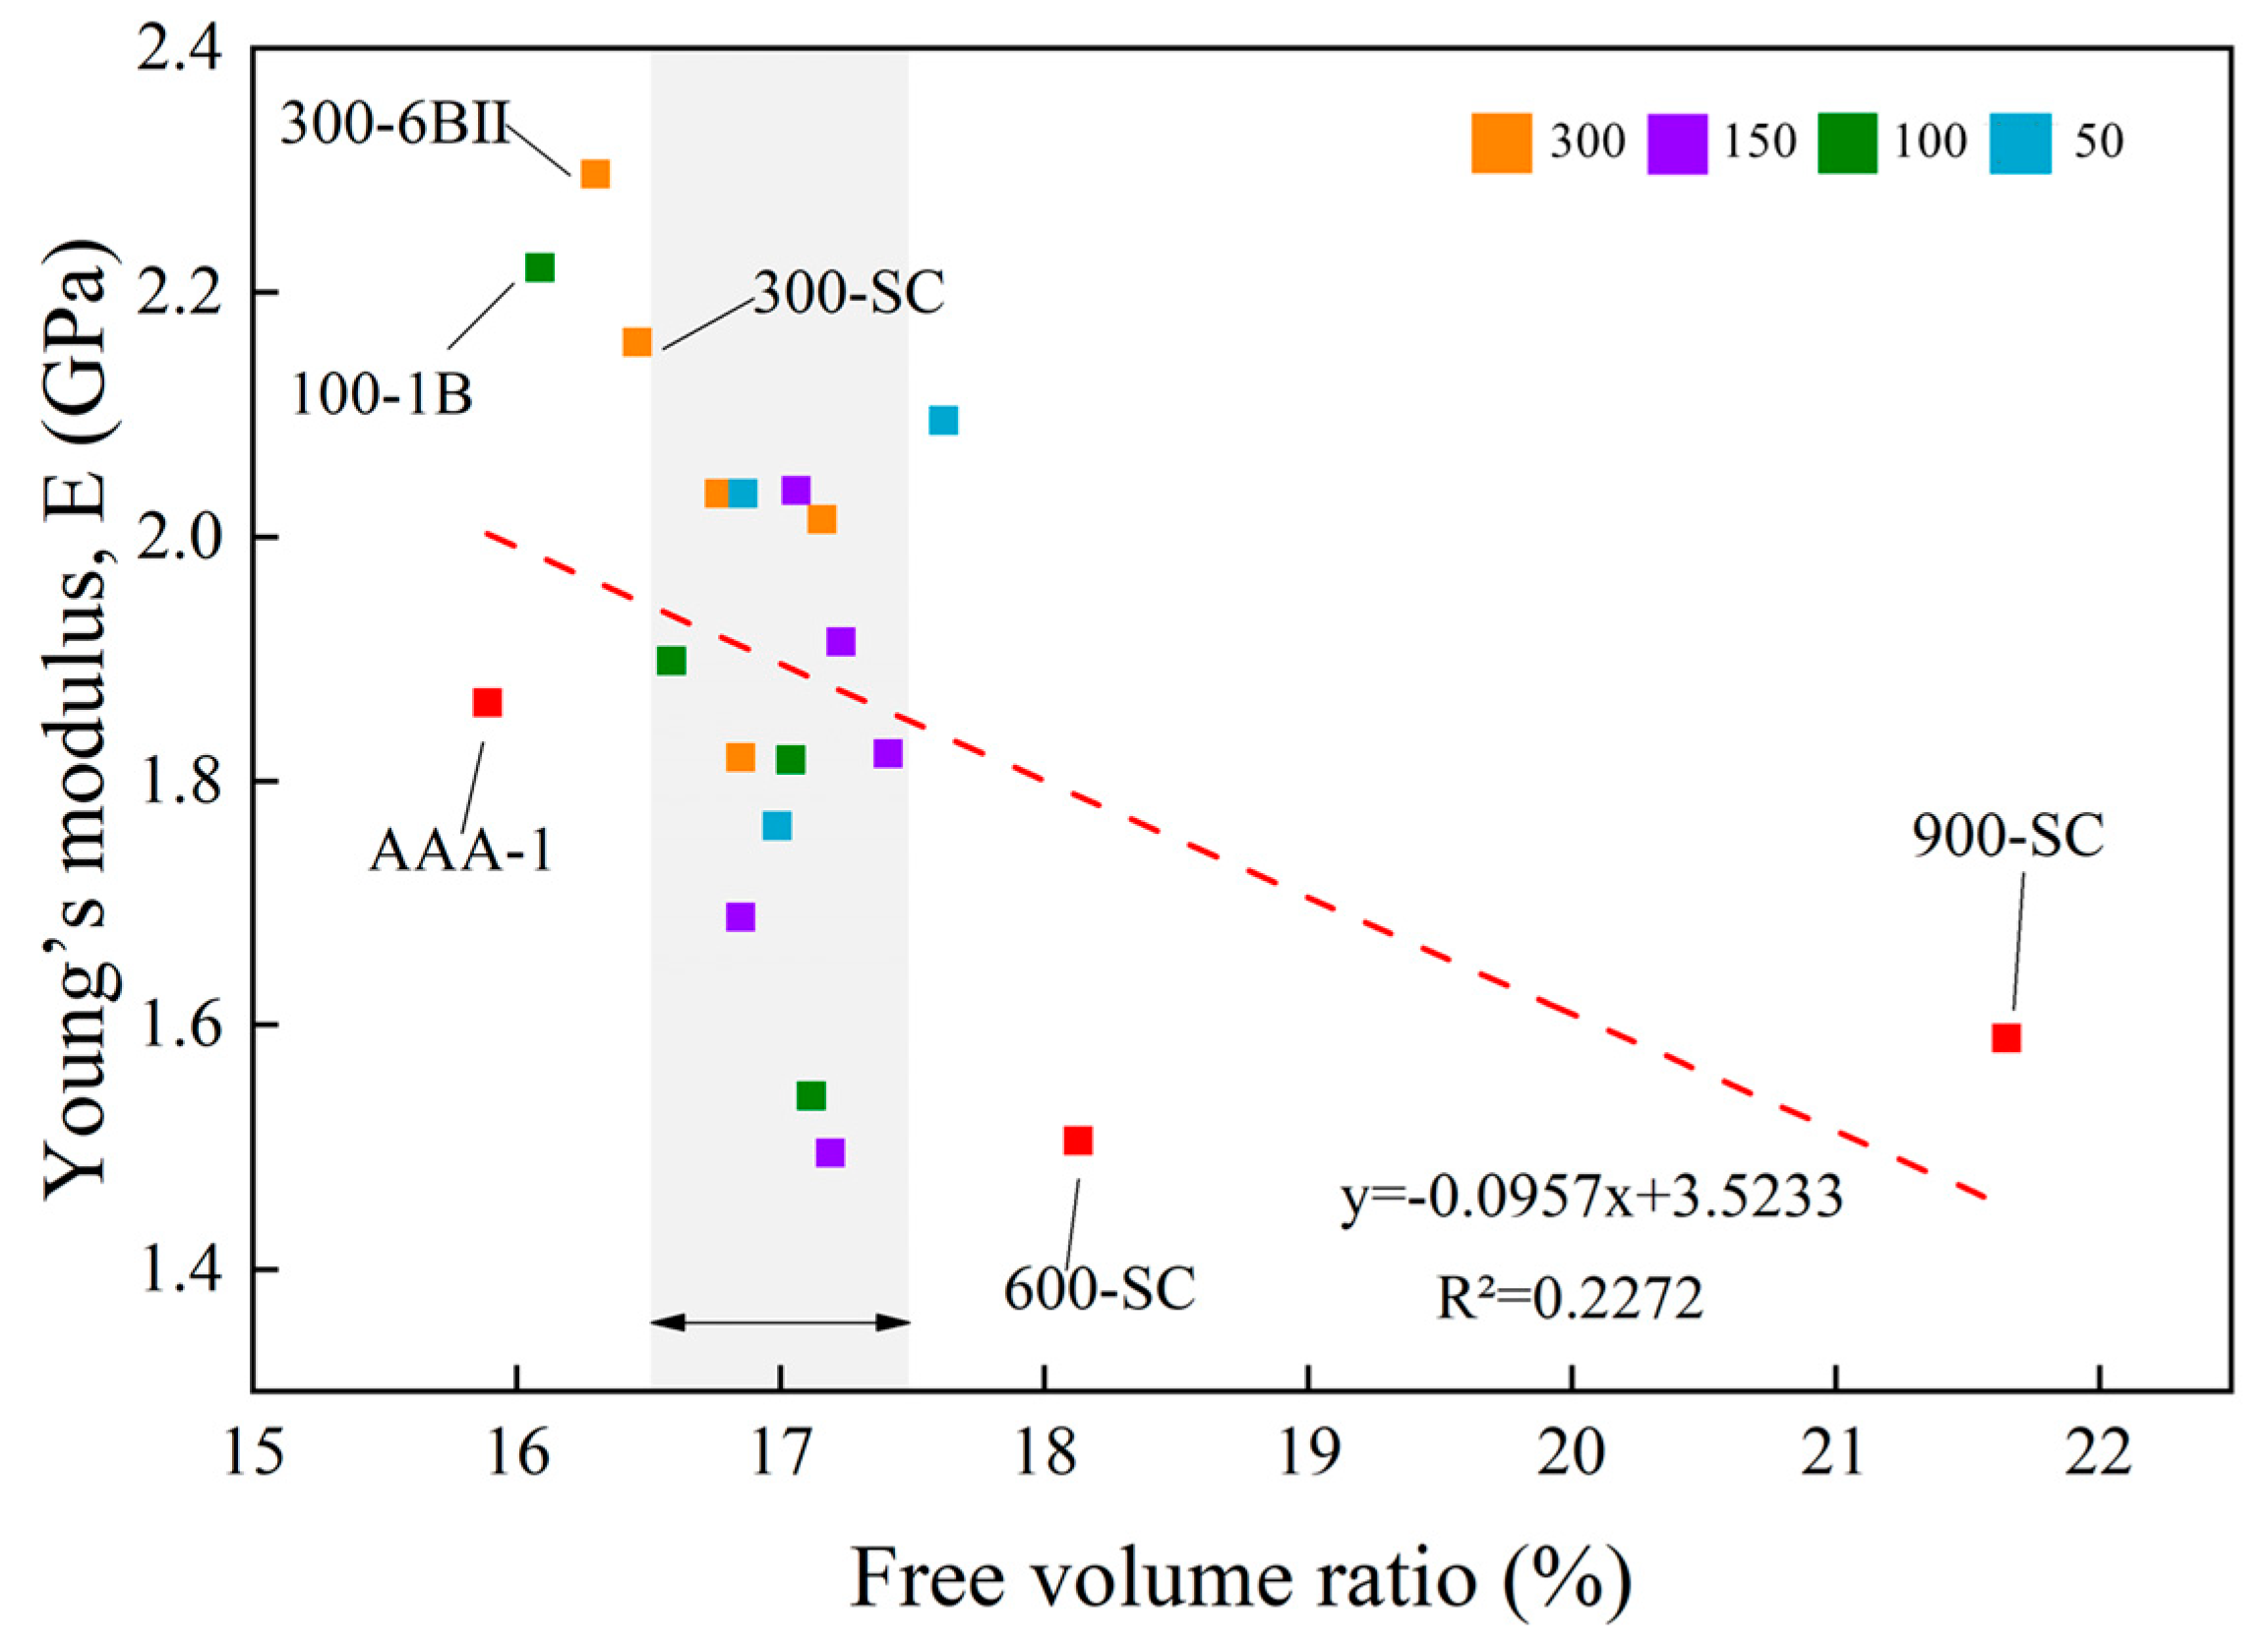
3.3. Relationship between FVR and Mechanical Properties of PEA Models
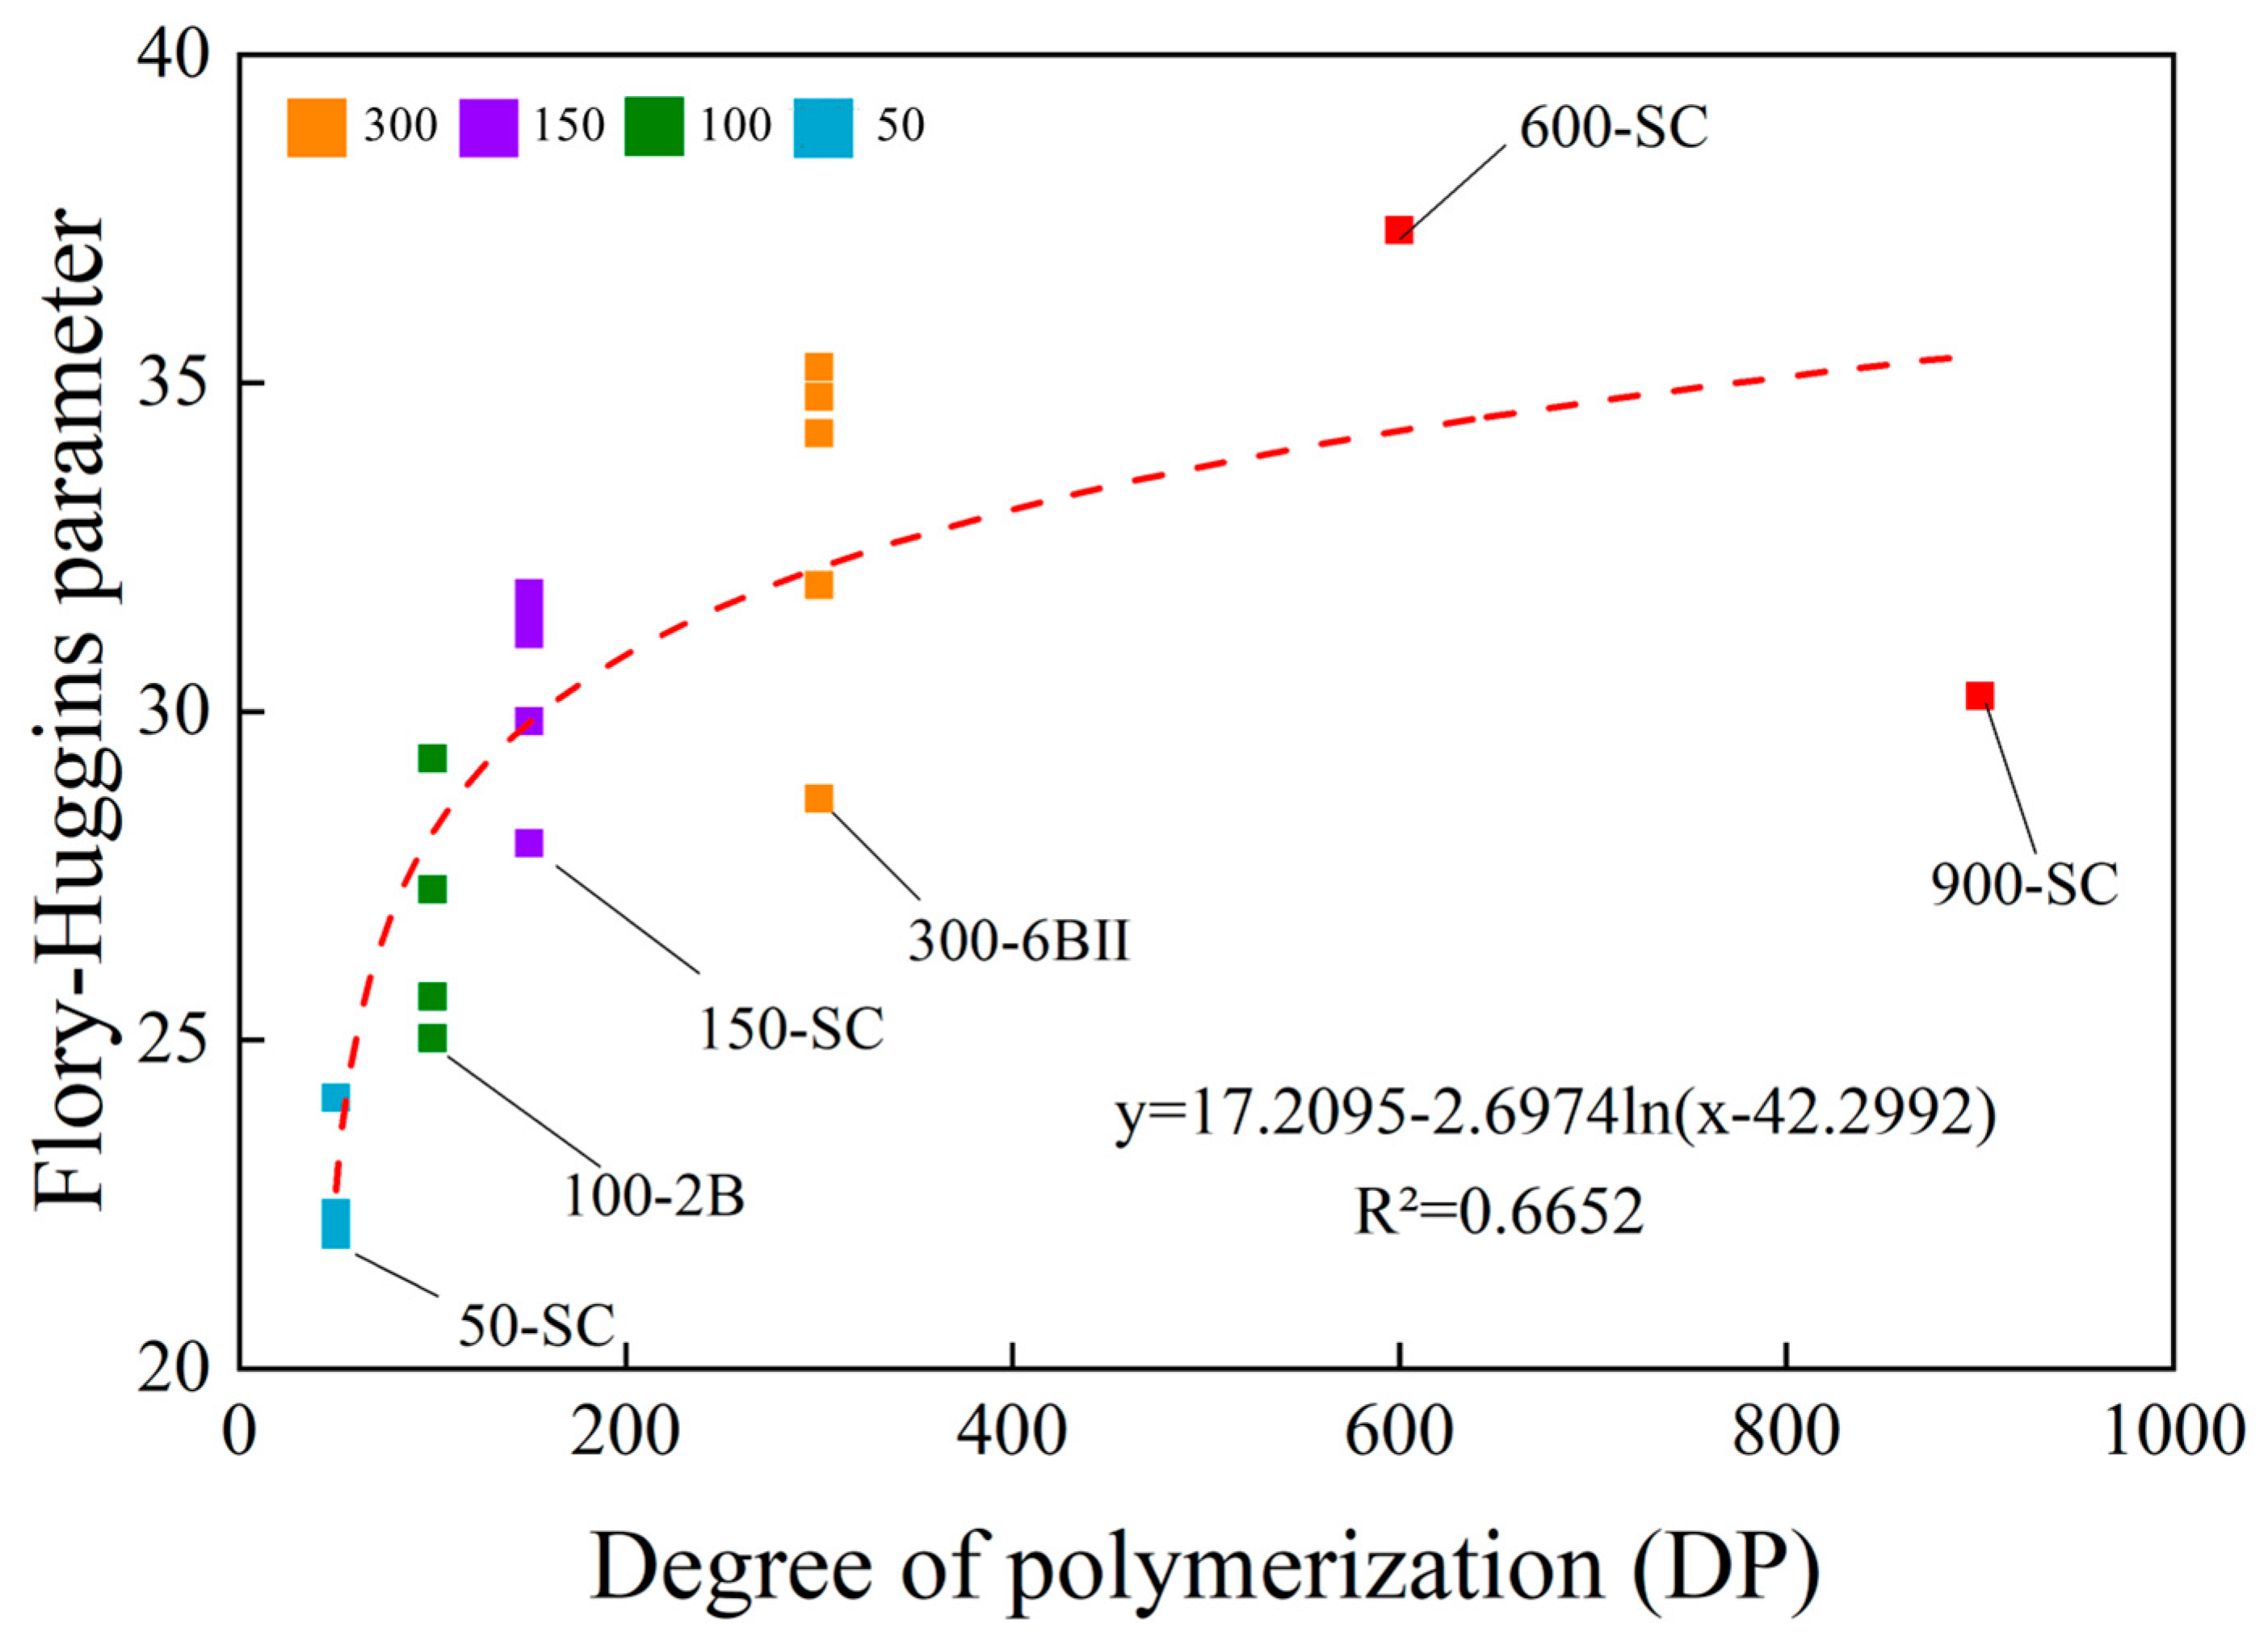
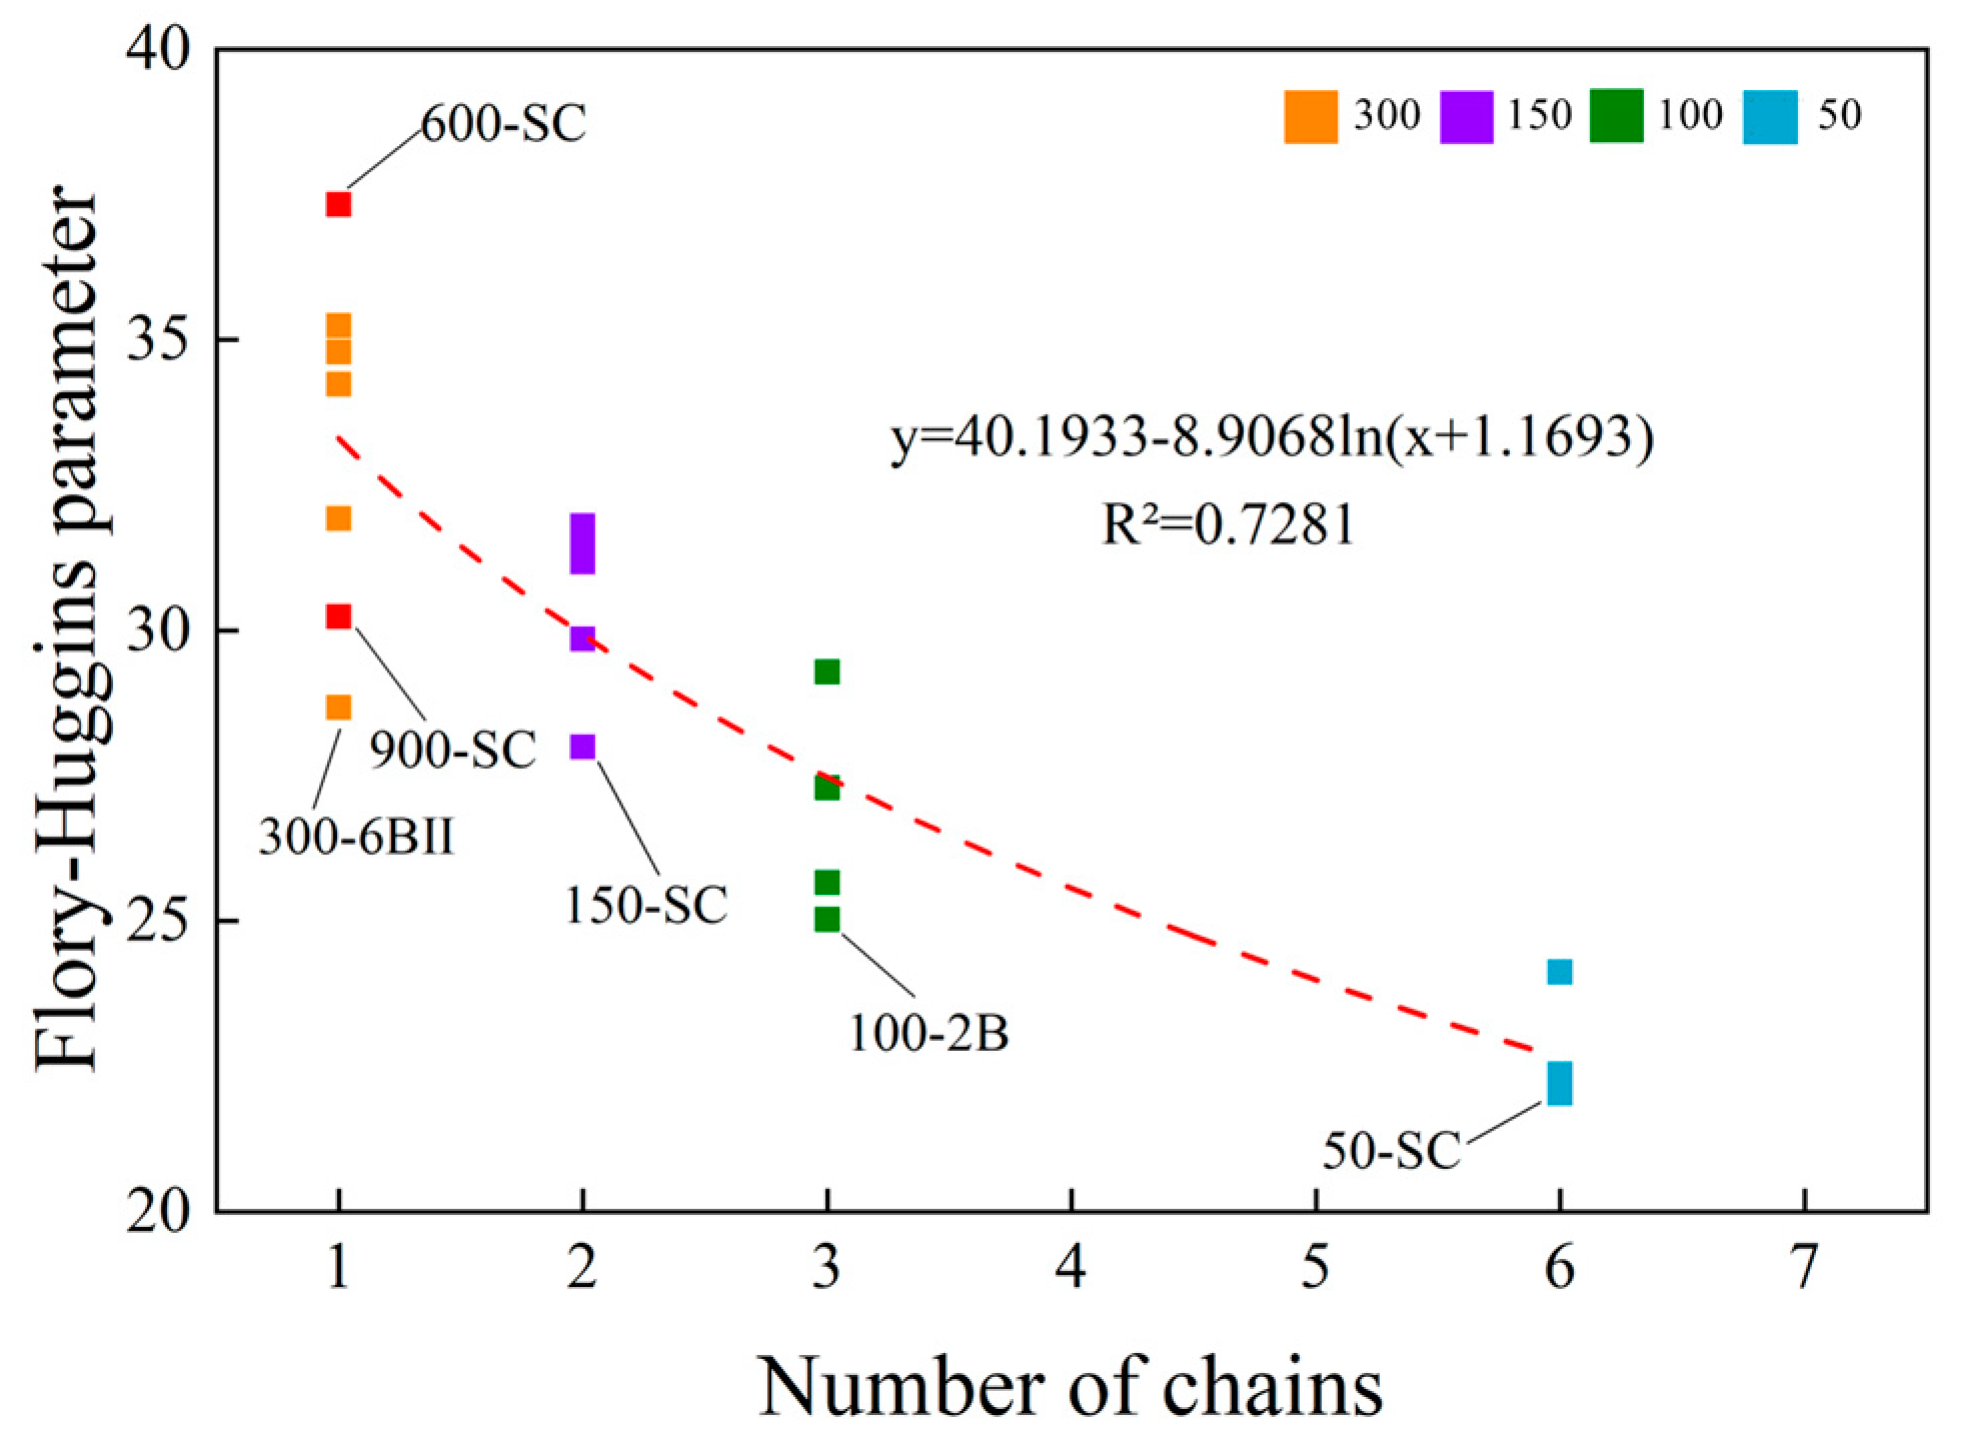
3.4. Compatibility Evaluation of PEA Models
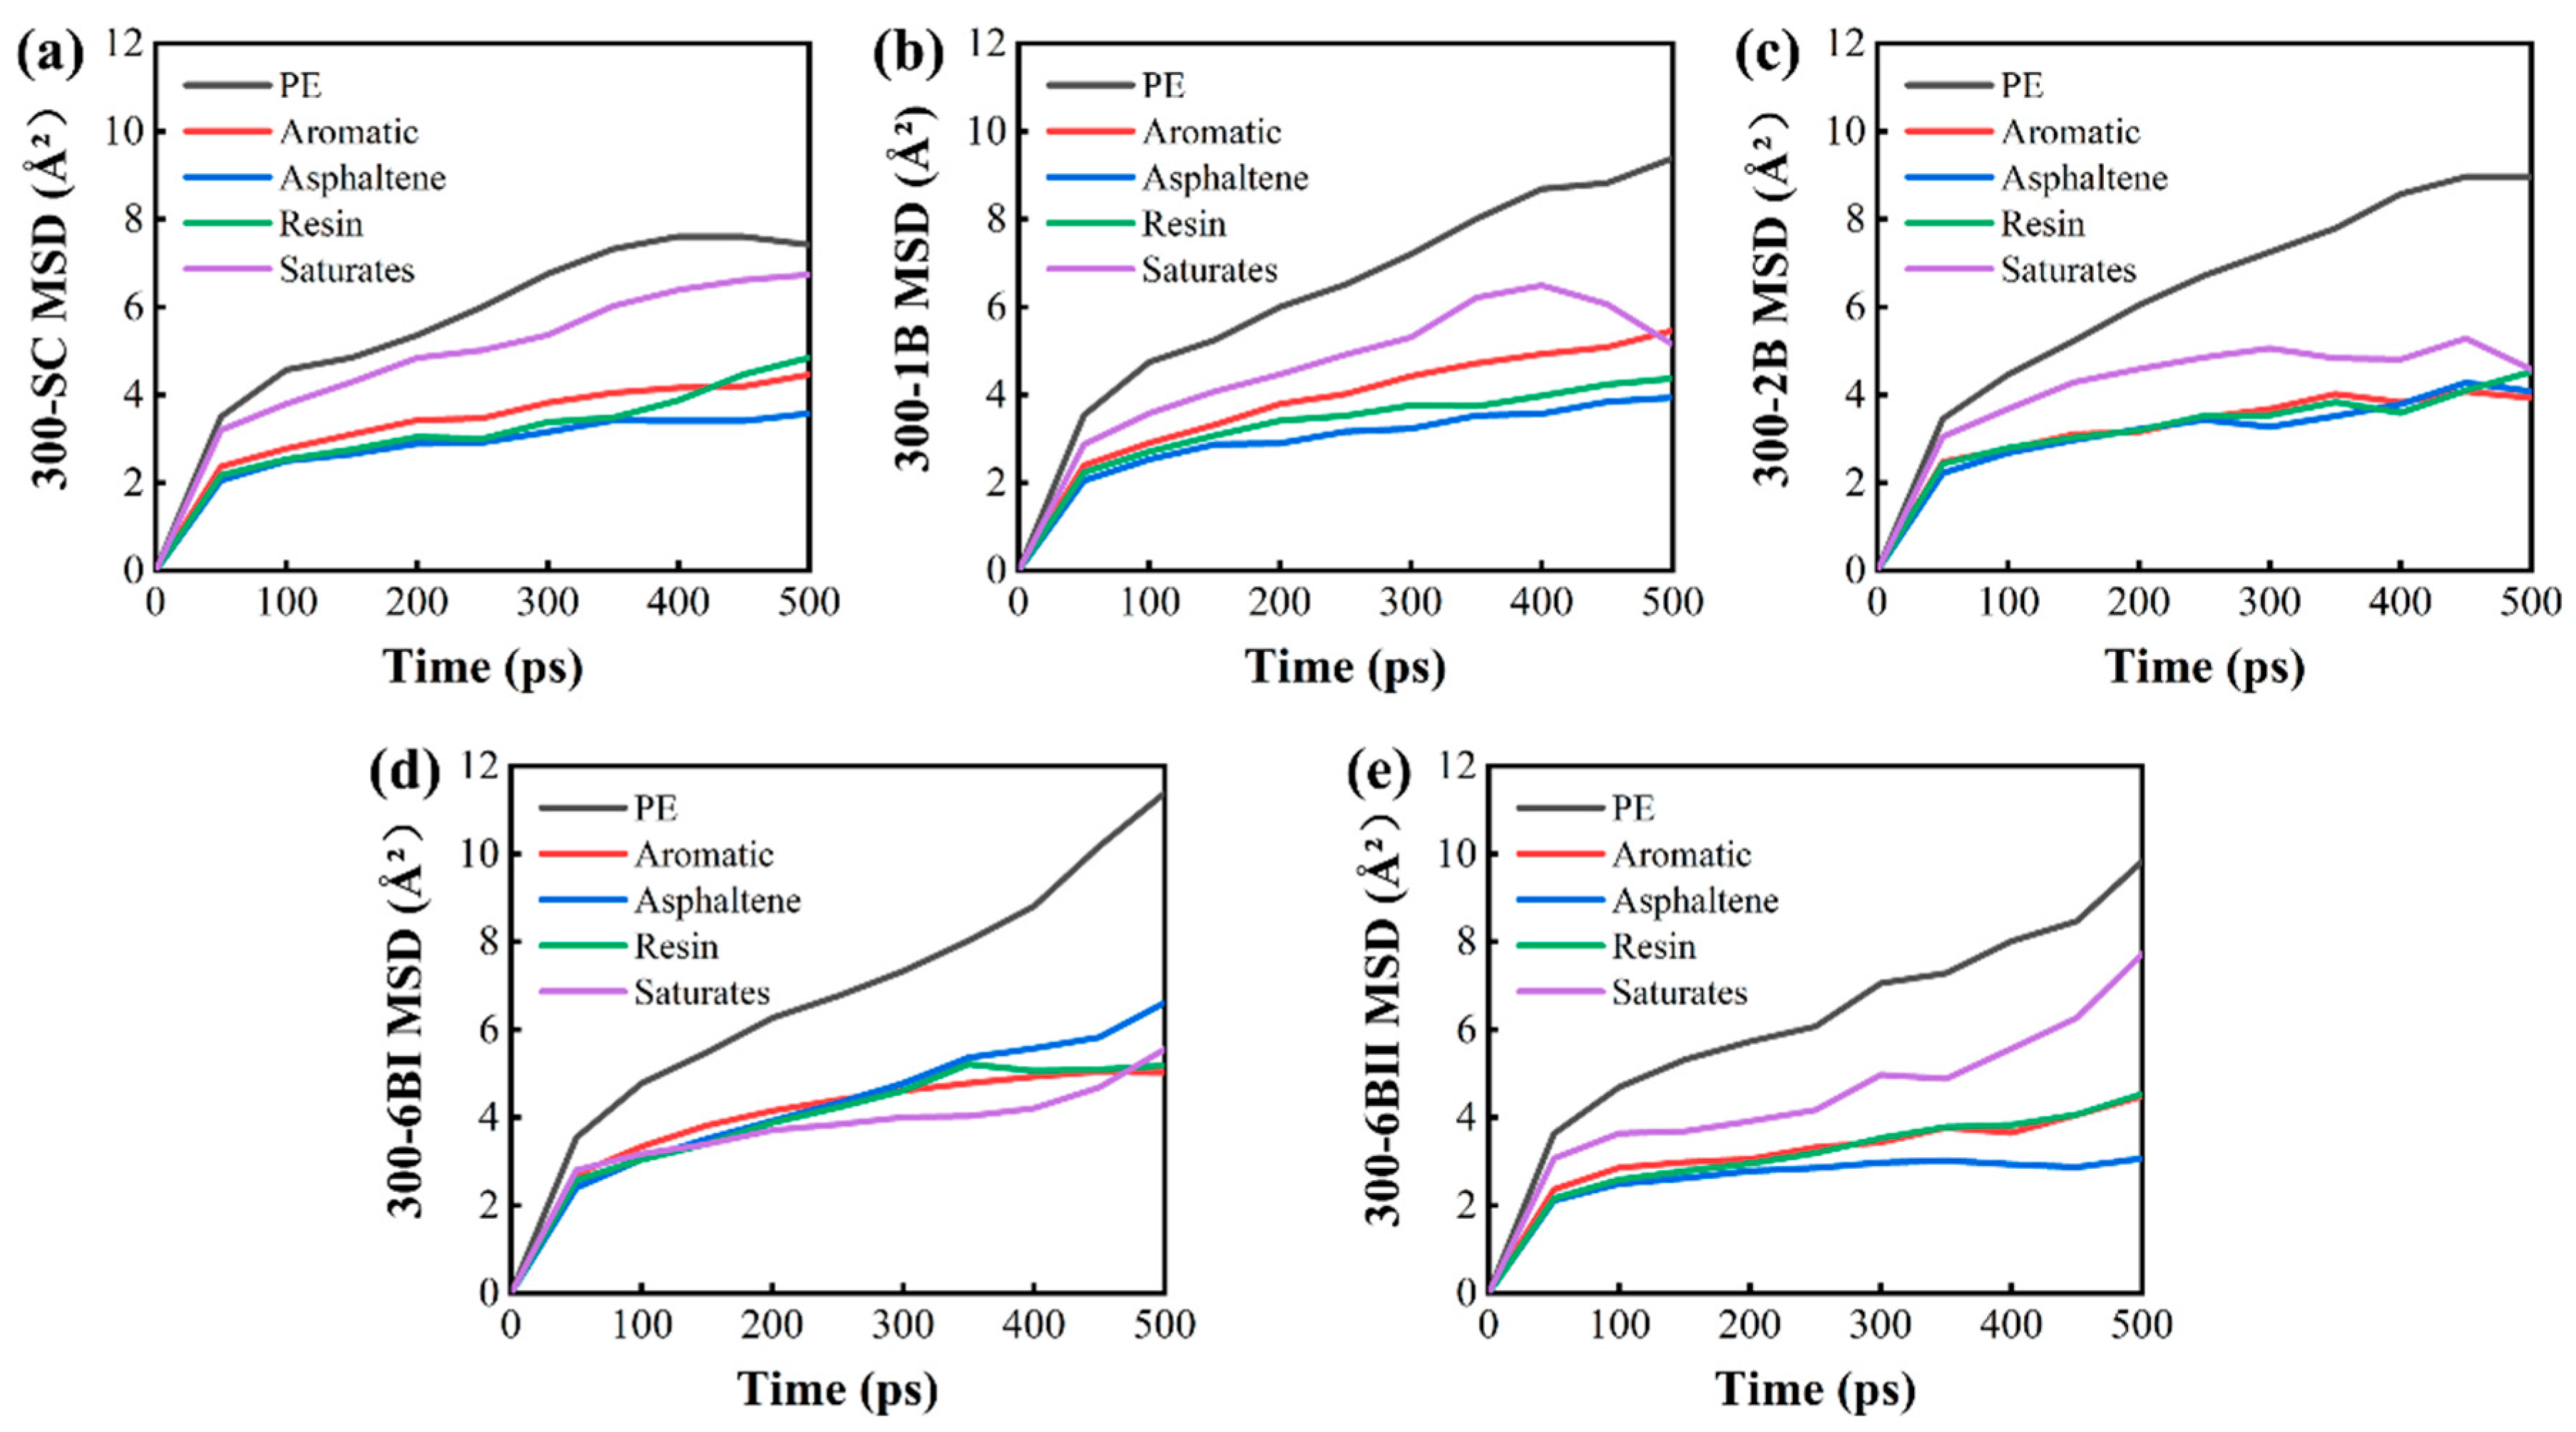
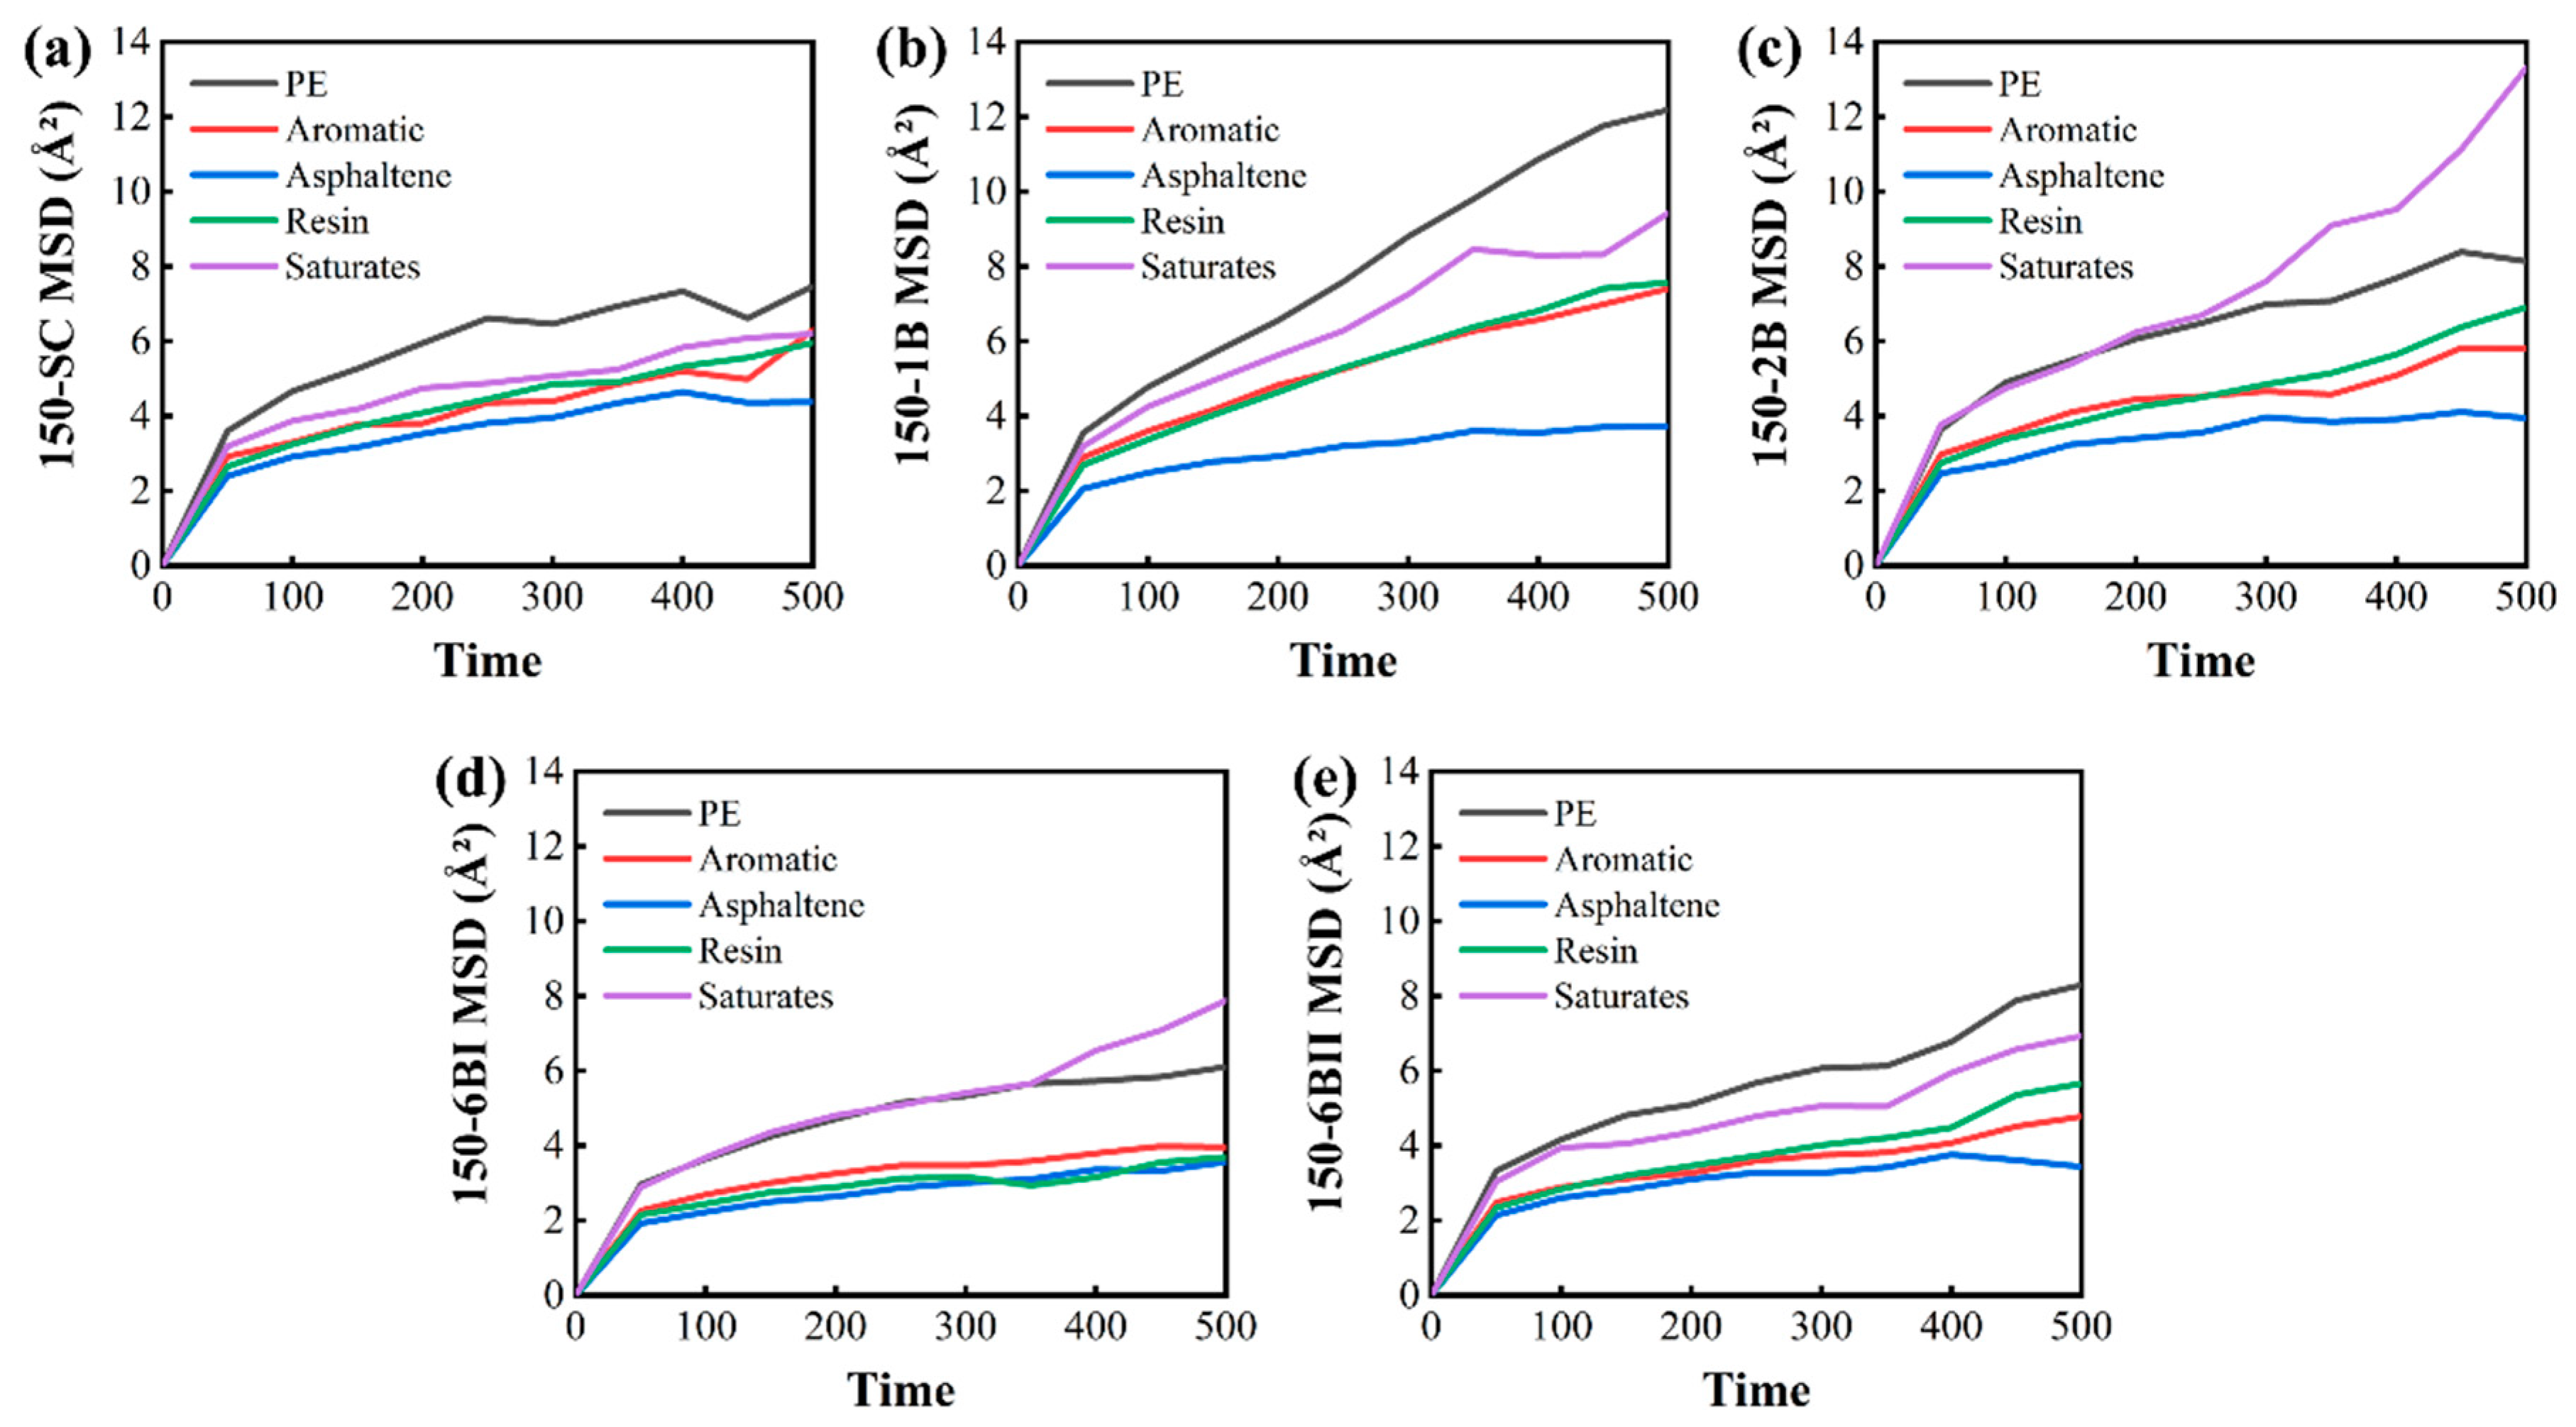
3.5. Mean squared Displacement (MSD) Analysis of PEA Models
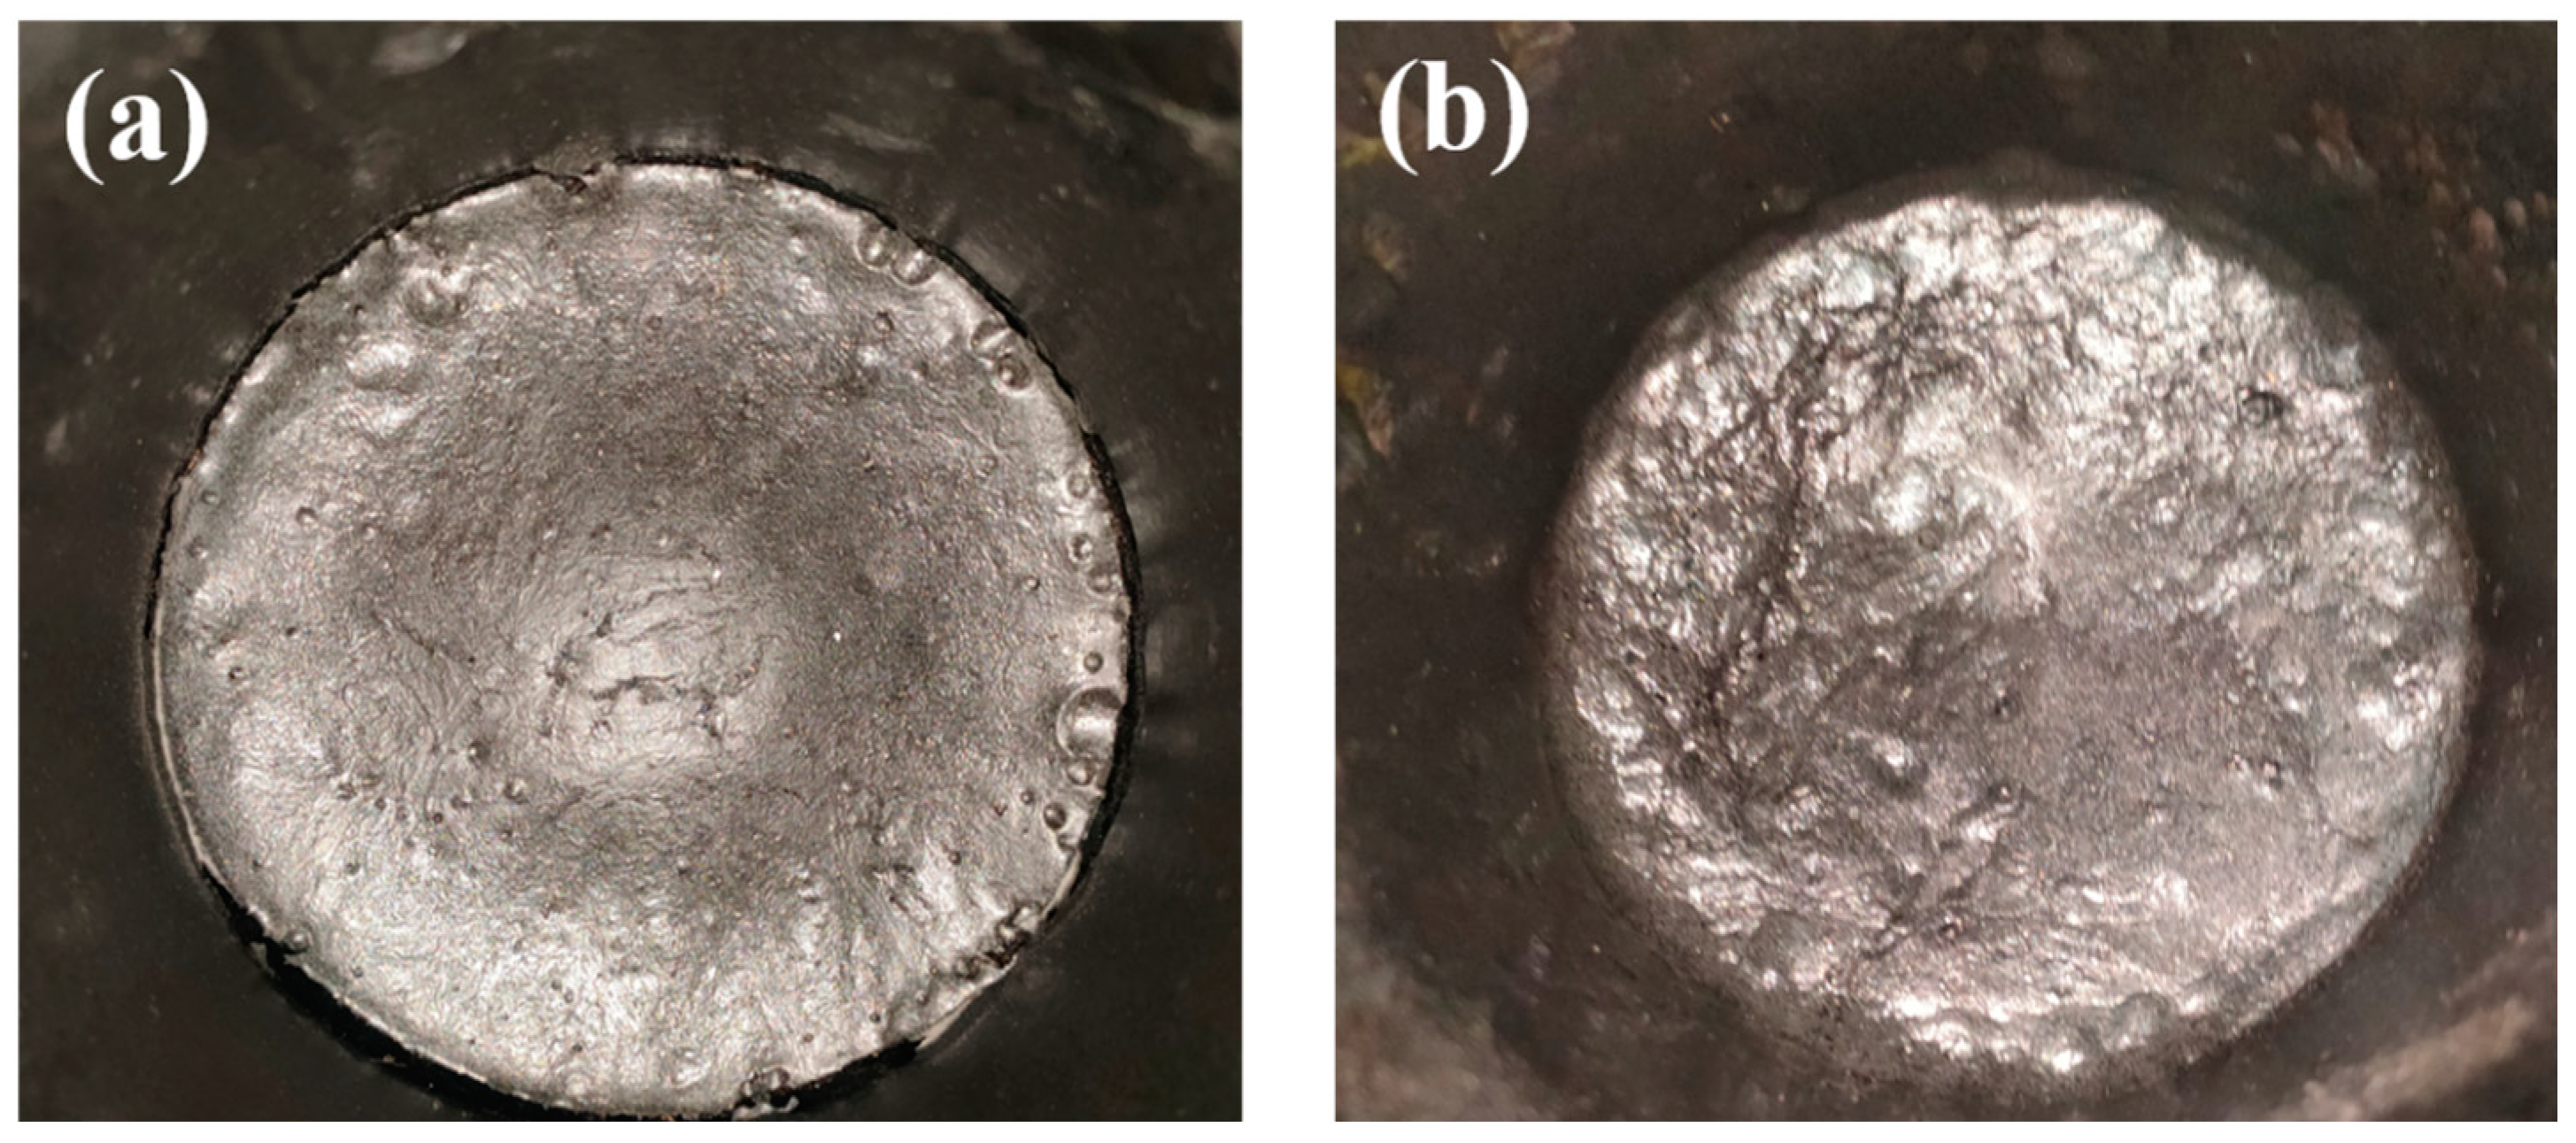
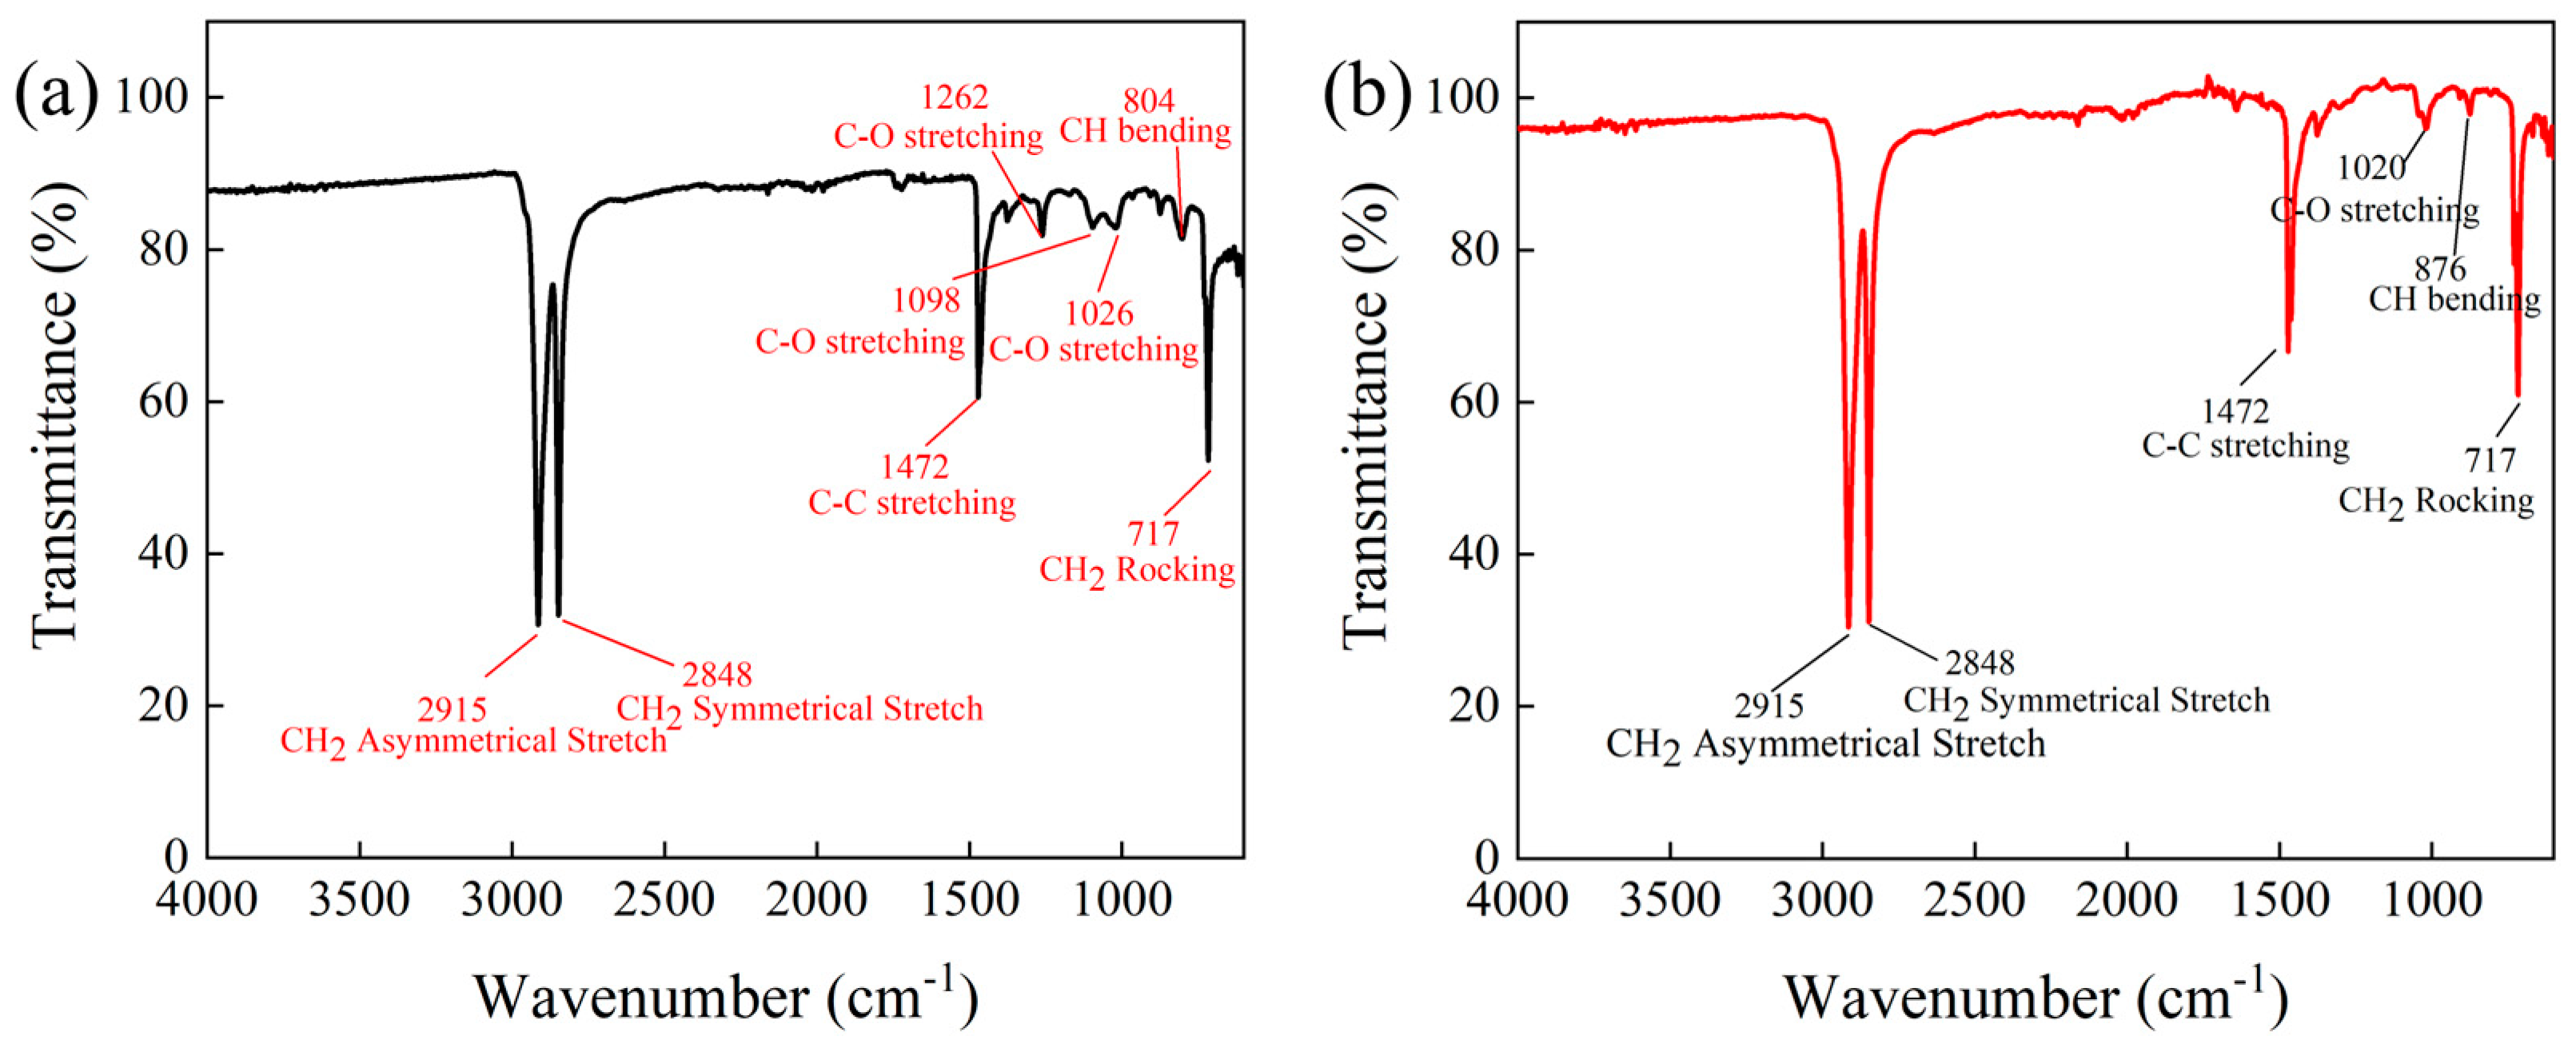
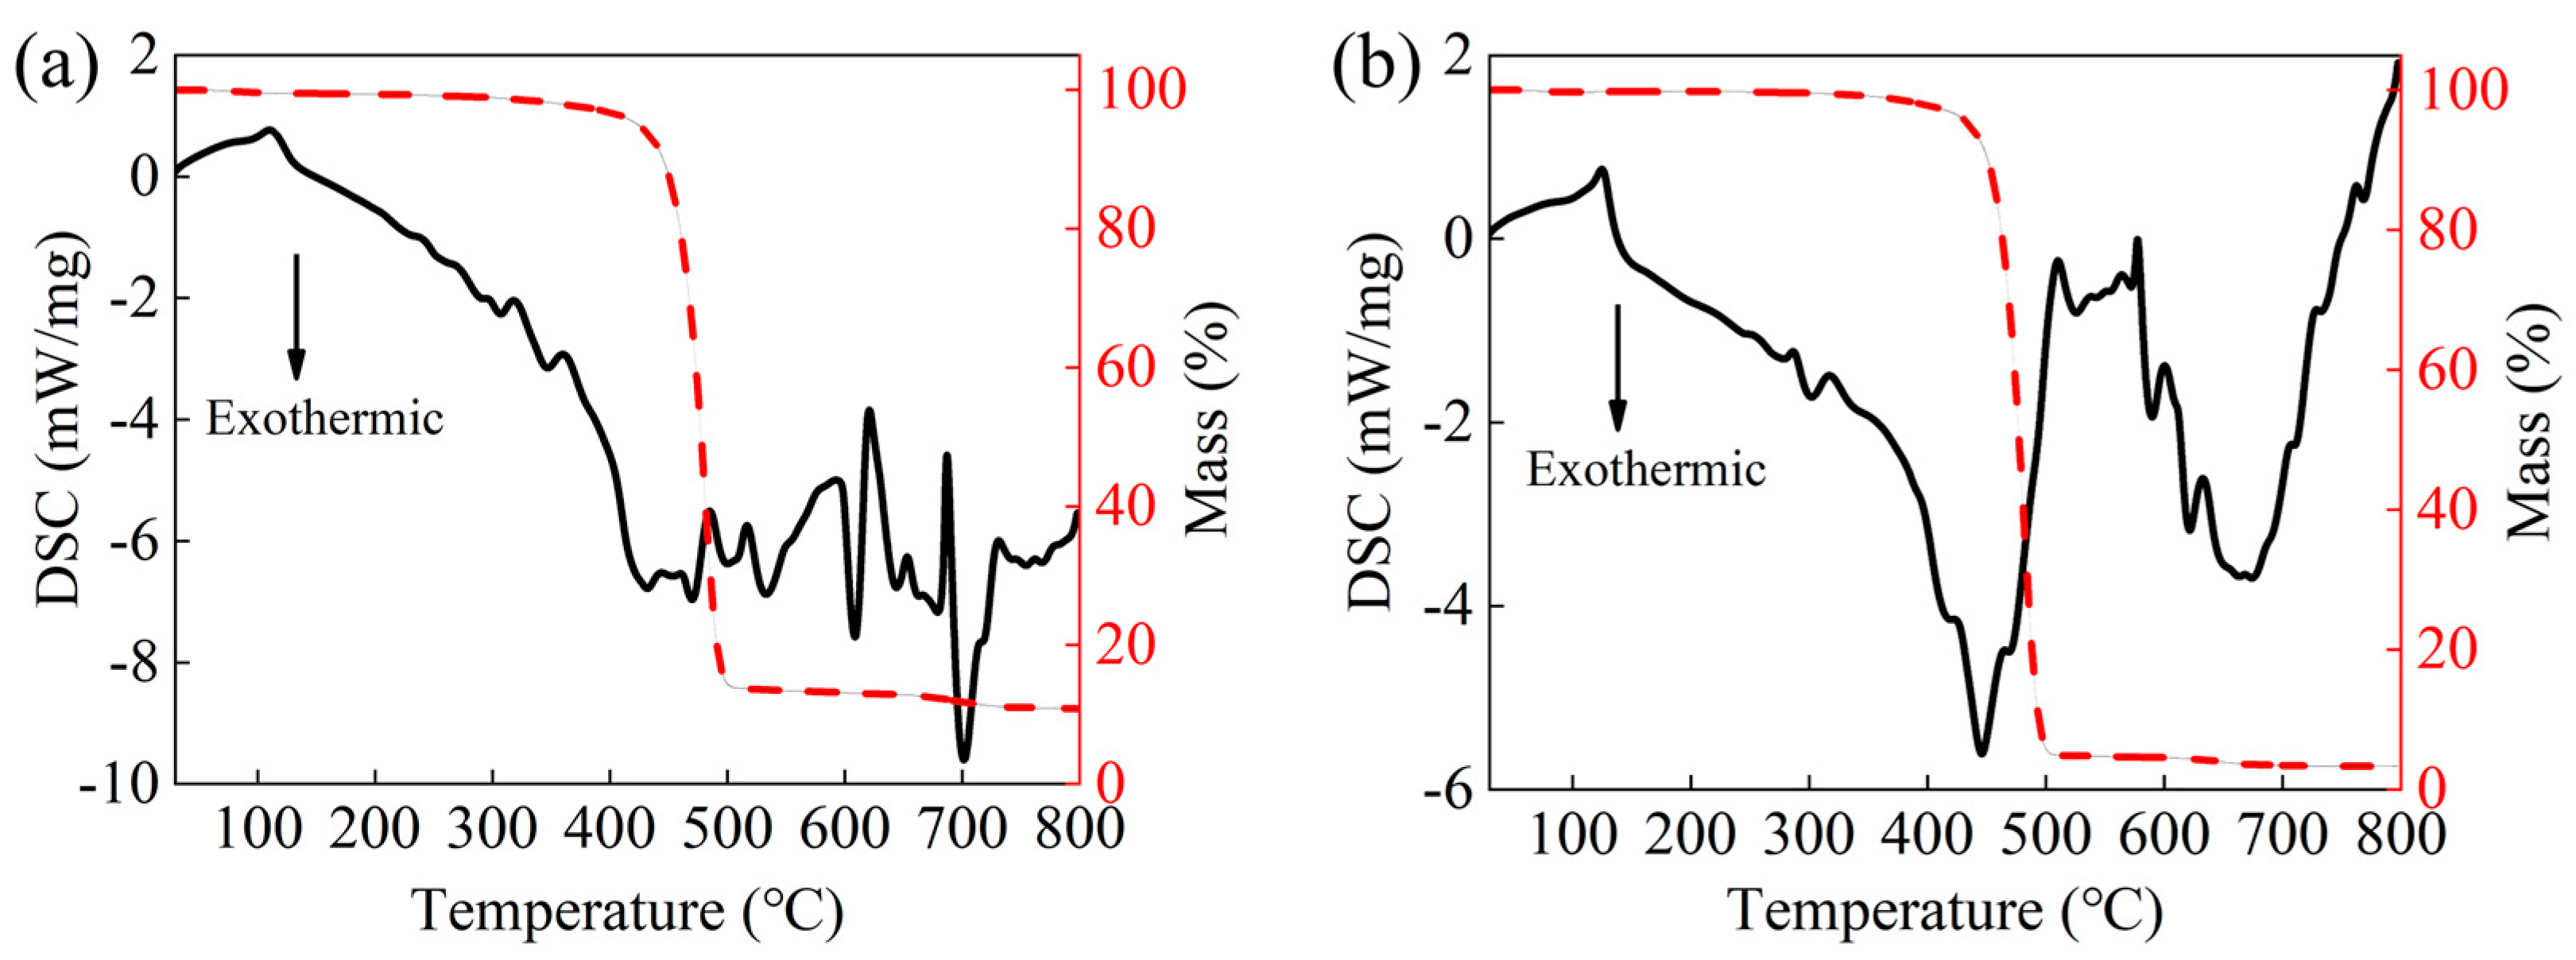
3.6. Experimental Part: Microscopical Analysis of LDPE and PEA
4. Conclusions
- (1)
- The addition of PE can reduce the density of modified asphalt by less than 5%, and a higher density of PEA is associated with lower FVR;
- (2)
- When the FVR is close, the mechanical properties are greatly influenced by the DP and configuration of PE.
- (3)
- The DP and the number of chains are the main parameters impacting the compatibility between PE and asphalt based on the Flory–Huggins parameter analysis. Decreasing the DP of PE (e.g., 50, with a minimum Flory–Huggins parameter and a relative molecular mass of 1300) significantly increases the compatibility between asphalt and PE.
- (4)
- LDPE-2 has better compatibility with asphalt, possibly because LDPE−2 has higher purity.
Author Contributions
Funding
Data Availability Statement
Acknowledgments
Conflicts of Interest
References
- OECD. Global Plastics Outlook: Economic Drivers, Environmental Impacts and Policy Options; OECD: Paris, France, 2022. [Google Scholar]
- Nairobi. From Pollution to Solution: A Global Assessment of Marine Litter and Plastic Pollution; United Nations Environment Programme: Nairobi, Kenya, 2021. [Google Scholar]
- Geyer, R.; Jambeck, J.R.; Law, K.L. Production, use, and fate of all plastics ever made. Sci. Adv. 2017, 3, e1700782. [Google Scholar] [CrossRef] [PubMed]
- Pathak, G.; Nichter, M.; Hardon, A.; Moyer, E.; Latkar, A.; Simbaya, J.; Pakasi, D.; Taqueban, E.; Love, J. Plastic pollution and the open burning of plastic wastes. Glob. Environ. Change 2023, 80, 102648. [Google Scholar] [CrossRef]
- Behera, S.; Das, S. Environmental impacts of microplastic and role of plastisphere microbes in the biodegradation and upcycling of microplastic. Chemosphere 2023, 334, 138928. [Google Scholar] [CrossRef] [PubMed]
- Gowthami, A.; Syed Marjuk, M.; Raju, P.; Nanthini Devi, K.; Santhanam, P.; Dinesh Kumar, S.; Perumal, P. Biodegradation efficacy of selected marine microalgae against Low-Density Polyethylene (LDPE): An environment friendly green approach. Mar. Pollut. Bull. 2023, 190, 114889. [Google Scholar] [CrossRef] [PubMed]
- Nisa, S.A.; Vasantharaja, R.; Supriya, S.; Inbakandan, D.; Dharani, G.; Govindaraju, K. Biodeterioration of polyethylene by jellyfish nematocyst protein. Mar. Pollut. Bull. 2023, 188, 114682. [Google Scholar] [CrossRef] [PubMed]
- Amobonye, A.; Bhagwat, P.; Singh, S.; Pillai, S. Plastic biodegradation: Frontline microbes and their enzymes. Sci. Total Environ. 2021, 759, 143536. [Google Scholar] [CrossRef] [PubMed]
- Polacco, G.; Filippi, S.; Merusi, F.; Stastna, G. A review of the fundamentals of polymer-modified asphalts: Asphalt/polymer interactions and principles of compatibility. Adv. Colloid. Interface Sci. 2015, 224, 72–112. [Google Scholar] [CrossRef] [PubMed]
- Alsolieman, H.A.; Babalghaith, A.M.; Memon, Z.A.; Al-Suhaibani, A.S.; Milad, A. Evaluation and Comparison of Mechanical Properties of Polymer-Modified Asphalt Mixtures. Polymers 2021, 13, 2282. [Google Scholar] [CrossRef]
- Alghrafy, Y.M.; Abd Alla, E.S.M.; El-Badawy, S.M. Rheological properties and aging performance of sulfur extended asphalt modified with recycled polyethylene waste. Constr. Build. Mater. 2021, 273, 121771. [Google Scholar] [CrossRef]
- Radeef, H.R.; Hassan, N.A.; Mahmud, M.Z.H.; Abidin, A.R.Z.; Ismail, C.R.; Abbas, H.F.; Al-Saffar, Z.H. Characterisation of cracking resistance in modified hot mix asphalt under repeated loading using digital image analysis. Theor. Appl. Fract. Mech. 2021, 116, 103130. [Google Scholar] [CrossRef]
- Abed, A.H.; Bahia, H.U. Enhancement of permanent deformation resistance of modified asphalt concrete mixtures with nano-high density polyethylene. Constr. Build. Mater. 2020, 236, 117604. [Google Scholar] [CrossRef]
- Xia, T.; Zhang, A.; Xu, J.; Chen, X.; Xia, X.; Zhu, H.; Li, Y. Rheological behavior of bitumen modified by reclaimed polyethylene and polypropylene from different recycling sources. J. Appl. Polym. Sci. 2021, 138, 50435. [Google Scholar] [CrossRef]
- Kakar, M.R.; Mikhailenko, P.; Piao, Z.; Bueno, M.; Poulikakos, L. Analysis of waste polyethylene (PE) and its by-products in asphalt binder. Constr. Build. Mater. 2021, 280, 122492. [Google Scholar] [CrossRef]
- Polacco, G.; Berlincioni, S.; Biondi, D.; Stastna, J.; Zanzotto, L. Asphalt modification with different polyethylene-based polymers. Eur. Polym. J. 2005, 41, 2831–2844. [Google Scholar] [CrossRef]
- Naskar, M.; Chaki, T.K.; Reddy, K.S. Effect of waste plastic as modifier on thermal stability and degradation kinetics of bitumen/waste plastics blend. Thermochim. Acta 2010, 509, 128–134. [Google Scholar] [CrossRef]
- Fang, C.Q.; Zhang, Y.; Yu, Q.; Zhou, X.; Guo, D.G.; Yu, R.E.; Zhang, M. Preparation, Characterization and Hot Storage Stability of Asphalt Modified by Waste Polyethylene Packaging. J. Mater. Sci. Technol. 2013, 29, 434–438. [Google Scholar] [CrossRef]
- Genet, M.B.; Sendekie, Z.B.; Jembere, A.L. Investigation and optimization of waste LDPE plastic as a modifier of asphalt mix for highway asphalt: Case of Ethiopian roads. Case Stud. Chem. Environ. Eng. 2021, 4, 100150. [Google Scholar] [CrossRef]
- Vasiljevic-Shikaleska, A.; Popovska-Pavlovska, F.; Cimmino, S.; Duraccio, D.; Silvestre, C. Viscoelastic properties and morphological characteristics of polymer-modified bitumen blends. J. Appl. Polym. Sci. 2010, 118, 1320–1330. [Google Scholar] [CrossRef]
- Hong, Z.; Yan, K.; Wang, M.; You, L.; Ge, D. Low-density polyethylene/ethylene–vinyl acetate compound modified asphalt: Optimal preparation process and high-temperature rheological properties. Constr. Build. Mater. 2022, 314, 125688. [Google Scholar] [CrossRef]
- Poulikakos, L.D.; Pasquini, E.; Tusar, M.; Hernando, D.; Wang, D.; Mikhailenko, P.; Pasetto, M.; Baliello, A.; Falchetto, A.C.; Miljkovic, M.; et al. RILEM interlaboratory study on the mechanical properties of asphalt mixtures modified with polyethylene waste. J. Clean. Prod. 2022, 375, 134124. [Google Scholar] [CrossRef]
- Panda, M.; Mazumdar, M. Utilization of reclaimed polyethylene in bituminous paving mixes. J. Mater. Civil. Eng. 2002, 14, 527–530. [Google Scholar] [CrossRef]
- Pe’rez-Lepe, A.; Martı’nez-Boza, F.J.; Gallegos, C. Influence of Polymer Concentration on the Microstructure and Rheological Properties of High-Density Polyethylene (HDPE)-Modified Bitumen. Energy Fuels 2005, 19, 1148–1152. [Google Scholar] [CrossRef]
- Hınıslıoglu, S. Use of waste high density polyethylene as bitumen modifier in asphalt concrete mix. Mater. Lett. 2004, 58, 267–271. [Google Scholar] [CrossRef]
- Zhang, S.-Q.; Wang, W.-Q.; Lin, J.-P.; Wang, L.-Q. Rheological Behaviors of Polymers with Nanoparticles Tethered at Each End. Chin. J. Polym. Sci. 2023. [Google Scholar] [CrossRef]
- Li, M.; Chen, X.; Cong, P.; Luo, C.; Zhu, L.; Li, H.; Zhang, Y.; Chao, M.; Yan, L. Facile synthesis of polyethylene-modified asphalt by chain end-functionalization. Compos. Commun. 2022, 30, 101088. [Google Scholar] [CrossRef]
- Li, M.R.; Luo, C.J.; Zhu, L.Y.; Li, H.Y.; Cong, P.L.; Feng, Y.Y.; Yan, L.K. A novel epoxy-terminated polyethylene modified asphalt with low-viscosity and high storage stability. Constr. Build. Mater. 2022, 335, 127473. [Google Scholar] [CrossRef]
- Ma, D.C.; Zhao, D.J.; Zhao, J.Z.; Du, S.J.; Pang, J.Y.; Wang, W.; Fan, C.X. Functionalization of reclaimed polyethylene with maleic anhydride and its application in improving the high temperature stability of asphalt mixtures. Constr. Build. Mater. 2016, 113, 596–602. [Google Scholar] [CrossRef]
- Vargas, M.A.; Vargas, M.A.; Sánchez-Sólis, A.; Manero, O. Asphalt/polyethylene blends: Rheological properties, microstructure and viscosity modeling. Constr. Build. Mater. 2013, 45, 243–250. [Google Scholar] [CrossRef]
- Li, M.; Luo, C.; Zhu, L.; Cong, P.; Li, H.; Chen, X.; Zhang, Y.; Chao, M.; Yan, L. Polyethylene based on molecular weight design for eco-friendly asphalt. J. Appl. Polym. Sci. 2023, 140, 53994. [Google Scholar] [CrossRef]
- González, O.; Muñoz, M.E.; Santamaría, A. Bitumen/polyethylene blends: Using m-LLDPEs to improve stability and viscoelastic properties. Rheol. Acta 2006, 45, 603–610. [Google Scholar] [CrossRef]
- Yan, L.K.; Li, M.R.; Li, Q.; Li, H.Y. Modified asphalt based on polyethylene with broad molecular weight distribution. Constr. Build. Mater. 2020, 260, 119707. [Google Scholar] [CrossRef]
- Liang, M.; Xin, X.; Fan, W.; Zhang, J.; Jiang, H.; Yao, Z. Comparison of rheological properties and compatibility of asphalt modified with various polyethylene. Int. J. Pavement Eng. 2021, 22, 11–20. [Google Scholar] [CrossRef]
- González-Aguirre, P.; Medina-Torres, L.; Schrauwen, C.; Fonteix, C.; Pla, F.; Herrera-Nájera, R. Morphology and rheological behavior of maltene–polymer blends. I. Effect of partial hydrogenation of poly(styrene-block-butadiene-block-styrene-block)-type copolymers. J. Appl. Polym. Sci. 2009, 112, 1330–1344. [Google Scholar] [CrossRef]
- Xu, D.; Wan, H.-X.; Yao, X.-R.; Li, J.; Yan, L.-T. Molecular Simulations in Macromolecular Science. Chin. J. Polym. Sci. 2023, 41, 1361–1370. [Google Scholar] [CrossRef]
- Li, D.D.; Greenfield, M.L. Chemical compositions of improved model asphalt systems for molecular simulations. Fuel 2014, 115, 347–356. [Google Scholar] [CrossRef]
- Dan, H.-C.; Zou, Z.-M.; Zhang, Z.; Tan, J.-W. Effects of aggregate type and SBS copolymer on the interfacial heat transport ability of asphalt mixture using molecular dynamics simulation. Constr. Build. Mater. 2020, 250, 118922. [Google Scholar] [CrossRef]
- Li, R.; Leng, Z.; Yang, J.; Lu, G.; Huang, M.; Lan, J.; Zhang, H.; Bai, Y.; Dong, Z. Innovative application of waste polyethylene terephthalate (PET) derived additive as an antistripping agent for asphalt mixture: Experimental investigation and molecular dynamics simulation. Fuel 2021, 300, 121015. [Google Scholar] [CrossRef]
- Hu, K.; Yu, C.H.; Yang, Q.L.; Li, Z.W.; Zhang, W.G.; Zhang, T.L.; Feng, Y. Mechanistic study of graphene reinforcement of rheological performance of recycled polyethylene modified asphalt: A new observation from molecular dynamics simulation. Constr. Build. Mater. 2022, 320, 126263. [Google Scholar] [CrossRef]
- Chen, P.; Hu, K.; Caihua, Y.; Yuan, D.; Ban, X. Study of the Microscopic Mechanism of Natural Rubber (Cis-1, 4-Polyisoprene, NR)/Polyethylene (PE) Modified Asphalt from the Perspective of Simulation. Polymers 2022, 14, 4087. [Google Scholar] [CrossRef]
- Ge, D.D.; Yan, K.Z.; You, Z.P.; Xu, H.B. Modification mechanism of asphalt binder with waste tire rubber and recycled polyethylene. Constr. Build. Mater. 2016, 126, 66–76. [Google Scholar] [CrossRef]
- Jones, D.R. SHRP Materials Reference Library: Asphalt Cements: A Concise Data Compilation; Strategic Highway Research Program, National Research Council: Washington, DC, USA, 1993. [Google Scholar]
- Du, J.; Jin, Y.; Hou, S.; Jin, R.; Wang, Q. Effect of component characteristics on mechanical properties of asphalt: A molecular dynamics study. Case Stud. Constr. Mater. 2023, 18, e02007. [Google Scholar] [CrossRef]
- Hill, R. The Elastic Behaviour of a Crystalline Aggregate. Proc. Phys. Soc. A 1952, 65, 349–354. [Google Scholar] [CrossRef]
- Connolly, M.L. Analytical molecular surface calculation. J. Appl. Crystallogr. 1983, 16, 548. [Google Scholar] [CrossRef]
- Long, Z.; Zhou, S.; Jiang, S.; Ma, W.; Ding, Y.; You, L.; Tang, X.; Xu, F. Revealing compatibility mechanism of nanosilica in asphalt through molecular dynamics simulation. J. Mol. Model. 2021, 27, 81. [Google Scholar] [CrossRef]
- Luo, L.; Chu, L.; Fwa, T.F. Molecular dynamics analysis of oxidative aging effects on thermodynamic and interfacial bonding properties of asphalt mixtures. Constr. Build. Mater. 2021, 269, 121299. [Google Scholar] [CrossRef]
- Martinez de Arenaza, I.; Meaurio, E.; Coto, B.; Sarasua, J.-R. Molecular dynamics modelling for the analysis and prediction of miscibility in polylactide/polyvinilphenol blends. Polymer 2010, 51, 4431–4438. [Google Scholar] [CrossRef]
- Jawalkar, S.S.; Raju; Halligudi, S.B.; Sairam, M.; Aminabhavi, T.M. Molecular Modeling Simulations to Predict Compatibility of Poly(vinyl alcohol) and Chitosan Blends: A Comparison with Experiments. J. Phys. Chem. B 2007, 111, 2431–2439. [Google Scholar] [CrossRef]
- SB/T 11149-2015; Technical specifications of waste plastics collection and sorting. Ministry of Commerce: Beijing, China, 2015.
- Zhang, F.; Hu, C. The research for crumb rubber/waste plastic compound modified asphalt. J. Therm. Anal. Calorim. 2015, 124, 729–741. [Google Scholar] [CrossRef]
- Du, Z.; Jiang, C.; Yuan, J.; Xiao, F.; Wang, J. Low temperature performance characteristics of polyethylene modified asphalts—A review. Constr. Build. Mater. 2020, 264, 120704. [Google Scholar] [CrossRef]
- Sridharan, R.; Krishnaswamy, V.G.; Kumar, P.S. Analysis and microbial degradation of Low-Density Polyethylene (LDPE) in Winogradsky column. Environ. Res. 2021, 201, 111646. [Google Scholar] [CrossRef]
- Taghavi, N.; Singhal, N.; Zhuang, W.-Q.; Baroutian, S. Degradation of plastic waste using stimulated and naturally occurring microbial strains. Chemosphere 2021, 263, 127975. [Google Scholar] [CrossRef] [PubMed]
- Evdokimov, I.N.; Fesan, A.A.; Losev, A.P. New Answers to the Optical Interrogation of Asphaltenes: Monomers and Primary Aggregates from Steady-State Fluorescence Studies. Energy Fuels 2016, 30, 4494–4503. [Google Scholar] [CrossRef]
- Schneider, C.A.; Rasband, W.S.; Eliceiri, K.W. NIH Image to ImageJ: 25 years of image analysis. Nat. Methods 2012, 9, 671–675. [Google Scholar] [CrossRef] [PubMed]


| Chain Type | Label | Chain Type |
|---|---|---|
| Single chain | SC |  |
| One branch | 1B |  |
| Two branches | 2B |  |
| Six branches distributed non-staggered | 6BI | 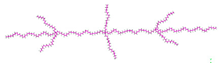 |
| Six branches distributed staggered | 6BII |  |
| Combination | Degree of Polymerization (DP) | Number of Chains (CN) | Number of Branches (BN) | Branch Chain Ratio (%) |
|---|---|---|---|---|
| 900-SC | 900 | 1 | 0 | 0 |
| 600-SC | 600 | 1 | 0 | 0 |
| 300-SC | 300 | 1 | 0 | 0 |
| 300-1B | 1 | 3.3 | ||
| 300-2B | 2 | 6.6 | ||
| 300-6BI | 6 | 20 | ||
| 300-6BII | 6 | 20 | ||
| 150-SC | 150 | 2 | 0 | 0 |
| 150-1B | 1 | 6.6 | ||
| 150-2B | 2 | 13.3 | ||
| 150-6BI | 6 | 40 | ||
| 150-6BII | 6 | 40 | ||
| 100-SC | 100 | 3 | 0 | 0 |
| 100-1B | 1 | 10 | ||
| 100-2B | 2 | 20 | ||
| 100-6BI | 6 | 60 | ||
| 50-SC | 50 | 6 | 0 | 0 |
| 50-1B | 1 | 20 | ||
| 50-2B | 2 | 40 |
| Pure PE, AAA-1 and PEA Models with Different Chain Types | Bulk Modulus, B (GPa) | Shear Modulus, G (GPa) | Young’s Modulus, E (GPa) |
|---|---|---|---|
| 900PE | 2.844 | 0.715 | 1.979 |
| 300PE-3B | 2.827 | 0.724 | 2.001 |
| AAA-1 | 3.103 | 0.666 | 1.864 |
| 900-SC | 2.509 | 0.570 | 1.589 |
| 600-SC | 3.006 | 0.531 | 1.505 |
| 300-SC | 3.165 | 0.779 | 2.159 |
| 300-1B | 2.947 | 0.651 | 1.819 |
| 300-2B | 3.110 | 0.731 | 2.035 |
| 300-6BI | 2.992 | 0.726 | 2.014 |
| 300-6BII | 3.172 | 0.833 | 2.297 |
| 150-SC | 3.044 | 0.650 | 1.822 |
| 150-1B | 2.947 | 0.736 | 2.038 |
| 150-2B | 2.732 | 0.692 | 1.914 |
| 150-6BI | 2.824 | 0.529 | 1.495 |
| 150-6BII | 2.983 | 0.600 | 1.688 |
| 100-SC | 3.048 | 0.545 | 1.542 |
| 100-1B | 3.139 | 0.803 | 2.220 |
| 100-2B | 3.062 | 0.680 | 1.898 |
| 100-6BI | 3.014 | 0.649 | 1.817 |
| 50-SC | 2.983 | 0.734 | 2.035 |
| 50-1B | 3.087 | 0.755 | 2.095 |
| 50-2B | 2.843 | 0.631 | 1.763 |
| AAA-1 and PEA Models with Different Chain Types | Occupied Volume (Å3) | Free Volume (Å3) | Free Volume Ratio (%) |
|---|---|---|---|
| AAA-1 | 45,096.22 | 8521.84 | 15.89 |
| 900-SC | 175,207.85 | 48,425.93 | 21.65 |
| 600-SC | 117,243.81 | 25,963.81 | 18.13 |
| 300-SC | 58,714.22 | 11,571.54 | 16.46 |
| 300-1B | 58,756.04 | 11,908.56 | 16.85 |
| 300-2B | 58,888.77 | 11,868.92 | 16.77 |
| 300-6BI | 58,792.02 | 12,181.74 | 17.16 |
| 300-6BII | 58,847.59 | 11,463.19 | 16.30 |
| 150-SC | 58,832.58 | 12,398.53 | 17.41 |
| 150-1B | 58,630.93 | 12,060.54 | 17.06 |
| 150-2B | 58,910.91 | 12,260.21 | 17.23 |
| 150-6BI | 58,736.90 | 12,188.74 | 17.19 |
| 150-6BII | 58,722.66 | 11,901.67 | 16.85 |
| 100-SC | 58,713.87 | 12,131.01 | 17.12 |
| 100-1B | 58,660.03 | 11,251.54 | 16.09 |
| 100-2B | 58,899.58 | 11,715.55 | 16.59 |
| 100-6BI | 58,702.49 | 12,054.54 | 17.04 |
| 50-SC | 59,035.95 | 11,969.21 | 16.86 |
| 50-1B | 58,638.13 | 12,540.28 | 17.62 |
| 50-2B | 58,901.69 | 12,055.43 | 16.99 |
Disclaimer/Publisher’s Note: The statements, opinions and data contained in all publications are solely those of the individual author(s) and contributor(s) and not of MDPI and/or the editor(s). MDPI and/or the editor(s) disclaim responsibility for any injury to people or property resulting from any ideas, methods, instructions or products referred to in the content. |
© 2024 by the authors. Licensee MDPI, Basel, Switzerland. This article is an open access article distributed under the terms and conditions of the Creative Commons Attribution (CC BY) license (https://creativecommons.org/licenses/by/4.0/).
Share and Cite
Jin, Y.; Li, H.; Chen, J.; Wang, Q.; Bao, Y.; Hou, S. Microscopic Properties of Asphalt and Polyethylene at an Extraordinary High Dosage through Molecular Dynamics Simulation. Buildings 2024, 14, 164. https://doi.org/10.3390/buildings14010164
Jin Y, Li H, Chen J, Wang Q, Bao Y, Hou S. Microscopic Properties of Asphalt and Polyethylene at an Extraordinary High Dosage through Molecular Dynamics Simulation. Buildings. 2024; 14(1):164. https://doi.org/10.3390/buildings14010164
Chicago/Turabian StyleJin, Yuye, Haoyi Li, Jie Chen, Qianqian Wang, Yanhua Bao, and Shuguang Hou. 2024. "Microscopic Properties of Asphalt and Polyethylene at an Extraordinary High Dosage through Molecular Dynamics Simulation" Buildings 14, no. 1: 164. https://doi.org/10.3390/buildings14010164
APA StyleJin, Y., Li, H., Chen, J., Wang, Q., Bao, Y., & Hou, S. (2024). Microscopic Properties of Asphalt and Polyethylene at an Extraordinary High Dosage through Molecular Dynamics Simulation. Buildings, 14(1), 164. https://doi.org/10.3390/buildings14010164