Article

Investigation of Medium-Term Performance of Porous Asphalt and Its Impacts on Tire/Pavement Noise

1
Key Laboratory of Transport Industry of Road Structure and Material, Research Institute of Highway Ministry of Transport, Xitucheng Road No. 8, Beijing 100088, China
2
Jiangsu Expressway Engineering Maintenance Limited Company, Shantou Road No. 2, Huai’an 223000, China
3
School of Civil and Transportation Engineering, Beijing University of Civil Engineering and Architecture, Beijing 100044, China
*
Authors to whom correspondence should be addressed.
Buildings 2024, 14(1), 64; https://doi.org/10.3390/buildings14010064
Submission received: 28 November 2023 / Revised: 21 December 2023 / Accepted: 22 December 2023 / Published: 25 December 2023

Abstract

:
To assess the medium-term performance of porous asphalt pavement during service and its influence on tire/pavement noise level, a seven-year continuous observation and data analysis study was conducted. Key performance indicators were measured and calculated by using automated pavement technology testing equipment. The noise levels were tested by using the on-board sound intensity (OBSI) method on three types of porous asphalt pavements (PUC-10, PAC-13, and PUC-10 + PAC-13) and one dense thin layer course (DTC) for comparison. The findings indicated that the Damage Rate (DR) and Surface Friction Coefficient (SFC) of porous asphalt pavements diminished greatly over time, while the International Roughness Index (IRI) and Rut Depth (RD) remained relatively stable. The two-layer porous asphalt pavement showed the largest noise reduction over the medium-term. Compared to DTC, the OBSI noise levels of these structures were lower by 2.09 dB, 1.53 dB, and 2.88 dB, respectively. The OBSI was found to be closely correlated with the SFC, IRI, test speed, lane, and pavement type. The RD had a notable effect on the OBSI in PUC-10 pavements. In PUC-10 + PAC-13 pavements, a significant linear relationship was observed between the OBSI and SFC. This is mainly because of the polishing of the coarse aggregates, which leads to micro-texture reduction, high frequency noise increase, and SFC decrease. This study makes a valuable contribution to understanding the laws of porous asphalt pavement performance changes and the relationship between tire/pavement noise and pavement characteristics.

1. Introduction

With good drainage and noise reduction characteristics, porous asphalt is commonly used for safety improvement and traffic noise mitigation [1,2,3]. Affected by factors such as vehicle loading and the environment, distresses will gradually appear and develop in the pavement. Raveling is the typical distress of porous asphalt pavements [4]. When coarse aggregates are stripped off from the surface, there will be changes in the surface texture at the macro level, which leads to an increase in the vibration of rolling on the pavement. Therefore, the noise emission level between the tire and pavement is also increased according to the generation mechanisms of tire/pavement noise, especially for noise in the low-frequency ranges (500~800 Hz) [5].
Tire/pavement noise varies with the aggregate type, gradation, asphalt, and porosity, and the density of the asphalt mixture of the pavement [6,7,8]. There is a particular linear relationship between the gradation of low-noise asphalt pavement, the porosity of the mixture, the construction depth, and the noise value of the close proximity method (CPX) [9,10]. Tires with different tread patterns and structures will generate various levels and frequencies of noise on the same pavement [11]. Many studies have revealed that porosity is the most critical factor for the noise reduction of porous asphalt, followed by the surface texture depth and mechanical impedance [12]. The aggregate particle size also significantly impacts the noise reduction performance, and 9.5 mm particles show the greatest effect, followed by 1.18 mm and 2.36 mm particles. Thinner porous asphalt layers using finer aggregate generally have a higher peak frequency of the noise absorption coefficient and vice versa [13]. Adding materials such as plastic and rubber in a certain proportion to the asphalt pavement can effectively improve the noise reduction performance of the asphalt pavement by changing its mechanical impedance [14,15].
The porosity of an asphalt mixture can be measured by using CT scanning and X-ray tomography, thus acquiring the microscopic characteristics of the asphalt mixture, the degradation law of the porosity, and the noise absorption coefficient of the mixture [16,17,18,19,20]. The relationship between the length of the connected pores and the pavement thickness can be quantified through the effect of airflow velocity on the flow resistance and the measured spectrum of the noise absorption coefficient. By improving the Zwikiker–Kosten model in combination with an indoor test of the noise absorption coefficient of the asphalt mixture, the noise absorption performance of the porous asphalt mixture can be predicted [21]. Methods such as surface texture level evaluations of the mixture, tire-dropping assays, and pendulum tests can effectively predict the tire/pavement noise of porous asphalt pavement [22]. With the influences of pavement aging, vehicle load, and environmental effects, the pores of porous asphalt pavement will be gradually blocked, resulting in a change in noise absorption frequency and a significant reduction in noise absorption performance [23].
In China, the service performance of pavement in use is mainly evaluated by the pavement quality index (PQI). The PQI is calculated from indicators including the pavement condition index (PCI), riding quality index (RQI), rutting depth index (RDI), pavement wear index (PWI), and skidding resistance index (SRI), and these indicators are considered as references for pavement maintenance decision-making [24,25,26,27]. However, no special indicator reflects the raveling of porous asphalt pavements. Rapid and non-destructive recognition of raveling is necessary for decision-making on maintaining porous asphalt pavements. Data collection and automatic methods are available to detect asphalt pavement macrostructures based on tire/pavement noise signals [28].
Before 2015, the application of porous asphalt pavement in China was relatively limited. However, after this time, with the adoption of expressway maintenance projects in provinces like Jiangsu Province, Hunan Province, etc., porous asphalt became popular due to its safety and environment-friendly characteristics. In recent years, research on porous asphalt pavement mainly focused on the influences of materials, such as the binders and fibers of porous asphalt, by laboratory testing. There has been less research on the performance degradation and medium-term noise reduction performance of porous asphalt pavement in practical engineering projects in China [29,30,31]. In order to fully study the performance changes of actual porous asphalt pavement in use in China, continuous pavement performance measurements, including DR, RD, IRI, and SFC, were carried out for 7 years, and tire/pavement noise data were also collected in 2022. Consequently, the medium-term performance variation tendencies of porous asphalt pavement were obtained. Correlations between these performance indicators and noise level values were investigated, and the possibility of using the tire/pavement noise level for the evaluation of raveling damage of porous asphalt pavement was explored in this way. This study makes a valuable contribution to understanding the laws of porous asphalt pavement performance changes and the relationship between tire/pavement noise and pavement characteristics.

2. Test Sections and Methods
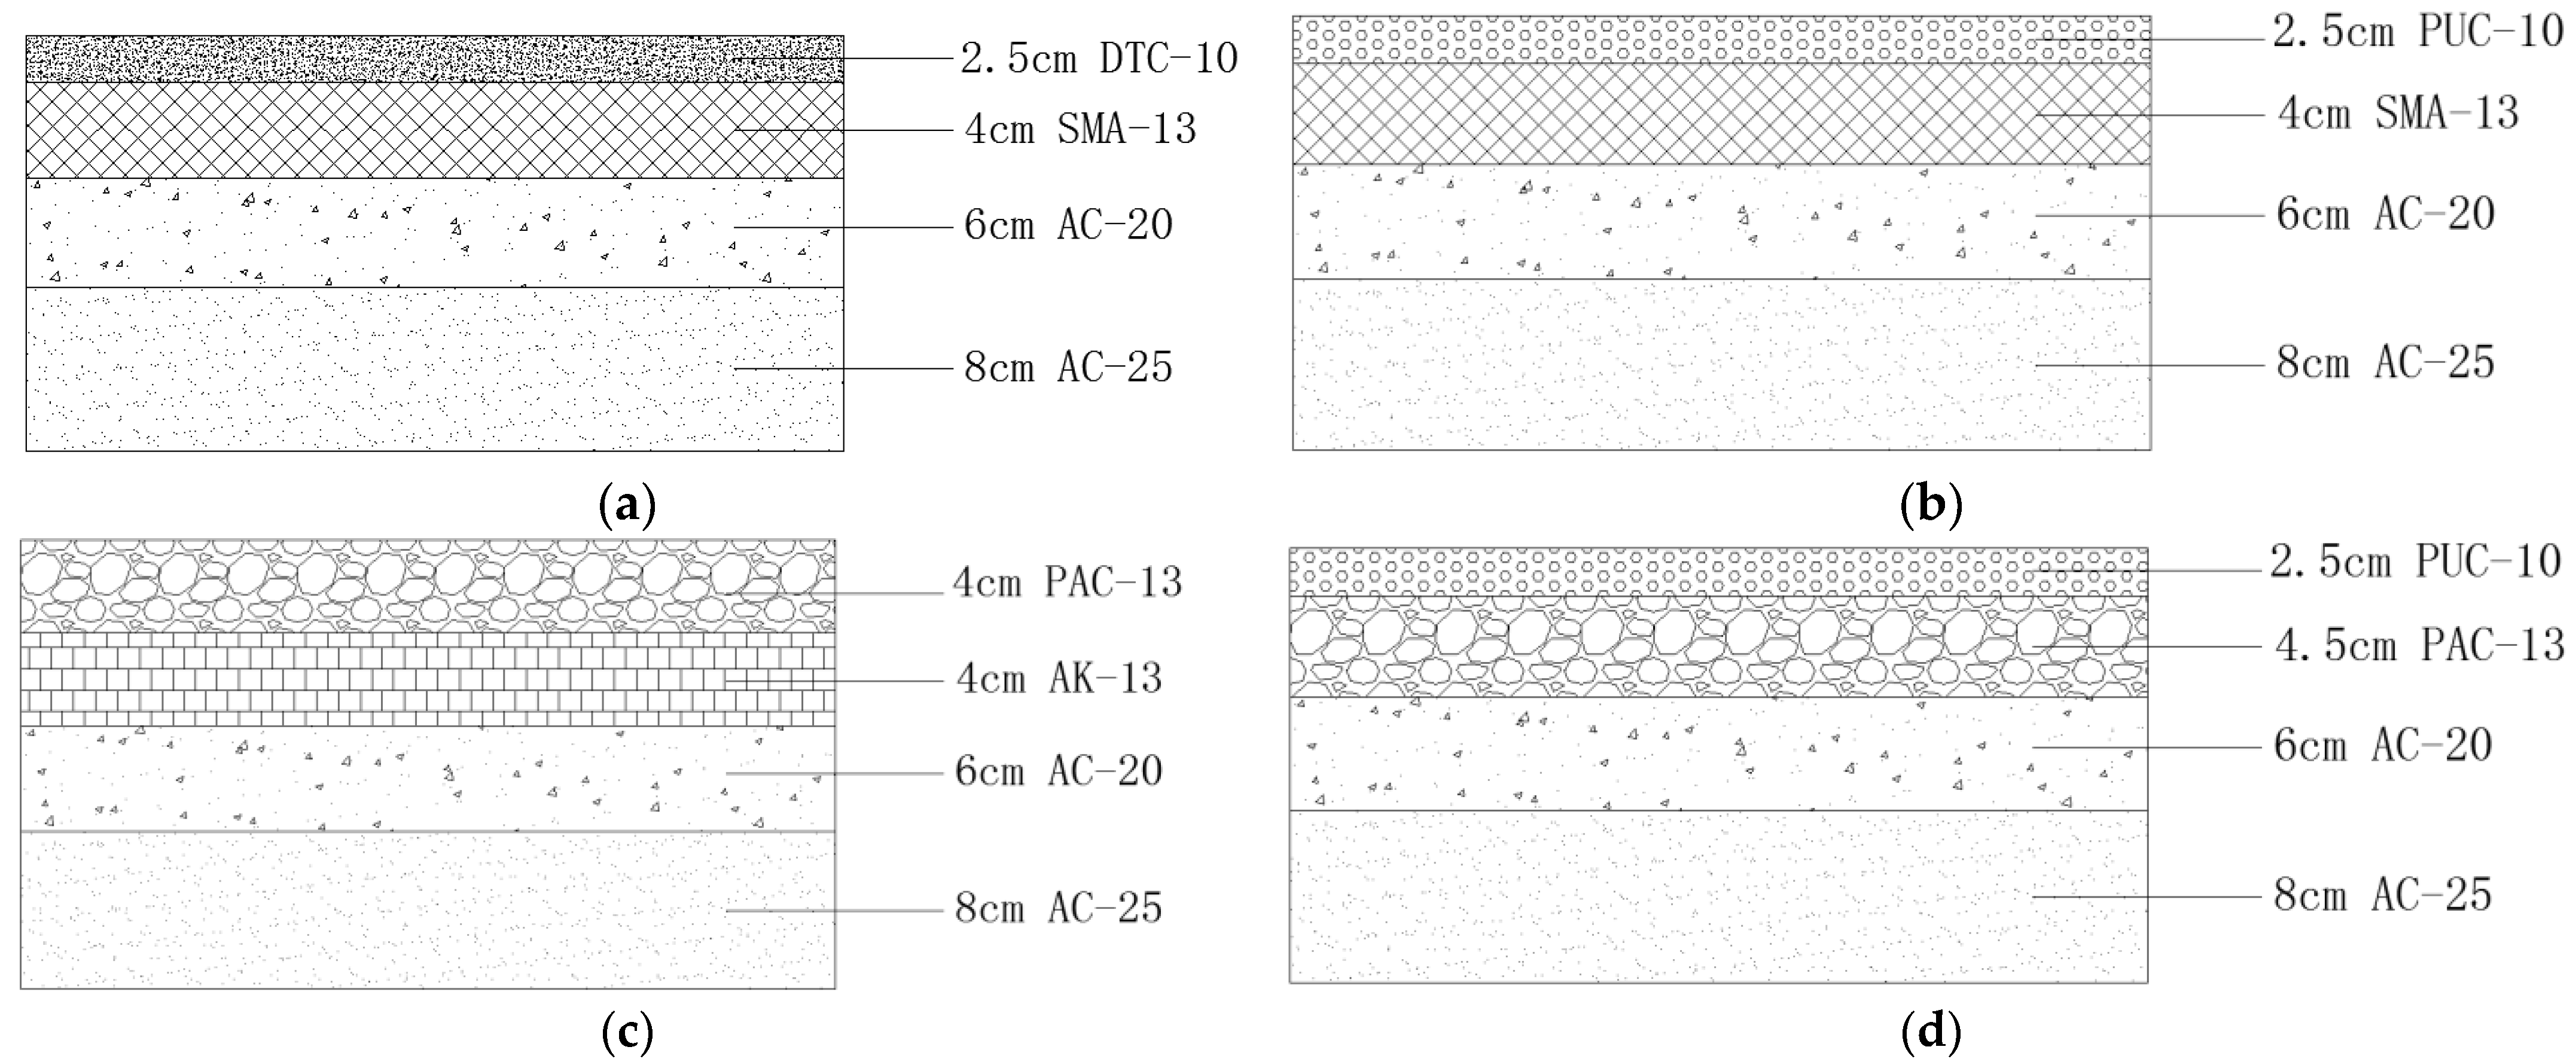
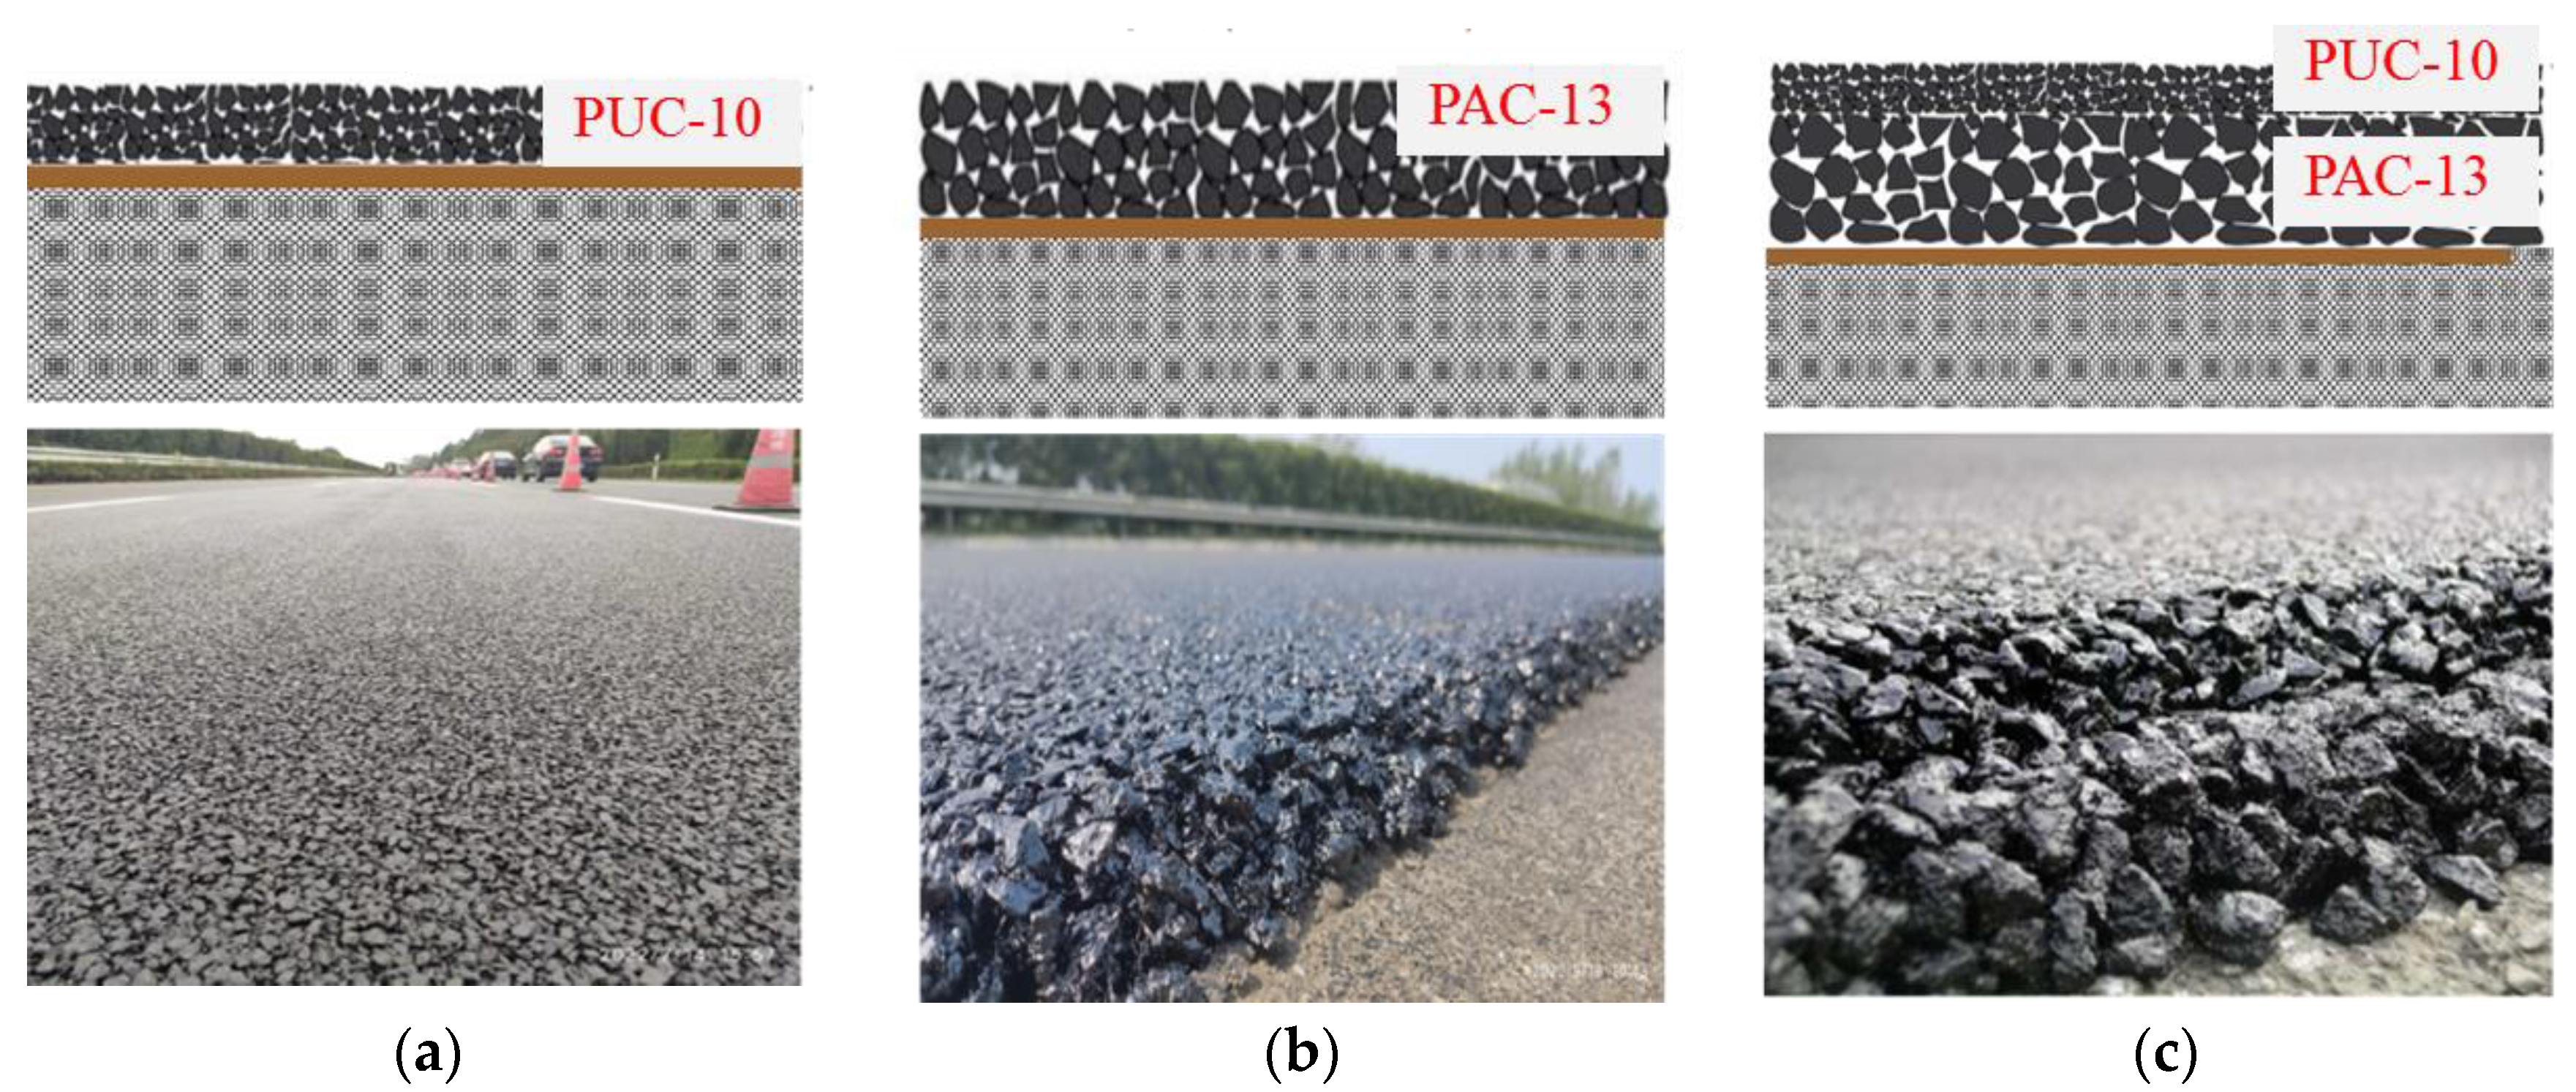
2.1. Test Sections

This study was performed based on the pavement engineering of the Yancheng–Jingjiang Expressway in Jiangsu Province, China, a two-way 4-lane highway. The engineering section was located in the downstream direction K162+700-K157+000, with a length of about 5.7 km. In the tested section, there were four types of asphalt pavement structures: (1) A dense, thin layer course with a maximum nominal aggregate size of 10 mm (DTC) was used as the top layer, with SMA-13/AC-20/AC-25 asphalt mixture courses underneath in that order, which is an ultra-thin asphalt mixture with a skeleton dense-graded structure type. (2) A thin-layer porous asphalt overlay with a maximum nominal aggregate size of 10 mm (PUC-10) was paved as the top layer, with SMA-13/AC-20/AC-25 asphalt layers underneath in that order. (3) Porous asphalt with a maximum nominal aggregate size of 13 mm (PAC-13), with AK-13/AC-20/AC-25 asphalt layers underneath in that order. (4) Two-layer porous asphalt with PUC-10 + PUC-13, with AC-20/AC-25 asphalt layers underneath in that order. The schemes of those pavement structures are shown in Figure 1, with the thickness indicated for each layer of the different structures. The porous asphalt mixtures are shown in Figure 2.
To understand the medium-term service performance of porous asphalt and determine the influence of the service properties of porous asphalt on tire/pavement noise, the service performance indicators of porous asphalt were tracked and observed continuously for 7 years, namely from 2015 to 2022. According to the Highway Performance Assessment Standards (JTG 5210-2018) [32], Multifunctional High-Speed Highway Condition Monitor (GB/T 26764) [33], and Specifications of Automated Pavement Condition Survey (JTG/T E61-2014) of China [34], a cracking and other information collecting system (CiCS) on a multifunctional automatic pavement detection vehicle and a friction coefficient meter were used as automatic detection equipment to detect the indicators DR, RD, IRI, SFC, and sensor measured texture depth (SMTD). The tire/pavement noise data were also collected by an OBSI test in 2022.
According to the Standard Test Methods of Bitumen and Bituminous Mixtures for Highway Engineering (JTG E20-2011) of China [35], the characteristics of the different road surface mixtures were measured. The gradation and performance indicators of the asphalt mixture on the pavement surface are shown in Table 1 and Table 2, respectively. Among the four pavement structures, the biggest difference lies in the gradation and porosity of the surface asphalt mixture, which leads to various differences in the performance of the mixtures.

2.2. Test Methods

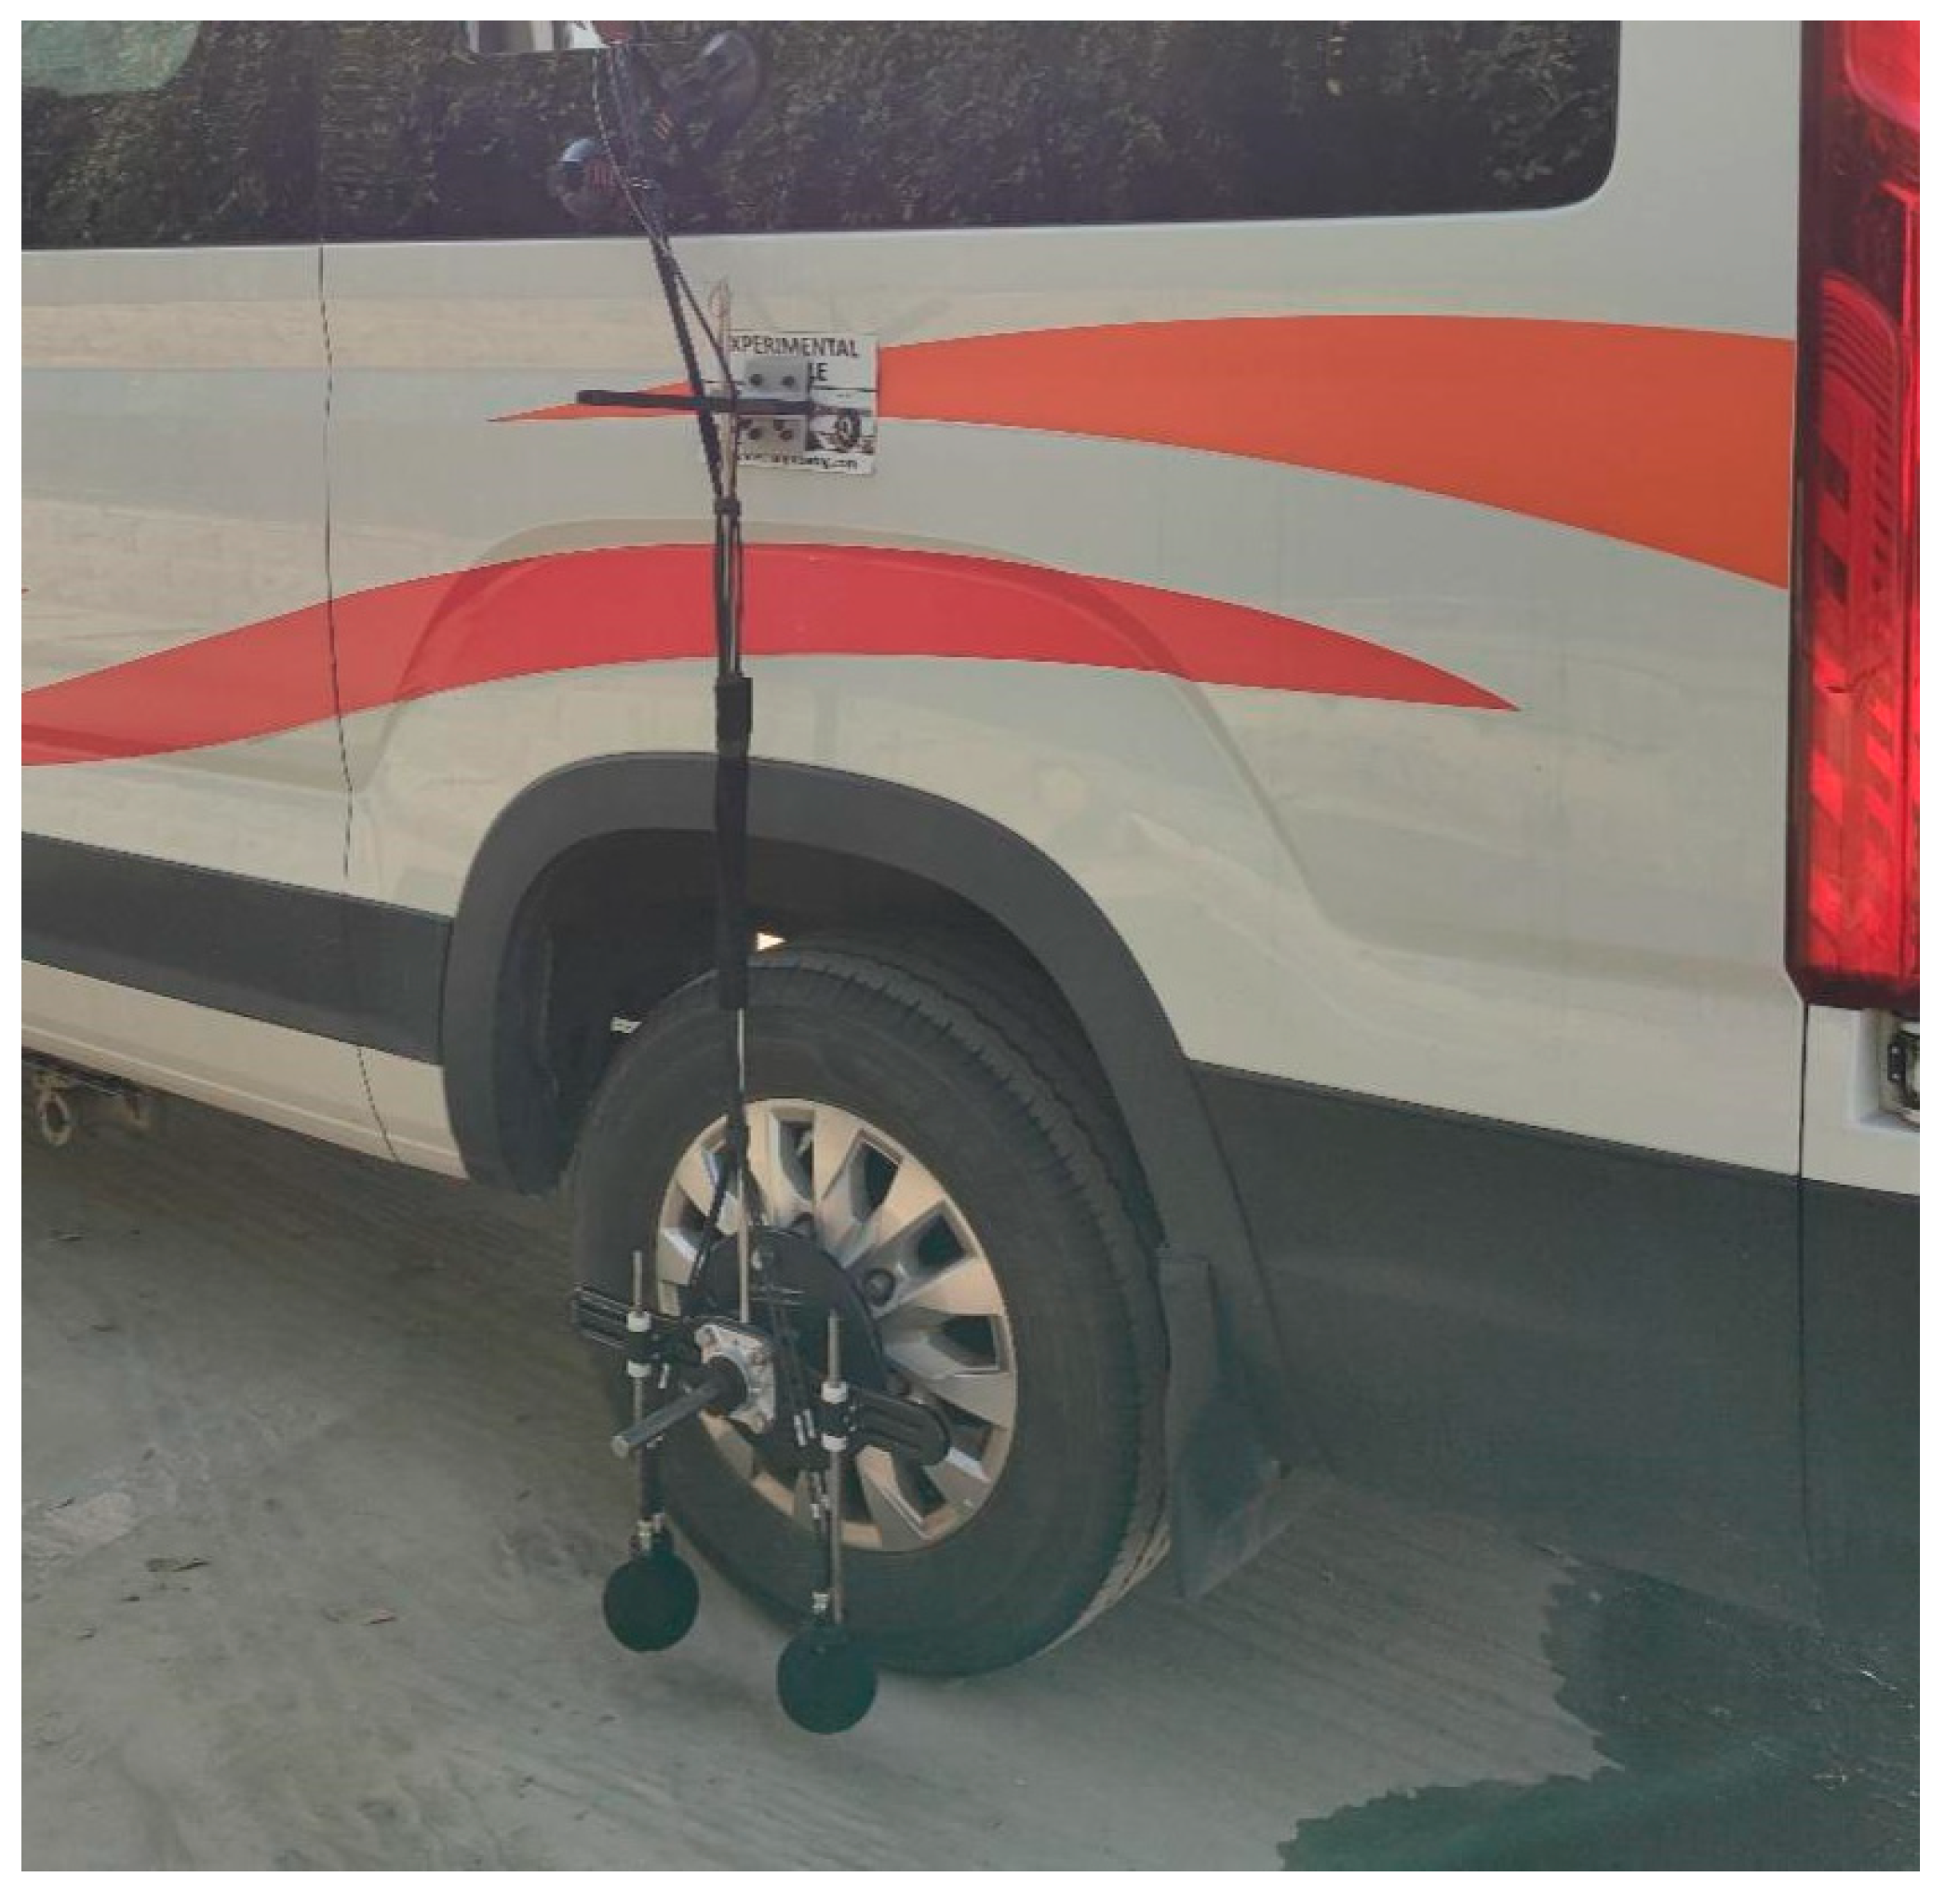
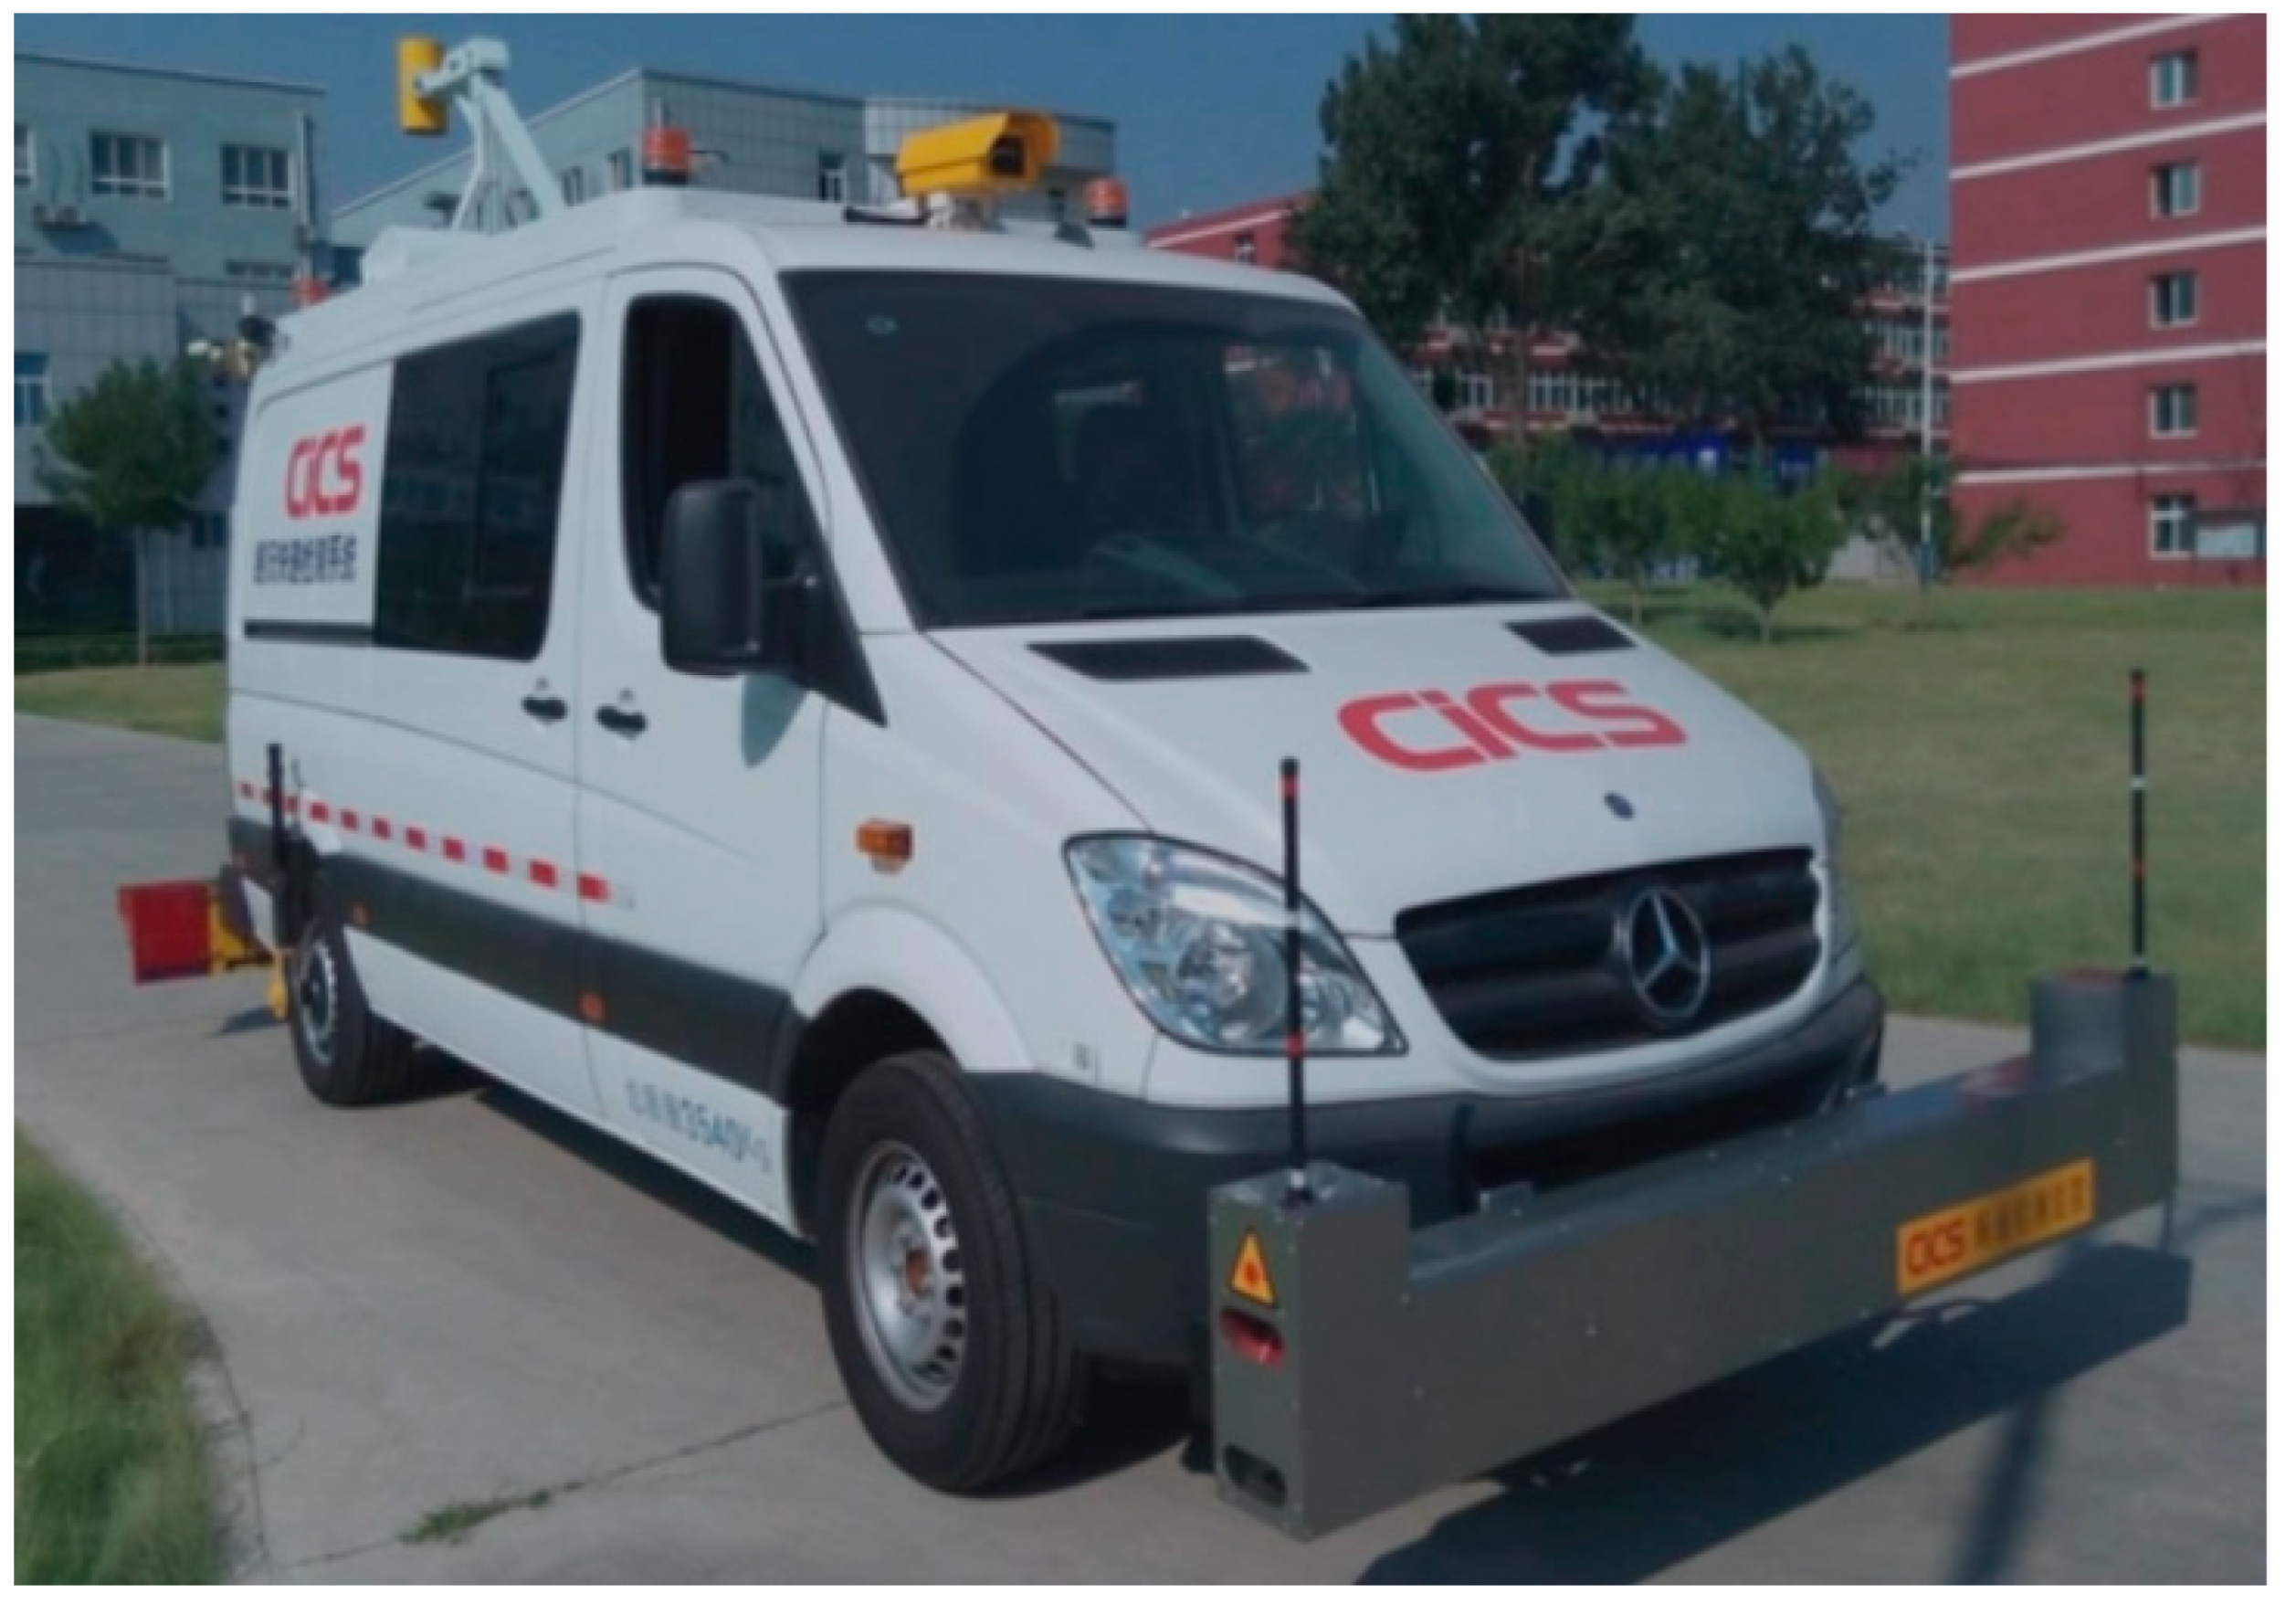
2.2.1. CiCS on the Multifunctional Automatic Pavement Detection Vehicle

The CiCS on the multifunctional automatic pavement detection vehicle comprises road surface detection equipment independently developed by our institute, shown in Figure 3. It passed the SCANNER certification organized by the Transport Research Institute in the UK in 2012, and it can output 40 road condition indicators, including DR, RD, IRI, SFC, SMTD, etc. Its effective detection speed is 0~100 km/h. The frequency of the sensor is 20 kHz/s. The coefficient of variation is 1.6~3.6%, and its correlation is 0.992~0.998.

2.2.2. On-Board Sound Intensity (OBSI) Tire/Pavement Noise Test

According to the American Association of State Highway and Transportation Officials (AASHTO T 360-16) [36], the noise of the section was tested with the OBSI method. The test vehicle was a light passenger car, and standard reference test tires (SRTT) were utilized. A pair of sound intensity sensors were arranged at both the front and rear ends of the tires. The distance of the sensor from the tire sidewall was 101.6 mm, and the height from the pavement surface was 76.2 mm. The two sensors were arranged symmetrically on both sides of the center line of the tire axle, with a horizontal distance of 209.6 mm and a standard speed of 97 km/h during the test. The device is shown in Figure 4. The noise intensity of the different lanes and the different pavement structures given in Figure 1 were measured.

2.3. Characteristic Indexes

The IRI is an important indicator in pavement design, construction acceptance, and maintenance. It reflects the comfort of drivers and passengers and the safety and durability of the pavement. Vehicles traveling on rough pavements will generate additional vibrations, accelerating damage to vehicles and pavements. The higher the IRI, the worse the smoothness of the pavement surface. In this study, the IRI was detected and analyzed by the CiCS vehicle. The longitudinal section data on the tire tracks were continuously measured by the high-speed laser rangefinder and the accelerometer, and the data errors caused by vehicle bumps were effectively eliminated by the self-developed inertia compensation scheme. The resolution of the laser sensor is 0.05 mm. With the support of the positioning data of the integrated control system, the IRI was obtained in real-time through the onboard data acquisition and processing software.
The RD is used for evaluating road performance. Rutting is a form of damage to asphalt pavement, manifested as a concave surface within the range of the asphalt pavement wheel track, sometimes accompanied by a raised edge of the wheel track. The deeper the RD, the stronger the bumpiness and vibration of the car during driving. It will impact the vibration noise of the road surface/tires. The RD was detected and analyzed by the CiCS vehicle. Based on the high-resolution and high-frequency sampling frequency of the sensor camera and the sub-pixel data analysis algorithm, the laser image rutting meter was applied to acquire pavement cross-section curves at a fixed sampling interval and calculate the pavement RD values by matching the rutting model to the acquired pavement curves.
The SFC is an indicator that characterizes the anti-sliding performance of pavements, which is directly related to the safety of driving and is a key quality control indicator during the construction and operation of highways. The SFC was detected and analyzed by a Mu-Meter MK6 friction coefficient meter. Continuous and uninterrupted detection ensured a certain thickness of water film on the pavement surface. An SFC value was output every 10 m, with a detection speed of 50 km/h. The MK6 used the sophisticated tilting tire principle to measure the loads generated by the tires as they passed over the pavement surface, with the tire at an angle of 7.5° to the direction of travel.
The DR was detected and analyzed by the CiCS vehicle. A two-dimensional pavement damage detection system was mainly used to detect and recognize pavement distress. Damage to the road surface can significantly impact the vibration and noise of the road surface/tires.
The SMTD was detected and analyzed by the CiCS vehicle. The three-line construction depth was obtained through the pavement wear detection system by adding one laser rangefinder each at the left, middle, and right positions behind the vehicle platform (the rangefinders at the left and right positions were shared with the roughness system).
According to the transportation industrial specification Highway Performance Assessment Standards (JTG 5210-2018) of China, the values of the indicators DR, RD, IRI, and SFC were converted into the PCI, RDI, RQI, and SRI. The calculation formulas are as follows:
(1)
PCI
The value of PCI ranges from 0 to 100, and a greater value represents a better pavement condition. The calculation formula of the PCI is given as follows:
P C I = 100 a 0 D R a 1
The DR of asphalt pavement was calculated based on the following formula:
D R = 100 × i = 1 i 0 W i A i A
where, DR means the percentage (%) of the sum of the converted areas of various pavement damages to the area of the surveyed pavement;
Ai—area of damaged pavement of type i (m2);
A—area of surveyed pavement (the product of the surveyed length and the effective pavement width) (m2);
wi—weight of the pavement damage of type i, referring to the corresponding specification;
i—individual type of damage in item i considering the degree of damage (mild, moderate, and severe);
a0 and a1 are constants, and for expressways, a0 = 15.00, a1 = 0.412.
(2)
RDI
The value of pavement RDI ranges from 0 to 100, and a greater value represents a better pavement condition. The relationship between RDI and RD is as follows:
R D I =       100 RD ,                                                     RD R D a 90 3 · R D R D a ,                     R D a < RD R D b   0                                                           ,                           RD > R D b                                  
where, R D a = 10.0, R D b = 40.0.
(3)
RQI
The RQI is calculated based on the formula below:
RQI   = 100 1 + a 2 e a 3 I R I
where a 2 and a 3 are constants, and for expressways, a 2 = 15.00, a 3 = 0.412.
(4)
SRI
S R I = 100 S R I m i n 1 + b 0 e b 1 S F C m i n
where, S R I m i n = 35.0, b 0 = 28.8, b 1 = −0.105.
(5)
TCS
The total number of transverse cracks in the detected section was recorded. The average value of the transverse crack spacing (TCS) per kilometer is obtained by:
T C S = 1000 n + 1
where, n is the total number of transverse cracks in the detected section.

3. Results and Analysis

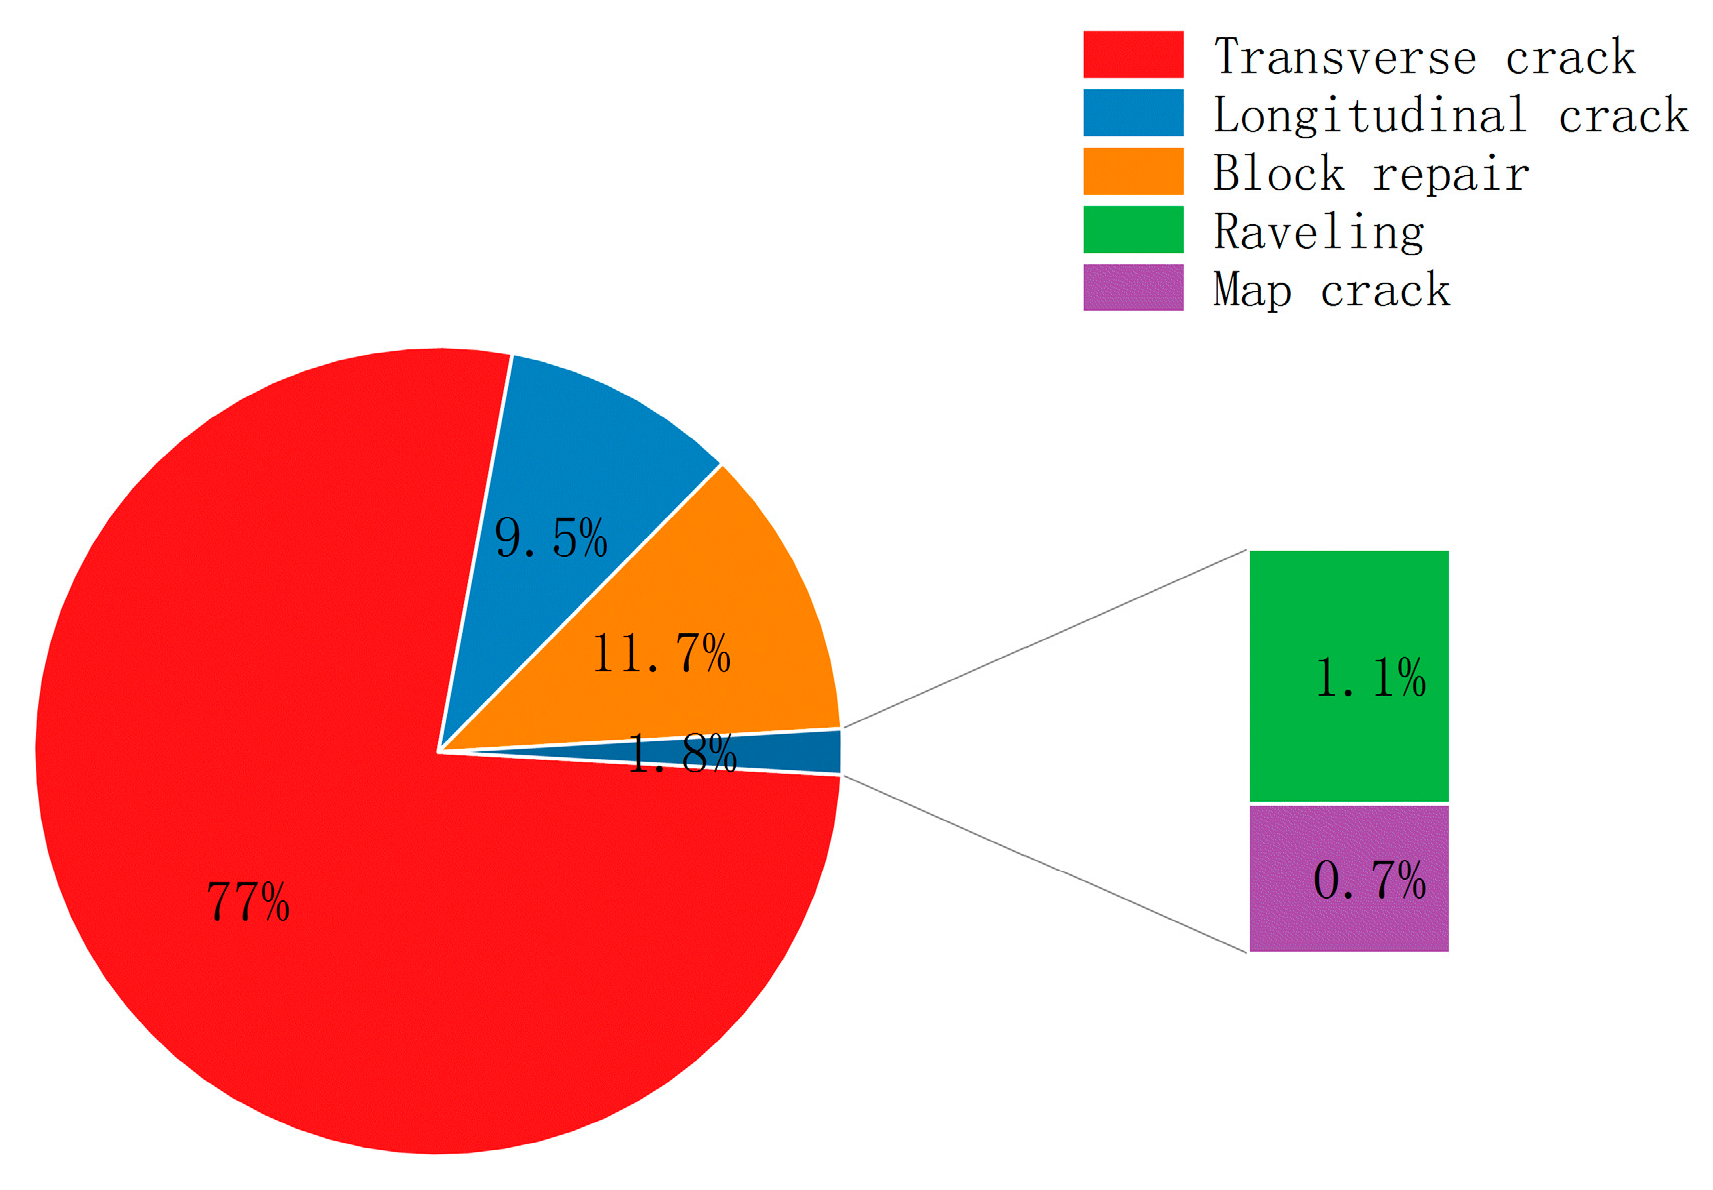
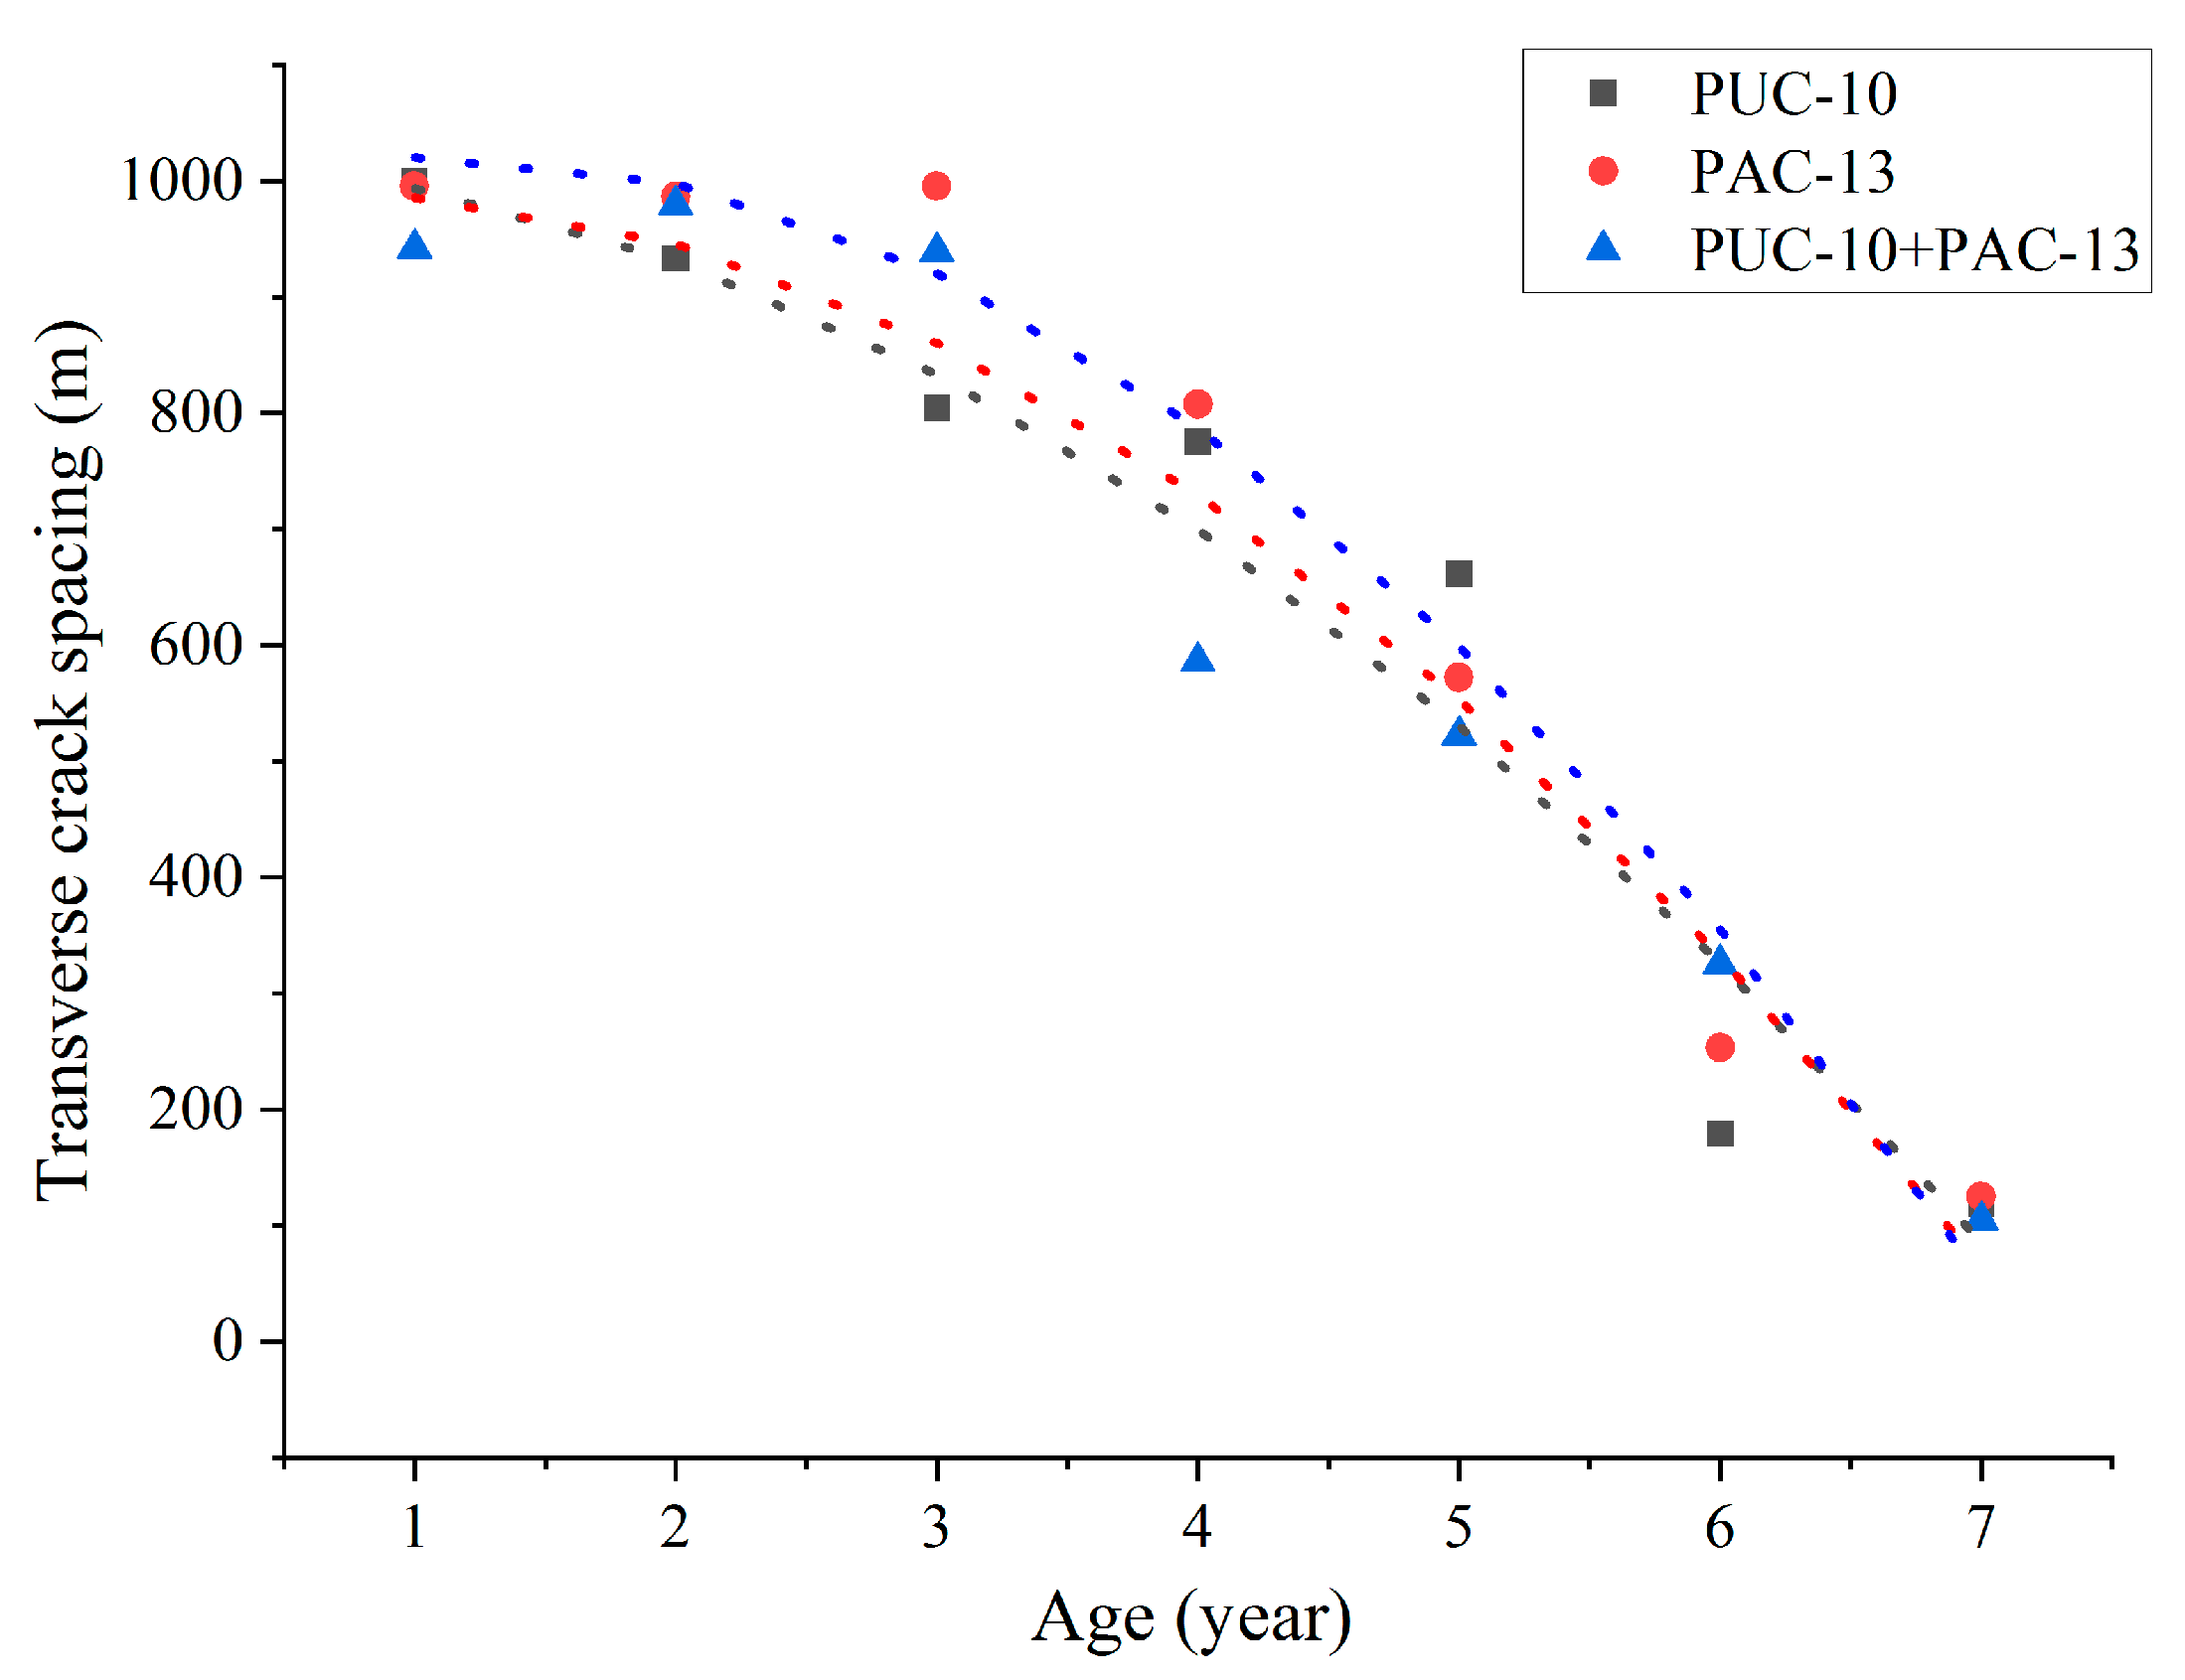
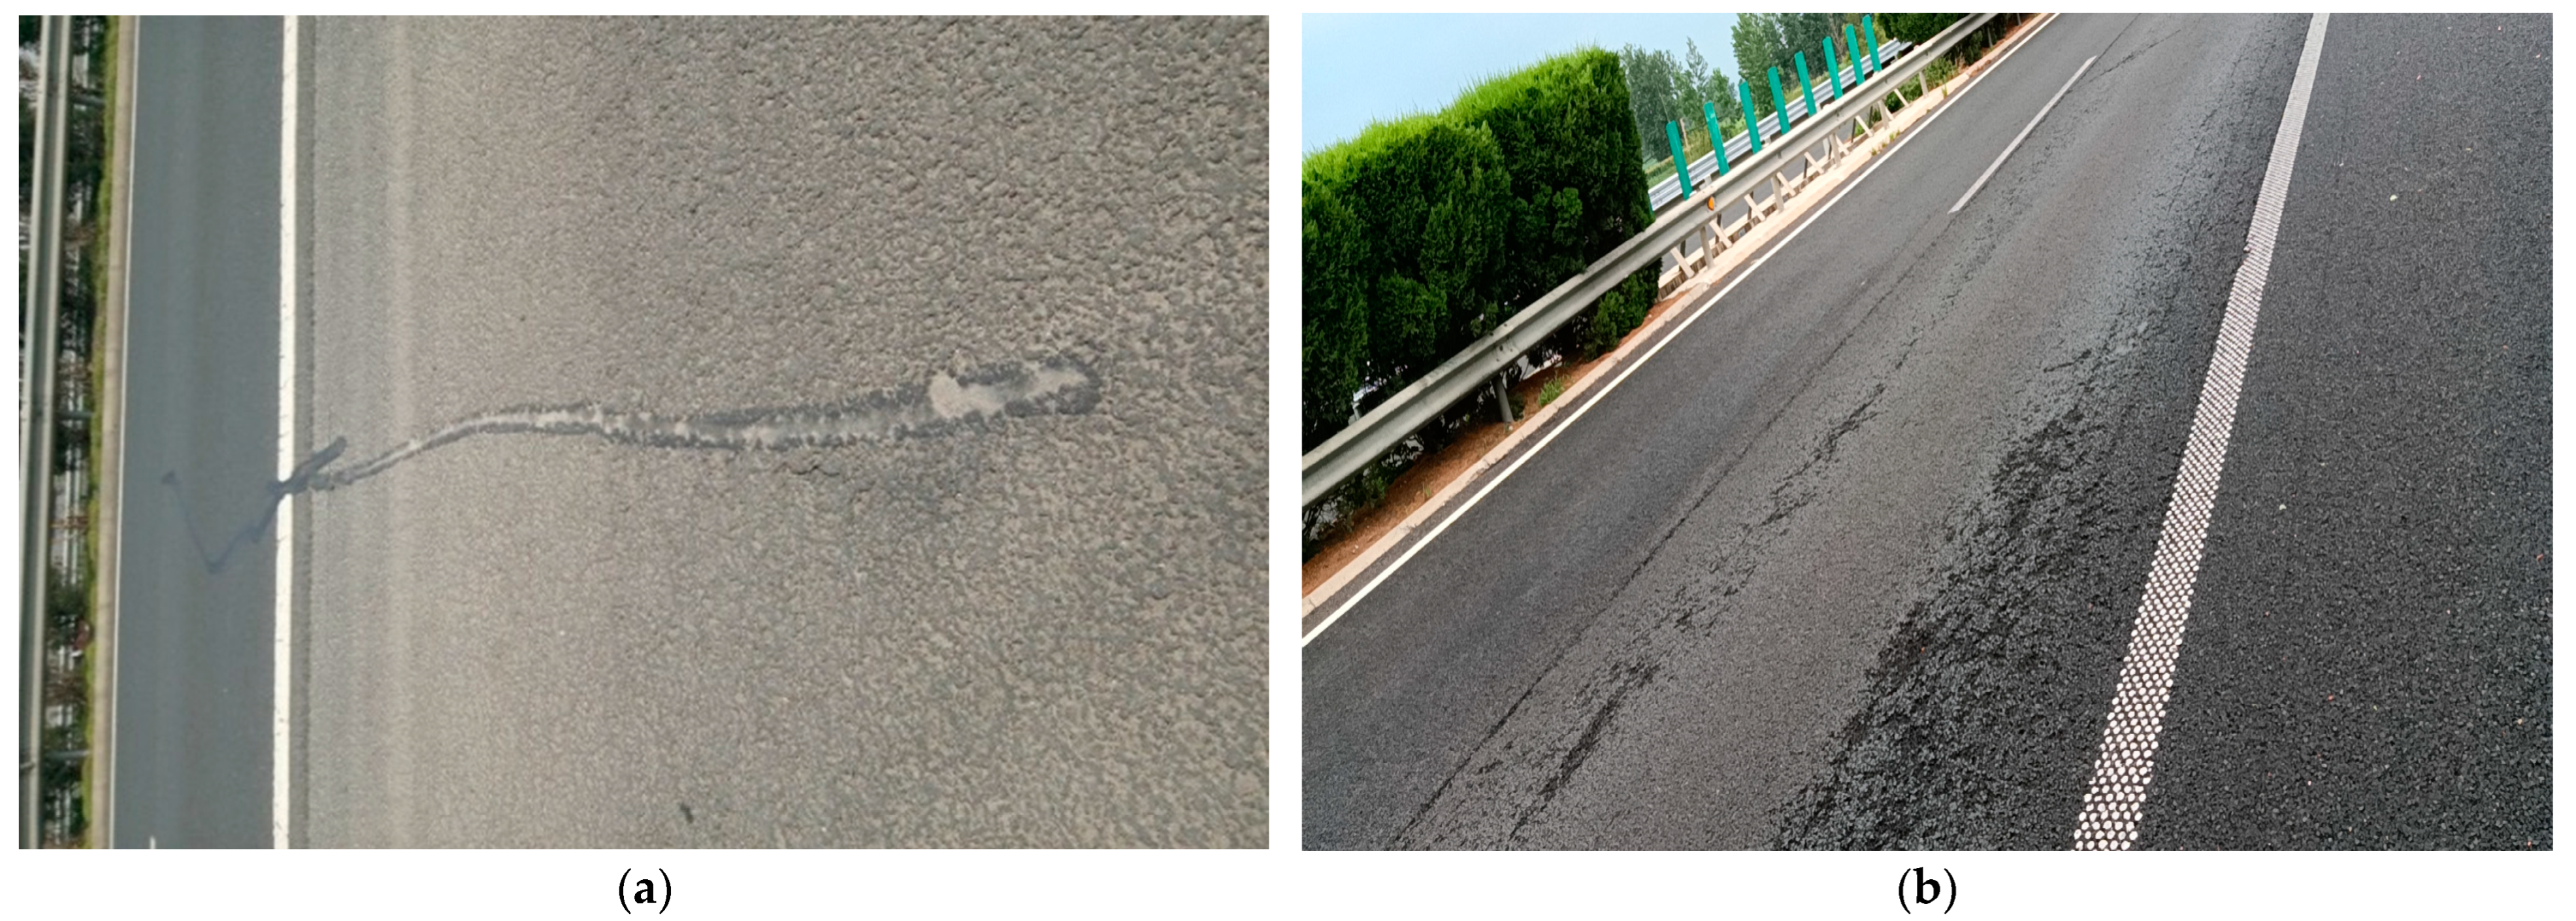
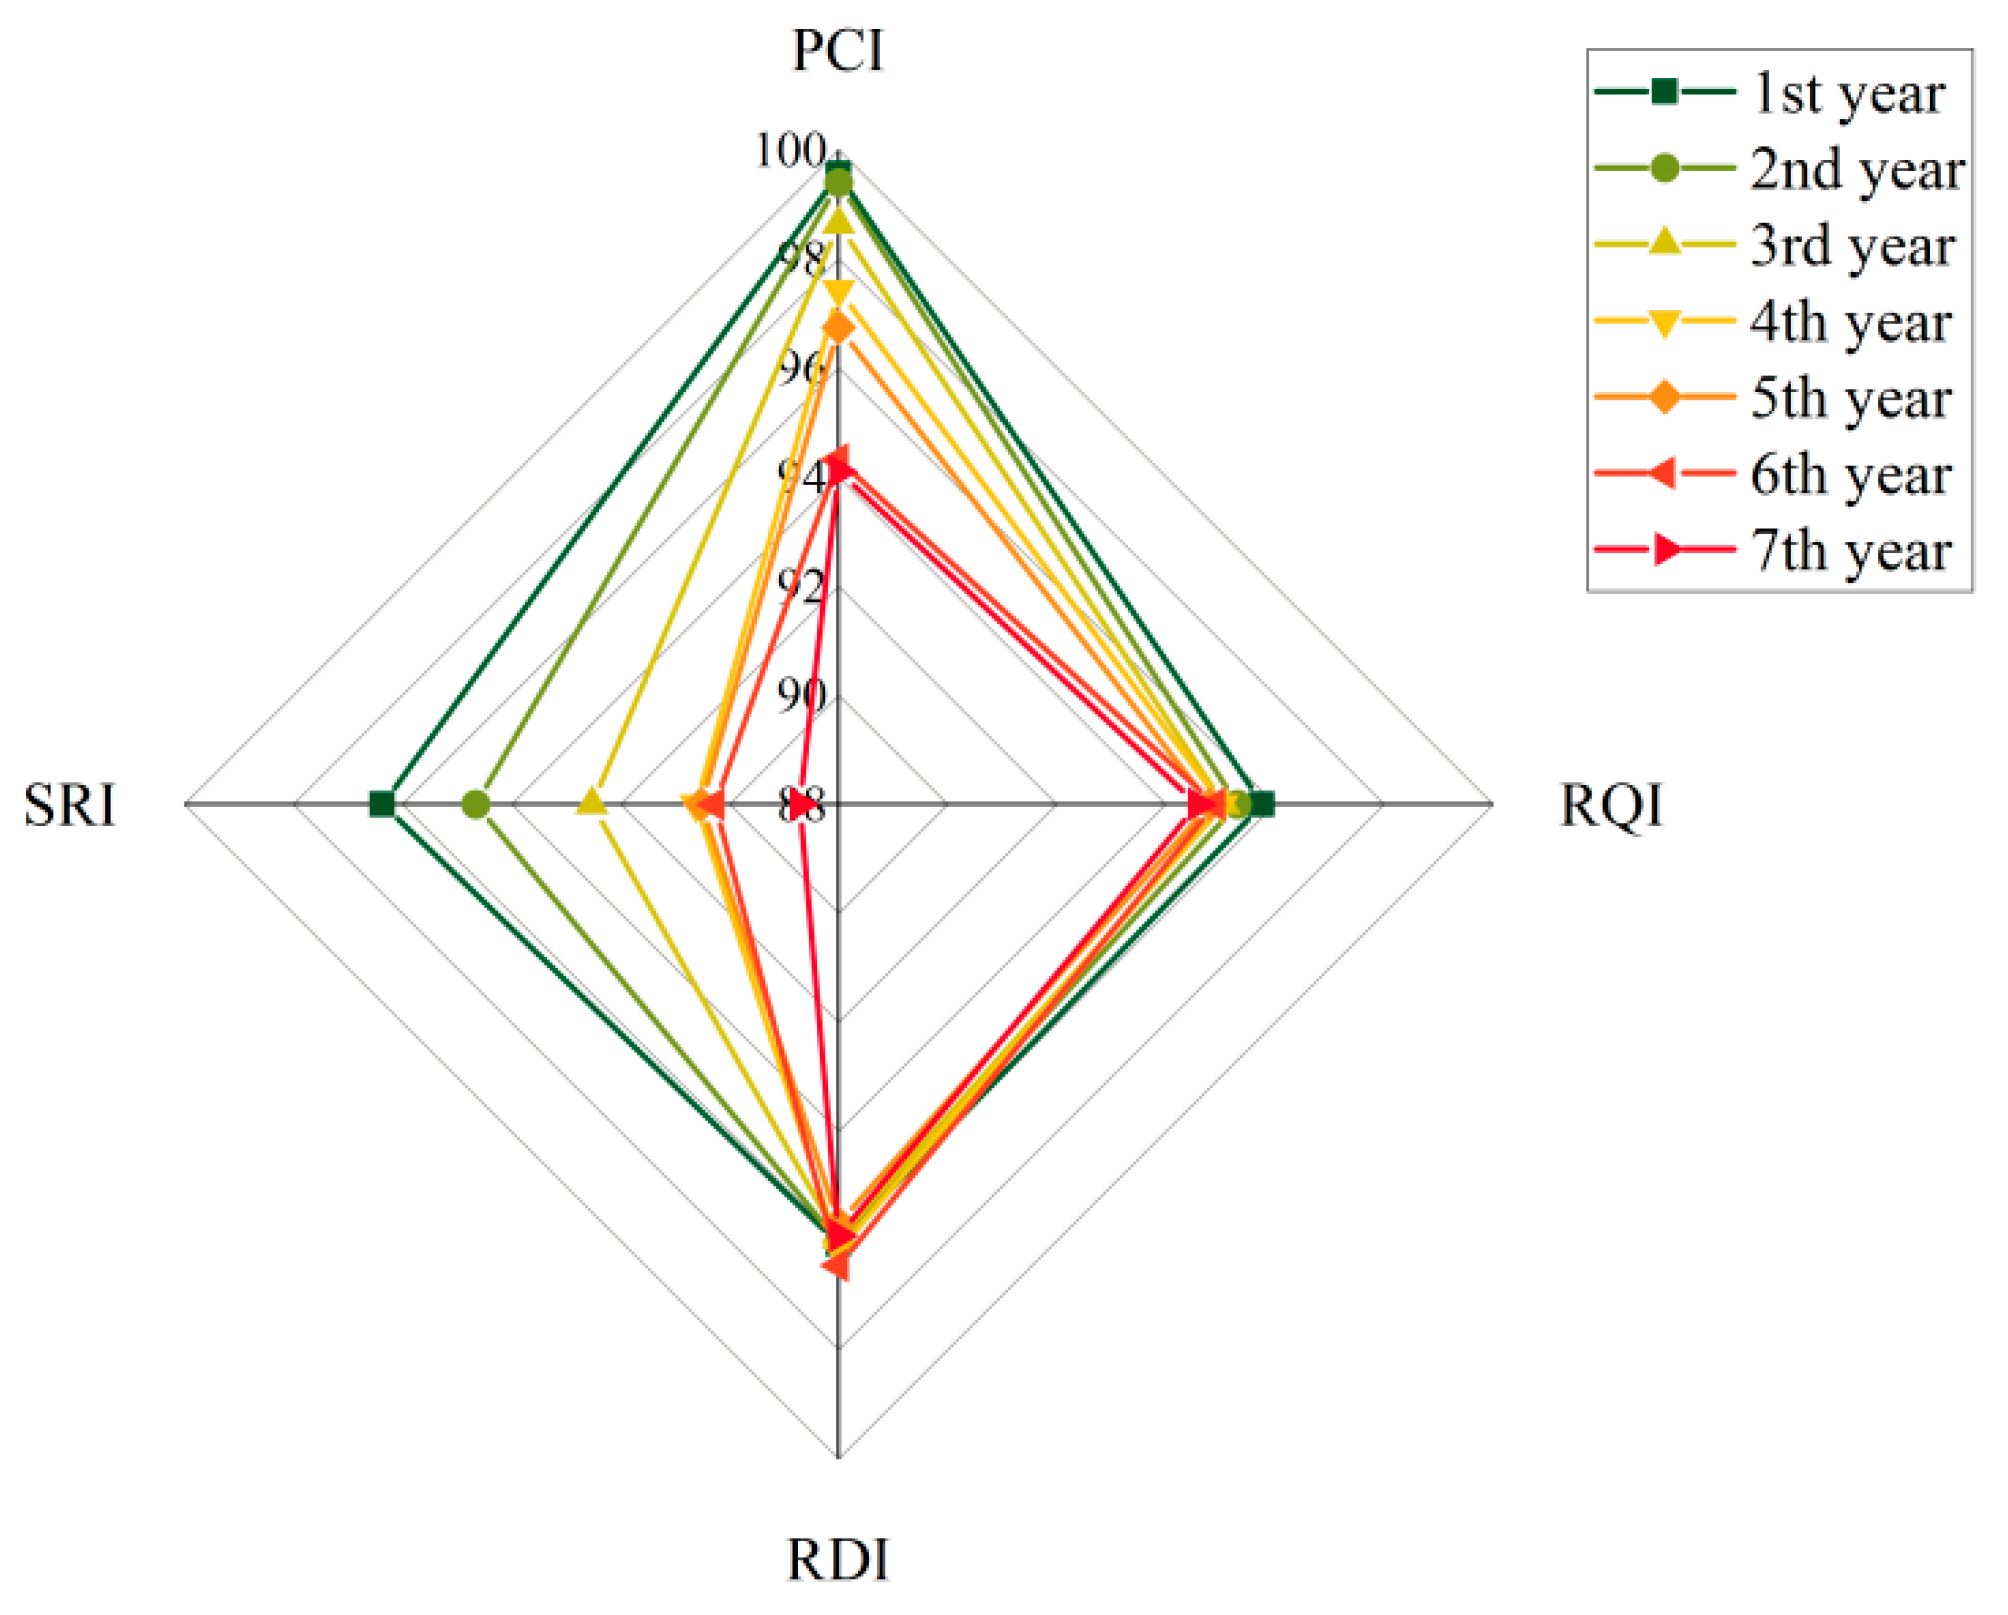
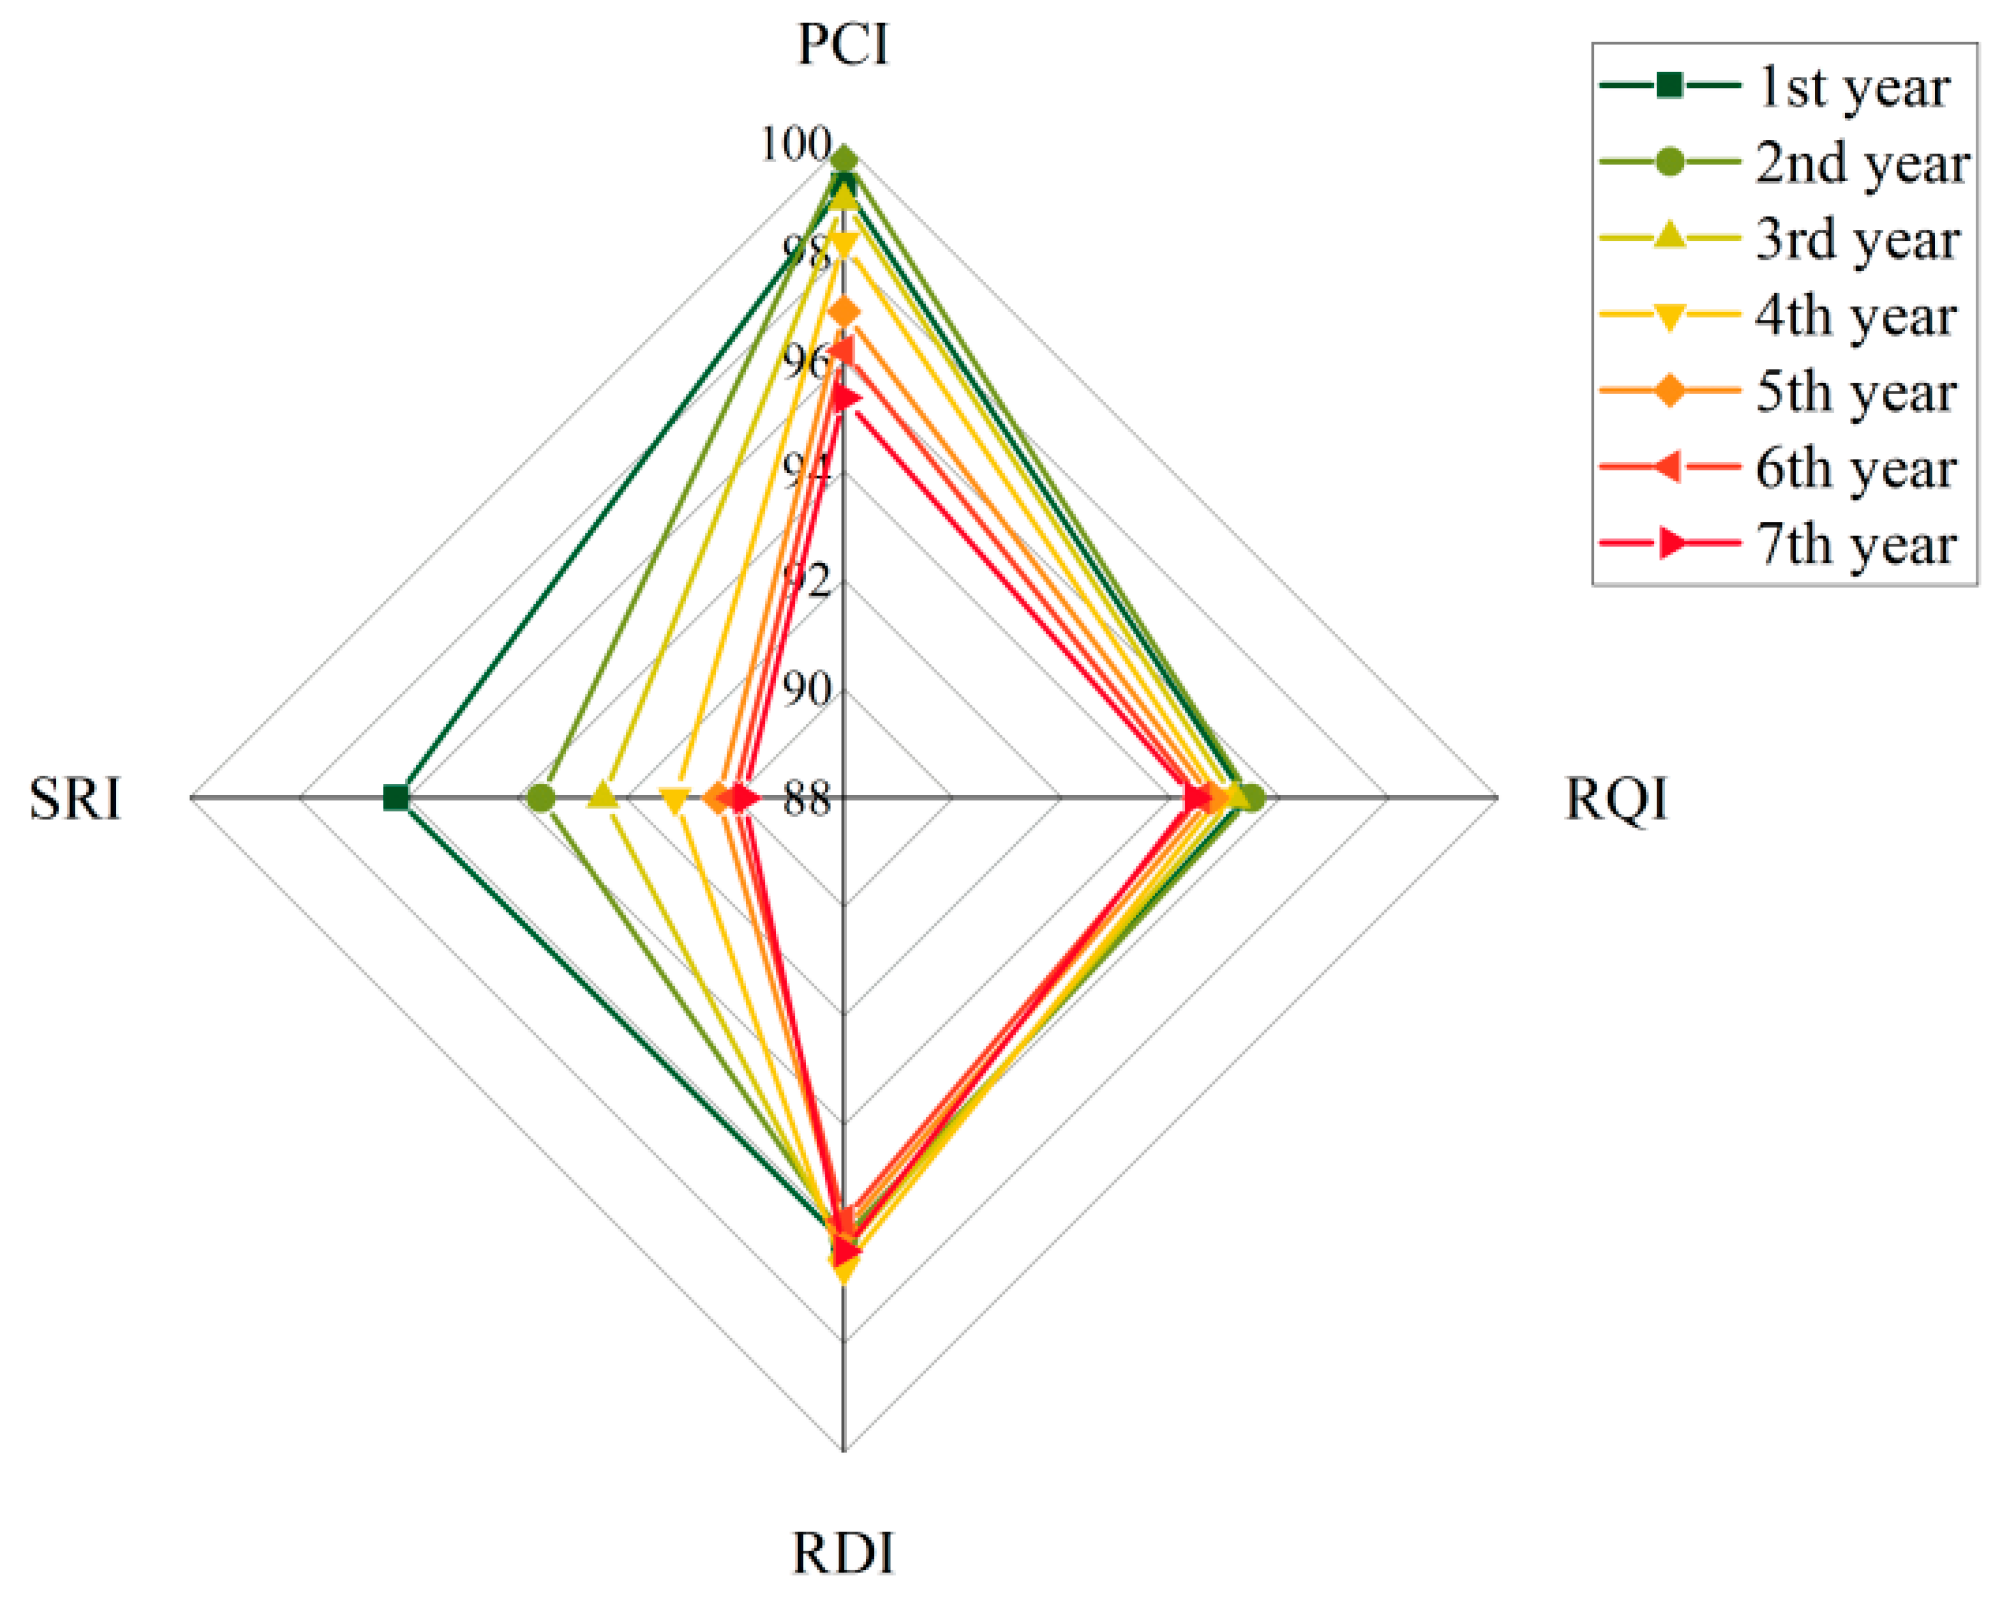
3.1. Development Trend of Service Performance of Porous Asphalt Pavement

The service performance indicators of the three porous pavement structures (PUC-10/PAC-13/PUC-10 + PAC-13) were measured by years. The measurement results are shown in Figure 5.
According to Figure 5, different pavement structures exhibited various characteristics of pavement service performance. The DR of the three porous pavement structures increased to a certain extent with time, and the DR of PUC-10, PAC-13, and PUC-10 + PAC-13 remained higher after 7 years of application. The proportions of different types of damage distress are plotted in Figure 6. It indicates that transverse crack distress is the main damage distress type of porous asphalt, accounting for about 77%. The TCS results and the typical porous pavement distresses are shown in Figure 7 and Figure 8. It is found that after three years of construction, the crack spacing of each pavement structure was greatly reduced, indicating that the transverse cracks of porous asphalt develop rapidly after three years of operation. They are the main reason for the increase in the DR.
During the 1–4 years of operation, the SFC of the three porous pavement structures decreased greatly, with an SFC decay rate of 13.8–17.0%, meaning the SFC value’s reduction rate was relatively slight after 4 years of operation. The RD of the three porous asphalt pavement structures did not decay significantly during the 7 years of operation, suggesting that the porous asphalt pavement has excellent anti-rutting performance. The IRI did not decay obviously, and the IRI of PUC-10, PAC-13, and PUC-10 + PAC-13 reached 1.22–1.26 m/km, which was mainly due to the rapid development of transverse crack distress with time, resulting in IRI decay to some degree.
According to the Chinese specification Highway Performance Assessment Standards (JTG5210-2018), the values of the indicators DR, RD, IRI, and SFC were converted into the PCI, RDI, RQI, and SRI, which are illustrated by Figure 9, Figure 10 and Figure 11.
During the 1–7 years of service, the performance of the porous asphalt pavement declined to a certain extent, among which the PCI and SRI showed the most notable decrease. The PCI of the three porous pavement structures dropped to 92.59–95.34, and the attenuation rate reached 3.93–6.41% compared with that in the first year. This is because the porous asphalt pavement has a higher connected porosity. Compared with a dense pavement surface, a porous asphalt mixture is more susceptible to aging and water damage, and its crack distress develops faster, resulting in a greater decrease in PCI. The SRI of the three porous pavement structures decreased to 88.72–89.45, and the attenuation rate ranged from 6.17% to 7.93%, which is mainly affected by factors such as aggregate angularity and polishing value [37,38]. Under the repeated action of vehicle load, the micro-texture of the coarse aggregate was reduced, resulting in a decrease in its skid-resistance properties. The RQI of the three porous pavement structures was reduced to 94.42–94.58, with an attenuation rate of 0.99–1.24%, and the RDI dropped to 95.45–96.31, with an attenuation rate within 0.6%. This is because the porous asphalt mixture has a skeleton-pore structure, and the coarse aggregates are embedded within each other, and thus, the pavement shows better resistance to deformation. Therefore, the RQI and RDI did not decay greatly.
With a service age increase, the anti-cracking performance and skid-resistance of porous asphalt pavement significantly decrease. It can be concluded that in order to improve the durability of porous asphalt pavement, it is necessary to control the development of transverse cracks and to improve its skid-resistance performance.

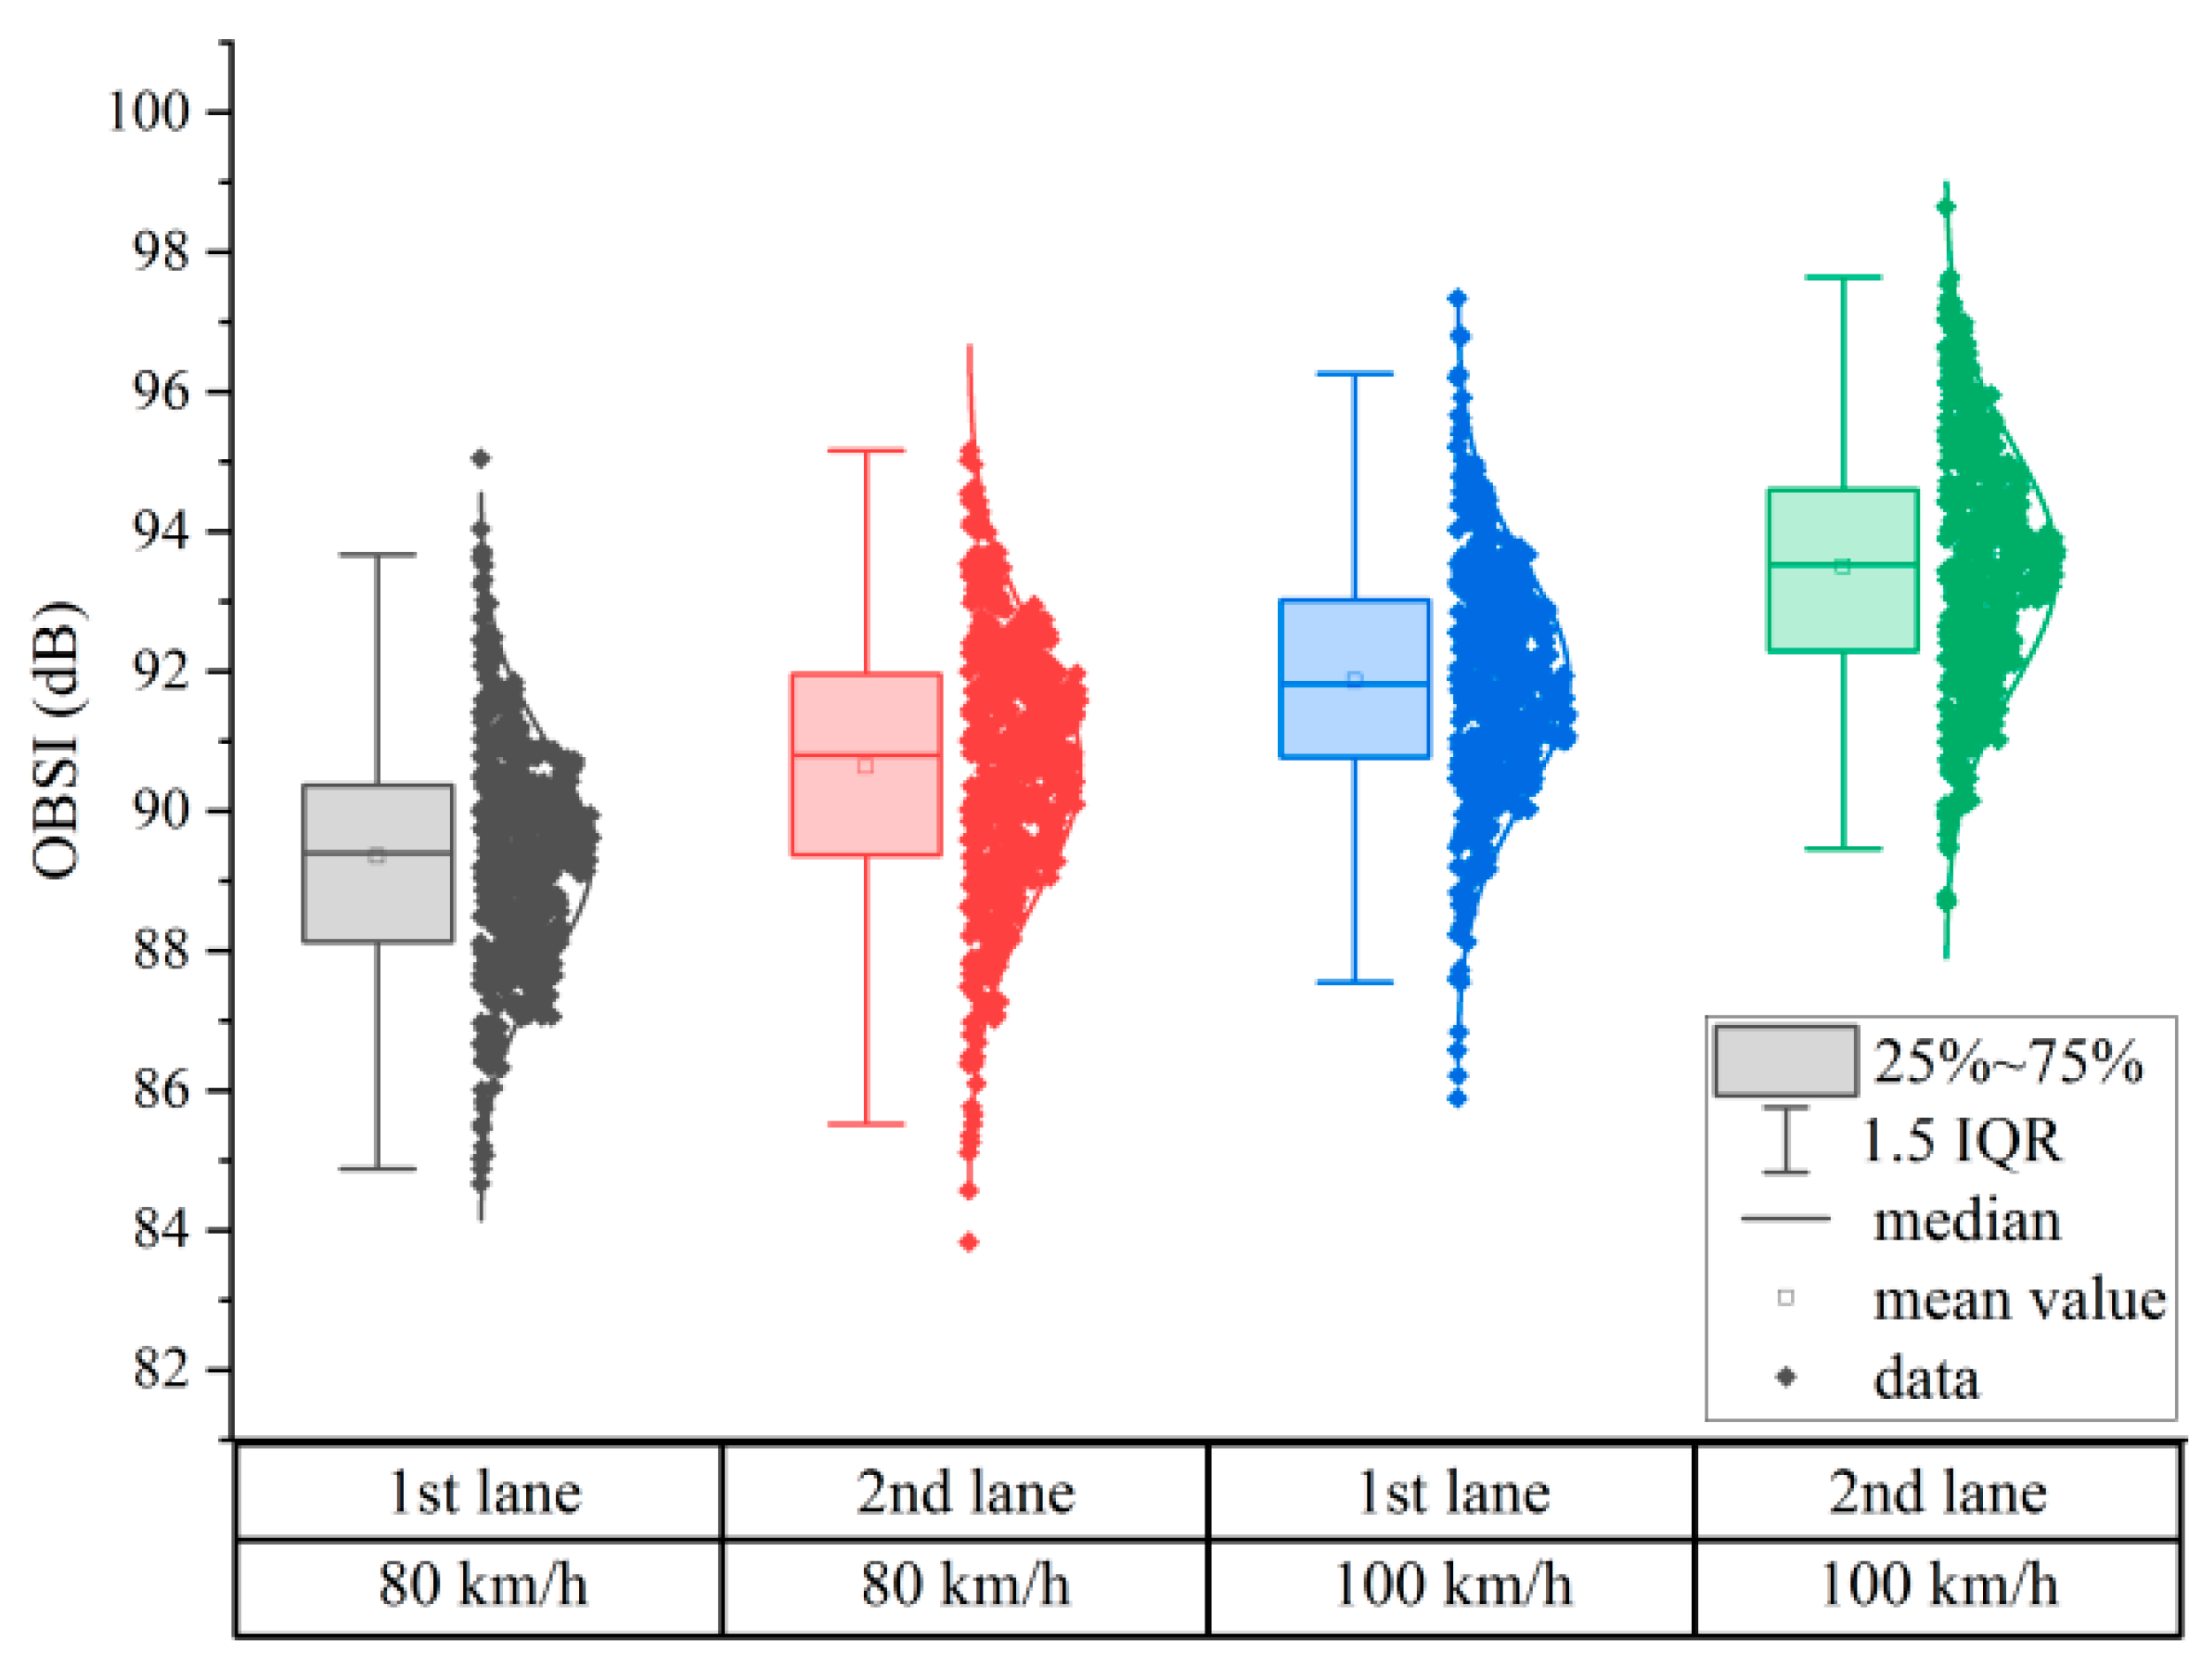
3.2. Tire/Pavement Noise Analysis Based on the OBSI Method

To quantify the tire/pavement noise of the porous asphalt, OBSI tests were carried out on porous asphalt pavement on different lanes with a length of 5 km. The test speeds were 80 km/h and 100 km/h, and the test results are shown in Figure 12.
According to Figure 12, at the test speed of 100 km/h, the average OBSI values of the noise of the first and second lanes were 91.86 dB and 93.50 dB, respectively, which were remarkably higher than those at the test speed of 80 km/h (89.35 dB and 90.63 dB). At the test speed of 100 km/h, the average OBSI value of the first lane was increased by 2.51 dB compared with that at 80 km/h, while that of the second lane was increased by 2.87 dB. This indicates that the OBSI is greatly impacted by the test speed; the faster the driving speed, the greater the OBSI value. At the same speed, the average OBSI value of the second lane was 1.64 dB (100 km/h) and 1.28 dB (80 km/h) higher than that of the first lane, respectively, suggesting that the OBSI value of the second lane was slightly greater than that of the first lane at the same test speed. Based on the box plot, the interquartile spacing [3/4 quantile (75% quantile value)—1/4 quantile (25% quantile value)] of the second lane was slightly greater than that of the first lane. This means that the OBSI dispersion of the second lane is greater than that of the first lane, which may be caused by the pavement condition indicators of each lane.
To understand the influence of different lanes on the pavement condition indicators, the distribution statistics of the test data of the SMTD, RD, DR, IRI, and SFC corresponding to the section tested by the OBSI with a length of 5 km were calculated. The results are shown in Figure 13. It was revealed that the average values of the SMTD and SFC of the first lane were higher than those of the second lane; the RD and IRI were lower than those of the second lane; and the DR values of the two lanes were basically 0. This indicated that the service performance of the pavement of the two lanes is satisfactory, and the service performance of the first lane of the pavement is better than that of the second lane. The average IRI value of the two lanes was slightly greater than the median, and its distribution range of quantile spacing of 75–95% was much greater than that of 5–25%, indicating that there were more points with large IRI values, which may be one of the main causes of tire/pavement noise. Therefore, the pavement condition indicators of different lanes are different, and poor service performance of the pavement is one of the main reasons for greater noise levels.
To clarify the influence of different pavement structures on the OBSI, the OBSI test data from lengths of 5 km were classified by different pavement structures, as shown in Figure 14. It was manifested that under the same test conditions, the OBSI noise level of the three porous pavement structures was greatly lower than that of the dense gradation pavement. The three porous pavement structures had better noise reduction properties. Compared with the DTC, their OBSI noise could be reduced by 2.09 dB, 1.53 dB, and 2.88 dB, respectively. The PUC + PAC had the best noise reduction effect compared to the other two porous pavement structures, with an average OBSI value of 91.23 dB. This is because it has a two-layer porous asphalt structure, and the connected pores are not easily clogged by dust during the pavement service, producing a more durable noise reduction effect. The OBSI of the PAC-13 was slightly higher than that of the PUC-10, and its standard deviation and interquartile spacing were higher than those of the other two pavement structures. This implies that a greater dispersion of OBSI values is caused by a larger connected porosity and better pavement service performance during service.

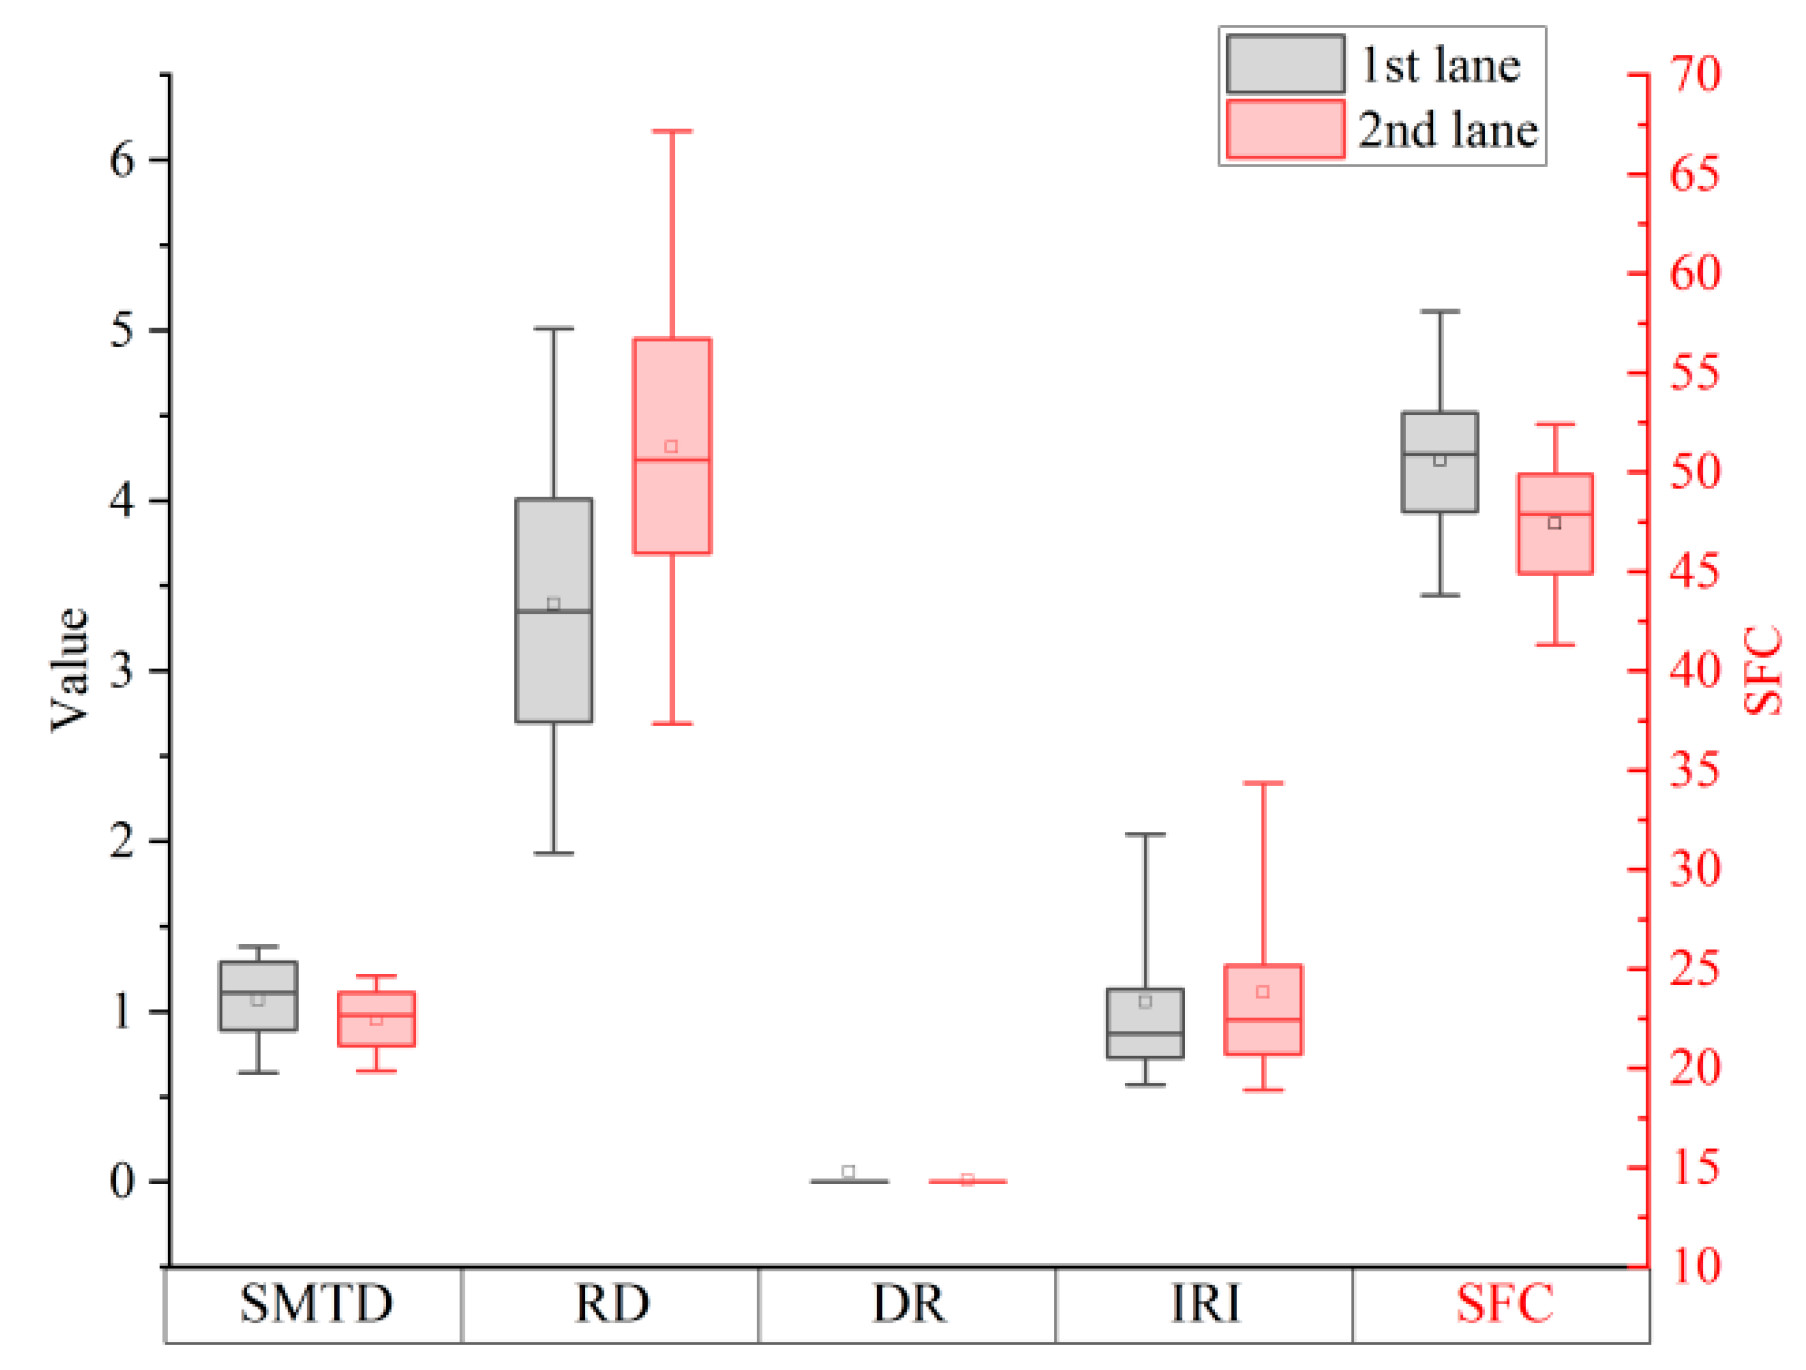
3.3. Correlation Analysis of OBSI and Pavement Performance Indicators

The test data were classified according to the OBSI test speeds (100 km/h and 80 km/h), types of pavement structure, and lanes. Table 3 shows the classification variables settings, and Table 4 presents the Pearson linear correlation analysis results.
A hypothesis test on the correlation coefficient between OBSI and speed was conducted, with p < 0.01 and a test level α = 0.01 adopted. The result rejected the null hypothesis. It was considered that the regression coefficient was significantly different from 0, and there was a significant linear relationship between OBSI and speed, with a correlation coefficient of 0.585. The p < 0.01 indicated that the linear relationship between OBSI and lane was significant, and the correlation coefficient was 0.317. The p < 0.01 suggested a significant linear relationship between OBSI and pavement structure, and the correlation coefficient was −0.201. The p > 0.01 manifested that there was no significant correlation between OBSI and pavement distress.
In summary, OBSI had significant correlations with speed, lane, and pavement structure, consistent with the analysis results in Figure 12, Figure 13 and Figure 14. The correlation between OBSI and pavement distress was not significant, mainly due to the few distressed sections in the tested section and the lack of sufficient distressed section data to support a correlation analysis between OBSI and pavement distress.
To clarify the correlation between the pavement performance indicators and tire/pavement noise intensity with porous pavement structures, a correlation analysis was carried out on the OBSI at a test speed of 100 km/h, and the SMTD, RD, DR, SFC, and IRI of the different pavement structures. The test results are shown in Table 5.
According to Table 5, the OBSI noise values of various pavement structures had a significant linear correlation with pavement performance indicators. The p < 0.01 for the OBSI noise levels of the DTC compact gradation asphalt pavement with the SMTD and SFC revealed that the OBSI noise value of the DTC compact gradation asphalt pavement had a significant linear relationship with the SMTD and SFC, and the correlation coefficients r were 0.567 and −0.304, respectively. The SMTD and SFC had a significant impact on the OBSI noise of the DTC compact gradation asphalt pavement due to the small porosity of the DTC, causing a direct correlation between the noise values and SMTD. Besides, the SMTD reflects the macroscopic texture, which has a certain impact on the skid-resistance performance of the pavement, so both the SMTD and SFC are closely associated with the OBSI value. The p < 0.01 for the OBSI noise value of the PUC-10 porous asphalt pavement and the RD denoted that the OBSI noise values of the PUC-10 porous asphalt pavement had a significant linear relationship with the RD, with a correlation coefficient r of 0.545. This suggests that compared with other pavement condition indicators, the RD has a more significant impact on the OBSI noise value of the PUC-10 porous asphalt pavement. The reason is that the PUC-10 structural layer is thinner, and the rutting compresses the pores of PUC-10, leading to a decreased noise absorption performance and an increased OBSI value, so the OBSI value has a significant linear relationship with the RD. There was no obvious linear correlation between the OBSI noise value of the PAC-13 porous asphalt pavement and the SMTD, RD, DR, SFC, or IRI, and the correlation coefficients r were all less than 0.2. The PAC-13, due to its high porosity, is affected by the clogging of its pores during service; thus, both the reduction of the noise absorption performance of the pavement and the decrease in the air pump noise affects the tire/pavement noise value, which may lead to a weaker correlation between the OBSI noise value and the pavement condition indicators. The p < 0.01 for the correlation of the OBSI noise value of the PUC-10 + PAC-13 porous asphalt pavement with the SFC indicated a significant linear relationship between the OBSI noise value and the SFC, with a correlation coefficient of −0.231. Under the influences of loading and environmental factors on the pavement, the microscopic texture is changed [39], which improves the tire/pavement noise value in the high-frequency range. Also, the microscopic wear of the pavement will directly affect the skid-resistance performance of the pavement (SFC decline). Therefore, the OBSI noise value has a negative correlation with the SFC.
As a result, the sensitivity of the tire/pavement noise of the different pavement structures to each pavement condition indicator varies. According to the data analysis, the section tracked and observed in this study had no serious distress, with the largest proportion of distress being transverse cracks. A transverse crack may not have a significant impact on tire/pavement noise, which may lead to an insignificant correlation between the DR and the OBSI. The impact of distress types, especially raveling, on noise should be taken into account by future studies.

4. Conclusions

In this study, the medium-term performances of different porous asphalt pavement structures were analyzed, and the tire/pavement noise levels of three types of porous pavements (PUC-10, PAC-13, and PUC-10 + PAC-13) in service were compared. The correlations between the OBSI and various pavement condition indicators were analyzed. The conclusions achieved are as follows:
(1)
The DR and SFC of the three porous asphalt pavements diminished significantly with the increasing age of the pavement, while the IRI and RD exhibited no remarkable reduction. The SFC had a relatively obvious decline over 1–4 years of operation, with a decrease rate of 13.8–17.0%.
(2)
Two-layer porous asphalt pavement (PUC-10 + PAC-13) exhibited the best noise reduction effect compared to the other two porous pavement structures for medium-term service.
(3)
The OBSI noise value of the DTC had a significant linear relationship with the SMTD and SFC. The RD had a more significant effect on the OBSI noise value of the PUC-10 porous asphalt pavement. The linear relationship between the OBSI noise value of the PUC-10 + PAC-13 porous asphalt pavement and the SFC was great. This is mainly because the microscopic texture changed under the influences of loading and environmental factors on the pavement, and it resulted in an improvement of the tire/pavement noise value in the high-frequency range. Also, the microscopic wear of the pavement will directly affect the skid-resistance performance of the pavement.
There was no serious pavement distress in the porous asphalt section based on the medium-term investigation, and the proportion of transverse cracks was the main type of distress. Transverse cracks have little impact on tire/pavement noise. Emphasis should be attached to the effect of distress types, especially raveling, on porous asphalt tire/pavement noise in order to establish the relationship between tire/pavement noise and pavement distress.

Author Contributions

H.W.: data curation, visualization, investigation, writing—original draft; G.W.: funding acquisition, project administration; M.L.: formal analysis, writing—review and editing; Y.Z.: funding acquisition, project administration; J.L.: writing—reviewing and editing, validation; D.H.: writing—review and editing, investigation, data curation. P.L.: formal analysis, writing—review and editing, investigation. All authors have read and agreed to the published version of the manuscript.

Funding

General Projects of Beijing Natural Science Foundation (No. 8232015). Pilot Project of Strong Transportation of the Research Institute of Highway Ministry of Transport (No. QG2021-1-4-5). Research on the Life-Cycle Maintenance Strategy of Porous Asphalt Pavement by the Research Project of Jiangsu Communications Holding Company.

Data Availability Statement

Data available on request due to restrictions eg privacy or ethical. The data presented in this study are available on request from the corresponding author. The data are not publicly available due to national highway information security considerations.

Acknowledgments

The authors would like to thank the reviewers for their comments on this paper.

Conflicts of Interest

Ge Wang and Yue Zhao were employed by Jiangsu Expressway Engineering Maintenance Limited Company. The remaining authors declare that the research was conducted in the absence of any commercial or financial relationships that could be construed as a potential conflict of interest.

References

  1. Michiyuki, Y.; Hiroshi, N.; Takuya, M. Sound absorption mechanism of porous asphalt pavement. J. Ince Jpn. 1999, 25, 29–43. [Google Scholar]
  2. Pakholak, R.; Plewa, A.; Gardziejczyk, W. Influence of Type of Modified Binder on Stiffness and Rutting Resistance of Low-Noise Asphalt Mixtures. Materials 2021, 14, 2884. [Google Scholar] [CrossRef] [PubMed]
  3. Rassoshenko, I.; Nikitenko, A.; Ivanov, N. Low-Noise Asphalt Application and Its Efficiency Analysis. Akustika 2019, 34, 127–131. [Google Scholar] [CrossRef]
  4. Tian, J.; Luo, S.; Liu, Z.; Yang, X.; Lu, Q. Determination of Construction Parameters of Porous Ultra-Thin Overlays Based on Laboratory Compaction Studies. Materials 2020, 13, 4496. [Google Scholar] [CrossRef] [PubMed]
  5. Hauwermeiren, W.V.; David, J.; Dekoninck, L. Assessing Road Pavement Quality Based on Opportunistic In-car Sound and Vibration Monitoring. In Proceedings of the 26th International Congress on Sound and Vibration, Montreal, QC, Canada, 7–11 July 2019. [Google Scholar]
  6. Awwal, A.; Mashros, N.; Hasan, S.A.; Hassan, N.A.; Rahman, R. Road Traffic Noise for Asphalt and Concrete Pavement. IOP Conf. Ser. Mater. Sci. Eng. 2021, 1144, 012082. [Google Scholar] [CrossRef]
  7. Vaitkus, A.; Skrodenis, D.; Ernas, O.; Vorobjovas, V. Surface Texture and Layer Permeability Of Aquaplaning Resistant Asphalt Pavements. IOP Conf. Ser. Mater. Sci. Eng. 2021, 1202, 012026. [Google Scholar] [CrossRef]
  8. Li, M.; Lu, H.; Li, J.; Mao, Q.; Chen, L. Performance study and application of porous ultra-thin wearing course for asphalt pavement maintenance. IOP Conf. Ser. Mater. Sci. Eng. 2021, 1075, 012014. [Google Scholar] [CrossRef]
  9. Kleizienė, R.; Šernas, O.; Vaitkus, A.; Simanavičienė, R. Asphalt Pavement Acoustic Performance Model. Sustainability 2019, 11, 2938. [Google Scholar] [CrossRef]
  10. Pizzo, L.; Bianco, F.; Moro, A.; Schiaffino, G.; Licitra, G. Relationship between tyre cavity noise and road surface characteristics on low-noise pavements. Transp. Res. Part D Transp. Environ. 2021, 98, 102971. [Google Scholar] [CrossRef]
  11. Spies, L.; Li, T.; Burdisso, R.; Sandu, C. An artificial neural network (ANN) approach to model Tire-Pavement interaction noise (TPIN) based on tire noise separation. Appl. Acoust. 2023, 206, 109294. [Google Scholar] [CrossRef]
  12. Faßbender, S.; Oeser, M. Investigation on an Absorbing Layer Suitable for a Noise-Reducing Two-Layer Pavement. Materials 2020, 13, 1235. [Google Scholar] [CrossRef] [PubMed]
  13. Zhang, H.; Liu, Z.; Meng, X. Noise reduction characteristics of asphalt pavement based on indoor simulation tests. Constr. Build. Mater. 2019, 215, 285–297. [Google Scholar] [CrossRef]
  14. Jin, D.; Ge, D.; Wang, J.; Malburg, L.; You, Z. Reconstruction of Asphalt Pavements with Crumb Rubber Modified Asphalt Mixture in Cold Region: Material Characterization, Construction, and Performance. Materials 2023, 16, 1874. [Google Scholar] [CrossRef] [PubMed]
  15. Jaskula, P.; Ejsmont, J.A.; Gardziejczyk, W.; Mioduszewski, P.; Stienss, M.; Motylewicz, M.; Szydlowski, C.; Gierasimiuk, P.; Rys, D.; Wasilewska, M. Bitumen-Based Poroelastic Pavements: Successful Improvements and Remaining Issues. Materials 2023, 16, 983. [Google Scholar] [CrossRef] [PubMed]
  16. Chu, L.; Tan, K.H.; Fwa, T.F. Evaluation of wearing course mix designs on sound absorption improvement of porous asphalt pavement. Constr. Build. Mater. 2017, 141, 402–409. [Google Scholar] [CrossRef]
  17. Gao, L.; Wang, Z.; Xie, J.; Wang, Z.; Li, H. Study on the sound absorption coefficient model for porous asphalt pavements based on a CT scanning technique. Constr. Build. Mater. 2020, 230, 117019. [Google Scholar] [CrossRef]
  18. Mahmud, M.; Hassan, N.A.; Hainin, M.R.; Che, R.I.; Mashros, N. Characterisation of microstructural and sound absorption properties of porous asphalt subjected to progressive clogging. Constr. Build. Mater. 2021, 283, 122654. [Google Scholar] [CrossRef]
  19. Zhang, Y.; Li, H.; Abdelhady, A.; Du, H. Laboratorial investigation on sound absorption property of porous concrete with different mixtures. Constr. Build. Mater. 2020, 259, 120414. [Google Scholar] [CrossRef]
  20. Xu, B.; Li, M.; Liu, S.; Fang, J.; Ding, R.; Cao, D. Performance analysis of different type preventive maintenance materials for porous asphalt based on high viscosity modified asphalt. Constr. Build. Mater. 2018, 191, 320–329. [Google Scholar] [CrossRef]
  21. Zw, A.; Jx, A.; Lei, G.A.; Ml, B.; Yl, A. Improvement of acoustic model and structural optimization design of porous asphalt concrete based on meso-structure research. Constr. Build. Mater. 2020, 265, 120327. [Google Scholar]
  22. Chen, D.; Ling, C.; Wang, T.; Su, Q.; Ye, A. Prediction of tire-pavement noise of porous asphalt mixture based on mixture surface texture level and distributions. Constr. Build. Mater. 2018, 173, 801–810. [Google Scholar] [CrossRef]
  23. Alber, S.; Ressel, W.; Liu, P.; Wang, D.; Oeser, M. Influence of soiling phenomena on air-void microstructure and acoustic performance of porous asphalt pavement. Constr. Build. Mater. 2018, 158, 938–948. [Google Scholar] [CrossRef]
  24. Amrina, R.J.A.; Buchari, E. Evaluation Pavement Deteriorating Condition on Surface Distress Index (SDI) Data Using Radial Basis Function Neural Networks (RBFNN). J. Phys. Conf. Ser. 2019, 1198, 032008. [Google Scholar]
  25. Afarin, K.; Amir, G. Machine learning for developing a pavement condition index. Autom. Constr. 2022, 139, 104296. [Google Scholar]
  26. Piryonesi, S.M.; Tamer, E. Examining the relationship between two road performance indicators: Pavement condition index and international roughness index. Transp. Geotech. 2021, 26, 100441. [Google Scholar] [CrossRef]
  27. Cao, L.; Li, L.W.; Yang, C.; Zhang, B.; Dong, Z. Performance prediction of expressway pavement in high maintenance level areas based on cosine deterioration equation: A case study of Zhejiang Province in China. J. Road Eng. 2022, 2, 267–278. [Google Scholar] [CrossRef]
  28. Ganji, M.R.; Golroo, A.; Sheikhzadeh, H.; Ghelmani, A.; Bidgoli, M.A. Dense-graded asphalt pavement macrotexture measurement using tire/road noise monitoring. Autom. Constr. 2019, 106, 102887. [Google Scholar] [CrossRef]
  29. Li, M.; Zeng, F.; Xu, R.; Cao, D.; Li, J. Study on Compatibility and Rheological Properties of High-Viscosity Modified Asphalt Prepared from Low-Grade Asphalt. Materials 2019, 12, 3776. [Google Scholar] [CrossRef]
  30. Chen, L.; Chen, J.; Li, M.; Li, J.; Li, Y. Research on high-temperature rheological performance of fiber reinforced high-viscosity asphalt mastics. Constr. Build. Mater. 2023, 397, 132397. [Google Scholar] [CrossRef]
  31. Chen, L.; Chen, J.; Li, M.; Li, J.; Li, Y. Study of fatigue performance of fiber reinforced high-viscosity asphalt mastic based on rheology. Constr. Build. Mater. 2023, 400, 132784. [Google Scholar] [CrossRef]
  32. JTG 5210-2018; Highway Performance Assessment Standards. Ministry of Transport of the People’s Republic of China: Beijing, China, 2018.
  33. GB/T 26764-2011; Multifunctional High-Speed Highway Condition Monitor. Standardization Administration of China: Beijing, China, 2011.
  34. JTG/T E61-2014; Specifications of Automated Pavement Condition Survey. Ministry of Transport of the People’s Republic of China: Beijing, China, 2014.
  35. JTG E20-2011; Standard Test Methods of Bitumen and Bituminous Mixtures for Highway Engineering. Ministry of Transport of the People’s Republic of China: Beijing, China, 2011.
  36. AASHTO T 360-16; Standard Test Method for Measuring Tire/Road Noise Using the On-Board Sound Intensity (OBSI) Method. American Association of State Highway and Transportation Officials: Washington, DC, USA, 2020.
  37. Zheng, N.; Chen, X.; Bi, J.; Wu, X. Research on the relationship between anti-skid performance and various aggregate micro texture based on laser scanning confocal microscope. Constr. Build. Mater. 2022, 316, 125984. [Google Scholar]
  38. Zheng, N.; Bi, J.; Dong, S.; Lei, J.; He, Y.; Cui, Z.; Chen, L. Testing and evaluation for long-term skid resistance of asphalt pavement composite seal using texture characteristics. Constr. Build. Mater. 2022, 356, 129241. [Google Scholar] [CrossRef]
  39. Víctor, V.; Fernando, T.; Pedro, H.; Santiago, P. Surface Aging Effect on Tire/Pavement Noise Medium-Term Evolution in a Medium-Size City. Coatings 2018, 8, 206. [Google Scholar]
Figure 1. Diagram of pavement structures. (a) Section of DTC-10 compact covering. (b) Section of PUC-10 porous covering. (c) Section of PAC-13 porous pavement surface. (d) Section of PUC-10 + PAC-13 porous pavement surface.
Buildings 14 00064 g001
Figure 2. Porous asphalt mixtures. (a) PUC-10 (10~30 mm). (b) PAC-13 (40~50 mm). (c) PUC-10 + PAC-13 (20~40 mm + 35~60 mm).
Buildings 14 00064 g002
Figure 3. CiCS vehicle.
Buildings 14 00064 g003
Figure 4. OBSI measurement equipment.
Buildings 14 00064 g004
Figure 5. Changes of pavement condition indicators by years of operation. (a) DR. (b) SFC. (c) RD. (d) IRI.
Buildings 14 00064 g005
Figure 6. The proportion of pavement distress by types.
Buildings 14 00064 g006
Figure 7. The change of crack spacing by years of operation.
Buildings 14 00064 g007
Figure 8. Porous pavement distress. (a) Transverse crack. (b) Raveling.
Buildings 14 00064 g008
Figure 9. PUC-10 pavement service performance scores.
Buildings 14 00064 g009
Figure 10. PAC-13 pavement service performance scores.
Buildings 14 00064 g010
Figure 11. PUC-10 + PAC-13 pavement service performance scores.
Buildings 14 00064 g011
Figure 12. OBSI of each lane at different test speeds.
Buildings 14 00064 g012
Figure 13. Distribution of pavement condition indicators in different lanes.
Buildings 14 00064 g013
Figure 14. OBSI distribution in different pavement structures.
Buildings 14 00064 g014
Table 1. Designed gradations of different asphalt mixtures.
Type of MixturePassing Percentage (%) of the Following Sieve Holes (mm)Polyester Fiber Content (%)Bitumen Ratio (%)
16.013.29.57.56.74.752.361.180.60.30.150.075
DTC-1010010092.7-44.928.823.417.111.18.986.40.24.85
PUC-1010010090.072.0-25.312.311.99.17.56.45.40.14.58
PAC-1310087.54.8--13.711.28.77.36.25.44.80.14.40
Table 2. Performances of different asphalt mixtures.
Indicator NameUnitDTC-10PUC-10PAC-13
Void content percentage%4.220.419.9
Marshall StabilitykN9.17.227.42
Residual Mashall stability percentage%94.690.489.7
Residual Freeze-thaw split tensile strength ratio%93.495.784.8
Standard raveling loss percentage%3.325.37.5
Immersion raveling loss percentage%-4.39.2
Dynamic Stabilitytime/mm523165749043
PermeabilitymL/min5265707116
Table 3. Variable settings for the linear regression model.
VariableVariable Setting
Test speed1 = 80 km/h; 2 = 100 km/h
Lane1 = Passing lane; 2 = Driving lane
Pavement structure1 = Compact gradation pavement; 2 = PUC-10; 3 = PAC-13; 4 = PUC-10 + PAC-13
Type of pavement distress1 = No damage; 2 = Transverse cracks; 3 = Longitudinal cracks; 4 = Repair
Table 4. Correlation analysis between OBSI and different indicators (n = 2280).
IndicatorM (SD)RangeOBSISpeedLanePavement StructurePavement Distress
OBSI (dB)Correlation
significant
91.33 (2.30)83.83–98.651
Speed (km/h)Correlation
significant
--0.585 *
0.000
1
LaneCorrelation
significant
--0.317 *
0.000
0.000
1.000
1
Pavement StructureCorrelation
significant
--−0.201 *
0.000
0.000
1.000
0.161 *
0.000
1
Pavement distressCorrelation
significant
- 0.034
0.109
0.003
0.899
0.036
0.089
−0.195 *
0.000
1
* Correlation is significant at a confidence level (two-tailed) of 0.01.
Table 5. Correlation analysis of OBSI and various indicators of the different pavement structures.
Pavement StructureIndicatorSMTDRDDRSFCIRI
DTC-10Correlation
Significance
0.567 *
0.000
0.035
0.619
−0.123
0.083
−0.304 *
0.000
−0.121
0.088
PUC-10Correlation
Significance
0.265
0.157
0.545 *
0.002
0.084
0.738
0.132
0.488
−0.089
0.638
PAC-13Correlation
Significance
0.127
0.067
−0.135
0.052
0.074
0.486
0.082
0.240
0.022
0.746
PUC-10 + PAC-13Correlation
Significance
−0.052
0.554
−0.024
0.786
0.142
0.095
−0.231 *
0.008
−0.044
0.618
* Correlation is significant at a confidence level (two-measure) of 0.01.
Disclaimer/Publisher’s Note: The statements, opinions and data contained in all publications are solely those of the individual author(s) and contributor(s) and not of MDPI and/or the editor(s). MDPI and/or the editor(s) disclaim responsibility for any injury to people or property resulting from any ideas, methods, instructions or products referred to in the content.

