Abstract
Bolted connections have become the most widely used connection method in steel structures. Over the long-term service of the bolts, loosening damage and other defects will inevitably occur due to various factors. To ensure the stability of bolted connections, an efficient and precise method for identifying loosened bolts in a given structure is proposed based on computer vision technology. The main idea of this method is to combine deep learning with image processing techniques to recognize and label the loosening angle from bolt connection images. A rectangular steel plate was taken as the test research object, and three grade 4.8 ordinary bolts were selected for study. The analysis was conducted under two conditions: manual loosening and simulated loosening. The results showed that the method proposed in this article could accurately locate the position of the bolts and identify the loosening angle, with an error value of about ±0.1°, which proves the accuracy and feasibility of this method, meeting the needs of structural health monitoring.
1. Introduction
Steel structural facilities have three primary connection methods: welding, bolting, and riveting. Among these, the most commonly used is bolting, or bolted connections. Bolted connections have several advantages over welding and riveting, such as a more straightforward structure, easy installation, a low cost, and reliable quality. Due to these advantages, bolted connections are widely used in various fields, including building structures, mechanical products, power equipment, transportation, aerospace engineering, and more [1]. However, bolted connections often occupy critical parts of steel structures, and their connection parts are continuously exposed to damp air, acid rain, and other harsh environments, making them susceptible to external damage like chemical corrosion. Additionally, due to lateral loads, mechanical shocks, and vibrations, bolted connection parts often operate in a damaged state for extended periods, which gradually reduces the pre-tightening force. This can eventually cause loosening or detachment of the connection joints, leading to structural damage [2].
Bolted connections are widely applied in civil, mechanical, and aerospace engineering steel structures. Bolt loosening is one major threat to structural safety. Caused by vibration or repetitive loads, the loosened bolt may not be easily identified initially but could weaken the structural integrity and lead to catastrophic failure.
To mitigate the structural damage caused by bolt loosening, human inspection is one of the most dominant methods in the engineering practice, particularly in civil engineering. For example, the Federal Highway Administration (FHWA) in the United States [3] requires routine bridge inspection every two years, during which the bolts of steel connections are inspected, recorded, and monitored by trained engineers. However, human inspection is expensive and prone to error, especially if the bolt loosening is subtle. In addition, some structural bolts are located in inaccessible places, making it more challenging to inspect bolt loosening promptly.
To date, extensive research efforts have been made to leverage advanced technologies for detecting and monitoring bolt loosening. Some of the applications include piezoelectric sensors [4,5], vibration-based methods [6,7], and electromechanical impedance [8,9]. Despite their successes, one commonality in these methods is that physical sensor deployments and/or cabling work are required, leading to cost increments for monitoring systems in the case of sensing a large number of steel bolts.
Non-contact vision-based methods, on the other hand, have shown great promise for monitoring bolt loosening. Such technologies rely on consumer-grade digital cameras to collect images of a structural surface at different inspection periods. Then, the image features related to bolt loosening (e.g., rotation of the bolt head) can be extracted through computer vision algorithms. Vision-based bolt loosening methods are appealing as they are non-contact, low-cost, and easy to deploy. Through the integration of other image collection platforms, such as unmanned aerial vehicles, these vision-based approaches could be ideal candidates for monitoring the steel bolts of civil structures that are inaccessible to human inspectors.
In this paper, we propose a vision-based approach for bolt loosening detection. The proposed approach can reliably identify loosened bolts and quantify the rotation angle of a bolt head. A laboratory experiment is conducted using a simple bolted steel plate to validate the performance of the proposed approach. The results indicate the effectiveness of the proposed approach for bolt loosening inspection in engineering applications.
2. Related Work
The health monitoring of bolted steel connections using vision-based methods is not new and has been well investigated. In 2004, Mazzeo et al. [10] developed a machine-learning method to identify the absence of bolts between rails and sleepers. A few years later, Marino et al. [11] improved the detection accuracy of the same work by combining the discrete wavelet transform technique with a neural network. As a result, the proposed method can achieve an accuracy of 99.6% in detecting visible bolts and 95% in detecting missing bolts. Liu et al. [12] investigated a novel machine vision approach to detect the absence of a bolt installed between the safety chain and the brake beam in freight trains. The proposed method shows promising results even when the collected image is subjected to a more complex background. Nevertheless, as mentioned above, these studies can only offer binary detection results on a bolt’s presence/absence. Whether the bolt is subjected to loosening is out of the scope of these studies.
Instead of inspecting the absence of a bolt, an increasing interest has been reported in the research community in quantifying bolt loosening through vision-based approaches. Two research groups (Cha et al. [13] and Park et al. [14]) conducted the earliest attempts in this field, after which more related work can be found, particularly in the fields of civil and mechanical engineering. In the rest of this section, a literature review is performed by discussing nine articles published in peer-reviewed journals from 2015 to 2019.
Cha et al. [13] investigated a vision-based approach for detecting loosened bolts. The proposed approach first utilized the Hough transform method to extract edge features of the bolt boundary, such as the dimensions of bolt heads and wrench holes. Based on such dimensions, the loosened and non-loosened bolts were classified by a support vector machine (SVM) to identify the loosened bolt effectively. Later on, follow-up work was conducted by Ramana et al. [15] through the usage of the Viola–Jones algorithm and a revised SVM. As a result, the proposed method enabled a better robustness of bolt loosening detection against a broader scope of image angles and distances.
Park et al. [14] applied the Hough transform method, Canny edge detector, and a series of computational algorithms to identify the rotation of bolt heads from images. A laboratory test was conducted on a bolted ring-shaped flange joint to validate the performance of this approach. Then, the proposed method was revised by Huynh et al. [16] by adding deep learning technology to enable a quasi-autonomous approach for bolt loosening detection. A field deployment on a box girder bridge was performed using an uncrewed aerial vehicle to validate the performance of this method.
Zhao et al. [17] developed a deep learning-based method to detect loosened bolts. The method utilized a convolutional neural network to recognize a unique texture pattern on a bolt head and then tracked the movement of this pattern once the bolt rotated. Zhang et al. [18] modified and applied such a concept for tracking the change in bolt height before and after bolt loosening. As a result, loosened bolts could be identified from images taken at particular camera shooting angles.
Sun et al. [19] proposed a binocular vision-based method to detect the bolt loosening on a bogie component in a train. Using edge extraction and 3D reconstruction technologies, the method can track subtle changes in the bolt head after loosening. Wang et al. [20] demonstrated a novel detection method for bolt loosening inspection in the oil and gas industry. The established method first utilized a convolutional neural network for bolt recognition. Then, the bolt rotation angles could be identified using the Hough transform line detection technique. Kong et al. [21] reported an image registration methodology to detect loosened bolts in steel connections. The method overlapped images of the steel bolts before and after loosening and found the differential image features caused by bolt-head rotation.
In reviewing the above-related works, one major challenge in existing methods is to robustly identify and quantify bolt loosening damage against texture changes of the structural surface. This is a concern in transferring such technologies from laboratory to practice application as bolted steel connections in the field may be contaminated by unexpected textures such as rust, dust, and corrosion marks. Particularly in civil engineering, the surfaces of steel connections could vary dramatically due to environmental factors like temperature and humidity during intervals between inspection periods. Such a texture change on the structural surface would provoke intensity redistribution at/around steel bolts in the collected images, leading to the possible failures of these methods.
The main contribution of this study is to investigate a robust vision-based approach to reliably detect loosened bolts against texture changes of the structural surface. Furthermore, through the geometric transformation technique, the loosened bolts can be quantified by automatically recovering the rotation angle of the bolt heads. To the authors’ best knowledge, this is the first effort reported in the literature on the vision-based detection and quantification of bolt loosening damage against surface texture changes.
3. Bolt Loosening Detection Method Based on Computer Vision Technology
3.1. Overall Detection Process
This paper integrates deep learning algorithms and digital image processing technologies, designing a bolt-loosening detection framework based on computer vision technology to achieve bolt-loosening recognition and angle calculation. The overall detection process is divided into two steps: Bolt detection and positioning based on the YOLOv2 algorithm and bolt loosening identification based on image feature matching. The specific process steps are shown in Figure 1.
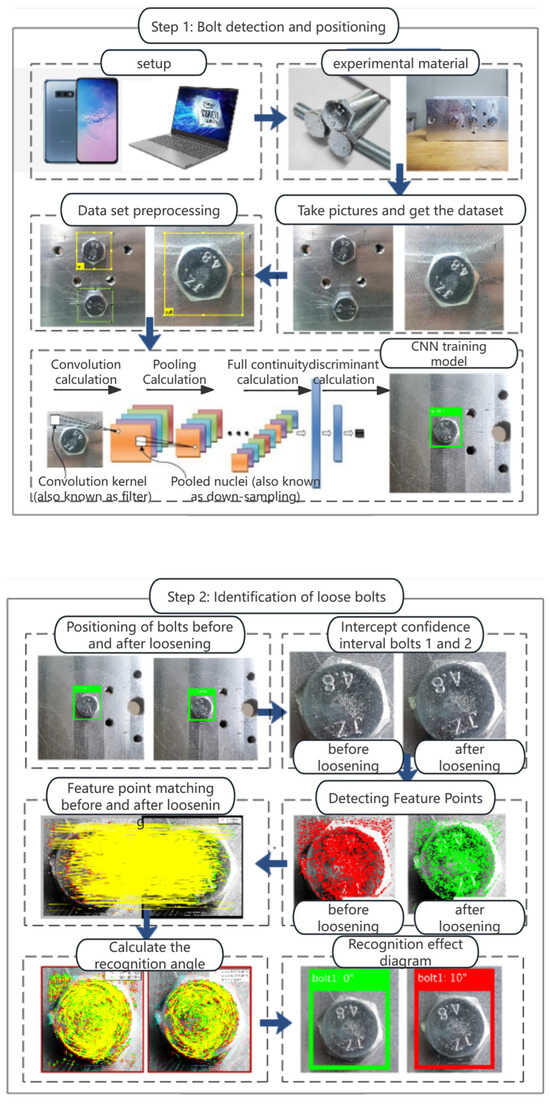
Figure 1.
Flowchart of Bolt Loosening Identification.
3.2. Bolt Detection and Positioning Based on Deep Learning
The KLT corner tracking algorithm is an abbreviation for the Kanade–Lucas–Tomasi tracking algorithm [18,22], and it is one of the classic corner-tracking algorithms. This algorithm assumes that the target only produces consistent small displacements in the video stream, and the grayscale variation in the target is not significant.
There are currently two directions for the task of object detection. One is based on traditional algorithms, but it has not been widely adopted due to redundant selection boxes and low efficiency. The other is based on deep learning algorithms, such as the two-stage series of Fast r-cnn, Faster r-cnn algorithms, and the one-stage series of SSD and YOLO algorithms.
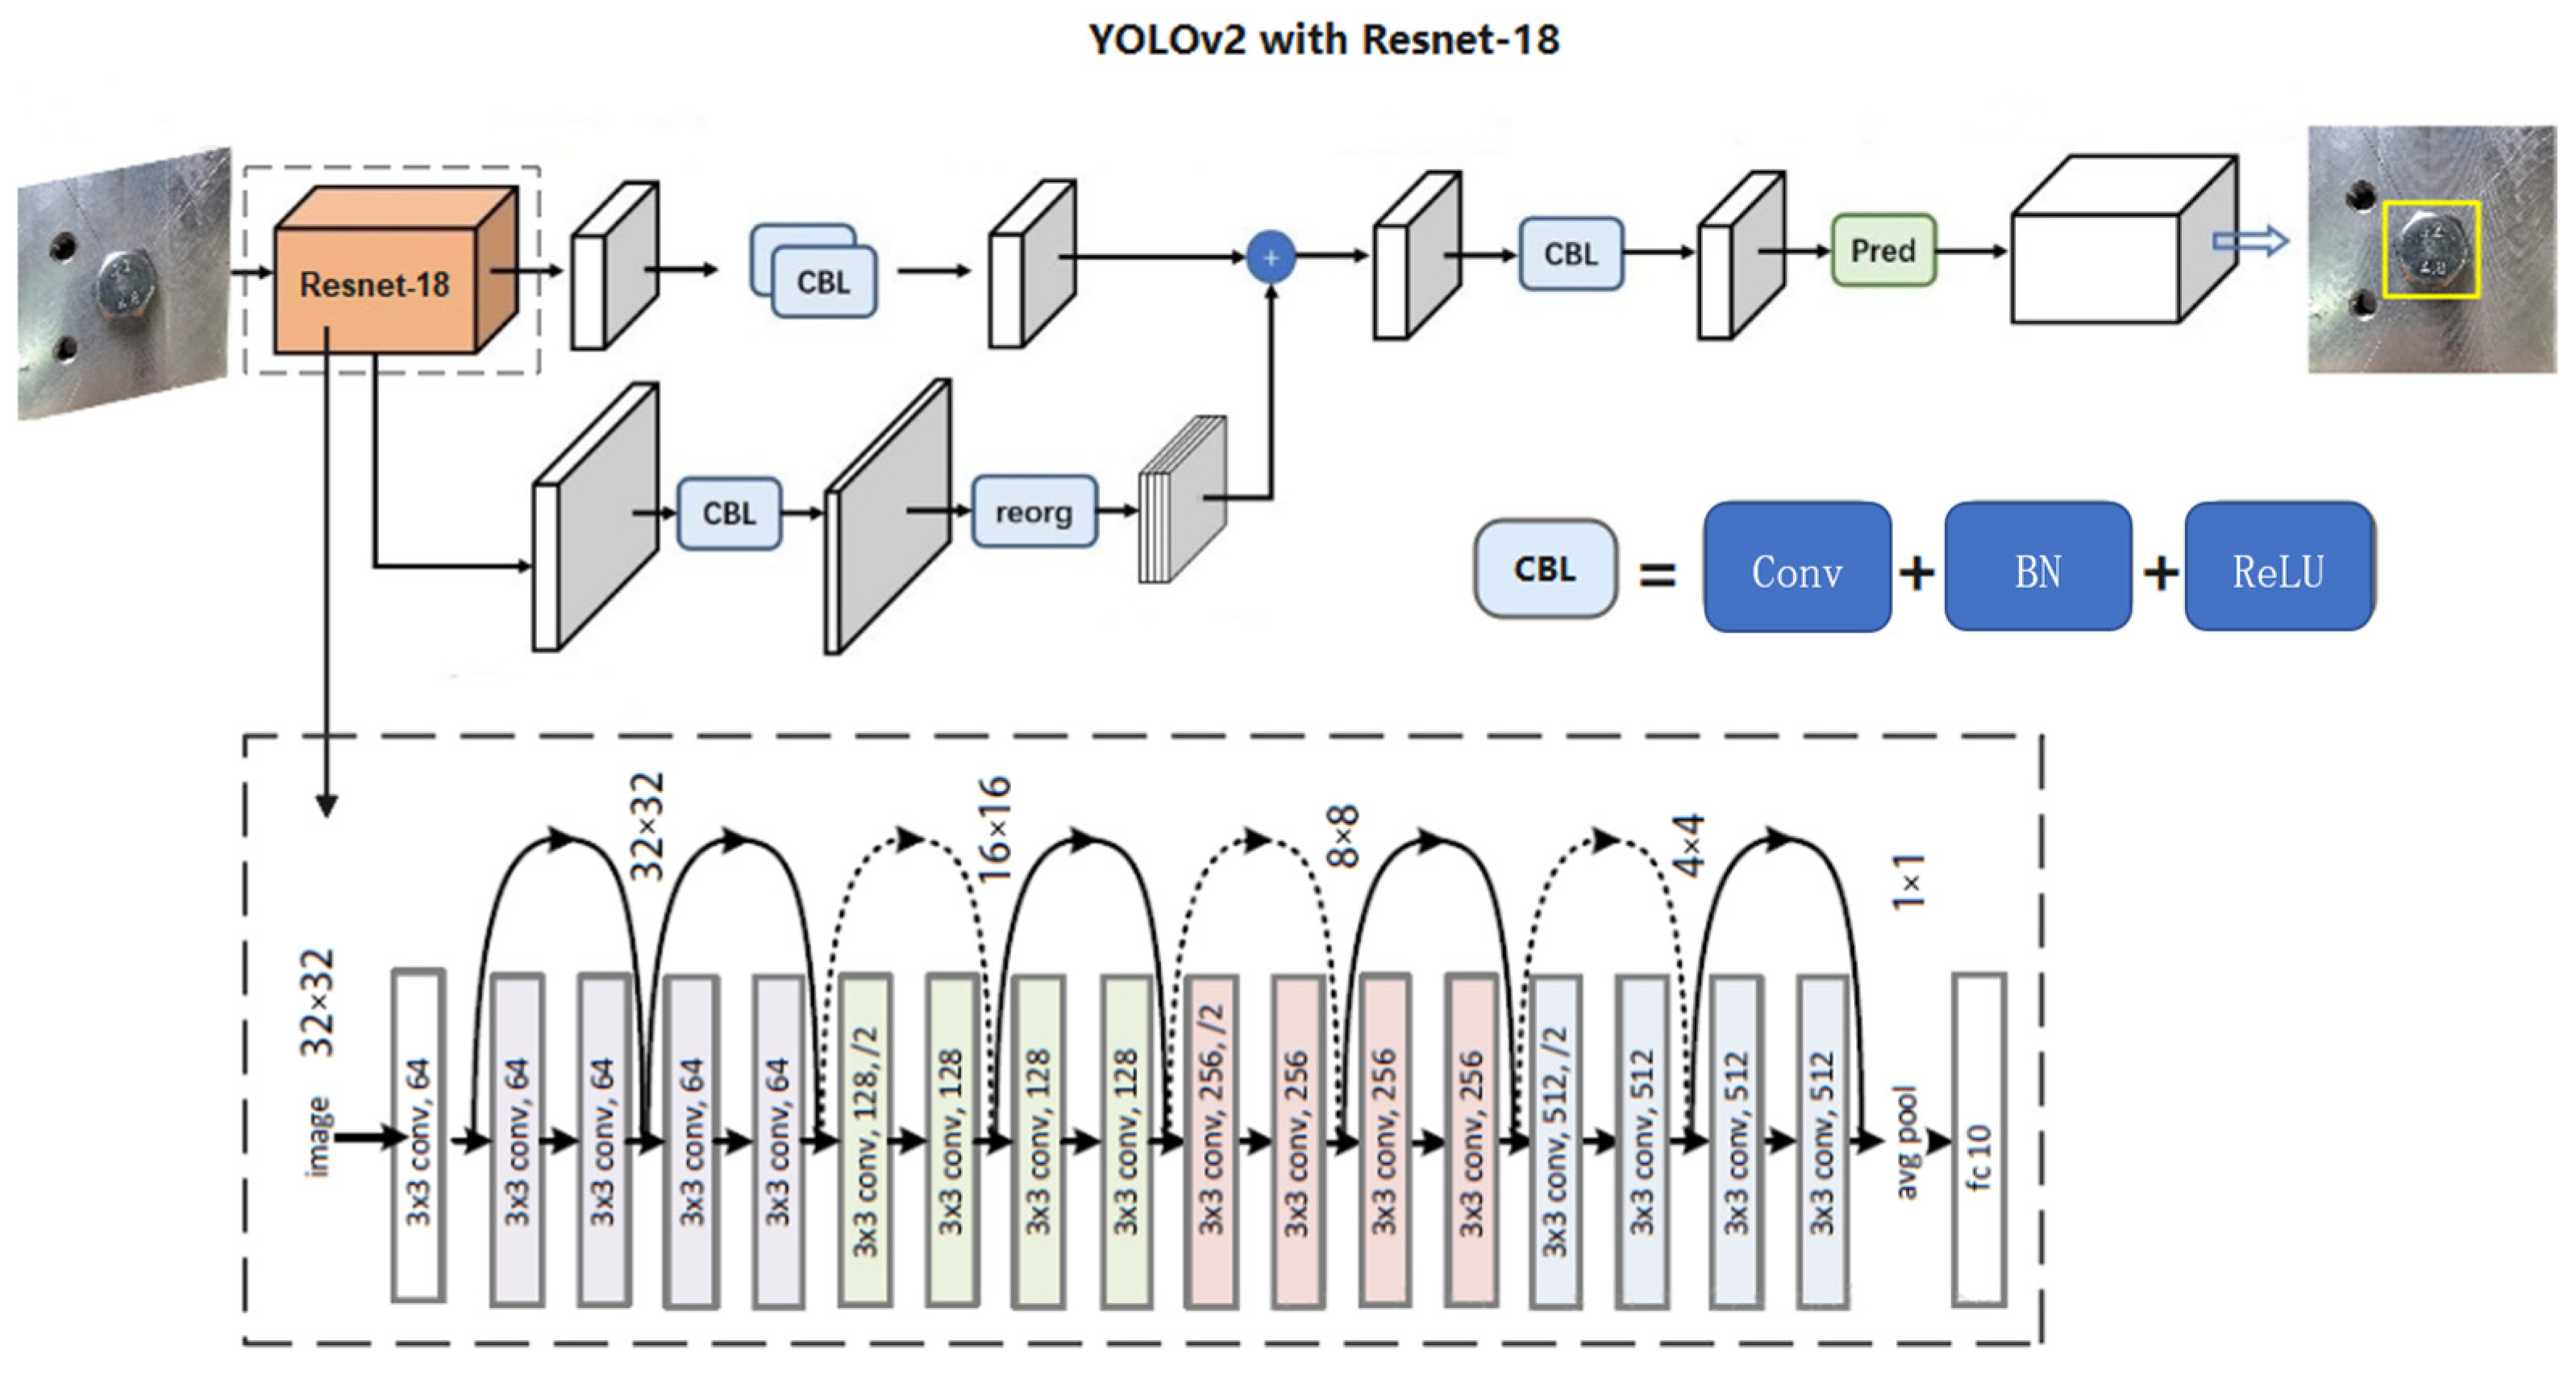
YOLOv2 [23] is the second-generation algorithm of the YOLO series, and its detection performance is excellent. Based on the engineering reality that bolts belong to the small target category, this paper proposes an improved YOLOv2 model, as shown in Figure 2.
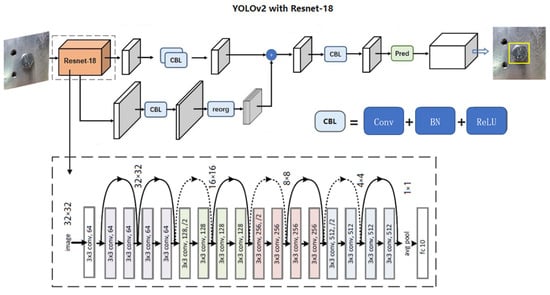
Figure 2.
Improved YOLOv2 Model.
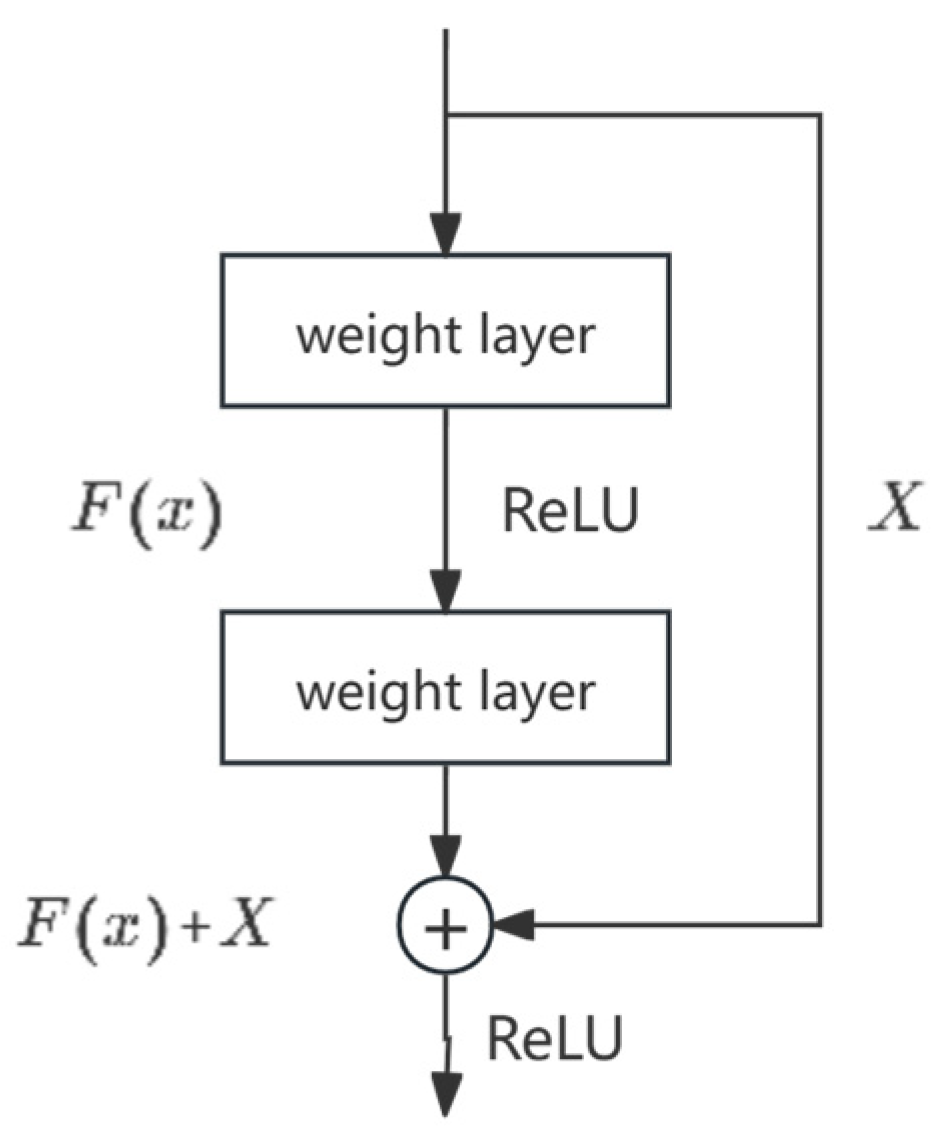
Using transfer learning, the convolutional residual network Resnet18 [24], which has a deep network depth and a low computational load, and can extract rich features, is used as the backbone network for YOLOv2. The advantage of introducing the residual network is to reduce the gradient vanishing or gradient explosion problem caused by the excessive depth of the network. The structure of the Resnet18 residual is shown in Figure 3.
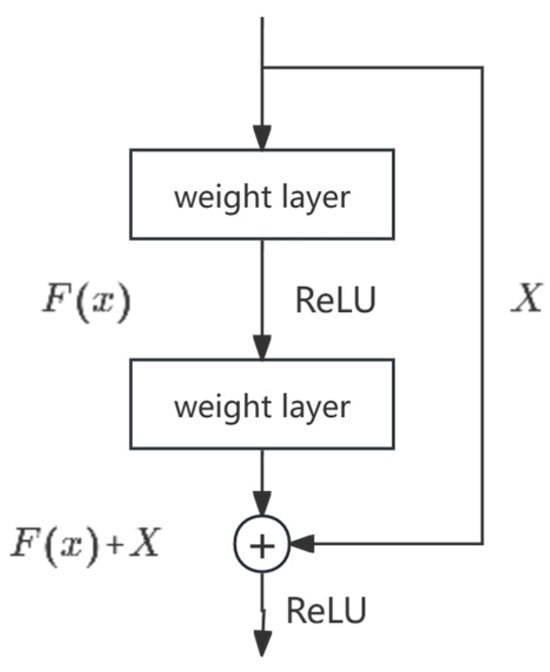
Figure 3.
Residual Structure Diagram.
The residual module is represented by Formula (1):
In the above formula, is the input of the residual module, is the output of the residual module, represents the residual mapping, and is the weight coefficient of the ith layer. When the second layer is included, Formula (2) is used for calculation.
In the above formula, is the weight coefficient of the first layer, is the weight coefficient of the second layer, and represents the activation function.
A smartphone with a dual-lens setup (16 million pixels + 12 million pixels) was used to capture the image dataset required for training the bolt detector. The dataset was then preprocessed with unified numbering and other preprocessing tasks. The experimental equipment was a computer with an Intel(R)Core(TM)i5 processor and 8.00 GB of memory. The software environment was the Windows 10 system, with the overall algorithm framework written on the Matlab platform.
The test bolt image data were annotated using the Image Labeler in Matlab 2016a software. The dataset was expanded through data augmentation. A dataset of 1000 bolt images was obtained, with 80% used as the training set and 20% as the validation set. The algorithm used the SGDM, with a learning rate set to 0.001, MinbatchSize set to 8, and MaxEpochs set to 20. Feature extraction was performed using the Resnet18 deep residual network to train the bolt detector based on the YOLOv2 model.
Hyperparameters are fixed parameters set before a model begins training, determining the efficiency of network training and the detection performance of the model. This paper established hyperparameters based on the device’s memory capacity and the relevant literature [25,26,27]. The hyper-parameters are listed in Table 1.

Table 1.
The setting of hyper-parameters.
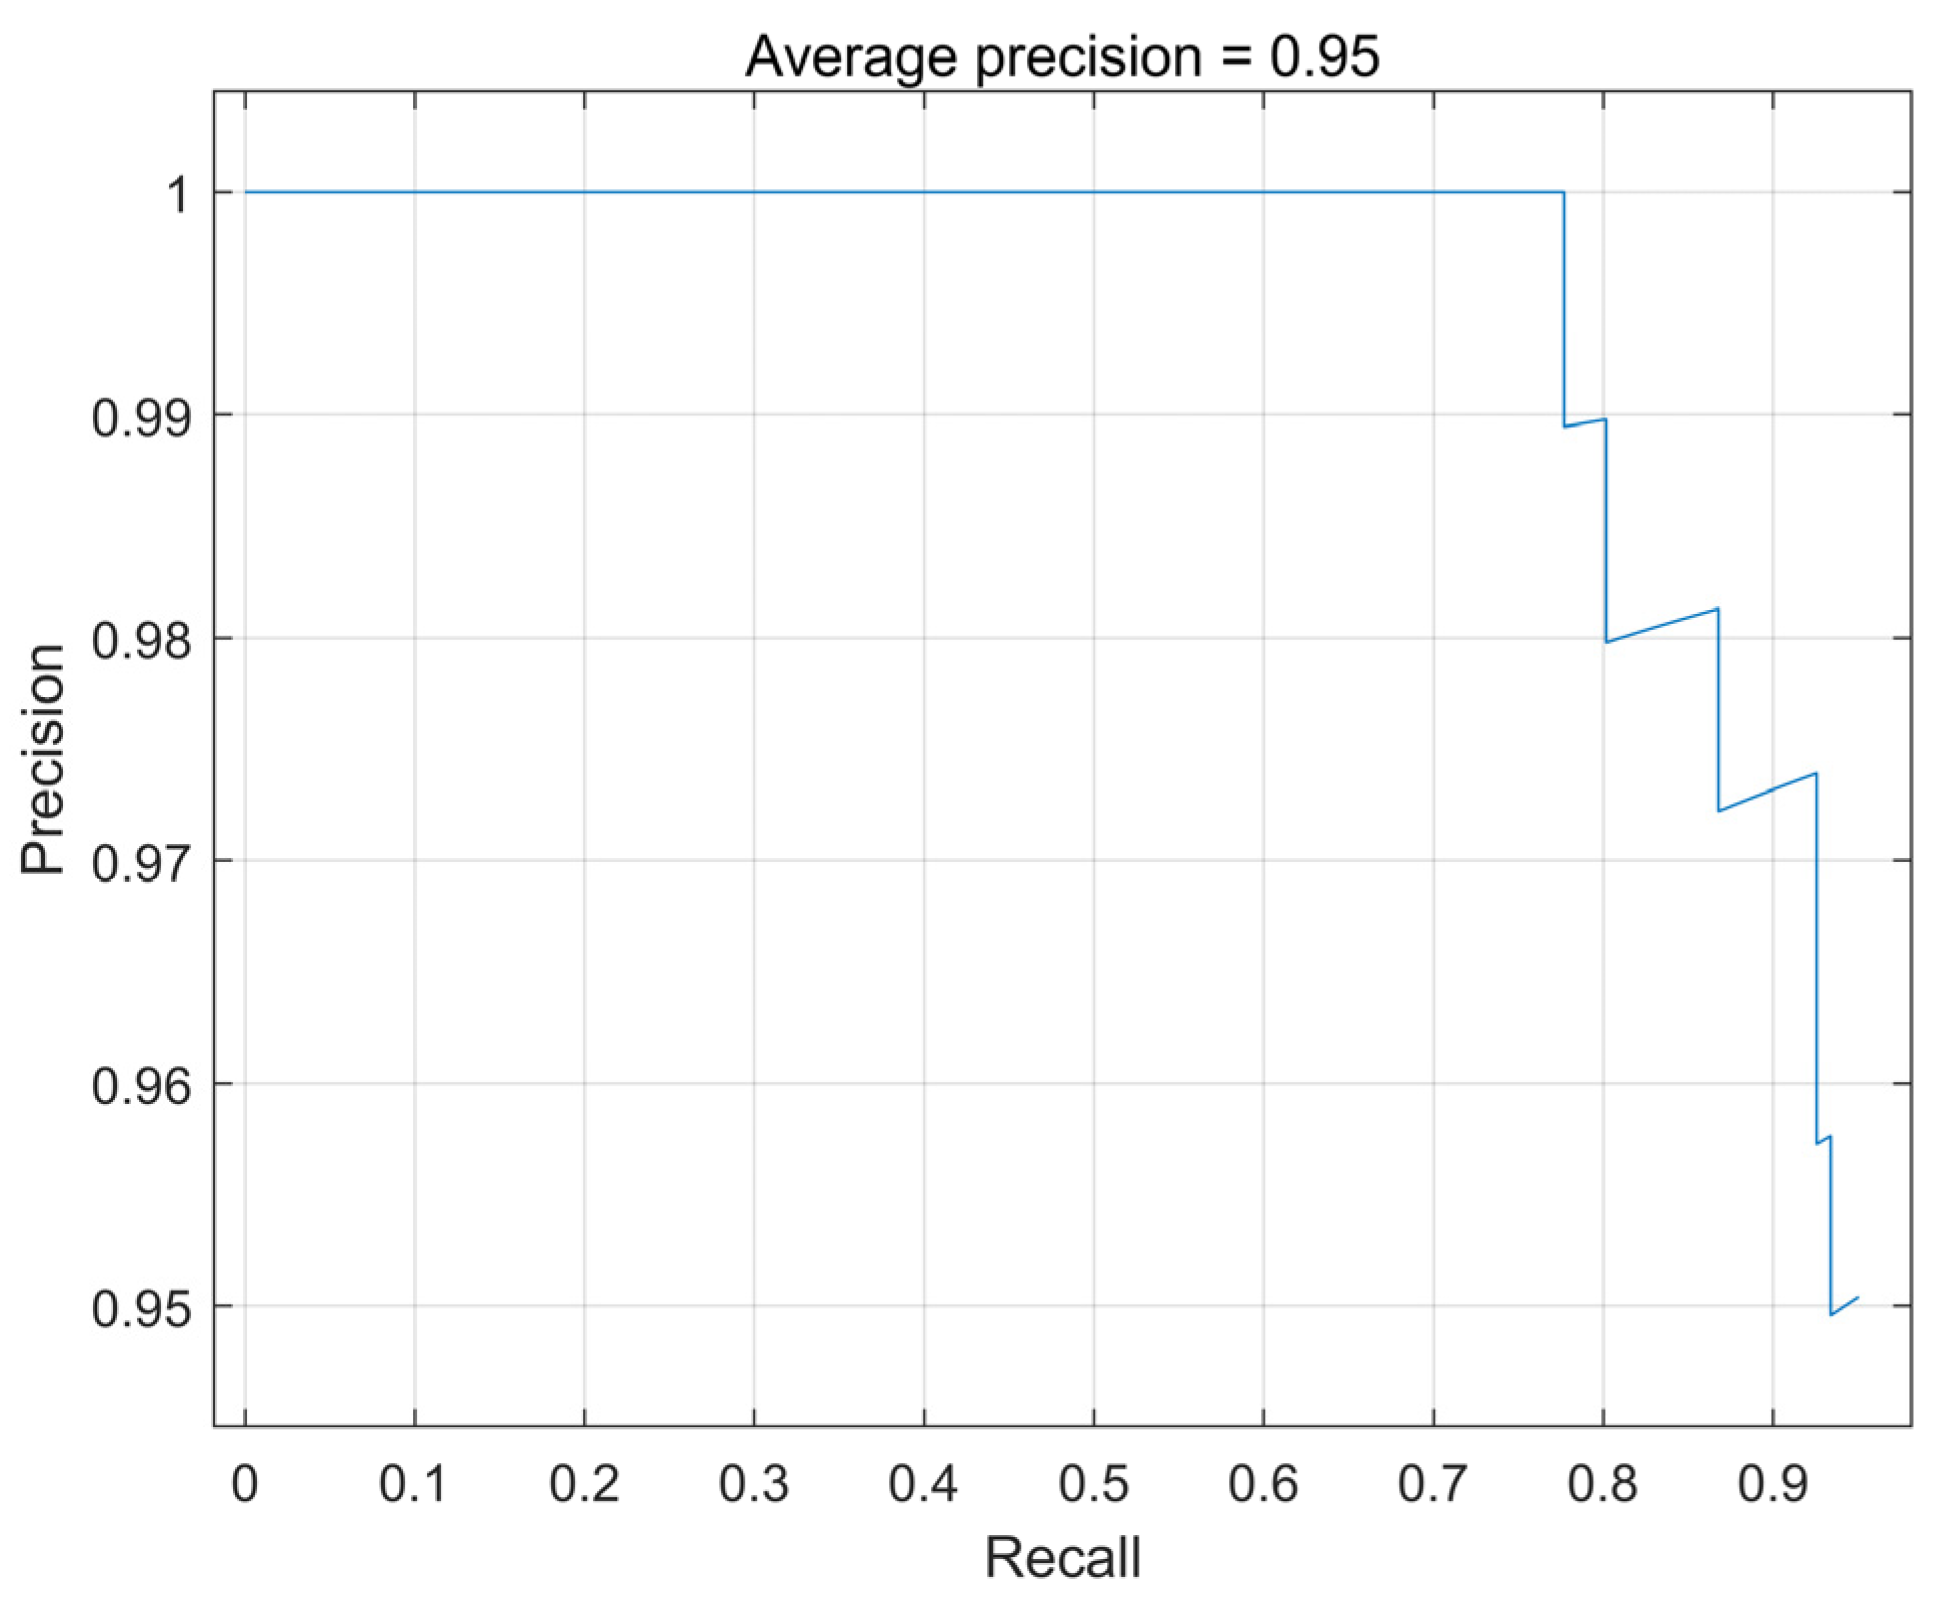
After the training was completed, the model’s accuracy was tested using a test set to obtain Precision and Recall data plotted on a coordinate axis. The area enclosed by this curve and the axes represent the model’s accuracy; the larger the area, the better the model’s detection performance. The graph shows that the Precision–Recall curve of the bolt detection model can achieve a Recall rate of 80% or higher without compromising its accuracy. As the Recall gradually increases, the detection accuracy experiences a slight reduction and eventually stabilizes around 0.95. Through calculations, it was determined that the average Precision (Average Precision) of the bolt detection model reached 0.95 during Recall, increasing from 0 to 1. As shown in Figure 4, the trained bolt-detection model achieved an average accuracy of up to 95%, meeting the detection requirements.
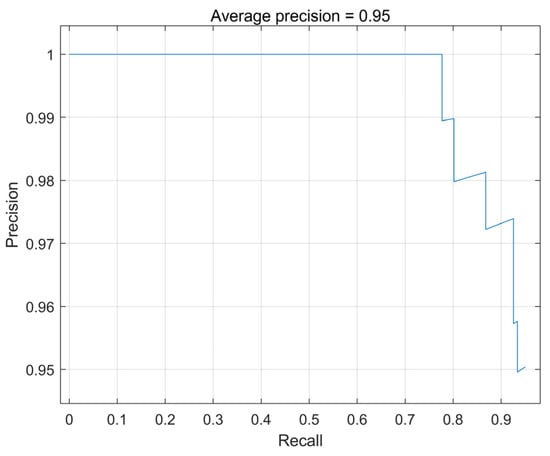
Figure 4.
Average Accuracy Curve.
3.3. Bolt Loosening Identification Based on ORB Image Matching Algorithm
ORB, which stands for Oriented FAST and Rotated BRIEF, is a new key point detection and feature description algorithm proposed by Rublee in 2011 [28]. This algorithm merges the speed advantages of FAST key point detection [29] with the stability benefits of BRIEF’s binary feature description [30]. The integration of these two characteristics results in ORB’s impressive speed and stability. In this study, we use this algorithm to detect and extract feature points from two images of bolts before and after loosening. We then match the corresponding feature points and their pixel positions. Through MLESAC [31], we estimate the geometric transformation matrix of the matched points, thereby identifying the loosening angle of the bolt.
- (1)
- oFAST Feature Extraction Algorithm
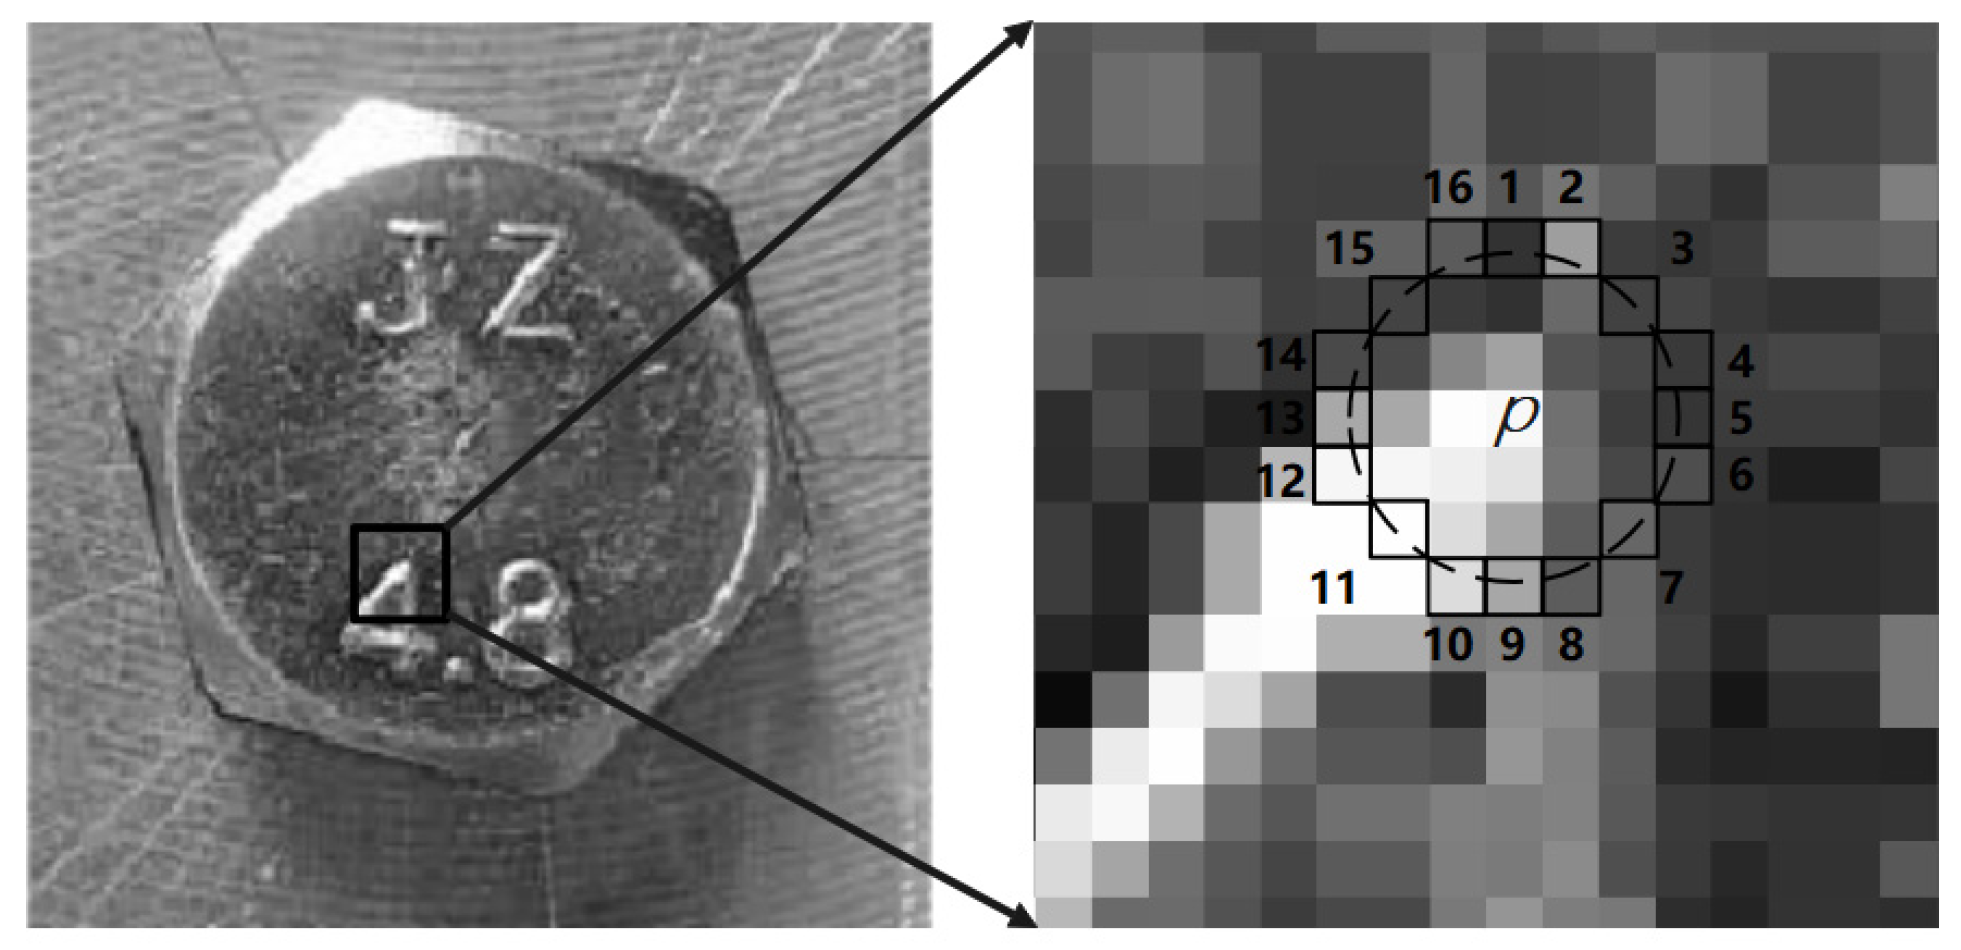
The principle of the FAST key point extraction algorithm is to use the fluctuation in grayscale differences between pixel points to achieve the goal of rapid feature point extraction. As shown in Figure 5, we take 16 bolt pixel points on the circumference with p as the center and r as the pixel radius and compare the difference with the grayscale value of the central pixel.
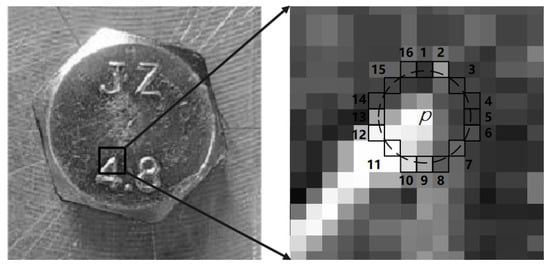
Figure 5.
Local Pixel Diagram of Bolt.
If there are consecutive pixel points that satisfy Formula (3), then:
In the formula: represents the pixel value of a certain point on the circumference, represents the pixel value of the center of the circle, is a predefined threshold, and represents the set of all pixel points on the circumference with pixel point p as the center.
While the FAST algorithm detects extremely fast, the extracted key points do not include related information such as direction and scale. To address this shortcoming, Rublee proposed an improved oFAST algorithm. After determining the bolt key points, the algorithm adds direction to the detected vital points using the grayscale centroid method [18], thus resolving the lack of directionality in the FAST algorithm.
- (2)
- rBRIEF Key Point Description Algorithm
After extracting key points using oFAST, the image’s critical information must undergo relevant description. The primary idea of the BRIEF key point description algorithm is to randomly select several pairs of points near the extracted vital points and combine the grayscale values of these point pairs into a binary string. This string is then used as the feature descriptor for that critical point.
Suppose a smooth image is selected. Within its domain of size S × S, the description is carried out using the binarization Formula (4):
where represents the grayscale pixel value of the smoothed image domain at a certain pixel location.
If pairs of points are selected, the resulting feature vector is converted into a -dimensional binary string descriptor, as shown in Formula (5):
where can be 128, 256, or 512 dimensions, occupying 16 bytes, 32 bytes, and 64 bytes, respectively.
Since BRIEF does not possess rotational invariance, Rublee proposed the improved rBRIEF algorithm. The BRIEF descriptor is rotated by adopting the primary direction of the critical points.
- (3)
- Estimating Transformation Matrix Using MLESAC Algorithm
After matching the features of the images of the bolt before and after loosening, the loosening angle of the bolt can be determined by calculating the geometric transformation matrix of the bolt images. The MLESAC (Maximum Likelihood Estimation SAmple Consensus) algorithm estimates the geometric transformation matrix between images. It can transform the maximum likelihood estimation problem into a problem of minimizing a cost function, as shown in Formula (6):
where represents the error pattern of Gaussian distribution, indicating the probability of inliers; represents the error pattern of uniform distribution, indicating the probability of outliers. is the size of the search window in the matching algorithm, and is the mixing factor of the two error patterns.
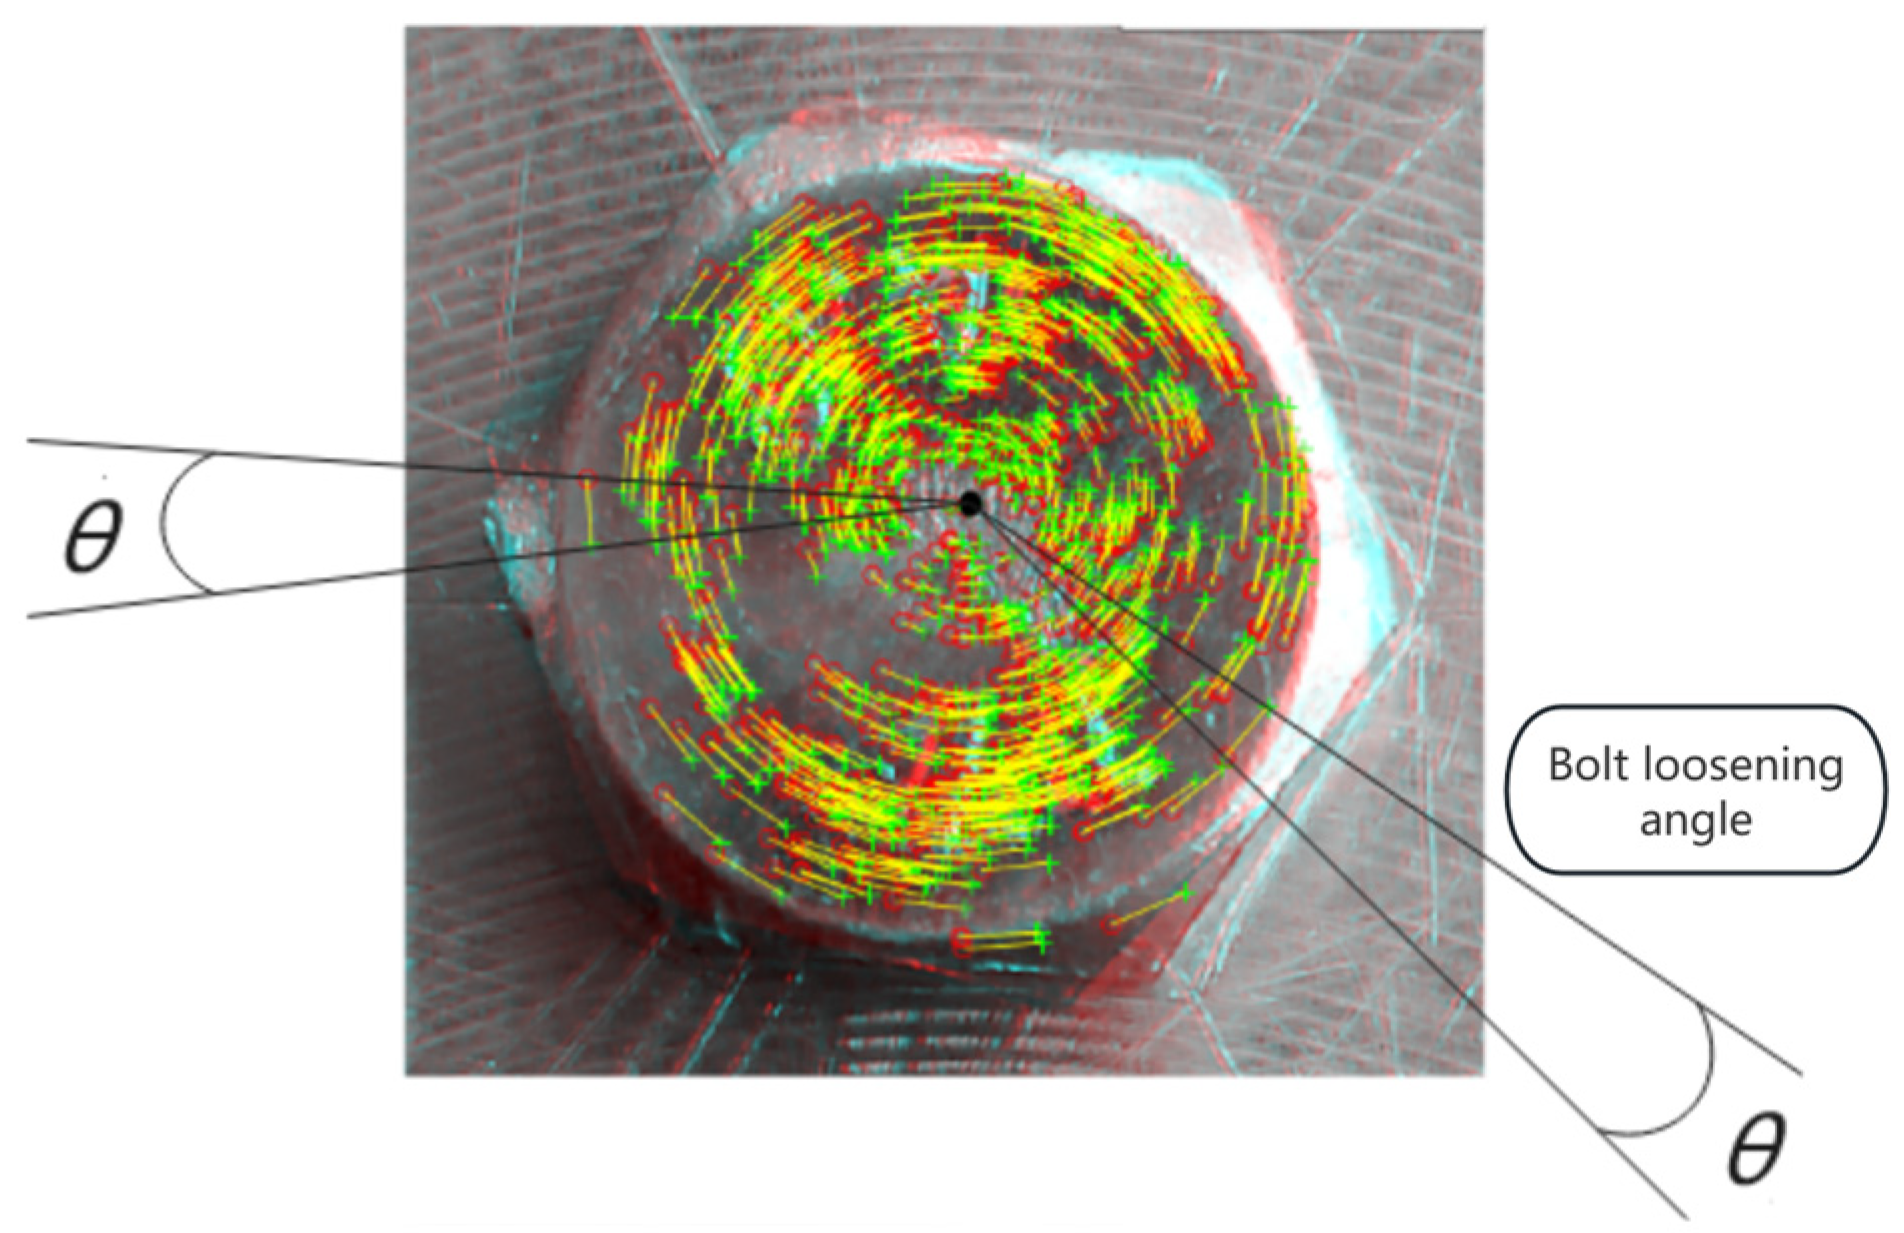
Figure 6 shows the deviation in pixel coordinates for each pair of feature points when the bolt is loosened by 10°.
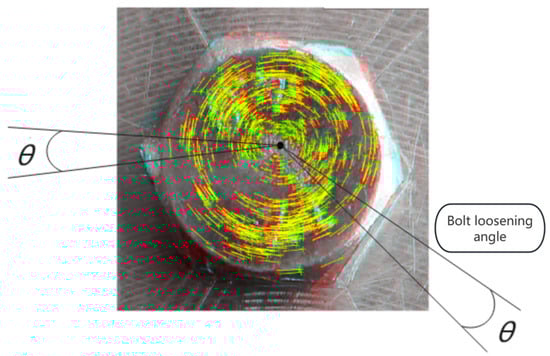
Figure 6.
Bolt Loosening Track Diagram.
4. Case Study Analysis
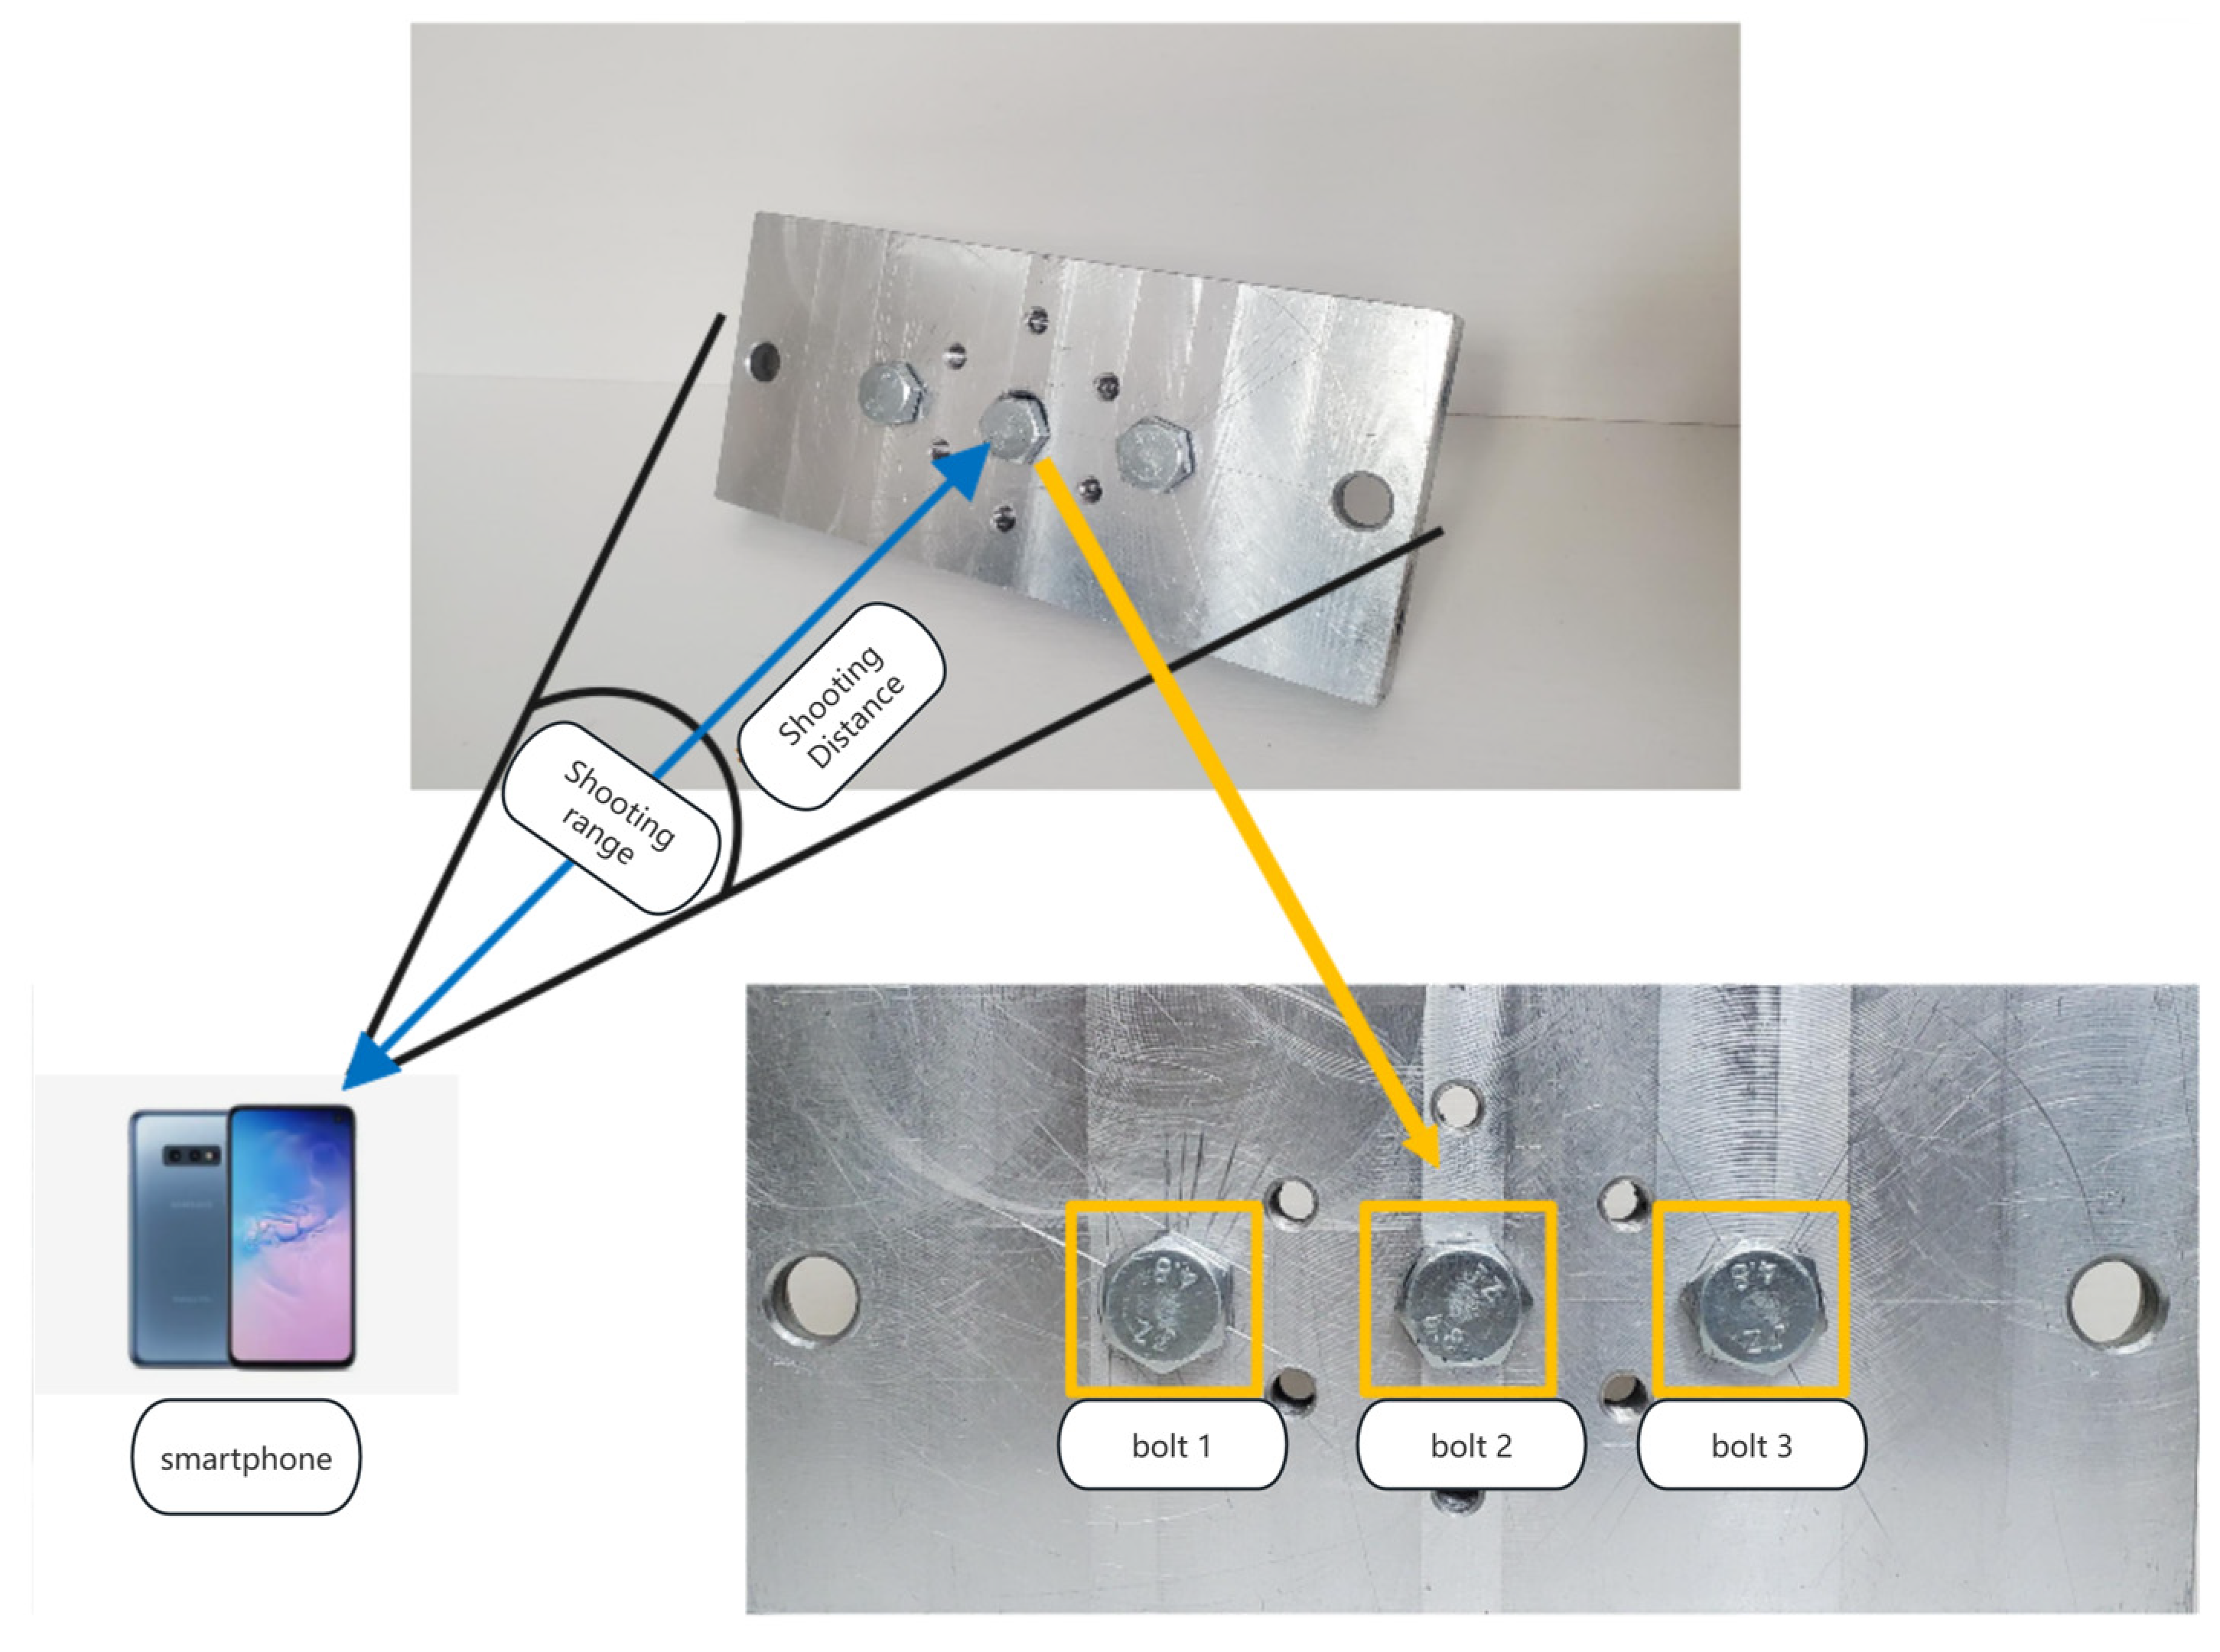
To validate the bolt-loosening detection method proposed in this paper, based on computer vision technology, the experimental setup utilized a rectangular steel plate with a thickness of 10 mm, a length of 230 mm, and a width of 100 mm as the object of study. Three grade 4.8 standard bolts were used to construct a model simulating a critical joint in steel structures. An intelligent smartphone (model: Samsung S10e; dual rear camera with 16 million + 12 million pixels; sensor type: CMOS sensor; camera aperture: f/1.5–2.4 + f/2.2) mounted on a tripod was used to capture images of the experimental model.
The external environment was set to natural daylight to simulate the lighting conditions of steel structures under actual working conditions. During the shooting process, the smartphone was fixed on a stand approximately 30 cm from the bolted joint plate. The built-in auto-focus feature of the phone was used for image data collection. The bolts on the joint plate were numbered for identification purposes. To simplify the calculation of angles, the recognized angles were rounded to the nearest whole number. The experimental setup is shown in Figure 7.
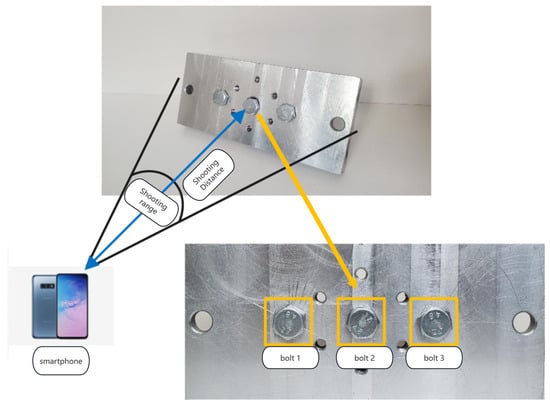
Figure 7.
Detail Drawing of Bolted Connection Model.
4.1. Categorization of Bolt-Loosening Angles
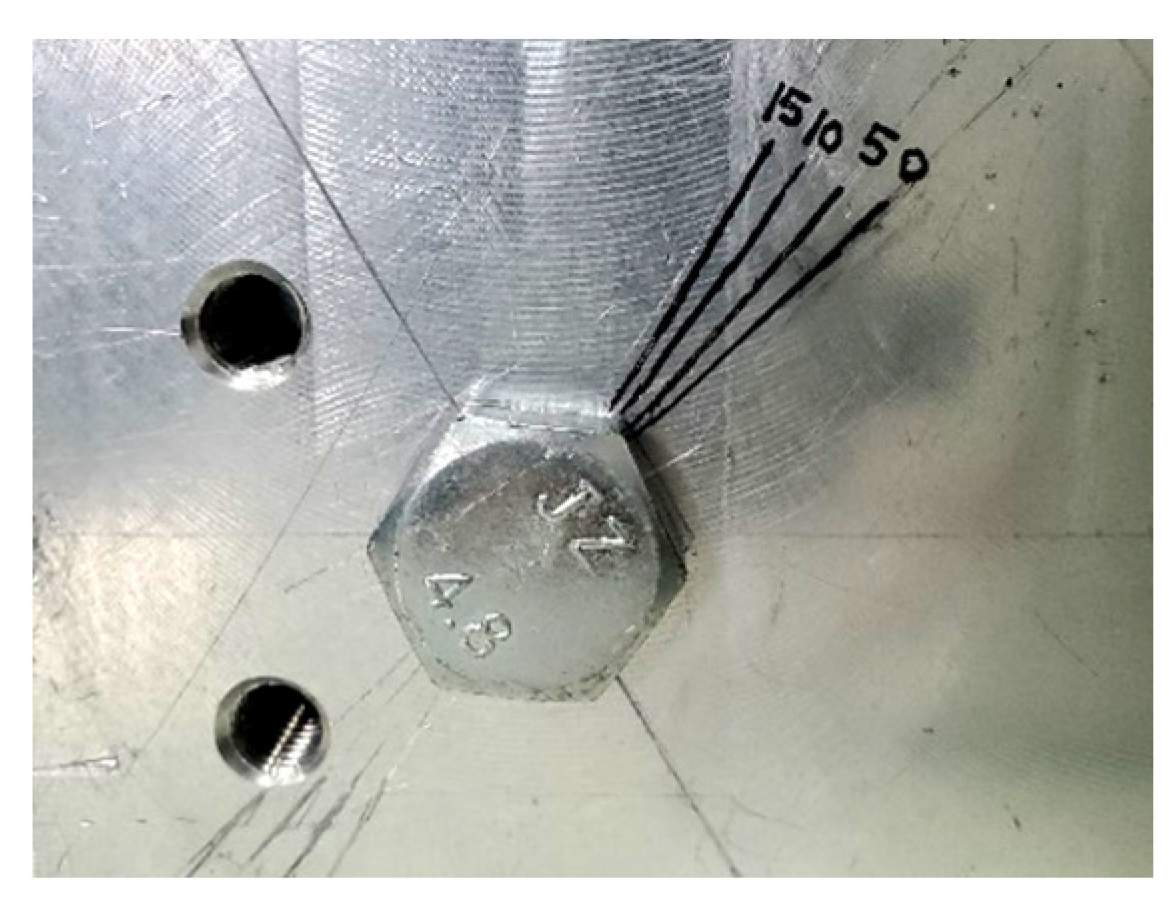
After mounting the bolts on the joint steel plate, they were numbered. To simulate the loosening of bolts in steel structures in actual engineering projects, this study utilized a protractor to demarcate several smaller-angle intervals at the bolt holes of the joint plate, precisely at 0°, 5°, 10°, and 15°. Additionally, to verify various loosening scenarios, larger angle intervals of 0°, 20°, 40°, and 60° were also marked. The simulation of bolt loosening in real engineering situations was achieved by manually aligning the bolts with these angle markings and rotating them counterclockwise. The divisions of these angle intervals are illustrated in Figure 8.

Figure 8.
Angle Division Diagram.
4.2. Bolt-Loosening Recognition Analysis
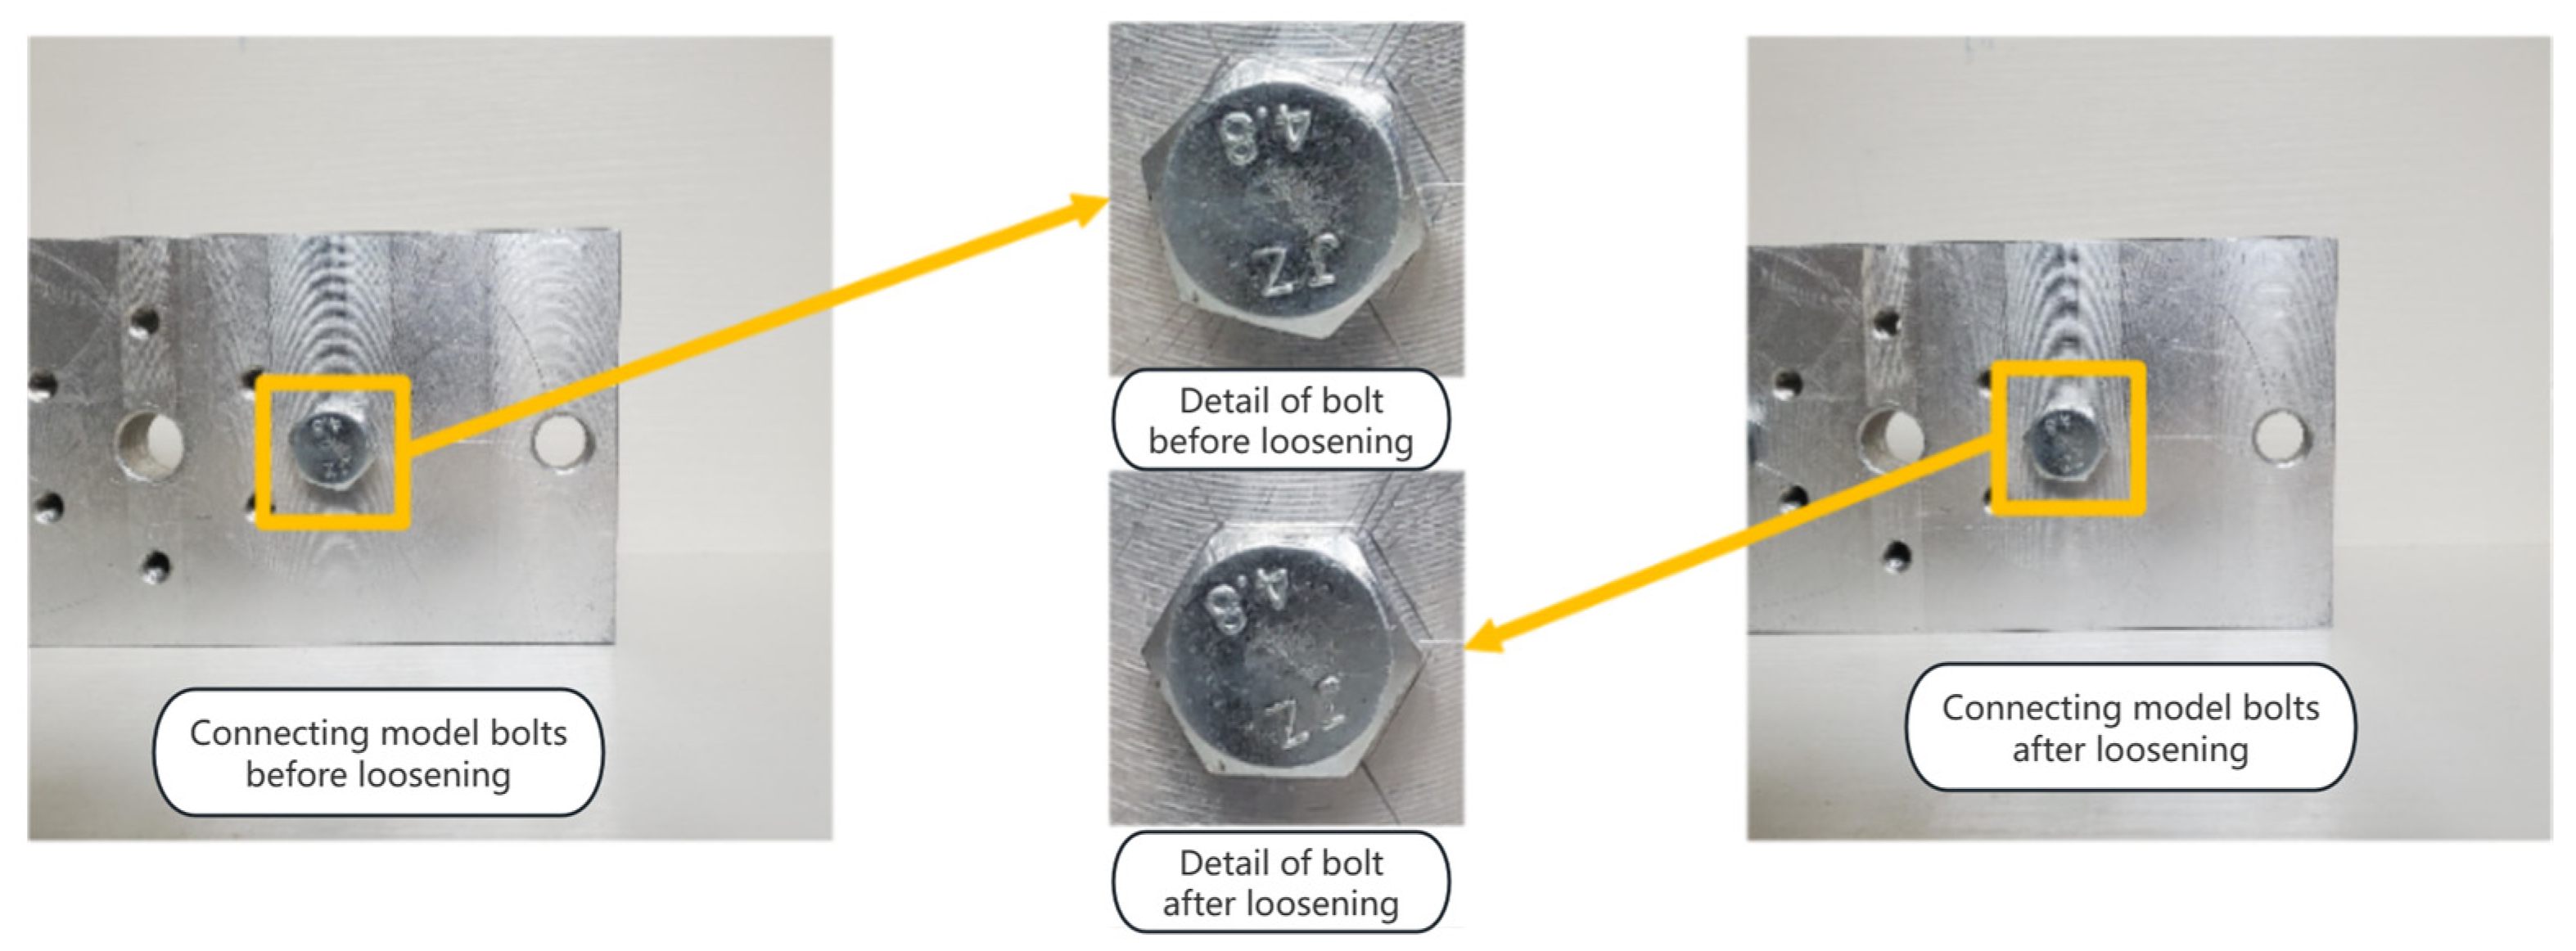
The joint model was placed on a horizontal workbench, with the smartphone fixed on a tripod under natural lighting conditions to collect image data. Initially, an image of the model before the bolt loosening was captured with the smartphone positioned directly in front of the joint model (the lens perpendicular to the model). Subsequently, the bolts were rotated counterclockwise to a certain angle by the angle scale, and another image of the model after the bolt loosening was taken in the same manner. Both images have a resolution of 3024 pixels × 3024 pixels—a comparative illustration of the bolts before and after loosening is presented in Figure 9.
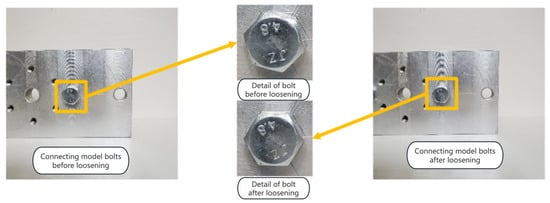
Figure 9.
Comparison of Bolts Before and After Loosening.
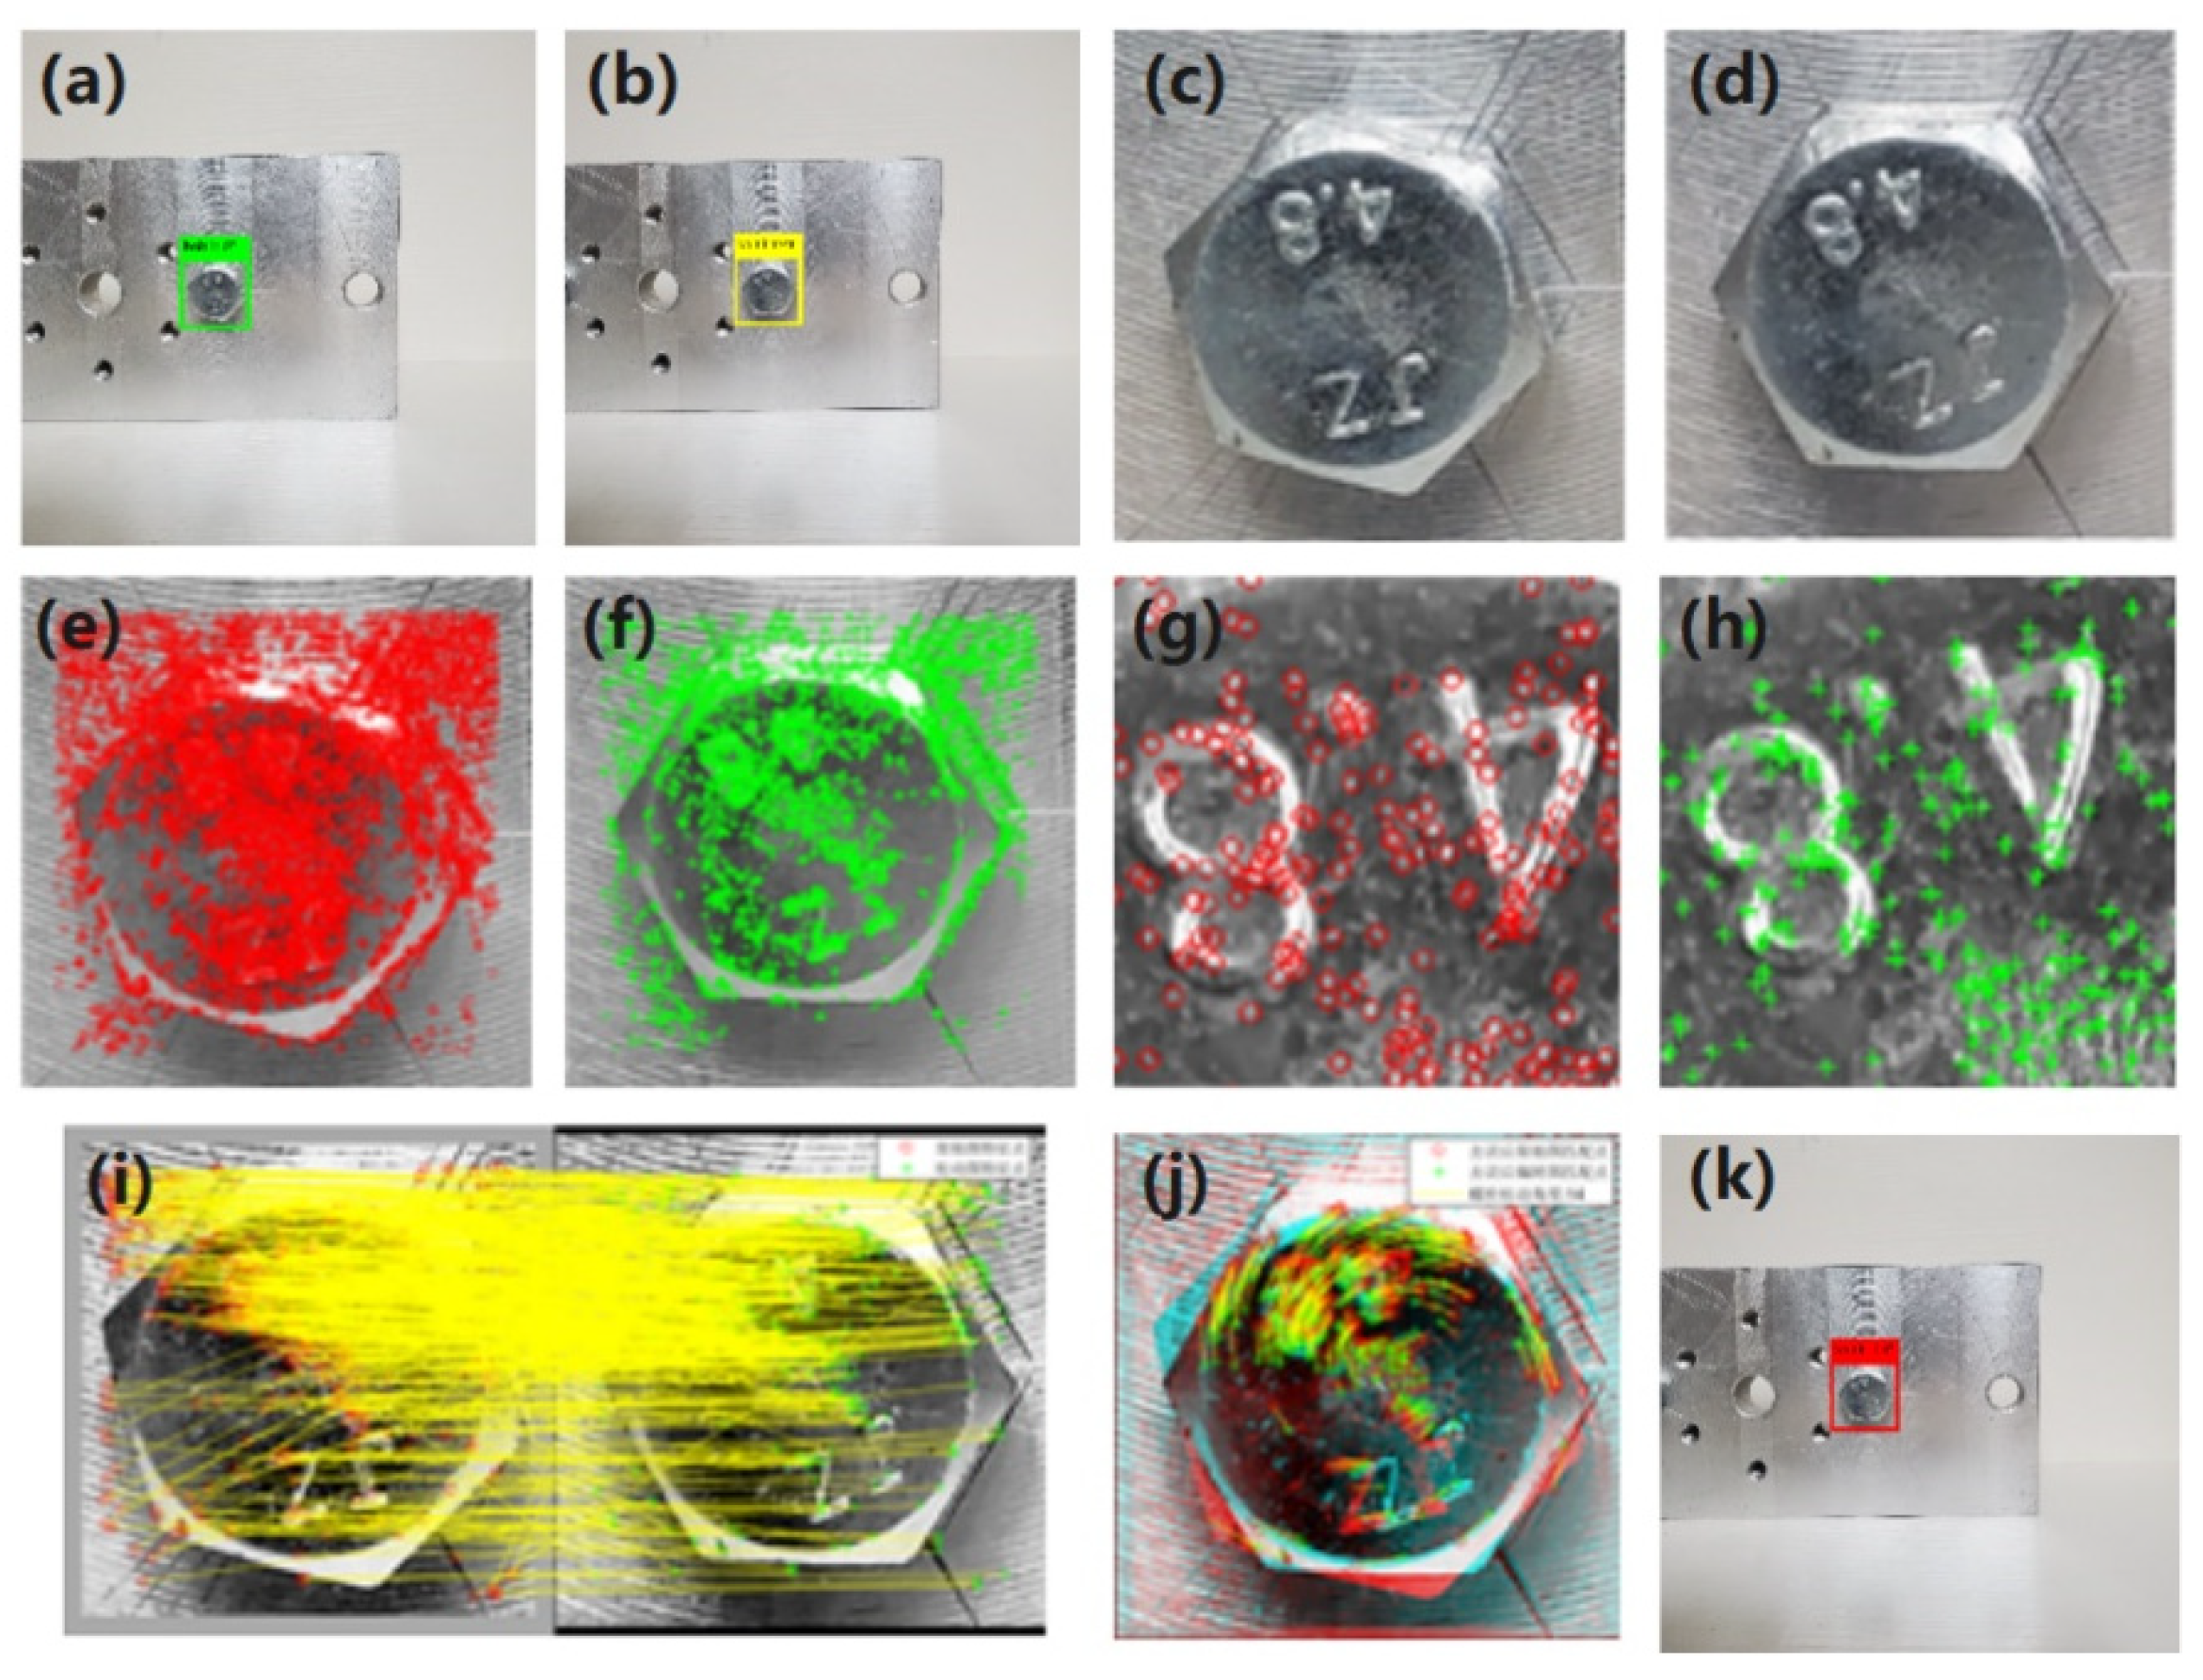
After acquiring the bolt image data, the two images, one before and one after loosening, were input into the algorithm designed in this paper. This process involved detecting, locating, and identifying bolt loosening in the images, with the specific workflow illustrated in Figure 10.
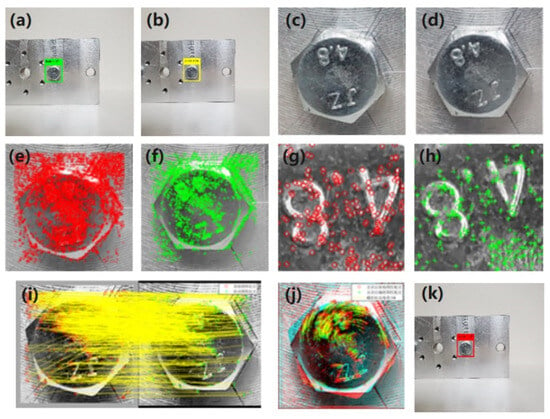
Figure 10.
Processing Process and Recognition Results. (a) The indicator located on the bolt before loosening. (b) The indicator located on the bolt after loosening. (c) The bolt without loosening. (d) The bolt with loosening. (e) Feature points on the bolt without loosening. (f) Feature points on the bolt with loosening. (g) Detailed detection effect of feature points on bolt without loosening. (h) Detailed detection effect of feature points on bolt with loosening. (i) Feature ponits are matched. (j) The rotation trajectory on the bolt without mismatched pairs. (k) The loosening angle is detected and displayed on the bolt.
The figure shows that the detector precisely located the bolts in both images (a) and (b). Image (a) shows the bolt before loosening, with a green box displaying “bolt1: 0°”, indicating the initial bolt image data. Image (b) represents the bolt after loosening, with a yellow box displaying “bolt1: test”, signifying this image’s processing of bolt-loosening recognition. Images (c) and (d) depict the cropped target areas of the bolt before and after loosening, respectively. This cropping retains the image of the bolt head while eliminating background and other distracting information, thus reducing image processing demands and enhancing the algorithm’s efficiency. Images (e) and (f) show the detection of a large number of feature points in the grayscale bolt images; feature points in the pre-loosening image are marked with red “o”s, and those in the post-loosening image with green “+” signs. The detailed detection effect of these feature points is shown in images (g) and (h).
Subsequently, feature point information is extracted and matched, with each matched pair connected by a yellow line, as shown in image (i). This matching identifies feature points that indicate rotation at the bolt head and some around the bolt, although there are numerous mismatched pairs. Image (j) overlays the pre- and post-loosening images, and after removing mismatched pairs, the rotation trajectory of the red and green feature points becomes apparent.
The original image (b) is re-marked for bolts that have loosened. The original locating rectangle is changed to red, and the degree of loosening is displayed at the top of the image, as shown in image (k), with a red box displaying “bolt1: 14°”.
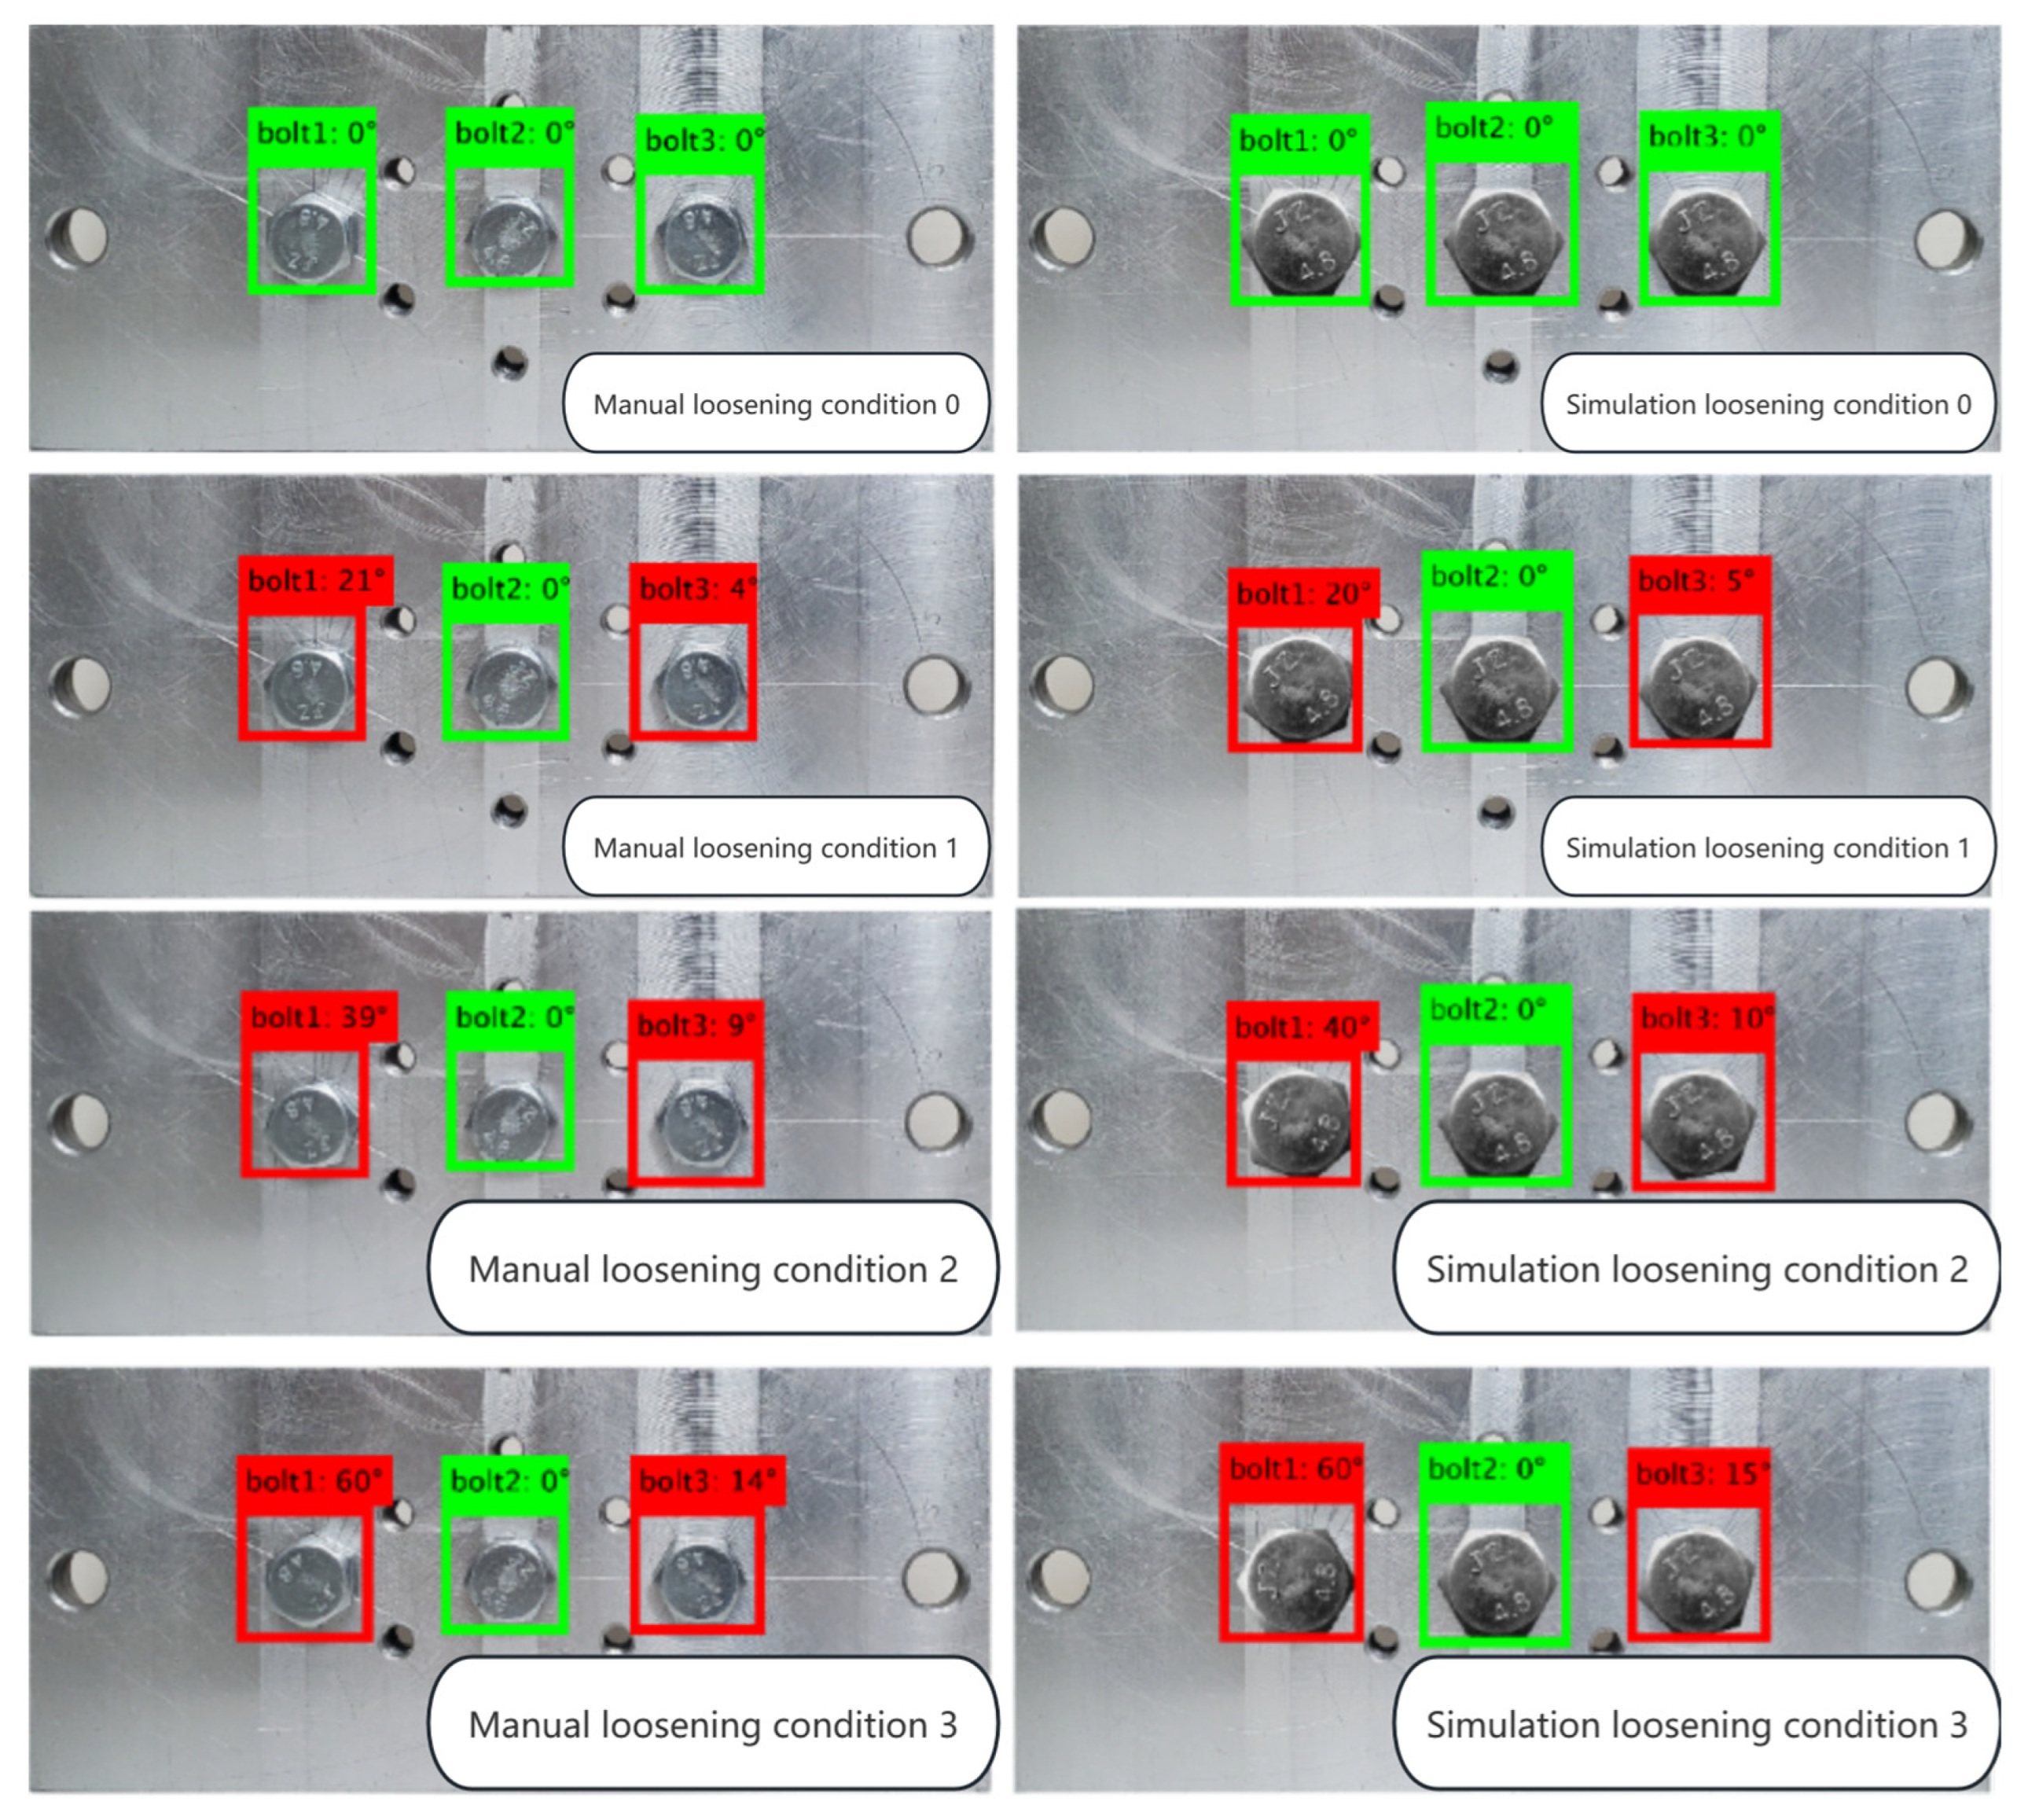
Following the operational process established for recognizing loosening in a single bolt, this procedure was sequentially applied to images of multiple bolts to test for loosening recognition. To verify the timeliness of the algorithm, a stopwatch was used during testing, and it was observed that the recognition of loosening in images of multiple bolts took approximately 5 s. Given the inherent errors in manually loosening bolts, an alternative approach was adopted. Images of bolt heads were cropped and then superimposed onto the bolt-hole positions on the joint plate to create composite images. This process, executed by the computer, simulated the bolts being loosened counterclockwise, thus achieving ideal loosening image data, as shown in Figure 11.
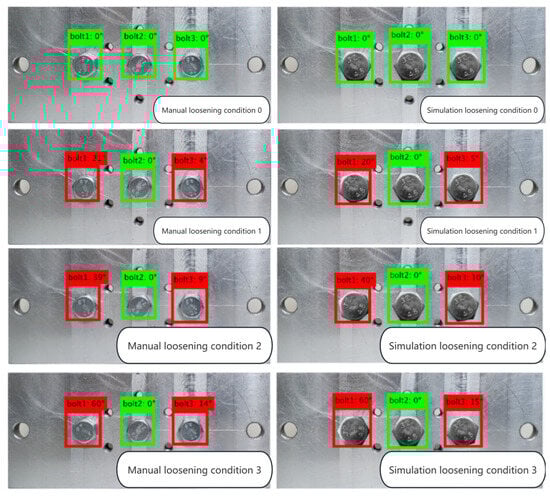
Figure 11.
Multiple Bolt-Loosening Conditions.
In Figure 11, the left side displays images of bolts manually loosened, while the right side shows computer-simulated loosening conditions. In the simulated loosening condition images, the angles of counterclockwise rotation are precisely controlled by the computer, ensuring that the algorithm’s detection results match the actual degrees of loosening. In the case of manual loosening, there were inevitable errors; for example, Bolt 3’s loosening angles of 4°, 9°, and 14° were each 1° off the ideal angles of 5°, 10°, and 15°. However, Bolt 2, which was not manipulated during the experiment and remained tightened, showed a detection result consistent with reality, displaying 0°. For Bolt 1, in conditions 1 and 2, the loosening angles were 21° and 39°, differing by 1° from the ideal angles. However, in condition 3, the detected loosening angle of 60° perfectly aligned with the ideal value, meeting the detection requirements. The comparative analysis of the two sets of images indicates that the algorithm’s angle recognition results are generally consistent with the actual conditions.
Based on Table 2, the error in manual loosening is evident in the recognition of 15° and 20° angles, with an approximate error of around 1.3°. The errors at other angles are slightly smaller. Bolt 2, which remained tightened throughout and did not undergo manual loosening, exhibited a maximum error of only 0.0588°, closely aligning with the actual 0° loosening condition. This indicates that, if the loosening angle of a bolt can be precisely controlled, the recognition results under actual working conditions can meet basic accuracy requirements.
Table 2.
Comparative Analysis of Manual Loosening Angle Error (photos taken by mobile phone).
In Table 3, all cases involve computer-simulated loosening, resulting in a maximum error of only 0.0400°. This error is nearly identical to the pre-set 10° angle in the computer simulation, effectively validating the precision of the bolt-loosening recognition algorithm presented in this paper. This demonstrates that, with precise control and accurate simulation, the algorithm can reliably detect and quantify bolt loosening to a high degree of accuracy.
Table 3.
Comparative Analysis of Manual Loosening Angle Error (photos taken by computer simulation).
5. Conclusions
This paper proposes a bolt-loosening detection method based on computer vision technology, implemented through algorithms developed on the MATLAB platform. The core idea integrates deep learning algorithms with image processing techniques to identify and calculate the loosening angles of bolts in joint model images. Firstly, a bolt detector trained using deep learning algorithms automatically identifies and frames bolts in captured images. Secondly, image processing techniques are applied to crop the bolt images within the confidence region, reducing the computational load in later stages. The cropped bolt images are then processed using the ORB and MLESAC algorithms for feature-point matching and pixel coordinate deviation calculations. This process effectively identifies and calculates the loosening angles of bolts in the images. Finally, experiments on joint model components were conducted to validate the feasibility of the proposed method. This experimental study lead to the following conclusions:
- (1)
- The method effectively identified loosened bolts in steel joint plates by training a bolt detector based on the YOLO algorithm and combining it with the ORB image-matching and MLESAC algorithms. It calculated their loosening angles, thereby proving its feasibility;
- (2)
- The algorithm efficiently processes bolt images obtained from experiments, identifying the location of the bolts, cropping images to include only the bolt targets, and, finally, calculating and marking the loosening angles on the images within less than 5 s, demonstrating the method’s efficiency;
- (3)
- Comparing manually loosened bolt images with computer-synthesized bolt-loosening images, it is evident that the angle values identified by the algorithm nearly match the actual values when the loosening angles of bolts are precisely controlled. The maximum error in loosening angles is approximately ±0.1°, confirming the algorithm’s accuracy in angle calculations.
Despite these achievements, the algorithm designed in this paper has certain limitations, which will be addressed in future research:
- (1)
- The algorithm’s processing time has yet to achieve near-real-time efficiency. Further improvements in device configuration and algorithm processing will be made to enhance the recognition performance, aiming for live detection capability;
- (2)
- Most bolt loosening in steel structures involves small angles, but scenarios of 360° or its multiples are not excluded, rendering the current algorithm infeasible. To enhance the practicality of the algorithm, future research will consider classifying bolts based on the length of the screw exposed after loosening, thereby addressing the limitations of the current method;
- (3)
- The issue of failing to consider the variability in tightened bolts’ angles when methods are used in production and installation processes should also be considered. According to the literature [32,33], the Bayesian method, as a typical method to overcome variability, could be considered. Due to the variability in tightened bolts, it is hard to estimate the actual angle of the loosened bolts, so the Bayesian-based method can be applied to update/predict the actual values of angles.
Author Contributions
Conceptualization, F.C.; methodology, F.C. and J.W.; software, C.H., B.H. and S.Q.; validation, Y.Q.; data curation, F.C. and C.H.; writing—original draft preparation, F.C. and C.H.; writing—review and editing, H.D., X.D., H.Z., Z.L. and J.W.; supervision, J.W.; funding acquisition, Y.Q. and J.W. All authors have read and agreed to the published version of the manuscript.
Funding
The corresponding author wishes to thank the support by the Open Project Program of Guangdong Provincial Key Laboratory of Intelligent Disaster Prevention and Emergency Technologies for Urban Lifeline Engineering (No. 2022ZB04), Hubei Provincial Department of Education Program (No. Q20221606), Department of Housing and Urban-Rural Development of Hubei Provincial (Urban and rural construction and development-202001).
Data Availability Statement
The raw data supporting the conclusions of this article will be made available by the fourth author and the second corresponding author on request.
Conflicts of Interest
The authors declare no conflicts of interest.
References
- Jiang, Y.; Zhang, M.; Lee, C.H. A study of early stage self-loosening of bolted joints. J. Mech. Des. 2003, 125, 518–526. [Google Scholar] [CrossRef]
- Shi, Y. Comparisons between Chinese and American Standards on Bolted Connection Design. Steel Constr. 2020, 35, 33–56. [Google Scholar]
- Federal Highway Administration (FHWA). National Bridge Inspection Standards; Federal Register; FHWA: Washington, DC, USA, 2004; Volume 69.
- Zhao, X.; Gao, H.; Zhang, G.; Ayhan, B.; Yan, F.; Kwan, C.; Rose, J.L. Active health monitoring of an aircraft wing with embedded piezoelectric sensor/actuator network: I. Defect detection, localization and growth monitoring. Smart Mater. Struct. 2007, 16, 1208. [Google Scholar] [CrossRef]
- Caccese, V.; Mewer, R.; Vel, S.S. Detection of bolt load loss in hybrid composite/metal bolted connections. Eng. Struct. 2004, 26, 895–906. [Google Scholar] [CrossRef]
- Milanese, A.; Marzocca, P.; Nichols, J.M.; Seaver, M.; Trickey, S.T. Modeling and detection of joint loosening using output-only broad-band vibration data. Struct. Health Monit. 2008, 7, 309–328. [Google Scholar] [CrossRef]
- Huda, F.; Kajiwara, I.; Hosoya, N.; Kawamura, S. Bolt loosening analysis and diagnosis by non-contact laser excitation vibration tests. Mech. Syst. Signal Process. 2013, 40, 589–604. [Google Scholar] [CrossRef]
- Martowicz, A.; Sendecki, A.; Salamon, M.; Rosiek, M.; Uhl, T. Application of electromechanical impedance-based SHM for damage detection in bolted pipeline connection. Nondestruct. Test. Eval. 2016, 31, 17–44. [Google Scholar] [CrossRef]
- Fan, S.; Li, W.; Kong, Q.; Feng, Q.; Song, G. Monitoring of pin connection loosening using eletromechanical impedance: Numerical simulation with experimental verification. J. Intell. Mater. Syst. Struct. 2018, 29, 1964–1973. [Google Scholar] [CrossRef]
- Mazzeo, P.L.; Nitti, M.; Stella, E.; Distante, A. Visual recognition of fastening bolts for railroad maintenance. Pattern Recognit. Lett. 2004, 25, 669–677. [Google Scholar] [CrossRef]
- Marino, F.; Distante, A.; Mazzeo, P.L.; Stella, E. A real-time visual inspection system for railway maintenance: Automatic hexagonal-headed bolts detection. IEEE Trans. Syst. Man Cybern. Part C Appl. Rev. 2007, 37, 418–428. [Google Scholar] [CrossRef]
- Liu, L.; Zhou, F.; He, Y. Automated status inspection of fastening bolts on freight trains using a machine vision approach. Proc. Inst. Mech. Eng. Part F J. Rail Rapid Transit 2016, 230, 1629–1641. [Google Scholar] [CrossRef]
- Cha, Y.J.; You, K.; Choi, W. Vision-based detection of loosened bolts using the Hough transform and support vector machines. Autom. Constr. 2016, 71, 181–188. [Google Scholar] [CrossRef]
- Park, J.H.; Huynh, T.C.; Choi, S.H.; Kim, J.T. Vision-based technique for bolt-loosening detection in wind turbine tower. Wind Struct. 2015, 21, 709–726. [Google Scholar] [CrossRef]
- Ramana, L.; Choi, W.; Cha, Y.J. Fully automated vision-based loosened bolt detection using the Viola–Jones algorithm. Struct. Health Monit. 2019, 18, 422–434. [Google Scholar] [CrossRef]
- Huynh, T.C.; Park, J.H.; Jung, H.J.; Kim, J.T. Quasi-autonomous bolt-loosening detection method using vision-based deep learning and image processing. Autom. Constr. 2019, 105, 102844. [Google Scholar] [CrossRef]
- Zhao, X.; Zhang, Y.; Wang, N. Bolt loosening angle detection technology using deep learning. Struct. Control Health Monit. 2019, 26, e2292. [Google Scholar] [CrossRef]
- Zhang, Y.; Sun, X.; Loh, K.J.; Su, W.; Xue, Z.; Zhao, X. Autonomous bolt loosening detection using deep learning. Struct. Health Monit. 2020, 19, 105–122. [Google Scholar] [CrossRef]
- Sun, J.; Xie, Y.; Cheng, X. A Fast Bolt-loosening Detection Method of Running Train’s Key Components based on Binocular Vision. IEEE Access 2019, 7, 32227–32239. [Google Scholar] [CrossRef]
- Wang, C.; Wang, N.; Ho, M.; Chen, X.; Song, G. Design of a New Vision-based Method for the Bolts Looseness Detection in Flange Connections. IEEE Trans. Ind. Electron. 2019, 67, 1366–1375. [Google Scholar] [CrossRef]
- Kong, X.; Li, J. Image registration-based bolt loosening detection of steel joints. Sensors 2018, 18, 1000. [Google Scholar] [CrossRef]
- Zhao, J.; Xu, H.; Dang, Y. Research on bolt detection of railway passenger cars based on improved Faster R-CNN. China Saf. Sci. J. 2021, 31, 82–89. [Google Scholar]
- Redmon, J.; Farhadi, A. YOLO9000: Better, faster, stronger. In Proceedings of the 2017 IEEE Conference on Computer Vision and Pattern Recognition (CVPR), Honolulu, HI, USA, 21–26 July 2017; pp. 6517–6525. [Google Scholar]
- Lan, M.; Liu, Y.; Jin, T.; Gong, Z.; Liu, Z. An Improved Recognition Method Based on Visual Trajectory Circle and ResnetN18 for Complex Power Quality Disturbances. Proc. CSEE 2022, 42, 6274–6286. [Google Scholar]
- Wang, Z.; Deng, S.; Qi, Y.; Zhou, Y. Rail Bolt Component Fault Detection Method Based on YOLO v3. Tech. Appl. 2021, 1, 34–36. [Google Scholar]
- Zhao, H.; Ding, Y.; Li, A.; Sheng, W.; Geng, F. Digital modeling on the nonlinear mapping between multi-source monitoring data of in-service bridges. Struct. Control Health Monit. 2020, 27, e2618. [Google Scholar] [CrossRef]
- Zhao, H.; Ding, Y.; Li, A.; Chen, B.; Wang, K. Digital modeling approach of distributional mapping from structural temperature field to temperature-induced strain field for bridges. J. Civ. Struct. Health Monit. 2023, 13, 251–267. [Google Scholar] [CrossRef]
- Rublee, E.; Raraud, V.; Konolige, K.; Bradski, G. ORB: An efficient alternative to SIFT or SURF. In Proceedings of the 2011 International Conference on Computer Vision, Barcelona, Spain, 6–13 November 2011; pp. 2564–2571. [Google Scholar]
- Rosten, E.; Drummond, T. Machine Learning for High-Speed Corner Detection. In Proceedings of the 9th European Conference on Computer Vision, Graz, Austria, 7–13 May 2006; Springer: Berlin/Heidelberg, Germany, 2006; pp. 430–443. [Google Scholar]
- Calonder, M.; Lepetit, V.; Strecha, C.; Fua, P. Brief: Binary robust independent elementary features. In Proceedings of the 11th European Conference on Computer Vision, Crete, Greece, 5–11 September 2010; Springer: Berlin/Heidelberg, Germany, 2010; pp. 778–792. [Google Scholar]
- Li, J.; Yang, Y.; Zhang, X. An Improved MLESAC Algorithm for Estimating Fundamental Matrix. Comput. Eng. 2012, 38, 214–217. [Google Scholar]
- Zhang, X.; Ding, Y.; Zhao, H.; Yi, L.; Guo, T.; Li, A.; Zou, Y. Mixed Skewness Probability Modeling and Extreme Value Predicting for Physical System Input–Output Based on Full Bayesian Generalized Maximum-Likelihood Estimation. IEEE Trans. Instrum. Meas. 2024, 73, 2504516. [Google Scholar] [CrossRef]
- Zhao, H.; Ding, Y.; Meng, L.; Qin, Z.; Yang, F.; Li, A. Bayesian Multiple Linear Regression and New Modeling Paradigm for Structural Deflection Robust to Data Time Lag and Abnormal Signal. IEEE Sens. J. 2023, 23, 19635–19647. [Google Scholar] [CrossRef]

Disclaimer/Publisher’s Note: The statements, opinions and data contained in all publications are solely those of the individual author(s) and contributor(s) and not of MDPI and/or the editor(s). MDPI and/or the editor(s) disclaim responsibility for any injury to people or property resulting from any ideas, methods, instructions or products referred to in the content. |
© 2024 by the authors. Licensee MDPI, Basel, Switzerland. This article is an open access article distributed under the terms and conditions of the Creative Commons Attribution (CC BY) license (https://creativecommons.org/licenses/by/4.0/).