Article

Assessment of CO2 Capture in FA/GGBS-Blended Cement Systems: From Cement Paste to Commercial Products

1
School of Economic and Management, Southeast University, Nanjing 211189, China
2
School of Civil and Environmental Engineering, University of Technology Sydney, Sydney, NSW 2007, Australia
3
Department of Civil and Environmental Engineering, The Hong Kong Polytechnic University, Hong Kong, China
*
Authors to whom correspondence should be addressed.
Buildings 2024, 14(1), 154; https://doi.org/10.3390/buildings14010154
Submission received: 20 December 2023 / Revised: 3 January 2024 / Accepted: 4 January 2024 / Published: 8 January 2024
(This article belongs to the Special Issue Low-Carbon and Green Materials in Construction—2nd Edition)

Abstract

:
The cement industry’s intricate production process, including kiln heating and fossil fuel use, contributes 5–8% of global CO2 emissions, marking it as a significant carbon emitter in construction. This study focuses on quantifying CO2 capture potential in blended cement systems through the utilisation of phenolphthalein and thermalgravimetric methodologies. Its primary objective is to assess the CO2 absorption capacity of these blended systems’ pastes. Initial evaluation involves calculating the carbon capture capacity within the paste, subsequently extended to estimate CO2 content in the resultant concrete products. The findings indicate that incorporating ground granulated blast-furnace slag (GGBS) or an ettringite-based expansive agent did not notably elevate carbonation depth, irrespective of their fineness. Conversely, the introduction of fly ash (FA) notably augmented the carbonation depth, leading to a substantial 36.4% rise in captured CO2 content. The observed distinctions in carbonation behaviour primarily stem from variances in pore structure, attributable to distinct hydration characteristics between GGBS and FA. Thermal analysis confirms the increased stabilisation of CO2 in FA blends, highlighting the crucial influence of material composition on carbonation and emission reduction. Incorporating both GGBS and FA notably diminishes binder emissions, constituting almost half of PC-concrete emissions. Initially, 60% GGBS shows lower emissions than 50% FA, but when considering CO2 capture, this emission dynamic significantly changes, emphasising the intricate influence of additives on emission patterns. This underscores the complexity of evaluating carbonation-induced emissions in cementitious systems.

1. Introduction

The cement industry stands as a crucial cornerstone of global construction, yet its operations contribute significantly to carbon emissions, which account for ~5–8% of total anthropogenic CO2 [1,2]. This stems from the intricate process involved in cement production [3,4,5]. Cement, the binding phase (after hydration) in concrete, is primarily manufactured through the heating and processing of raw materials like limestone, clay, and other minerals in kilns [6]. The thermal treatment, coupled with the use of fossil fuels to power these high-temperature kilns, leads to the release of carbon dioxide (CO2) into the atmosphere [5]. Additionally, the decomposition of carbonates during the production process generates emissions, making the cement industry a notable contributor to carbon emissions worldwide.
In traditional practices, carbonation poses a risk to reinforced concrete by lowering the pH of the matrix, leading to potential corrosion of the reinforcement bars [7,8]. Nevertheless, this effect is limited to reinforced concrete with steel bars, while plain concrete or concrete reinforced with polymers or non-steel bars remains unaffected by this carbonation-induced corrosion [9]. Therefore, the innovative concept of CO2 curing in concrete represents a revolutionary shift in sustainable construction practices [10,11]. Unlike traditional methods, CO2 curing involves leveraging carbon dioxide (CO2) as a beneficial agent in the concrete curing process. By injecting CO2 into concrete mixes or exposing concrete structures to CO2, a mineralisation reaction occurs wherein the CO2 chemically reacts with calcium ions in the concrete to form calcium carbonate. This reaction not only accelerates the curing process but also enhances the strength and durability of the concrete while effectively sequestering CO2 within the material itself. This technique holds immense promise in reducing carbon footprints within the construction industry, offering the dual benefit of enhancing structural performance while mitigating carbon emissions [12,13].
Supplementary cementitious materials (SCMs) significantly contribute to bolstering the performance, sustainability, and durability of concrete [14,15,16]. Materials like pulverised fly ash (PFA), ground granulated blast-furnace slag (GGBS), silica fume (SF), and others, derived from industrial processes or natural minerals or recycled wastes, serve as byproducts that, upon incorporation into concrete mixes, partially substitute for Portland cement [17,18,19,20]. Incorporating SCMs provides multiple benefits, such as enhanced workability, decreased heat generation in hydration, heightened long-term strength, and improved resistance to chemical attacks and cracking [18,21]. Moreover, SCMs additionally contribute to mitigating the environmental impact of concrete production by reducing the demand for cement, thereby lowering carbon emissions [22,23,24,25]. Their utilisation showcases a sustainable approach to modern concrete technology, promoting the construction of resilient structures while diminishing the industry’s ecological footprint [26,27,28].
However, the use of SCMs means a reduction in the overall calcium content in the blended systems, which, on the other hand, reduces the capacity for CO2 mineralisation. Therefore, it is important to evaluate the amount of CO2 that can be immobilised by these blended systems, which can be used as guidance for low-carbon and sustainable development of the circular economy [29,30].
This study tries to configure different blended cement systems by using clinkers and SCMs and estimate the CO2 capture capacity by different pastes. The flowchart of the research outline is shown in Figure 1. Finally, based on the evaluated values, the embodied carbon assessment was given to the standard pavements made by such binders. This paper proposes the estimation method of CO2 capture capacity by blended cement from paste to concrete, which will contribute to the development of low-carbon concrete.

2. Experimental Procedures

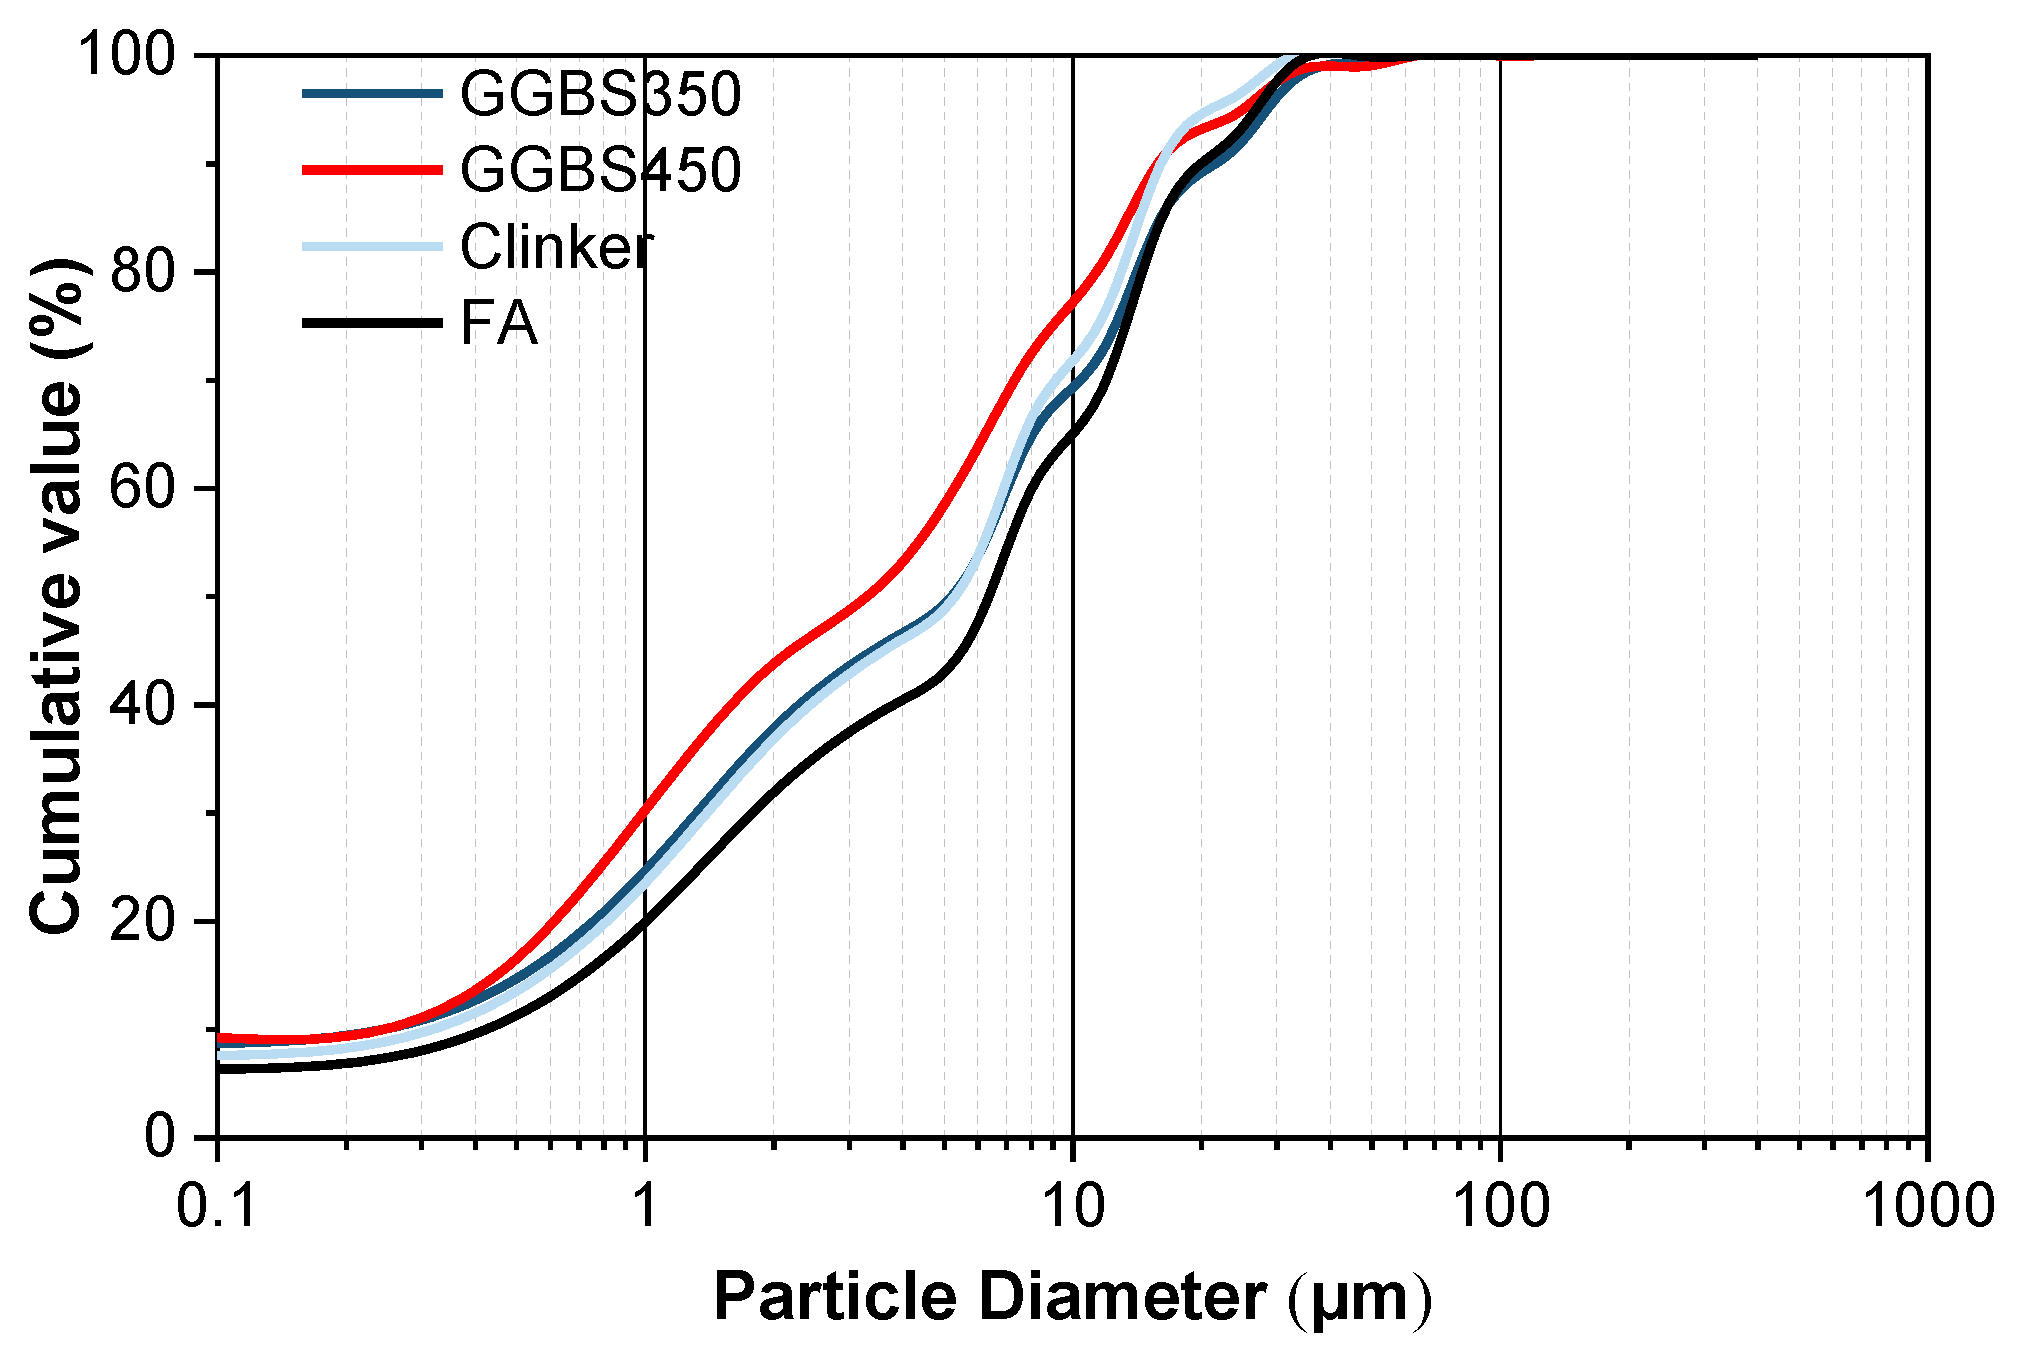
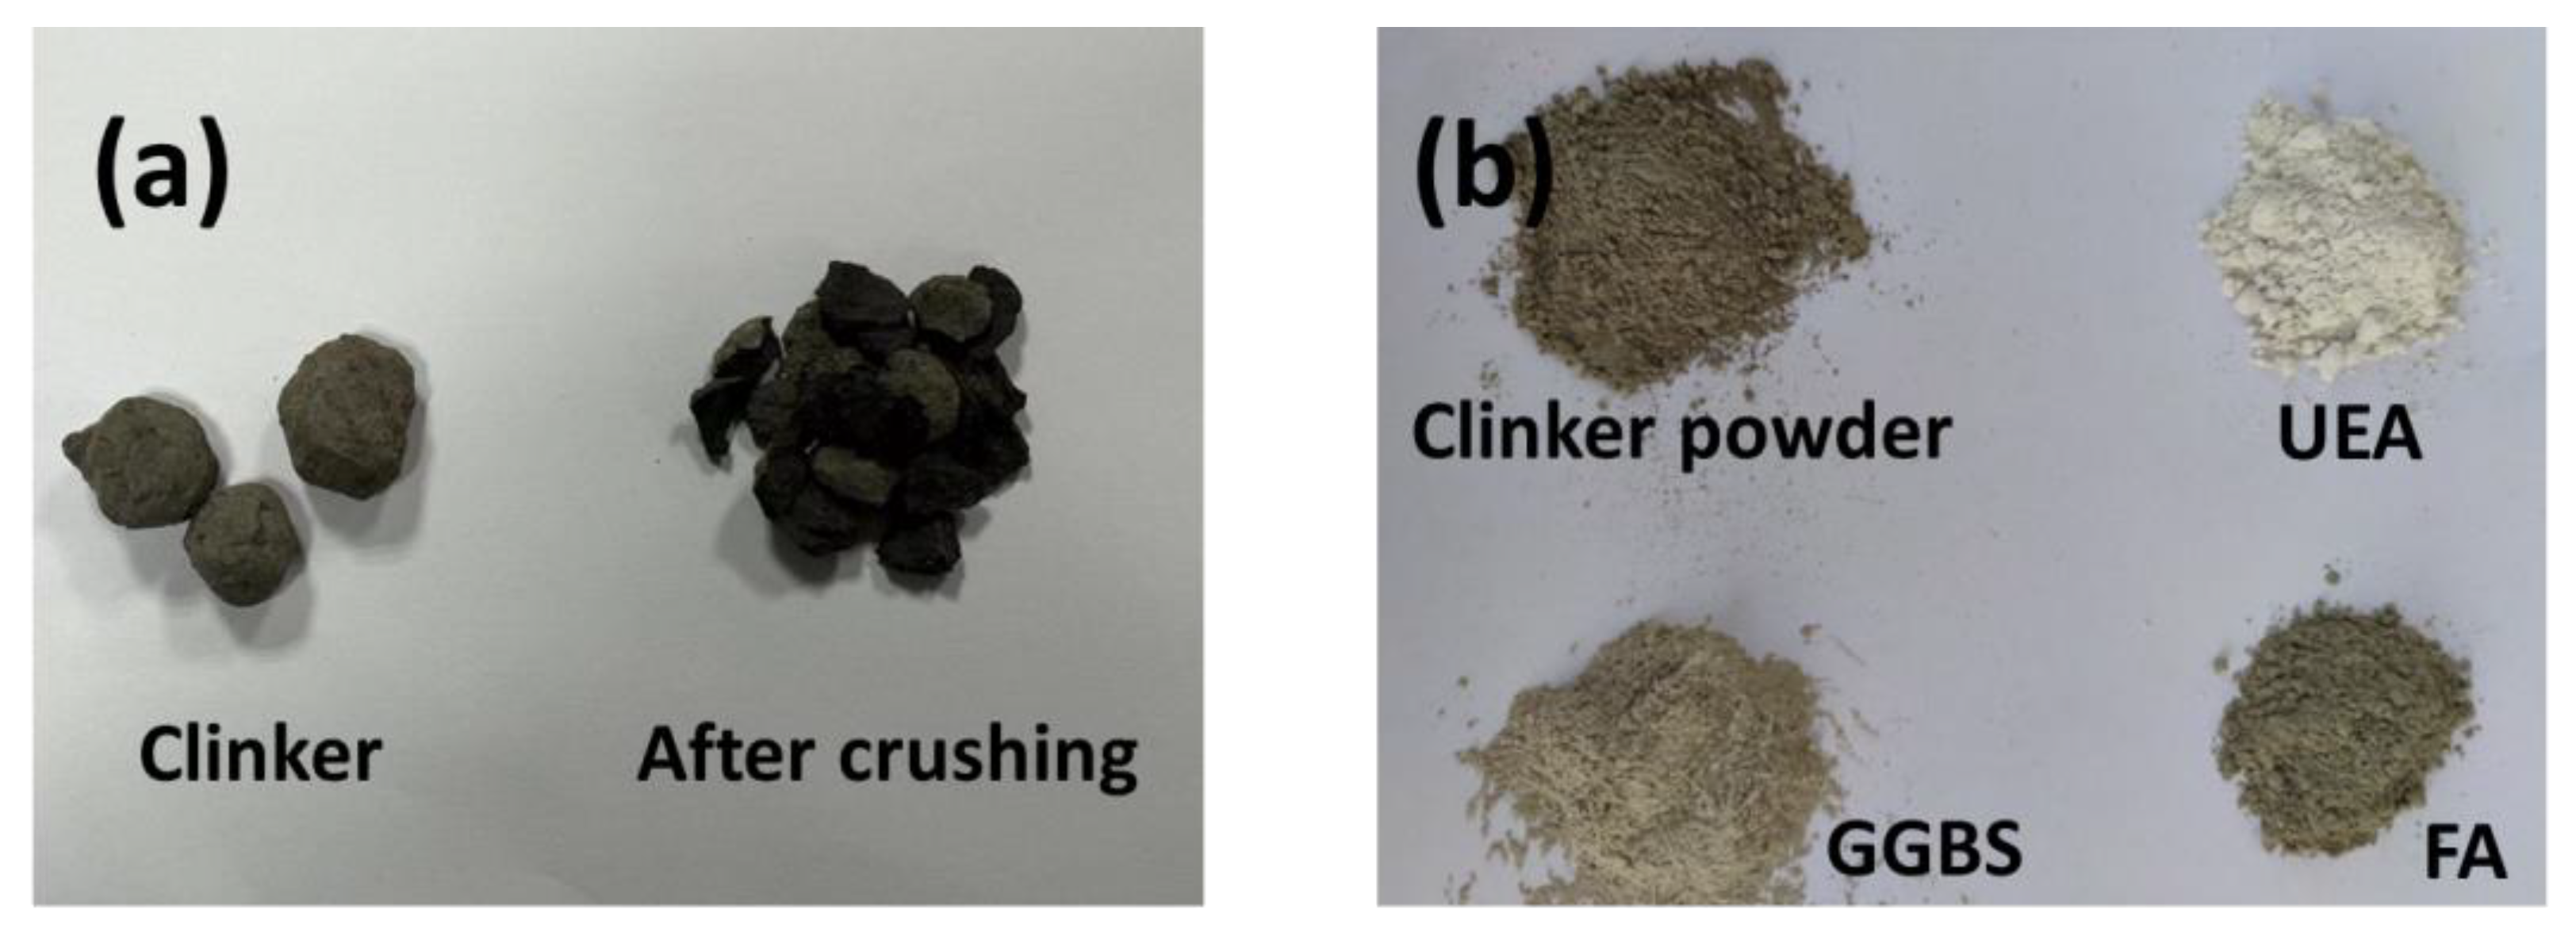
2.1. Composition and Properties of Clinker and SCMs

Cement clinker (density of 3.12 g/cm3), which was provided by Xiaoyetian Cement Plant (Nanjing, China), was ground for 45 min by a vibrating mill. The chemical composition and particle size distribution are given in Table 1 and Figure 2, respectively. The ground granulated blast-furnace slag (GGBS) was supplied by Nanjing Steel and Iron Company, with an initial Blaine fineness of 365 m2/kg (labelled as GGBS350) and a density of 2.89 g/cm3. Considering there are different activities of commercial GGBS, the GGBS350 was further ground by the vibrating mill for another 20 min, resulting in GGBS with a Blaine fineness of 450 m2/kg (labelled as GGBS450). The fly ash (FA) used in this study conforms to GB/T 1596-2017 [31] as a Class F fly ash, a typical low-calcium FA, which only contains 5.46% CaO, as shown in Table 1, determined by ARLTM Perform’X Sequential X-Ray Fluorescence 4200 (Thermo Fisher Scientific, Waltham, MA, USA). The FA has a slightly larger particle size, reaching a Blaine fineness of 325 m2/kg with a density of 2.15 g/cm3.
Additionally, the UEA (Aft-based expansive agent, density of 2.80 g/cm3) is always used to reduce the cracks in plain precast concrete, which is considered during the preparation of CO2-cured concrete products. The UEA is in the form of a pink powder, provided by the China Academy of Building Materials Science (CABMS), consisting of calcium aluminium sulphate (containing some potassium, as shown by XRF) and aluminium oxide as the major expansion sources. The images of the raw materials are shown in Figure 3. This kind of expansion agent (EA) is frequently used in self-stressed or prestressed concrete water pipes, floor slabs, columns, beams and columns, waterproof roof panels, etc., and is sometimes also used in plain concrete products to resist shrinkage-induced cracks. According to the particle size distribution in Figure 2, the D50 values of GGBS350, GGBS450, Clinker and FA are 25.8, 17.5, 18.7, and 27.5 μm.

2.2. Sample Preparation and CO2 Curing

The blended cement was made by mixing clinker and GGBS or FA at a certain ratio for around 10 min by a small (volume: 2 L) planetary mixer, in addition to clinker and SCMs, around an additional 5% gypsum (which was not accounted into the total binder mixture) was also added to the blended cement to regulate the hydration and setting time. The blended cements were made by blending up to 50% FA, 60% GGBS, and 8% UEA (see Table 2) to assess the carbonation process.
Cement pastes were formulated using two distinct water-to-binder ratios of 0.45, while the clinker was gradually replaced with GGBS and FA, spanning from 0 wt% to 60 wt% or 50 wt% incrementally, with intervals of 10 wt% (see Table 2). The gypsum is used for controlling the setting of the clinker, i.e., by the reaction between the C3A and gypsum, the setting of the clinker can be controlled. The mix design refers to GB/T175 [32] for the preparation of the P·I Cement, which requires 3–5% gypsum to control the setting of the cement. The mixed blended powder (Section 2.1) was added to a planetary mixer, and the weighted water was added slowly within 30 s. The slurry was mixed initially for 60 s, followed by a 30 s pause, and was then mixed for another 90 s to obtain the uniform mixtures. The paste was cast into 40 mm × 40 mm × 160 mm steel moulds. The cast paste prisms were covered with a layer of plastic form for around 24 h, followed by curing in a carbonation chamber with 20 vol% CO2 concentration according to GB/T 50082-2009 [33] (a temperature of 20 ± 1 °C and relative humidity of 65 ± 5%) for up to 28 d.

2.3. Evaluation Methods

Figure 4 displays sampling strategies for carbonation depth measurements and the single-way diffusion carbonation test. Three major aspects are evaluated for the blended cement systems:
(1) Carbonation depth: The depth of carbonation after carbon curing was assessed by the phenolphthalein method according to GB/T 50082-2009 [33].
(2) Carbon content evaluation and pore size distribution after carbonation: The prisms of cement pastes were sealed with rosin paraffin wax for the four rectangular sides (Figure 3) with the exposure of the two sides for single-way carbonation, which aims to compare the differences between each mix. The carbonation degree of the pastes was evaluated using the thermogravimetric method by a Netzsch STA 250 (Bavaria, Germany). The test was conducted under an N2 atmosphere from 30 to 1000 °C with a heating rate of 10 °C. The samples were removed from one side of the paste prisms by 2 mm each until 40 mm (i.e., 6–20 groups), corresponding to the largest carbonation depth of 50 wt% FA-blended cement paste (see sampling strategy in Figure 4) until the carbonation degree was almost the same as the previous group. The carbonates were calculated according to Equation (1). On the other hand, the CO2 percentage was calculated based on the mass loss from 500 °C to 800 °C [34,35,36].
C C % = m 500 ° C m 800 ° C × 100 44 m 800 ° C × 100 %
In addition, the Micromeritics ASAP 2020 system (Micromeritics, GA, USA) was used to conduct the N2-adsorption test at a consistent temperature of 77.350 K for porosity measurement. It calculated the specific surface area via the Brunauer–Emmett–Teller (BET) equation and determined pore size distributions using the Barrett–Joyner–Halenda (BJH) method from the adsorption curve. The samples were prepared from both the carbonated side and the non-carbonated side, as indicated by the phenolphthalein method.
(3) Embodied carbon content for concrete: The life cycle assessment (LCA) of the concrete products by using the blended cement was evaluated based on the database provided by the Institute of Civil Engineers (ICE, London, UK; https://circularecology.com/embodied-carbon-footprint-database.html, accessed on 5 November 2023) with the addition of the evaluated captured carbon content by blended cement paste [37] under the scheme of the cradle-to-gate method. The commercial concrete mix design is as given in Table 3, and was set as the precast concrete pavement bricks with a standard unit of 200 × 200 × 50 mm. The transportation distance is expected to be 30 miles, which is a typical distance around construction sites. The emission factor for each material is based on the database ICE V3.0, extracted from EN 15804, EPD-MPA-20170159-CAG1-EN (https://epd-online.com/, accessed on 5 November 2023). The standard 100 mm cubic bricks are made based on the mix design for testing the carbonation depth according to the phenolphthalein method. The binders used were selected based on the discussion in Section 3.1, which are the ref, 50% FA blends, and 60% GGBS blends. The carbonation depth of the three cubic concretes are 15.3 mm, 27.6 mm, and 14.3 mm, respectively.

3. Experiment Results and Discussion

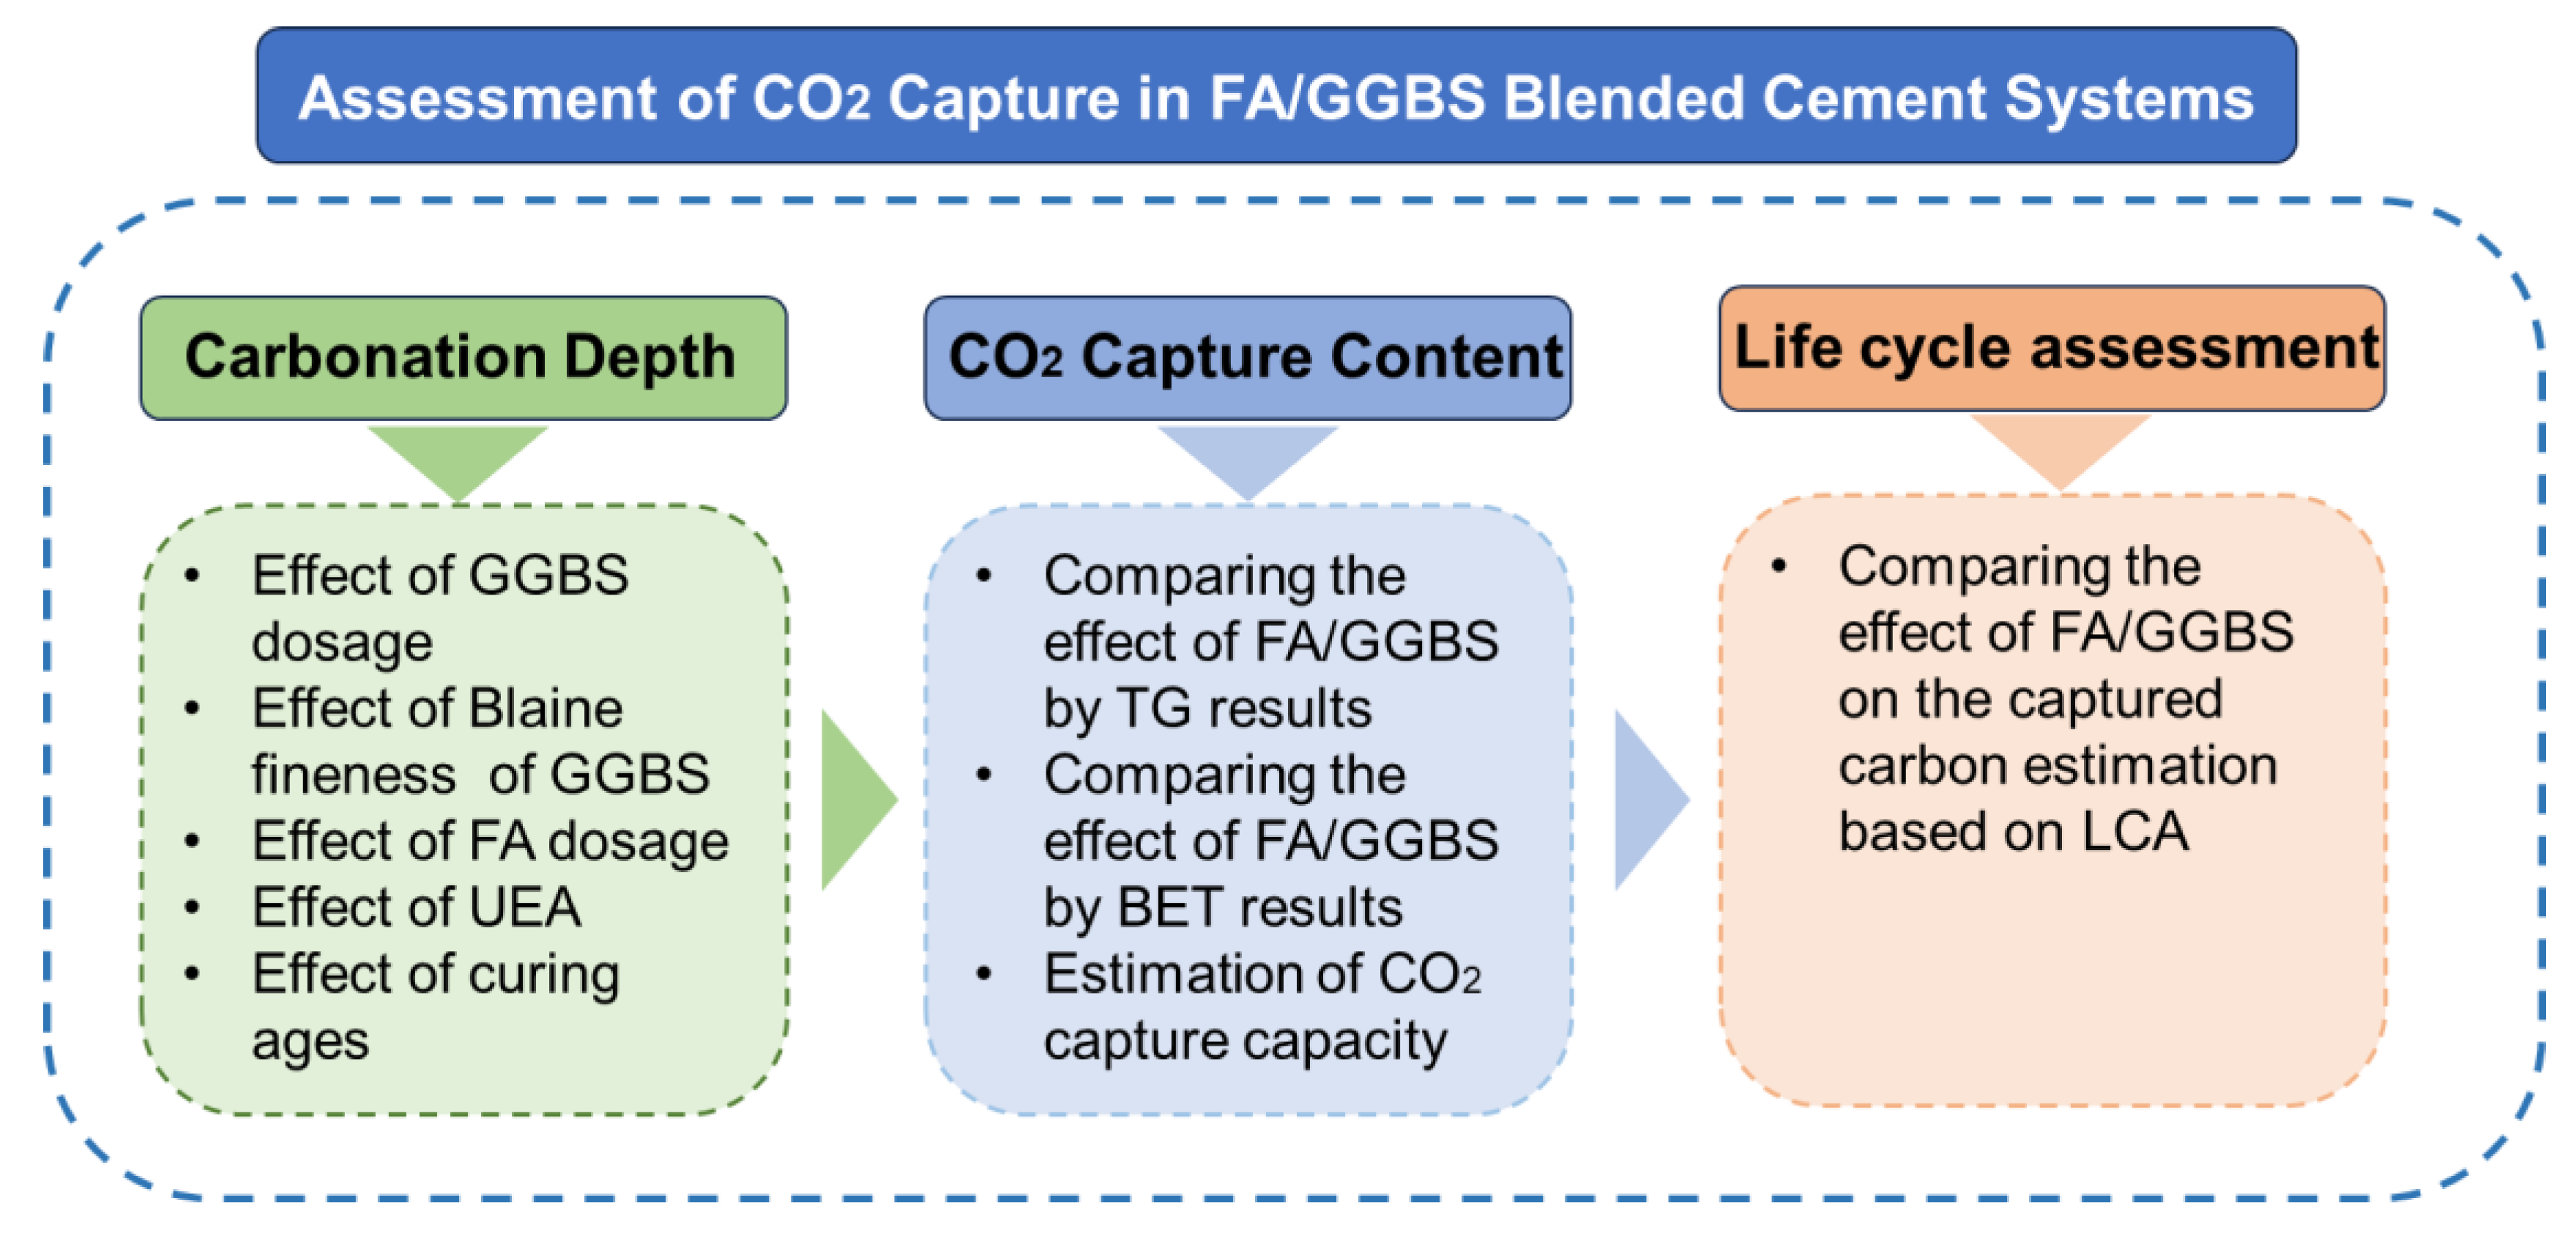
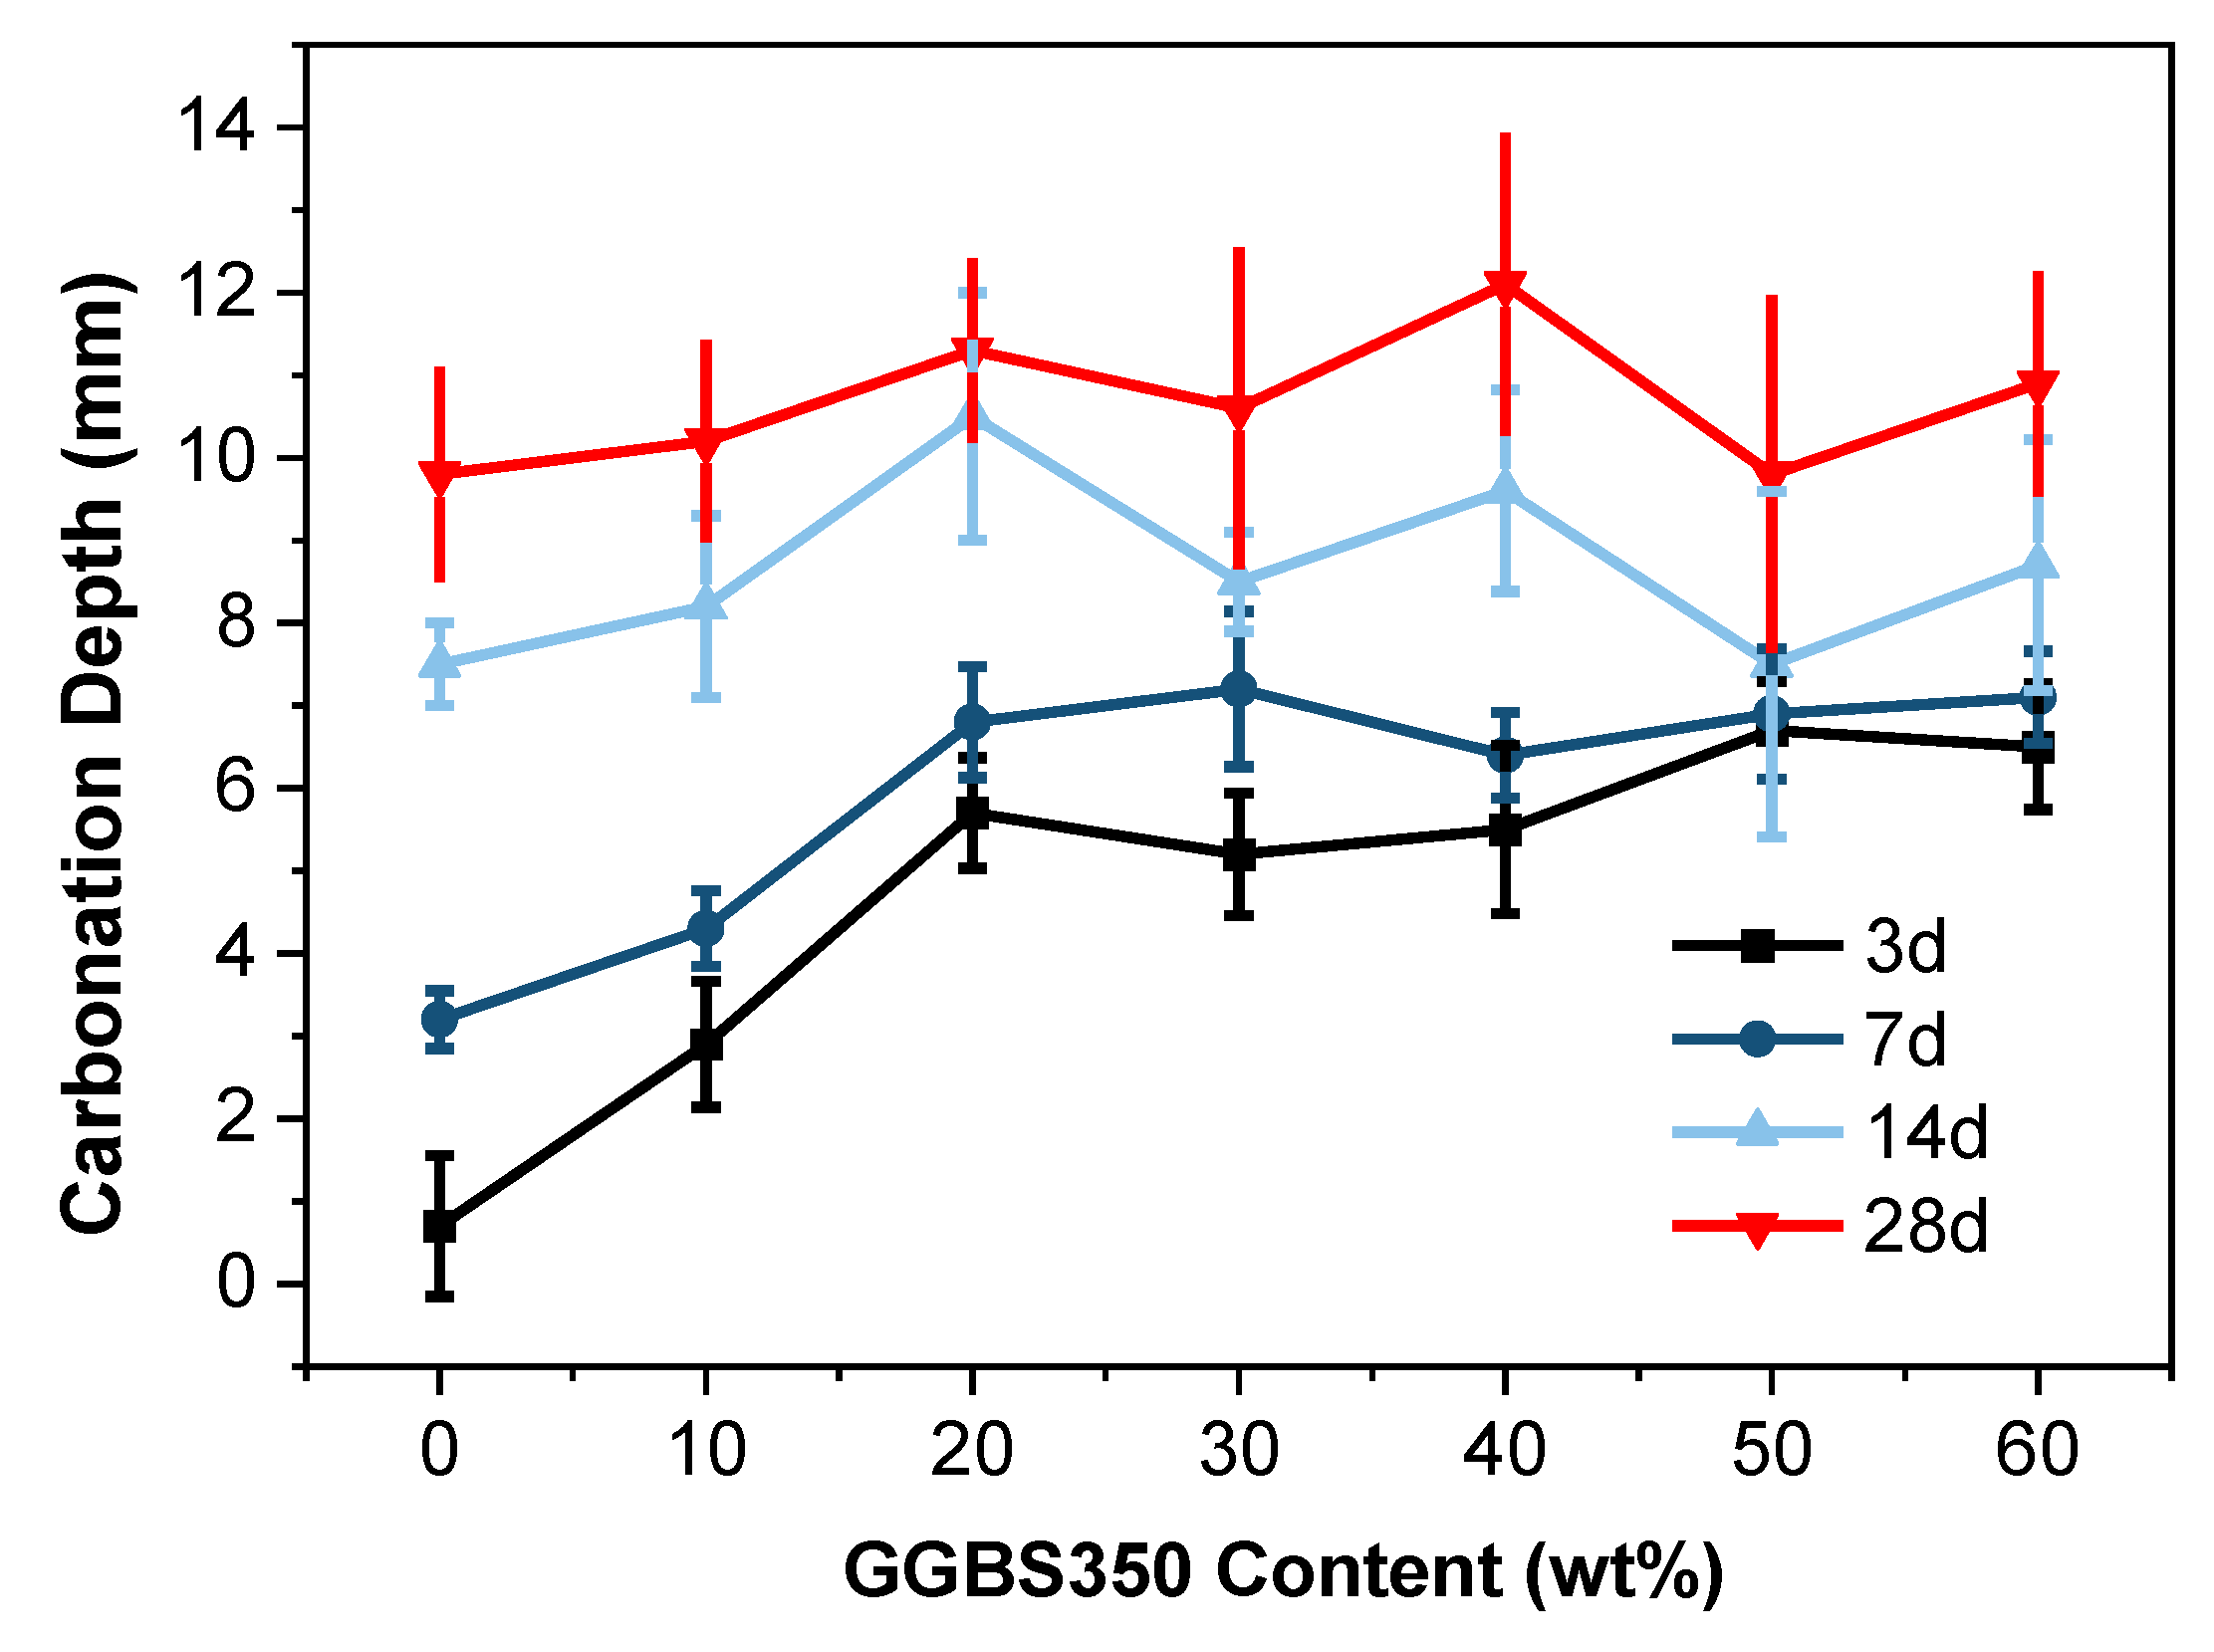
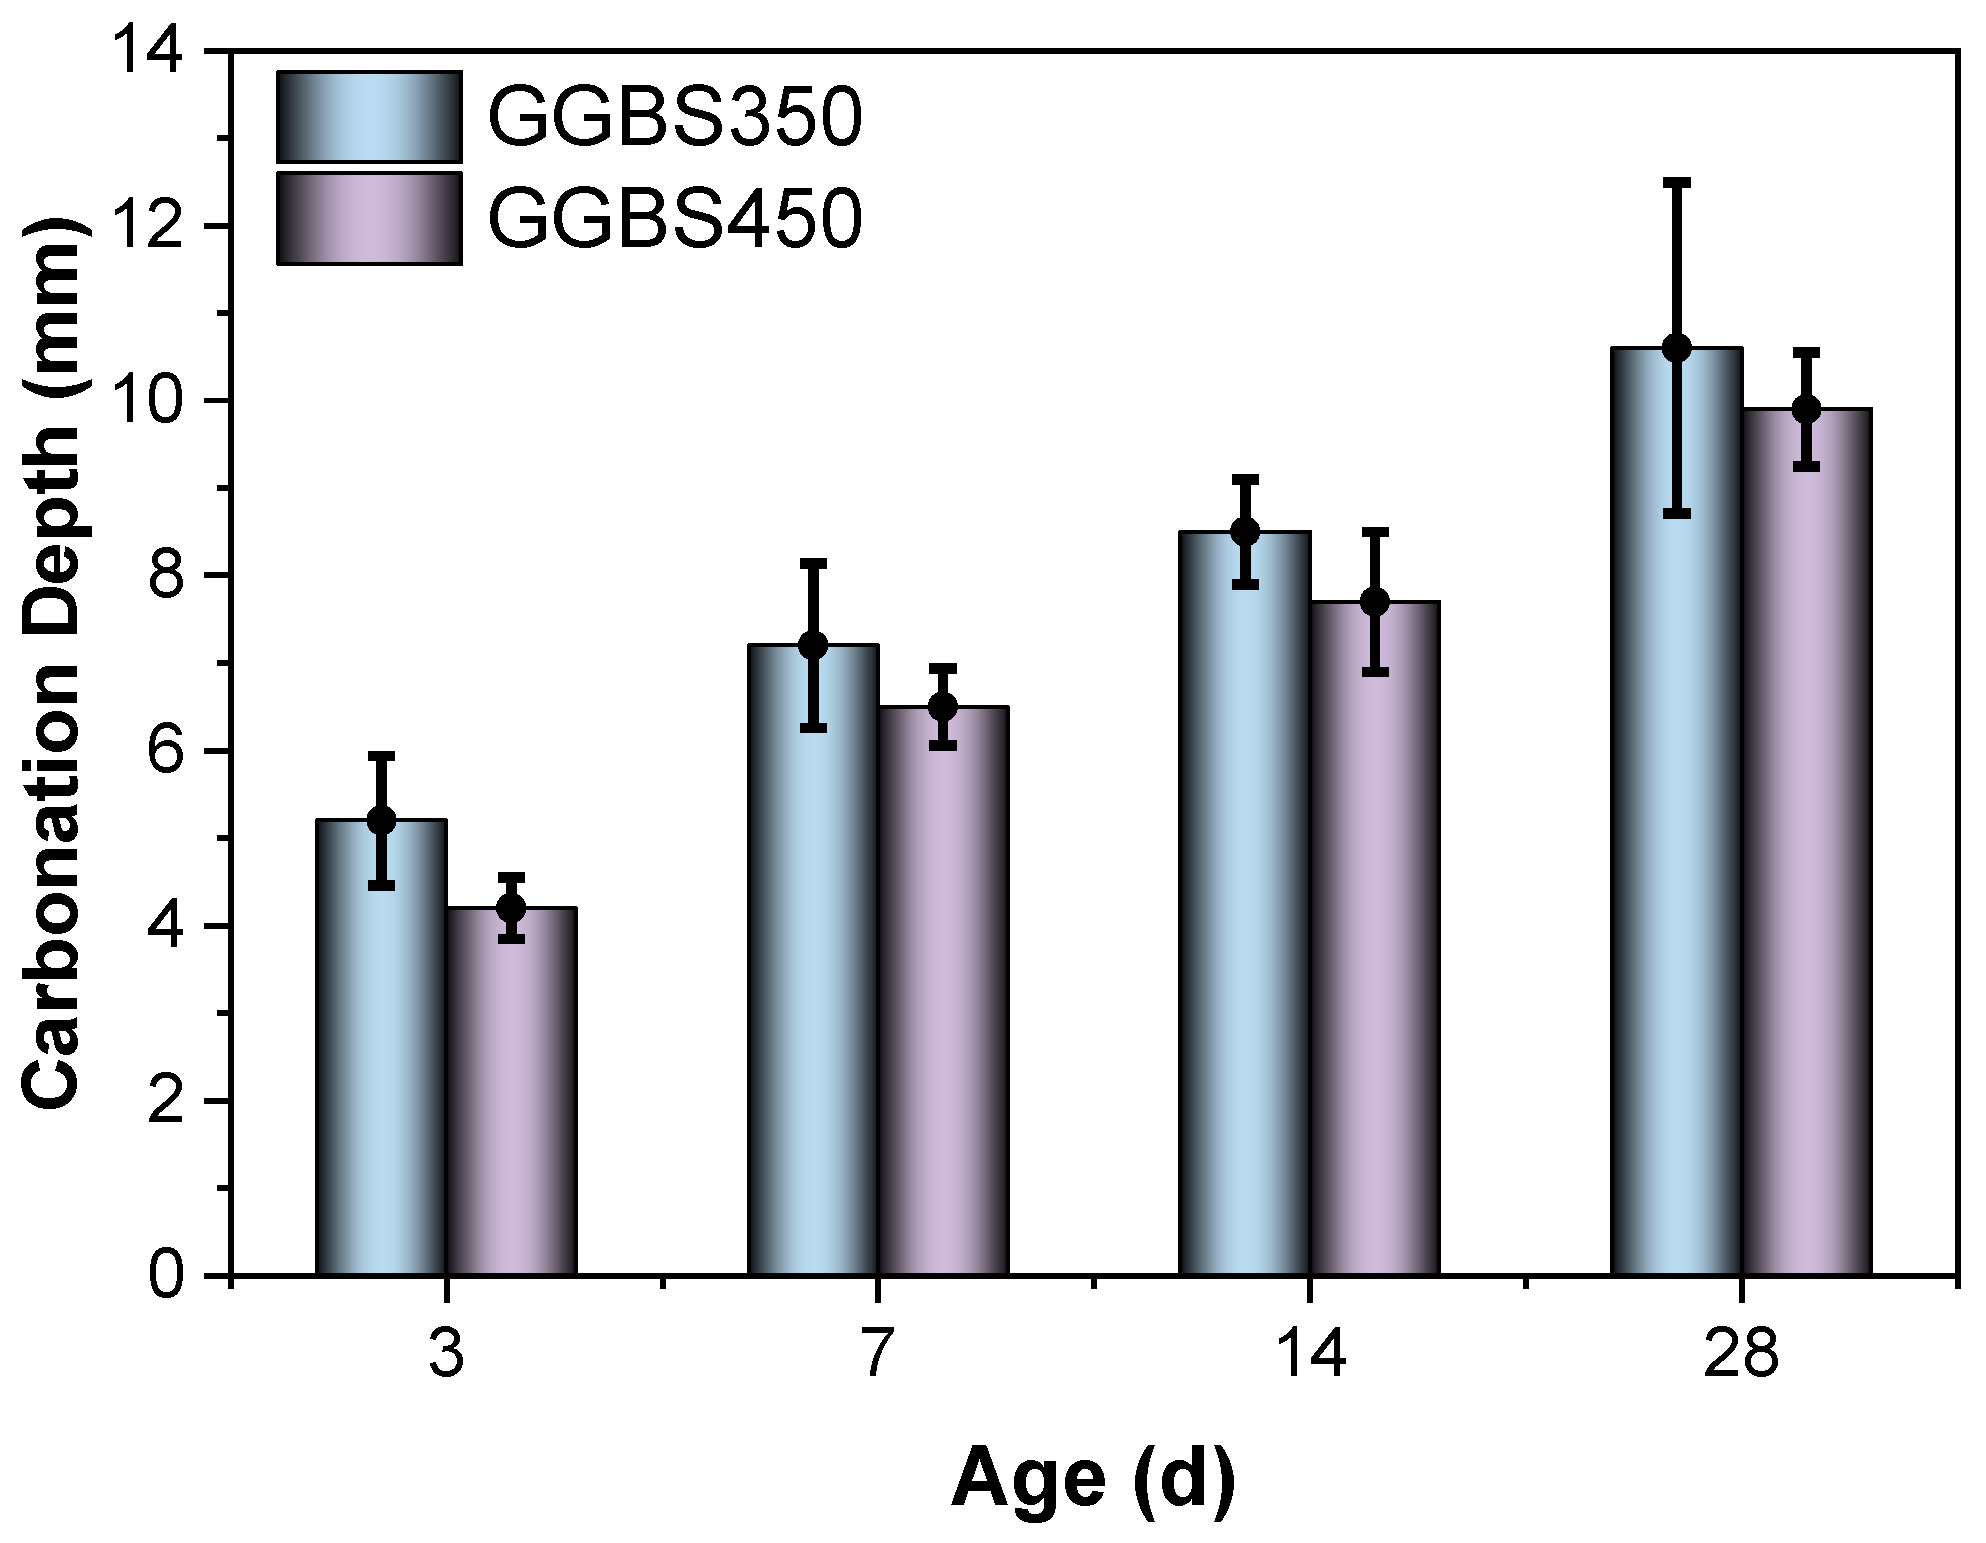
3.1. Carbonation Depth

Figure 5 shows the carbonation depth of GGBS-blended cement at 3, 7, 14, and 28 d with varying slag content (0 wt% to 60 wt%) under a water-to-binder ratio of 0.35. The experimental results indicate that the carbonation depth of slag-clinker cementitious materials at different ageing stages exceeds that of the control group. Notably, distinct disparities in carbonation depth are observed at 3 and 7 d, while the differences diminish gradually at 14 and 28 d. Interestingly, the carbonation depth of hardened GGBS blends falls below that of the control group at both 14 and 28 d of carbonation.
Examining the reasons behind these findings, it is imperative to note that water-quenched GGBS constitutes an active glassy material, and alkali released from the clinker triggers its activity [38], albeit with a certain latency in this reaction (i.e., secondary hydration) [39]. Nonetheless, the hydration products thereof contribute to densifying the cementitious material and refining pore structures [40]. Consequently, this phenomenon can enhance the carbonation resistance of cementitious materials under these conditions.
Figure 6 illustrates the impact of slag activity on the carbonation depth of blended cement containing a 30% GGBS content. The depiction clearly illustrates that blended cement compositions with increased slag activity consistently demonstrate shallower levels of carbonation at various stages of maturation when contrasted with compositions possessing lower slag activity [41]. The influence of slag activity on blended cement is discernible through dual mechanisms. Primarily, the increase in slag fineness contributes to an augmented specific surface area, thereby facilitating a more extensive interaction with Ca(OH)2 within the system. This interaction leads to a reduction in Ca(OH)2 content, effectively mitigating its detrimental impact on carbonation. Additionally, this interaction fosters the formation of C-S-H gel, consequently narrowing the pore structure of the blended cement. This phenomenon results in heightened density and increased resilience against carbonation, bolstering the material’s durability over time. The synergistic effect of enhanced surface area and the formation of C-S-H gel thus presents a multifaceted approach by which slag activity positively influences the carbonation resistance of blended cement [42].
The overarching effect on carbonation emanates from the confluence of these dual mechanisms. Empirical evidence illustrated from this investigation that the density enhancement attributed to enhanced slag activity markedly surpasses the adverse impact stemming from Ca(OH)2 depletion [43,44]. Consequently, the carbonation depth of cementitious materials crafted with highly active slag consistently registers lower values across diverse ageing periods compared to those utilising low-activity (i.e., lower surface area, in this case) slag [45]. Significantly, when maintaining a specified water-to-binder ratio and incorporating 30% GGBS content, a remarkable enhancement in carbonation resistance becomes particularly evident. Notably, this enhancement manifests as notable reductions in depth by 19.2%, 9.7%, 9.4%, and 6.5% at 3 days, 7 days, 14 days, and 28 days, respectively. This empirical trend not only underscores the substantial impact of slag activity on mitigating carbonation but also intimates a gradual decrease in its influence over time on the depth of carbonation within the system. This diminishing effect suggests a nuanced temporal relationship between slag content and its efficacy in bolstering the resistance of the material against carbonation, underscoring the need for continued investigation into the long-term implications of slag activity in blended cement compositions.
When the FA content reaches 50 wt% (under a water-to-binder ratio of 0.45), the carbonation depth of the blended cement reaches 26.3 mm (Figure 7), indicating severe carbonation. This situation markedly differs from the impact of GGBS content on cementitious material carbonation (Figure 5). The relatively lower reactivity of FA compared to GGBS (owing to its lower calcium content) leads to a potential higher consumption of Ca(OH)2 during reactions [42]. Consequently, the alkalinity of the cementitious paste decreases, making the cementitious material more susceptible to carbonation. Additionally, the pozzolanic reaction of FA lags (behind) that of GGBS, showing more pronounced disparities during the later stages of carbonation against the control group.
Furthermore, the excessive unreacted FA in the early stages significantly increases the porosity of the cementitious material, facilitating CO2 diffusion and thereby intensifying carbonation. Notably, when the FA content reaches 50%, the carbonation depth at 28 d (under a water-to-binder ratio of 0.45) increases by 100.1% (Figure 7). This substantial increase underscores the profound impact of FA content on the carbonation of cementitious materials.
After the addition of the UEA expansion agent, the carbonation of cement pastes significantly increased, particularly during the early-age phase, resulting in approximately a twofold increase in carbonation depth compared to the control group (Figure 8). With the inclusion of the UEA expansion agent, the cement paste exhibited a notably higher presence of ettringite compared to ordinary cement paste. The complete carbonation of this ettringite led to a significant rise in the content of calcite, suggesting that under the influence of CO2, the ettringite was prone to fragmentation, resulting in the generation of CaCO3. Moreover, the as-formed calcium carbonate predominantly comprised unstable calcite, contributing to an increase in carbonation depth.

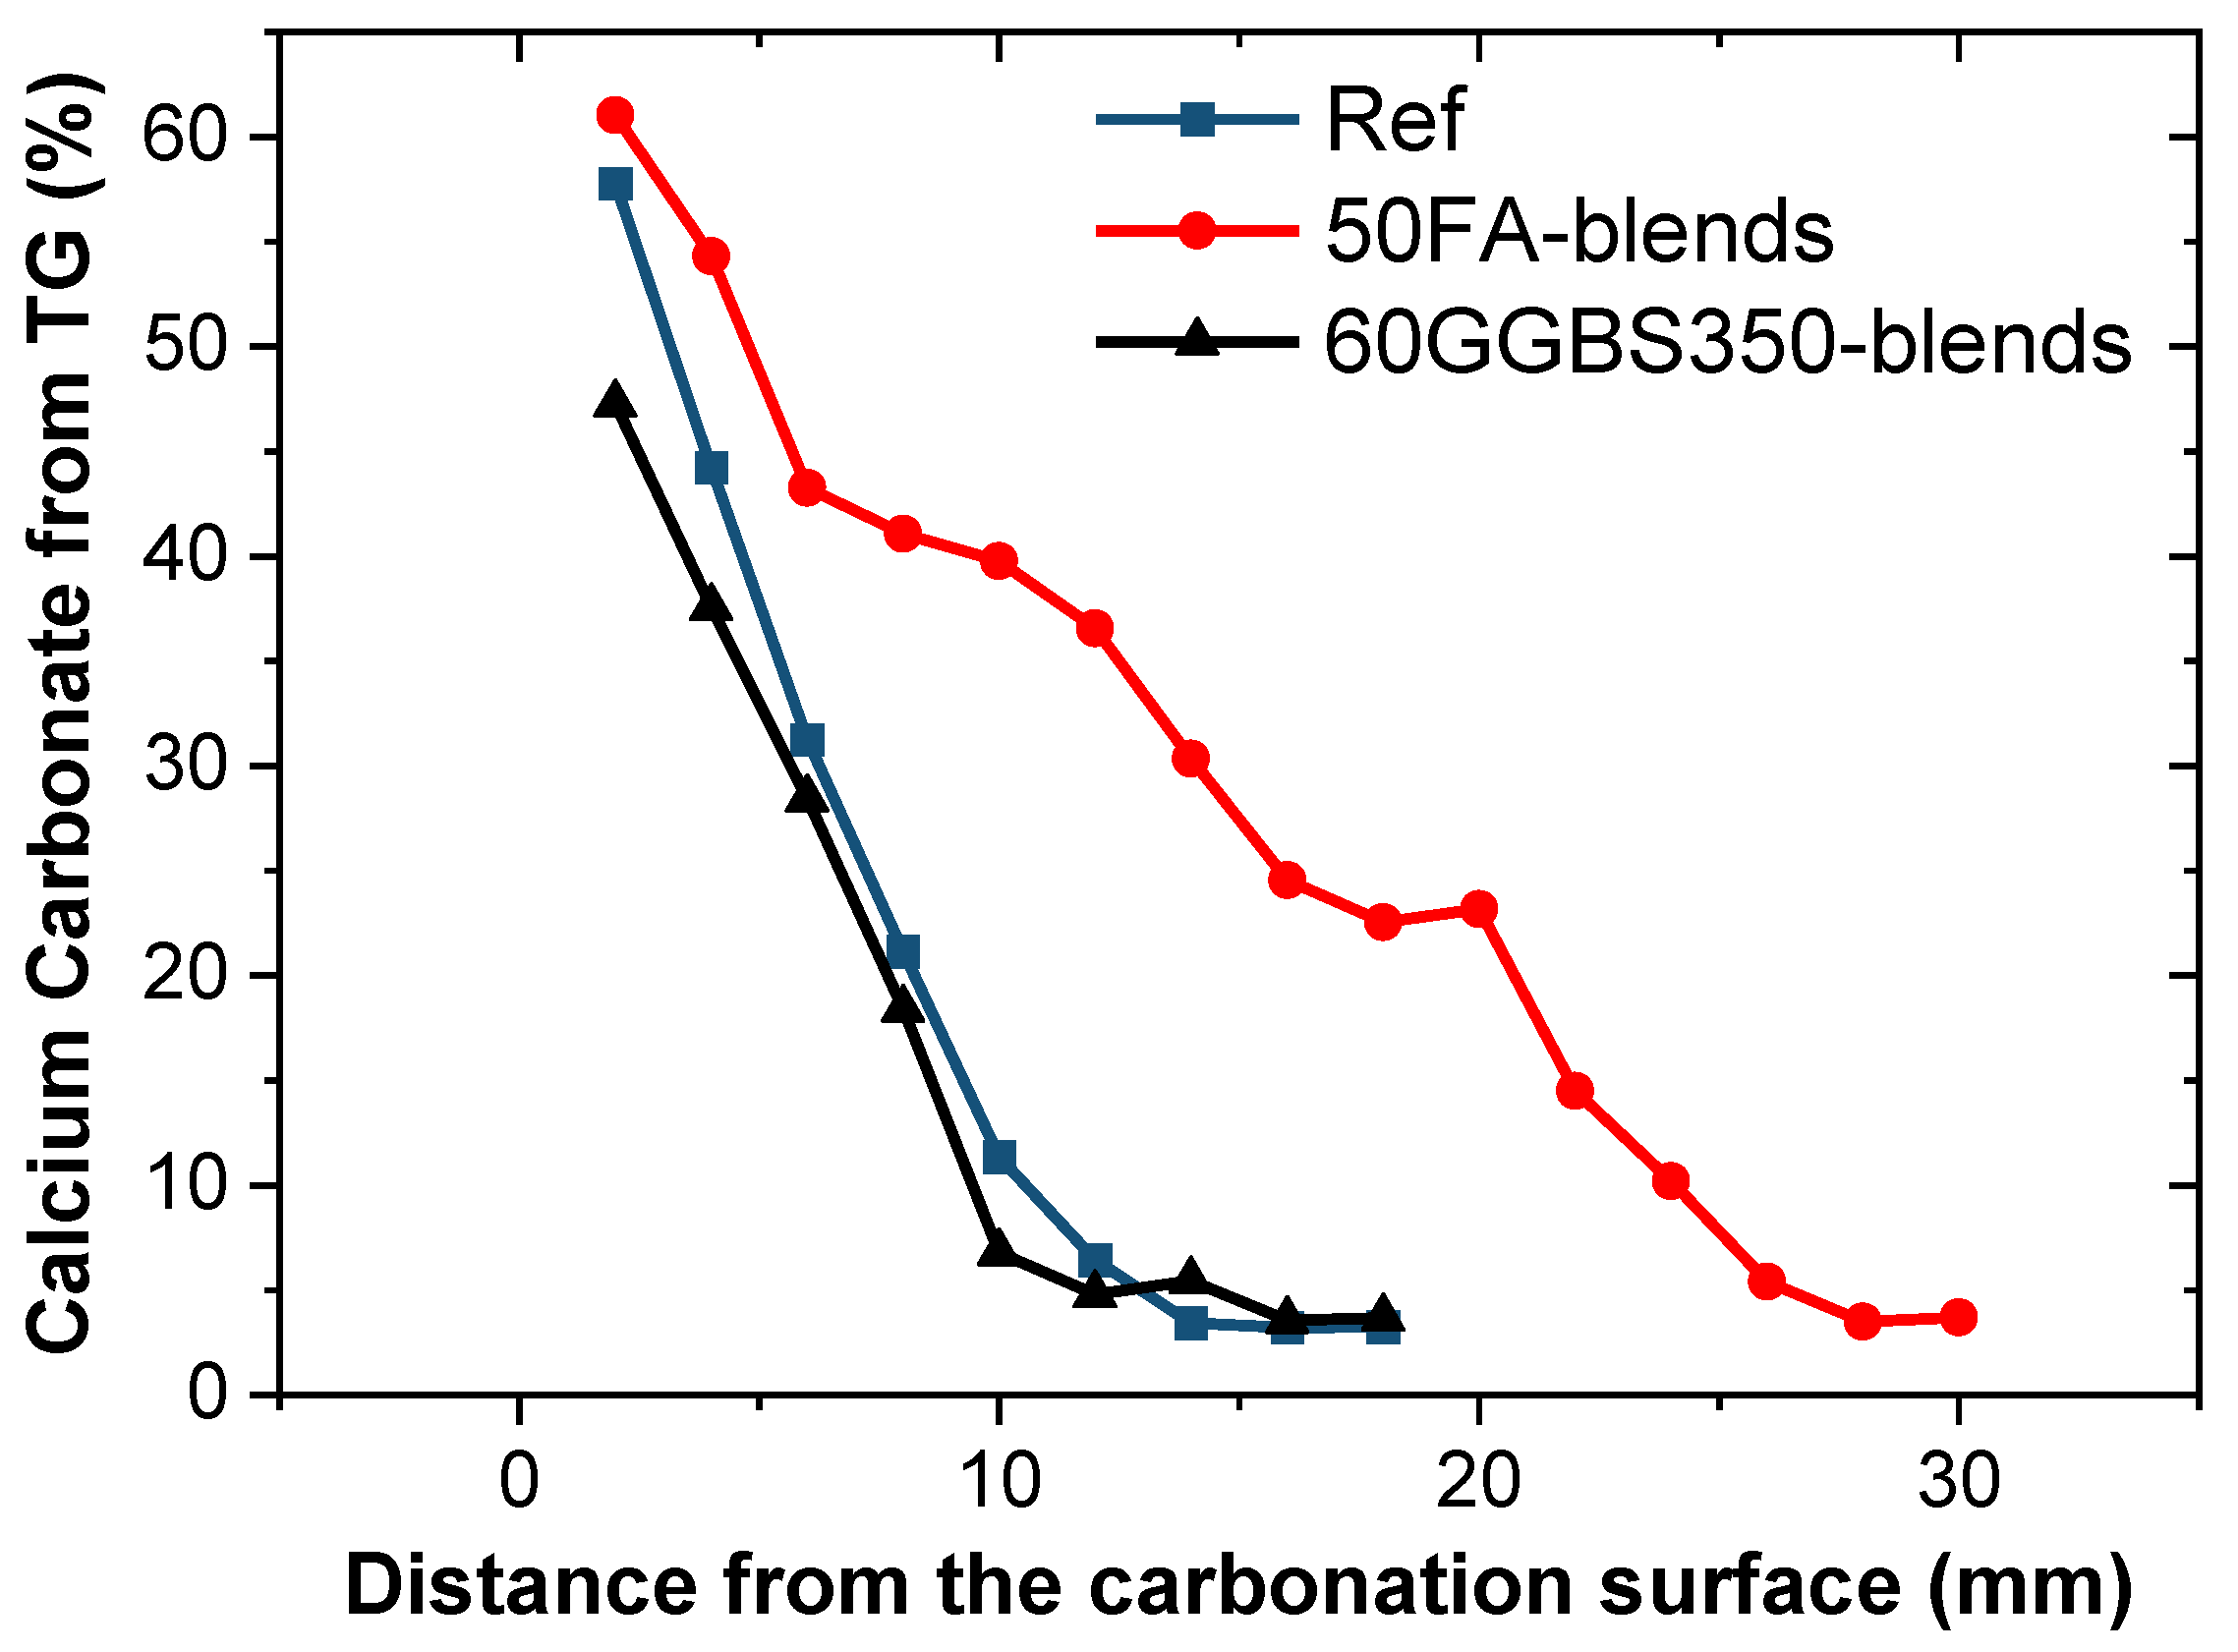
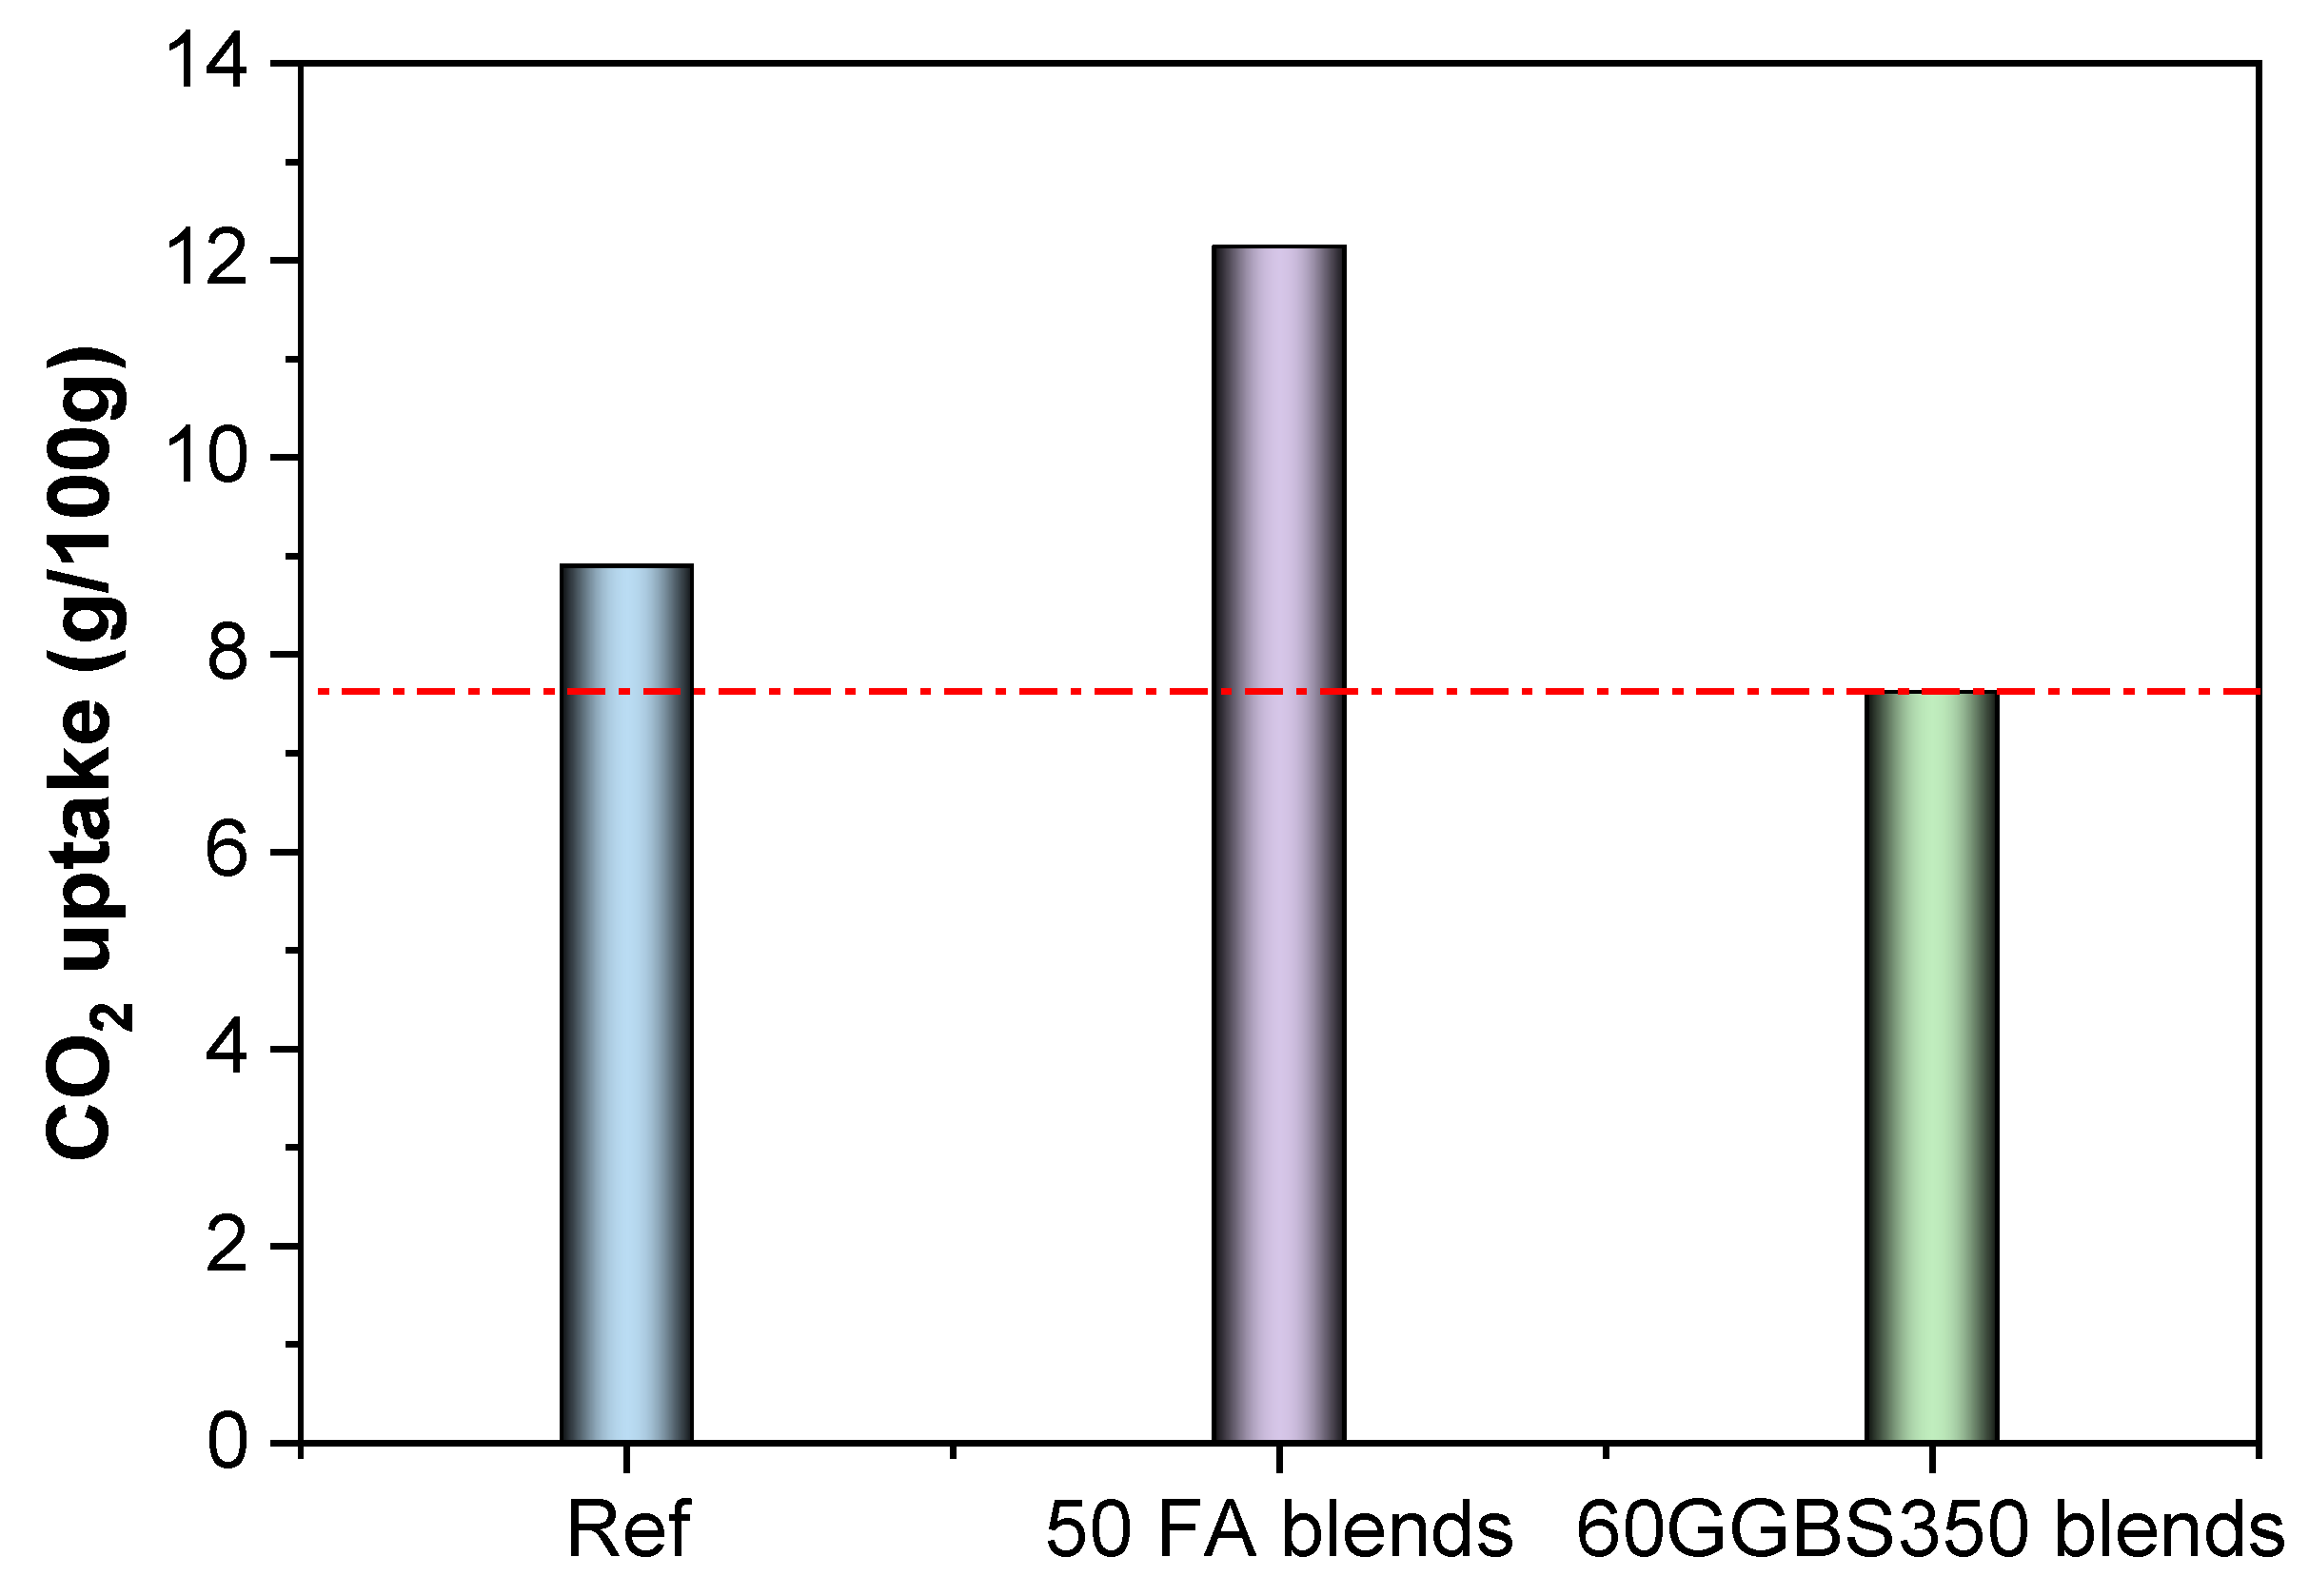
3.2. Carbonates Content Profile

As discussed in Section 3.1, the maximum carbonation that happened in the systems was in 50 wt% FA-blended cement, which was further used for the calculation of carbonate profiles. Considering that GGBS is also frequently used in normal concrete, the 60 wt% GGBS-blended cement was used for comparison. The carbonated samples were therefore cut and ground for thermalgravimetric analysis.
Figure 9 illustrates the evolution of average calcium carbonate content at a given location concerning the depth of carbonation following exposure surface sampling (2 mm to 30 mm). The trend exhibited in the figure aligns significantly with the results of carbonation depth (as shown in Figure 5 and Figure 7): after 28 d of carbonation, the FA-blended cement demonstrates notably elevated calcium carbonate content, correlating with its higher degree of carbonation. Additionally, FA contains some unburnt solid carbon that decomposes at this stage, thus resulting in an overestimation of the calcium carbonate content within the fly ash blended cement [46]. Upon the introduction of active mineral admixtures such as fly ash (FA) and ground granulated blast furnace slag (GGBS) into the Portland cement system, their active constituents initiate a gradual consumption of Ca(OH)2 and C-S-H gel. This process results in the formation of a lower calcium-to-silica ratio C-S-H gel or C-A-S-H gel. Notably, this reaction not only modifies the composition of the cementitious matrix but also provides potential reactants for subsequent carbonation processes. These include unreacted Ca(OH)2 and C-S-H gel, alongside C-(A)-S-H and lower Ca/Si ratio C-S-H gel, which engage with the active substances present, influencing the carbonation reactions within the system. This transformative process underscores the intricate role of active mineral admixtures in altering the chemical composition of cementitious materials and subsequently affecting their susceptibility to carbonation. Further investigation into these intricate reactions is pivotal for a comprehensive understanding of their implications for the durability and performance of cementitious systems [47]. Ca(OH)2 constitutes a crucial part of the concrete paste, and during carbonation, it is converted into calcium carbonate, followed by C-S-H gel [48]. However, the carbonation of the gel depends on intricate factors such as the liquid phase environment, Ca/Si ratio, gel porosity, and more. Upon slag reaction, the generated C-A-S-H gel possesses reduced gel porosity, restraining diffusion, thereby exhibiting a slightly lower degree of carbonation compared to the control group (Table 4) [42].
It is clearer from the pore size distribution (Table 4) that the pore structure was refined by adding 60 wt% GGBS after 28 d of hydration, which agrees with the theory of secondary reaction (i.e., the pozzolanic effect of GGBS at the age of 28 d). However, the addition of 50% FA coarsened the pore structure from the nanometer to the micro-meter scale (Table 4). This is potentially due to the lower reactivity of FA during hydration, only reacting a little at the age of 28 d. A previous study showed that the refinement of C-A-S-H gel in FA-blended cement takes up to 91 d [16]. By looking more specifically at the pore diameter ranges of the selected mixtures, the pores distributed in the range of 50–200 nm in FA-blended cement increased significantly when compared to the reference group (i.e., the clinker–gypsum paste), which provides tunnels for the diffusion of CO2, accelerating the carbonation depth (Figure 7) and carbonation degree (Figure 9). On the other hand, the GGBS blends (even the content of GGBS is up to 60 wt%) showed a decrease in both the 50–200 nm and >200 nm ranges of pores, indicating the significant hydration of GGBS happening in the system [34].
Moreover, the phenolphthalein method may not accurately reflect the extent of carbonation within the cementitious paste. Therefore, the thermal gravimetric method is used as the basis to evaluate the capacity of CO2 binding by the blended cement systems [15]. Equation (2) provides an estimation method for the average CO2 content taken by the paste, which is estimated from the mass loss of each layer. The average binding capacity of the cement paste is used for the estimation of the total carbon emission by the as-made precast concrete products.
C O 2   ( g / 100 g ) = i = 1 n ( l 1 + l 2 + + l n ) n
where l stands for the CO2 from each layer calculated from the mass loss, and the position of the l is given in Figure 4.
As calculated, the CO2 uptake by the carbonated blended cement is estimated in Figure 8. The addition of FA significantly increases the content of CO2 taken by the paste due to carbonation, whereas the addition of GGBS slightly reduces this effect [49,50]. As discussed above, although the GGBS consumes calcium hydroxide in the system, it also decreases the carbonation depth (Figure 5) and reduces the amount of captured carbon. The carbonated pastes stabilised around 8.90 g of CO2 per 100 g of paste, which increased to 12.14 by using the 50% FA blends, accounting for a 36.4% increase. Conversely, the 60% GGBS blends reduced the captured CO2 by around 14.4%, reaching 7.62 g of CO2 per 100 g of pastes (Figure 10).
As calculated, the CO2 uptake by the carbonated blended cement is estimated in Figure 10. The addition of FA significantly increases the content of CO2 taken by the paste due to carbonation, whereas the addition of GGBS reduced slightly this effect [49,50]. As discussed above, although the GGBS consumes calcium hydroxide in the system, it also decreases the carbonation depth (Figure 5) and reduces the amount of captured carbon. The carbonated pastes stabilised around 8.90 g of CO2 per 100 g of pastes, which increased to 12.14 by using the 50% FA blends, accounting for a 36.4% increase. Conversely, the 60% GGBS blends reduced the captured CO2 by around 14.4%, reaching 7.62 g of CO2 per 100 g of pastes (Figure 10).

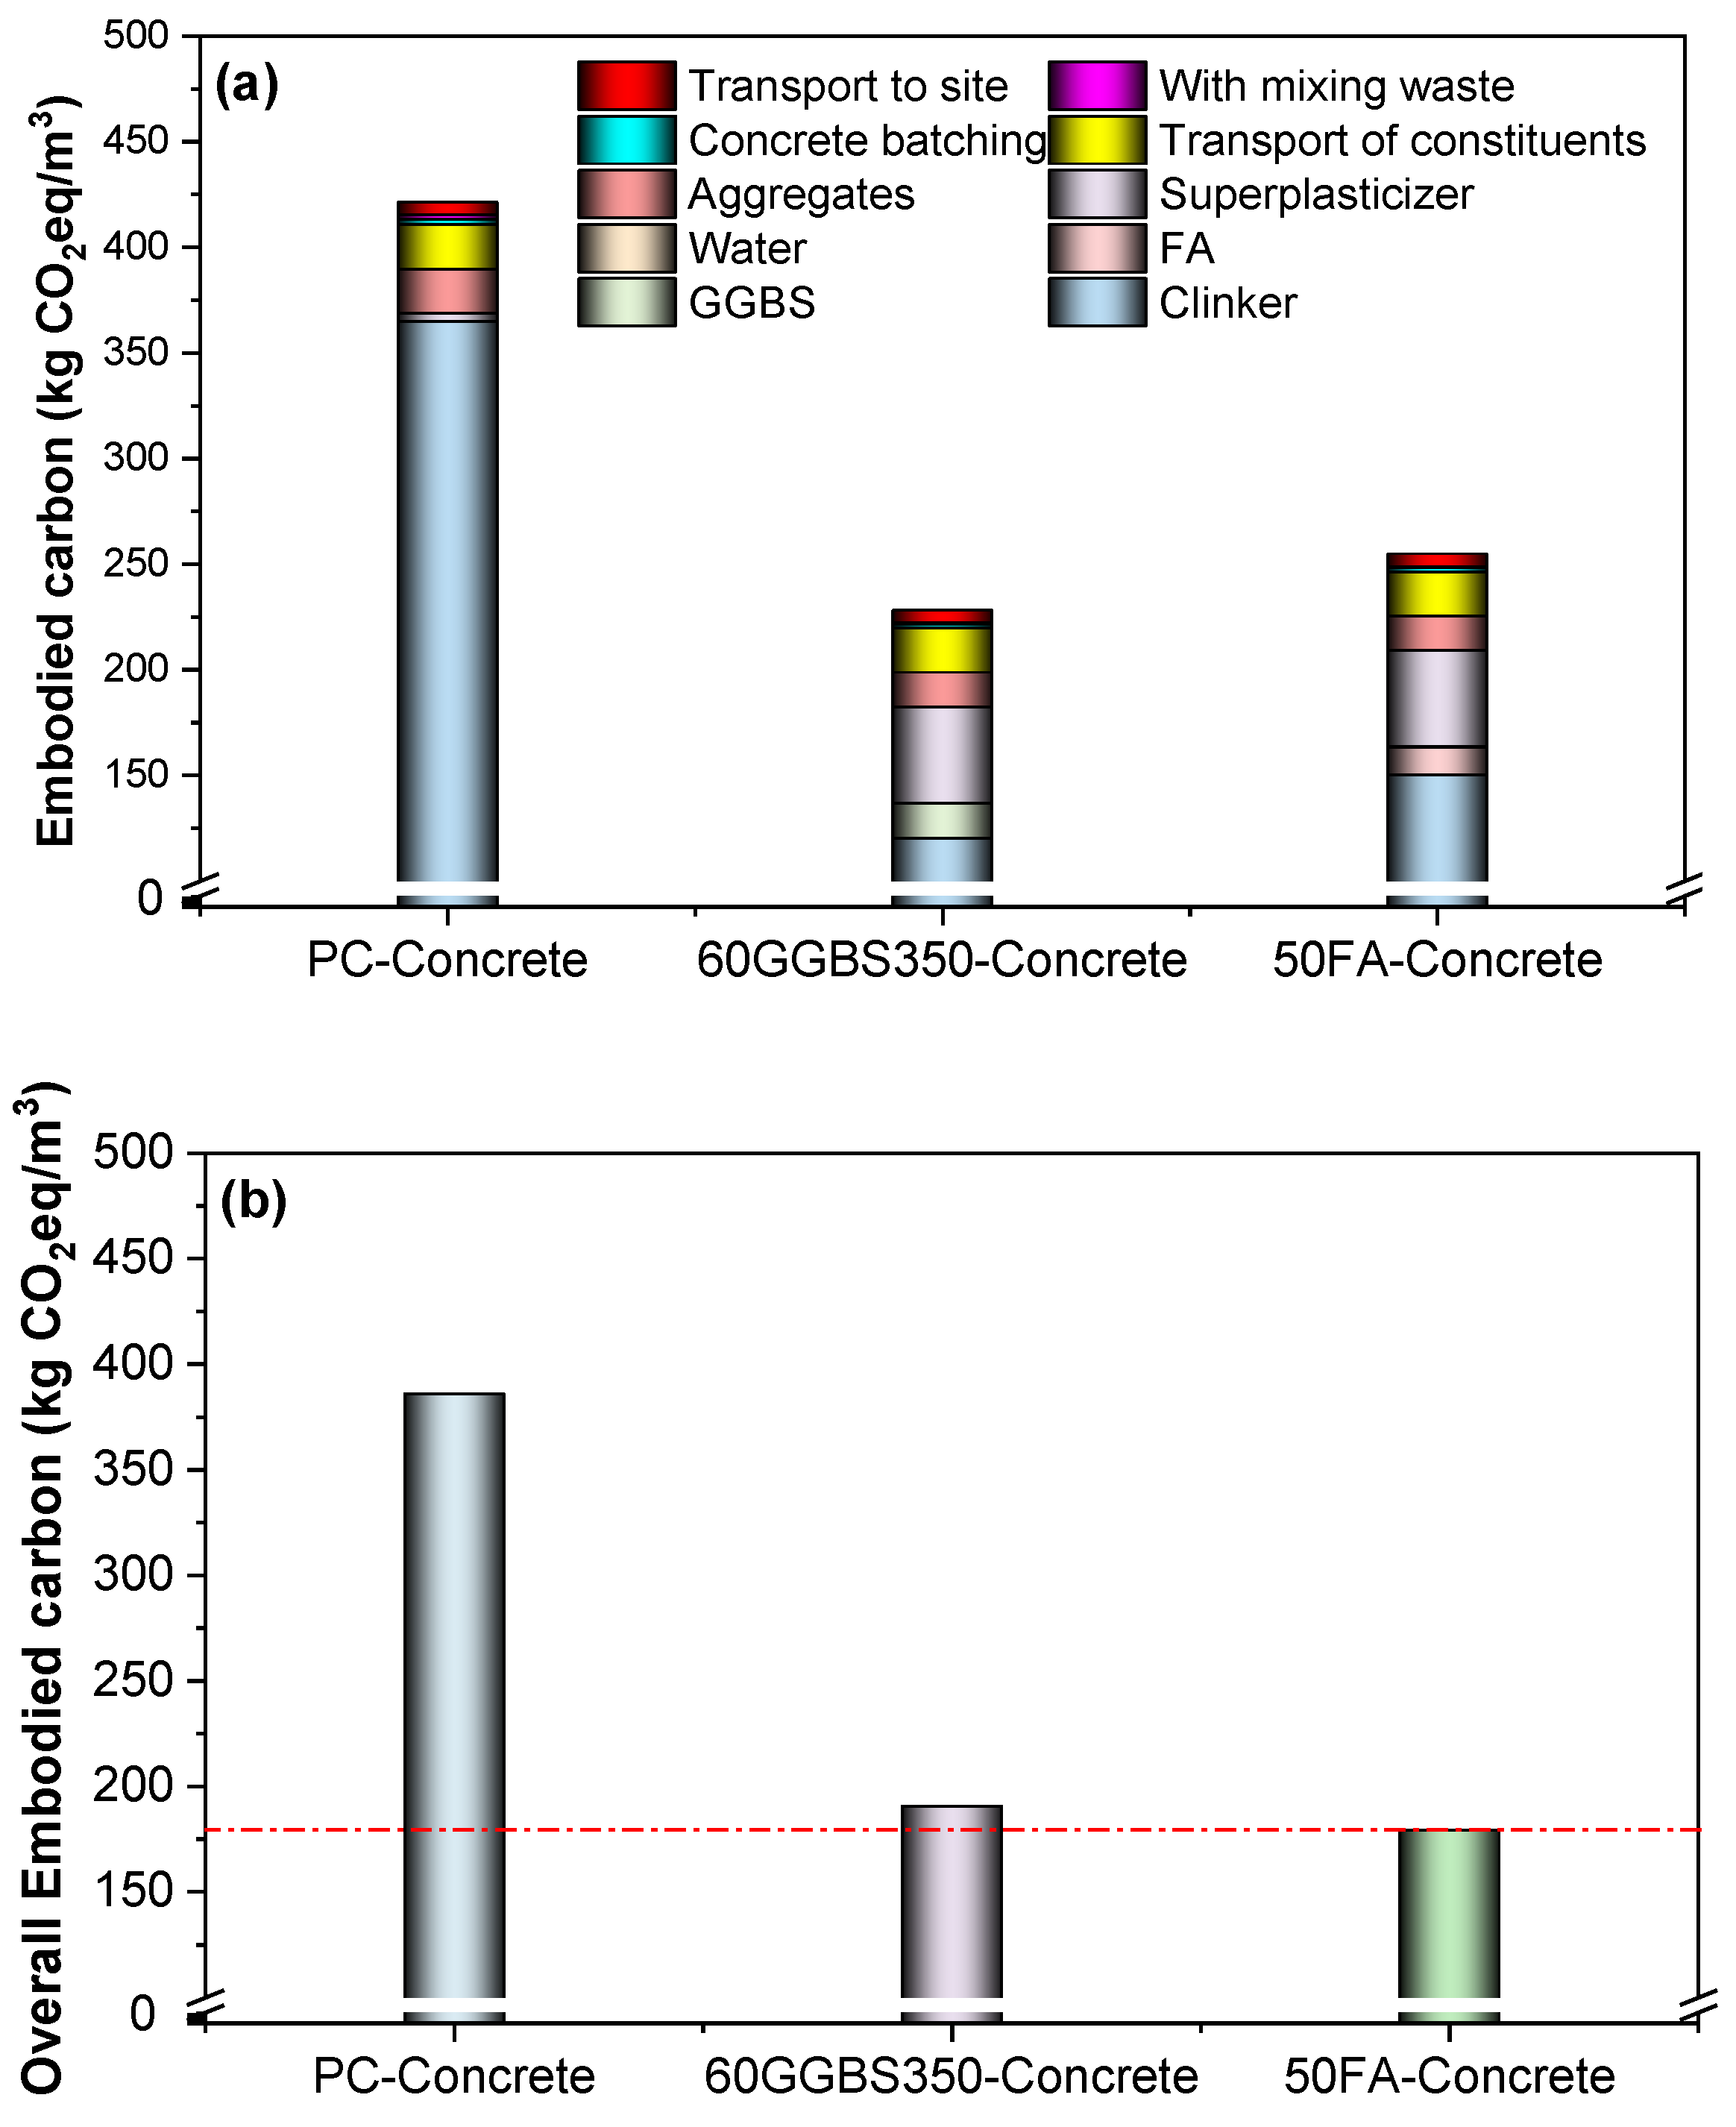
3.3. Life Cycle Assessment and Captured Carbon Estimation of FA/GGBS Block

Life cycle assessment (LCA) is a comprehensive method used to evaluate the environmental impacts of a product, process, or system throughout its entire life cycle. In the context of producing paving bricks, the extension of the statement could be considered into six phases of the life cycle and their implications [51,52,53,54]. Figure 11 gives the schematic of the production of concrete products using the as-proposed mix design given in Table 3. The details are shown in the following:
Step 1: Raw Material Extraction and Processing: LCA involves assessing the impact of acquiring raw materials. In the case of paving bricks, this includes sourcing binders, aggregates (coarse and fine), and other additives. It considers the energy consumption, water usage, and emissions associated with mining, the transportation of raw materials to the production site, and their processing [55].
Step 2: Manufacturing Process: This phase involves the actual production of bricks, including mixing binders, aggregates, and any other additives to create the concrete mix. The energy consumed during the mixing, moulding, and curing process is considered. In this scenario, the use of waste CO2 gas for carbonation curing is noteworthy as it could reduce the carbon footprint compared to traditional curing methods.
Step 3: Transportation: LCA accounts for the transportation of raw materials to the manufacturing plant, as well as the distribution of the finished bricks to construction sites. The distance travelled, the mode of transportation, and fuel consumption impact the overall assessment.
Step 4: Carbonation Curing: This step is significant in reducing the carbon footprint. Carbonation curing involves using waste CO2 gas to react with the concrete mix, which leads to the formation of calcium carbonate within the bricks, thereby sequestering carbon dioxide.
Step 5: Construction Process: The assessment considers the emissions associated with the construction phase, including the transportation of bricks to the construction site, on-site activities like laying the bricks, and any additional materials or energy used during installation.
Step 6: End-of-Life Considerations: LCA might also consider the disposal or reuse of the paving bricks after their intended life cycle. Whether the bricks are recycled, reused, or disposed of in landfills affects their overall environmental impact.
As shown in Figure 11, the blended binders are mixed with coarse and fine aggregates in the plant to produce the bricks, followed by carbonation curing using waste CO2 gas. The life cycle assessment of the embodied carbon emissions also includes the transportation and construction process (Figure 11) [56]. The embodied carbon emissions from the captured CO2 by the bricks made of different blended cements can be calculated based on the estimation from Equation (2) (as given in Figure 10) with the consideration of the carbonation depth of the cured bricks (Section 2.3). However, two additional factors need to be considered, including, firstly, the proportion of pastes in the concrete, which can be calculated from Equation (3), and secondly, the volume of carbonation can be estimated from the carbonation depth tested, as seen in Section 2.3.
V p a s t e = V c o n c r e t e V a g g .
where the density of concrete is considered to be 2400 kg/m3; the density of aggregate is 2710 kg/m3 (limestone aggregate); and the density of water is 1000 kg/m3. Thus, the volume of paste can be calculated (including the binder, water, and the as-formed capillary and gel pores). Meanwhile, the density of cement paste is estimated to be 2000 kg/m3, which can be used to estimate the mass of paste in carbonated concrete.
V c a r b o n a t e d = V b r i c k [ a d c a r b o n a t i o n × b d c a r b o n a t i o n × c d c a r b o n a t i o n ]
where Vcarbonated is the carbonated volume of concrete, which can be used in conjunction with Equation (3) to calculate the mass of carbonated paste.
E m b o d i e d   c a r b o n = t o t a l   e m b o i d e d   c a r b o n c a r b o n   t a k e n   b y   p a s t e
Figure 12 calculates the embodied carbon emissions based on the methodology given in Section 3.2 and the process in Figure 11. Naturally, the addition of both GGBS and FA hugely reduces the carbon emissions from the binder, which gives roughly half of the total carbon emissions from the PC-concrete (i.e., use CEM I). The addition of 60% GGBS shows lower carbon emissions when compared to that of 50% FA. However, when considering the CO2 capture, this situation changes conversely. This demonstrates that the low-activity SCMs may show a positive effect on the overall carbon emission of concrete products when using carbon curing technology.

4. Conclusions

The research thoroughly investigates the complex interplay of carbonation depth in relation to diverse cementitious materials and additives while calculating their cumulative embodied carbon emissions. As a result, the following conclusions emerge:
(1)
GGBS-blended cement demonstrates reduced carbonation depth via densification, while higher FA content amplifies depth due to delayed reactions and increased porosity, emphasising material and additive impacts.
(2)
The UEA expansion agent accelerates early-age carbonation, highlighting the diverse influences of additives on carbonation depth, crucial for enhancing durability against carbonation-induced deterioration.
(3)
FA blends exhibit increased carbonation due to heightened porosity, contrasting with the GGBS blends’ decreased depth, attributed to refined pore structures from secondary reactions.
(4)
Thermal analysis confirms higher CO2 uptake in FA blends, highlighting the material composition’s crucial role in carbonation and emissions mitigation.
(5)
The addition of GGBS and FA significantly reduces binder emissions, comprising nearly half of PC-concrete emissions. While 60% GGBS initially shows lower emissions than 50% FA, considering CO2 capture alters this dynamic.
The study examines carbonation depth in cementitious materials and additives, highlighting GGBS’s ability to reduce depth while FA enhances it due to delayed reactions. Various additives play a significant role in influencing carbonation, ultimately affecting material durability. Thermal analysis validates the increased CO2 absorption in FA blends, vital for mitigating emissions. Incorporating both GGBS and FA notably decreases binder emissions, yet the emission dynamics change notably when considering CO2 capture.

Author Contributions

Conceptualisation, J.L. and F.Q.; data curation, J.L. and Y.W.; formal analysis, J.L.; funding acquisition, F.Q.; investigation, J.L., Y.W., Y.S. and H.Z.; methodology, J.L. and F.Q.; software, J.L.; validation, F.Q.; writing—original draft, F.Q.; writing—review and editing, J.L., Y.W., F.Q., H.Z. and Y.S. All authors have read and agreed to the published version of the manuscript.

Funding

The authors appreciate the support from the Australian Research Council (ARC), Australia (FT220100177; LP230100288; DP220101051; IH180100010; DP220100036).

Data Availability Statement

The raw data supporting the conclusions of this article will be made available by the authors on request.

Acknowledgments

School of Economic and Management, Southeast University, China; School of Civil and Environmental Engineering, University of Technology Sydney, NSW 2007, Australia; Department of Civil and Environmental Engineering, the Hong Kong Polytechnic University, HKSAR, China.

Conflicts of Interest

The authors declare no conflicts of interest.

References

  1. Coffetti, D.; Crotti, E.; Gazzaniga, G.; Carrara, M.; Pastore, T.; Coppola, L. Pathways towards sustainable concrete. Cem. Concr. Res. 2022, 154, 106718. [Google Scholar] [CrossRef]
  2. Xie, H.Z.; Li, L.G.; Liu, F.; Kwan, A.K.H. Recycling old concrete as waste concrete powder for use in pervious concrete: Effects on permeability, strength and eco-friendliness. Buildings 2022, 12, 2172. [Google Scholar] [CrossRef]
  3. Li, J.; Xu, G. Circular economy towards zero waste and decarbonization. Circ. Econ. 2022, 1, 100002. [Google Scholar] [CrossRef]
  4. Zeng, X.; Ogunseitan, O.A.; Nakamura, S.; Suh, S.; Kral, U.; Li, J.; Geng, Y. Reshaping global policies for circular economy. Circ. Econ. 2022, 1, 100003. [Google Scholar] [CrossRef]
  5. Ravikumar, D.; Zhang, D.; Keoleian, G.; Miller, S.; Sick, V.; Li, V. Carbon dioxide utilization in concrete curing or mixing might not produce a net climate benefit. Nat. Commun. 2021, 12, 855. [Google Scholar] [CrossRef] [PubMed]
  6. Tong, R.; Sui, T.; Feng, L.; Lin, L. The digitization work of cement plant in China. Cem. Concr. Res. 2023, 173, 107266. [Google Scholar] [CrossRef]
  7. Alahmari, T.S.; Abdalla, T.A.; Rihan, M.A.M. Review of Recent Developments Regarding the Durability Performance of Eco-Friendly Geopolymer Concrete. Buildings 2023, 13, 3033. [Google Scholar] [CrossRef]
  8. Qu, F.; Li, W.; Dong, W.; Tam, V.W.; Yu, T. Durability deterioration of concrete under marine environment from material to structure: A critical review. J. Build. Eng. 2021, 35, 102074. [Google Scholar] [CrossRef]
  9. Kortmann, J.; Minar, S. Contribution of Carbon Concrete Construction to the Circular and Resource Economy. Buildings 2023, 13, 2851. [Google Scholar] [CrossRef]
  10. Zajac, M.; Skocek, J.; Ben Haha, M.; Deja, J. CO2 Mineralization Methods in Cement and Concrete Industry. Energies 2022, 15, 3597. [Google Scholar] [CrossRef]
  11. Lu, D.; Wang, D.; Wang, Y.; Zhong, J. Nano-engineering the interfacial transition zone between recycled concrete aggregates and fresh paste with graphene oxide. Constr. Build. Mater. 2023, 384, 131244. [Google Scholar] [CrossRef]
  12. Deng, Q.; Zou, S.; Xi, Y.; Singh, A. Development and Characteristic of 3D-Printable Mortar with Waste Glass Powder. Buildings 2023, 13, 1476. [Google Scholar] [CrossRef]
  13. Li, X.-S.; Li, L.; Zou, S. Developing Low-PH 3D Printing Concrete Using Solid Wastes. Buildings 2023, 13, 454. [Google Scholar] [CrossRef]
  14. Richardson, I.; Girão, A.; Taylor, R.; Jia, S. Hydration of water-and alkali-activated white Portland cement pastes and blends with low-calcium pulverized fuel ash. Cem. Concr. Res. 2016, 83, 1–18. [Google Scholar] [CrossRef]
  15. Herterich, J.; Richardson, I.; Moro, F.; Marchi, M.; Black, L. Microstructure and phase assemblage of low-clinker cements during the early stages of carbonation. Cem. Concr. Res. 2022, 152, 106643. [Google Scholar] [CrossRef]
  16. Zhu, X.; Richardson, I.G. Morphology-structural change of CASH gel in blended cements. Cem. Concr. Res. 2023, 168, 107156. [Google Scholar] [CrossRef]
  17. Wang, J.; Hu, Z.; Chen, Y.; Huang, J.; Ma, Y.; Zhu, W.; Liu, J. Effect of Ca/Si and Al/Si on micromechanical properties of C (-A)-SH. Cem. Concr. Res. 2022, 157, 106811. [Google Scholar] [CrossRef]
  18. Wang, J.; Gao, C.; Tang, J.; Hu, Z.; Liu, J. The multi-scale mechanical properties of calcium-silicate-hydrate. Cem. Concr. Compos. 2023, 140, 105097. [Google Scholar] [CrossRef]
  19. Qu, F.; Zhang, Y.; Zhu, X.; Xu, W.; Poon, C.S.; Li, W.; Tsang, D.C. Roles of wood waste biochar for chloride immobilization in GGBS-blended cement composites. Constr. Build. Mater. 2024, 411, 134389. [Google Scholar] [CrossRef]
  20. Wu, H.; Hu, R.; Yang, D.; Ma, Z. Micro-macro characterizations of mortar containing construction waste fines as replacement of cement and sand: A comparative study. Constr. Build. Mater. 2023, 383, 131328. [Google Scholar] [CrossRef]
  21. Lu, D.; Jiang, X.; Leng, Z.; Huo, Y.; Wang, D.; Zhong, J. Electrically conductive asphalt concrete for smart and sustainable pavement construction: A review. Constr. Build. Mater. 2023, 406, 133433. [Google Scholar] [CrossRef]
  22. Snellings, R. Assessing, understanding and unlocking supplementary cementitious materials. RILEM Tech. Lett. 2016, 1, 50–55. [Google Scholar] [CrossRef]
  23. Li, X.; Snellings, R.; Antoni, M.; Alderete, N.M.; Ben Haha, M.; Bishnoi, S.; Cizer, Ö.; Cyr, M.; De Weerdt, K.; Dhandapani, Y. Reactivity tests for supplementary cementitious materials: RILEM TC 267-TRM phase 1. Mater. Struct. 2018, 51, 151. [Google Scholar] [CrossRef]
  24. Juenger, M.C.; Snellings, R.; Bernal, S.A. Supplementary cementitious materials: New sources, characterization, and performance insights. Cem. Concr. Res. 2019, 122, 257–273. [Google Scholar] [CrossRef]
  25. Qu, F.; Zhao, H.; Wu, K.; Liu, Y.; Zhao, X.; Li, W. Phase transformation and microstructure of in-situ concrete after 20-year exposure to harsh mining environment: A case study. Case Stud. Constr. Mater. 2023, 19, e02287. [Google Scholar] [CrossRef]
  26. Snellings, R.; Suraneni, P.; Skibsted, J. Future and emerging supplementary cementitious materials. Cem. Concr. Res. 2023, 171, 107199. [Google Scholar] [CrossRef]
  27. Qu, F.; Li, W.; Guo, Y.; Zhang, S.; Zhou, J.L.; Wang, K. Chloride-binding capacity of cement-GGBFS-nanosilica composites under seawater chloride-rich environment. Constr. Build. Mater. 2022, 342, 127890. [Google Scholar] [CrossRef]
  28. Lu, D.; Jiang, X.; Leng, Z.; Zhang, S.; Wang, D.; Zhong, J. Dual responsive microwave heating-healing system in asphalt concrete incorporating coal gangue and functional aggregate. J. Clean. Prod. 2023, 422, 138648. [Google Scholar] [CrossRef]
  29. Khajuria, A.; Atienza, V.A.; Chavanich, S.; Henning, W.; Islam, I.; Kral, U.; Liu, M.; Liu, X.; Murthy, I.K.; Oyedotun, T.D.T. Accelerating circular economy solutions to achieve the 2030 agenda for sustainable development goals. Circ. Econ. 2022, 1, 100001. [Google Scholar] [CrossRef]
  30. He, H.; Gao, X.; Fei, X. Generation and management of municipal solid waste in top metropolitans of China: A comparison with Singapore. Circ. Econ. 2023, 2, 100041. [Google Scholar] [CrossRef]
  31. GB/T 1596-2017; Fly Ash Used for Cement and Concrete. Standards Press of China: Beijing, China, 2017.
  32. GB/T175; Common Portland Cement. Standards Press of China: Beijing, China, 2023.
  33. GB/T 50082-2009; Standard for Test Methods of Long-Term Performance and Durability of Ordinary Concrete. China Architecture & Building Press: Beijing, China, 2010.
  34. Zajac, M.; Irbe, L.; Bullerjahn, F.; Hilbig, H.; Haha, M.B. Mechanisms of carbonation hydration hardening in Portland cements. Cem. Concr. Res. 2022, 152, 106687. [Google Scholar] [CrossRef]
  35. Ye, J.; Liu, S.; Zhao, Y.; Li, Y.; Fang, J.; Zhang, H.; Guan, X. Development of Ultrafine Mineral Admixture from Magnesium Slag and Sequestration of CO2. Buildings 2023, 13, 204. [Google Scholar] [CrossRef]
  36. Qu, F.; Li, W.; Zeng, X.; Luo, Z.; Wang, K.; Sheng, D. Effect of microlimestone on properties of self-consolidating concrete with manufactured sand and mineral admixture. Front. Struct. Civ. Eng. 2020, 14, 1545–1560. [Google Scholar] [CrossRef]
  37. Valera, E.H.; Cremades, R.; van Leeuwen, E.; van Timmeren, A. Additive manufacturing in cities: Closing circular resource loops. Circ. Econ. 2023, 2, 100049. [Google Scholar] [CrossRef]
  38. Wang, H.; Wang, Y.; Cui, S.; Wang, J. Reactivity and hydration property of synthetic air quenched slag with different chemical compositions. Materials 2019, 12, 932. [Google Scholar] [CrossRef]
  39. Schöler, A.; Lothenbach, B.; Winnefeld, F.; Zajac, M. Hydration of quaternary Portland cement blends containing blast-furnace slag, siliceous fly ash and limestone powder. Cem. Concr. Compos. 2015, 55, 374–382. [Google Scholar] [CrossRef]
  40. Giergiczny, Z. Fly ash and slag. Cem. Concr. Res. 2019, 124, 105826. [Google Scholar] [CrossRef]
  41. Marple, M.A.; Koroglu, B.; Morrison, K.; Crowhurst, J.; Balachandra, A.; Soroushian, P.; Mason, H.E. Accelerated carbonation and structural transformation of blast furnace slag by mechanochemical alkali-activation. Cem. Concr. Res. 2022, 156, 106760. [Google Scholar] [CrossRef]
  42. Rathnarajan, S.; Dhanya, B.; Pillai, R.G.; Gettu, R.; Santhanam, M. Carbonation model for concretes with fly ash, slag, and limestone calcined clay-using accelerated and five-year natural exposure data. Cem. Concr. Compos. 2022, 126, 104329. [Google Scholar] [CrossRef]
  43. Zhang, M.; Wang, F.; Long, Y.; Yu, L.; Yang, C.; Wen, M.; Yu, X.; Tian, Y.; Zhao, M. Improving the carbonation resistance of alkali-activated slag mortars by calcined Mg/Al layered double hydroxides. Appl. Clay Sci. 2022, 216, 106379. [Google Scholar] [CrossRef]
  44. Zhu, X.; Tang, D.; Yang, K.; Zhang, Z.; Li, Q.; Pan, Q.; Yang, C. Effect of Ca(OH)2 on shrinkage characteristics and microstructures of alkali-activated slag concrete. Constr. Build. Mater. 2018, 175, 467–482. [Google Scholar] [CrossRef]
  45. Zhu, X.; Luan, M.; Yang, K.; Yang, C. Using GGBS: Clarification of the Importance of Relative Humidity at Storage on Reactivity of GGBS. J. Adv. Concr. Technol. 2022, 20, 663–675. [Google Scholar] [CrossRef]
  46. Wang, T.; Ishida, T.; Gu, R.; Luan, Y. Experimental investigation of pozzolanic reaction and curing temperature-dependence of low-calcium fly ash in cement system and Ca-Si-Al element distribution of fly ash-blended cement paste. Constr. Build. Mater. 2021, 267, 121012. [Google Scholar] [CrossRef]
  47. Yeo, S.H.; Mo, K.H.; Mahmud, H.B. Hybrid Nucleation Acceleration Method with Calcium Carbonate and Calcium Silicate Hydrate for Fast-Track Construction. Buildings 2023, 13, 2975. [Google Scholar] [CrossRef]
  48. Luke, K.; Lachowski, E. Internal composition of 20-year-old fly ash and slag-blended ordinary Portland cement pastes. J. Am. Ceram. Soc. 2008, 91, 4084–4092. [Google Scholar] [CrossRef]
  49. Justnes, H.; Skocek, J.; Østnor, T.A.; Engelsen, C.J.; Skjølsvold, O. Microstructural changes of hydrated cement blended with fly ash upon carbonation. Cem. Concr. Res. 2020, 137, 106192. [Google Scholar] [CrossRef]
  50. Georget, F.; Soja, W.; Scrivener, K.L. Characteristic lengths of the carbonation front in naturally carbonated cement pastes: Implications for reactive transport models. Cem. Concr. Res. 2020, 134, 106080. [Google Scholar] [CrossRef]
  51. Robayo-Salazar, R.; Mejía-Arcila, J.; de Gutiérrez, R.M.; Martínez, E. Life cycle assessment (LCA) of an alkali-activated binary concrete based on natural volcanic pozzolan: A comparative analysis to OPC concrete. Constr. Build. Mater. 2018, 176, 103–111. [Google Scholar] [CrossRef]
  52. Shen, W.; Cao, L.; Li, Q.; Zhang, W.; Wang, G.; Li, C. Quantifying CO2 emissions from China’s cement industry. Renew. Sustain. Energy Rev. 2015, 50, 1004–1012. [Google Scholar] [CrossRef]
  53. van Deventer, J.S.; White, C.E.; Myers, R.J. A roadmap for production of cement and concrete with low-CO2 emissions. Waste Biomass Valorization 2021, 12, 4745–4775. [Google Scholar] [CrossRef]
  54. Liu, Z.; Meng, W. Fundamental understanding of carbonation curing and durability of carbonation-cured cement-based composites: A review. J. CO2 Util. 2021, 44, 101428. [Google Scholar] [CrossRef]
  55. Cao, Z.; Myers, R.J.; Lupton, R.C.; Duan, H.; Sacchi, R.; Zhou, N.; Reed Miller, T.; Cullen, J.M.; Ge, Q.; Liu, G. The sponge effect and carbon emission mitigation potentials of the global cement cycle. Nat. Commun. 2020, 11, 3777. [Google Scholar] [CrossRef]
  56. Yu, Z.; Qu, G.; Li, Z.; Wang, Y.; Ren, L. Carbon Emission Composition and Carbon Reduction Potential of Coastal Villages under Low-Carbon Background. Buildings 2023, 13, 2925. [Google Scholar] [CrossRef]
Figure 1. Flowchart of the research outline in this study.
Buildings 14 00154 g001
Figure 2. Particle size distribution of clinker, GGBS (350 and 450), and FA.
Buildings 14 00154 g002
Figure 3. The images of the raw materials: (a) raw and crushed clinker (before milling); (b) powder materials include clinker powder, UEA, GGBS, and FA.
Buildings 14 00154 g003
Figure 4. Sampling strategies for carbonation depth measurement and the single-way diffusion carbonation test. (a) Specimens for carbonation, (b) carbonation depth measurement, and (c) single-way diffusion carbonation test.
Buildings 14 00154 g004
Figure 5. Carbonation depth of the GGBS350 blends up to 60 wt% replacement.
Buildings 14 00154 g005
Figure 6. Carbonation depth of the GGBS-blended cement with different fineness at the replacement level of 30 wt%.
Buildings 14 00154 g006
Figure 7. Carbonation depth of the FA blends up to 60 wt% replacement.
Buildings 14 00154 g007
Figure 8. Carbonation depth of the 8 wt% UEA blended cement.
Buildings 14 00154 g008
Figure 9. Calcium carbonates calculated from TG using Equation (1) as given by the conversion from CO2 to CaCO3.
Buildings 14 00154 g009
Figure 10. Estimation of CO2 capture capacity by different blended cement based on experimental observations.
Buildings 14 00154 g010
Figure 11. Life cycle assessment (LCA) of the embodied carbon emissions with the consideration of CO2 captured by bricks, as calculated from this study. A schematic to show the factors accounted for in the current estimation. Notes: S1 stands for step 1.
Buildings 14 00154 g011
Figure 12. Embodied carbon emissions by each component (a) without considering carbon capture (i.e., contributional distribution); (b) with the consideration of carbon capture. The carbon emission of the PC-concrete reaches 386 kg/m3, whereas the GGBS blends and FA blends reach 190 and 179 kg/m3, respectively.
Buildings 14 00154 g012
Table 1. Chemical composition of clinker, GGBS and FA by XRF (wt%).
Raw MaterialsSiO2Al2O3Fe2O3MgOCaONa2OK2OSO3OthersLOI
Clinker21.095.333.280.8766.120.550.210.21.670.89
GGBS32.0114.041.039.2337.020.380.442.312.970.57
FA49.2325.877.620.985.460.551.591.014.942.75
UEA25.5715.300.801.0124.120.091.3828.900.981.85
Table 2. Mixing proportion of blended cement (wt%).
NameClinkerGGBSFAUEAAdditional Gypsum
Ref100------5%
10FA-blends90--10--5%
20FA-blends80--20--5%
30FA-blends70--30--5%
40FA-blends60--40--5%
50FA-blends50--50--5%
10GGBS-blends9010----5%
20GGBS-blends8020----5%
30GGBS-blends7030----5%
40GGBS-blends6040----5%
50GGBS-blends5050----5%
60GGBS-blends6040----5%
8UEA-blends92----85%
Table 3. Mix design for commercial concrete for embodied carbon assessment (kg/m3).
TypesClinkerGGBSFAWaterCoarse AggregateFine AggregateAdmixtures
PC-Concrete36000160160014204
60GGBS350-Concrete144216 (60%)0160160014205
50FA-Concrete1800180 (50%)160160014204
Table 4. Pore structure of blended cement pastes determined by the N2 adsorption method after 28 d of hydration.
SampleSurface Area
(m2/g)
Avg. Pore
Diameter (nm)
Pore Size Distribution (%)
<20 nm20–50 nm50–200 nm>200 nm
Ref15.99219.20845.526.326.41.8
50FA14.67724.33232.127.633.86.5
60GGBS35022.02113.62057.531.111.40
Disclaimer/Publisher’s Note: The statements, opinions and data contained in all publications are solely those of the individual author(s) and contributor(s) and not of MDPI and/or the editor(s). MDPI and/or the editor(s) disclaim responsibility for any injury to people or property resulting from any ideas, methods, instructions or products referred to in the content.

