Article

Performance Evaluation of Inerter-Based Dynamic Vibration Absorbers for Wind-Induced Vibration Control of a Desulfurization Tower

School of Civil Engineering and Communication, North China University of Water Resources and Electric Power, Zhengzhou 450000, China
*
Author to whom correspondence should be addressed.
Buildings 2024, 14(1), 150; https://doi.org/10.3390/buildings14010150
Submission received: 16 December 2023 / Revised: 30 December 2023 / Accepted: 4 January 2024 / Published: 7 January 2024

Abstract

:
High-rise flue gas desulfurization towers are susceptible to wind loads, which can cause instability and failure in the along-wind and across-wind directions. The tuned mass damper (TMD) has been widely applied in the wind-induced vibration control of high-rise structures. To enhance the control performance and reduce the auxiliary mass of TMD, this study focuses on inerter-based dynamic vibration absorbers (IDVAs) for controlling the vibration response of a desulfurization tower. The dynamical equations of the tower–IDVA systems are established under wind loads, and a parameter optimization strategy for IDVAs is proposed by using the genetic algorithm. The performance of the traditional TMD and six IDVAs in the vibration control of the tower are systematically compared. Numerical simulations demonstrate that both the TMD and IDVAs can substantially mitigate the vibration response of the tower. However, compared to the TMD with the same response mitigation ratio, more than 34% of the auxiliary mass can be reduced by two optimal IDVAs. In addition, the energy dissipation enhancement and lightweight effect of the two IDVAs are explained through parametric studies.

1. Introduction

Large-scale flue gas desulfurization towers, characterized as high-rise thin-walled steel structures, are critical devices used by petrochemical enterprises. Such structures are notably sensitive to wind loads due to their high flexibility and low damping [1,2]. At the bottom of the desulfurization tower, industrial exhaust gases undergo desulfurization, and a slender steel chimney is set up on the upper sections to raise the height of the smoke discharge. The variation in the sections weakens the stiffness and carrying capacity of the upper parts of the structure. As the high-rise structure with a circular cross-section, the desulfurization tower can easily suffer severe across-wind vortex-induced vibrations at certain wind speeds in addition to the along-wind fluctuating response [3,4,5]. Therefore, it is imperative to conduct research on the wind-induced vibration control of the tower.
Passive measures have been recognized as an effective approach [6,7]. As a typical dynamic vibration absorber, the tuned mass damper (TMD) has been widely adopted in engineering structures [8,9,10]. The optimal parameter design approach, which disregards the damping of the main structure proposed by Den Hartog [11], serves as the foundation for TMD parameter optimization. Brownjohn et al. [12] installed a monitoring system for TMDs, which allows the real-time display of the resulting vibration status and modal damping values. This system facilitates the adjustment of the TMD parameters, consequently enhancing its control performance. Elias et al. [13] designed a distributed multiple tuned mass damper, which achieves multimodal dynamic response control of the along-wind response of the chimney. Xiang et al. [14] performed a seismic design of the hysteretic damping tuned mass damper using the H/H2 optimization for undamped and damped structures, providing valuable references for designers. Theoretical analysis and experimental verification have demonstrated that the application of TMDs in reducing chatter during the turning of the thin-walled cylinder also shows a good control performance [15]. Vibration control analyses of a high-rise structure indicate the effectiveness of linearizing the equations of motion to obtain optimal control device parameters [16]. Moreover, the pendulum TMDs installed at the top of Shanghai Tower and Taipei 101 significantly mitigate the wind-induced vibrations, thereby improving the comfort levels of residents [17]. Testing research on the TMD system in the Shanghai tower indicates that it is highly suitable for controlling vibrations of structures with relatively small damping ratios [18]. However, the control performance of TMD relies considerably on its tuned mass, which may have adverse effects on the structure. Additionally, the large displacement of its mass block and the narrow frequency band limit the development of TMD [19]. Especially for high-rise structures with limited installation space, like desulfurization towers, the large auxiliary mass of the TMD increases the difficulty of its application.
In 2002, based on the force–current analogy, Smith [20] introduced a two-terminal mechanical device dubbed an inerter. This groundbreaking innovation has allowed new avenues for the vibration control strategies of high-rise structures [21,22]. Combined with a TMD, the inerter element can effectively reduce the auxiliary mass and improve the control performance of traditional dynamic vibration absorbers [23,24,25]. Alotta et al. [26] included a standard inerter-based device within a rhombus truss, which can tune the frequency of the vibration absorber by changing only the geometry of the rhombus truss. In terms of the vibration control of high-rise structures, Liang et al. [27] seismically controlled a mega-substructure system with a tuned inerter damper (TID) and showed an enhanced effect under optimal conditions relative to the traditional viscous damper and the TMD. With reference to a multiple tuned mass damper system, Chen et al. [28] developed a multiple tuned inerter-based damper system for controlling the seismic response, which demonstrated significant advantages. Marian et al. [29] proposed a tuned mass damper–inerter (TMDI) by combining a TMD with an inerter element in series. By leveraging the mass amplification effect of the inerter, the TMDI can perform better than the traditional TMD. Based on a constrained multi-objective evolutionary algorithm, Wang et al. [30] proposed an efficient inerter-based absorber parameter optimization scheme for the wind-induced vibration control of high-rise structures, and they applied it to the TMDI/TID in a 340-meter-high building. However, TID and TMDI require connections at both ends of the structure. Their control performance depends on the connection length of the inerter device, posing installation difficulties in high-rise tubular towers.
Different from TID and TMDI, inerter-based dynamic absorbers (IDVAs) connected to one end of the primary structure are expected to solve the connection problem of the inerter device. Replacing the viscous damper in a TMD with a tuned viscous mass damper [31], Garrido et al. [32] proposed a rotational inertia double tuned mass damper and demonstrated the advantages of it with respect to the TMD. Zhang et al. [33] installed a rotational inertia double tuned mass damper on wind turbines to control their in-plane vibration, establishing comprehensive numerical models and optimization algorithms. Building on this basis, Zhang et al. [34,35,36] combined a TMD with an inerter subsystem, leading to the development of a generalized tuned mass inerter system. Their findings suggested that the tuned mass inerter system could reduce the auxiliary mass and improve the control performance compared to TMD. Wen et al. [37], Su et al. [38], and Hu et al. [39] compared the performance levels of different combinations of IDVAs, as shown in Figure 1. These studies have verified the advantages of IDVAs over the traditional TMD, which were manifested in energy dissipation enhancement, a lightweight effect, and a wider effective frequency band.
Given the limited space at the top of the tower, it is necessary to investigate the lightweight effects of different vibration absorbers. However, the specific effectiveness of different IDVAs in controlling the wind-induced vibration of the desulfurization towers are not clear. Additionally, in the parameter design of the vibration absorbers, the distinct wind-induced response characteristics of cylindrical structures in the along-wind and across-wind directions should be considered. The present study aims to provide an optimal solution for the wind-induced vibration control of the desulfurization tower and investigate the control performances of different IDVAs.
To this end, the control performances of six IDVAs on the wind-induced vibration of a desulfurization tower are systematically evaluated and compared. The organization of this paper is as follows. First, a numerical model of the tower is established, and the transfer functions are derived. Second, an optimal parameter design strategy for the IDVAs is established. Third, the control performances of a TMD and six IDVAs on the tower are compared. Finally, a parametric study is carried out to further analyze the control performance enhancement and lightweight effect of two optimal IDVAs.

2. Tower–IDVA Systems

2.1. Model of the Desulfurization Tower

The desulfurization tower is 85 meters tall and divided into five sections. The tower is mainly made of Q235 steel, with an elastic modulus of 2.06 × 10⁵ MPa, a density of 7.85 g/cm3, and a Poisson’s ratio of 0.3. The thickness of the tower body decreases with increasing height, ranging from 1.6 cm to 2 cm. The dimensions of the segmental structures of the tower are shown in Table 1 and Figure 2a.
The desulfurization tower is regarded as a cantilever beam structure with the base fully constrained. A finite element model, comprising 32 elements, is established using the Beam188 element in ANSYS, as shown in Figure 2b. To validate the accuracy of the simplified beam element model, a solid model is established using the Solid95 element, as shown in Figure 2c. The parameters of dynamic characteristics and mode shapes of the two models are compared in Table 2 and Figure 3, respectively. The comparison reveals minimal discrepancies between the beam element model and the solid model. Conservatively, the first two modal damping ratios for the desulfurization tower are set as 0.5% [13,40]. To enhance computational efficiency, the structural mass matrix, stiffness matrix, and damping matrix of the beam element model are extracted to construct a numerical model of the tower for subsequent analysis.

2.2. Equations of the Tower–IDVA System
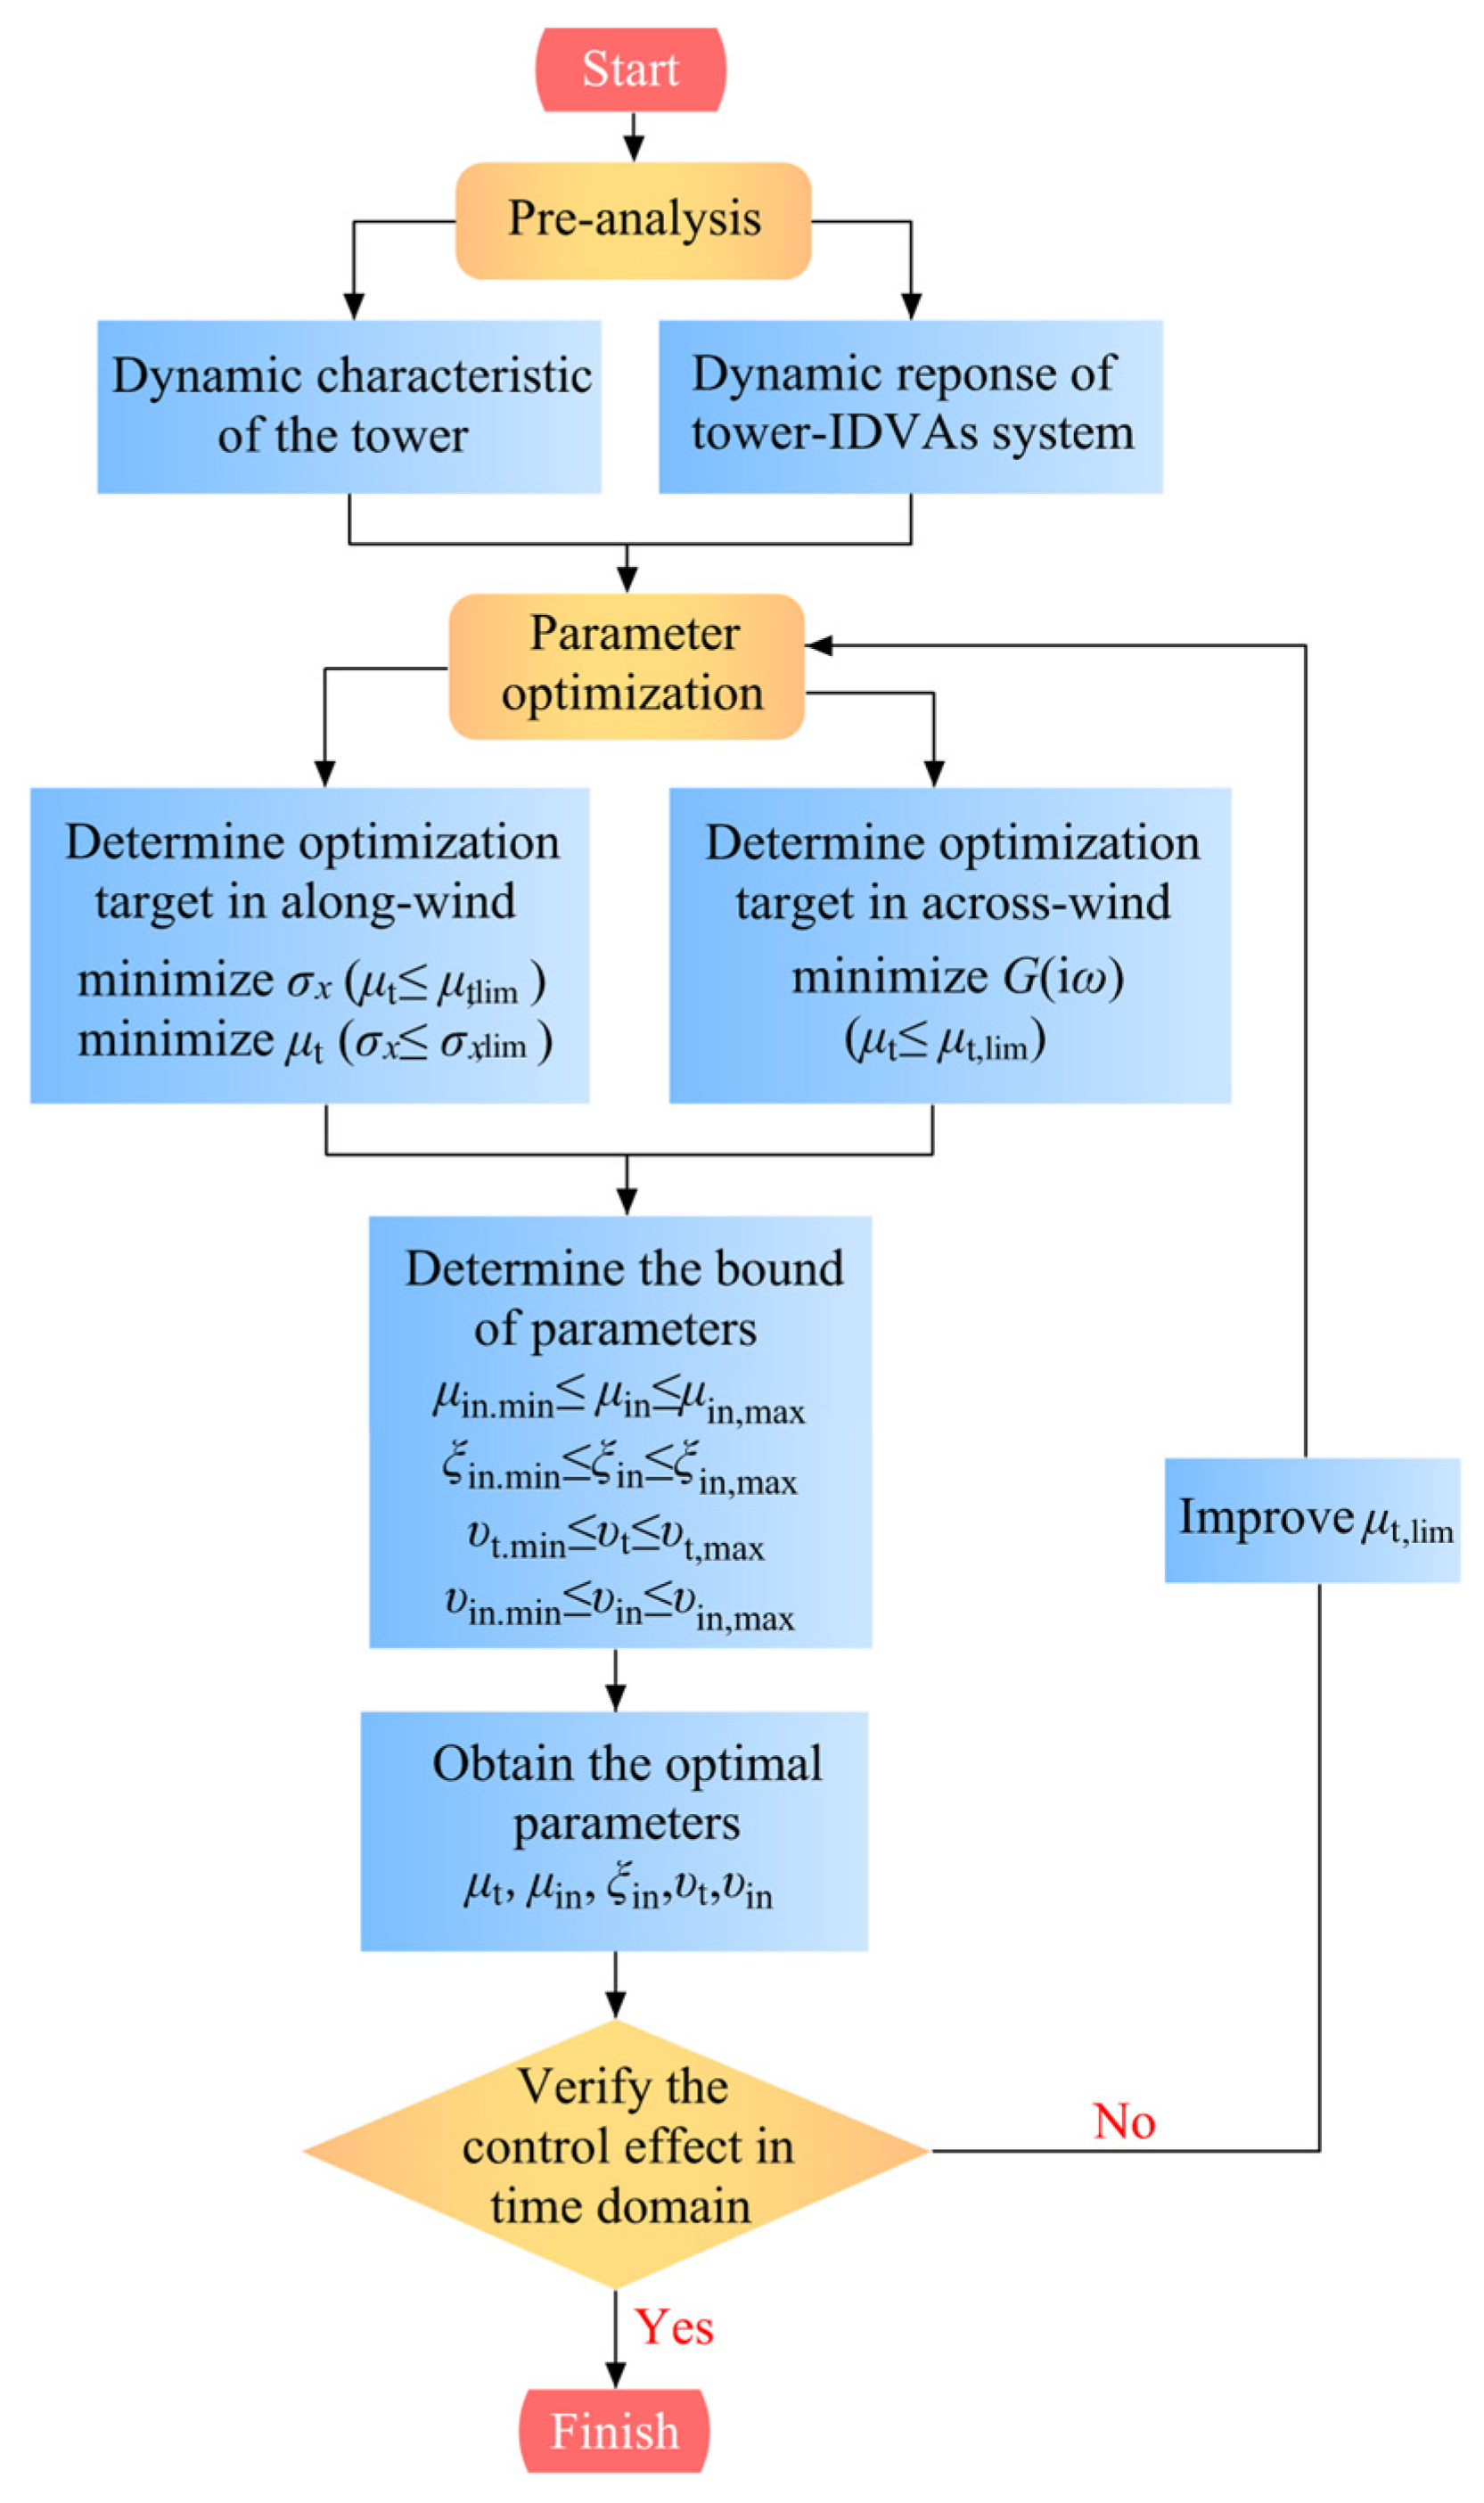
The desulfurization tower is simplified into a generalized system:
m = Φ T M Φ ;   c = Φ T C Φ ;   k = Φ T K Φ ,
where M, C, and K represent the mass matrices, damping matrices, and stiffness matrices, respectively; and Φ represents the mode shape function of the desulfurization tower. In this study, only the first mode is considered in wind-induced vibration control.
The analytical model of the desulfurization tower–IDVA system under wind loads is shown in Figure 4. Cn may represent any inerter subsystem of the different configurations C1~C6, as shown in Figure 1. If Cn is replaced by a damping element ct, it represents the TMD system. The dynamical equation for the tower–TMD system is Equation (2), and the equations for the six tower–IDVA systems are represented as Equations (3)–(8):
m x ¨ + c x ˙ + c t ( x ˙ x ˙ t ) + k x + k t ( x x t ) = f ( t ) m t x ¨ t + c t ( x ˙ t x ˙ ) + k t ( x t x ) = 0 ;
m x ¨ + c x ˙ + k x + k t ( x x t ) + k in ( x x in ) = f ( t ) m t x ¨ t + m in ( x ¨ t x ¨ in ) + c in ( x ˙ t x ˙ in ) + k t ( x t x ) = 0 m in ( x ¨ in x ¨ t ) + c in ( x ˙ in x ˙ t ) + k in ( x in x ) = 0 ;
m x ¨ + m in ( x ¨ x ¨ in ) + c x ˙ + k x + k t ( x x t ) = f ( t ) m t x ¨ t + c in ( x ˙ t x ˙ in ) + k t ( x t x ) + k in ( x t x in ) = 0 m in ( x ¨ in x ¨ ) + c in ( x ˙ in x ˙ t ) + k in ( x in x t ) = 0 ;
m x ¨ + c x ˙ + c in ( x ˙ x ˙ in ) + k x + k t ( x x t ) = f ( t ) m t x ¨ t + m in ( x ¨ t x ¨ in ) + k t ( x t x ) + k in ( x t x in ) = 0 m in ( x ¨ in x ¨ t ) + c in ( x ˙ in x ˙ ) + k in ( x in x t ) = 0 ;
m x ¨ + m in ( x ¨ x ¨ t ) + c x ˙ + c t ( x ˙ x ˙ t ) + k x + k t ( x x t ) = f ( t ) m t x ¨ t + m in ( x ¨ t x ¨ ) + c t ( x t x ) + k t ( x t x ) = 0 ;
m x ¨ + c x ˙ + k x + k t ( x x t ) + k in ( x x 1 ) = f ( t ) m t x ¨ t + c in ( x ˙ t x ˙ 2 ) + k t ( x t x ) = 0 m in ( x ¨ 2 x ¨ 1 ) + c in ( x ˙ 2 x ˙ t ) = 0 m in ( x ¨ 1 x ¨ 2 ) + k in ( x 1 x ) = 0 ;
m x ¨ + c x ˙ + c in ( x ˙ x ˙ in ) + k x + k t ( x x t ) = f ( t ) m t x ¨ t + m in ( x ¨ t x ¨ in ) + k t ( x t x ) = 0 m in ( x ¨ in x ¨ t ) + c in ( x ˙ in x ˙ ) = 0 ,
where x, xt, and xin represent the displacements of the tower, the tuned mass, and the inerter element, respectively, and f(t) represents the generalized wind load.
As previous research on TMDs is relatively mature and the derivation processes of various configurations are similar, only the configuration C1 is taken as an example to demonstrate the derivation of the transfer functions and the frequency domain responses of the tower–IDVA systems.
First, the following dimensionless parameters are defined:
μ t = m t / m ;   μ in = m in / m t ;   ξ in = c in / ( 2 m t k t ) ;   υ t = ω t / ω 0 ;   υ in = k in / k t ,
where μt and μin represent the tuned mass ratio and inertance–mass ratio, respectively; ξin represents the nominal damping ratio of the inerter subsystem; υt is the frequency ratio of C1, where ωt and ω0 represent the circular frequency of C1 and the desulfurization tower, respectively; and υin is the nominal stiffness ratio of spring kin in the inerter subsystem.
Accordingly, a substitution can be made for the mass, stiffness, and damping parameters in Equation (3):
m t = μ t m ;   m in = μ in μ t m ;   c = 2 m ω 0 ξ 0 ;   c in = 2 m ξ in μ t υ t ω 0 ;   k = m ω 0 2 ;   k t = μ t m ( ω 0 υ t ) 2 ;   k in = υ in μ t m ( ω 0 υ t ) 2 ,
where ξ0 represents the first-order damping ratio of the desulfurization tower.
M 1 X ¨ + C 1 X ˙ + K 1 X = F ( t ) ,
where X = [x, xt, xin]T, F(t) = [f(t)/m, 0, 0]T. The first modal mass matrices M1, damping matrices C1, and stiffness matrices K1 of C1 are represented as follows:
M 1 = 1 0 0 0 μ t + μ t μ in μ t μ in 0 μ t μ in μ t μ in ;   C 1 = 2 ξ 0 ω 0 0 0 0 2 ξ in μ t υ t ω 0 2 ξ in μ t υ t ω 0 0 2 ξ in μ t υ t ω 0 2 ξ in μ t υ t ω 0 ;   K 1 = ω 0 2 ( 1 + μ t υ t 2 + υ in μ t υ t 2 ) μ t ( ω 0 υ t ) 2 υ in μ t ( ω 0 υ t ) 2 μ t ( ω 0 υ t ) 2 μ t ( ω 0 υ t ) 2 0 υ in μ t ( ω 0 υ t ) 2 0 υ in μ t ( ω 0 υ t ) 2
Upon substituting the variables in Equation (10), the mass, stiffness, and damping matrices of C2~C6 can be found in Appendix A. If f(t) = eiωt, X = H(iω)·eiωt, where H(iω) = [H0(iω), Ht(iω), Hin(iω)]T, H0(iω), Ht(iω), and Hin(iω) represent the transfer functions of the main structure, the mass block. and the inerter element of the tower–C1 system, respectively. By substitution into Equation (11), the following equation is derived:
H ( i ω ) = 1 m [ ω 2 M 1 + i ω C 1 + K 1 ] 1 [ 1 , 0 , 0 ] T = A 11 A 12 A 13 A 21 A 22 A 23 A 31 A 32 A 33 1 1 0 0   A 11 = ω 2 + i 2 ω ω 0 ξ 0 + ω 0 2 ( 1 + μ t υ t 2 + υ in μ t υ t 2 ) A 12 = μ t ( ω 0 υ t ) 2 ;   A 21 = A 12 A 13 = υ in μ t ( ω 0 υ t ) 2 ;   A 31 = A 13 A 22 = ω 2 ( μ in + μ t μ in ) + i 2 ω ξ in μ t υ t ω 0 + μ t ( ω 0 υ t ) 2 A 23 = ω 2 μ t μ in i 2 ω ξ in μ t υ t ω 0 ;   A 32 = A 23 A 33 = ω 2 μ t μ in + i 2 ω ξ in μ t υ t ω 0 + υ in μ t ( ω 0 υ t ) 2
The root mean square of the displacement response of the tower–C1 system under wind load can be represented as follows:
σ x = ω 1 ω 2 S x ( i ω ) d ω = ω 1 ω 2 H 0 ( i ω ) 2 S F ( i ω ) d ω ,
where ω1~ω2 represent the range of the integral frequency, and the integration is performed near the first-order frequency of the structure; Sx(iω) represents the response spectrum of the structure, and it is resolved using the pseudo excitation method [41], which has a relatively high computational efficiency; and SF(iω) represents the load spectrum of the structure, which can be derived from the wind speed spectrum.

2.3. Optimal Design

For the along-wind vibration control, the minimum root-mean-square displacement response σx of the tower obtained from the frequency domain analysis or the minimum tuned mass ratio μt are taken as the optimization objectives. The genetic algorithm, a widely used computational method for optimizing damper parameters in design [10,42], is renowned for its global search capabilities and reduced likelihood of entrapment in local optima. Its ability to process multiple variables simultaneously enhances the computational efficiency, making it suitable for optimizing multiple computational parameters under a single objective. Therefore, the genetic algorithm is then used to optimize the IDVA parameters μin, ξin, υt, and υin under the specific μt,lim or σx,lim. The control performances of IDVAs can also be compared under varying μt. The control parameter settings of the genetic algorithm are as follows: the maximum evolution generation is set to 150 generations, the population size is 900, the crossover probability is 0.8, the mutation probability is 0.05, the proportion of the newly generated population is 0.25, and the calculation accuracy is 1 × 10⁻⁹.
H control theory is renowned for high control accuracy and strong robustness, and it is suitable for the control of the single-order modal vibration of the structure [14,43]. The desulfurization tower is a cylindrical structure, and its vibration in the across-wind direction is dominated by single-order modal vortex resonance.
As a cylindrical high-rise structure, the across-wind response of the desulfurization tower is predominantly governed by vortex-induced resonance at a single modal frequency. It is feasible to simulate the vortex excitation by employing sinusoidal excitation (refer to Appendix B). The H optimization theory is typically employed for structural peak response suppression under harmonic/sinusoidal excitation [14,43,44]. Therefore, for the across-wind vibration control of the tower, based on the transfer function of the tower–IDVA system and the dimensionless parameters defined by Equation (9), the parameters of the IDVAs are optimized using the genetic algorithm and H performance index:
G ( i ω ) = sup ω τ max [ H 0 ( i ω ) ] ,
where G(iω) represents the H norm of the six typical tower–IDVA systems, and τmax represents the maximum singular value.
In summary, the parameter optimization of IDVAs for vibration control in the along-wind and across-wind directions of the desulfurization tower obtained from the above analysis is shown in Figure 5.

3. Evaluation of Wind-Induced Vibration Control
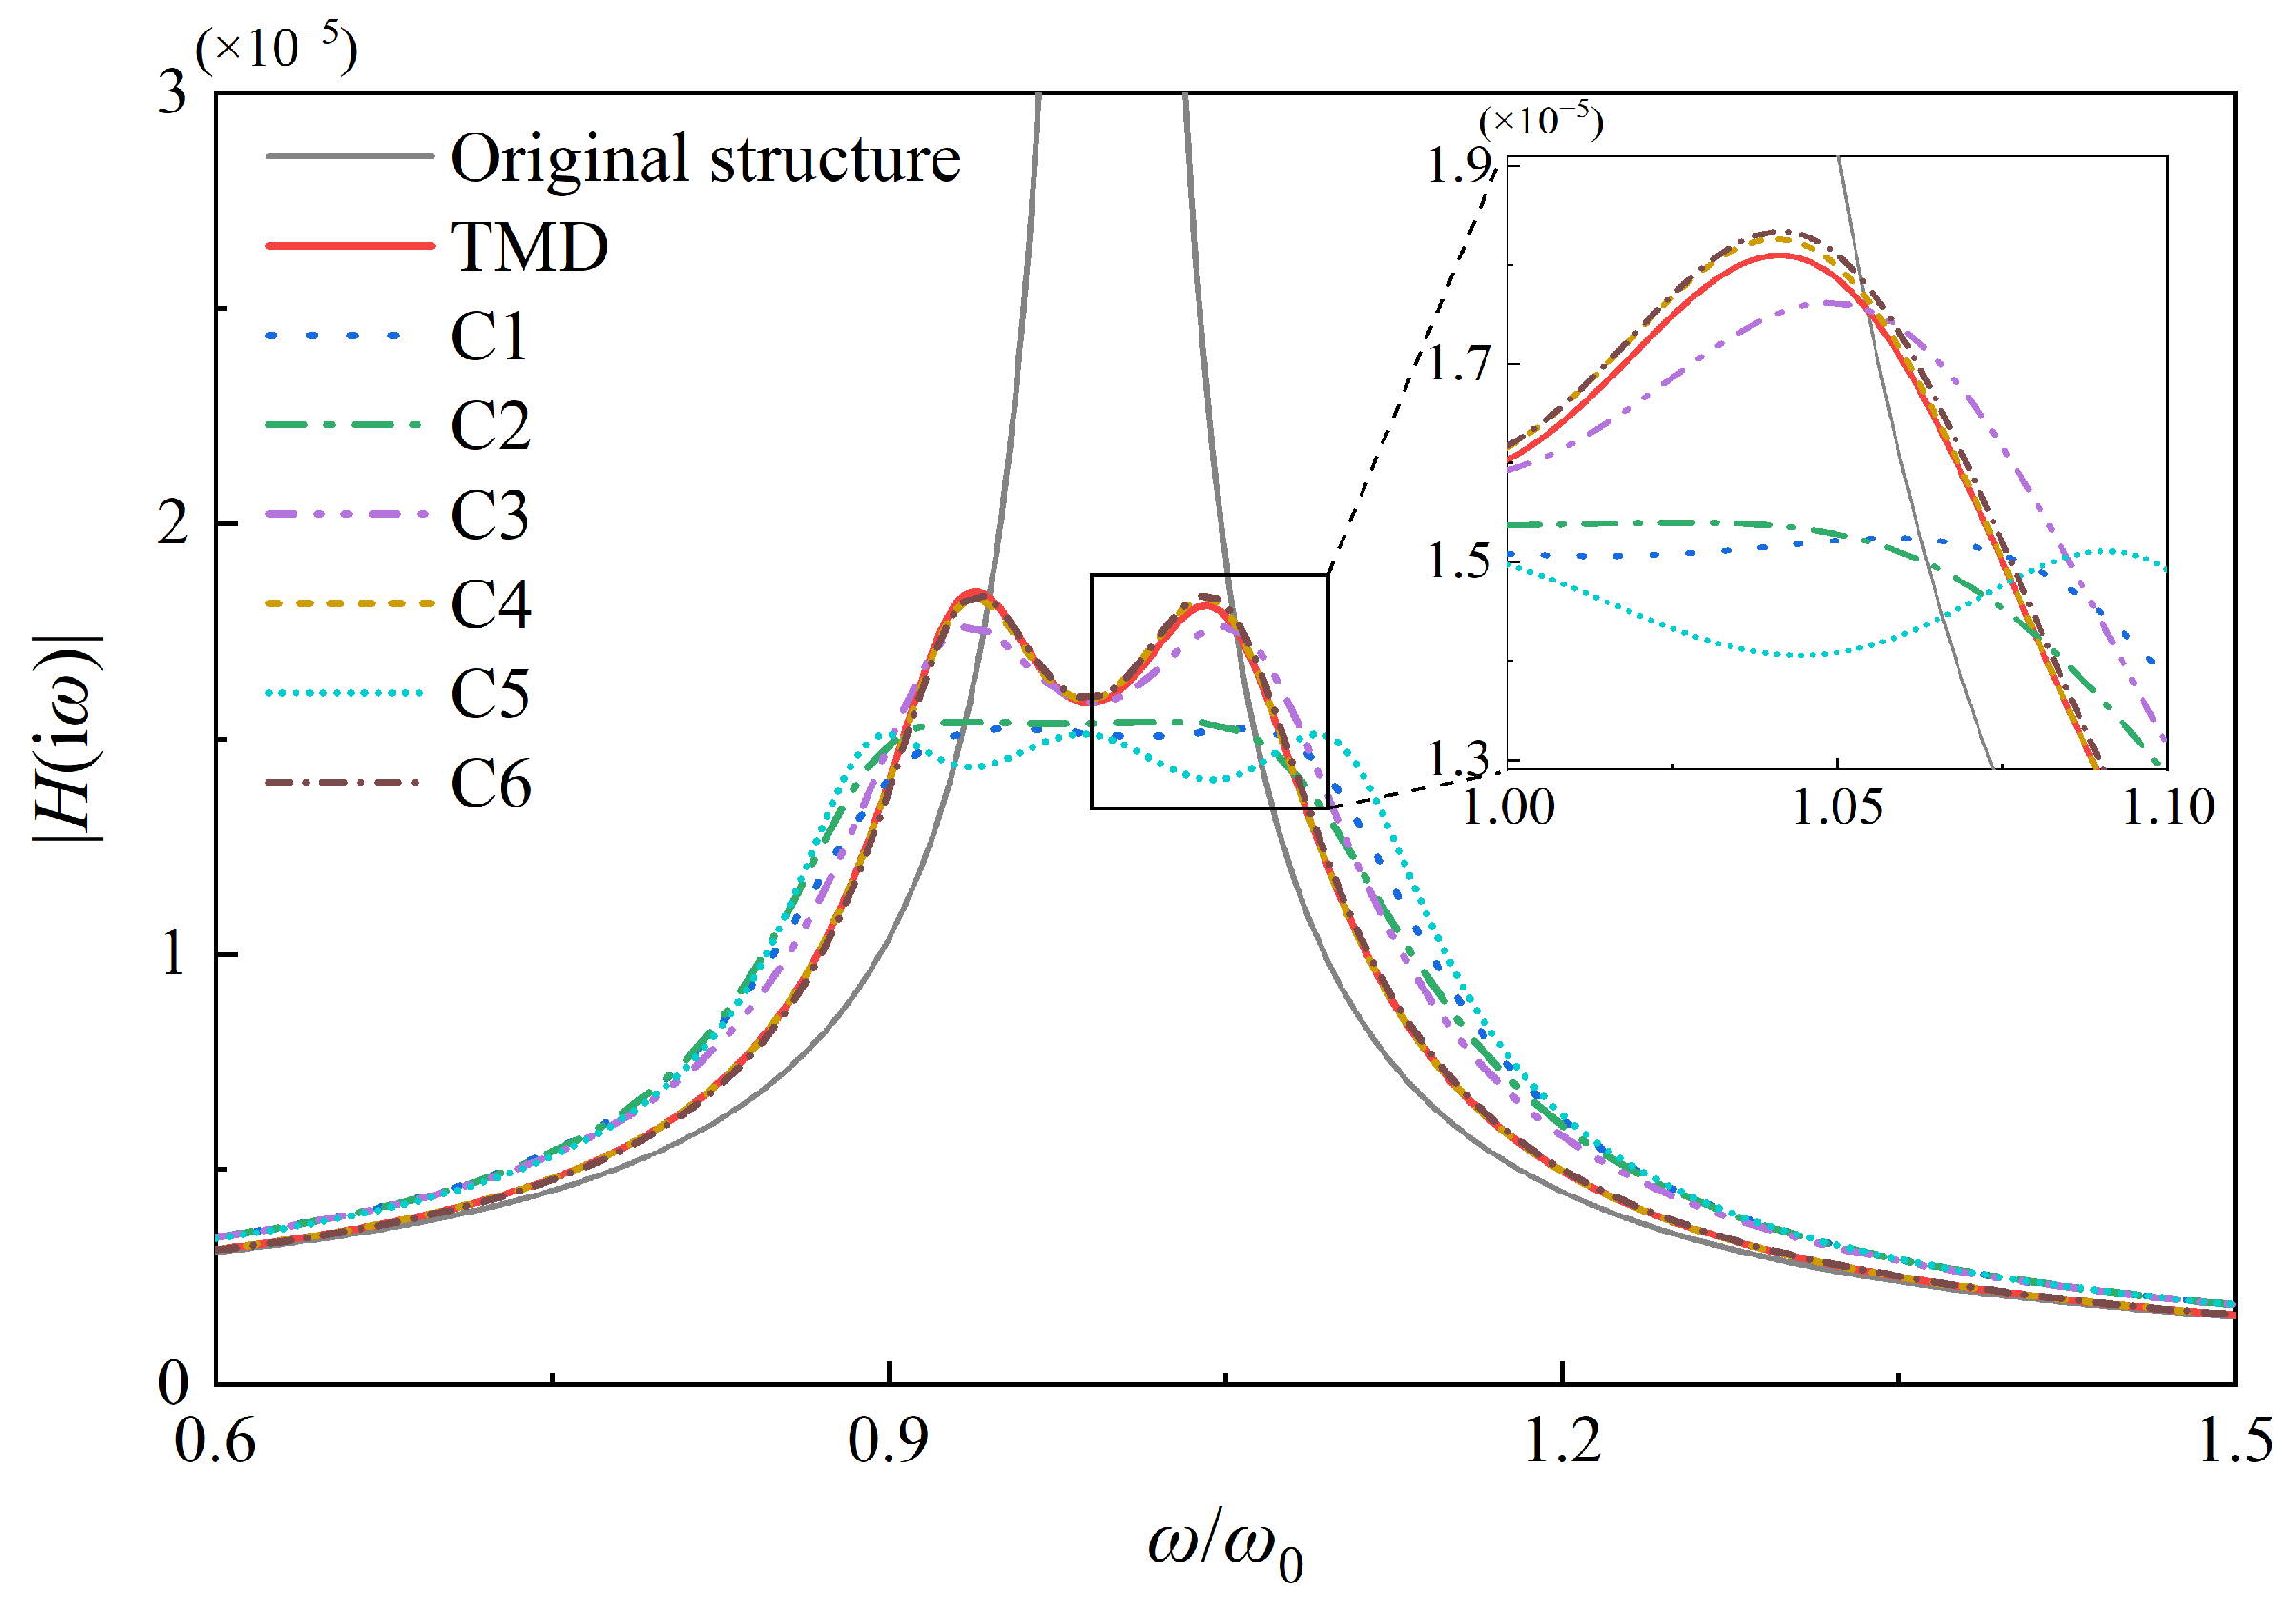
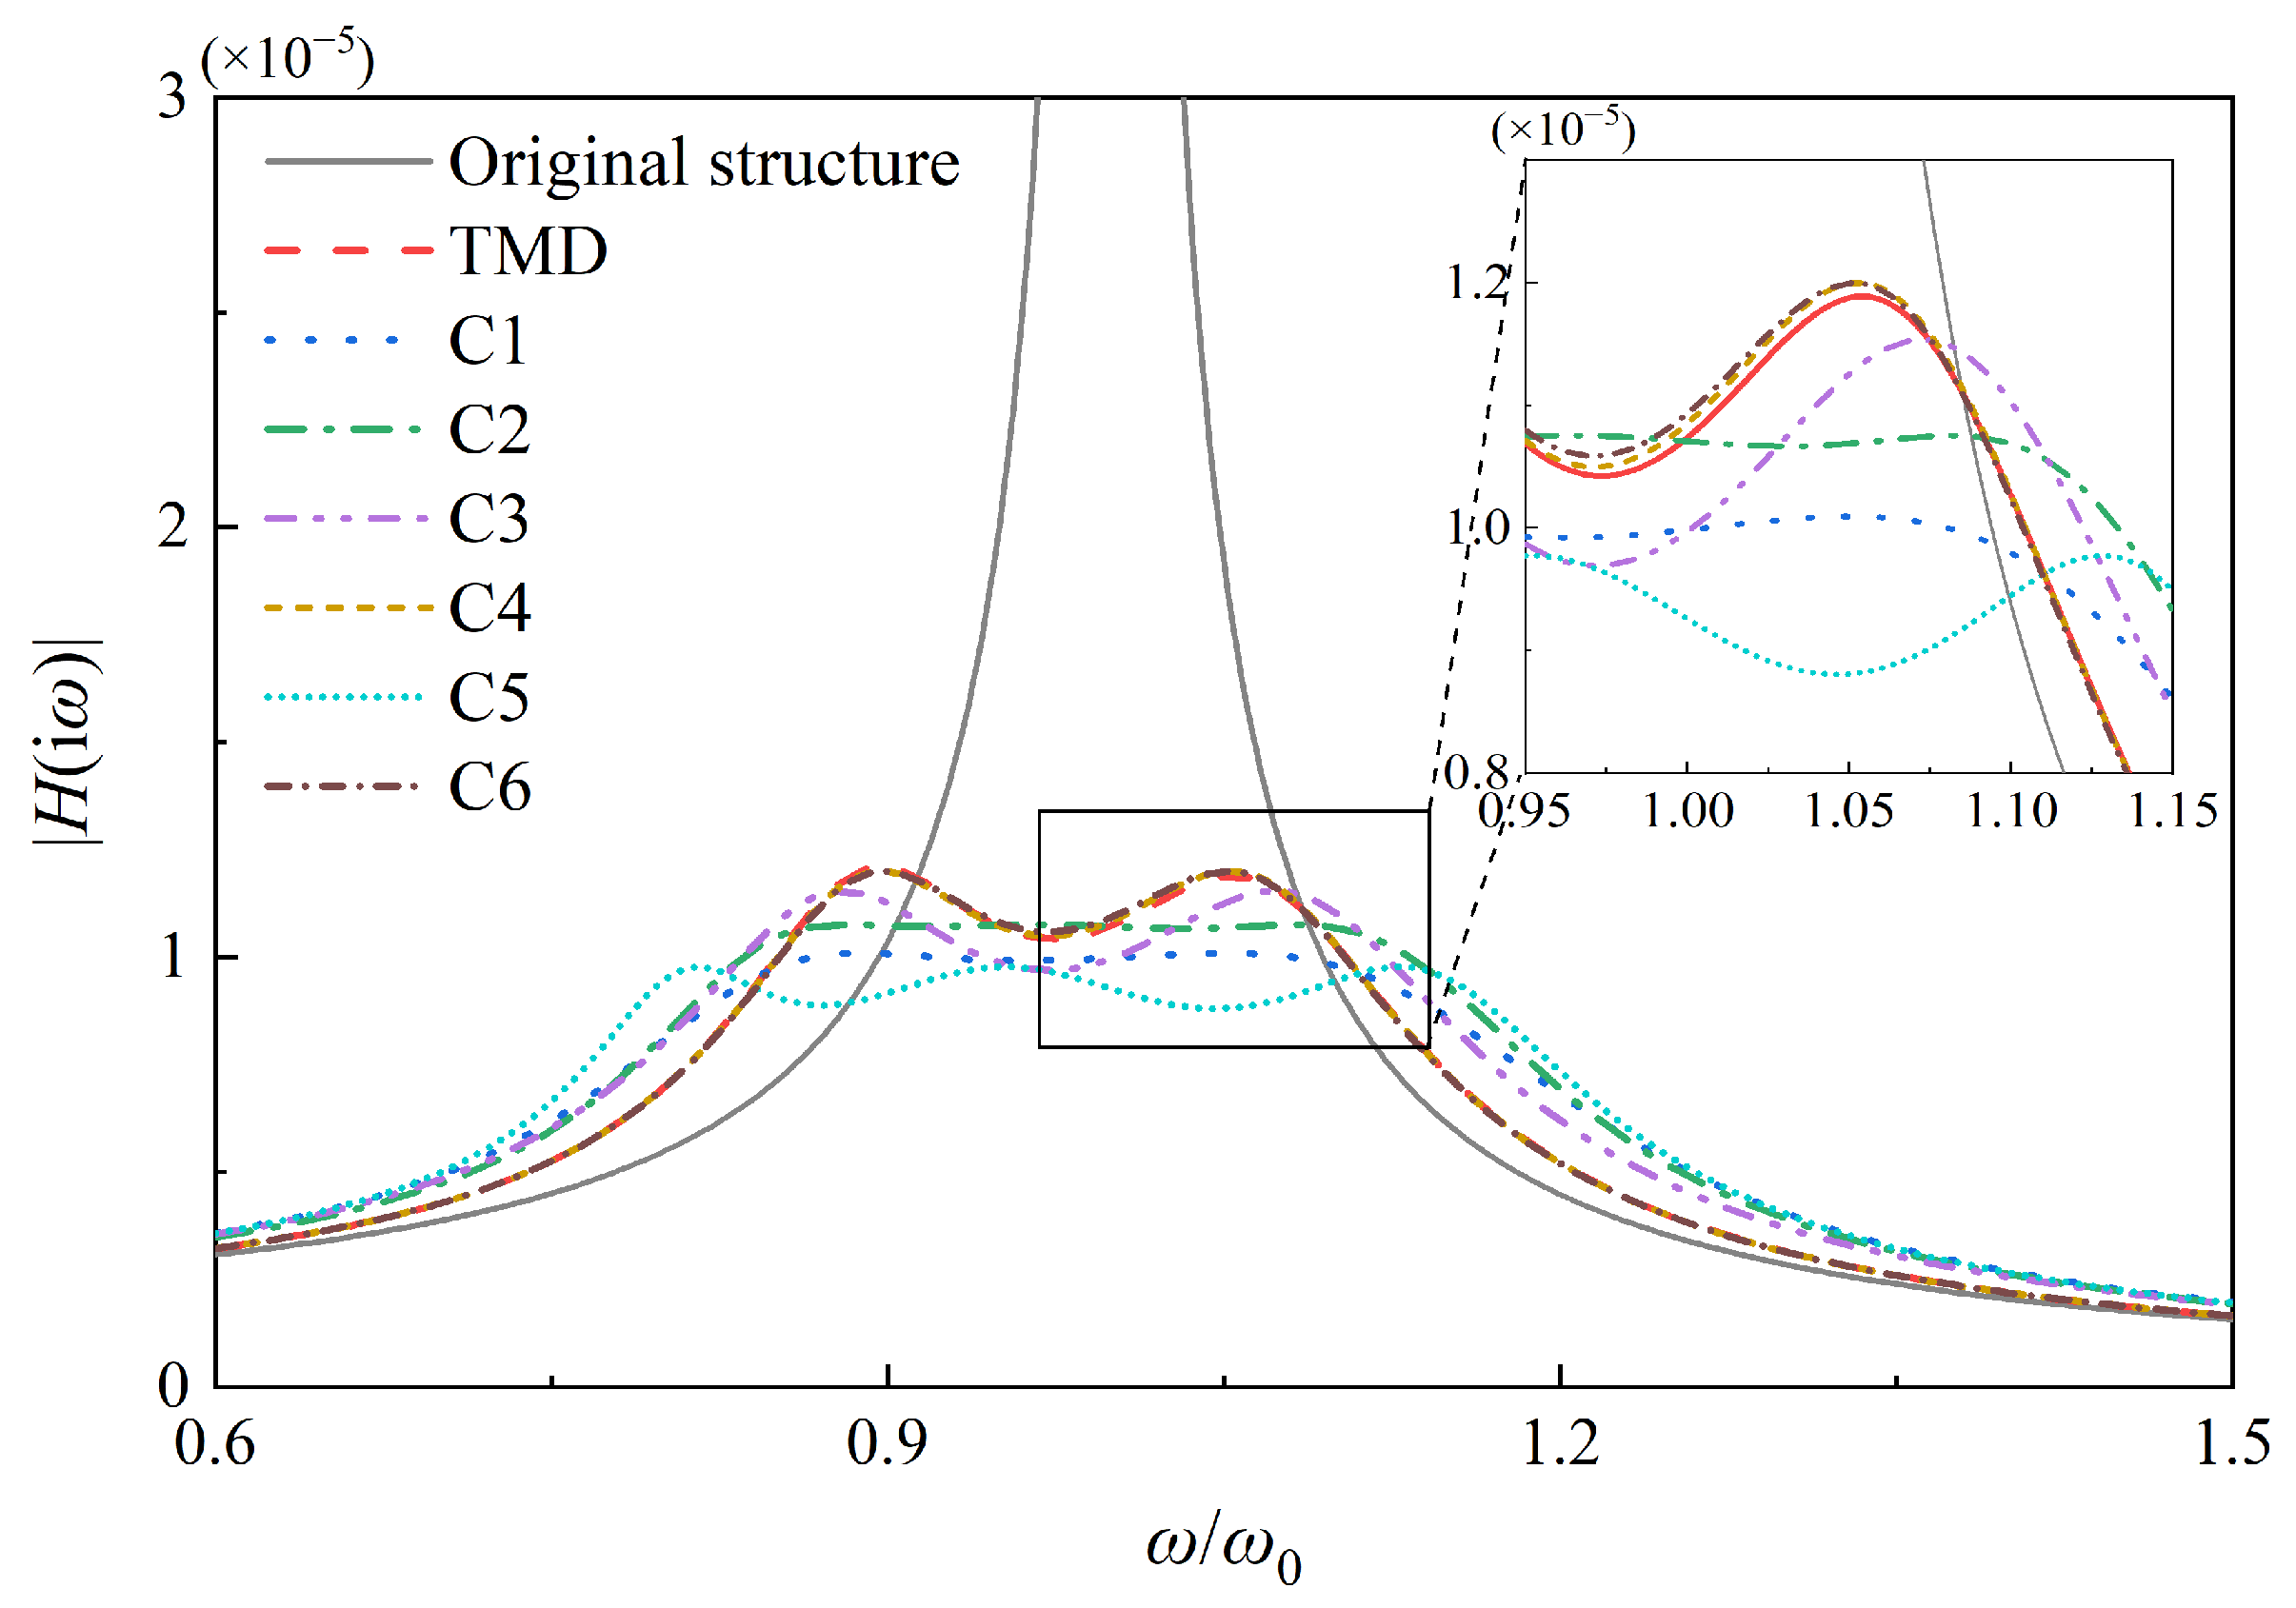
3.1. Comparative Analysis of H Performance

By setting the tuned mass ratios to μt = 2% and μt = 5%, the genetic algorithm is used to search and optimize the four parameters of IDVAs, specifically μin, υt, υin, and ξin. The results, including the optimized parameters for the TMD calculated using the fixed point theory [9], are collated in Table 3. The frequency response curves of the TMD and six optimally designed IDVAs are performed in Figure 6 and Figure 7, and the tuned mass ratios μt of the vibration absorbers are 2% and 5%, respectively.
Based on the comparison results of the frequency response curves and the optimal parameters of IDVAs, C1 and C5 exhibit the best H performance. When the mass ratio is 2%, the peak values of the frequency response curves of C1 and C5 can be reduced to below 80.02% and 80.43% of the traditional TMD, respectively. In addition, the H performance of C2 is also significantly superior to that of the TMD. The frequency response curve of C3 resides between that of C2 and TMD, resulting in a limited enhancement to the control performance. This indicates that in the inerter subsystem, the spring element is suitable for series connection with the inerter element and damping element. Furthermore, the inerter makes the effective frequency band of IDVAs wider than that of the TMD.
According to the results of parameter optimization, when the mass ratio μt is determined, C1, C2, C3, and C5 can obtain the optimal inertance–mass ratio μin within the set range. However, the optimal inertance–mass ratio μin of C4 is infinitely close to zero, while the optimal μin of C6 is close to positive infinity. Therefore, an additional analysis of the H performance of C4 is performed. The tuned mass ratio μt is set as 2%, and the inertance–mass ratio μin is varied. For each μin, the genetic algorithm is employed to find the optimal υt, υin, and ξin of C4. Figure 8a shows that the H performance under the control of C4 is optimal and equivalent to that of the TMD when μin is zero. As μin gradually increases from 0 to 2, the peak of the frequency response curve continues to increase. This indicates that the inerter does not have a significant effect in C4, and C4 does not enhance the control performance of the TMD.
Similarly, the H performance analysis of C6 is performed, as shown in Figure 8b. The frequency response curves of C6 under various inertance–mass ratios μin are compared when μt = 2%. Contrary to C4, the control performance of C6 improves with increasing μin. The optimal frequency ratios υt and the damping ratios ξin of both C4 and C6 are similar to the optimal parameters of the TMD. By comparing C4, C6, and the traditional TMD, it can be determined that introducing only an inerter element, whether it is in parallel or series, cannot enhance the control performance of the TMD. For the IDVAs connected to one end of the primary structure, it is necessary to introduce another spring element within the inerter subsystem.
The subsequent vibration control analysis and the parametric study are no longer focused on C4 and C6. The variation trends of the optimal parameters of C1~C3 and C5 under different tuned mass ratios μt are shown in Figure 9. For an intuitive comparison, the dimensionless coefficients ξin, μin, υt, and υin of the IDVAs are calculated into cin, min, kt, and kin, which can be used directly for engineering design through Equation (10). The range of the tuned mass ratio μt is set from 0.5% to 10%, and nine sets of H performance optimal parameters of C1, C2, C3, and C5 are further optimized.
As shown in Figure 9a,b, the damping coefficients cin of C1 and C2 are relatively small, but their inertance mass min is the largest. This demonstrates that in the inerter subsystems of C1 and C2, the connection modes of the elements make the inerter more involved in vibration control. Moreover, these configurations achieve greater energy dissipation of the main structure because of their small damping coefficients. C3 has the largest damping coefficient and a small inertance mass, which indicates that in C3, the inerter element has not participated significantly in vibration control. This phenomenon is also the reason for the control performance of C3 compared to the other three configurations. The tuned mass min and damping coefficient cin of C5 are relatively large, demonstrating that it achieves energy dissipation enhancement through its large damping by connecting the three elements in series in the inerter subsystem. This mechanism of energy dissipation is different from that of C1 and C2.
As shown in Figure 9c,d, the optimal stiffnesses kt of the four IDVAs and TMD are relatively close, demonstrating that the introduction of the inerter subsystem has a minor impact on the stiffness of the TMD. In the inerter subsystems, the spring stiffness kin of C3 is relatively large, while the kin values of the remaining three IDVAs are fairly similar and significantly small.

3.2. Along-Wind Vibration Control Analysis

The desulfurization tower is in the deltaic plain of the Yangtze River, where the basic wind pressure data corresponding to a 50-year return period are 0.40 kPa at a height of 10 meters. The along-wind load is represented by the Davenport spectrum [45], which is defined by Equation (16).
S u ( n ) = 2 3 σ u 2 n y ( 1 + y 2 ) 4 / 3 ,
where Su(n) represents the power spectrum of fluctuating wind; n represents the frequency; u represents the across-wind fluctuating wind speed; y represents the dimensionless frequency, y = 1200 n / u ¯ 10 ; u ¯ 10 = 24.9 m/s, representing the mean wind speed at an elevation of 10 m on the tower, which is derived through basic wind-pressure; and σu represents the root mean square of the fluctuating wind speed.
The optimal parameters of C1, C2, C3, and C5 can be obtained under the principle of minimizing the frequency domain displacement response σx in the along-wind direction. The IDVAs are then coupled with the numerical model of the tower for a comparative analysis of the control performance in the frequency domain and for verification in the time domain. To compare the control performances of the TMD and different IDVAs, the displacement response mitigation ratio γ is defined as:
γ = ( 1 σ x , controlled / σ x , original ) × 100 % ,
where σx,original and σx,controlled are the root-mean-square displacements of the tower in the frequency domain before and after the installation of the vibration absorber, respectively.
The relationships between the root-mean-square displacement response and the vibration mitigation ratio γ with respect to the mass ratio μt for the four typical IDVAs and TMD in application to the desulfurization tower are compared in Figure 10. The control performance of IDVAs on the along-wind vibration response of the desulfurization tower agrees with their H performance, demonstrating their advantages over the TMD. The control efficiency of the vibration absorbers is progressively improved with the increase in the mass ratio μt. However, once μt is larger than 5%, the increase rates of the vibration mitigation ratios progressively slow down. Therefore, in the subsequent time-domain vibration control analysis, the tuned mass ratios μt are all capped at 5%. The above results show that the H performance of C5 is superior to that of C1, but the advantage is not obvious. In the response control of the structure, the control ratios of the two configurations are even close. Therefore, subsequent analyses are carried out for both C1 and C5, and other IDVAs are no longer considered.
The simulation of the pulsating wind speed and wind load time is performed in accordance with the Davenport spectrum (Equation (16)) using the harmonic superposition method [13]. The along-wind speed curves of Elements 30, 31, and 32 at the top of the tower are shown in Figure 11, which demonstrate the spatial correlation of wind speed time history curves at these three locations. A comparison between the simulated wind speed spectrum and the target wind speed spectrum on the tower is further conducted in Figure 12, verifying the reliability of the simulated wind load.
A time-domain response analysis of wind-induced vibration in the along-wind direction of the tower is conducted, comparing the displacement and acceleration vibration control performance of C1, C5, and the TMD with μt = 2%. Figure 13 presents the time history response curves at the top (Element 32) of the tower. The analysis results also validate that the control performances of C1 and C5 are better than those of the TMD.
In addition to the enhancement of the control performance, the more significant advantage of C1 and C5 is that their auxiliary masses are smaller than that of the TMD. As depicted in the frequency domain analysis in Figure 10, C1 and C5 possess much smaller mass ratios than the TMD under the same displacement response mitigation ratio γ. To further validate the lightweight effects of C1 and C5, the frequency domain response mitigation ratio (γ = 59.21%) of the TMD (μt = 5%) is adopted as the objective, and the minimum mass ratios μt and other optimal parameters of C1 and C5 are designed again using the genetic algorithm. The results reveal that when μt = 3.3%, C1 and C5 can meet the vibration mitigation ratio, yielding an equivalent control performance with TMD when μt = 5%. The time domain response curves in Figure 14 corroborate this finding. For the identical control objective, C1 and C5 can achieve a 34% reduction in the auxiliary mass compared to the TMD.

3.3. Across-Wind Vibration Control Analysis
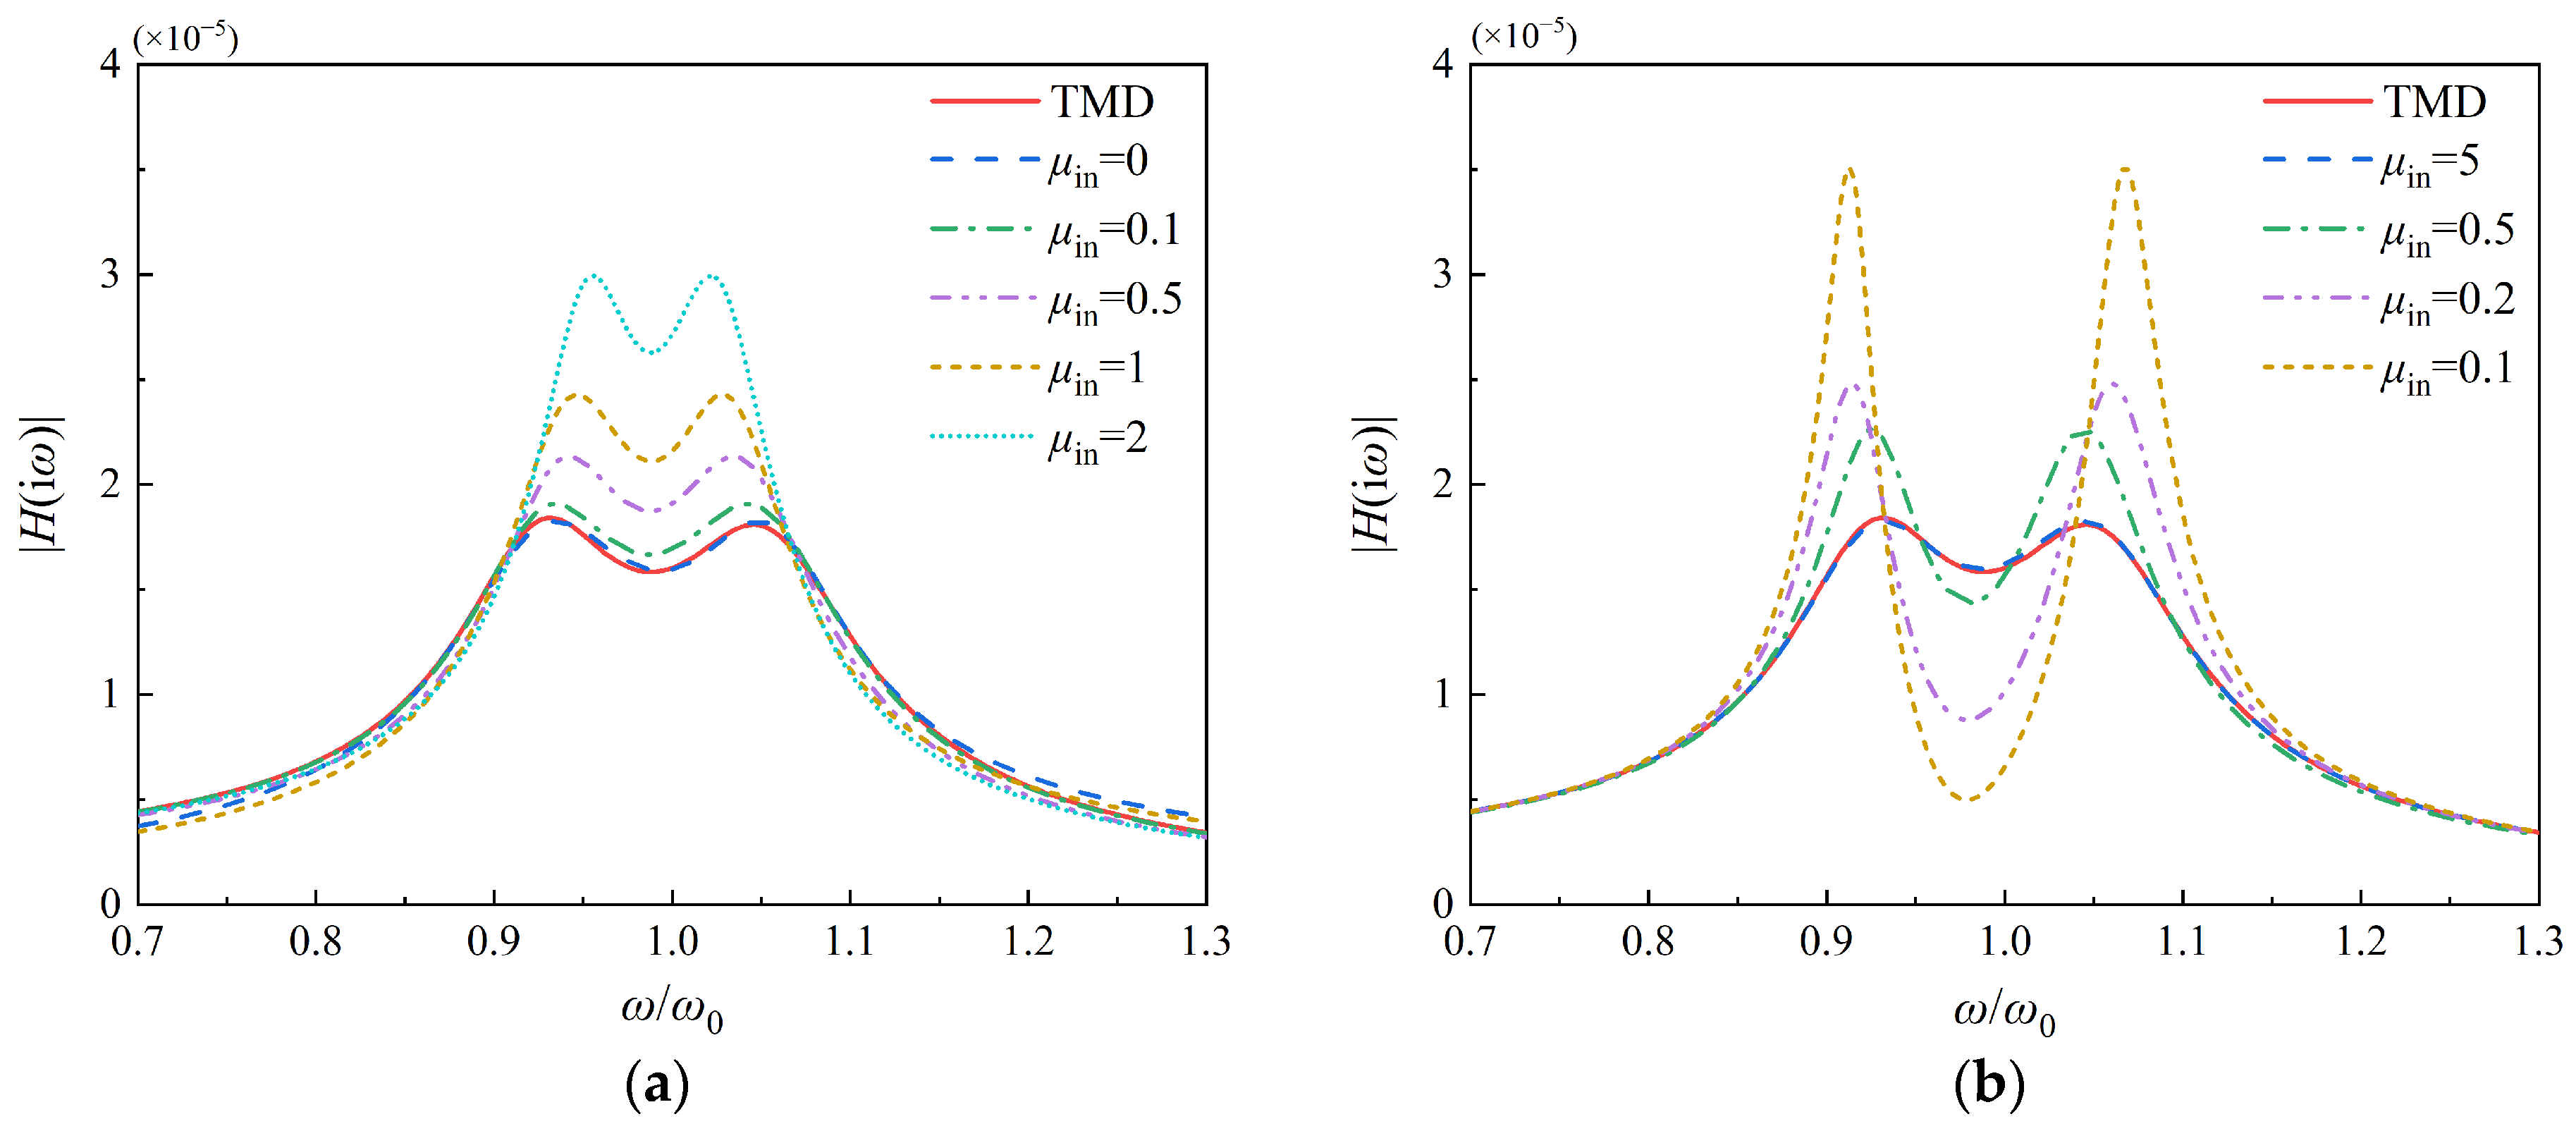
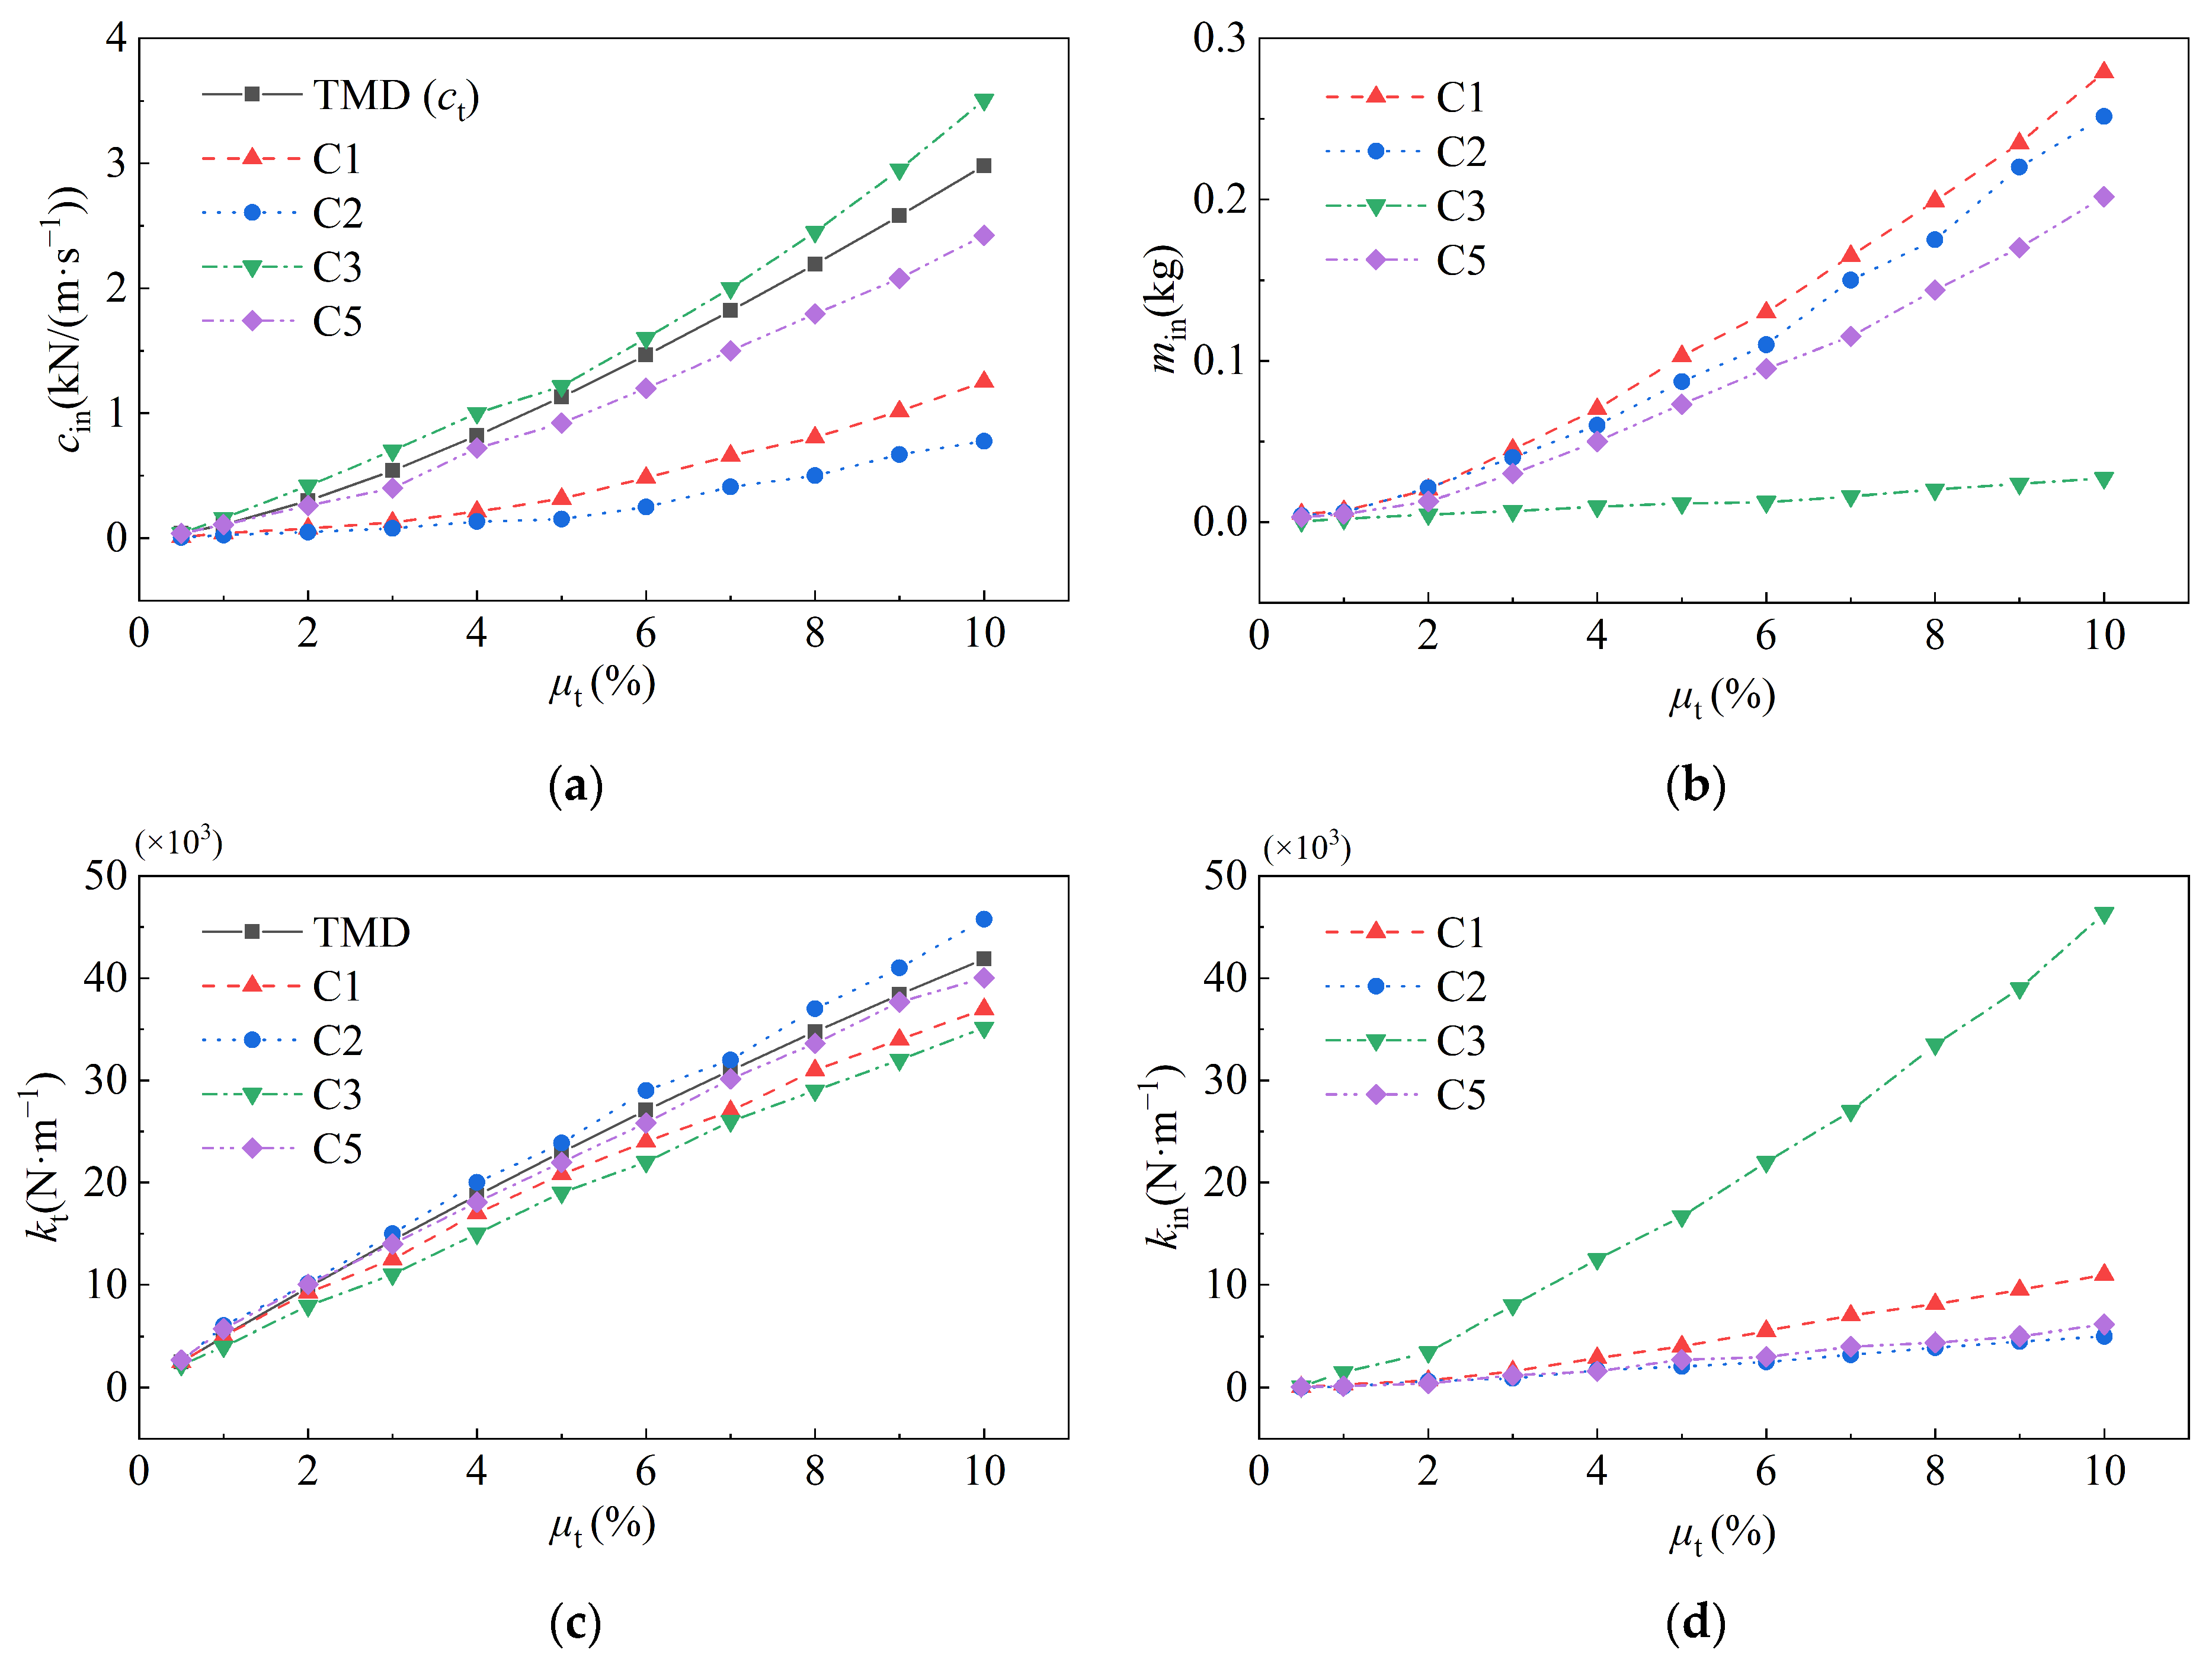
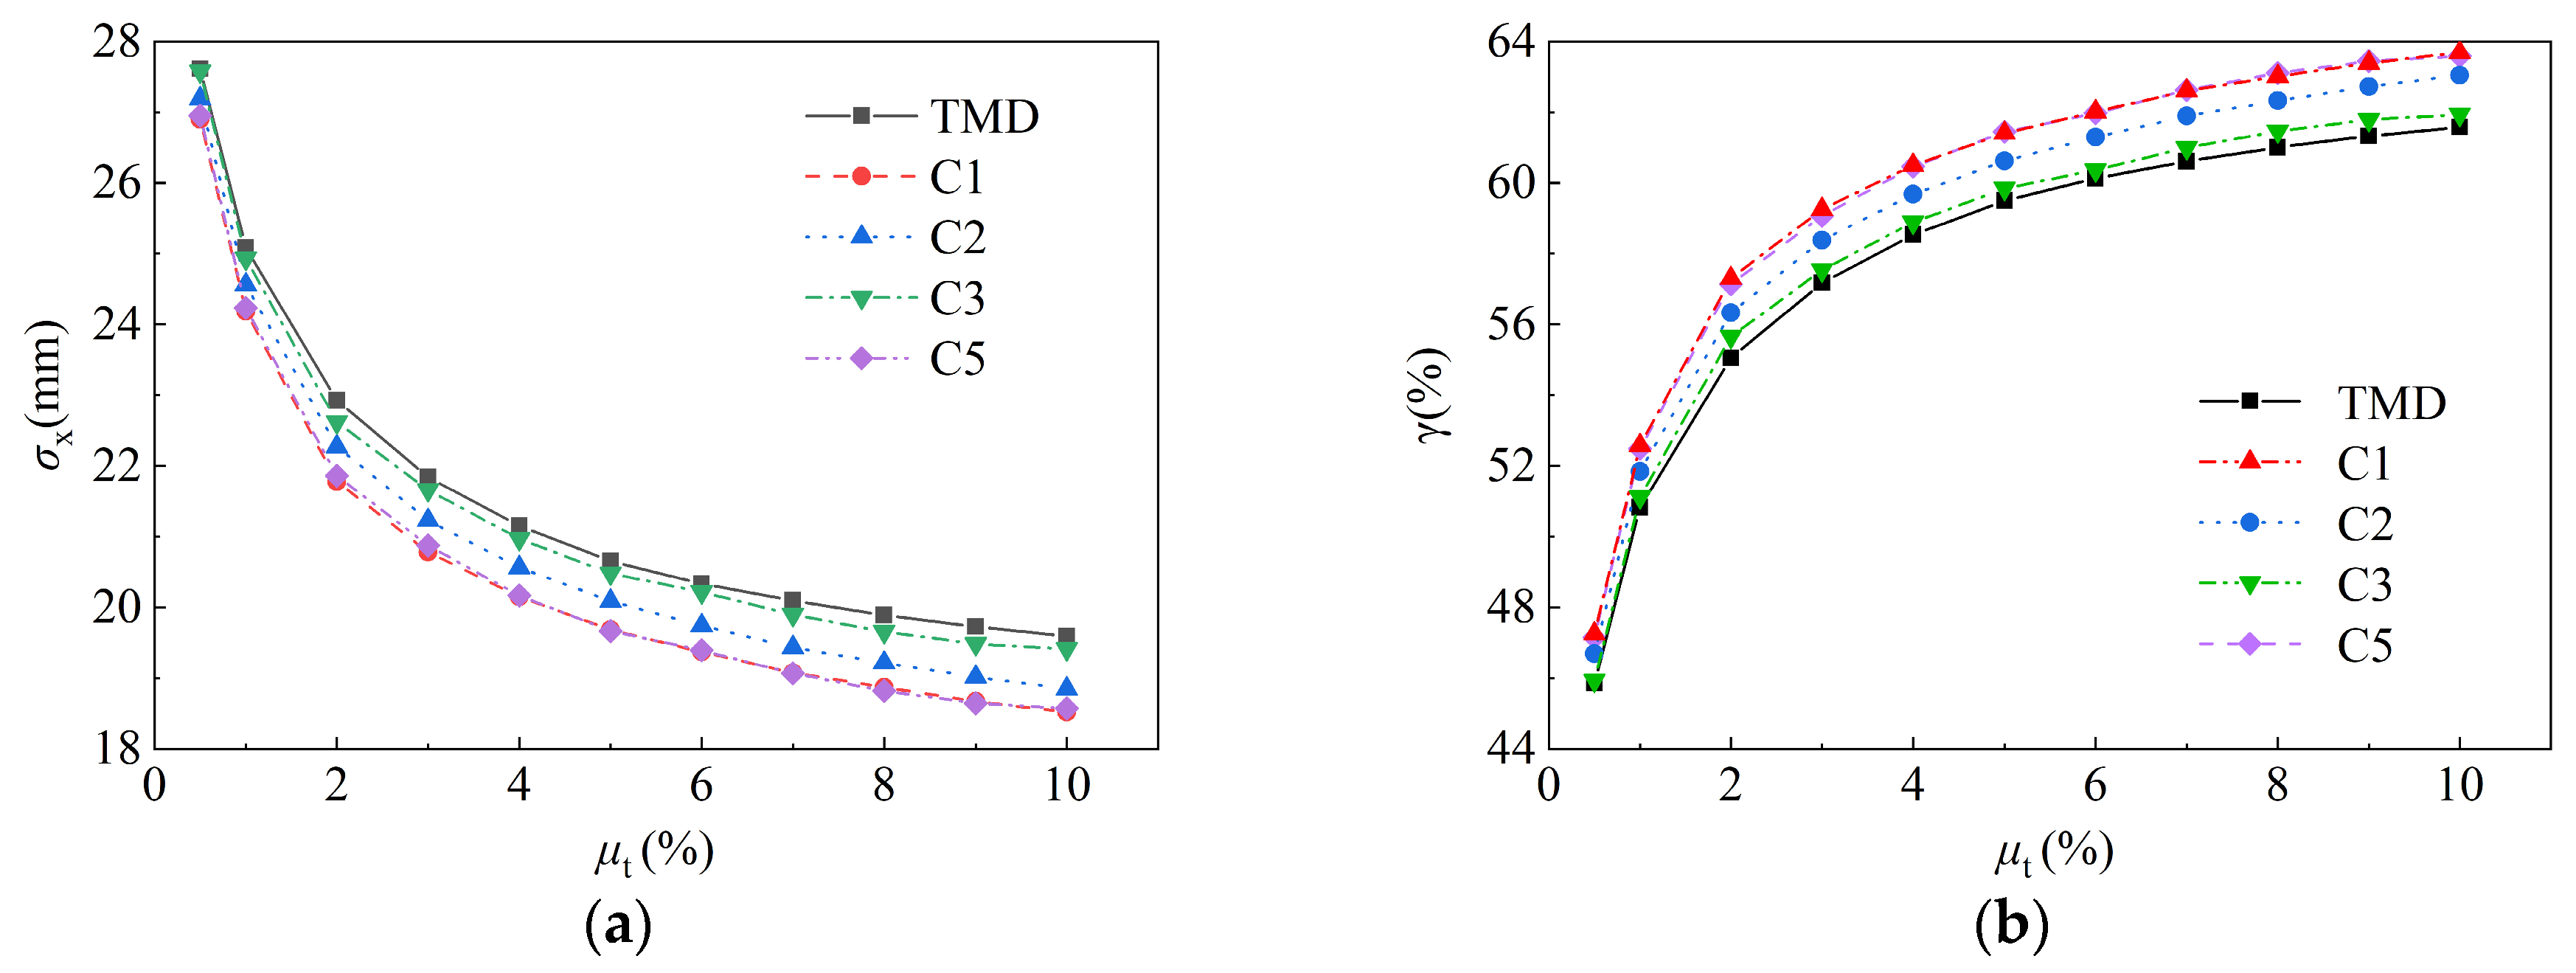
The across-wind loads on high-rise structures are mainly composed of vortex excitation and across-wind turbulence. When vortex-induced resonance occurs, the impact of turbulence on the structural vibration can be neglected [5]; thus, only the vortex force is taken into account as the across-wind load. Taking into account the dimensions of various sections of the desulfurization tower, the Reynolds number, and the critical wind speed parameters, we refer to numerous standards [46,47,48,49,50,51] for the characteristics and modalities involved in vortex-induced resonance of the desulfurization tower. The detailed analysis process can be found in Appendix B. The results reveal that the upper part of the tower (Section V, Figure 1a) will be subject to vortex-induced resonant forces, leading to severe vortex-induced resonance, at its first-order critical wind speed. When vortex-induced resonance occurs, the wind speed at a height of 10 m is 11.7 m/s. The sinusoidal force proposed by Rumman [52] is applied to the upper section of the tower:
F v ( t ) = 1 2 ρ v ¯ 2 A μ L sin ( 2 π n s t ) ,
where Fv(t) represents the vortex force; v ¯ represents the mean wind speed; ns represents the vortex shedding frequency, which is taken as the first-order frequency of the tower; and μL represents the lift coefficient, which is set at 0.25 for a circular cross-section structure.
Time history response analysis is carried out to evaluate the performance of across-wind vibration control on the tower using a TMD (μt = 5%). The TMD yields a maximum vibration mitigation ratio of 93.51% for the top of the tower, resulting in a peak displacement response of 0.035 m at the tower top. Starting from 5%, the tuned mass ratios μt of C1 and C5 are gradually reduced in increments of 0.1%, and other parameters are optimally designed with the H performance index. When the tuned mass ratios of C1 and C5 are limited to 2.3%, the results of the time domain analysis show that the mitigation ratios for the largest across-wind displacement responses reach 93.46% and 93.52%, respectively. The control performance is approximately equivalent to that of the TMD under μt = 5%.
A comparative analysis in the time domain of TMD (μt = 2.3%, μt = 5%), C1 (μt = 2.3%), and C5 (μt = 2.3%) on the vibration control is carried out. Figure 15 shows the displacement responses at the top (Element 32) of the tower with different control devices installed. It verifies that the equivalent C1 and C5 can exhibit a consistent control performance relative to the TMD (μt = 5%), which is significantly superior to that of the TMD (μt = 2.3%). This finding indicates that when the tower experiences across-wind vortex-induced resonance, C1 and C5 based on H optimization exhibit superior vibration control performance. Compared to the along-wind vibration control, C1 and C5 reveal better results regarding the response mitigation ratios and the lightweight effects in the across-wind direction. Compared to the TMD under μt = 5%, C1 and C5 can reduce the auxiliary mass of the vibration absorber by 54%.

4. Parametric Study

Both the control devices C1 and C5 demonstrate a remarkable superiority in mitigating the along-wind and across-wind vibrations in the desulfurization tower. To further explore the principle of the control performance enhancement and lightweight effects of the inerter system, Figure 16 presents the hysteresis curves for the whole vibration absorber and damping elements of TMD, C1, and C5, all set at an identical mass ratio (μt = 2%). The hysteresis curves of C1 and C5 are observed to closely parallel those of the TMD. However, the hysteresis curve for the damping element in C1 shows a significant difference from those in C5 and the TMD. This difference is attributed to the inerter subsystem in C1, which can effectively amplify the displacement of the vibration absorber, leading to a significant enhanced energy dissipation. Additionally, the hysteresis curve for the damping element in C5 closely mirrors that of the TMD. In combination with the earlier parameter analysis results, it is evident that the inertance–mass ratio of C5 is smaller than that of C1, whereas its damping coefficient aligns closely with that of the TMD. This observation suggests that the energy dissipation mechanism of C5 aligns closely with that of the TMD. The difference is that the inerter element of C5 can increase the apparent mass through a series connection with a damping element, thereby realizing an enhancement in energy dissipation efficiency.
Based on the optimized parameters of the control devices C1 and C5, a sensitivity analysis is conducted to evaluate the influence of various parameters including μin, μt, υin, and ξin on the displacement response mitigation ratio γ. In both Case 1 and Case 2, as depicted in Figure 17, Figure 18, Figure 19 and Figure 20, the tuned mass ratios μt are set at 2% and 5%, respectively, with other primary optimal parameters referenced from Table 3. Figure 17 illustrates the influences of variations in μin and μt on the γ of C1. A comparative analysis of Figure 17a,b reveals that an increase in μt leads to a diminished sensitivity of C1 to changes in μin. This finding indicates that when mt of C1 is relatively large, the role of the inerter system in vibration control gradually decreases. The increment of γ progressively decelerates with higher values of μt, consistent with the results obtained from Figure 10. Figure 18 presents the influences of υin and ξin on γ of C1 with μt values set at 2% and 5%, respectively. The outcomes demonstrate that the displacement response mitigation rate of C1 is insensitive to variations in the tuned stiffness, implying strong control robustness. This observation is consistent with the frequency response curve comparisons previously conducted.
As depicted in Figure 19, compared to C1, the control performance of C5 exhibits greater sensitivity to variations in μin. This finding indicates that when the μt of C5 is relatively small, an excessively low μin may even lead to an adverse effect on the response mitigation capability. When the value of μin slightly exceeds its optimal value, its impact on the control performance of C5 is relatively insignificant. Figure 20 indicates a similar pattern of C5 and C1 regarding the influence of υin and ξin on γ. The control performance of the two control devices exhibits greater sensitivity to variations in ξin but insensitivity to the variations in frequency within a certain range.

5. Conclusions

A study of IDVAs for the wind-induced vibration control of high-rise desulfurization towers is carried out. The transfer functions and displacement responses in the frequency domain of desulfurization tower–IDVA systems are derived and solved. Based on the vibration characteristics of the tower in both the along-wind and across-wind directions, the optimal design strategy for the IDVA parameters is established by using the genetic algorithm. The H performances and control efficiencies of the traditional TMD and six typical IDVAs are systematically compared. The principles of the energy dissipation enhancement and lightweight effects of the inerter in two optimal IDVAs are further elucidated through parametric analyses. The main conclusions are as follows:
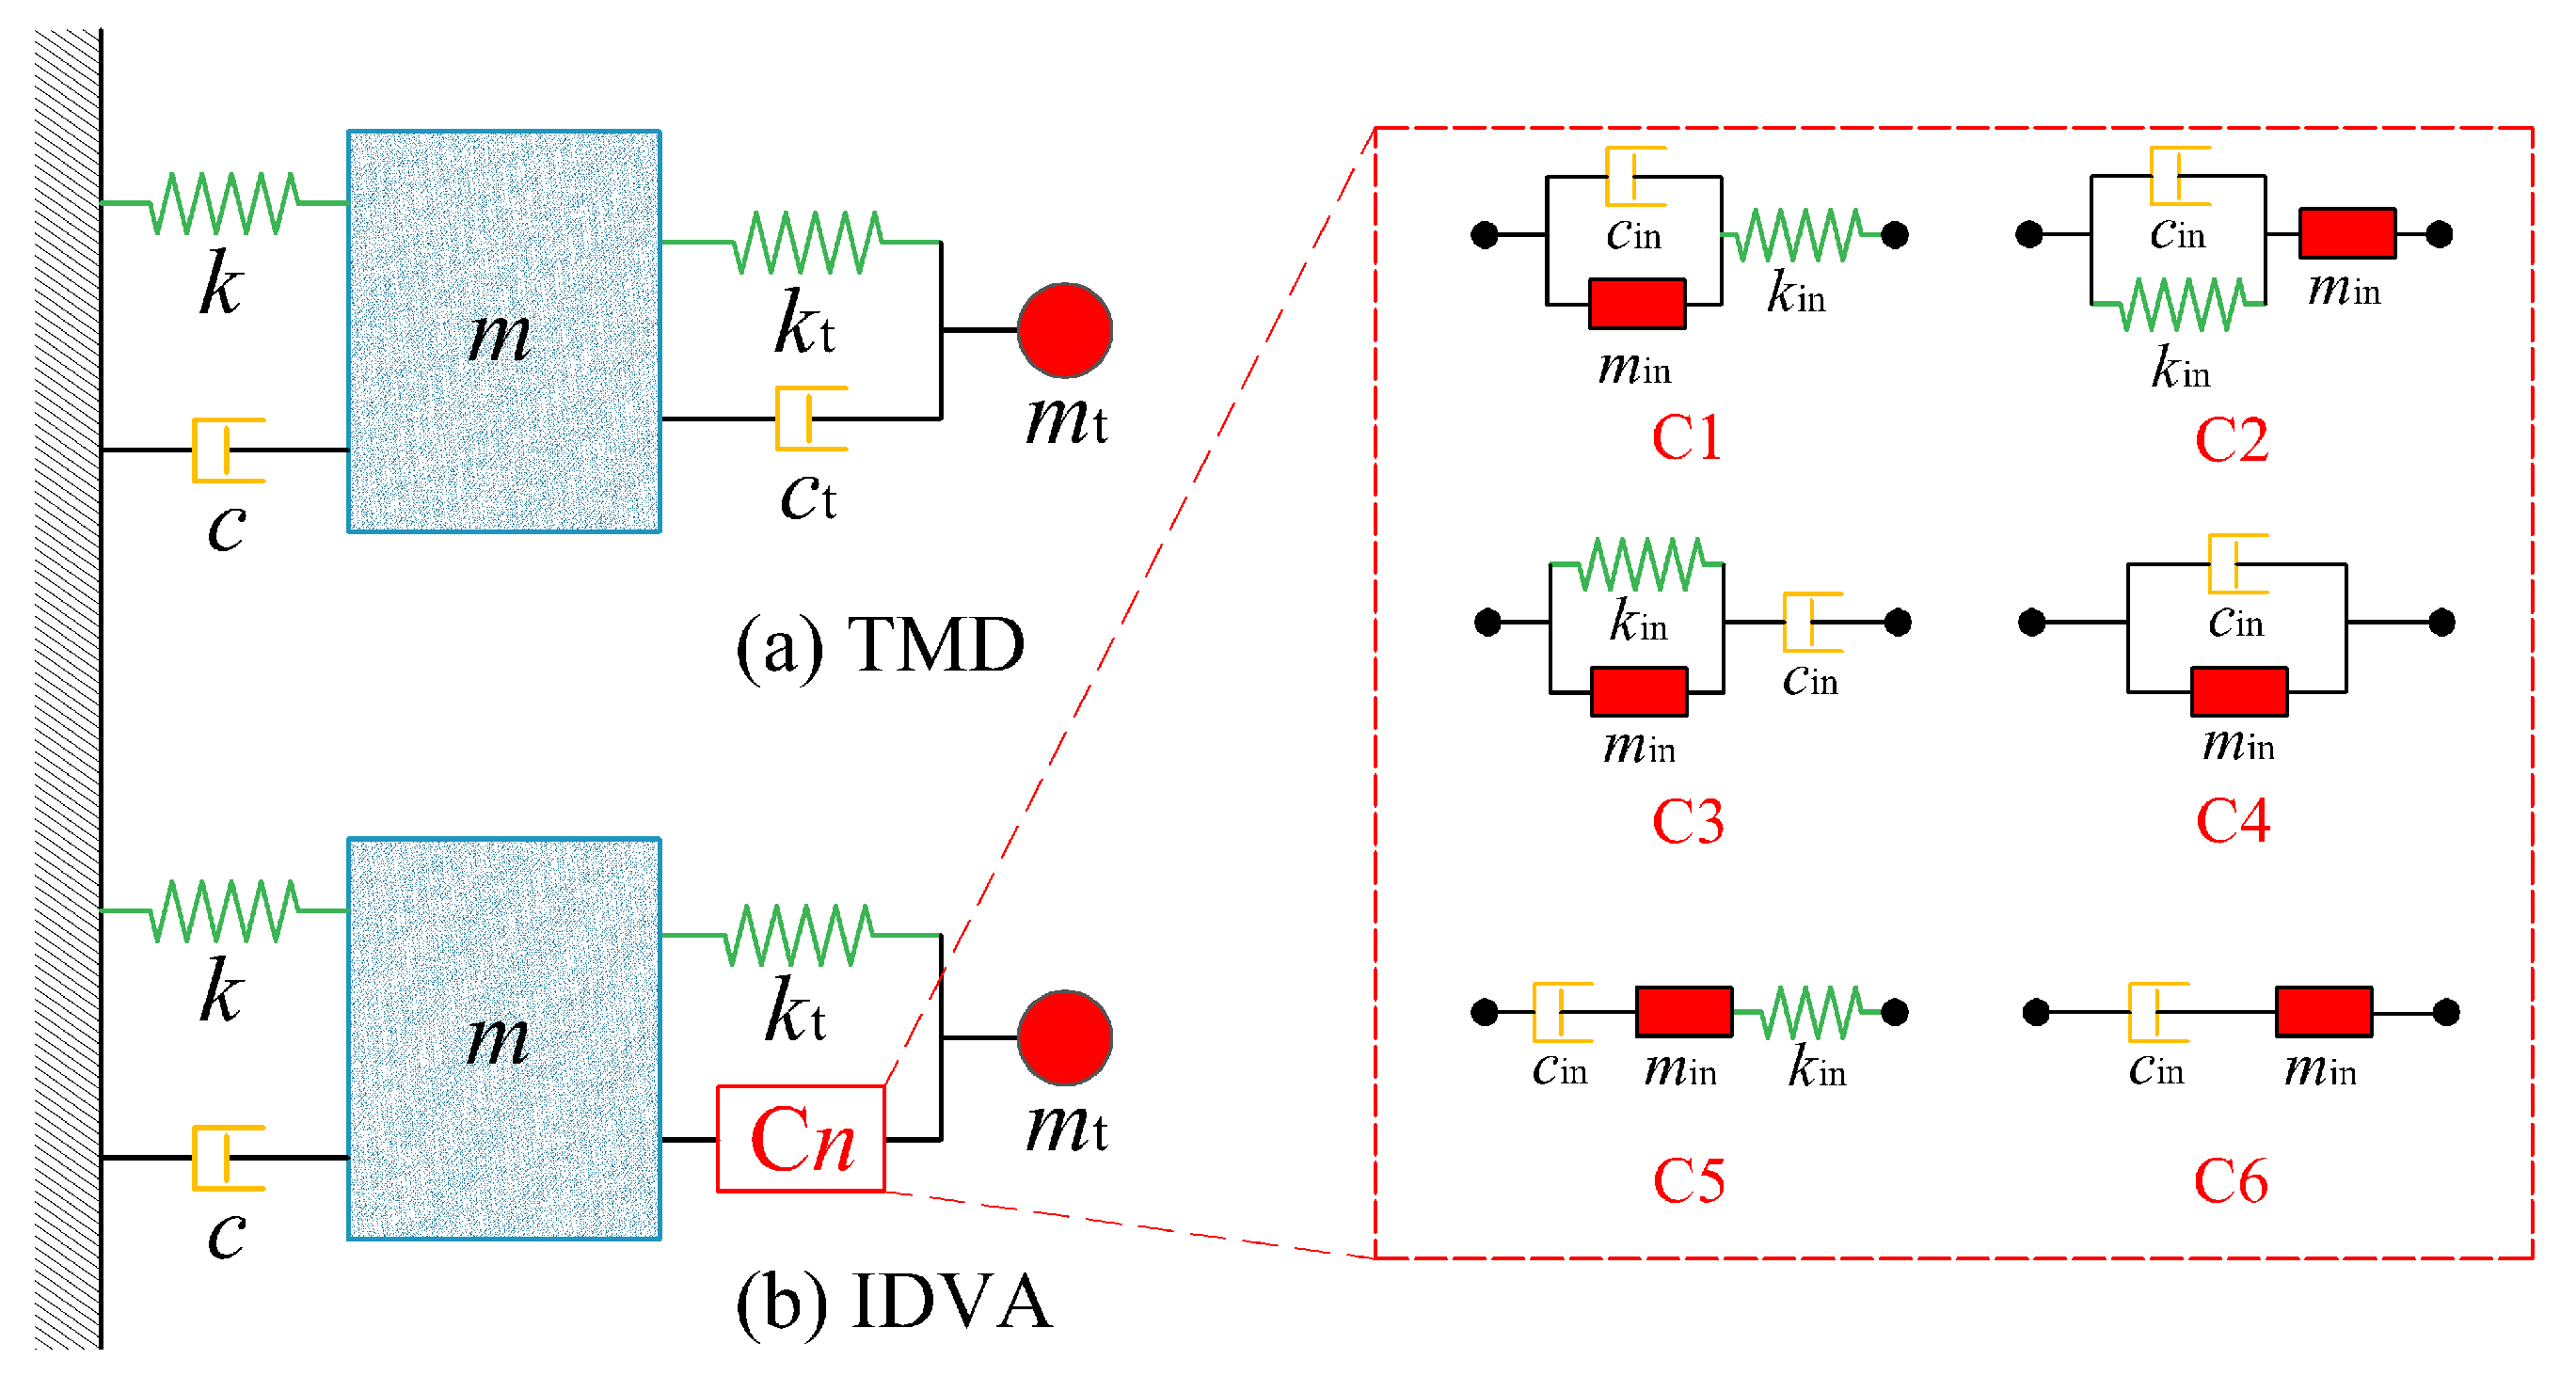
  • C4 and C6, which only introduced an inerter element, cannot enhance the control performance of the TMD. It is necessary to add another spring element. The configurations C1, C2, C3, and C5 with three components—the spring, damper, and inerter—can enhance the H performance and expand the effective frequency band of the TMD when parallel with the tuning spring component. The configurations C1 and C5, where the spring element is in series with other components, have a relatively close control performance and are significantly superior to other configurations.
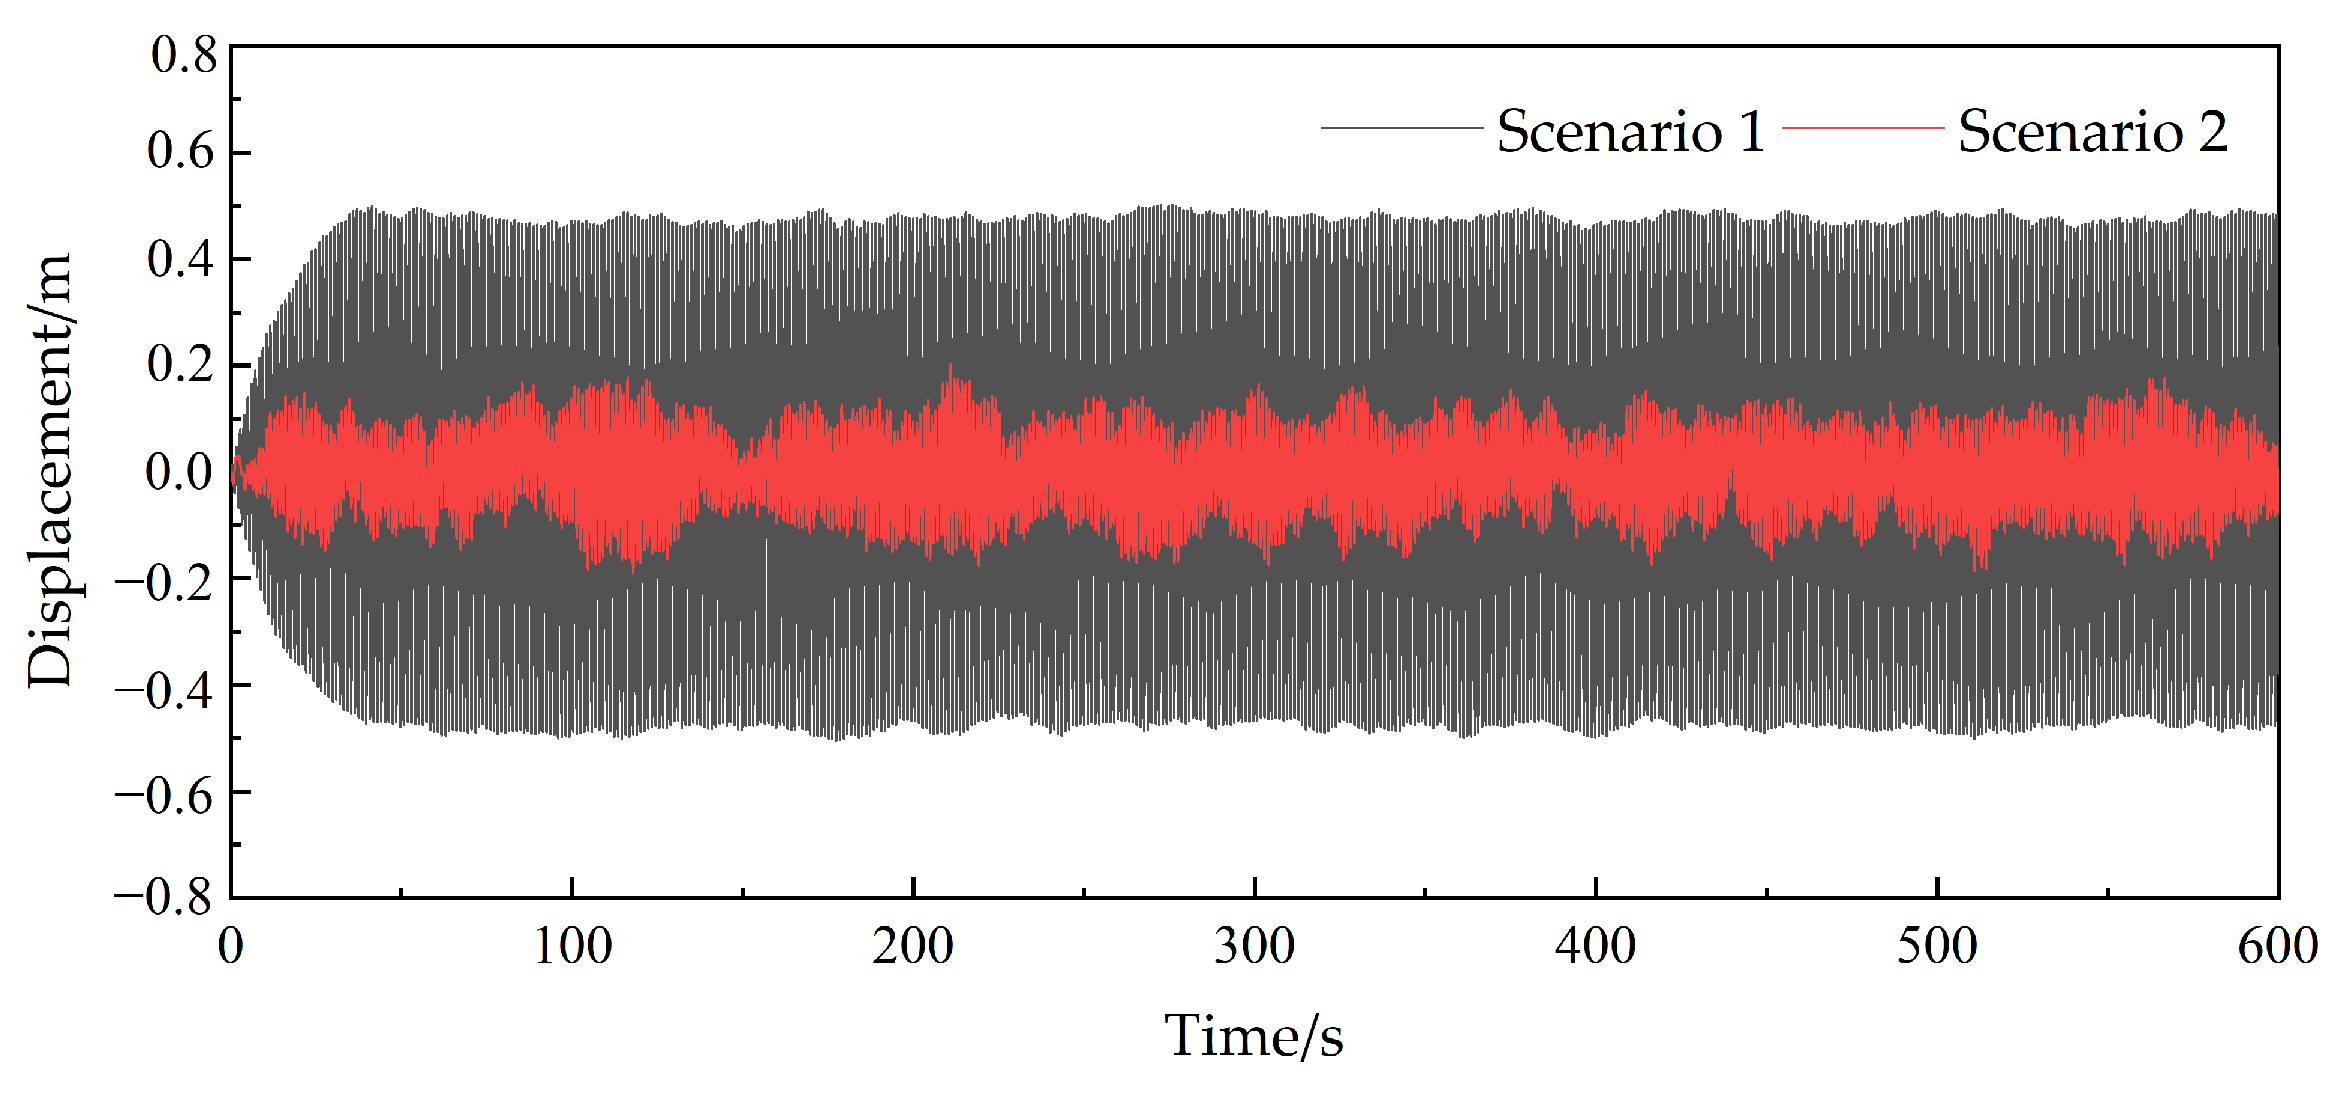
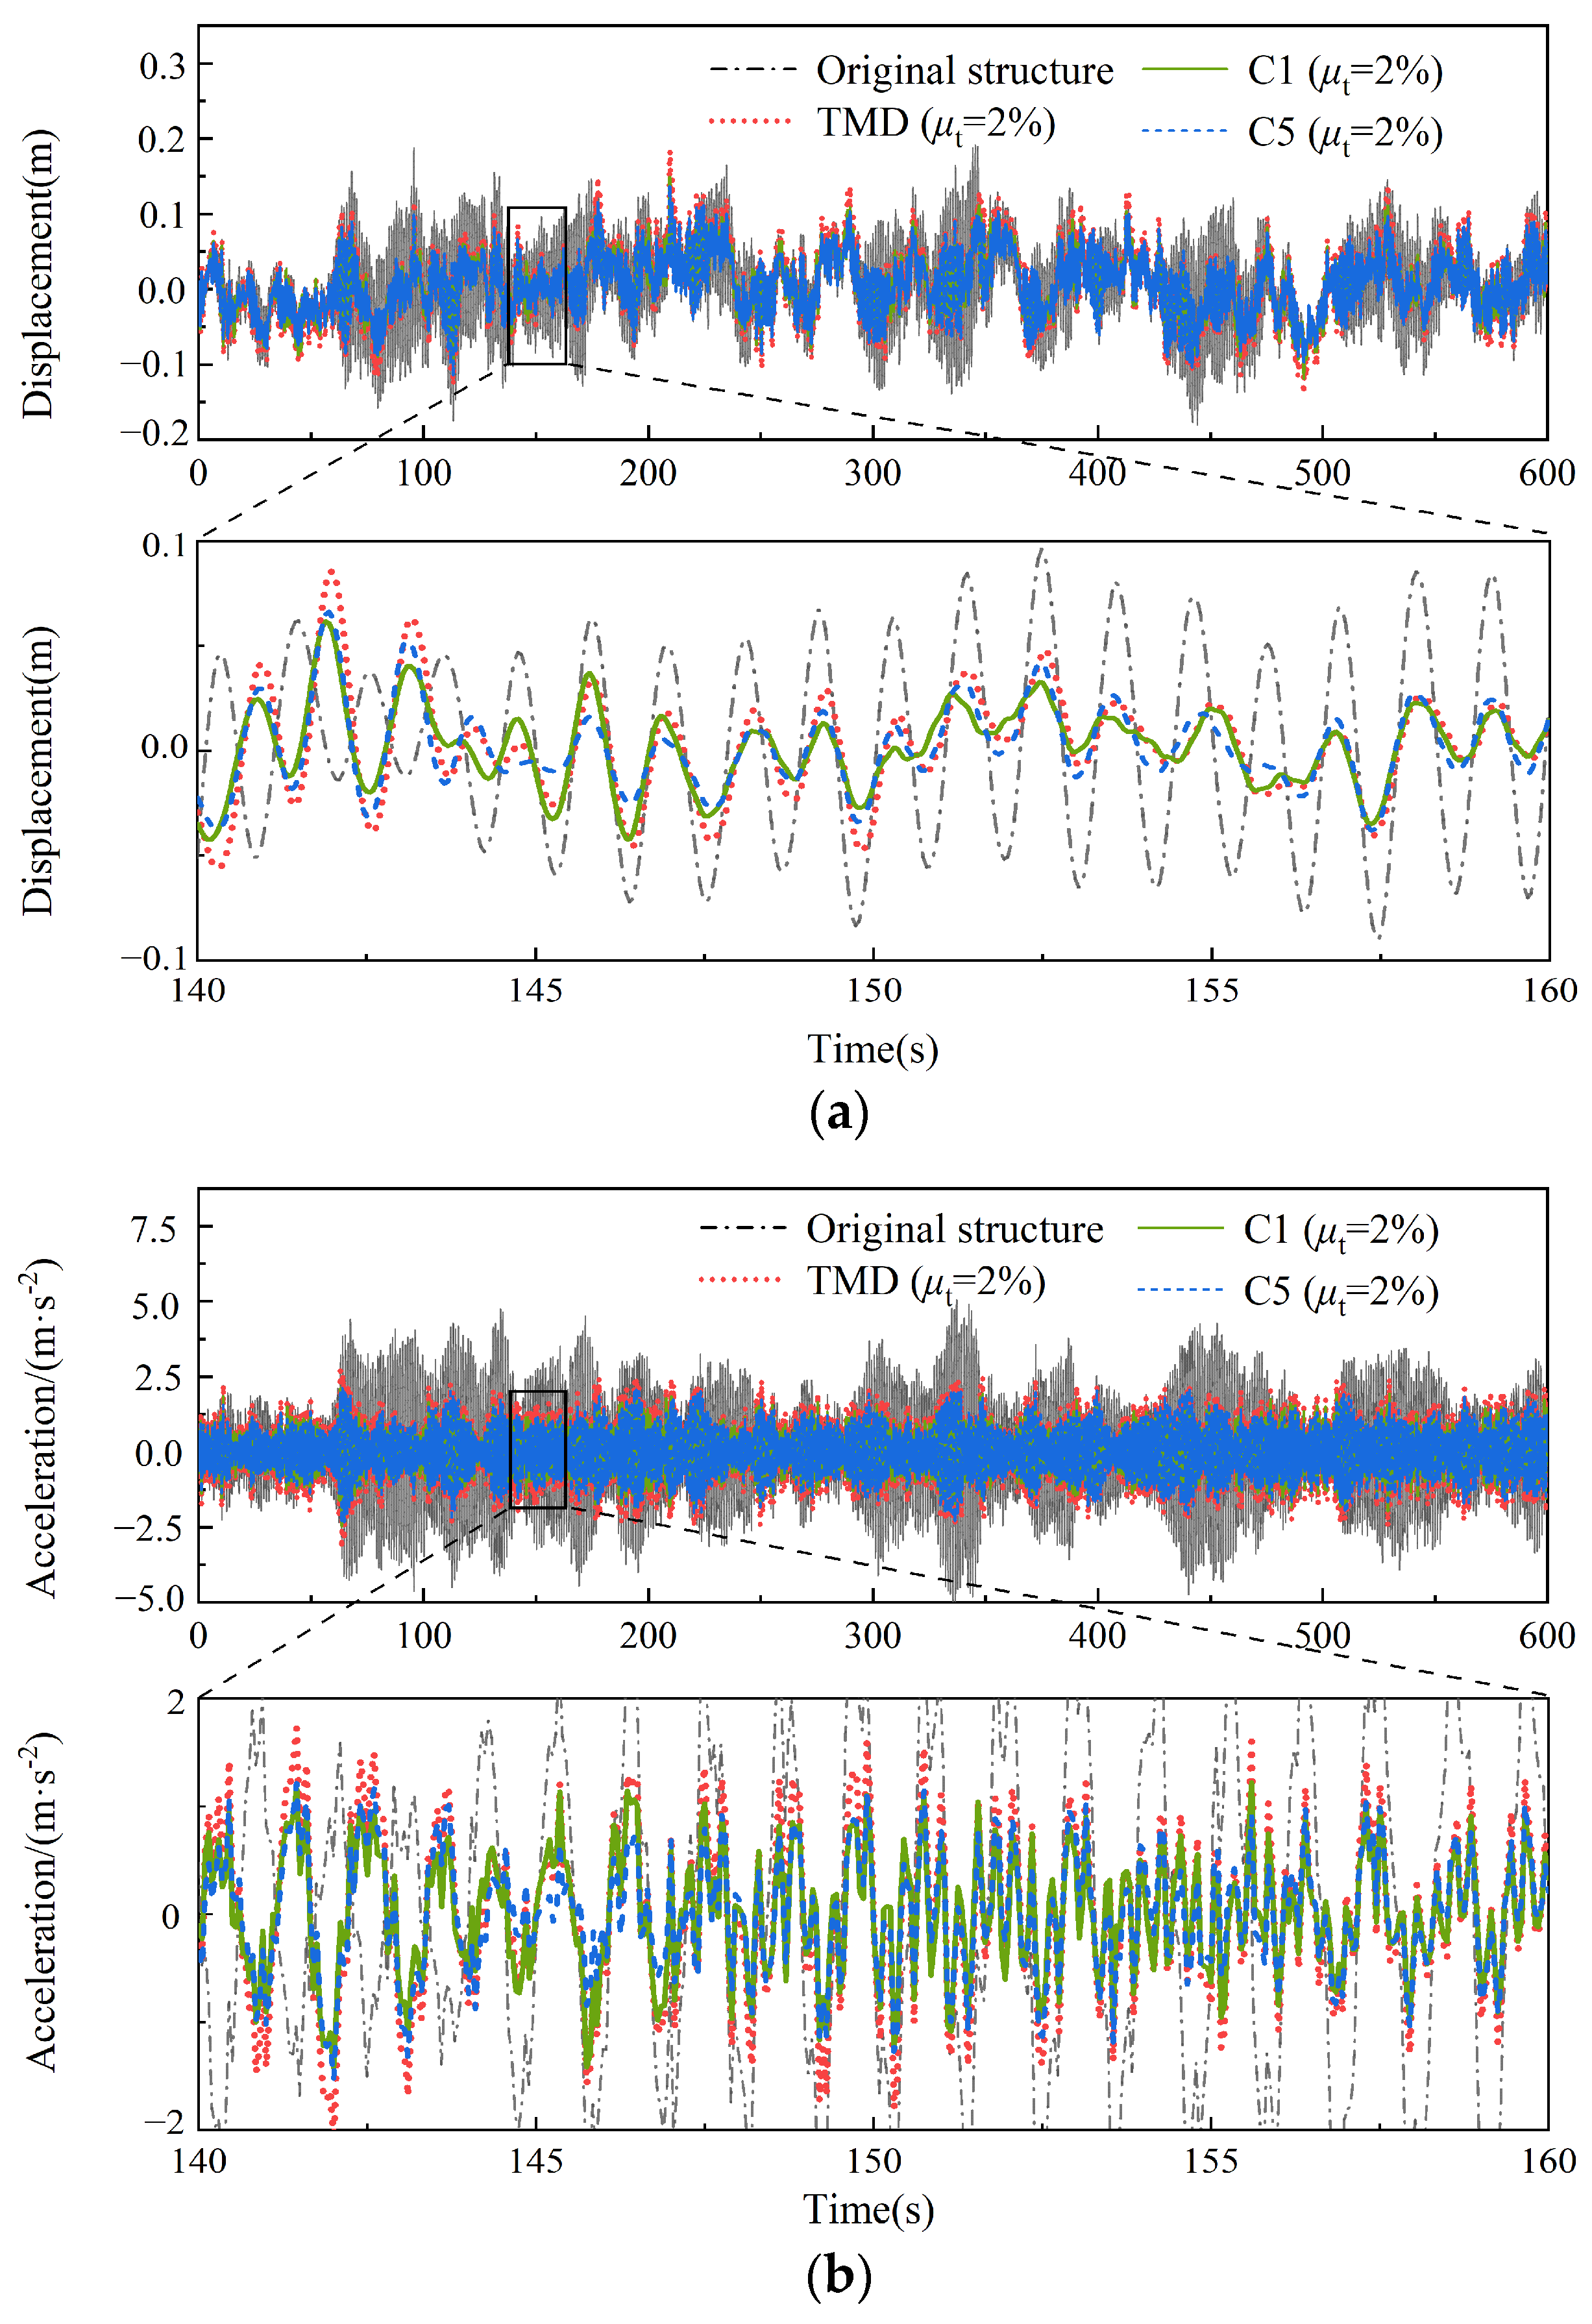
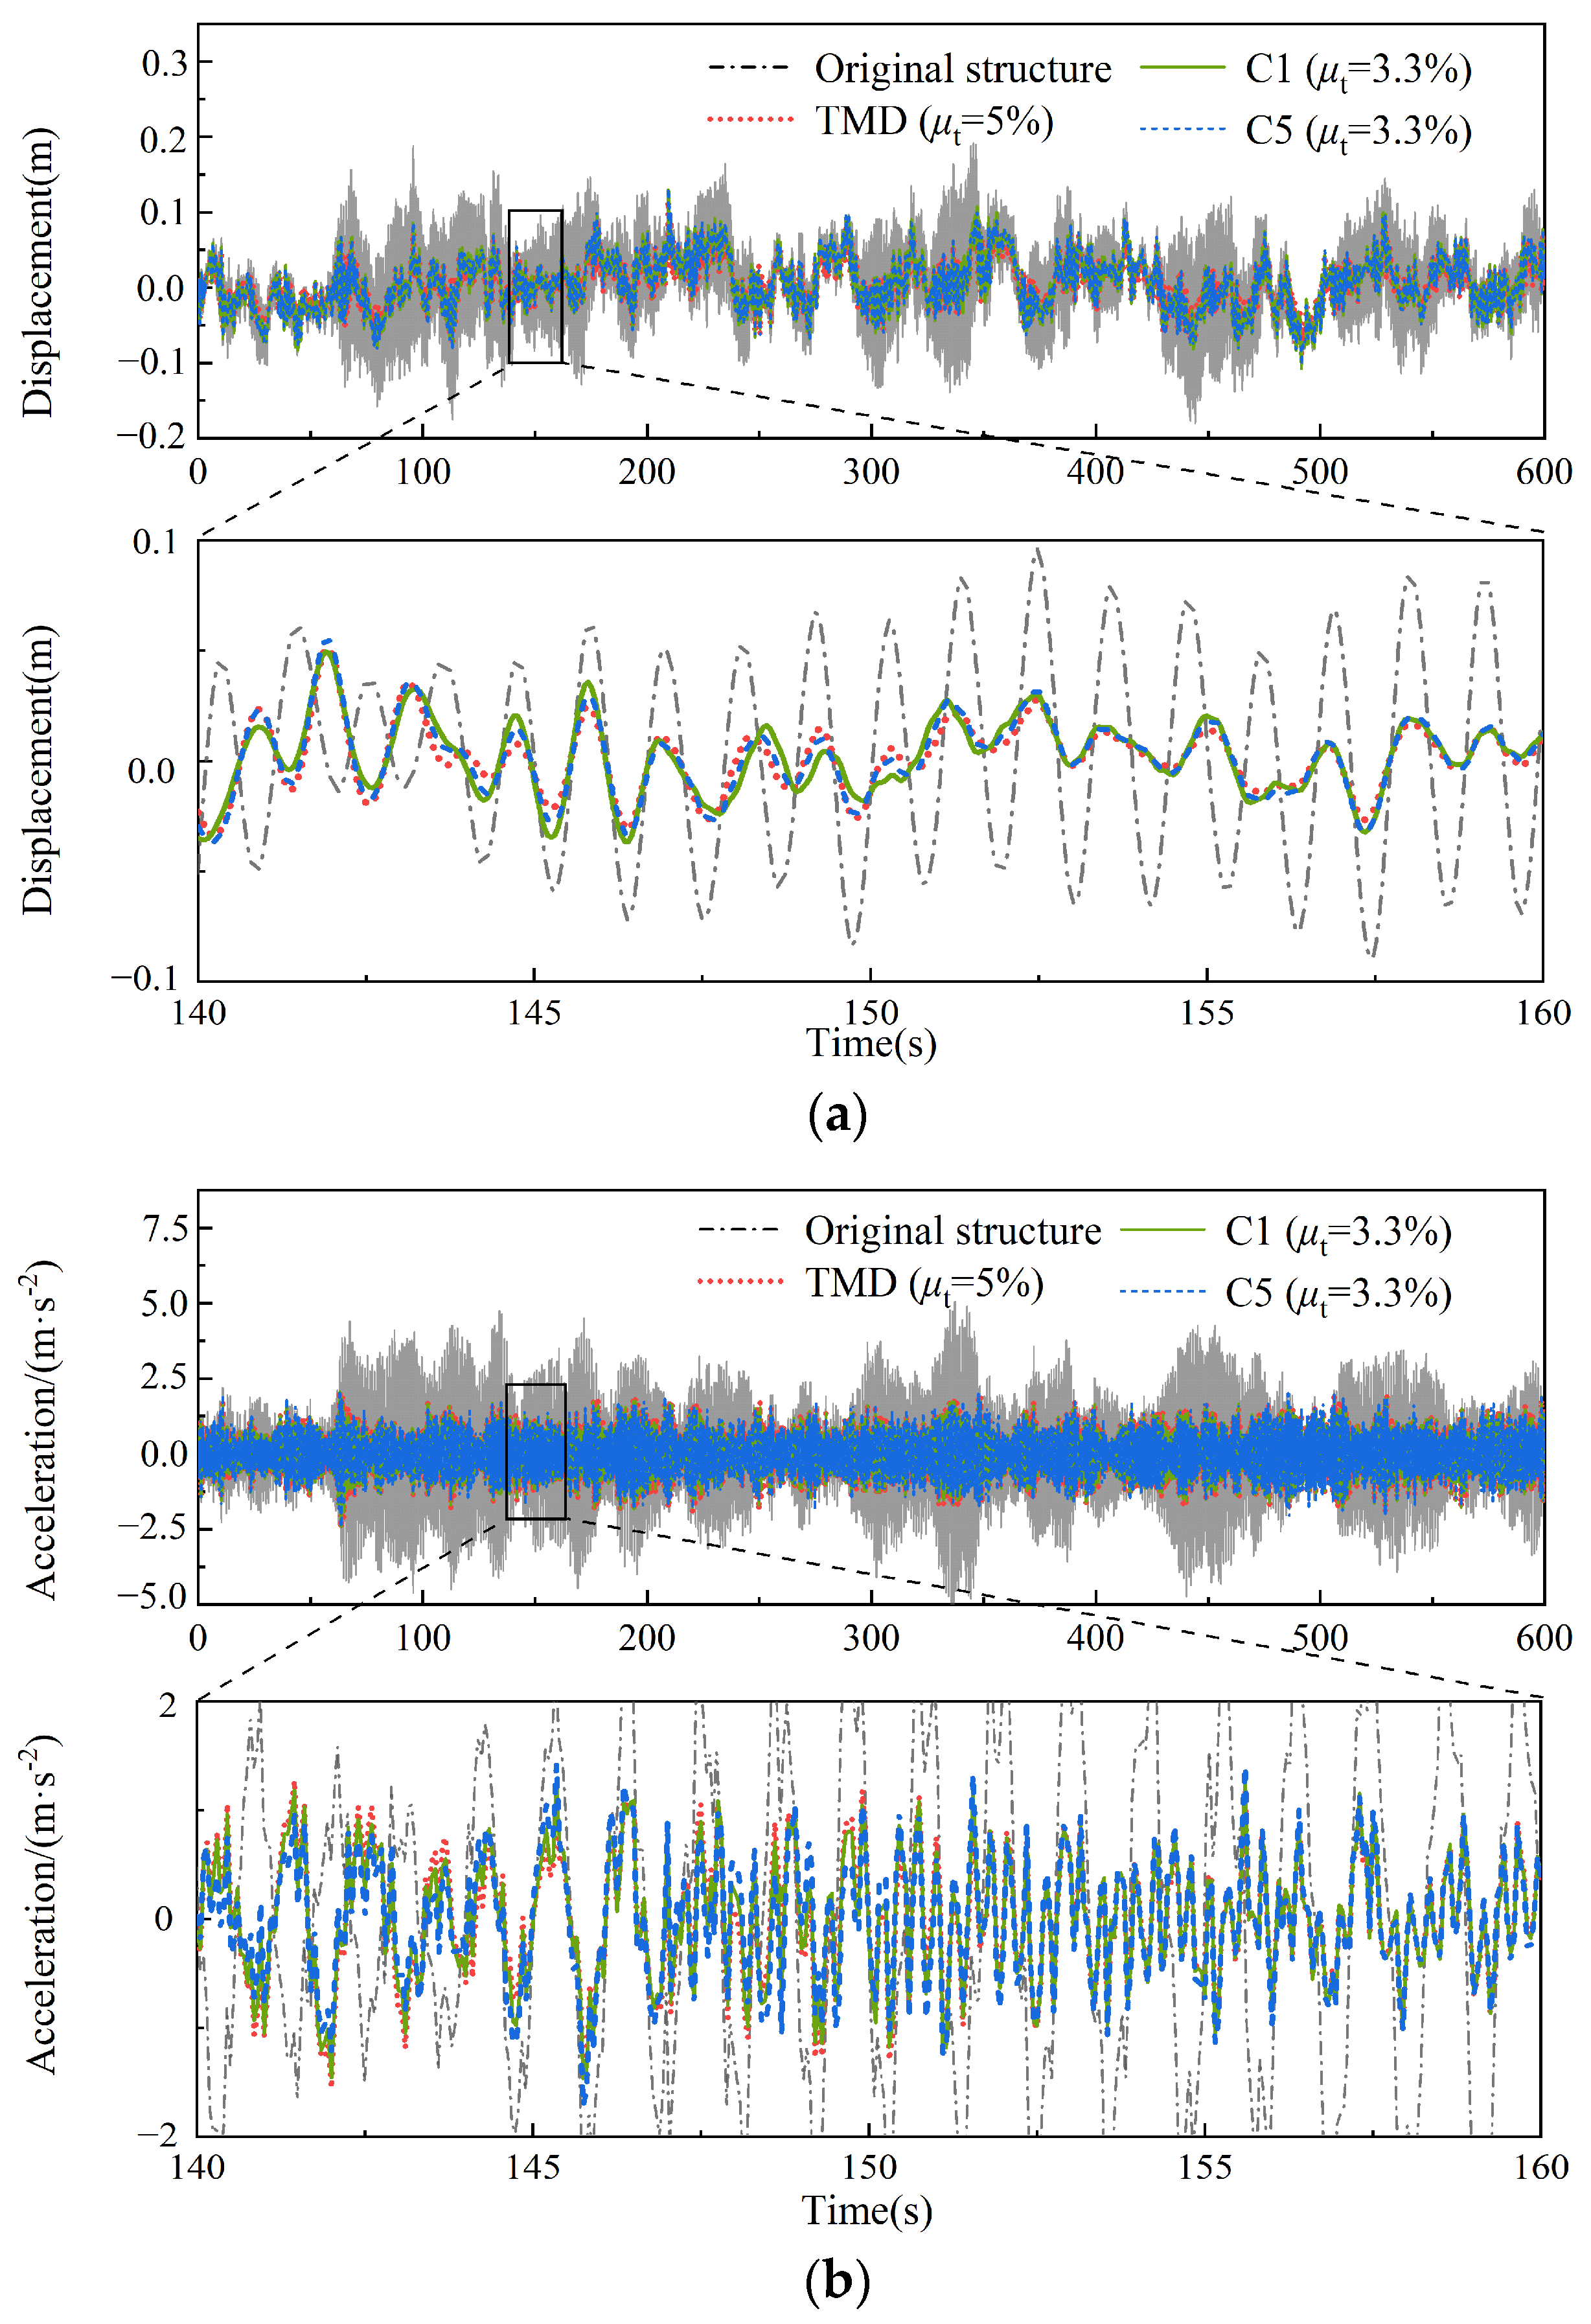
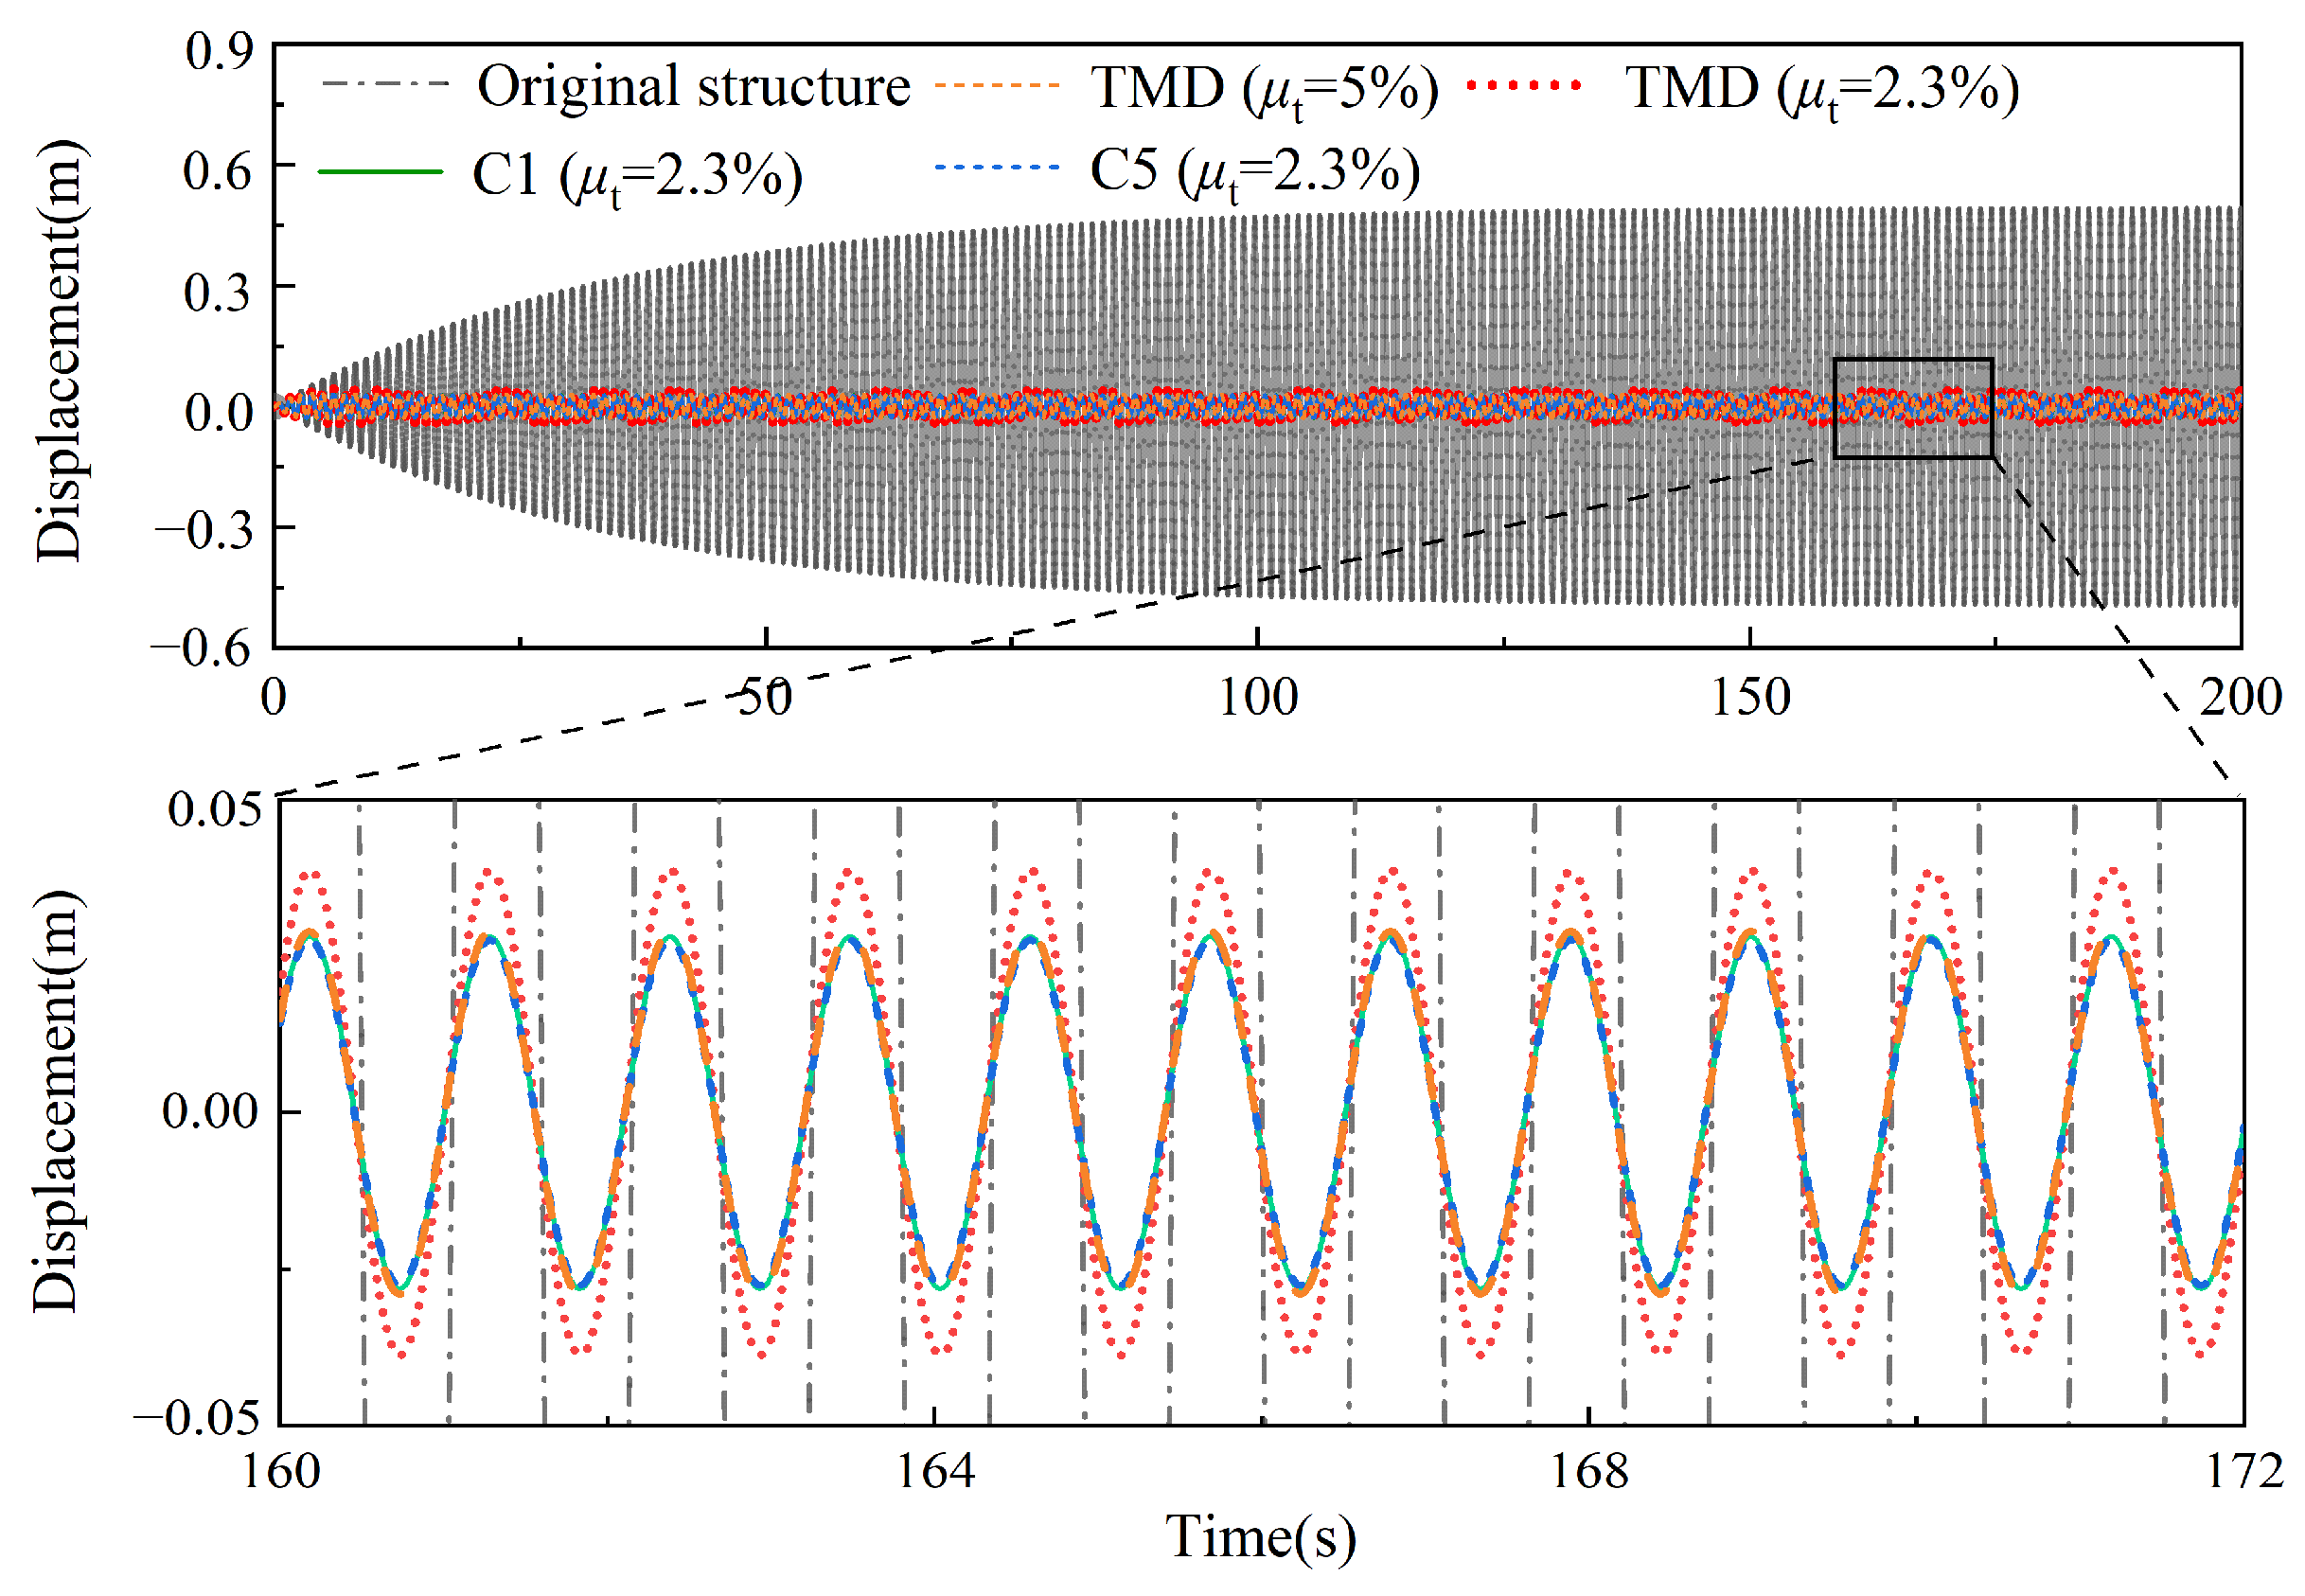
  • Under the along-wind loads, the application of C1 and C5 can reduce the tuned mass ratio of the TMD from 5% to below 3.3%, maintaining an equivalent vibration control performance for the tower. Under vortex excitation simulated by sinusoidal excitation in the across-wind direction, C1 and C5 demonstrate an even higher vibration mitigation ratio and greater lightweight effect. With mass ratios of 2.3%, C1 and C5 match the control performance of the TMD with a 5% tuned mass ratio, and their vibration mitigation ratio of the displacement response reaches 93.5%.
  • C1 features a high optimal inertance–mass ratio and a low damping ratio, and it achieves further energy dissipation through an increased displacement response of the damping element by paralleling it with the inerter element. C5 adopts a series connection of the inerter, damping, and stiffness elements, with a larger inertance–mass ratio and an optimal damping coefficient close to that of the TMD, achieving further energy dissipation through the apparent mass enhancement of the inerter.

Author Contributions

Conceptualization, Y.L. and Z.W.; methodology, Y.L. and Q.Z.; software, Q.Z., Y.X. and J.W.; validation, Z.W., Q.Z. and Y.X.; formal analysis, Y.L.; investigation, Z.W.; resources, Z.W.; data curation, Y.L., Q.Z. and Y.X.; writing—original draft preparation, Y.L.; writing—review and editing, Z.W., Q.Z., Y.X. and J.W.; visualization, Y.L.; supervision, Z.W.; project administration, Z.W. and Q.Z.; funding acquisition, Z.W. All authors have read and agreed to the published version of the manuscript.

Funding

The authors greatly acknowledge the financial support from the National Natural Science Foundation of China (Grant No. 52378300 and 51878274).

Data Availability Statement

Data are contained within the article. Additional supporting data presented in this study are available upon request from the corresponding authors.

Conflicts of Interest

The authors declare no conflicts of interest.

Appendix A

Upon substituting the variables in Equation (10), the mass, damping, and stiffness matrices of the tower–C2 system can be expressed as:
M 2 = 1 + μ t μ in 0 μ t μ in 0 μ t 0 μ t μ in 0 μ t μ in ;   C 2 = 2 ξ 0 ω 0 0 0 0 2 ξ in μ t υ t ω 0 2 ξ in μ t υ t ω 0 0 2 ξ in μ t υ t ω 0 2 ξ in μ t υ t ω 0 ;   K 2 = ω 0 2 + μ t ( ω 0 υ t ) 2 μ t ( ω 0 υ t ) 2 0 μ t ( ω 0 υ t ) 2 μ t ( ω 0 υ t ) 2 + υ in μ t ( ω 0 υ t ) 2 υ in μ t ( ω 0 υ t ) 2 0 υ in μ t ( ω 0 υ t ) 2 υ in μ t ( ω 0 υ t ) 2
The matrices of the tower–C3 system can be expressed as:
M 3 = 1 0 0 0 μ t + μ t μ in μ t μ in 0 μ t μ in μ t μ in ;   C 3 = 2 ξ 0 ω 0 + 2 ξ in μ t υ t ω 0 0 2 ξ in μ t υ t ω 0 0 0 0 2 ξ in μ t υ t ω 0 0 2 ξ in μ t υ t ω 0 ;   K 3 = ω 0 2 + μ t ( ω 0 υ t ) 2 μ t ( ω 0 υ t ) 2 0 μ t ( ω 0 υ t ) 2 μ t ( ω 0 υ t ) 2 + υ in μ t ( ω 0 υ t ) 2 υ in μ t ( ω 0 υ t ) 2 0 υ in μ t ( ω 0 υ t ) 2 υ in μ t ( ω 0 υ t ) 2
The matrices of the tower–C4 system can be expressed as:
M 4 = 1 + μ t μ in μ t μ in μ t μ in μ t μ in ;   C 4 = 2 ξ 0 ω 0 + 2 ξ in μ t υ t ω 0 2 ξ in μ t υ t ω 0 2 ξ in μ t υ t ω 0 2 ξ in μ t υ t ω 0 ;   K 4 = ω 0 2 + μ t ( ω 0 υ t ) 2 μ t ( ω 0 υ t ) 2 μ t ( ω 0 υ t ) 2 μ t ( ω 0 υ t ) 2
The matrices of the tower–C5 system can be expressed as:
M 5 = 1 0 0 0 0 μ t 0 0 0 0 μ t μ in μ t μ in 0 0 μ t μ in μ t μ in ;   C 5 = 2 ξ 0 ω 0 0 0 0 0 2 ξ in μ t υ t ω 0 2 ξ in μ t υ t ω 0 0 0 2 ξ in μ t υ t ω 0 2 ξ in μ t υ t ω 0 0 0 0 0 0 ; K 5 = ω 0 2 + μ t ( ω 0 υ t ) 2 + υ in μ t ( ω 0 υ t ) 2 μ t ( ω 0 υ t ) 2 0 υ in μ t ( ω 0 υ t ) 2 μ t ( ω 0 υ t ) 2 μ t ( ω 0 υ t ) 2 0 0 0 0 0 0 υ in μ t ( ω 0 υ t ) 2 0 0 υ in μ t ( ω 0 υ t ) 2
The matrices of the tower–C6 system can be expressed as:
M 6 = 1 0 0 0 μ t + μ t μ in μ t μ in 0 μ t μ in μ t μ in ;   C 6 = 2 ξ 0 ω 0 + 2 ξ in μ t υ t ω 0 0 2 ξ in μ t υ t ω 0 0 0 0 2 ξ in μ t υ t ω 0 0 2 ξ in μ t υ t ω 0 ;   K 6 = ω 0 2 + μ t ( ω 0 υ t ) 2 μ t ( ω 0 υ t ) 2 0 μ t ( ω 0 υ t ) 2 μ t ( ω 0 υ t ) 2 0 0 0 0

Appendix B

For the high-rise cylindrical desulfurization tower, it is necessary to determine their vortex-induced vibration characteristics by combining the Reynolds number, the critical wind speed, and the Strouhal number. The Reynolds number is calculated by the following equation:
R e = 69000 v D ,
where v represents the wind speed, which can be defined as the critical wind speed of the structure; and D is the width of the structure. It should be noted that the tower has variable cross sections, leading to different D values and consequently diverse Re values.
When Re ≥ 3.5 × 10⁶, the vortex shedding frequency is close to the structural natural frequency, indicating the potential cross-critical region strong wind resonance. In design, it is necessary to verify and check this index, and it should consider not only the first-order vibration mode of the structure but also the verification of the first 2–4 modes.
The critical wind speed of the desulfurization tower is calculated as:
v cr = f i D / S t ,
where vcr illustrates the i-th order critical wind speed of the tower; fi represents the i-th order frequency of the structure; St represents the Strouhal number; and the St for the circular cylinder structure can be set as 0.2.
To clarify the across-wind vibration characteristics of the tower and prevent underestimation of the wind-induced response, resonance verification was deemed based on these calculations above and the structural dimensions of the tower. The verification results, for different codes, are shown in Table A1. Given the relative brevity of Section II and Section IV of the tower, verifications were principally conducted on Sections I, III, and V—the bottom, middle, and top of the tower, respectively.
Table A1. Across-wind resonance checking conditions.
ModeFrequency
(Beam199/Solid95)
Period
(Beam188/Solid95)
Chinese codes [47,48] v cr < 1.2 v H ,   and R e 3 × 10 6 Only Re and vcr of Section III meet the requirements
Europe codes [49] v cr 1.25 v H ,   and H / D > 6 Only Section V
needs to be calculated
Japanese codes [50] v H / ( f 1 D m ) 4.2 ,   and H / D m 7 Only Section V
needs to be calculated
American codes [51] v cr < 1.2 v Z cr Section III and Section V
need to be calculated
Note: vH is the wind speed at the top of each section of the structure; H and D are the height and width of each section of the structure, respectively; Dm is the cross-sectional diameter at 2/3 of the total height of the structure; vZcr is the wind speed at height Zcr, where Zcr = 0.5(z1 + z2), and z1 and z2 are the upper and lower height limits where the change in cross-sectional diameter is less than 30%, respectively. When the cross-sectional variation within the top 1/3 height range of the structure is less than 10%, Zcr can also be taken as 5/6 of the total height. To maintain clarity and consistency, symbols in different codes have been simplified and unified.
When the wind speed reaches the first-order critical wind speed, there is a potential for vortex-induced resonance in the upper part (Section V) of the tower. When the wind speed reaches the second-order critical wind speed, there is a potential for vortex-induced resonance in the middle part (Section III) of the tower. It is important to note that the critical wind speeds of higher orders exceed the maximum wind speed that may appear in the environment where the desulfurization tower is located, negating the need for further verification in these cases.
In addition, as shown in Table 1, a difference is observed between the results derived from Chinese codes and the other four codes. According to the Chinese codes, only the middle part of the tower necessitates calculation for vortex-induced resonance. For the upper part, the Reynolds number does not meet the verification conditions set by Chinese codes. Ignoring the impact of across-wind resonance in the upper part could potentially lead to wind-induced structural damage. Therefore, we conducted calculations for two different scenarios where Section V and Section III of the tower are subjected to vortex-induced forces.
In the theory of across-wind vibration analysis for high-rise cylindrical structures, the wind speed range of vcr~1.3 vcr along the height of the structure is usually defined as the lock-in zone. Considering a rather unfavorable situation, the two scenarios each designated Section V and Section III of the tower as the lock-in zone, with basic wind speeds at a height of 10 m set as v10 = 11.7 m/s and 24.9 m/s, respectively. In addition to the wake vortices in the lock-in zone, the response of the structure to crosswinds is also influenced by the incoming turbulent flow. Both influences on the tower were considered and calculated cumulatively. The schematic wind loads for the structure to crosswinds in both scenarios are shown in Figure A1.
Figure A1. Across-wind load distribution.
Buildings 14 00150 g0a1
For the vortex-induced forces of the desulfurization tower, the impact in non-lock-in zones is far less than that in lock-in zones, hence the sinusoidal force proposed by Rumman [52] is applied to the upper section of the tower:
F v ( t ) = 1 2 ρ v ¯ 2 A μ L sin ( 2 π n s t ) ,
where Fv(t) represents the vortex-induced excitation for each element; v is the average wind speed of that element; ns represents the vortex shedding frequency, taken here as the first-order frequency of the tower; and μL is the lift coefficient, which for cylindrical structures is taken as 0.25.
The across-wind turbulence-induced excitation of the desulfurization tower can be analyzed under the theory of random vibrations. By opting for an across-wind pulsating wind power spectrum [53] as in Equation (A9), the simulation of the across pulsating wind speed process and the construction of the load vector are conducted.
S v ( n ) = 3.1 σ v 2 n x ( 1 + 9.5 x ) 5 / 3 ,
where Sv(n) is the power spectrum of the fluctuating wind in the across-wind direction; x = n z / v ¯ ( z ) is the dimensionless frequency; σv represents the root mean square of the fluctuating wind speed.
The wind-induced displacement and acceleration responses at the top of the structure in the across-wind direction are presented in Figure A2. The impact of turbulence-induced excitation is more significant in Scenario 2 due to the greater overall wind speed. However, given that the middle section accounts for less than 1/4 of the full height of the structure, even with the vortex-induced excitation, the overall response is still visibly smaller than that in Scenario 2. Therefore, the primary focus for across-wind vibration of the tower should be the scenario where the upper section is in the lock-in zone. Moreover, a comparison of the response curves from working Scenario 1 indicates that the sinusoidal force representing vortex-induced excitation plays a more dominant role over turbulence-induced excitation.
Figure A2. Displacement response in across-wind direction at the top of the tower.
Buildings 14 00150 g0a2
From the comprehensive analysis above, it is evident that the across-wind vibration response of the desulfurization tower is predominantly due to first-mode vortex-induced resonance. Therefore, when calculating the vortex-induced vibration caused by across-wind, only the vortex-induced resonant force applied to the upper section of the structure is taken into account.

References

  1. Kareem, A. Emerging frontiers in wind engineering: Computing, stochastics, machine learning and beyond. J. Wind Eng. Ind. Aerodyn. 2020, 206, 104320. [Google Scholar] [CrossRef]
  2. Lorenzo, I.F.; Elena, B.C.; Rodríguez, P.M.; Parnás, V.B.E. Dynamic analysis of self-supported tower under hurricane wind conditions. J. Wind Eng. Ind. Aerodyn. 2020, 197, 104078. [Google Scholar] [CrossRef]
  3. Lupi, F.; Niemann, H.J.; Höffer, R. A novel spectral method for cross-wind vibrations: Application to 27 full-scale chimneys. J. Wind Eng. Ind. Aerodyn. 2017, 171, 353–365. [Google Scholar] [CrossRef]
  4. Han, Y.; Zhou, X.; Wang, L.; Cai, C.S.; Yan, H.; Hu, P. Experimental investigation of the vortex-induced vibration of tapered light poles. J. Wind Eng. Ind. Aerodyn. 2021, 211, 104555. [Google Scholar] [CrossRef]
  5. Arul, M.; Kareem, A.; Kwon, K.D. Identification of vortex-induced vibration of tall building pinnacle using cluster analysis for fatigue evaluation: Application to Burj Khalifa. J. Struct. Eng-ASCE 2020, 146, 04020234. [Google Scholar] [CrossRef]
  6. Kavyashree, B.G.; Patil, S.; Rao, V.S. Review on vibration control in tall buildings: From the perspective of devices and applications. Int. J. Dyn. Control 2020, 9, 1316–1331. [Google Scholar] [CrossRef]
  7. Jafari, M.; Alipour, A. Methodologies to mitigate wind-induced vibration of tall buildings: A state-of-the-art review. J. Build. Eng. 2020, 33, 101582. [Google Scholar] [CrossRef]
  8. Yang, F.; Sedaghati, R.; Esmailzadeh, E. Vibration suppression of structures using tuned mass damper technology: A state-of-the-art review. J. Vib. Control 2022, 28, 812–836. [Google Scholar] [CrossRef]
  9. Den Hartog, J.P. Mechanical Vibrations; Courier Corporation: New York, NY, USA, 1985. [Google Scholar]
  10. Colherinhas, G.B.; Morais, M.V.G.; Machado, M.R. Spectral model of offshore wind turbines and vibration control by pendulum tuned mass dampers. Int. J. Str. Stab. Dyn. 2022, 22, 2250053. [Google Scholar] [CrossRef]
  11. Elias, S.; Matsagar, V. Research developments in vibration control of structures using passive tuned mass dampers. Ann. Rev. Control 2017, 44, 129–156. [Google Scholar] [CrossRef]
  12. Brownjohn, J.M.W.; Carden, E.P.; Goddard, C.R.; Oudin, G. Real-time performance monitoring of tuned mass damper system for a 183 m reinforced concrete chimney. J. Wind Eng. Ind. Aerod. 2010, 98, 169–179. [Google Scholar] [CrossRef]
  13. Elias, S.; Matsagar, V.; Datta, T.K. Along-wind response control of chimneys with distributed multiple tuned mass dampers. Struct. Control Health Monit. 2019, 26, e2275. [Google Scholar] [CrossRef]
  14. Xiang, Y.; Tan, P.; He, H.; Yao, H.; Zheng, X. Seismic optimal design of hysteretic damping tuned mass damper (HD-TMD) for acceleration response control. Acta Mech. 2023; published online. [Google Scholar] [CrossRef]
  15. Franco, L.G.T.; Morita, N.F.; Fong, H.F.A.; Carbajal, F.B.; Lopez, A.E.D.; Arreola, D.E.R. Oscillation attenuation in a building-like structure by using a flexible vibration absorber. Mathematics 2022, 10, 289. [Google Scholar] [CrossRef]
  16. Nakano, Y.; Kishi, T.; Takahara, H. Experimental study on application of tuned mass dampers for chatter in turning of a thin-walled cylinder. Appl. Sci. 2021, 11, 12070. [Google Scholar] [CrossRef]
  17. Bekdas, G.; Nigdeli, S.M. Mass ratio factor for optimum tuned mass damper strategies. Int. J. Mech. Sci. 2013, 71, 68–84. [Google Scholar] [CrossRef]
  18. Lu, X.; Chen, J. Mitigation of wind-induced response of Shanghai Center Tower by tuned mass damper. Struct. Des. Tall Spec. Build. 2011, 20, 435–452. [Google Scholar] [CrossRef]
  19. Xu, K.; Bi, K.; Ge, Y.; Zhao, L.; Han, Q.; Du, X. Performance evaluation of inerter-based dampers for vortex-induced vibration control of long-span bridges: A comparative study. Struct. Control Health Monit. 2020, 27, e2529. [Google Scholar] [CrossRef]
  20. Smith, M.C. Synthesis of mechanical networks: The inerter. IEEE Trans. Autom. Control 2002, 47, 1648–1662. [Google Scholar] [CrossRef]
  21. Wang, F.; Hong, M.; Chen, C. Building suspensions with inerters. Proc. Inst. Mech. Eng. Part C J. Mech. Eng. Sci. 2010, 224, 1605–1616. [Google Scholar] [CrossRef]
  22. Lazar, I.F.; Neild, S.A.; Wagg, D.J. Using an inerter-based device for structural vibration suppression. Earthq. Eng. Struct. Dyn. 2014, 43, 1129–1147. [Google Scholar] [CrossRef]
  23. Ma, R.; Bi, K.; Hao, H. Inerter-based structural vibration control: A state-of-the-art review. Eng. Struct. 2021, 243, 112655. [Google Scholar] [CrossRef]
  24. Xu, T.; Li, Y.; Lai, T.; Zheng, J. A simplified design method of tuned inerter damper for damped civil structures: Theory, validation, and application. Struct. Control Health Monit. 2021, 28, e2798. [Google Scholar] [CrossRef]
  25. Zhang, R.; Zhao, Z.; Pan, C.; Ikago, K.; Xue, S. Damping enhancement principle of inerter system. Struct. Control Health Monit. 2020, 27, e2523. [Google Scholar] [CrossRef]
  26. Alotta, G.; Failla, G. Improved inerter-based vibration absorbers. Int. J. Mech. Sci. 2021, 192, 106087. [Google Scholar] [CrossRef]
  27. Liang, Q.; Li, L.; Yang, Q. Seismic analysis of the tuned-inerter-damper enhanced mega-sub structure system. Struct. Control Health Monit. 2020, 28, e2568. [Google Scholar] [CrossRef]
  28. Chen, H.; Bi, K.; Liu, Y.; Tan, P. Performance evaluation of multiple tuned inerter-based dampers for seismic induced structural vibration control. Struct. Control Health Monit. 2022, 29, e2860. [Google Scholar] [CrossRef]
  29. Marian, L.; Giaralis, A. Optimal design of a novel tuned mass-damper–inerter (TMDI) passive vibration control configuration for stochastically support-excited structural systems. Probabilist Eng. Mech. 2014, 38, 156–164. [Google Scholar] [CrossRef]
  30. Wang, Q.; Qiao, H.; Li, W.; You, Y.; Fan, Z.; Tiwari, N. Parametric optimization of an inerter-based vibration absorber for wind-induced vibration mitigation of a tall building. Wind Struct. 2020, 31, 241–253. [Google Scholar]
  31. Ikago, K.; Sugimura, Y.; Saito, K.; Inoue, N. Modal response characteristics of a multiple degree-of-freedom structure incorporated with tuned viscous mass dampers. J. Asian. Archit. Build. 2012, 11, 375–382. [Google Scholar] [CrossRef]
  32. Garrido, H.; Curadelli, O.; Ambrosini, D. Improvement of tuned mass damper by using rotational inertia through tuned viscous mass damper. Eng. Struct. 2013, 56, 2149–2153. [Google Scholar] [CrossRef]
  33. Zhang, Z.; Høeg, C. Inerter-enhanced tuned mass damper for vibration damping of floating offshore wind turbines. Ocean Eng. 2021, 223, 108663. [Google Scholar] [CrossRef]
  34. Zhang, R.; Cao, Y.; Dai, K. Response control of wind turbines with ungrounded tuned mass inerter system (TMIS) under wind loads. Wind Struct. 2021, 32, 573–586. [Google Scholar]
  35. Zhang, R.; Zhao, Z.; Dai, K. Seismic response mitigation of a wind turbine tower using a tuned parallel inerter mass system. Eng. Struct. 2019, 180, 29–39. [Google Scholar] [CrossRef]
  36. Zhang, L.; Xue, S.; Zhang, R.; Xie, L.; Hao, L. Simplified multimode control of seismic response of high-rise chimneys using distributed tuned mass inerter systems (TMIS). Eng. Struct. 2021, 228, 111550. [Google Scholar] [CrossRef]
  37. Wen, Y.; Chen, Z.; Hua, X. Design and evaluation of tuned inerter-based dampers for the seismic control of MDOF structures. J. Struct. Eng. 2017, 143, 04016207. [Google Scholar] [CrossRef]
  38. Su, N.; Peng, S.; Hong, N.; Xia, Y. Wind-induced vibration absorption using inerter-based double tuned mass dampers on slender structures. J. Build. Eng. 2022, 58, 104993. [Google Scholar] [CrossRef]
  39. Hu, Y.; Chen, M.Z.Q. Performance evaluation for inerter-based dynamic vibration absorbers. Int. J. Mech. Sci. 2015, 99, 297–307. [Google Scholar] [CrossRef]
  40. Li, S.; Liu, M.; Li, H.; Hui, Y.; Chen, Z. Effects of structural damping on wind-induced responses of a 243-meter-high solar tower based on a novel elastic test model. J. Wind Eng. Ind. Aerod. 2018, 172, 1–11. [Google Scholar] [CrossRef]
  41. Lin, J.; Zhang, Y.; Li, Q.; Williams, F. Seismic spatial effects for long-span bridges, using the pseudo excitation method. Eng. Struct. 2004, 26, 1207–1216. [Google Scholar] [CrossRef]
  42. Colherinhas, G.B.; Morais, M.V.G.; Shzu, M.A.M.; Avlia, S.M. Optimal pendulum tuned mass damper design applied to high towers using genetic algorithms: 2DOF modelling. Int. J. Str. Stab. Dyn. 2019, 19, 1950125. [Google Scholar] [CrossRef]
  43. Liao, F.; Lu, Y.; Liu, H. Cooperative optimal preview tracking control of continuous-time multi-agent systems. Int. J. Control 2016, 89, 2019–2028. [Google Scholar] [CrossRef]
  44. Kaveh, A.; Farzam, M.F.; Maroofiazar, R. Comparing H2 and H algorithms for optimum design of tuned mass dampers under near-fault and far-fault earthquake motions. Period. Polytech. Civ. Eng. 2020, 64, 828–844. [Google Scholar] [CrossRef]
  45. Davenport, A.G. The response of slender, line-like structures to a gusty wind. Proc. Inst. Civ. Eng. 1961, 23, 389–408. [Google Scholar] [CrossRef]
  46. Wang, L.; Wang, Z.; Huang, N.; Fan, X.; Zhang, Z. Comparative analysis of cross-wind load code for high structures with circular sections. Structures 2022, 43, 117–1186. [Google Scholar] [CrossRef]
  47. NB/T 47041-2014; Vertical Vessels Supported by Skirt. Standards Press of China: Beijing, China, 2014.
  48. GB/T 50051-2021; Technical Standard for Chimney Engineering. China Planning Press: Beijing, China, 2021.
  49. BS EN 1991-3-2; Eurocode 3: Design of Steel Structures: Part 3-2: Towers, Masts and Chimneys. European Committee for Standardization: Brussels, Belgium, 2006.
  50. AIJ 2004; Recommendations for Loads on Buildings. Architectural Institute of Japan: Tokyo, Japan, 2004.
  51. ASME STS-1-2006; Steel Stacks. The American Society of Mechanical Engineers: New York, NY, USA, 2006.
  52. Holmes, J.D. Wind Loading of Structures, 3rd ed.; CRC Press: Boca Raton, FL, USA, 2018. [Google Scholar]
  53. Simiu, E.; Yeo, D.H. Wind Effect on Structures: Modern Structural Design for Wind, 4th ed.; Wiley-Blackwell: Hoboken, NJ, USA, 2019. [Google Scholar]
Figure 1. Schematic diagram of the tuned mass damper (TMD) and inerter-based dynamic vibration absorbers (IDVA) system: (a) TMD; (b) IDVA. (m, c, and k are the mass, damping, and stiffness of the main structure, respectively; mt, ct, and kt are the tuned mass, damping, and tuned stiffness of the TMD, respectively; and min, cin, and kin are the inertance coefficient, damping, and stiffness of the inerter subsystems, respectively).
Buildings 14 00150 g001
Figure 2. Comparison of the desulfurization tower models: (a) Height of each segment; (b) The beam element model; (c) The solid element model.
Buildings 14 00150 g002
Figure 3. Comparison of the first three mode shapes: (a) The first mode; (b) The second mode; (c) The third mode.
Buildings 14 00150 g003
Figure 4. Analytical model of the desulfurization tower–IDVA system.
Buildings 14 00150 g004
Figure 5. Parameter optimization of IDVAs for the desulfurization tower.
Buildings 14 00150 g005
Figure 6. Comparison of frequency response curves (μt = 2%).
Buildings 14 00150 g006
Figure 7. Comparison of frequency response curves (μt = 5%).
Buildings 14 00150 g007
Figure 8. Comparison of the frequency response curves by changing μin: (a) C4; (b) C6.
Buildings 14 00150 g008
Figure 9. Variation laws of the optimal parameters of the IDVAs and TMD with the tuned mass ratio: (a) Optimal cin; (b) Optimal min; (c) Optimal kt; (d) Optimal kin.
Buildings 14 00150 g009
Figure 10. Comparison of along-wind responses in the frequency domain: (a) Root-mean-square responses; (b) Vibration mitigation ratios.
Buildings 14 00150 g010
Figure 11. Time history curve of wind speed at the top of the desulfurization tower: (a) Element 32; (b) Element 31; (c) Element 30.
Buildings 14 00150 g011
Figure 12. Wind speed spectrum comparison.
Buildings 14 00150 g012
Figure 13. Comparison of the along-wind response of the desulfurization tower (μt = 2%): (a) Displacement response; (b) Acceleration response.
Buildings 14 00150 g013
Figure 14. Comparison of the along-wind response of the desulfurization tower (γ = 59.21%): (a) Displacement response; (b) Acceleration response.
Buildings 14 00150 g014
Figure 15. Comparison of the across-wind response of the desulfurization tower.
Buildings 14 00150 g015
Figure 16. Hysteretic curves of the damping elements of the C1, C5, and TMD configurations: (a) Total hysteretic curves; (b) Hysteretic curves of the damping element.
Buildings 14 00150 g016
Figure 17. Sensitivity analysis of the μt and μin of C1: (a) Case 1 (μt = 2%); (b) Case 2 (μt = 5%).
Buildings 14 00150 g017
Figure 18. Sensitivity analysis of the υin and ξin of C1: (a) Case 1 (μt = 2%); (b) Case 2 (μt = 5%).
Buildings 14 00150 g018
Figure 19. Sensitivity analysis of the μt and μin of C5: (a) Case 1 (μt = 2%); (b) Case 2 (μt = 5%).
Buildings 14 00150 g019
Figure 20. Sensitivity analysis of the υin and ξin of C5: (a) Case 1 (μt = 2%); (b) Case 2 (μt = 5%).
Buildings 14 00150 g020
Table 1. Inner diameter and thickness values of each section of the tower.
SegmentIIIIIIIVV
Inside diameter/m7.7007.700/5.7605.7602.7002.700
Thickness/m0.0200.020/0.0160.0160.0160.016
Table 2. Natural vibration frequencies and periods of the tower.
ModeFrequency
(Beam199/Solid95)
Period
(Beam188/Solid95)
Error
1st0.908/0.8881.101/1.1262.3%
2nd4.192/4.1600.239/0.2410.8%
3rd9.156/9.0500.109/1.1111.2%
Note: Error = (Beam model frequency – Solid model frequency)/Solid model frequency × 100%.
Table 3. Optimal H performance parameters of the TMD and IDVAs.
μt (%)μinυtυinξin
TMD2/0.9794/0.0874 (ξt)
5/0.9524/0.1336 (ξt)
C120.06460.95470.07380.0149
50.13220.90600.19370.0548
C220.06830.99900.06210.0136
50.09500.97050.08660.0176
C320.00380.90310.41700.1619
50.00370.90130.81040.1520
C42→00.9796/0.0862
5→00.9511/0.1346
C520.04130.95960.04380.0764
50.11230.89780.13330.1156
C62→+∞1.0136/0.0975
5→+∞0.9511/0.1359
Disclaimer/Publisher’s Note: The statements, opinions and data contained in all publications are solely those of the individual author(s) and contributor(s) and not of MDPI and/or the editor(s). MDPI and/or the editor(s) disclaim responsibility for any injury to people or property resulting from any ideas, methods, instructions or products referred to in the content.

