
Determining Urban Indicators in Local Plans—As One of the Sustainable Assumptions of the New European Bauhaus?


Abstract
:1. Introduction
- Are the urban indicators defined by architects adapted to spatial needs?
- Do they allow for optimal shaping of this space, taking into account the provisions of Polish law?
- Is their skillful designation likely to be one of the sustainable assumptions of the New European Bauhaus?
2. Polish Planning Regulations in Relation to the Issues Discussed
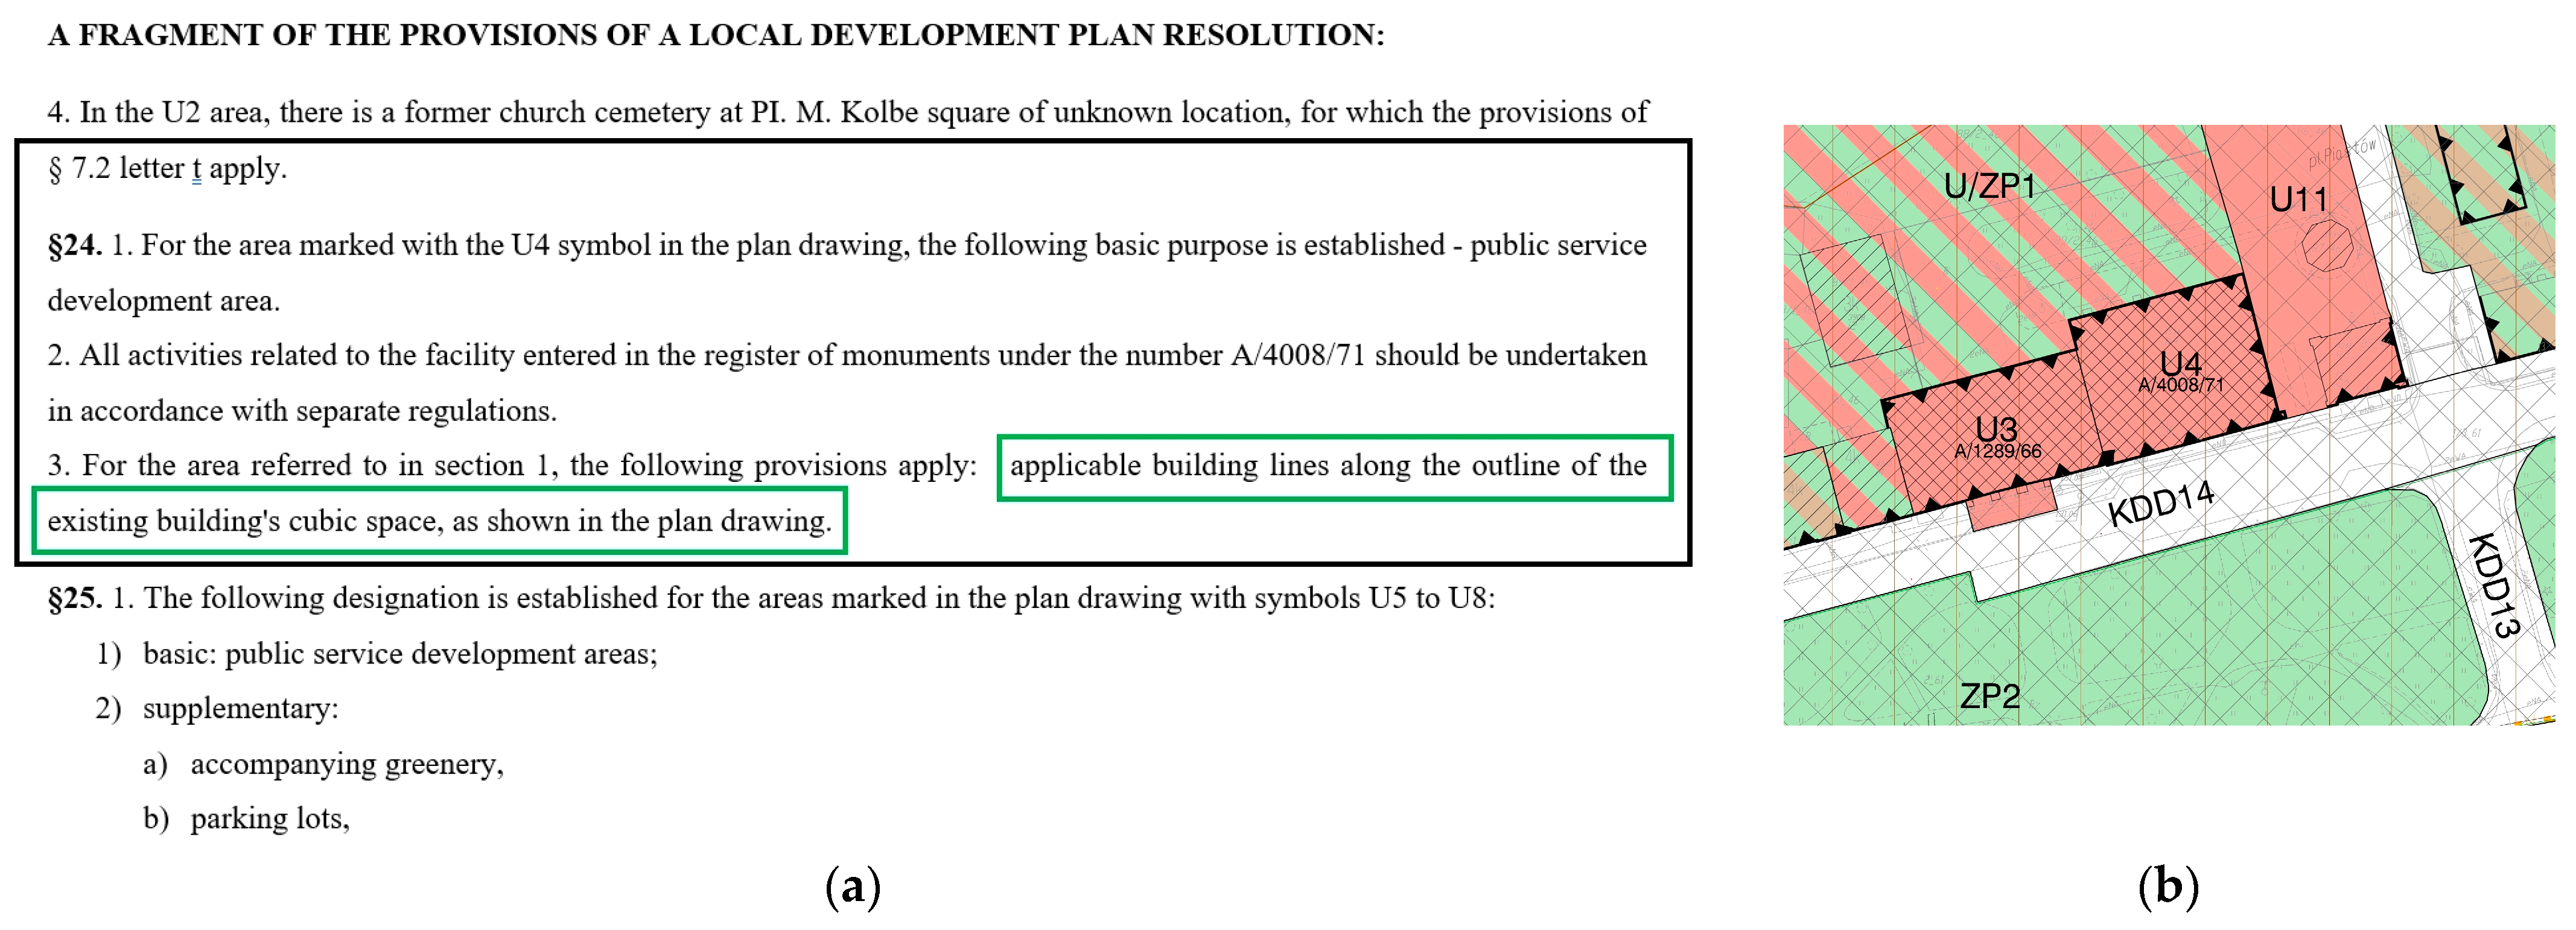
3. Problems and Inaccuracies in Planning Provisions
4. Analysis of Selected Urban Indicators
4.1. The Area of Research and Research Method
- multi-family housing (MW);
- detached, semi-detached and terraced houses (MN);
- trade services (U), public services (U), sports, and recreation services (US);
- industrial (P), and industrial and service (PU) buildings.
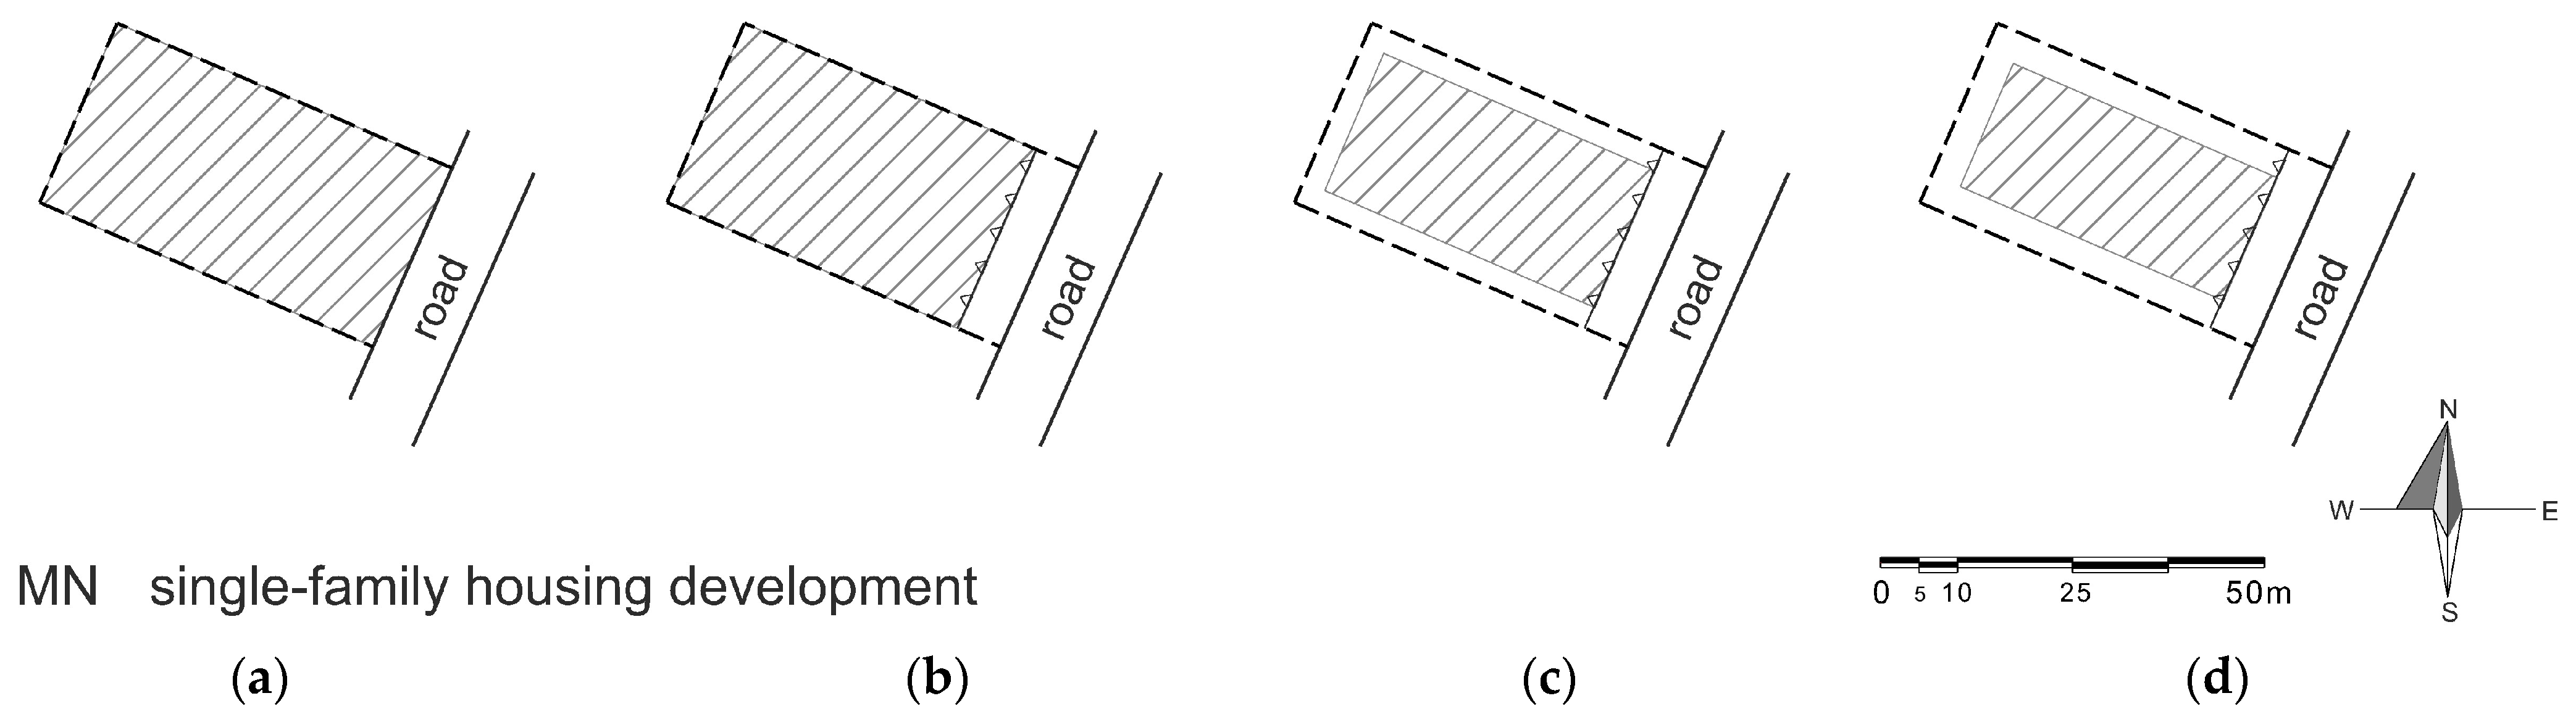
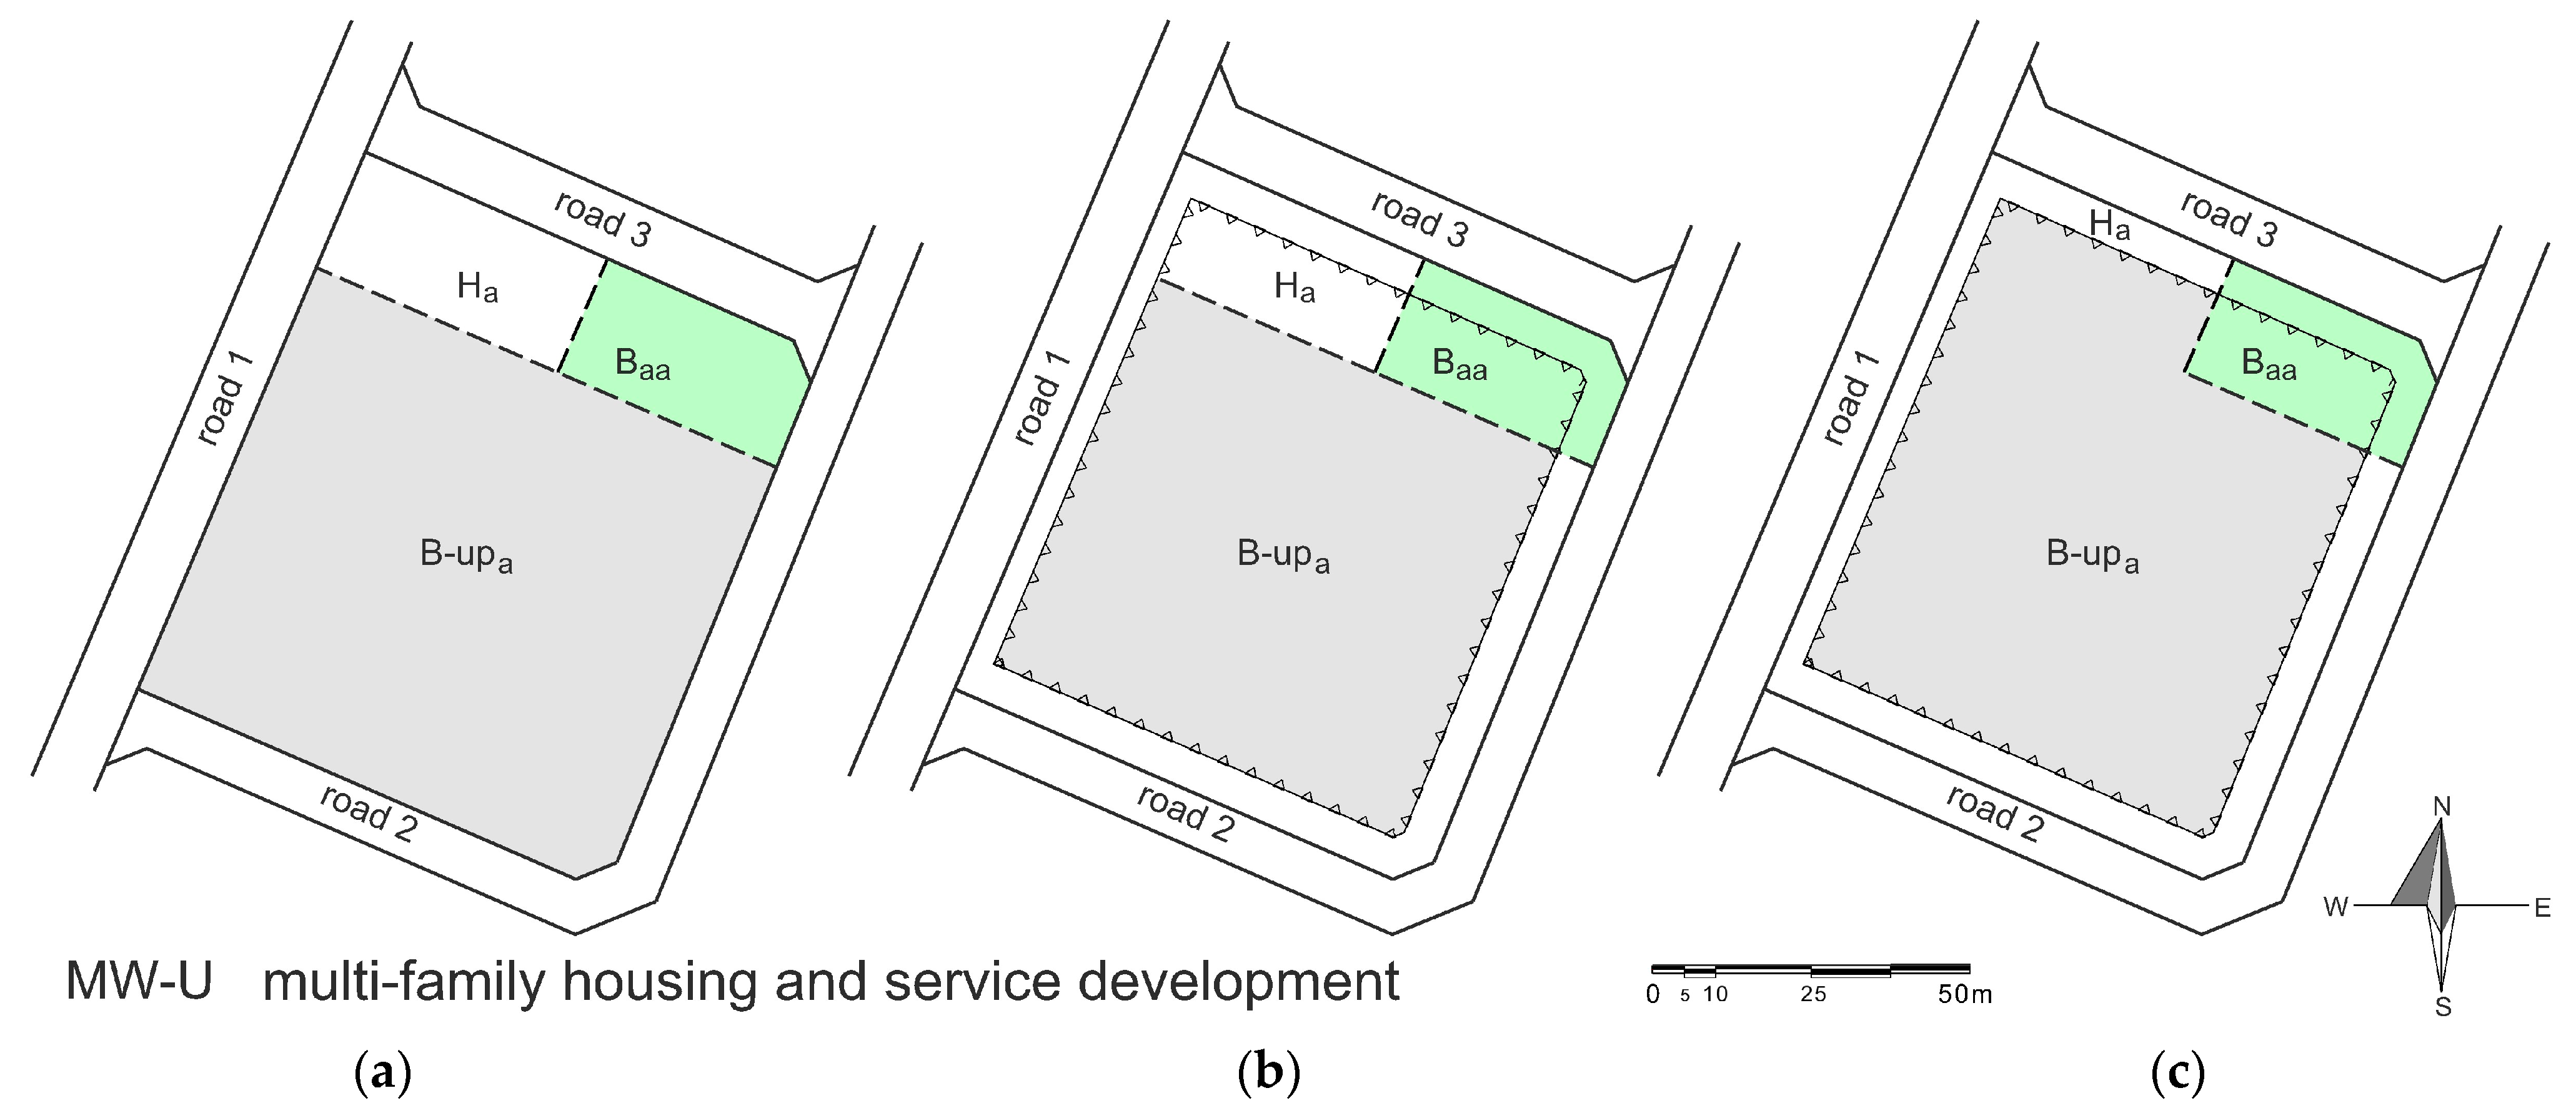
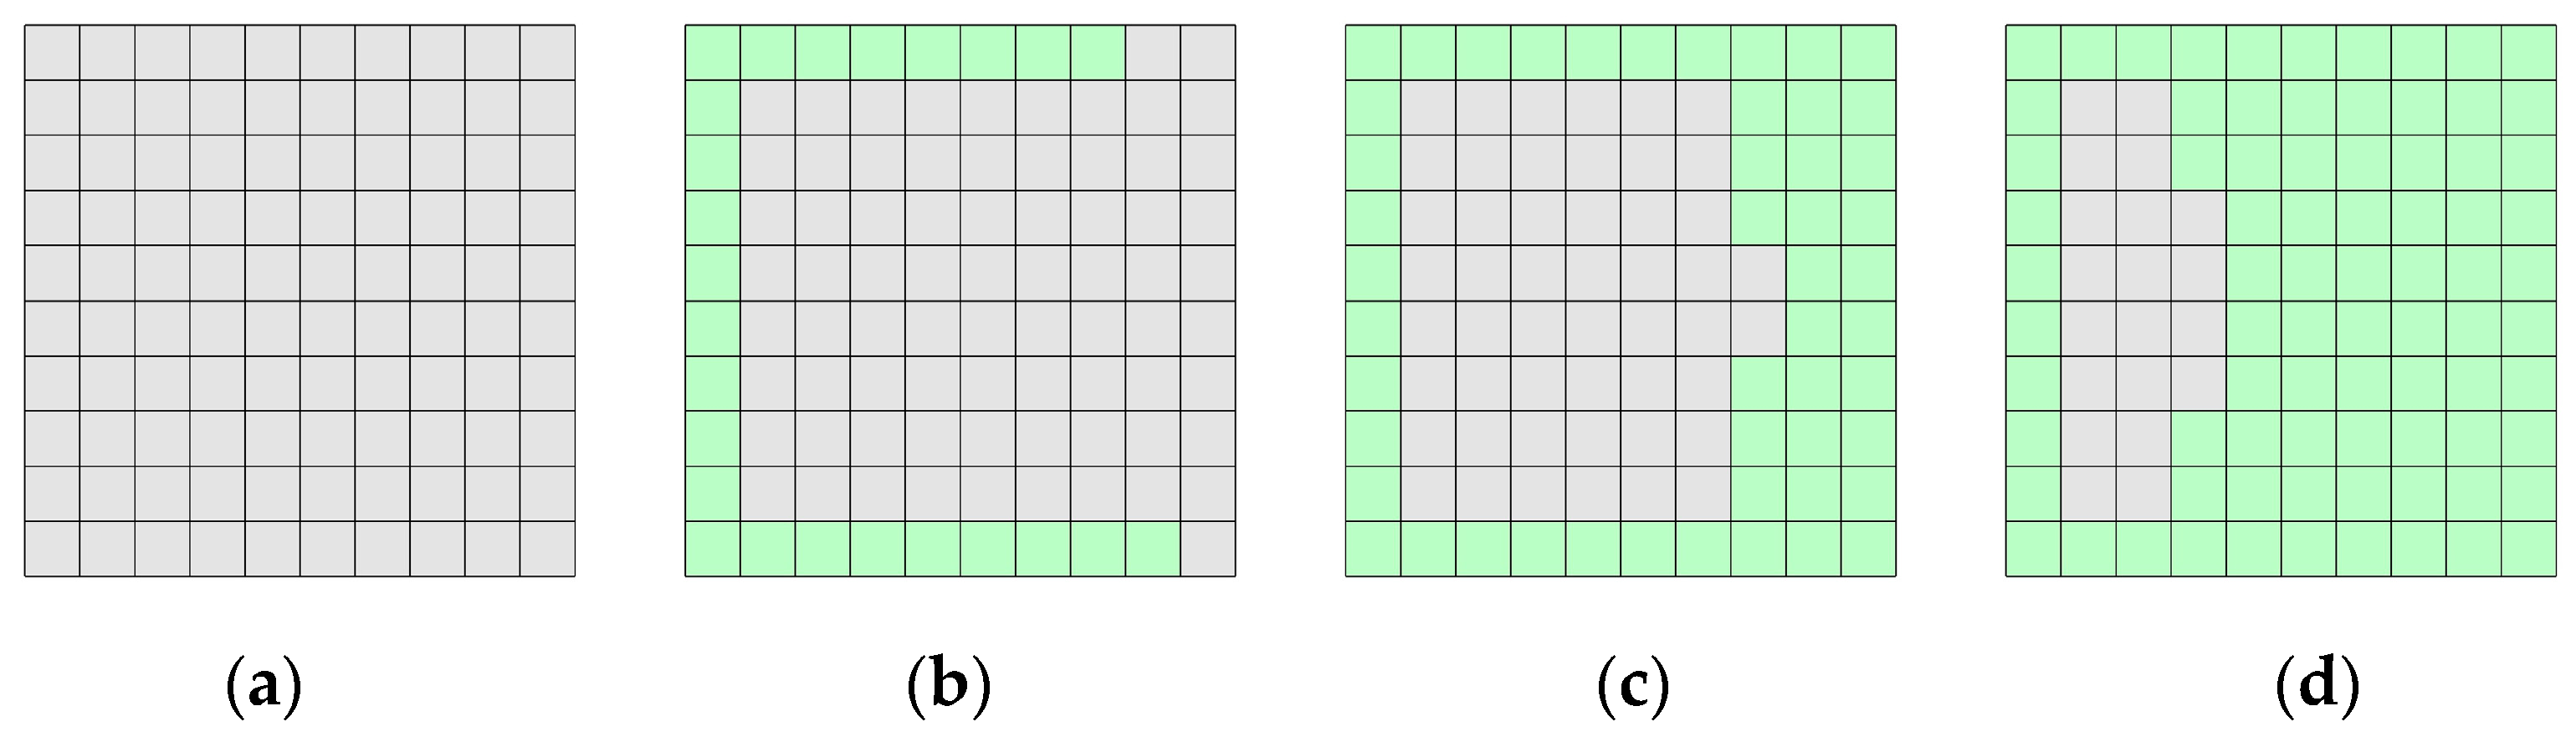
- the total area of the plot (Figure 4a);
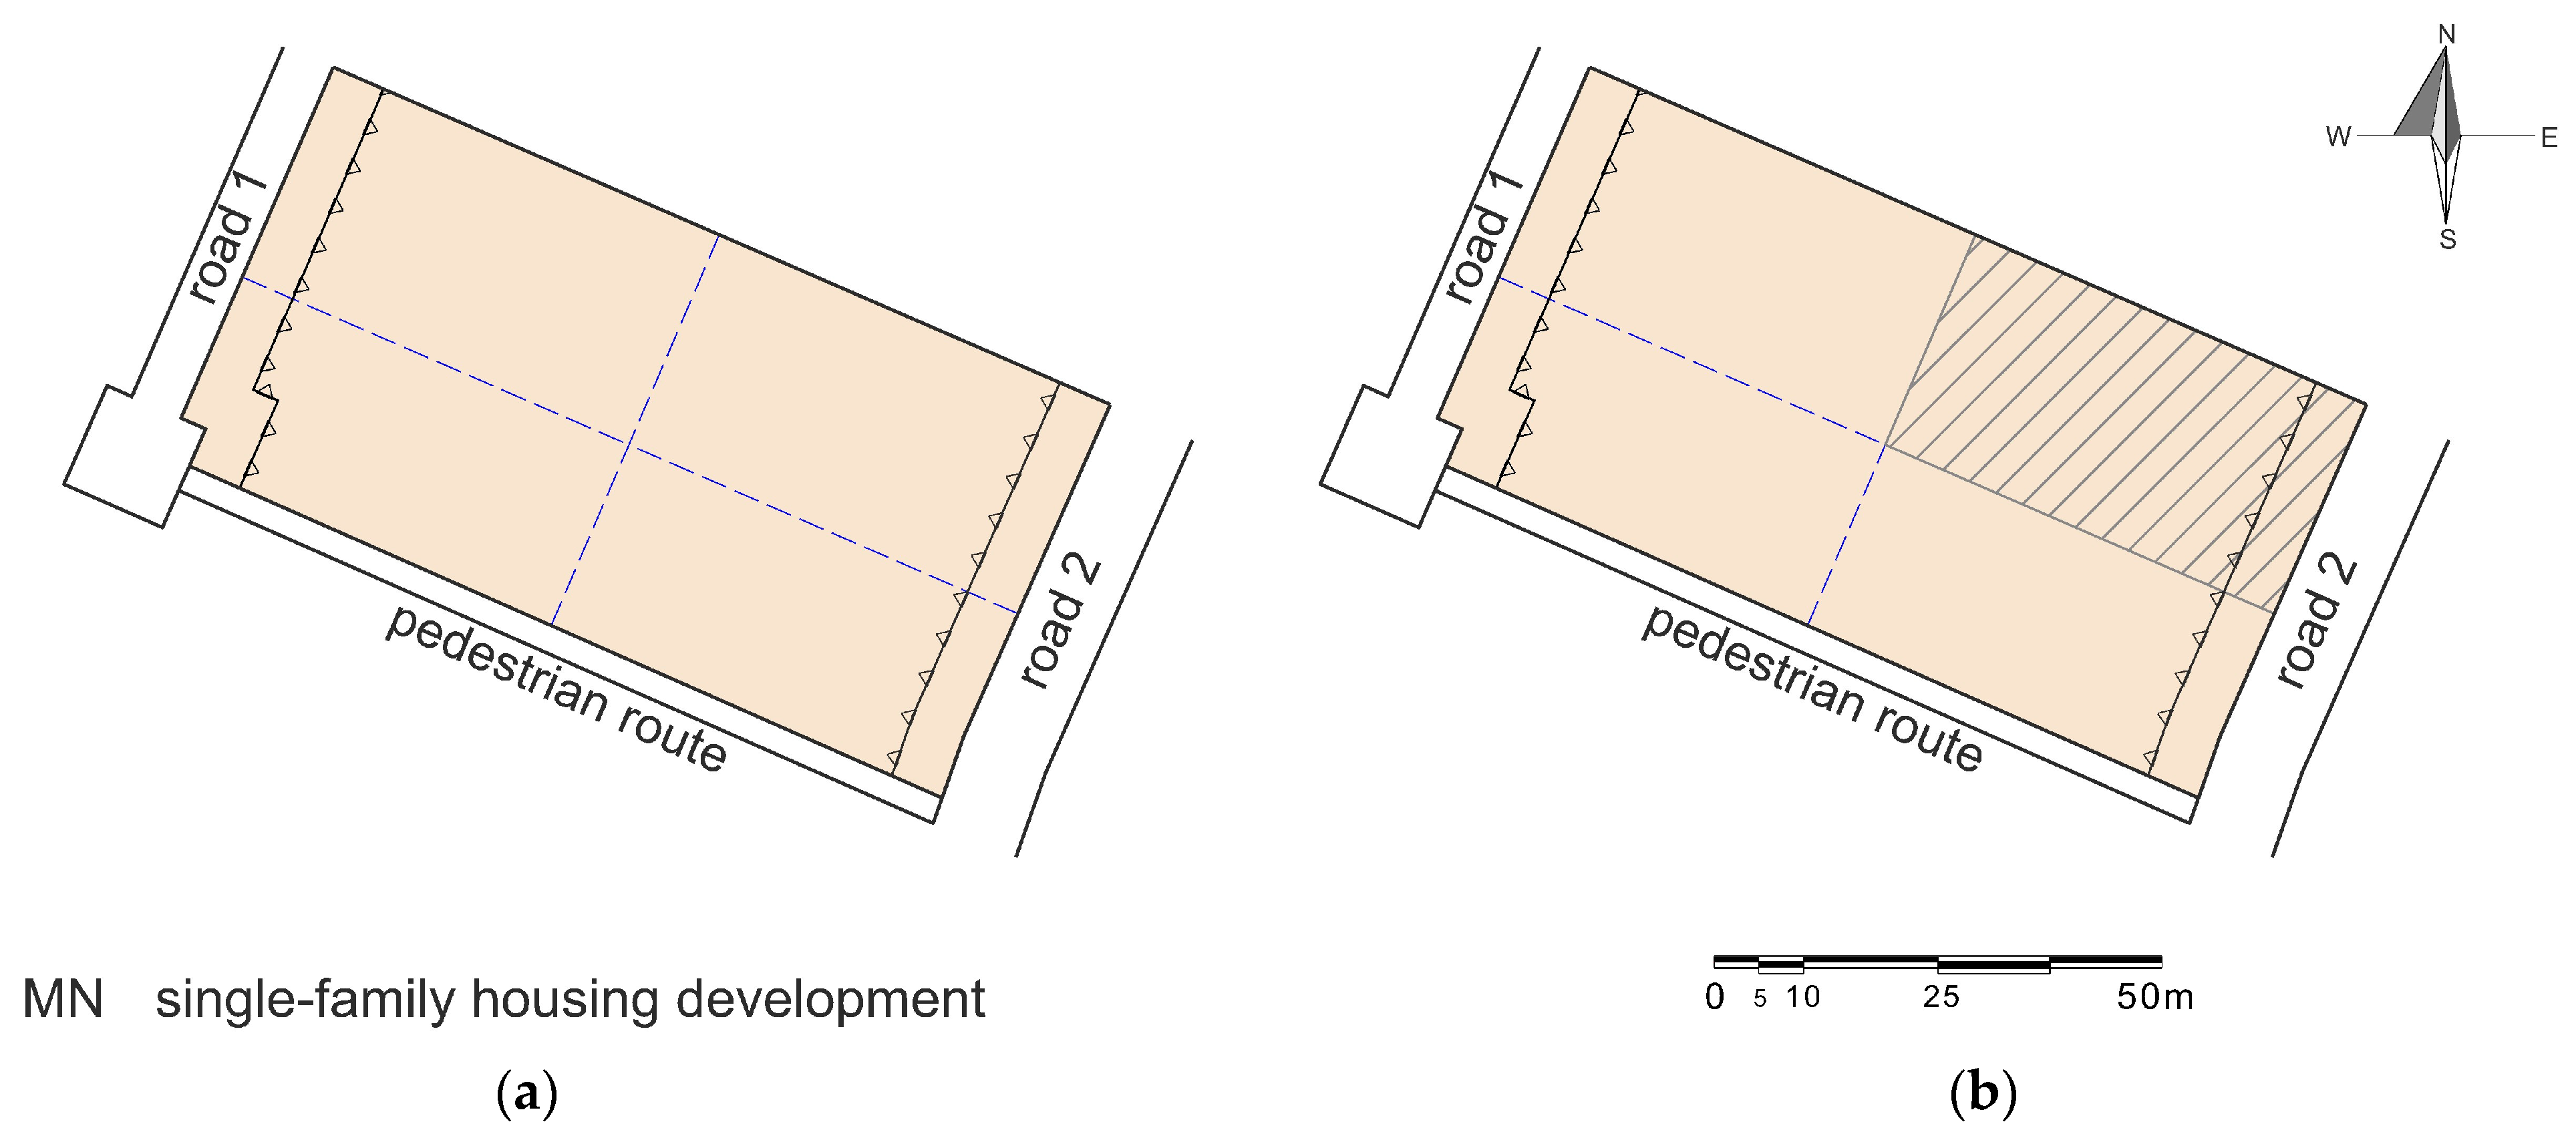
- the area of land intended for potential development, taking into account the indicated building line (for the sake of simplicity and uniformity, defined only on the side of the road) (Figure 4b);
- the area of land intended for potential development, taking into account both the indicated building line and the provisions of the construction law, assuming that the distance between the building and the plot boundary is required at the level of 3 m because there are no windows and doors (Figure 4c);
- the area of land intended for potential development, taking into account both the indicated building line and the provisions of the construction law, assuming that the distance between the building and the plot boundary is required at the level of 4 m because there are windows and doors on all walls of the building (Figure 4d).
4.2. Research Course and Results
4.2.1. The First Stage of Research
4.2.2. The Second Stage of Research
- taking into account the total area of the plot—without additional arrangements (WAAA);
- taking into account the building line (BL);
- taking into account building lines and building regulations (BL + CLAR) at the same time.
5. Final Conclusions and Summary
Funding
Data Availability Statement
Conflicts of Interest
References
- Marszałek Sejmu. Ustawa z Dnia 27 Marca 2003 r. o Planowaniu i Zagospodarowaniu Przestrzennym, Unified Text: Dz.U. 2023 poz. 977; Marszałek Sejmu: Warsaw, Poland, 2023. [Google Scholar]
- Bertuglia, C.S.; Ciarkę, G.P.; Wilson, A.G. (Eds.) Models and performance indicators in urban planning: The changing policy context. Modelling the city. In Performance, Policy and Planning; Routledge: London, UK; New York, NY, USA, 1994; p. 21. [Google Scholar]
- Andrzejewska, A. Challenges of spatial planning in Poland in the context of global climate change—Selected issues. Buildings 2021, 11, 596. [Google Scholar] [CrossRef]
- European Commission. The New European Bauhaus Comes to Cities. Available online: https://poland.representation.ec.europa.eu/news/nowy-europejski-bauhaus-wchodzi-do-miast-2022-11-18_pl (accessed on 23 September 2023).
- Nellemann, C.; Corcoran, E. (Eds.) Dead Planet, Living Planet—Biodiversity and ecosystem restoration for sustainable development. In A Rapid Response Assessment; UNEP, GRID-Arendal: Nairobi, Kenya, 2010; p. 6. [Google Scholar]
- SELF-PORTRAIT. A Letter about Good Space. Politics and Urban Planning. Available online: https://www.autoportret.pl/artykuly/polityka-i-urbanistyka/ (accessed on 26 October 2023).
- The Harvard Gazette; Naturalist, E.O. Wilson Is Optimistic. Available online: https://news.harvard.edu/gazette/story/2006/06/naturalist-e-o-wilson-is-optimistic/ (accessed on 26 October 2023).
- Liao, L.; Du, M.; Chen, Z. Environmental pollution and socioeconomic health inequality: Evidence from China. Sustain. Cities Soc. 2023, 95, 104579. [Google Scholar] [CrossRef]
- Wagner, I.; Krauze, K.; Zalewski, M. Błękitne aspekty zielonej infrastruktury. In Zrównoważony Rozwój—Zastosowania; Katedra Ekologii Stosowanej, Uniwersytet Łódzki; Europejskie Regionalne Centrum Ekohydrologii Pod Auspicjami UNESCO, PAN: Łódź, Poland, 2013; pp. 145–155. [Google Scholar]
- New European Bauhaus—Ministry of Culture and National Heritage—Portal Gov.pl. Available online: https://www.gov.pl/web/kultura/nowy-europejski-bauhaus (accessed on 27 July 2023).
- European Commission. The European Green Deal. Available online: https://commission.europa.eu/strategy-and-policy/priorities-2019-2024/european-green-deal_en (accessed on 29 August 2023).
- Ministerstwo Rozwoju i Technologii. Rozporządzenie Ministra Rozwoju i Technologii z Dnia 17 Grudnia 2021 r. w Sprawie Wymaganego Zakresu Projektu Miejscowego Planu Zagospodarowania Przestrzennego. In Legal Text Announced: Dz.U. 2021 poz. 2404; Ministerstwo Rozwoju i Technologii: Warsaw, Poland, 2021. [Google Scholar]
- Marszałek Sejmu. Ustawa z Dnia 27 Marca 2003 r. o Planowaniu i Zagospodarowaniu Przestrzennym, Unified text: Dz.U. 2022 poz. 503 ze zm.; Marszałek Sejmu: Warsaw, Poland, 2022.
- Ministerstwo Infrastruktury. Rozporządzenie Ministra Infrastruktury z Dnia 26 Sierpnia 2003 r. w Sprawie Wymaganego Zakresu Projektu Miejscowego Planu Zagospodarowania Przestrzennego, Legal text announced: Dz.U. 2003 nr 164 poz. 1587; Ministerstwo Infrastruktury: Warsaw, Poland, 2003.
- Marszałek Sejmu. Ustawa z Dnia 7 Lipca 2023 r. o Zmianie Ustawy o Planowaniu i Zagospodarowaniu Przestrzennym oraz Niektórych Innych Ustaw, Unified text: Dz.U. 2023 r. poz. 1688; Marszałek Sejmu: Warsaw, Poland, 2023. [Google Scholar]
- Polska Norma Number: PN-ISO 9836:1997; Właściwości Użytkowe w Budownictwie—Określanie i Obliczanie Wskaźników Powierzchniowych i Kubaturowych. Polski Komitet Normalizacyjny: Warsaw, Poland, 1997.
- Ministerstwo Infrastruktury. Rozporządzenie Ministra Infrastruktury z Dnia 12 Kwietnia 2002 r. w Sprawie Warunków Technicznych, Jakim Powinny Odpowiadać Budynki i Ich Usytuowanie, Dz.U. 2002 nr 75 poz. 690; Ministerstwo Infrastruktury: Warsaw, Poland, 2002.
- Ministerstwo Infrastruktury. Rozporządzenie Ministra Infrastruktury z Dnia 12 Kwietnia 2002 r. w Sprawie Warunków Technicznych, Jakim Powinny Odpowiadać Budynki i ich Usytuowanie, Dz.U. 2022 poz. 1225; Ministerstwo Infrastruktury: Warsaw, Poland, 2022.
- PAN (Polish Academy of Sciences). Komitet Przestrzennego Zagospodarowania Kraju. Chaos Przestrzenny. Stanowisko Prezydium Polskiej Akademii Nauk z Dnia 20 Listopada 2018 r. w Sprawie Uwzględnienia w Polityce Rozwoju i Przepisach Prawa Wyników Badań Naukowych Dotyczących Potrzeb Kształtowania Przestrzennego Rozwoju Polski. Available online: https://kpzk.pan.pl/index.php?option=com_content&view=article&id=168&Itemid=177&lang=pl (accessed on 3 July 2023).
- New Urban Agenda. Quito Declaration on Sustainable Cities and Human Settlements for All. un. Habitat III. Quito 2016. Available online: https://habitat3.org/wp-content/uploads/NUA-English.pdf (accessed on 26 December 2023).
- Grover, H. Local Response to Global Climate Change: The Role of Local Development Plans in Climate Change Management. Ph.D. Thesis, Texas A&M University, College Station, TX, USA, 2010; p. 5. Available online: http://oaktrust.library.tamu.edu/bitstream/handle/1969.1/ETD-TAMU-2010-08-8461/GROVER-DISSERTATION.pdf?sequence=3 (accessed on 23 September 2023).
- World Health Organization (WHO). United Nations Human Settlements Programme—Headquarters. Review of Indicator Frameworks Supporting Urban Planning for Resilience and Health. Third Report on Protecting Environments and Health by Building Urban Resilience. 2022. Available online: https://www.who.int/europe/publications/i/item/WHO-10665-355763 (accessed on 7 December 2023).
- Szulczewska, B.; Giedych, R.; Borowski, J.; Kuchcik, M.; Sikorski, P.; Mazurkiewicz, A.; Stańczyk, T. How much green is needed for a vital neighbourhood? In Search for Empirical Evidence, Land Use Policy; Elsevier: Kraków, Poland, 2014; Volume 38, pp. 330–345. ISSN 0264-8377. [Google Scholar]
- Jopek, D. Water in the city. The development of permeable surfaces in urban areas, VI International Conference of Science and Technology INFRAEKO 2018 Modern Cities. In Infrastructure and Environment; Słyś, D., Dziopk, J., Eds.; EDP Sciences: Krakow, Poland, 2018; pp. 1–8. [Google Scholar]
- Official Journal of the Lower Silesian Voivodeship. Available online: https://edzienniki.duw.pl/actbymonths (accessed on 23 June 2023).
- European Commission. Communication from the Commission to the European Parliament, the Council, the European Economic and Social Committee and the Committee of the Regions. In Green Infrastructure (GI)—Enhancing Europe’s Natural Capitaly; European Commission: Brussels, Belgium, 2013; pp. 2–3. [Google Scholar]
- Andrzejewska, A. Modern masters of urban planning as precursors of the contemporary trend of “green infrastructure” and “urban garden” in the context of ongoing spatial processes. Architectus 2019, 4, 54–55+63. [Google Scholar] [CrossRef]
- Official Journal of the Greater Poland Voivodeship. Available online: http://edziennik.poznan.uw.gov.pl/actbymonths (accessed on 24 June 2023).
- Wroclaw Spatial Information System. Local Plans. Available online: https://gis.um.wroc.pl/imap/?gpmap=gp7 (accessed on 23 June 2023).
- European Union. New European Bauhaus. Available online: https://new-european-bauhaus.europa.eu/about/about-initiative_en (accessed on 27 July 2023).
- United Nations Human Settlements Programme. Urban Indicators. Guidelines Monitoring the Habitat Agenda and the Millennium Development Goals. 2004. Available online: https://unhabitat.org/urban-indicators-guidelines-monitoring-the-habitat-agenda-and-the-millennium-development-goals (accessed on 10 December 2023).


| No. | Destiny of Area | Urban Indicators in the Analyzed the Local Plans (MPZP) | |||||||||||||||||||||||||||||
|---|---|---|---|---|---|---|---|---|---|---|---|---|---|---|---|---|---|---|---|---|---|---|---|---|---|---|---|---|---|---|---|
| Min. Biologically Active Area [min. Baa] in % | Max. Built-Up Area [max. B-upa] in % | ||||||||||||||||||||||||||||||
| 0 | 5 | 10 | 15 | 20 | 25 | 30 | 35 | 40 | 50 | 60 | 70 | 80 | 90 | 0 | 5 | 10 | 20 | 25 | 30 | 35 | 40 | 45 | 50 | 60 | 70 | 80 | 85 | 90 | 100 | ||
| 1 | MN | - | 1× | - | - | - | - | 12× | 3× | 15× | 6× | 6× | - | - | - | - | - | - | 6× | 6× | 15× | 4× | 4× | 1× | 5× | 2× | - | - | - | - | - |
| 2 | MN/U | - | - | - | 2× | - | 4× | 5× | 7× | 5× | 3× | 3× | - | - | - | - | - | - | - | 2× | 6× | 4× | 3× | 1× | 3× | 6× | 1× | - | - | - | - |
| 3 | ML | - | - | - | - | - | - | - | 2× | - | - | - | - | - | - | - | - | - | - | - | 3× | - | - | - | 2× | - | - | - | - | - | - |
| 4 | MN/MW | - | - | 1× | - | - | 1× | 2× | - | - | - | - | - | - | - | - | - | - | - | - | - | - | - | - | 1× | - | - | - | - | - | - |
| 5 | MW | 1× | - | - | - | 3× | 4× | 3× | - | 1× | - | - | - | - | - | - | - | - | - | - | 3× | - | - | 1× | 3× | 2× | 1× | - | - | - | 1× |
| 6 | MW/U | - | - | 2× | - | - | 2× | 3× | - | - | - | - | - | - | - | - | - | - | - | - | - | - | 3× | - | 2× | 2× | - | 1× | - | - | - |
| 7 | MW/ZP | - | - | 1× | - | - | 2× | - | - | 1× | 1× | 1× | - | - | - | - | - | - | - | - | 2× | - | - | - | 1× | 1× | 1× | - | - | - | |
| 8 | RM | - | - | - | - | - | 1× | 4× | - | 6× | 1× | - | - | - | - | - | - | - | - | - | 4× | - | - | - | 3× | 5× | - | - | - | - | - |
| 9 | RU | - | - | - | - | - | - | 4× | - | - | - | - | - | - | - | - | - | - | - | - | - | - | - | 1× | 3× | - | - | - | - | - | |
| 10 | U | 1× | 12× | 3× | 5× | 6× | 10× | 2× | 1× | 1× | - | - | - | - | - | - | 1× | 6× | 5× | - | 6× | - | 10× | 5× | 5× | 1× | 1× | 2× | |||
| 11 | US | - | - | 2× | - | - | - | 1× | - | 2× | 2× | 3× | - | - | 1× | 1× | - | 4× | - | 1× | 1× | - | 1× | - | - | 1× | - | - | - | - | - |
| 12 | P | 1× | - | - | - | - | - | - | - | - | - | - | - | - | - | - | - | - | - | - | - | - | - | - | - | - | - | - | - | 1× | - |
| 13 | P/U | - | 1× | 6× | 1× | 1× | 4× | - | - | - | - | - | - | - | - | - | - | - | - | - | - | - | 1× | - | - | 3× | 3× | 6× | - | - | - |
| 14 | Z | - | - | - | - | - | - | - | - | - | 1× | 1× | - | 1× | 1× | 1× | 1× | - | - | 1× | 1× | - | - | - | - | - | - | - | - | - | - |
| 15 | U/Z | - | - | - | - | - | - | 2× | 1× | - | - | 1× | - | - | - | - | - | - | - | 1× | - | 2× | - | - | - | - | - | - | - | - | |
| SUM | 3× | 2× | 24× | 6× | 9× | 24× | 46× | 14× | 31× | 15× | 15× | 1× | 1× | 2× | 2× | 1× | 4× | 7× | 16× | 41× | 8× | 20× | 4× | 30× | 30× | 10× | 9× | 1× | 1× | 3× | |
| 193× | 187× | ||||||||||||||||||||||||||||||
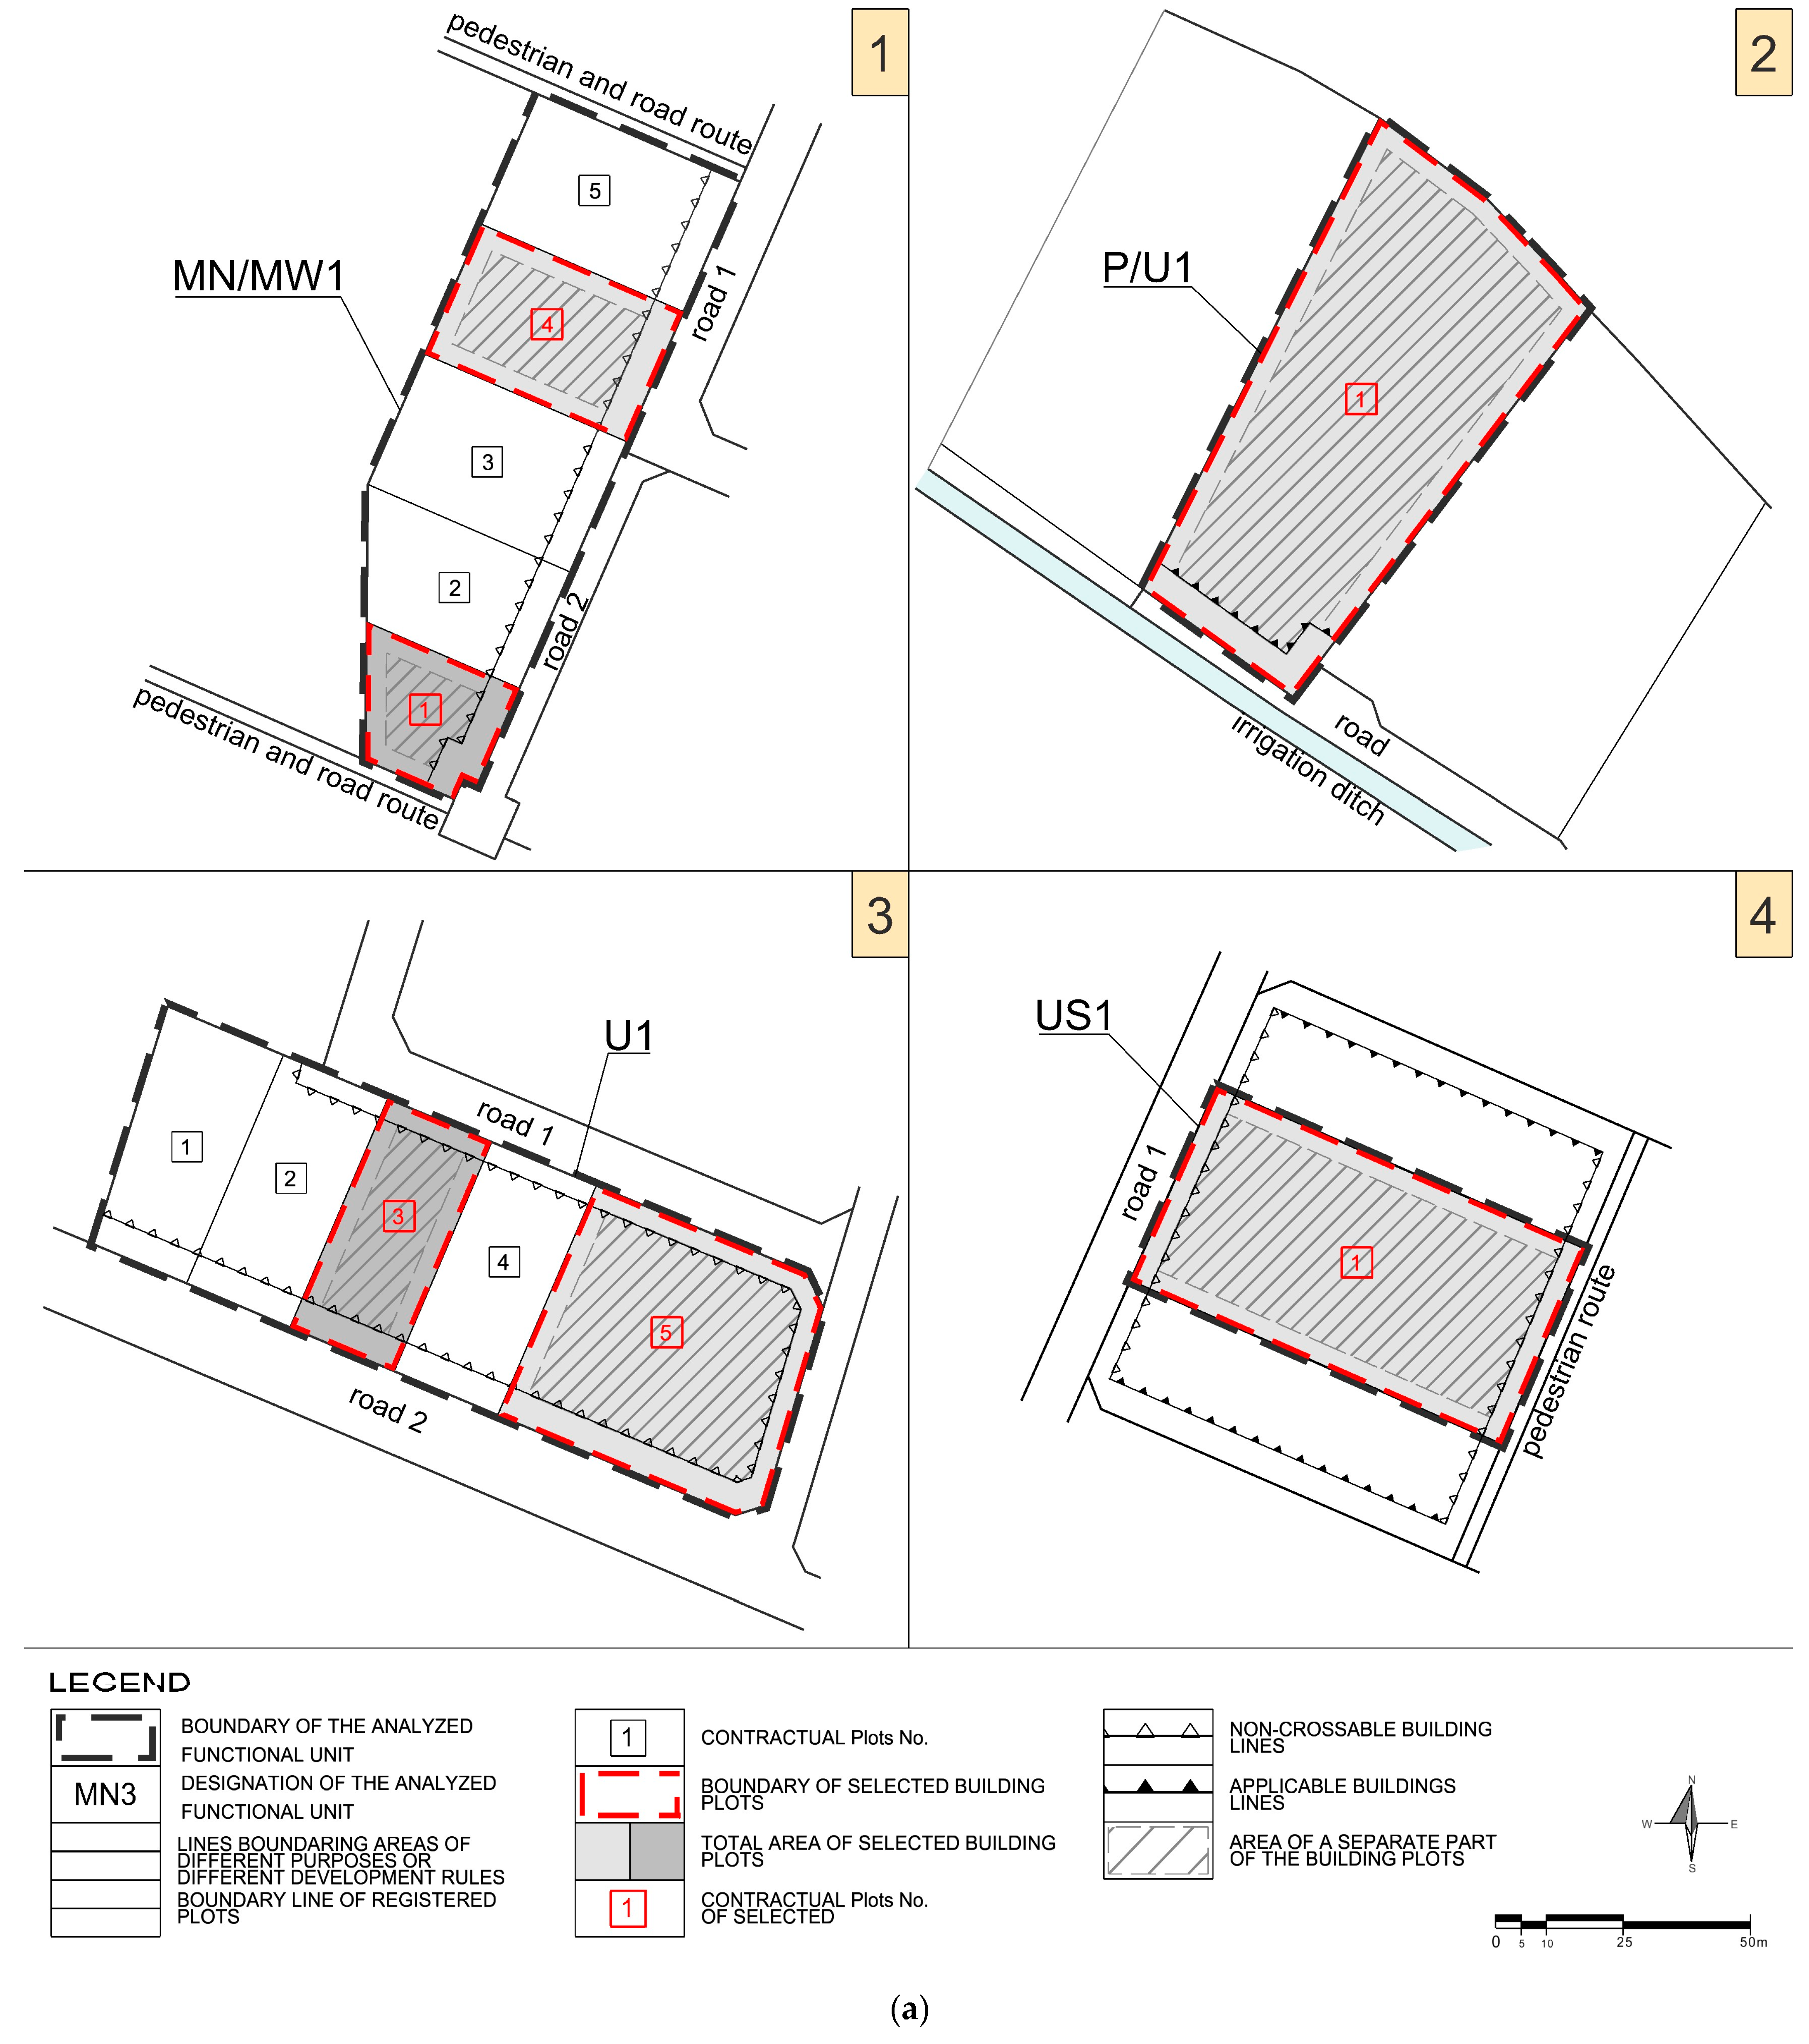
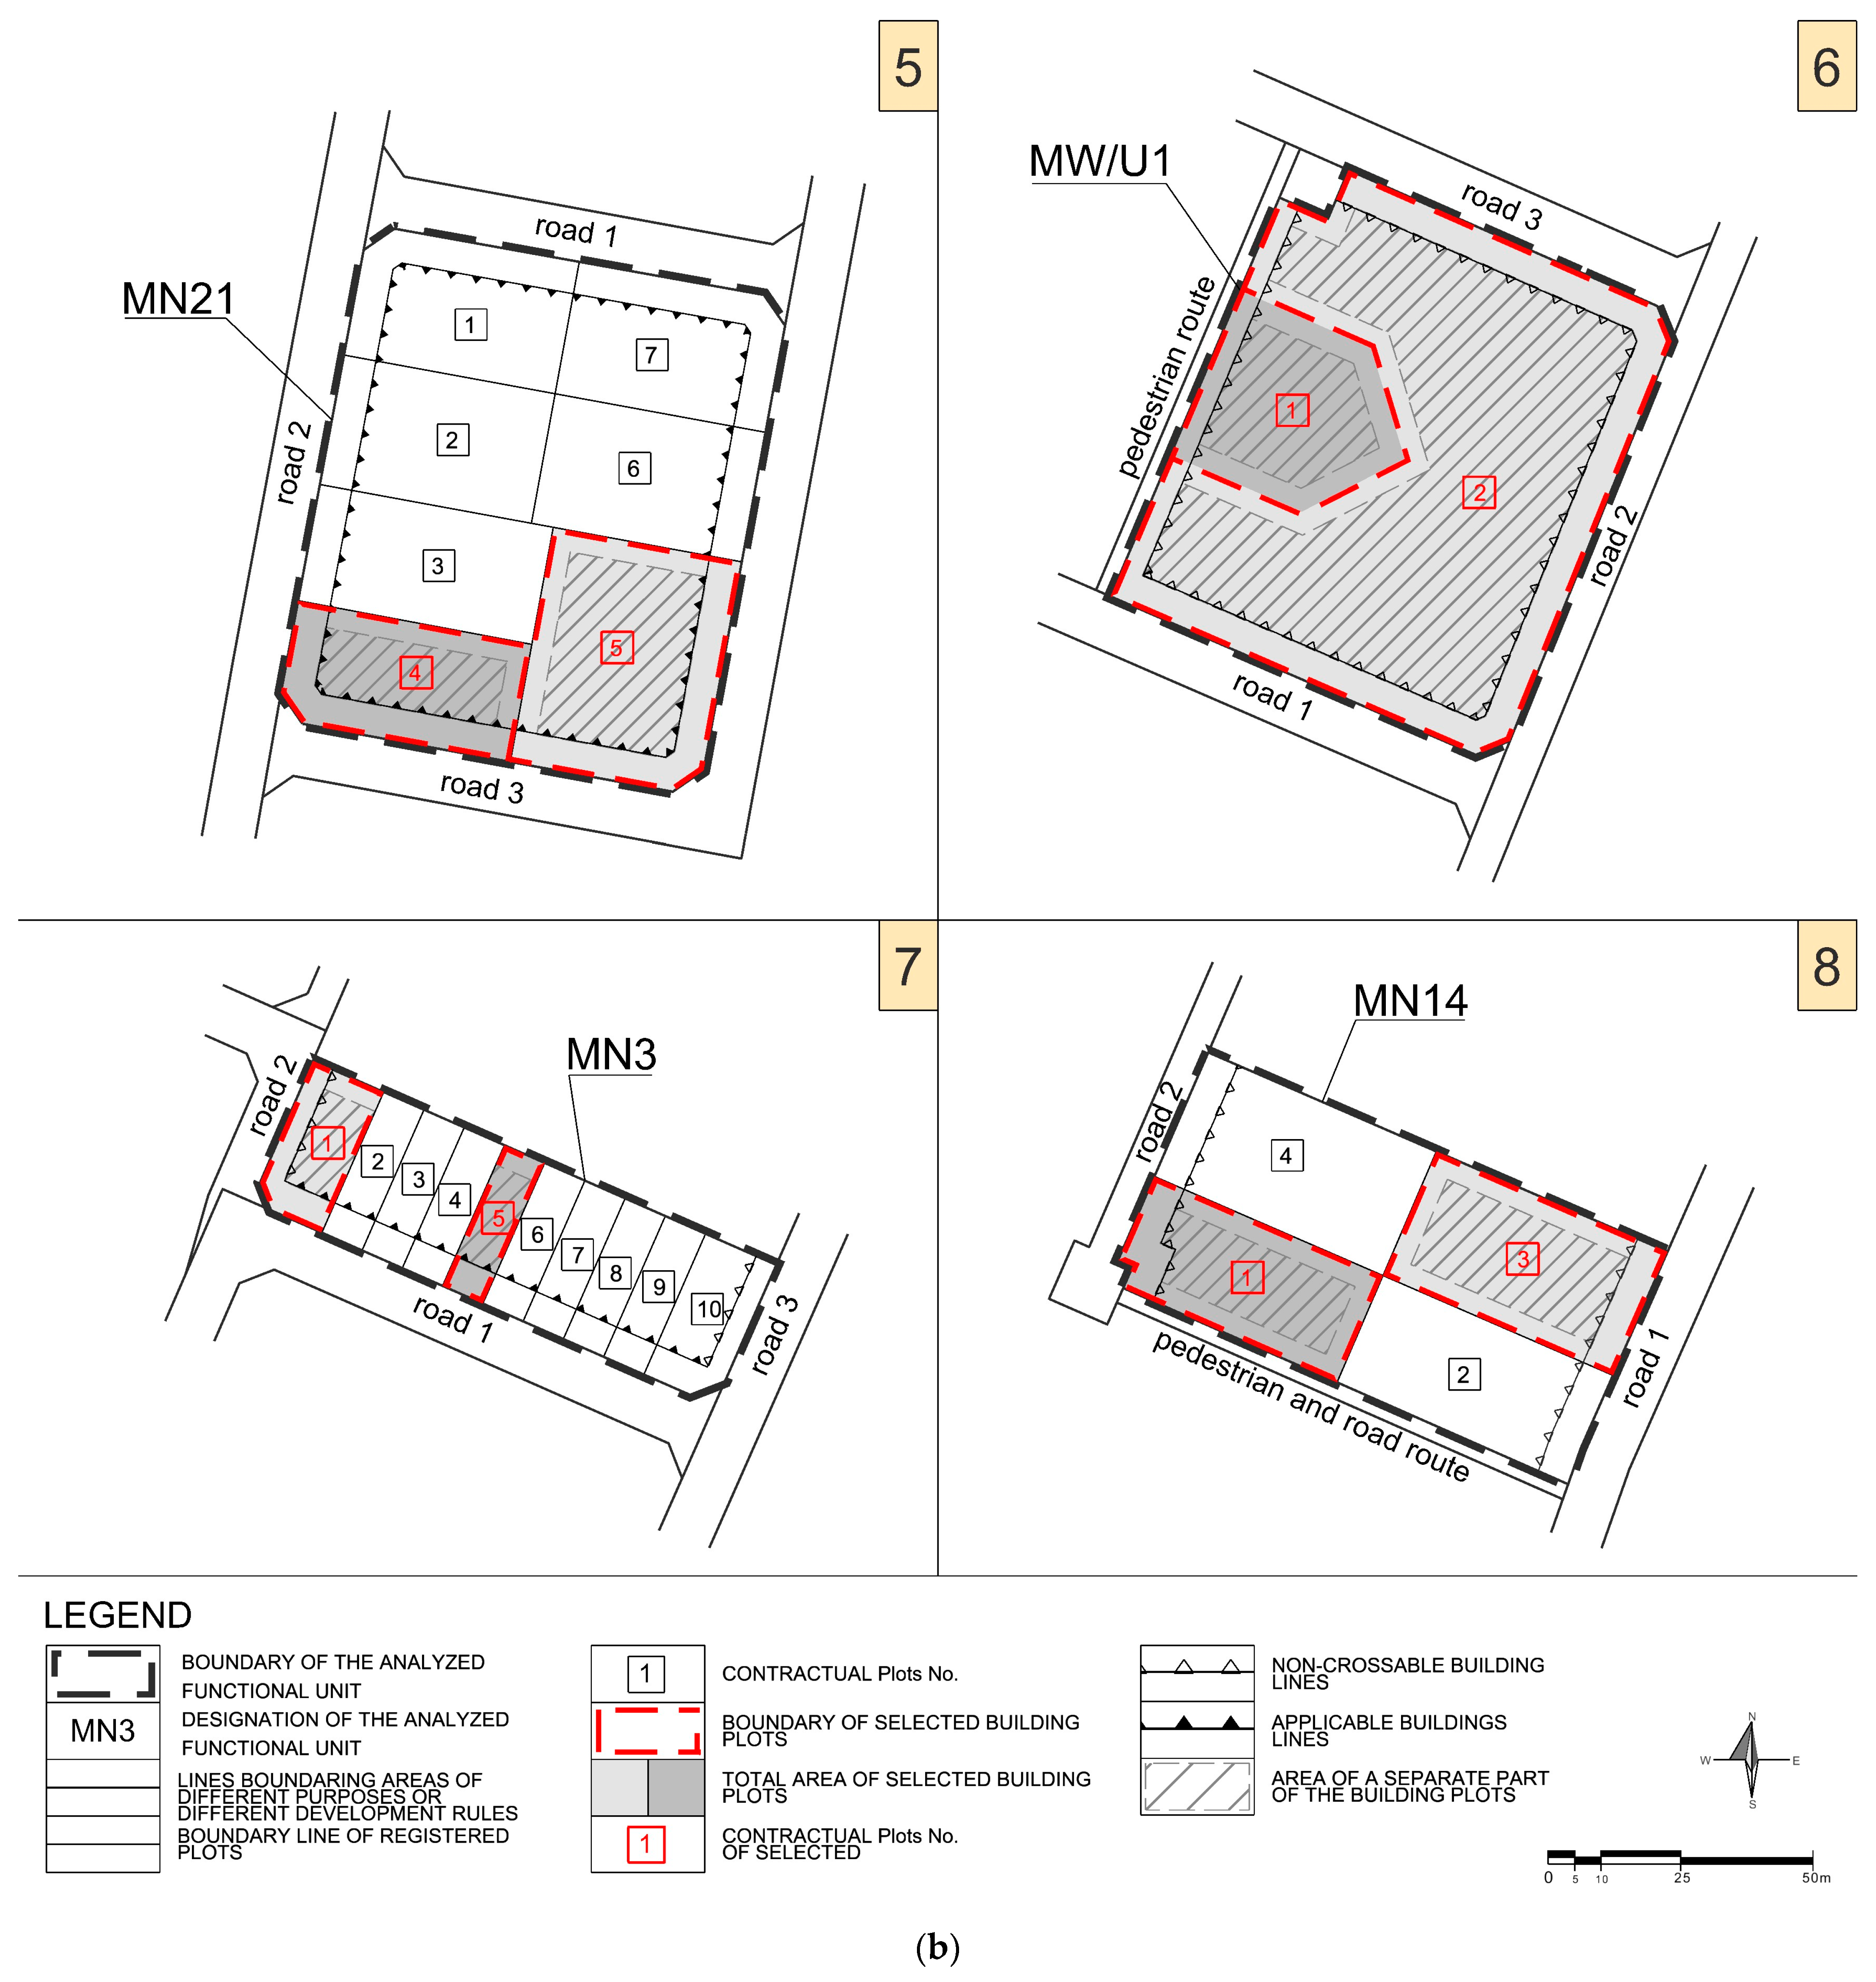
| No. | Function (Purpose of Area) | Plot No. (According to Figure 6) | Conditions resulting from Planning and Legal Provisions | Plot Size (m2, ha) | Values of Urban Indicators in the Local Development Plan | |||
|---|---|---|---|---|---|---|---|---|
| Min. Biologically Active Area [min. Baa] | Max. Built-up Area [max. B-upa] | |||||||
| (%) | (m2; ha) | (%) | (m2; ha) | |||||
| 1 | MN/MW1 | 1 | WAAA | 674.05; 0.0674 | 10 | 67.41; 0.0067 | 50 | 337.03; 0.0337 |
| BL | 505.28; 0.0505 | - | 252.64; 0.0253 | |||||
| BL + CLAR | 272.06; 0.0272 | - | 136.03; 0.0136 | |||||
| 4 | WAAA | 1206.60; 0.1207 | 120.66; 0.0121 | 603.30; 0.0603 | ||||
| BL | 1039.17; 0.1039 | - | 519.59; 0.0520 | |||||
| BL + CLAR | 661.76; 0.06617 | - | 330.88; 0.0331 | |||||
| 2 | P/U1 | 1 | WAAA | 4575.01; 0.4575 | 20 | 915.00; 0.0915 | 60 | 2745.00; 0.2745 |
| BL | 4307.54; 0.4307 | - | 2584.52; 0.2584 | |||||
| BL + CLAR | 3398.26; 0.3398 | - | 2038.95; 0.2038 | |||||
| 3 | U1 | 3 | WAAA | 1085.87; 0.1085 | 10 | 108.58; 0.0108 | 50 | 542.93; 0.0542 |
| BL | 864.33; 0.0864 | - | 432.16; 0.0432 | |||||
| BL + CLAR | 552.21; 0.0552 | - | 276.10; 0.0276 | |||||
| 5 | WAAA | 2573.50; 0.2573 | 257.35; 0.0257 | 1286.75; 0.1286 | ||||
| BL | 1898.92; 0.1898 | - | 949.46; 0.0949 | |||||
| BL + CLAR | 1742.30; 0.1742 | - | 871.15; 0.0871 | |||||
| 4 | US1 | 1 | WAAA | 3316.64; 0.3317 | 0 | - | 90 | 2984.98; 0.2985 |
| BL | 2982.16; 0.2982 | - | 2683.94; 0.2684 | |||||
| BL + CLAR | 2411.74; 0.2412 | - | 2170.56; 0.2171 | |||||
| 5 | MN21 (b) | 4 | WAAA | 1003.43; 0.1003 | 60 | 602.05; 0.6020 | 30 | 301.03; 0.0301 |
| BL | 645.11; 0.0645 | - | 193.53; 0.0193 | |||||
| BL + CLAR | 439.39; 0.0439 | - | 131.81; 0.0131 | |||||
| 5 | WAAA | 1615.62; 0.1615 | 969.37; 0.0969 | 484.68; 0.0484 | ||||
| BL | 1175.95; 0.1175 | - | 353.78; 0.0352 | |||||
| BL + CLAR | 915.26; 0.0915 | - | 274.57; 0.0274 | |||||
| 6 | MW/U1 | 1 | WAAA | 1142.46; 0.1143 | 10 | 114.25; 0.0114 | 80 | 913.97; 0.0913 |
| BL | 1007.64; 0.1008 | - | 806.112; 0.0806 | |||||
| BL + CLAR | 677.25; 0.0677 | - | 541.80; 0.0542 | |||||
| 2 | WAAA | 5997.43; 0.5997 | 599.74; 0.0059 | 4797.94; 0.4798 | ||||
| BL | 4483.68; 0.4484 | - | 3586.94; 0.3587 | |||||
| BL + CLAR | 4040.32; 0.4040 | - | 3232.26; 0.3232 | |||||
| 7 | MN3 (sz) | 1 | WAAA | 413.27; 0.0413 | 30 | 123.98; 0.0124 | 60 | 247.96; 0.0248 |
| BL | 242.49; 0.0242 | - | 145.49; 0.0146 | |||||
| BL + CLAR | 200.13; 0.0200 | - | 120.08; 0.0120 | |||||
| 5 | WAAA | 240.69; 0.0241 | 72.207; 0.0072 | 144.41; 0.0144 | ||||
| BL | 190.89; 0.0191 | - | 114.53; 0.0115 | |||||
| BL + CLAR | 157.66; 0.0158 | - | 94.60; 0.0095 | |||||
| 8 | MN14 (w) | 1 | WAAA | 1012.12; 0.1012 | 50 | 506.06; 0.0506 | 40 | 404.85; 0.0405 |
| BL | 864.00; 0.0864 | - | 345.60; 0.0345 | |||||
| BL + CLAR | 491.75; 0.0492 | - | 196.70; 0.0197 | |||||
| 3 | WAAA | 1209.43; 0.1209 | 604.72; 0.0605 | 483.77; 0.0484 | ||||
| BL | 1056.48; 0.1056 | - | 422.59; 0.0423 | |||||
| BL + CLAR | 655.00; 0.0655 | - | 262.00; 0.0262 | |||||
Disclaimer/Publisher’s Note: The statements, opinions and data contained in all publications are solely those of the individual author(s) and contributor(s) and not of MDPI and/or the editor(s). MDPI and/or the editor(s) disclaim responsibility for any injury to people or property resulting from any ideas, methods, instructions or products referred to in the content. |
© 2023 by the author. Licensee MDPI, Basel, Switzerland. This article is an open access article distributed under the terms and conditions of the Creative Commons Attribution (CC BY) license (https://creativecommons.org/licenses/by/4.0/).
Share and Cite
Andrzejewska, A.K. Determining Urban Indicators in Local Plans—As One of the Sustainable Assumptions of the New European Bauhaus? Buildings 2024, 14, 100. https://doi.org/10.3390/buildings14010100
Andrzejewska AK. Determining Urban Indicators in Local Plans—As One of the Sustainable Assumptions of the New European Bauhaus? Buildings. 2024; 14(1):100. https://doi.org/10.3390/buildings14010100
Chicago/Turabian StyleAndrzejewska, Anna Katarzyna. 2024. "Determining Urban Indicators in Local Plans—As One of the Sustainable Assumptions of the New European Bauhaus?" Buildings 14, no. 1: 100. https://doi.org/10.3390/buildings14010100
APA StyleAndrzejewska, A. K. (2024). Determining Urban Indicators in Local Plans—As One of the Sustainable Assumptions of the New European Bauhaus? Buildings, 14(1), 100. https://doi.org/10.3390/buildings14010100