Article

The Effect of Length of Service in a Thermal Environment on Thermal Comfort and Mental Stress

1
Inhalation Toxicity Research Center, Occupational Safety and Health Research Institute, Korea Occupational Safety and Health Agency (KOSHA), Daejeon 34122, Republic of Korea
2
Digital Healthcare R&D Department, Korea Institute of Industrial Technology, Cheonan 31056, Republic of Korea
3
Carbon Neutral Technology R&D Department, Korea Institute of Industrial Technology, Cheonan 31056, Republic of Korea
*
Author to whom correspondence should be addressed.
Buildings 2024, 14(1), 99; https://doi.org/10.3390/buildings14010099
Submission received: 19 November 2023 / Revised: 20 December 2023 / Accepted: 27 December 2023 / Published: 29 December 2023
(This article belongs to the Special Issue Impact of Physical Environments on Occupant Comfort)

Abstract

:
An inappropriate thermal environment negatively impacts workers, causing mental stress and safety accidents. Unskilled workers are more vulnerable to industrial accidents and thermal stress compared with skilled workers due to suboptimal and unfamiliar work. Previous studies have focused on individual characteristics (such as gender, age, and race), with limited emphasis on the thermal comfort sensation. This study identified the preferred thermal environment according to work experience and how mental stress differed between unskilled and skilled workers by examining their thermal comfort sensation. Predicted mean vote (PMV) was used as an indicator of the thermal environment, and five environments were constructed for PMV: −2, −1, 0, 1, and 2. Participants were recruited among current workers and the public. Mental stress and thermal comfort sensation were assessed using heart rate variability and thermal comfort vote, respectively. This study demonstrated that the skilled group experienced higher mental stress and a lower thermal comfort sensation. Contrastingly, in the sensitivity analysis, the unskilled group exhibited greater sensitivity to changes in the thermal environment. Through a comprehensive analysis, this study derived an optimal PMV range for each group. The findings can provide a reference for configuring the optimal thermal environment of the workplace.

1. Introduction

According to a report by the International Labor Organization, approximately 80 million workers worldwide suffer from exposure to extremely low or high temperatures in the workplace annually [1]. In 2022, nearly half of the Korean workers reportedly experienced physical occupational hazards associated with extreme temperatures [2]. Working in inappropriate thermal environments affects the autonomic nervous system, responsible for maintaining bodily homeostasis, with severe cases potentially leading to cardiovascular diseases [3]. Such environments can also impair cognitive function, decision-making ability, and work performance, increasing the risk of accidents in the workplace [4,5,6]. Additionally, inappropriate thermal environments can trigger mental stress among workers or residents, negatively impacting their overall quality of life [7,8]. Therefore, an appropriate thermal environment should be designed from the workers’ perspective, considering the potential harm to physical and mental health, as well as safety.
Various thermal indices have been developed to identify workplace hazards that adversely affect workers and create appropriate thermal environments. The concept of effective temperature (ET), which measures temperature, humidity, and air velocity to evaluate the thermal environment, was first developed in 1923. Subsequently, the new ET, which improved on ET and the wet bulb globe temperature, was developed [9]. However, conventional indicators primarily focus on physical variables such as temperature and humidity, failing to capture the actual thermal sensation perceived by individuals [10]. In recent years, predicted mean vote (PMV) has gained widespread usage, as it offsets the shortcomings of traditional indicators by considering personal variables like clothing insulation (attire worn by workers) and metabolic rate (thermal load generated by work activities).
Predicted mean vote, proposed by Fanger in 1970, is a heat balance model that considers four physical variables (air temperature, relative humidity, air velocity, and radiant temperature) and two personal variables (clothing insulation and metabolic rate) to calculate the PMV index, which is displayed on a scale ranging from −3 to +3 [11]. This model was developed based on thermal responses and physical factors observed among over 1300 American and European students. A PMV index closer to −3 indicates a colder environment, while a value closer to +3 implies a hotter environment. When the thermal environment is evaluated using the PMV index, thermal sensation vote (TSV) and thermal comfort vote (TCV) are often used concurrently [12,13]. TSV, which is an effective indicator for estimating the actual thermal comfort sensation in a specific environment, is determined based on an individual’s actual reaction rated on a thermal sensation scale of the questionnaire [14]. TCV is an indicator that evaluates an individual’s perceived comfort in a given thermal environment [15]. By utilizing PMV, TSV, and TCV, the assessment encompasses both the objective variables associated with the thermal environment and the subjective perceptions of residents. Considering its universality and advantages, PMV has globally adopted the ASHRAE 55 standard and ISO-7730 [16,17], and substantial research on PMV is currently underway. Extensive research has been conducted using PMV, TSV, and TCV factors with a range of outcomes. Ter Mors et al. [12] analyzed the thermal environment in primary school classrooms by analyzing TSV and TCV based on PMV. Liu et al. [18] performed a PMV-based thermal environment analysis in a hospital operating room. Additionally, Vilcekova et al. [19] analyzed the thermal environment of school classrooms using PMV and TSV, as well as CO2 and noise levels, to explore the optimal environment. Zhang et al. [20] studied depth-dependent thermal comfort in submarine cabins based on PMV. Rehman et al. [21] employed PMV and TCV to create an optimal thermal environment for smart buildings. Finally, Zheng et al. [9] analyzed the TSV and predicted the percentage of dissatisfaction (PPD) of seasonally varying construction site office environments using PMV, emphasizing that the range of thermal comfort can vary significantly depending on temperature.
Previous studies have primarily used PMV to evaluate building environments. However, it is necessary to analyze the characteristics of residents, such as gender, race, and work experience, rather than only the thermal environment according to building characteristics [10]. Cheung et al. [4] emphasized that PMV does not account for the aforementioned differences in personal characteristics. Contrastingly, Karjalainen [22] reported that compared with men, women tend to be more dissatisfied with thermal environments and exhibit greater sensitivity to both cold and heat. Modera [23] found statistically significant gender differences in physiological responses to temperature changes, reporting that women exhibit much higher sensitivity to temperature changes than men. Young and Lee [24] posited that age also influences the level of thermal comfort experienced, finding that older women are less sensitive to thermal environment changes compared with women of all other age groups. Kurazumi et al. [25] reported that women living in Thailand (a tropical region) are more sensitive to thermal environment changes than those living in Japan (a temperate region). Differences in the thermal comfort sensation and sensitivity according to personal characteristics have been attributed to differences in physiological, genetic, cultural, and ecological factors among groups living in various environmental conditions [26,27].
Most studies have focused on personal characteristics such as gender, age, and race when studying thermal environments, with limited research on the physiological responses and thermal comfort sensation based on individual experiences of specific thermal environments. It is imperative to understand these aspects to establish standardized workplace thermal environments that cater to workers with varying lengths of service, ultimately enhancing adaptability and job satisfaction, especially for new workers. New workers may experience a greater workload due to unfamiliar and suboptimal work practices or generate more thermal load driven by an increased need for physical exertion [28]. According to the Korea Occupational Safety and Health Agency [29], industrial accidents among workers with less than six months of work experience account for 49.3% of all accidents, the highest among all subgroups. Therefore, it is necessary to analyze the effect of length of service on thermal comfort sensation to establish appropriate thermal standards that satisfy average workers’ thermal comfort sensation and mental stress levels. Additionally, it is necessary to conduct research to explore the methodology for developing these standards.
This study investigated whether there are significant differences in PMV-based thermal comfort sensation and mental stress between skilled (recruited from current workers) and unskilled (involving the general public) workers in similar thermal environments. The effect of length of service on thermal comfort sensation and mental stress in a thermal environment were also examined by analyzing these outcome variables and comparing them between the skilled and unskilled groups. The analysis results were used to establish criteria for the thermal environment preferred by each group.

2. Materials and Methods

2.1. Participants

This study involved 20 skilled production workers (length of service ≥ 5 years) in the manufacturing industry and 16 unskilled workers (length of service = 0). All the participants were male. Based on the recruitment documents approved by the International Review Board (IRB), we created a recruitment notice and recruited participants through online recruitment. The skilled participants’ length of service was confirmed by means of the National Health Insurance Certificate and certificate of employment. All the participants voluntarily agreed to participate in the study and were selected based on the exclusion criteria, which included no history of cardiovascular disease or musculoskeletal disorders, considering the experimental nature of the study. Each participant provided signed informed consent. The experiment was conducted after obtaining approval from the Institutional Review Board (P01-202202-01-020). Table 1 outlines the general characteristics of the participants.

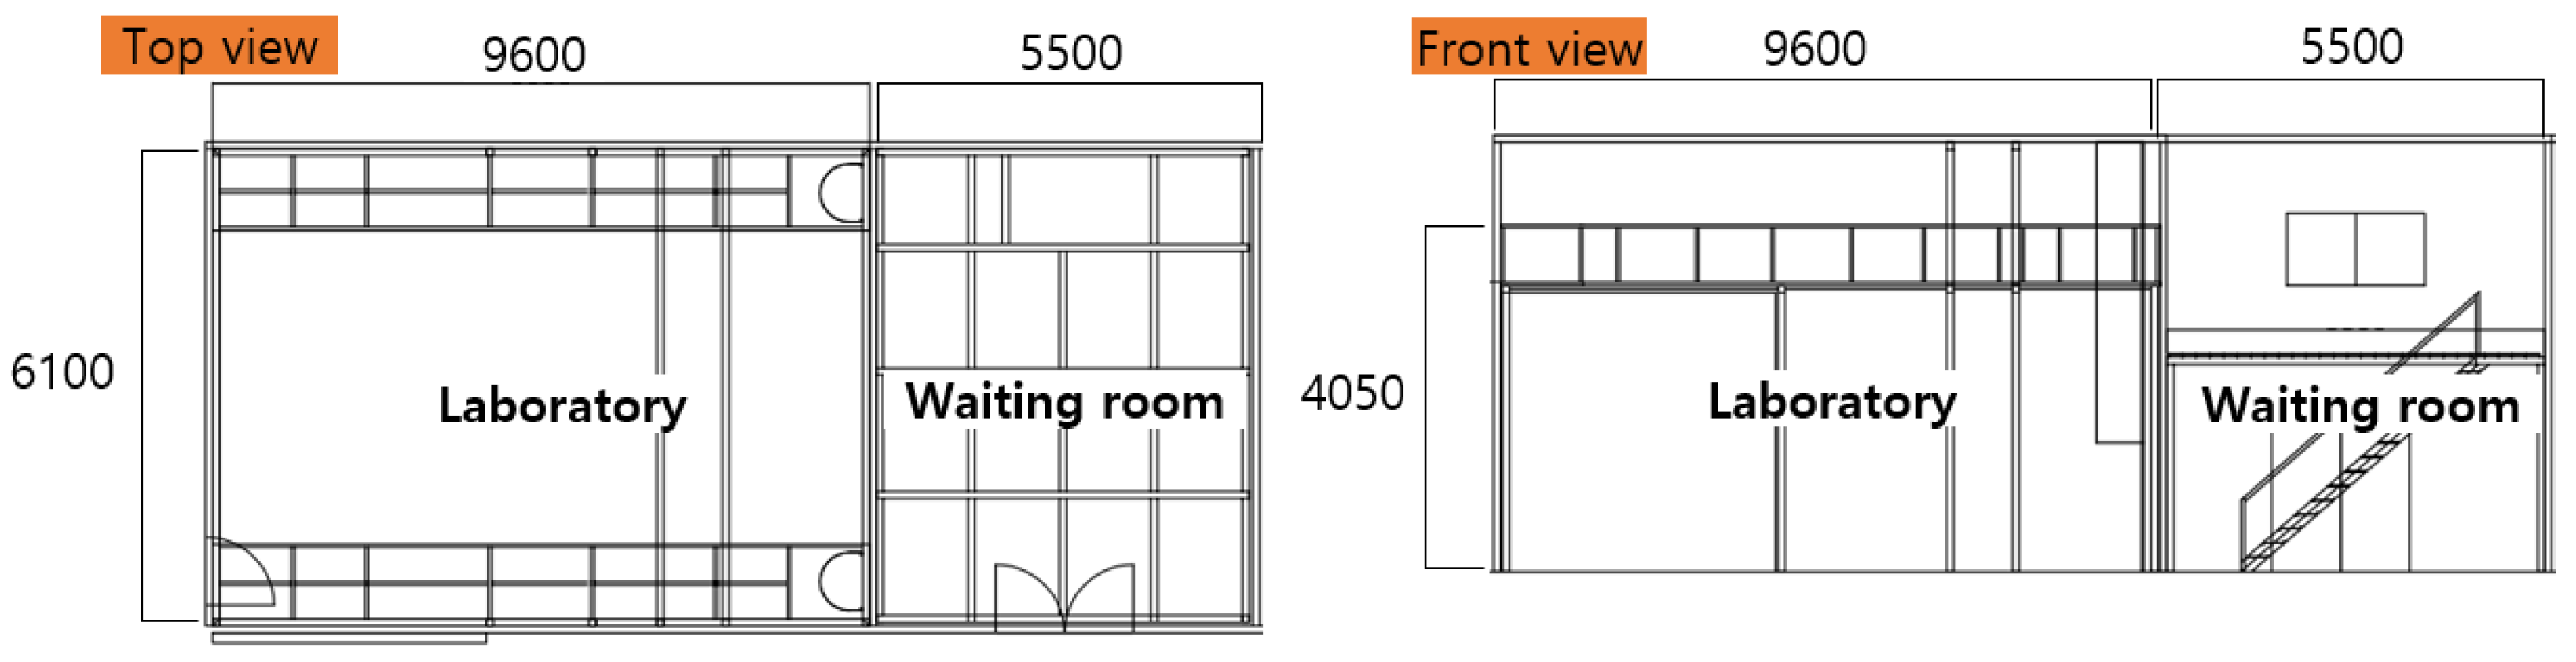
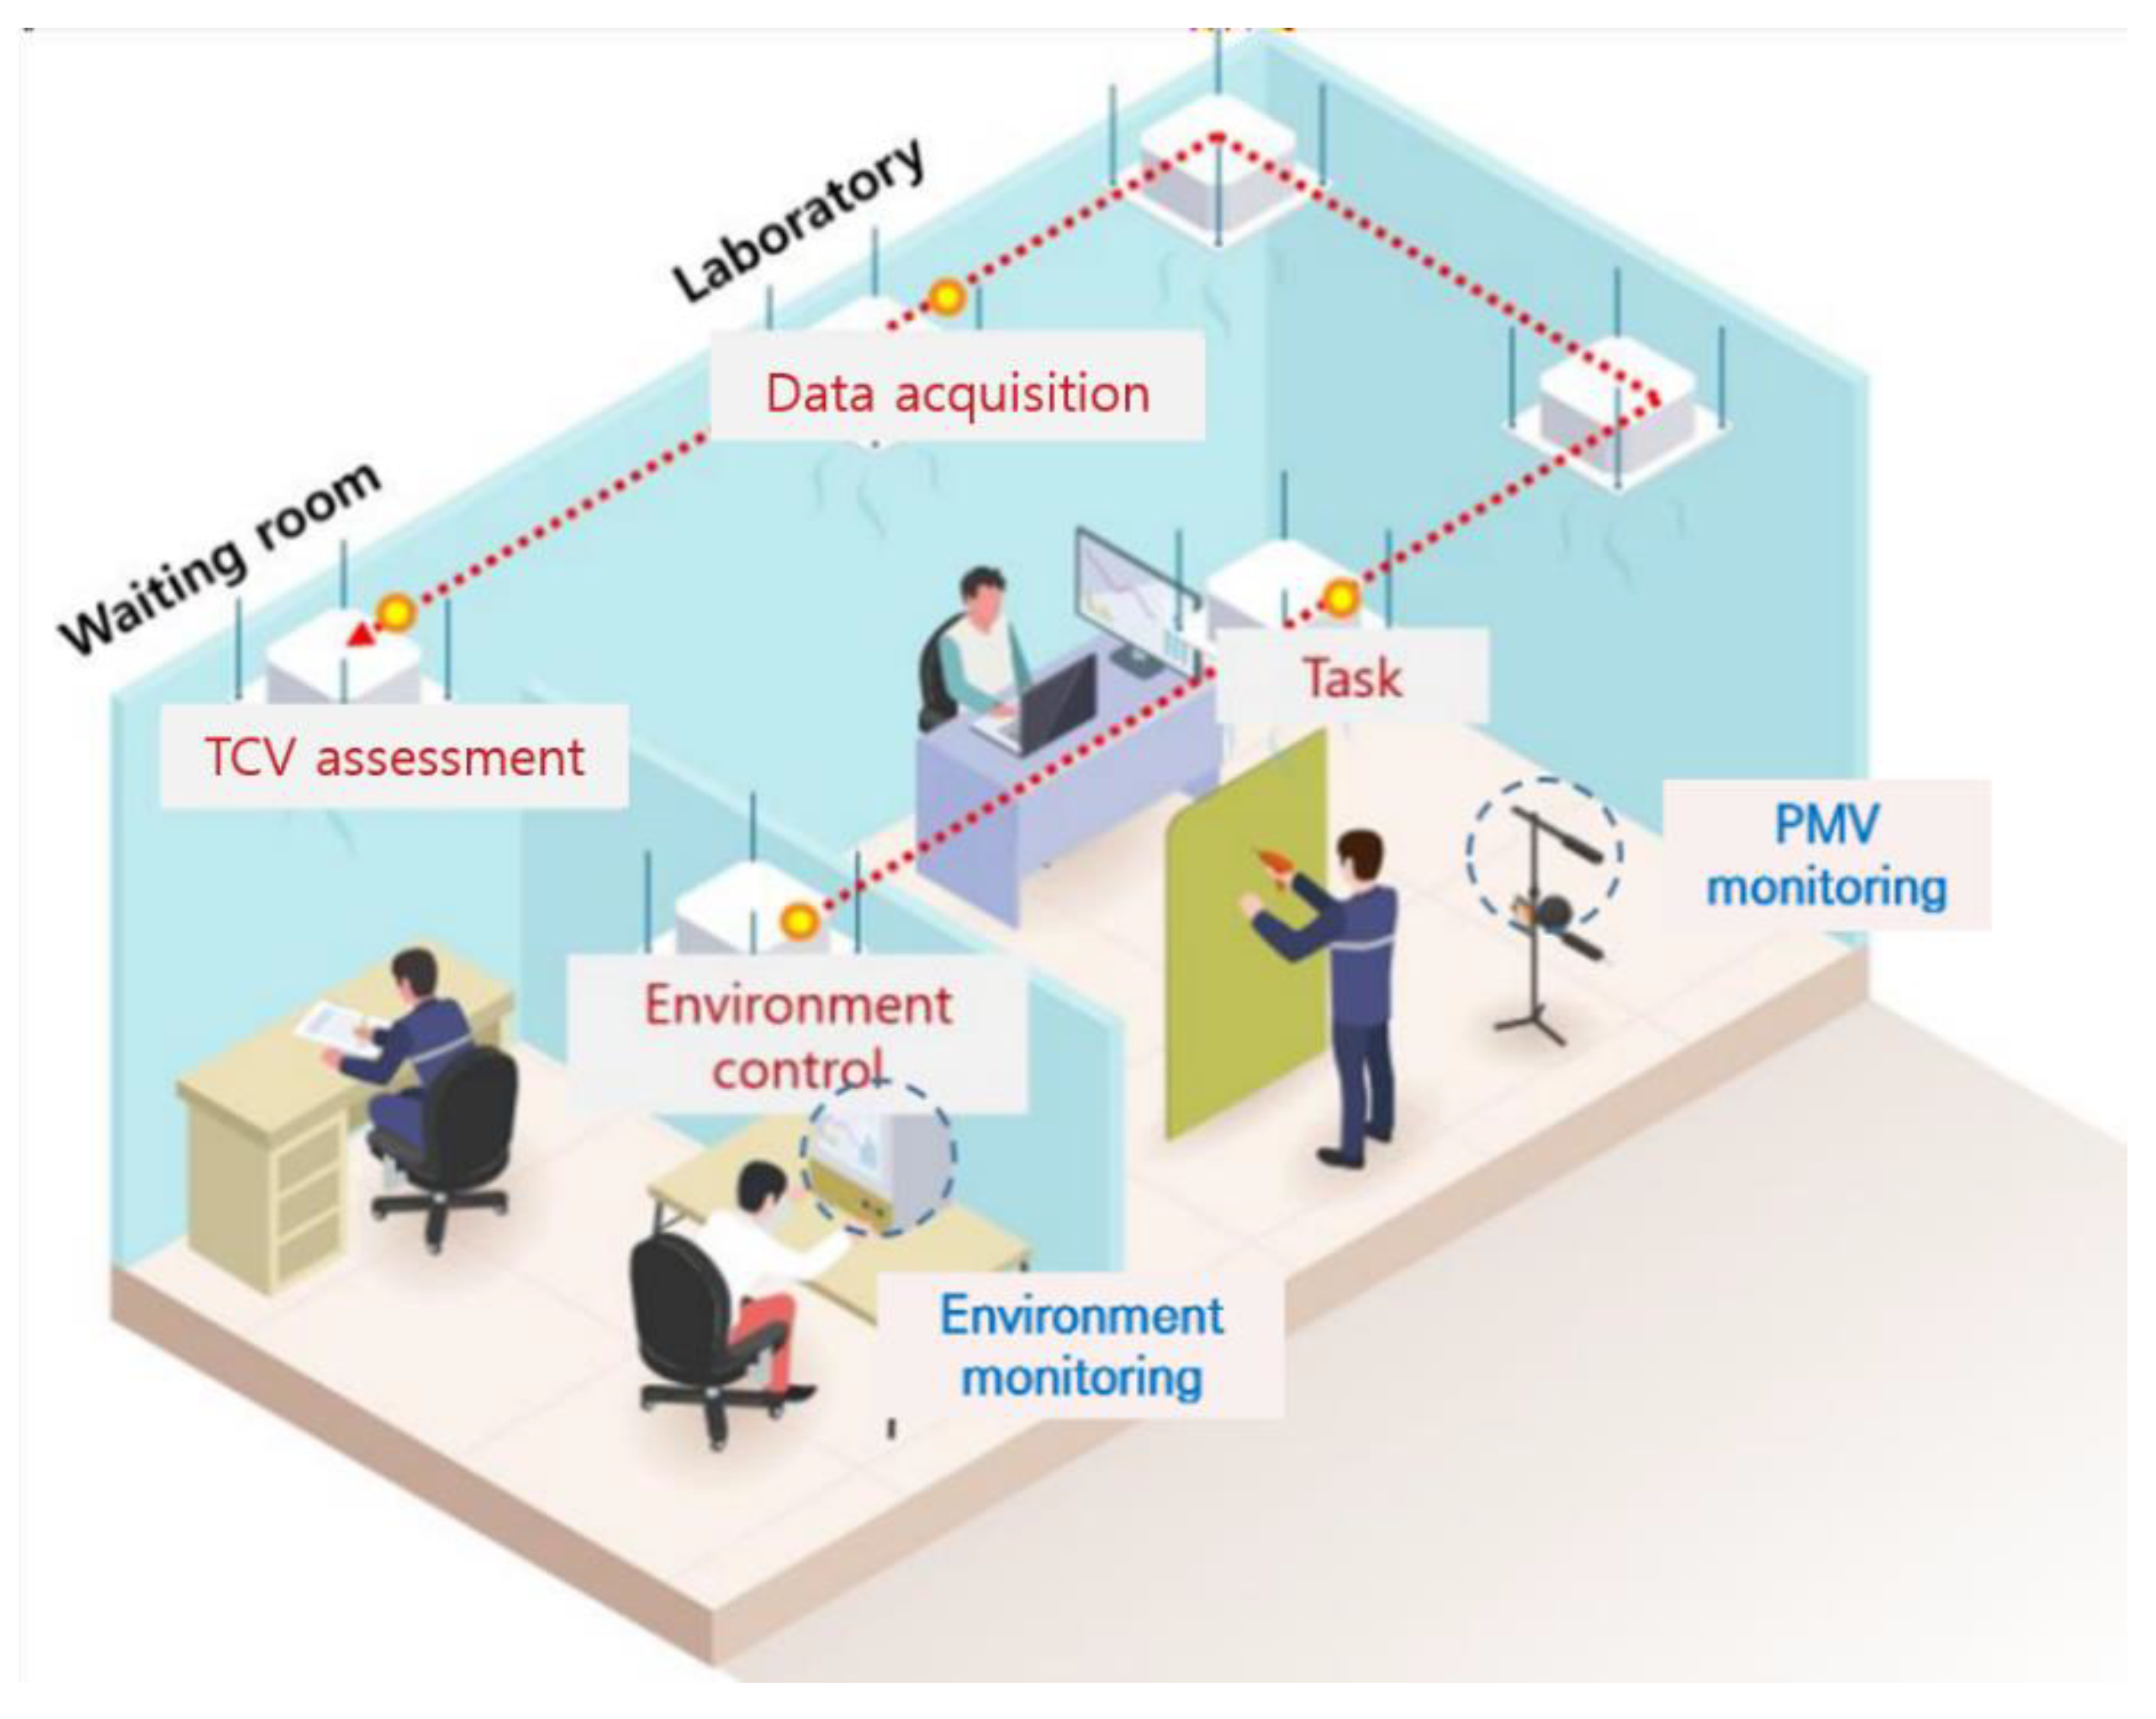
2.2. Experimental Environment

The experiment was conducted in an indoor setting, and the PMV index was calculated based on five variables: air temperature, relative humidity, air velocity, clothing insulation, and metabolic rate. Mean radiant temperature was excluded, as it is irrelevant to indoor environments. Consequently, five PMV levels (−2, −1, 0, 1, and 2) were established to quantify the thermal environment. The air temperature was set to 18 °C, 22.5 °C, 27.5 °C, 32 °C, and 36.5 °C to represent differential changes in PMV. The air velocity was maintained at 2.1 m/s to simulate a fan breeze level (PMV = −2), while in other thermal environments, the average value was set to 0.2 m/s, typical for indoor settings. Humidity was maintained at 50% (±5), a range that does not significantly impact human physiological responses. The clothing insulation value was set to 0.73 clo, representing actual work clothes and conforming to the specifications outlined in ISO 7730 [17], while the metabolic rate was set to 1.7 met, corresponding to screw-driving work, according to ISO 8996 [30] (see Table 2).
The experimental chamber consisted of a laboratory (9600 mm × 6100 mm × 7200 mm) for conducting experiments and acquiring data and a waiting room (5500 mm × 6100 mm × 7200 mm) for measuring temperature changes and evaluating the thermal comfort sensation (Figure 1). The waiting room temperature was theoretically neutral (PMV = 0). The air temperature was set based on the breathing line (1200 mm from the floor), which is the standard height for sensing temperature. The PMV value in the laboratory was monitored in real time using the PMV meter Testo400 (Testo, Germany), and environmental variables in the laboratory and waiting room were controlled and monitored using the SmartDAC+ cooling system (Yokogawa, Japan).

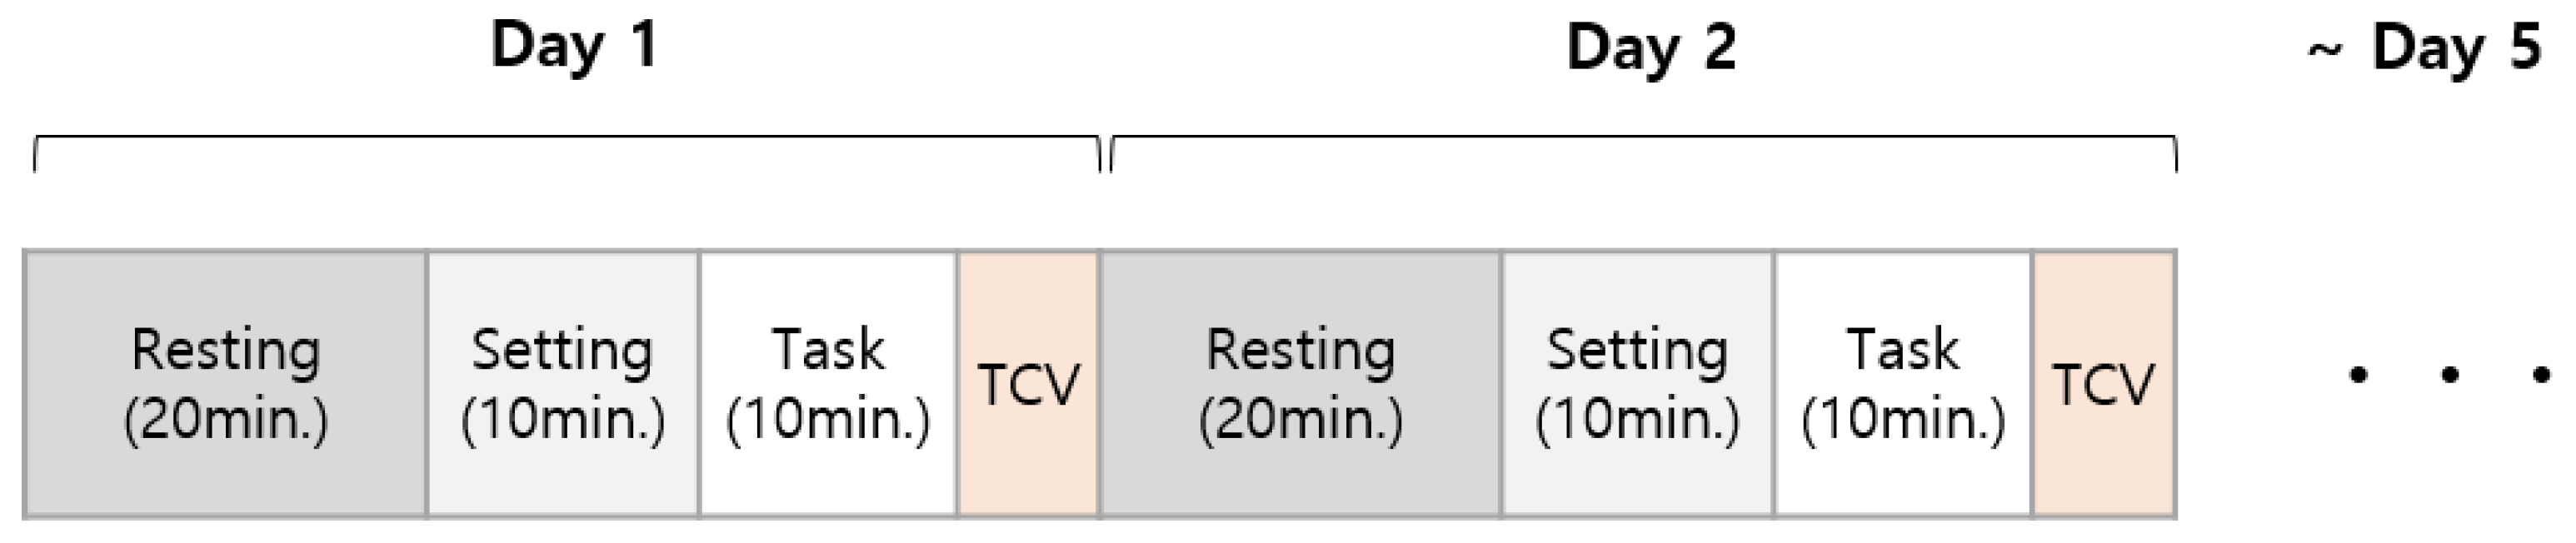
2.3. Experimental Procedure

The experiment was conducted in four stages: (1) preparation, (2) environment control, (3) task and data acquisition, and (4) thermal comfort voting (TCV) assessment. In the preparation stage, the participants rested in the waiting room to reduce their body temperature to the normal range adapted to outdoor environments before the experiment. They then changed into the experimental clothing and signed the informed consent forms. In the environment control stage, the necessary PMV variables were set using the air conditioning system. In the task stage, the participants repeatedly performed a screw-driving task. The data acquisition stage ran concurrently with the task stage, with heart rate variability (HRV) data being collected during task performance. Finally, for TCV assessment, the thermal comfort sensation for the given thermal environment was evaluated after the task was completed (Figure 2).
In the preparation stage, the participants rested for 20 min, followed by a 10 min experimental environment setting time. They performed the task for 10 min; subsequently, the TCV assessment was conducted without a preset time window. Since the experiment in one thermal environment could only be conducted once per day, it took five days for each participant to complete the experiment (Figure 3).

2.4. Measurement

Electrocardiography (ECG) to measure HRV was obtained using Biopac MP160 and ECG100C (Biopac, Goleta, CA, USA). Heart rate variability was obtained from a three-lead ECG, with the negative electrode being attached to the right clavicle; the positive electrode, to the lower left rib cage; and the ground electrode, to the lower right rib cage (Figure 4). The in-house TCV evaluation sheet assessed the thermal comfort sensation perceived by each participant, with each item being rated on a 5-point Likert scale (−2 = uncomfortable, −1 = slightly uncomfortable, 0 = neutral, 1 = slightly comfortable, and 2 = comfortable) (Figure 4).

2.5. Data Analysis

The low-frequency (LF)/high-frequency (HF) ratio is a measure of balance between sympathetic and parasympathetic nervous system activity. It is calculated by dividing the LF band by the HF band after calculating their power by applying the Fast Fourier Transform to the HRV data obtained from the ECG signal [31]. Previous studies have demonstrated that the LF/HF ratio increases during mental stress [32,33,34,35]. This can be attributed to the mechanism by which sympathetic nervous system activity increases and parasympathetic nervous system activity decreases under stress, leading to an elevation in the LF/HF ratio. The LF/HF ratio is widely used as a measure for evaluating mental stress [36].
In this study, the LF/HF ratio was calculated using the Kubios HRV Algorithm (Kubios, Finland) [37], with the LF and HF bands being set to 0.04–0.15 Hz and 0.15–0.40 Hz, respectively. For the TCV assessment, the overall mean score of the evaluation results from individual thermal environment variables was used. Sensitivity to changes in thermal environments was assessed by analyzing the range of the highest and lowest changed values of TCV and mental stress according to changes in the thermal environment. We defined sensitivity as a change in response to changes in the thermal environment.

2.6. Statistics

For statistical analysis, the five PMV thermal environments were set as independent variables, and the LF/HF ratio and TCV, as dependent variables. The normality of all data samples was assessed and confirmed with the Shapiro–Wilk test. One-way analysis of variance (ANOVA) was performed to compare mental stress and thermal comfort sensation within each group. Independent t-tests were conducted to compare mental stress and thermal comfort sensation between the two groups and among the five thermal environments (−2, −1, 0, 1, and 2). Sensitivity to changes in thermal environments was analyzed using independent t-tests between the unskilled and skilled groups based on the changed values in two thermal environments. The statistical significance level for all analyses was set to 0.05.

3. Results

3.1. LF/HF Ratio Analysis Results

The Shapiro–Wilk test was performed on HRV and TCV data samples of the groups to check their normal distribution. All samples satisfied the normality assumption (p > 0.05). First, the difference in the LF/HF ratio in each thermal environment was identified in the unskilled group (Figure 5a), and secondly, the difference in the LF/HF ratio in each thermal environment was identified in the skilled group (Figure 5b). Finally, the two groups were directly compared to confirm the difference between the unskilled and the skilled in each thermal environment (Figure 5c). A one-way ANOVA was conducted on the LF/HF ratios of the unskilled group, and the results demonstrated a significant difference in PMV-dependent LF/HF ratio changes. Tukey’s post hoc test demonstrated significant differences in the results between the PMV(0) and PMV(2) environments (p < 0.05) (Figure 5a). However, the same test conducted on the skilled group revealed no significant differences in the PMV-dependent LF/HF ratio (p > 0.05) (Figure 5b). The t-test performed on the mental stress analysis results of both groups in the five thermal environments revealed significant inter-group differences in the PMV(−2) and PMV(−1) environments (p < 0.05) (Figure 5c).

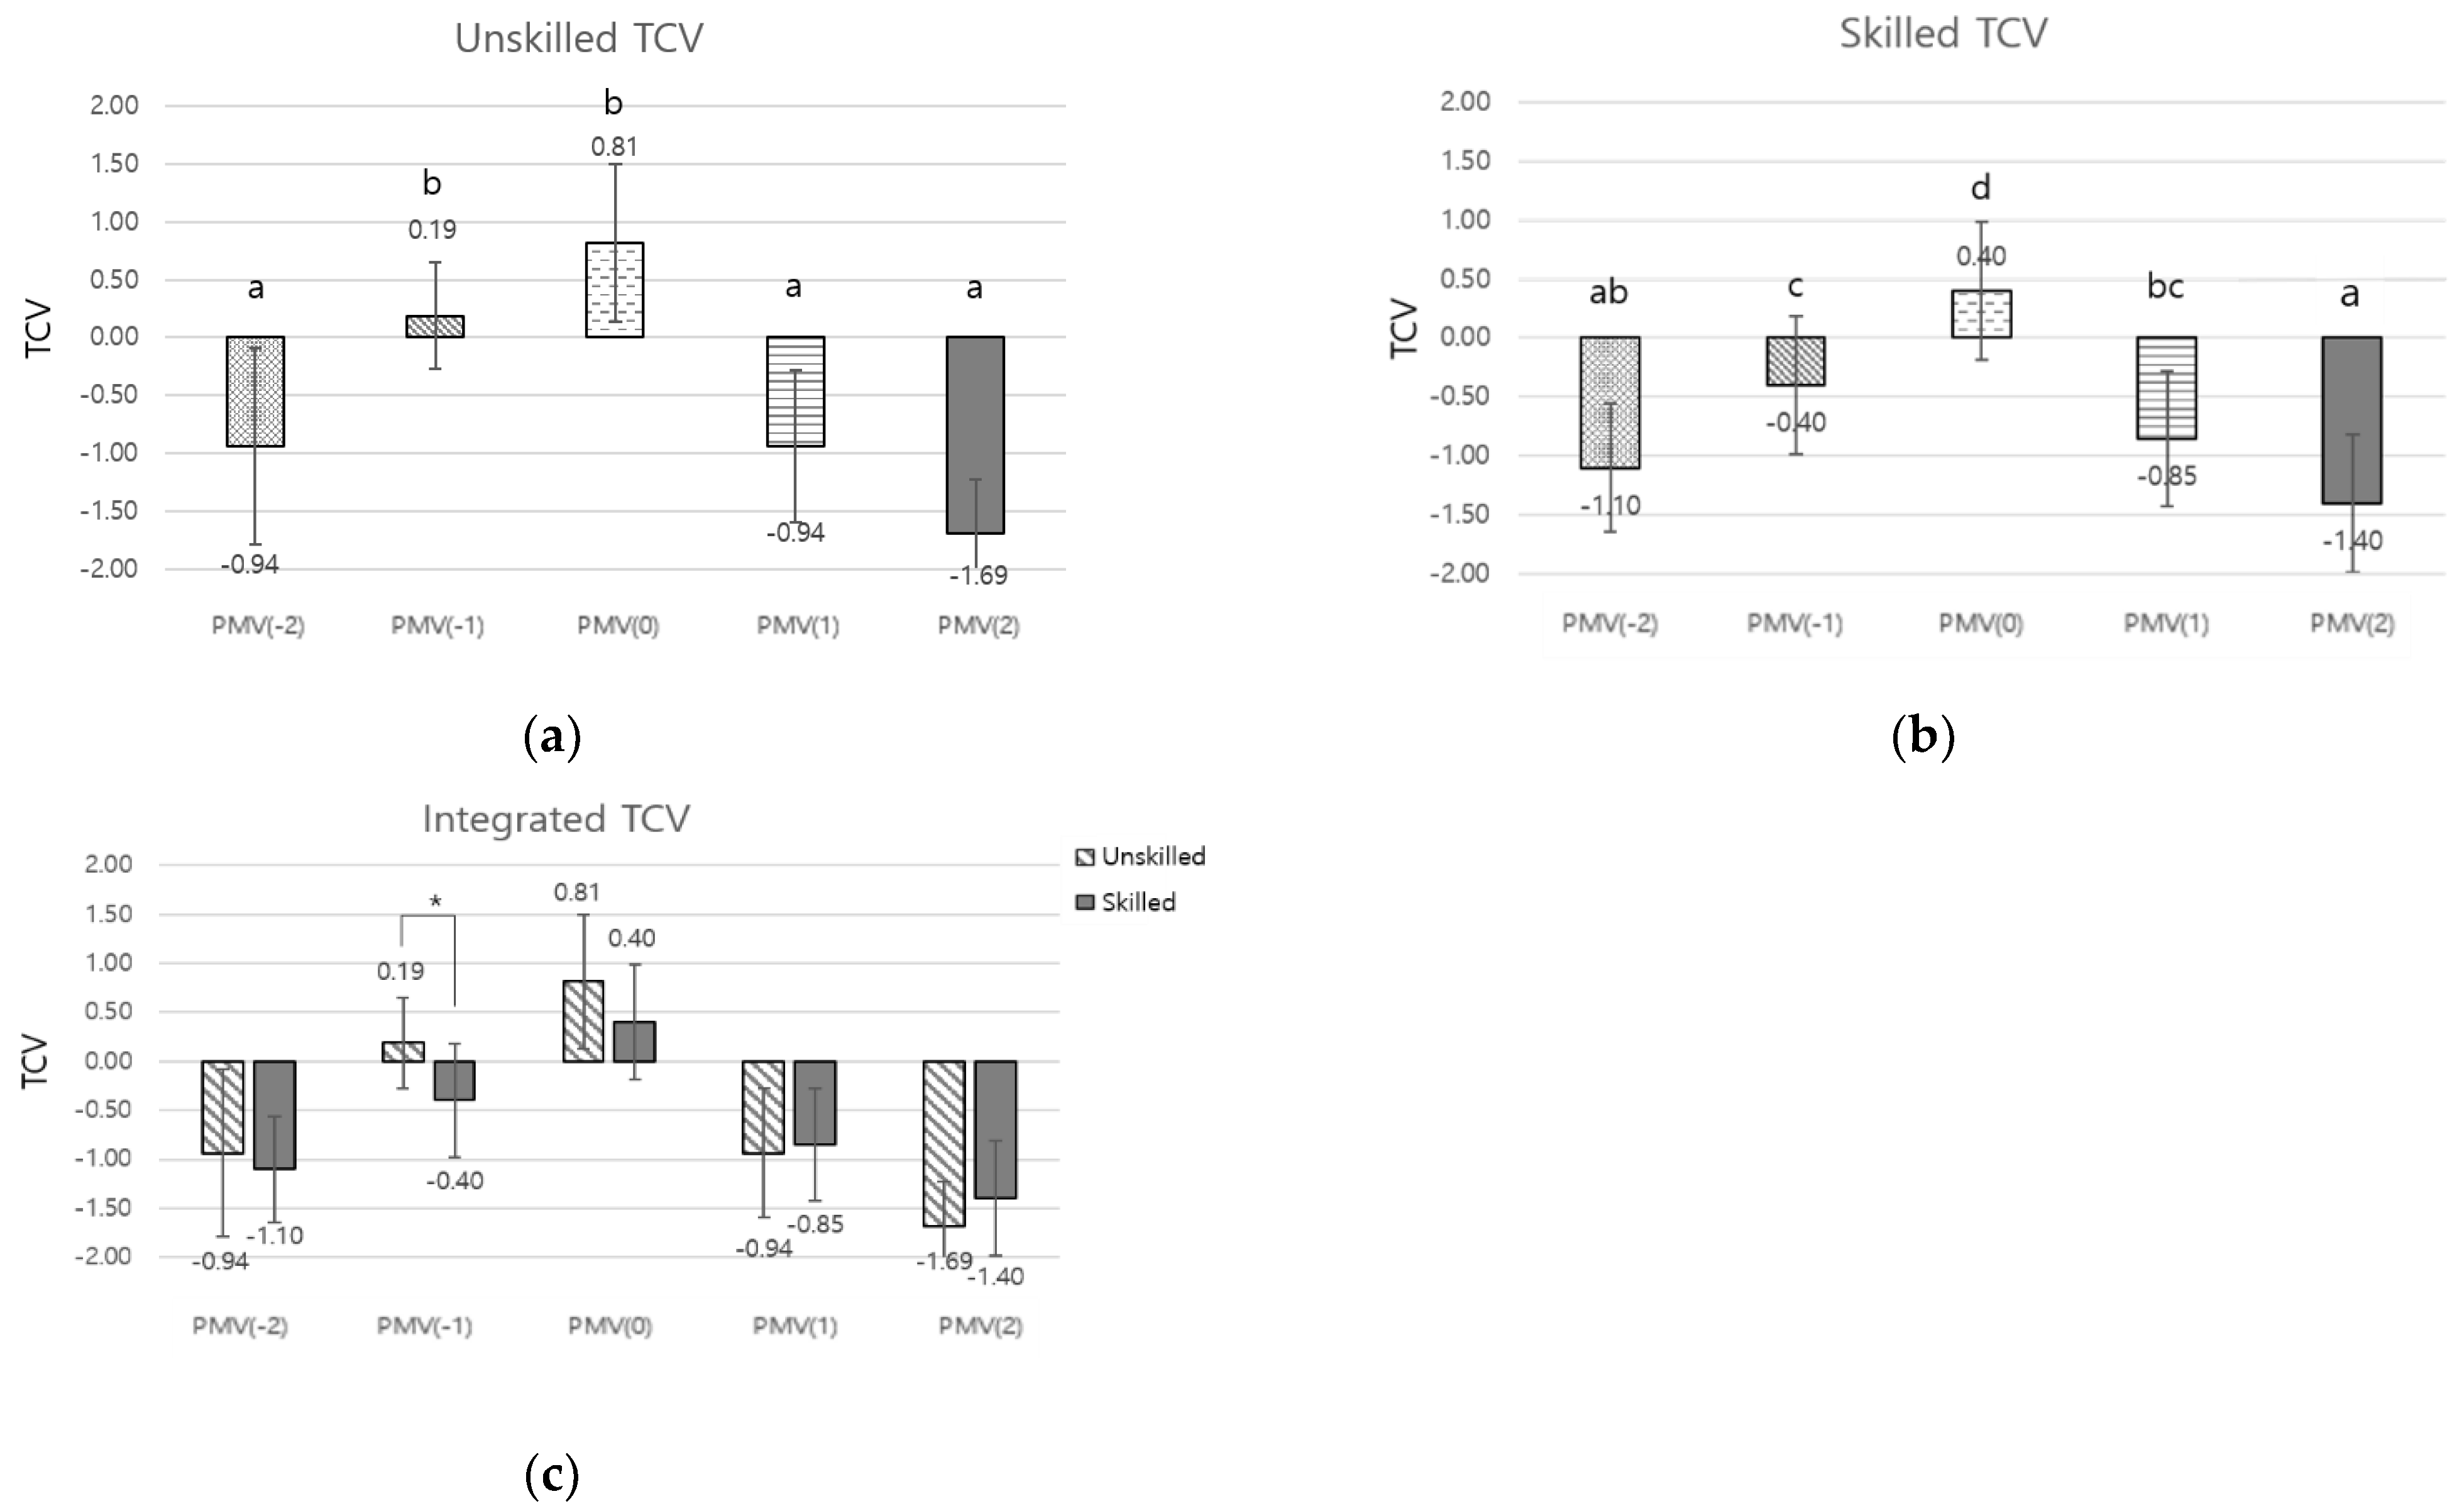
3.2. TCV Analysis Results

In the one-way ANOVA performed on TCV scores in the unskilled group, significant differences were found in some environments (p < 0.05), ranging from −1.69 in PMV(−2) to 0.81 in PMV(0). Tukey’s post hoc test revealed higher TCV scores in PMV(−1) and PMV(0) compared with PMV(−2), PMV(1), and PMV(2) (Figure 6a). The skilled group exhibited significant differences in most environments (p < 0.05), with TCV scores ranging from −1.4 in PMV(−2) to 0.4 in PMV(0). In Tukey’s post hoc test, differences were observed in all cases except for PMV(−2) and PMV(2), PMV(−2) and PMV(1), and PMV(1) and PMV(−1) (Figure 6b). The t-test performed on the TCV scores of the unskilled and skilled groups revealed a significant difference in PMV(−1) (p < 0.05) (Figure 6c).

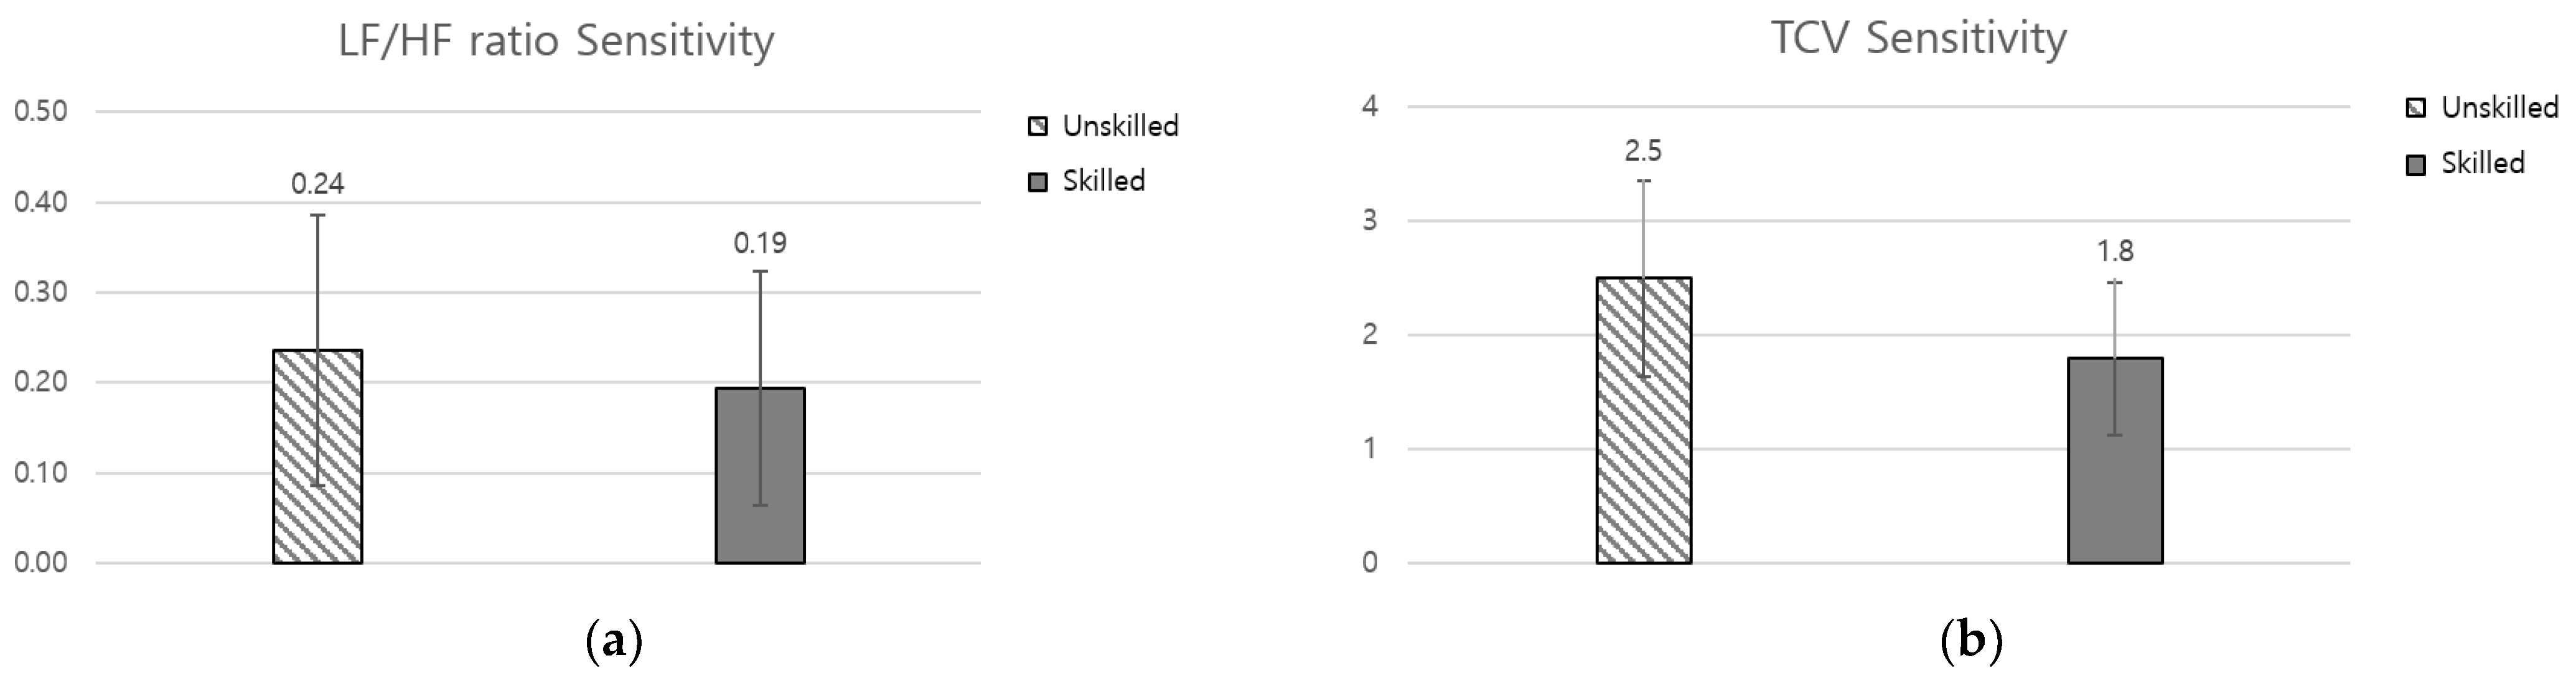
3.3. Thermal Sensitivity Analysis

Sensitivity to changes in thermal environments was compared by analyzing the differences between thermal environments with the highest and lowest LF/HF ratio and TCV values in the data points for both groups. In the unskilled group, the highest LF/HF ratio was observed in the PMV(2) environment, and the lowest, in the PMV(0) environment. In the skilled group, the highest LF/HF ratio was in the PMV(1) environment, and the lowest, in the PMV(0) environment. A difference of 0.24 was observed in the unskilled group, and 0.19, in the skilled group. Regarding TCV, the PMV(0) and PMV(2) environments, which remained high for both groups, were compared. A difference of 2.5 was observed in the unskilled group, and 1.8 in the skilled group. Both the LF/HF ratio and TCV demonstrated significant differences in sensitivity between the groups (t = 2.21 p = 0.043) (Figure 7).

4. Discussion

This study analyzed the effects of PMV-based thermal environment changes on mental stress and thermal comfort sensation, and the related thermal sensitivity in unskilled and skilled worker groups. Regarding the LF/HF ratio, the unskilled group exhibited higher and lower stress levels in warm (PMV = 2) and neutral (PMV = 0) environments, respectively. However, the skilled group did not demonstrate any significant PMV-dependent differences. The t-test for the LF/HF ratio for the five thermal environments showed that the skilled group had higher mental stress levels in the PMV(−2) environment than the unskilled group (t = 2.22, p = 0.046) and that the skilled group also had higher mental stress levels in the PMV(−1) environment than the unskilled group (t = 2.43, p = 0.039). Performing an independent sample t-test on thermal sensitivity showed again that the unskilled group was more sensitive to changes in the thermal environment than the skilled group (t = 2.11, p = 0.42). Regarding TCV, both the skilled and unskilled groups demonstrated significant differences in the PMV(−1) environment, with the unskilled group demonstrating higher TCV values than the skilled group. The unskilled group was categorized into two reaction groups of PMV(−1) and (0) and PMV(−2), (1), and (2) for TCV, while the skilled group was classified into four reaction groups of PMV(−2) and (2) and three separate groups for the remaining three PMV values. A significant inter-group difference in TCV was found in the PMV(−1) environment, with the unskilled group demonstrating higher TCV values than the skilled group (t = 1.96, p = 0.03).
This study demonstrated that skilled workers exhibited greater mental stress compared with unskilled workers in the PMV(−2) and PMV(−1) environments, which correspond to lower temperature conditions. In contrast, unskilled workers reported a higher thermal comfort sensation (higher TCV) compared with skilled workers in the PMV(−1) environment. The combined results of the mental stress and TCV analyses imply that the unskilled workers preferred PMV(−1) and PMV(0) environments, while the skilled workers preferred the PMV(0) environment. Additionally, from the combined results of the mental stress and sensitivity analyses, it can be inferred that the unskilled group was more sensitive to changes in the thermal environment compared with the skilled group. These results have two practical implications: First, it is necessary to design the thermal environment of the workplace to be close to PMV(−1) and PMV(0); second, workplaces with a high proportion of workers having a short length of service require precise control of the PMV variables to reduce the range of temperature variations.
Kosonen and Tan [38] reported that productivity in offices improves with PMV values between −0.5 and 0.5 based on an analysis of task completion time and task performance accuracy according to the thermal environment. Zhang et al. [20] reported that although appropriate PMV values varied depending on the submarine’s immersion depth, values between 0 and 1 were generally optimal for maintaining body temperature. The results of this study are consistent with the range of PMV values recommended in previous studies, suggesting that the required range may vary depending on specific conditions and locations.
This study focused on analyzing the mental stress and thermal comfort sensation experienced by unskilled and skilled workers, with length of service as a key variable of personal characteristics. This study has certain limitations: Analyses based on other general characteristics, such as gender, age, and race, were not conducted, and the results may vary depending on changes in physical and personal variables of PMV. The experiment in this study was conducted in a laboratory environment where study variables could be controlled with low deviation. It should be noted that variability in the variables during job performance can also impact mental stress and TCV results. There is also a limitation in that it does not provide a clear reason for the difference between mental stress and TCV depending on the career. Previous studies have reported that the results may vary depending on human characteristics (age, gender, race), etc., regarding the thermal environment. Modera [23] reported that the difference in thermal satisfaction occurs because women have relatively lower skin temperature and metabolic rate than men. In addition, Young and Lee [24] reported that the elderly have lower body temperature control ability and cutaneous vasoconstriction response than young people due to aging, resulting in a difference in thermal satisfaction. Previous studies have suggested a clear relationship between thermal satisfaction arising from these physiological and ecological differences. However, in this study, the parameters are limited to “career”. Further research is needed to find out why the unskilled group was more sensitive to changes in the thermal environment, but the conclusion we drew is that the skilled group, given the same situation in the two groups, seemed to show relatively less sensitivity because they were familiar with high exposure to the thermal environment. However, the reason why the LF/HF ratio of the skilled group was high overall is that the stress caused by the thermal environment experienced in the previous workplace may have been reflected in the current one. In addition, in conducting the experiment, the participants of the skilled group verbally conveyed the opinion that it was not common for them to design an environment more extreme than their work environment. While this provided focused data to interpret the results of the differences study, it did not provide information about the clear reasons for the differences in thermal relationships arising from differences in attention to them. Despite these limitations, the study is significant, as it confirmed the differences between unskilled and skilled workers when exposed to various thermal environments. The findings can serve as a basis for designing workplace thermal environments. Follow-up research is expected to explore major personal characteristics other than length of service that can affect the thermal environment and to use additional objective data beyond workers’ mental stress. Additionally, it is planned to expand the PMV value range, which is currently limited to −2–2.

5. Conclusions

This study aimed to determine if there were significant differences in thermal comfort sensation and mental stress between unskilled and skilled workers in various PMV-based thermal environments and to investigate the effect of length of service on thermal comfort sensation and mental stress. A screw-driving task was performed by 16 unskilled and 20 skilled workers in five different PMV-based thermal environments. Heart rate variability and TCV data were collected to assess mental stress and thermal comfort sensation, respectively, with the former being analyzed using LF/HF ratio data obtained from HRV. Overall, unskilled workers tended to prefer PMV(−1) and PMV(0) environments, while their skilled counterparts preferred the PMV(0) environment. A sensitivity analysis revealed that unskilled workers had higher sensitivity to changes in the thermal environment compared with skilled workers. The results are expected to provide evidence for designing an appropriate thermal environment in the workplace and contribute to improving the working environment. On the basis of these research results, we propose the necessity of creating an appropriate working environment in consideration of the ratio of skilled and unskilled workers in the workplace. In addition, this studies emphasizes that PMV, which can be used effectively to evaluate the thermal environment more precisely, can be used in the current situation where the number of people with heat-related diseases is steadily increasing due to global warming and other reasons. Beyond evaluating the thermal environment of residential buildings, a technique that has been frequently used before, PMV can be effectively applied to workers with frequent exposure to thermal environments, considering their metabolism and clothing.

Author Contributions

J.-S.H. contributed to conceptualization, methodology, investigation, obtaining resources, supervision, project administration, funding acquisition, and writing—review, and editing. Y.-S.S. contributed to conceptualization, software, formal analysis, data curation, visualization, and writing—original draft preparation. D.-A.C. contributed to methodology and software. J.-B.K. contributed to validation, formal analysis, and data curation. All authors have read and agreed to the published version of the manuscript.

Funding

This research was supported by the Korea Institute of Industrial Technology (KITECH) (EO230006).

Institutional Review Board Statement

The study was conducted according to the guidelines of the Declaration of Helsinki and approved by the Institutional Review Board of the Ministry of Health & Welfare, Republic of Korea (approval No. P01-202202-01-020, 10 February 2022).

Informed Consent Statement

Informed consent was obtained from all participants involved in this study.

Data Availability Statement

The data presented in this study are available on request from the corresponding author. The data are not publicly available due to privacy. It cannot be disclosed due to the inclusion of personal information such as age and weight.

Conflicts of Interest

The authors declare no conflicts of interest.

References

  1. International Labor Organization. Sectoral Activities Department (SECTOR), Geneva. 2012. Available online: https://www.ilo.org/sector/lang--en/index.htm (accessed on 13 November 2022).
  2. Korea Occupational Safety and Health Agency. Physical Activity Risk Factor Exposure; KOSHA: Seoul, Republic of Korea, 2022. [Google Scholar]
  3. Veitch, J.A.; Charles, K.E.; Farley, K.M.; Newsham, G.R. A model of satisfaction with open-plan office conditions: COPE field findings. J. Environ. Psychol. 2007, 27, 177–189. [Google Scholar] [CrossRef]
  4. Cheung, S.S.; Lee, J.K.; Oksa, J. Thermal stress, human performance, and physical employment standards. Appl. Physiol. Nutr. Metab. 2016, 41, S148–S164. [Google Scholar] [CrossRef] [PubMed]
  5. Hancock, T. Creating environments for health—20 years on. Promot. Educ. 2007, 7–8, 27. [Google Scholar] [CrossRef]
  6. Pilcher, J.J.; Nadler, E.; Busch, C. Effects of hot and cold temperature exposure on performance: A meta-analytic review. Ergonomics 2002, 45, 682–698. [Google Scholar] [CrossRef] [PubMed]
  7. Najafi, N.; Movahed, K.; Barzegar, Z.; Samani, S. The effect of thermal comfort on stress in female high school students. Int. J. Sch. Health 2018, 5, 1–6. [Google Scholar]
  8. Yan, T.; Jin, H.; Jin, Y. The mediating role of emotion in the effects of landscape elements on thermal comfort: A laboratory study. Build Environ. 2023, 233, 110130. [Google Scholar] [CrossRef]
  9. Zheng, Z.; Zhang, Y.; Mao, Y.; Yang, Y.; Fu, C.; Fang, Z. Analysis of SET* and PMV to evaluate thermal comfort in prefab construction site offices: Case study in South China. Case Stud. Therm. Eng. 2021, 26, 101137. [Google Scholar] [CrossRef]
  10. Kim, H.S.; Kim, H.T.; Kim, H.S.; Kuwak, W.T.; Kim, J.H. A study on the effects of PMV thermal environment and illumination on visual performance. Sci. Emot. Sensib. 2014, 17, 55–62. [Google Scholar] [CrossRef]
  11. Fanger, P.O. Thermal Comfort: Analysis and Applications in Environmental Engineering; Danish Technical Press: Copenhagen, Denmark, 1970. [Google Scholar]
  12. Ter Mors, S.; Hensen, J.L.; Loomans, M.G.; Boerstra, A.C. Adaptive thermal comfort in primary school classrooms: Creating and validating PMV-based comfort charts. Build Environ. 2011, 46, 2454–2461. [Google Scholar] [CrossRef]
  13. Wu, Y.C.; Mahdavi, A. Assessment of thermal comfort under transitional conditions. Build Environ. 2014, 76, 30–36. [Google Scholar] [CrossRef]
  14. Liu, H.; Lian, Z.; Gong, Z.; Wang, Y.; Yu, G. Thermal comfort, vibration, and noise in Chinese ship cabin environment in winter time. Build Environ. 2018, 135, 104–111. [Google Scholar] [CrossRef]
  15. Van Craenendonck, S.; Lauriks, L.; Vuye, C.; Kampen, J. A review of human thermal comfort experiments in controlled and semi-controlled environments. Renew. Sust. Energ. Rev. 2018, 82, 3365–3378. [Google Scholar] [CrossRef]
  16. ASHRAE. ANSI/ASHRAE Addenda o, p, and q to ANSI/ASHRAE Standard 55-2010; ASHRAE: Atlanta, GA, USA, 2013; p. 7. [Google Scholar]
  17. ISO 7730:2005(E); Moderate Thermal Environments-Determination of the PMV and PPD Indices and Specification of the Conditions for Thermal Comfort. International Organization for Standardization: Geneva, Switzerland, 2005.
  18. Liu, C.; Zhou, G.; Li, H. Analysis of thermal environment in a hospital operating room. Procedia Eng. 2015, 121, 735–742. [Google Scholar] [CrossRef]
  19. Vilcekova, S.; Meciarova, L.; Burdova, E.K.; Katunska, J.; Kosicanova, D.; Doroudiani, S. Indoor environmental quality of classrooms and occupants’ comfort in a special education school in Slovak Republic. Build Environ. 2017, 120, 29–40. [Google Scholar] [CrossRef]
  20. Zhang, S.; He, W.; Chen, D.; Chu, J.; Fan, H.; Duan, X. Thermal comfort analysis based on PMV/PPD in cabins of manned submersibles. Build Environ. 2019, 148, 668–676. [Google Scholar] [CrossRef]
  21. Rehman, S.U.; Javed, A.R.; Khan, M.U.; Nazar Awan, M.; Farukh, A.; Hussien, A. Personalised comfort: A personalised thermal comfort model to predict thermal sensation votes for smart building residents. Enterp. Inf. Syst. 2022, 16, 1852316. [Google Scholar]
  22. Karjalainen, S. Gender differences in thermal comfort and use of thermostats in everyday thermal environments. Build Environ. 2007, 42, 1594–1603. [Google Scholar] [CrossRef]
  23. Modera, M. Skin temperature and evaporative heat loss variations for men and women in thermal comfort. ASHRAE Transact 1993, 99, 210–222. [Google Scholar]
  24. Young, A.J.; Lee, D.T. Aging and human cold tolerance. Exp. Aging Res. 1997, 23, 45–67. [Google Scholar] [CrossRef]
  25. Kurazumi, Y.; Ishii, J.; Fukagawa, K.; Kondo, E.; Aruninta, A. Ethnic differences in thermal responses between Thai and Japanese females in tropical urban climate. Am. J. Clim. Change 2016, 5, 52–68. [Google Scholar] [CrossRef]
  26. Nicol, J.F.; Humphreys, M. Understanding the adaptive approach to thermal comfort. ASHRAE Transact. 1998, 104, 991–1004. [Google Scholar]
  27. Meier, M.W.; Fischer, W.K.; Perruchoud, R.; Gauckler, L.J. Thermal shock of anodes-a solved problem? In Light Metals; Tomsett, A., Johnson, J., Eds.; Springer International Publishing: Cham, Switzerland, 1994; pp. 685–694. [Google Scholar]
  28. Kim, S.W.; Sohn, A.R.; Lee, J.S. The effects of job stress on musculoskeletal diseases among shipyard workers. Phys. Ther. Korea 2005, 12, 1–10. [Google Scholar]
  29. Korea Occupational Safety and Health Agency. Overall Disaster Status and Analysis—By Entry Period (Medium Classification by Industry); KOSHA: Seoul, Republic of Korea, 2023. [Google Scholar]
  30. EN ISO 8996:2021; Ergonomics of the Thermal Environment-Determination of Metabolic Rate. International Organization for Standardization: Geneva, Switzerland, 2021.
  31. Von Rosenberg, W.; Chanwimalueang, T.; Adjei, T.; Jaffer, U.; Goverdovsky, V.; Mandic, D.P. Resolving ambiguities in the LF/HF ratio: LF-HF scatter plots for the categorization of mental and physical stress from HRV. Front. Physiol. 2017, 8, 360. [Google Scholar] [CrossRef] [PubMed]
  32. Hjortskov, N.; Rissén, D.; Blangsted, A.K.; Fallentin, N.; Lundberg, U.; Søgaard, K. The effect of mental stress on heart rate variability and blood pressure during computer work. Eur. J. Appl. Physiol. 2004, 92, 84–89. [Google Scholar] [CrossRef] [PubMed]
  33. Minakuchi, E.; Ohnishi, E.; Ohnishi, J.; Sakamoto, S.; Hori, M.; Motomura, M.; Hoshino, J.; Murakami, K.; Kawaguchi, T. Evaluation of mental stress by physiological indices derived from finger plethysmography. J. Physiol. Anthrop. 2013, 32, 17. [Google Scholar] [CrossRef] [PubMed]
  34. Sato, N.; Miyake, S. Cardiovascular reactivity to mental stress: Relationship with menstrual cycle and gender. J. Physiol. Anthropol. Appl. Hum. Sci. 2004, 23, 215–223. [Google Scholar] [CrossRef] [PubMed]
  35. Subahni, A.R.; Xia, L.; Malik, A.S. Association of mental stress with video games. In Proceedings of the 2012 4th International Conference on Intelligent and Advanced Systems (ICIAS2012), Kuala Lumpur, Malaysia, 12–14 June 2012; IEEE: Piscataway, NJ, USA, 2012; pp. 82–85. [Google Scholar]
  36. Tao, D.; Tan, H.; Wang, H.; Zhang, X.; Qu, X.; Zhang, T. A systematic review of physiological measures of mental workload. Int. J. Environ. Res. Public Health 2019, 16, 2716. [Google Scholar] [CrossRef]
  37. Tarvainen, M.P.; Niskanen, J.P.; Lipponen, J.A.; Ranta-Aho, P.O.; Karjalainen, P.A. Kubios HRV–heart rate variability analysis software. Comp. Methods Programs Biomed. 2014, 113, 210–220. [Google Scholar] [CrossRef]
  38. Kosonen, R.; Tan, F. Assessment of productivity loss in air-conditioned buildings using PMV index. Energy Build. 2004, 36, 987–993. [Google Scholar] [CrossRef]
Figure 1. Experimental chamber.
Buildings 14 00099 g001
Figure 2. Experiment description.
Buildings 14 00099 g002
Figure 3. Experiment run time and procedure.
Buildings 14 00099 g003
Figure 4. Measurement: (a) electrocardiography (ECG) data acquisition and analysis system; (b) ECG electrode attachment locations; (c) thermal comfort vote (TCV) evaluation sheet.
Buildings 14 00099 g004
Figure 5. LF/HF ratio analysis results: (a) unskilled, (b) skilled, (c) integrated. * p < 0.05.
Buildings 14 00099 g005
Figure 6. TCV analysis results: (a) unskilled, (b) skilled, (c) integrated. *, p < 0.05.
Buildings 14 00099 g006
Figure 7. Range comparison analysis. (a) LF/HF ratio, (b) TCV.
Buildings 14 00099 g007
Table 1. Participant characteristics.
SampleAge (Years)Height (cm)Weight (kg)BMI (kg/m2)LoS (Years)
Unskilled1633.4 (9.8)174.4 (4.7)73.3 (8.5)24.9 (2.6)-
Skilled2036.6 (7.6)172.9 (8.9)74.1 (9.9)24.8 (3.2)11.8 (4.8)
(LoS: length of service).
Table 2. Criteria for setting the thermal environment.
VariablesCase 1Case 2Case 3Case 4Case 5
PMV−2−1012
Air temperature18 °C22.5 °C27.5 °C32 °C36.5 °C
Air velocity2.1 m/s0.2 m/s
Relative humidity50% (±5)
Clothing insulation0.73 clo
Metabolic rate1.7 met
(PMV: predicted mean vote.)
Disclaimer/Publisher’s Note: The statements, opinions and data contained in all publications are solely those of the individual author(s) and contributor(s) and not of MDPI and/or the editor(s). MDPI and/or the editor(s) disclaim responsibility for any injury to people or property resulting from any ideas, methods, instructions or products referred to in the content.

