1. Introduction
After the rapid development of highway bridges in a short period, the South Korean government has faced a lack of an effective digital platform for managing massive amounts of information on bridge maintenance. In 2016, there was a bridge incident in which an external prestressing tendon of a bridge ruptured owing to unexpected corrosion [
1]; subsequent investigations on prestressed concrete (PSC) bridges also revealed cases of tendon corrosion. In addition, according to 2021 statistics [
2], approximately 15% of all bridges were more than 30 years old, and this proportion is rapidly growing. According to estimations, 47% of all bridges will be older than 30 years within the next 10 years, and this figure will increase to 80% within the next 20 years. As the deterioration of bridge structures accumulates over time and repeated repairs show limitations in maintaining serviceability, maintenance authorities are compelled to consider a more effective maintenance system. To make reliable decisions regarding maintenance plans and potential replacements, bridge structures must encompass connected data from the design to the operation phase. An efficient digital platform for managing these comprehensive data is essential to ensure adequate maintenance strategies and safe and sustainable operation of aging bridge infrastructure.
Bridge information modeling (BrIM) was introduced to address these limitations and is expected to improve information management throughout the project life cycle, from planning to maintenance [
3,
4]. BrIM is an approach that involves creating a comprehensive three-dimensional (3D) model of a bridge and utilizing it for various purposes, including structural analysis, simulation, optimization, visualization, cost estimation, communication, and collaboration. The key advantage of BrIM is its ability to integrate an intelligent physical 3D model into an environment that facilitates seamless interoperability among bridge design applications. This integration enables an efficient and robust exchange of information between different tools and software, thereby promoting a cohesive and streamlined bridge design and management process [
5,
6]. Using the potential of BrIM, stakeholders in the bridge industry can make informed decisions, enhance maintenance efficiency, and ensure the long-term performance and safety of bridge structures.
BrIM for bridge maintenance systems (BMSs) is widely implemented in various countries. McGuire et al. (2016) developed BrIM for inspection and evaluation [
7]. This method provides solutions for collecting, storing, and using location-based damage information based on building information models (BIMs). The related inspection, evaluation, and management data are linked to BIMs. Therefore, an inspector can systematically monitor the deterioration of a 3D model in real time. Tanaka et al. (2016) and Wan et al. (2019) proposed a BIM-based BMS considering an industry foundation class (IFC) extension [
8,
9]. They provided an IFC extension for maintenance data, such as deterioration or inspection results, and integrated them into web-based BIMs for multiscale visualization and collaborative management. Byun et al. (2021) built a BIM-based BMS that focused on detailed data management [
10]. A maintenance data schema and its information system were defined and incorporated using a web data management program, supporting a modeling library and bridge assessment. Li et al. (2023) developed a BIM-based BMS for managing defect data [
11]. Defect information was digitally classified using the International Framework Dictionary (IFD) standard to create a three-dimensional BIM library defect in the BIM. From the 3D defect information on BIMs, the technical condition of the bridge was evaluated using a rating system. The concept of modeling damage information and mapping using BIMs is the basis for establishing a knowledge base for bridge structural health-monitoring systems [
12,
13]. Petti et al. (2023) studied enhancing the inspection guidelines of Italy by using BIMs and multidisciplinary efforts. The authors also introduced 3D modeling with IFC and geometric scanning and an integrated operational model for inspection activities to ensure the dynamic quality control of the congruence of the description and correctness of inspection results [
14].
Despite the potential advantages of BrIM implementation for maintenance, there are challenges to its broad use: defining BIMs to satisfy owner demands and establishing efficient BIM procedures for existing bridges [
6]. In the literature, digitized BMS platforms use commercial BIM software such as Revit and Midas CIM [
10,
11,
15], which may lead to data exchange problems among different software technologies [
16,
17]. Thus, most studies have used IFCs to convey BrIM from the construction to the maintenance phase [
8,
9,
14,
18,
19,
20,
21]. However, these methods are only valid when BIM technology is introduced to the target bridges. The South Korean maintenance authority manages more than 38,000 bridges constructed without BIMs, and huge amounts of human resources and expenses are required to digitize them if existing BIM solutions are used. In addition, bridge managers who were interviewed for this study mentioned that BIMs increase their workload because of their incompatibility with existing management systems. Therefore, a different approach is required for BrIM-based BMSs in existing bridges.
This study aimed to develop a BrIM-based BMS for existing bridges that were originally constructed without BIMs. The research philosophy is primarily interpretivism in nature. The central importance lies in the definition of data for bridge maintenance, a definition derived from actively engaging with the perspectives and experiences of current maintenance practitioners. This approach aligns with interpretivism’s core principles, emphasizing the exploration of subjective meanings and contextual nuances. This study conducted the following steps: planning, architectural design, system development, and implementation (
Figure 1). To better understand the practical requirements during the planning, interviews were conducted among three key groups: bridge owners, managers, and outsourced inspection companies. The information and functional requirements obtained from these interviews were used to design the system architecture of a BrIM-based BMS, which facilitates data exchange with the existing facility management system (FMS). During the development, a data-driven modeling approach that imports fundamental data from the FMS was adopted for efficient 3D modeling. This approach enables model generation using a model library and templates with minimal human intervention. A mapping method was implemented to visualize the inspection data within the 3D models. To ensure effective data management, an inventory code system was incorporated, enabling the organized storage and retrieval of not only the maintenance history but also new inspection data. This code system also facilitated the automatic quantification of defect data and bridge assessments. With these features, the developed BrIM-based BMS can support decision-making by providing data aggregation, dashboards, and reporting functionalities. A case study shows the implementation of the system, and its feasibility, limitations, and scalability for additional features are discussed.
2. Information and Functional Requirements from Interviews
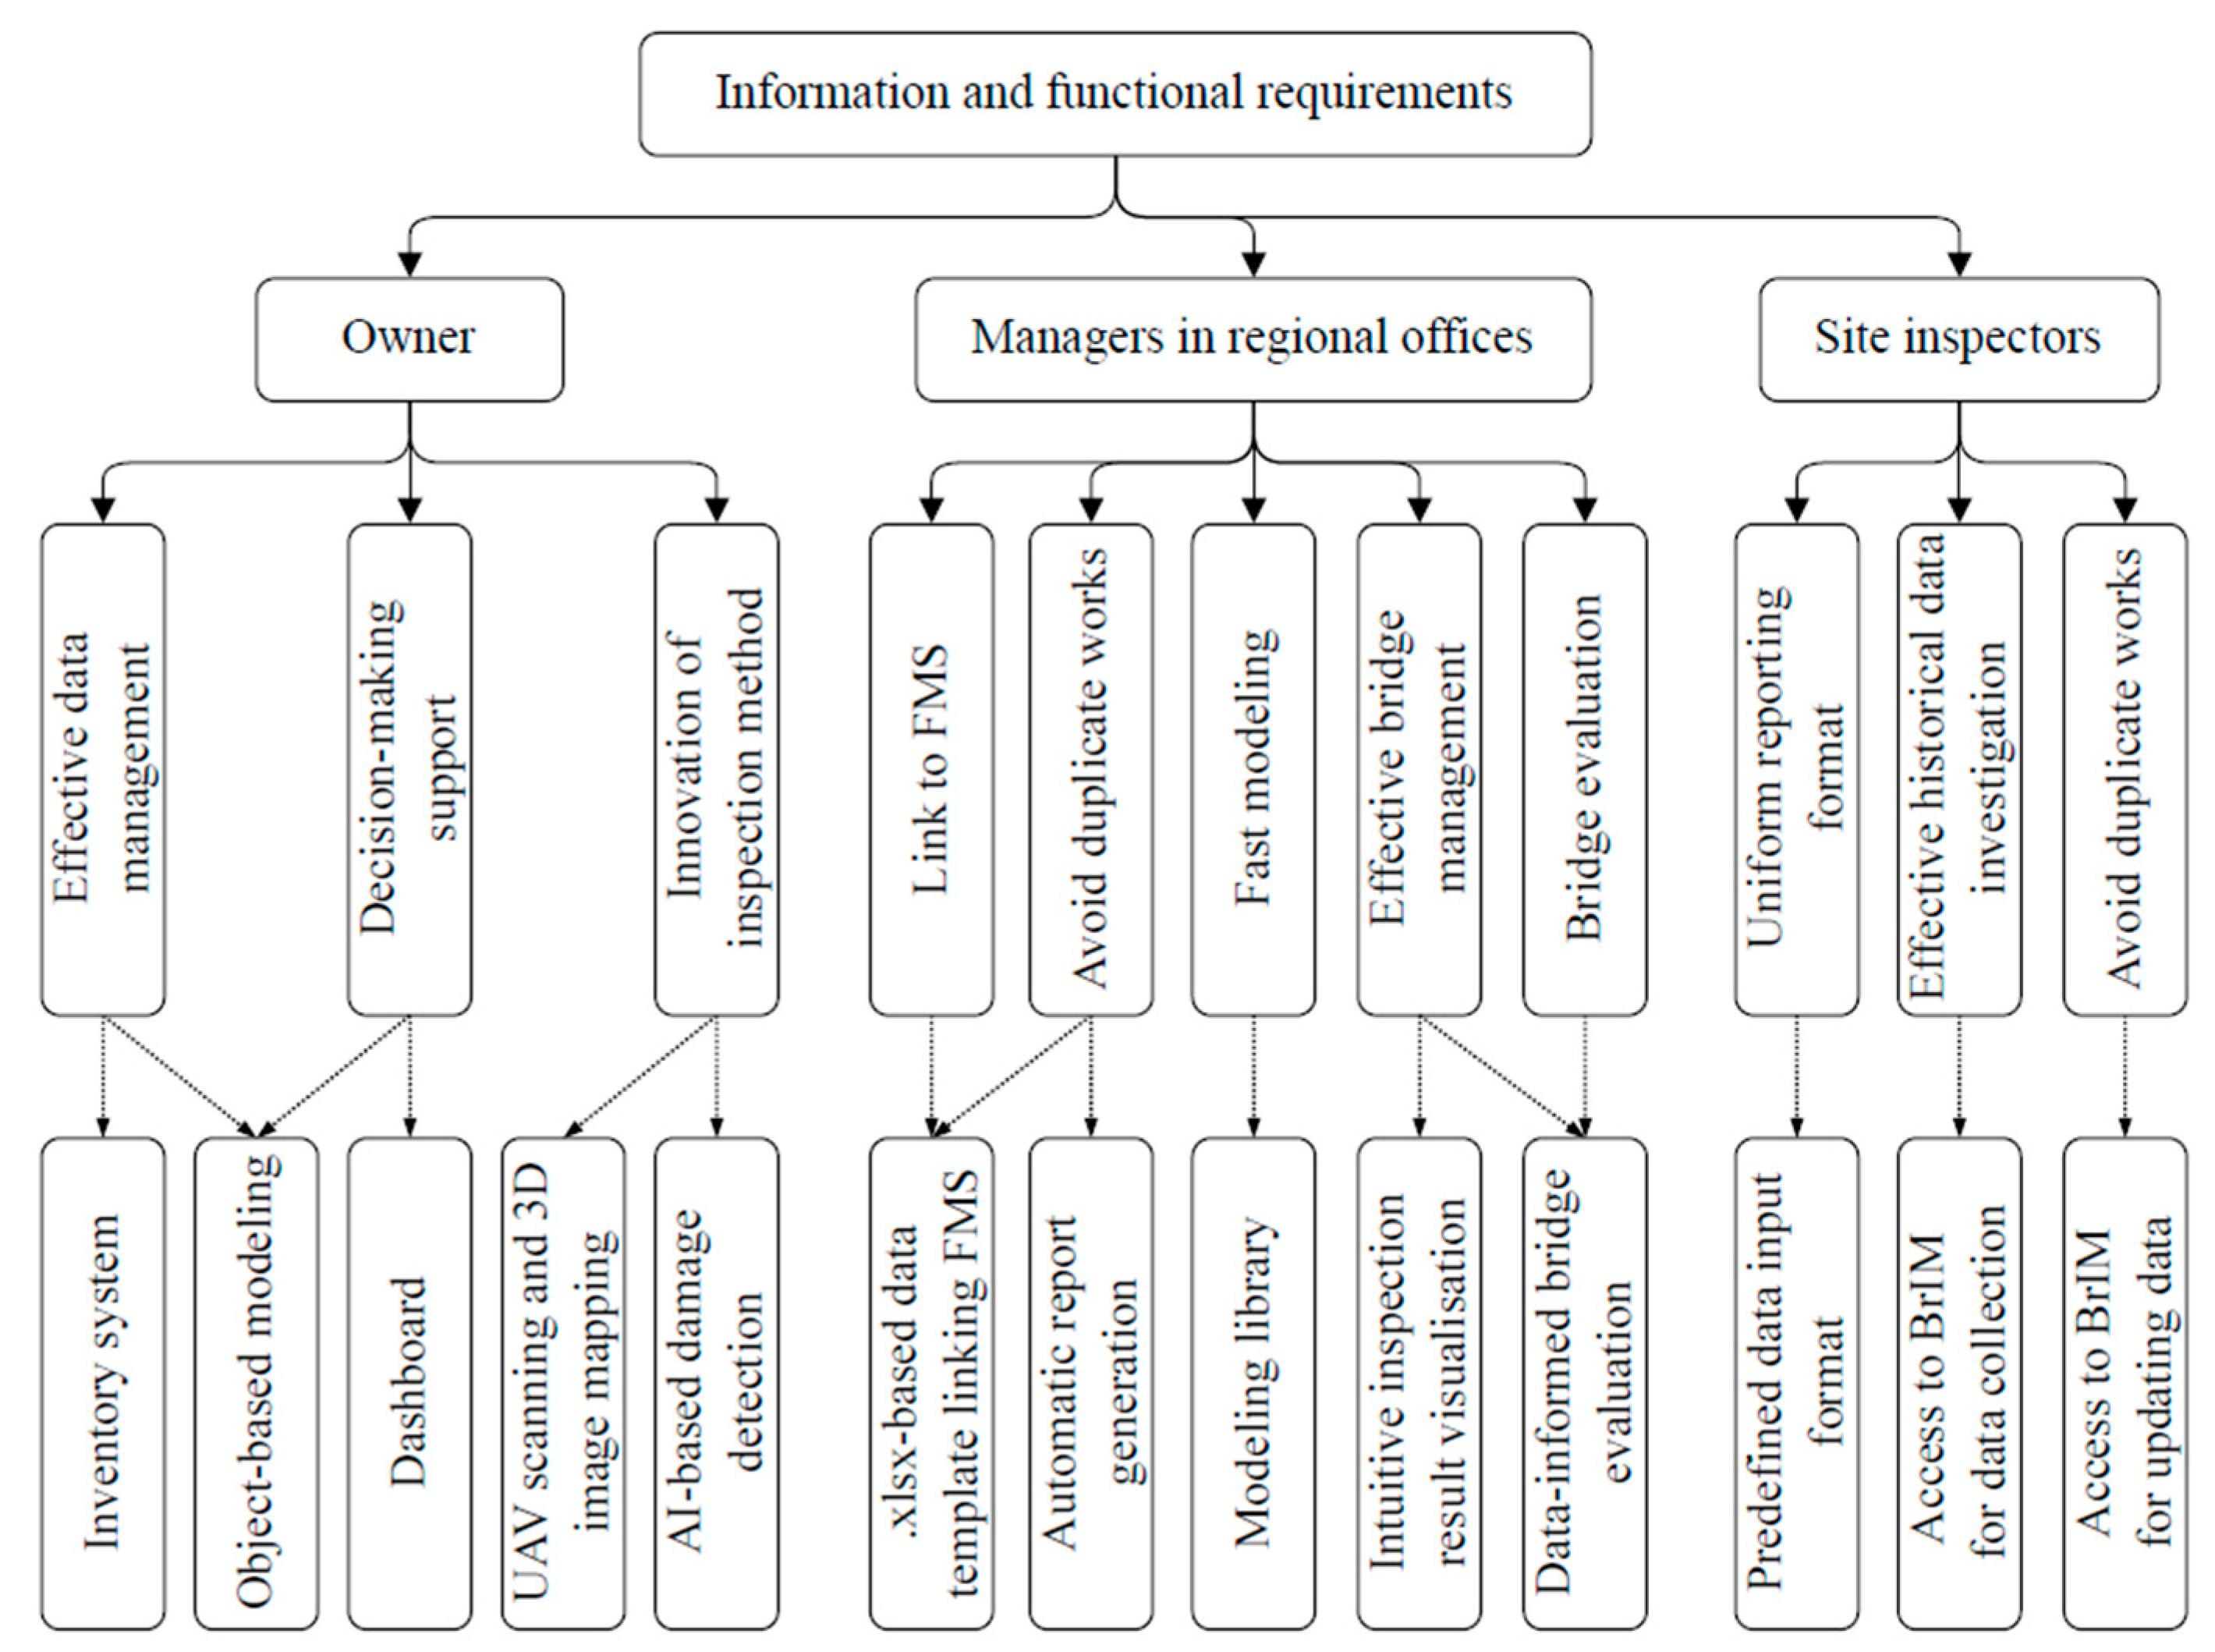
When selecting interviewees, stakeholders regarding bridge maintenance and potential users of the BrIM-based BMS were considered. Notably, the Korea Expressway Corporation (KEC), responsible for managing all highway bridges in South Korea, played a crucial role by providing continuous feedback on the development direction to achieve practical implementation of BrIM. They also recommended relevant interviewees involved in bridge maintenance. The KEC has regional offices responsible for each area. Regional offices regularly inspect roads and facilities within their jurisdictions and upload relevant information to the FMS. However, because of the many facilities managed by each office, compared to the number of personnel available, only essential visual inspections are performed. Thus, specialized third-party companies are outsourced for safety inspections, which are performed at least once every two years. In this context, the interviewees were categorized into three groups: owners, managers in regional offices, and site inspectors. Owners indicate managers in KEC headquarters, including around 20 individuals from a structure management department, an individual from a design department, and five researchers on structural maintenance from the KEC research center. Managers were employees from two regional offices of the KEC, and a case study was conducted on a bridge managed by one of the regional offices. Lastly, site inspectors were employees of a bridge inspection company who had conducted inspections for numerous highway bridges for more than 20 years.
After the inspection tasks are completed by the third-party companies, reports are submitted and reviewed by managers in regional offices and uploaded to the FMS. Important information, such as assessed grades, damage amounts, and expected repair costs, is directly entered, whereas most of the extensive content is uploaded in the document file format. Based on the uploaded information, the KEC determines the direction and budget for future maintenance. This approach faces limitations as the number of aging bridges rapidly increases. Consequently, the prioritization of actions became challenging, and maintenance costs significantly increased. Action through a rational evaluation was required before rapid deterioration occurred, but the time required to analyze information for evaluation increased, and the reliability did not meet expectations. Therefore, the requirement for renovating the maintenance system to efficiently store, manage, and utilize information emerged, and the KEC aimed to solve this through BrIM. To implement BrIM, we interviewed bridge maintenance stakeholders to understand the information and functional requirements, as shown in
Figure 2. This section introduces the detailed requirements and their links to the functions reflected in BrIM. Detailed descriptions of these features are provided in the following sections.
2.1. Information and Functional Requirements from Owners
The owner, the KEC, faced many challenges in improving the existing FMS using BIMs. Because the FMS is closely connected to various related agencies, regulations, and subsystems and has accumulated vast amounts of data, system renovation is not a problem that can be addressed by a single organization. Therefore, its goal was to gradually transform the existing maintenance system into a BrIM system while maximizing the use of existing information and making it flexible enough to adapt to future system changes. The requirements were categorized as follows.
Effective data management: An essential requirement of BrIM is that information be stored and processed immediately in the form desired by users. Because inspections and evaluations of bridges are performed at the component level, modeling and information storage formats must be defined, classified, and compiled according to user requirements. Therefore, both existing document-based information and newly acquired data were digitized and stored through inventory systems and object-oriented modeling to increase accessibility to user-specific information about each component.
Support decision-making: A function is required to efficiently display the collected information for a better maintenance decision-making process. The owners demanded various statistical analyses based on variables such as evaluation grades, regional classifications, damage classifications, and cost classifications of bridges to prioritize maintenance. Therefore, dashboard and reporting functions were incorporated into BrIM to display the results in chart form or to enable the direct acquisition of relevant numerical values.
Innovation of inspection methods: Many innovative inspection methods performed in the past are difficult to apply in practice without improvement of the maintenance information input platform (references should be added). This is because new forms of information require defining new ways of exchanging information and often require secondary data curation. However, professional personnel that can perform this task are limited. Therefore, new technologies must enable users to utilize and share information immediately upon incorporation into BrIM without any secondary processing. BrIM defines a predefined data input method that reflects the characteristics of new technologies and enables the use of data without secondary data processing. In response to the owner’s requirements, as a prototype BrIM in step-by-step development, UAV (unmanned aerial vehicle)-based visual inspection improvements and AI-based damage detection using scanned model images were considered.
2.2. Information and Functional Requirements from Managers in Regional Offices
The requirements of managers in regional offices are more focused on a practical perspective. Their most frequent claim regarding new system development was that their work styles and working conditions were not considered. They stated that the previously developed systems always came with additional tasks rather than reducing the workload, leading to a repetitive pattern in which they could not be appropriately used and were eventually abandoned. The requirements for avoiding this problem were categorized as follows:
Avoiding duplicate work and linking to the FMS: Managers in regional offices perform two duplicate indoor tasks for bridge maintenance: reporting and data uploading. To date, the management of bridges in the area has been based on reports; however, the FMS is designed to manage the entire infrastructure. Therefore, the formats are different. Consequently, managers must perform redundant tasks of collecting data for report writing and processing data again for uploading, increasing workload and leading to missing data uploads to the FMS owing to limited personnel. Therefore, the newly developed BrIM considered an .xlsx-based data template that is familiar to existing practitioners, enabling changes in the management system, automatic report generation, and reduced work time with a single data input. Practitioners can input data based on this template and upload them to BrIM and the FMS without additional work.
Fast modeling: One of the most significant issues in utilizing BrIM for maintenance is the modeling of numerous bridges. Most existing bridges lack BIM-related data and lose design data, except for basic information recorded in the FMS or stored only in hard-copy format. Therefore, a modeling library that requires minimal information has been suggested, enabling the modification of details to increase the level of detail (LOD) as required.
Improved bridge management and evaluation: The top priority of maintenance managers should ensure bridge safety and take appropriate measures to prevent accidents. The problem is that the job rotation system of the KEC results in managers changing every three years. Therefore, new managers find it challenging to quickly understand the status of bridges within their jurisdiction, and they mostly rely on outsourcing evaluations, which are conducted every 2–3 years. The outsourced company simultaneously evaluates several bridges and takes several months to complete the data collection, site inspection, evaluation, and report writing. Consequently, managers have demanded BIM functions that enable them to intuitively check the inspection and evaluation results of bridges based on input data. Through an inventory system, managers can collect and classify information in the desired manner, and each result can be visualized to facilitate communication with users.
2.3. Information and Functional Requirements from Site Inspectors
The site inspectors indicated in
Figure 2 refer to personnel dispatched from outsourced companies for bridge evaluation. According to the interview responses, most of the bridge evaluation period was dedicated to researching information regarding the bridges and writing reports on the inspection results. Owing to security issues, outsourced companies could not access the FMS and had to analyze soft and hard copies of the previous maintenance history and design data provided by the KEC, which had to be repeated for every bridge evaluation. In addition, while there were regulations for report-writing items, there was no standardized format, resulting in different forms of investigation content depending on the outsourced company. This inconsistency caused more time to be spent analyzing the information and resulted in information loss because the reports were summarized when the evaluation results report was created. Consequently, BrIM considered granting temporary access rights to outsourced companies to search for information only for target bridges and enabling inspectors to directly upload inspection and evaluation results based on the predefined data input format.
3. Development of the BrIM-Based BMS
3.1. System Architecture
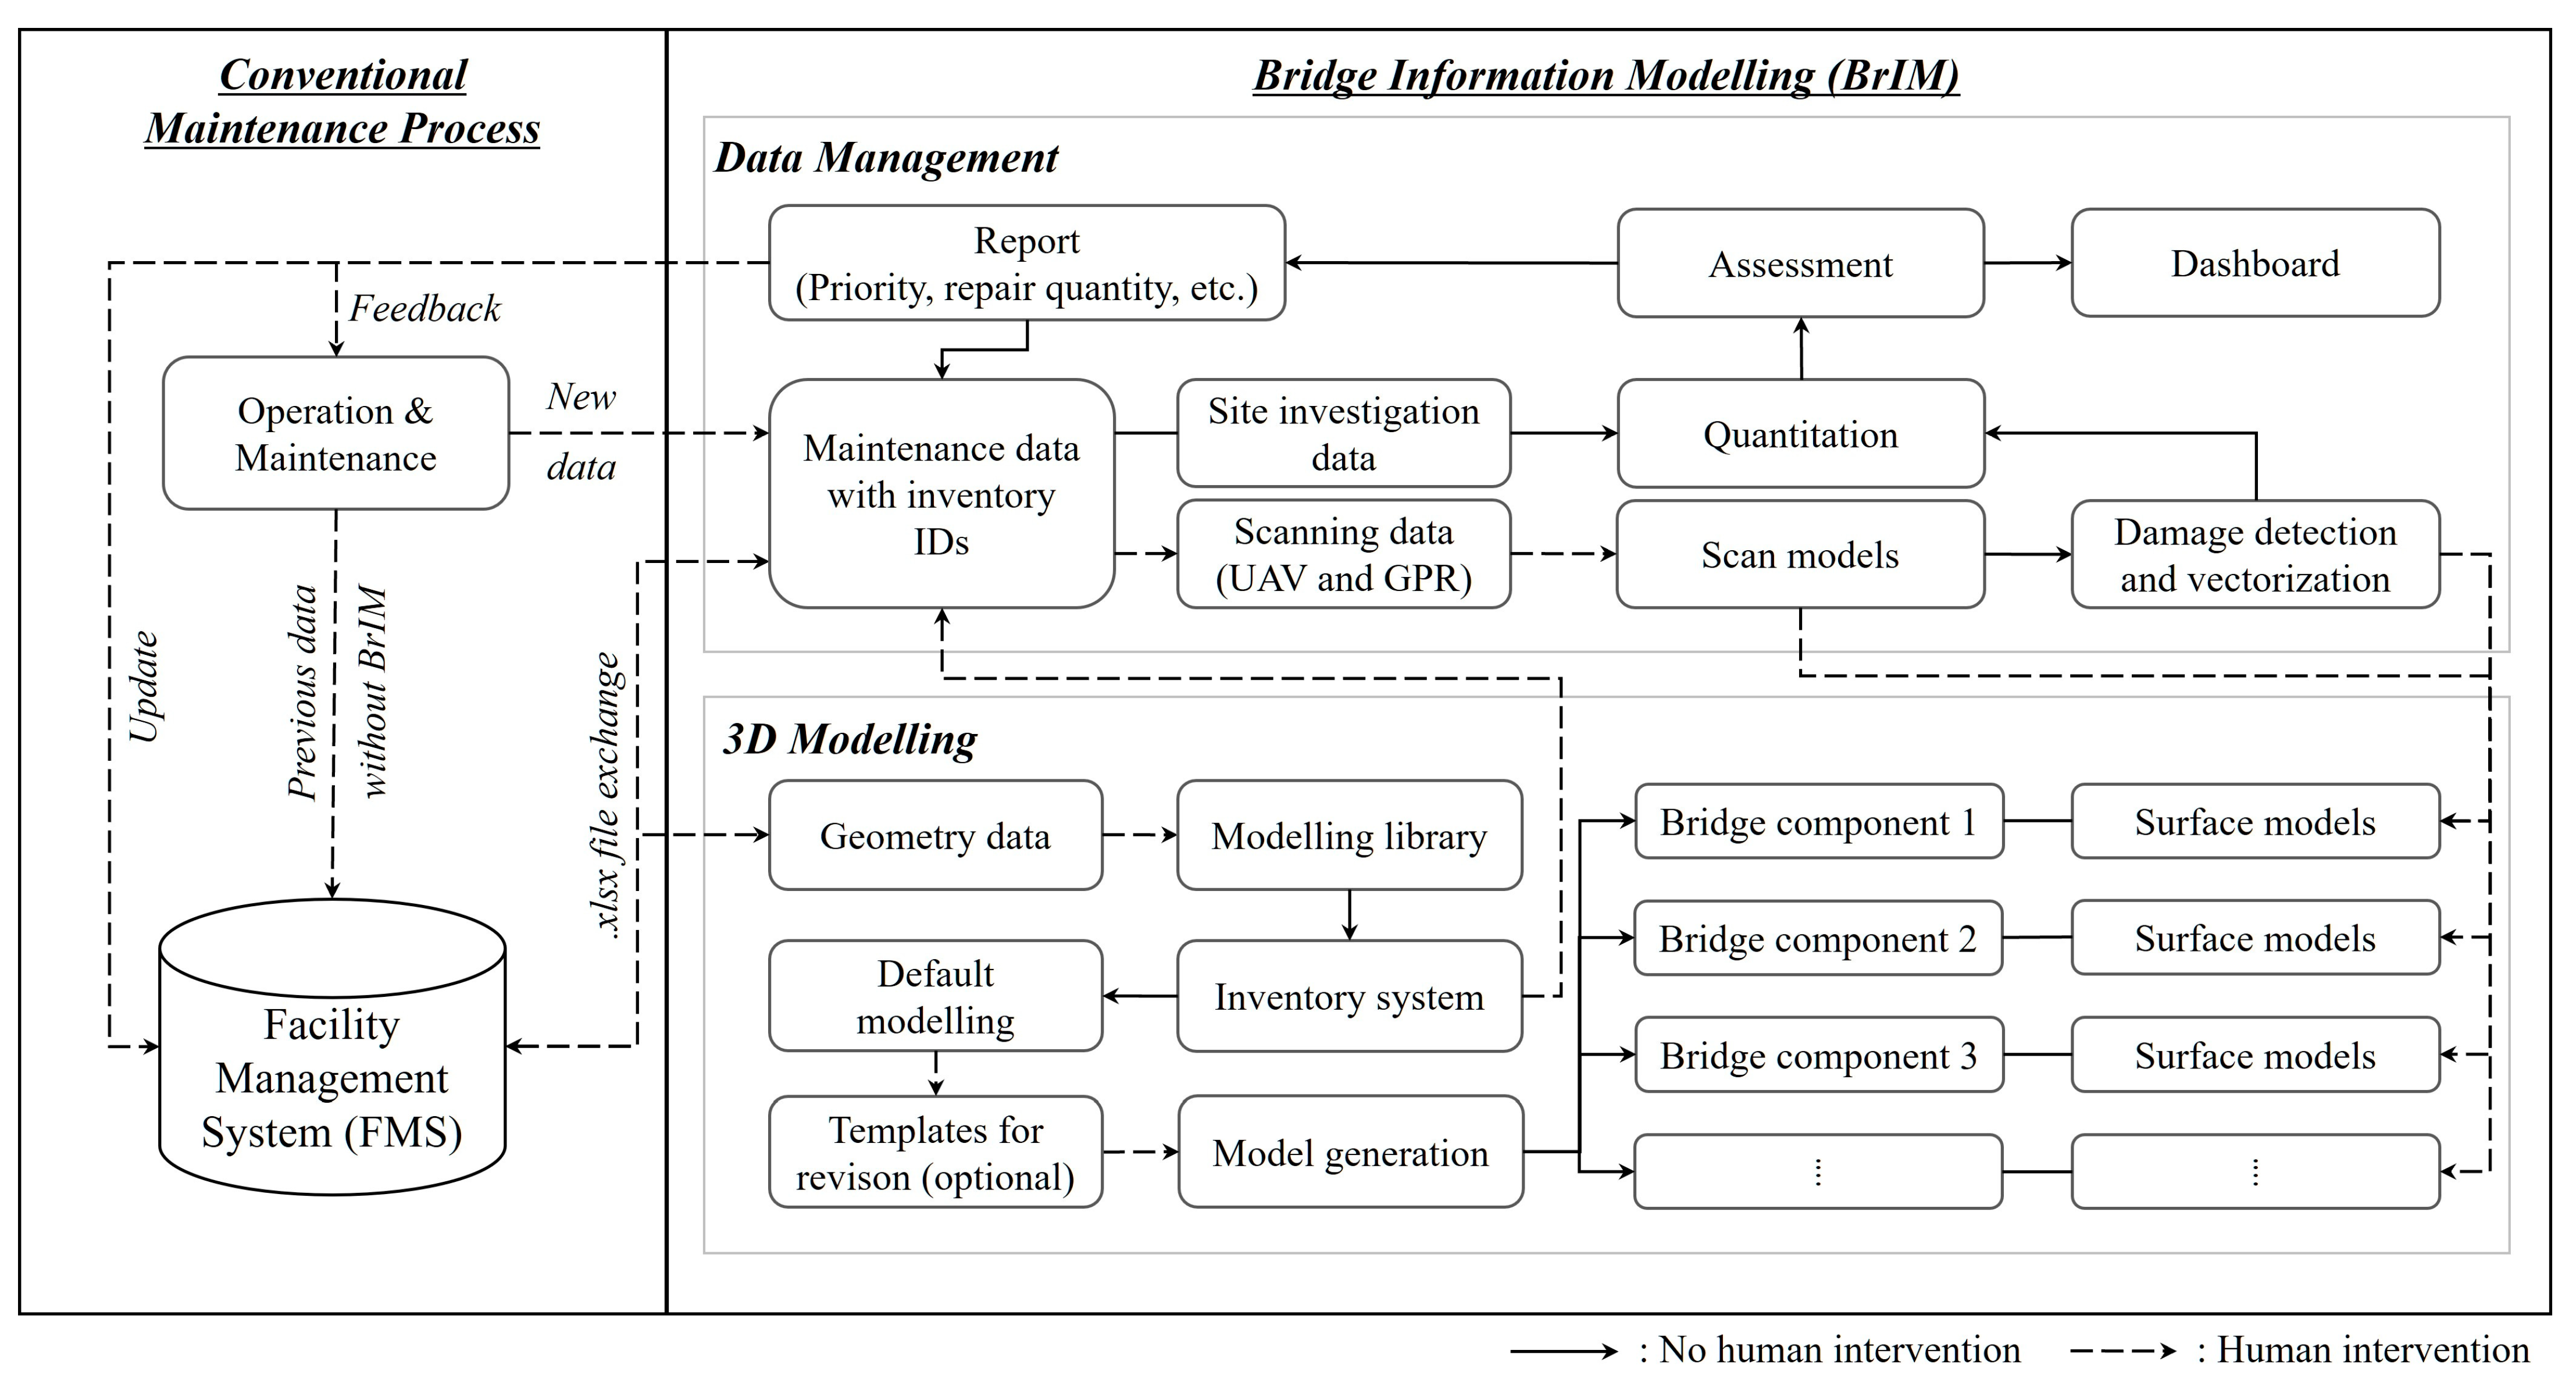
Based on this information and functional requirements, a BrIM-based BMS was designed, as shown in
Figure 3. The initial step of the BrIM operation is to import the fundamental data of the target bridges from the FMS. As mentioned in
Section 2, owing to the loss or incomplete digitization of data for existing bridges in the FMS, the utilization of fundamental data was considered to ensure stable data collection. To minimize human intervention during the modeling process, a modeling library, templates, and inventory system were considered, and the concepts of a surface model and mapping were applied to store damage information. Damage information obtained through visual inspections, UAVs, and GPR (ground penetration radar) scanning was stored in each object according to the inventory system. Although human intervention is required during the data input process, the quantification and evaluation procedures are performed automatically within the system. Additionally, dashboards and reporting functionalities were considered to enhance usability, enabling users to determine the direction of future maintenance based on the provided information. Detailed explanations are presented in the following subsections.
3.2. Three-Dimensional Modeling
In the case of 3D modeling, the greatest challenge is the time required for numerous existing bridges without BrIM data. Manual modeling is expected to require an enormous amount of time because there are many different bridge types, dimensions, and conditions. Moreover, time is required to establish computer-readable design data using traditional 2D drawings. To address these challenges, Partala (2022) suggested a data-driven modeling approach by importing data from the national registry of bridges [
22]. By referring to this method, BrIM proposed in this study was designed to generate 3D bridge models based on predefined data templates (with a modeling library) and gather data from the FMS. The templates included fundamental information regarding the superstructure and substructure types and dimensions, as listed in
Table 1. The modeling template has exactly the same format exported from the FMS to improve data handling efficiency, and is exported or imported with .xlsx files using Microsoft Excel. The undefined dimensions for details, except for the fundamental information, can be provided with default values according to the structural types and standard design drawings, which enables the bridge details to be automatically generated in the model based on the modeling library. Because the 3D models in the system are intended for maintenance, the LOD is typically lower than that for construction. All elements targeted for inspection (generally defined in the national inspection manual) must be represented in a 3D model and specified in the inventory system. Therefore, 3D models can be generated by importing the .xlsx files from the FMS, and the least human intervention is required, if necessary.
3.3. Inventory System
The use of identifiers (IDs) is crucial to ensure the proper assignment of inspection data and facilitate data aggregation for quantitation. The FHWA’s National Bridge Inventory specifications [
23] define the government-led inventory coding guidelines for bridge maintenance. These coding guidelines encompass information such as geometry, structure type, materials, and inspection details, represented as codes and stored in the National Bridge Inventory database. This centralized database enables efficient analysis and management of the status of bridges. Regarding data exchange in the context of BIM solutions, the IFC has established standards to facilitate interoperability. However, the current focus of these standards primarily revolves around design-to-construction information exchange, and their application to bridge projects has gained traction only recently. Although some studies have explored the incorporation of maintenance-related information (damage, repair, etc.) into BIMs using the IFC bridge schema [
8,
24,
25], these efforts have primarily focused on 3D modeling.
Therefore, a detailed inventory coding system for bridge maintenance was suggested in a previous study [
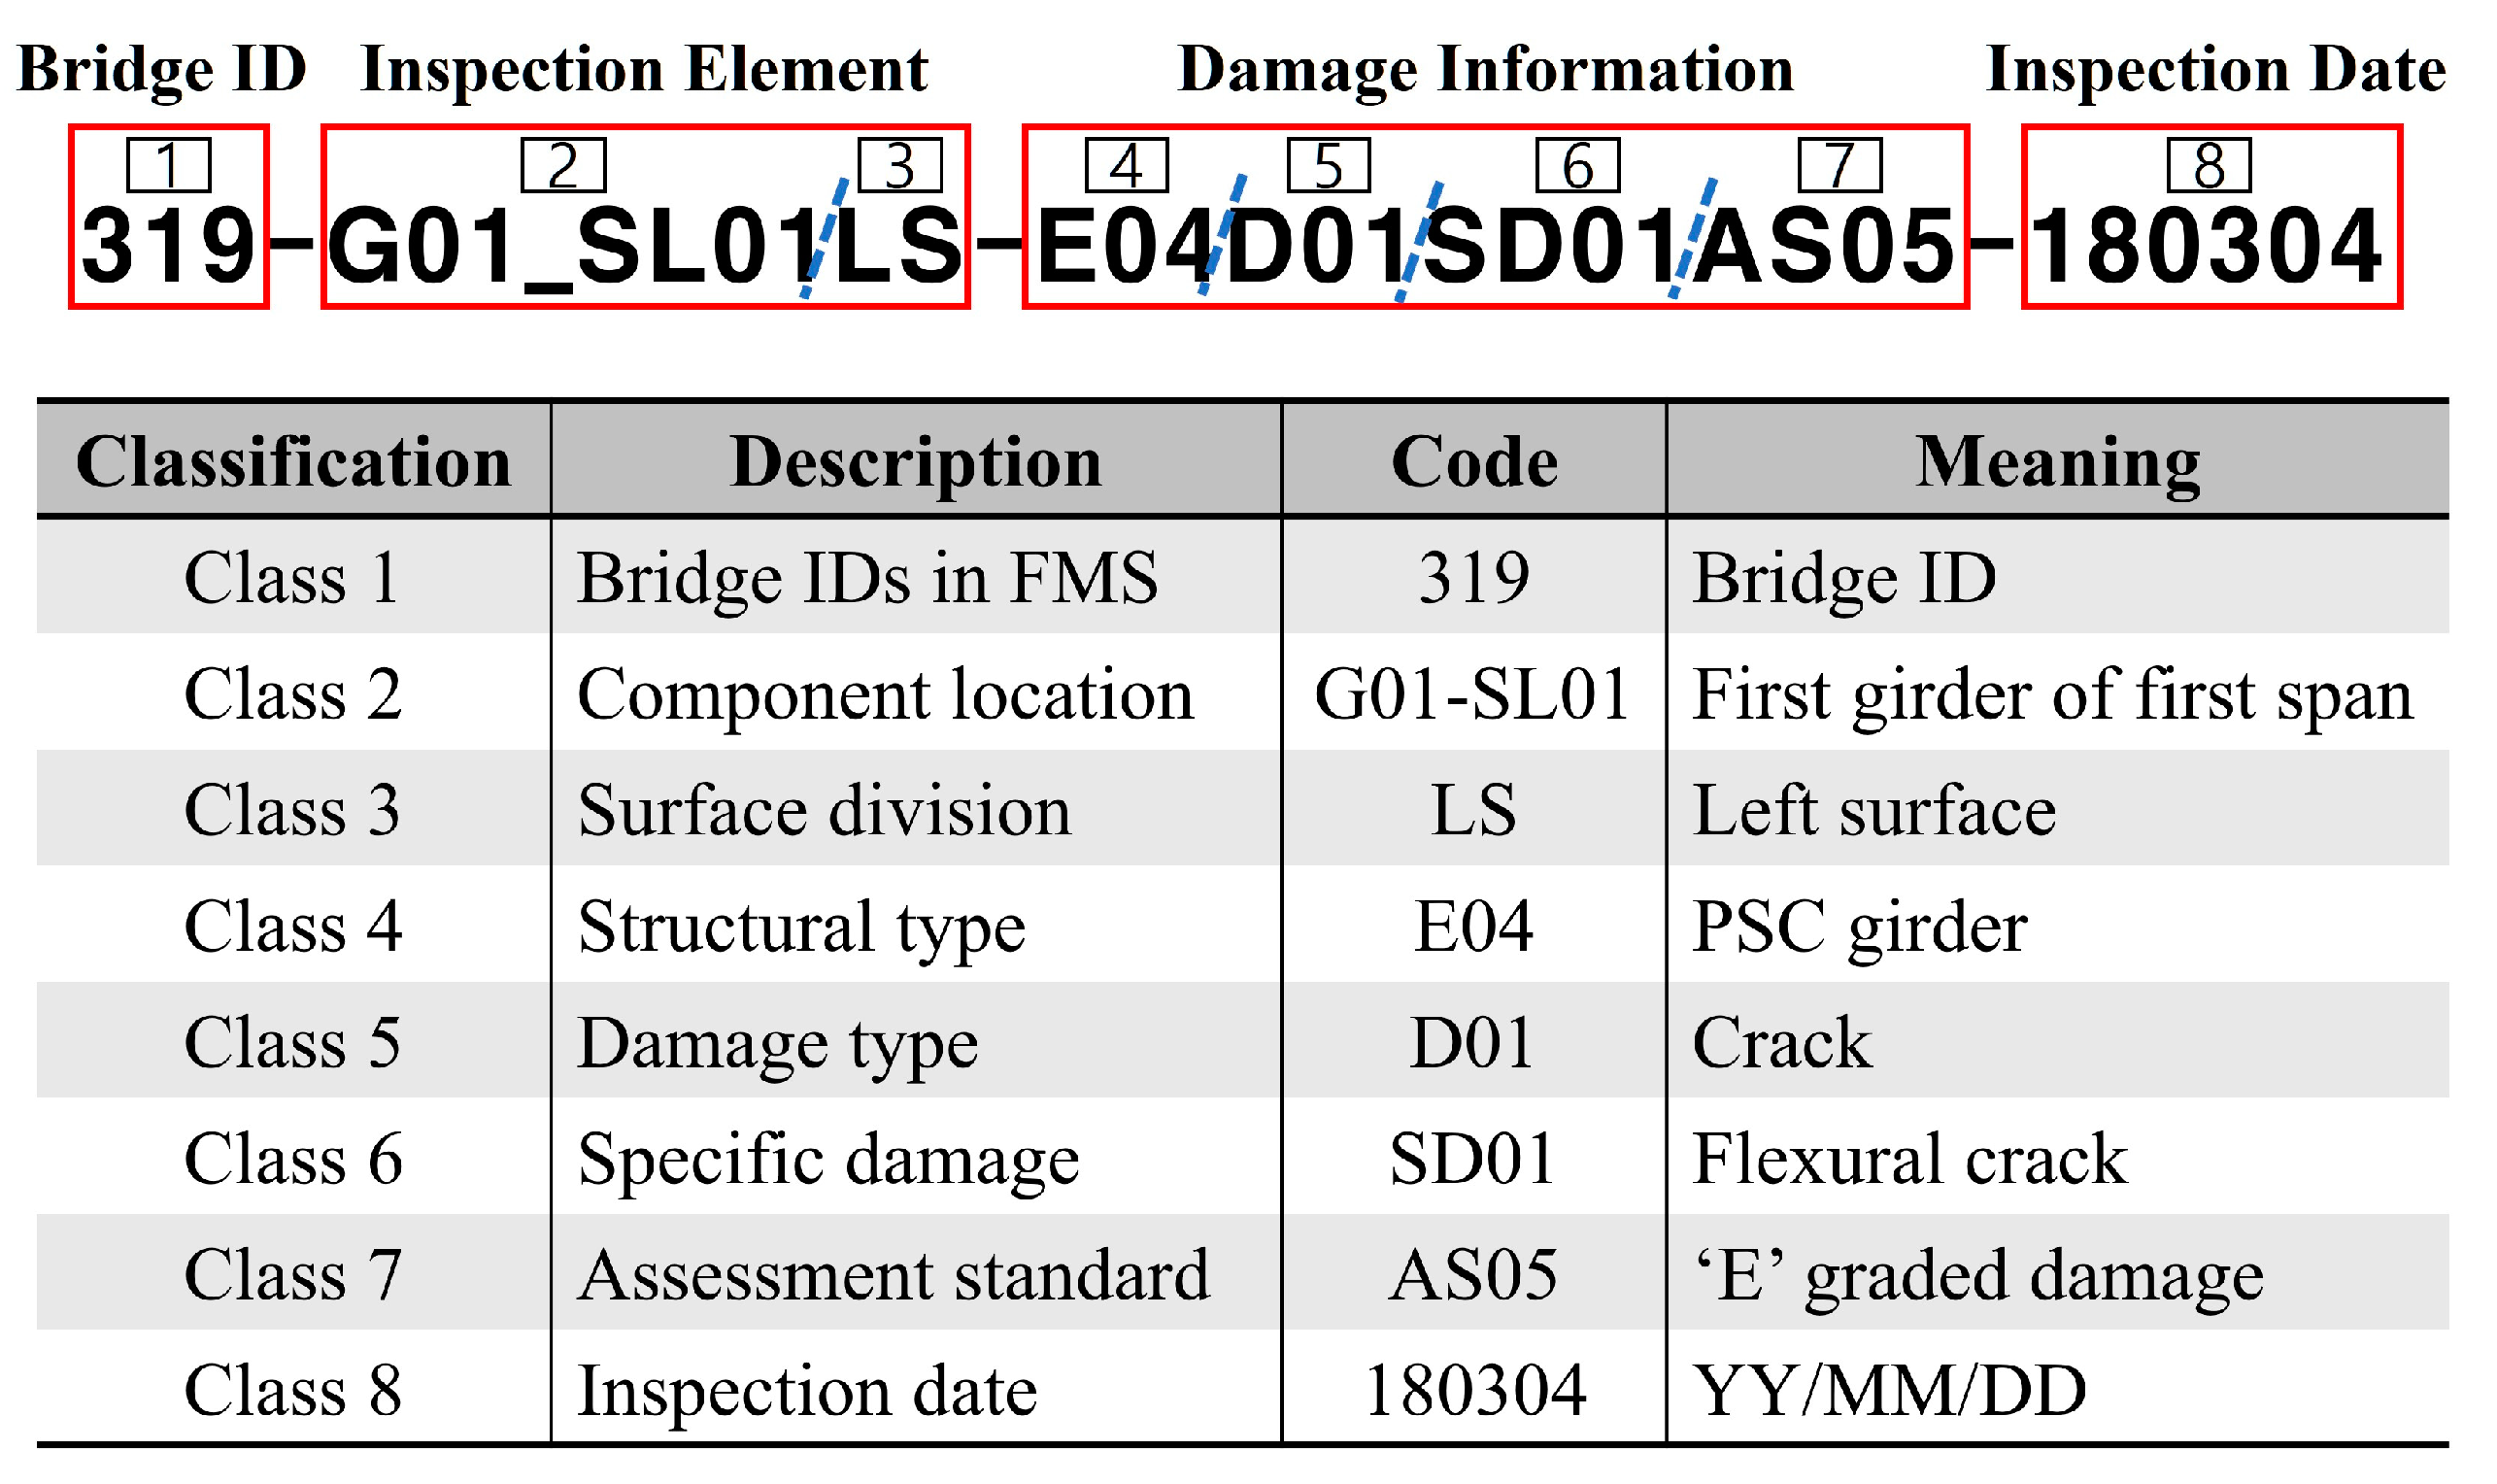
26], and
Figure 4 shows the coding system for PSC bridges as an example. The codes used in BrIM comprise four main categories: “Bridge IDs,” “Inspection Elements,” “Damage Information,” and “Inspection Date.” Bridge IDs have already been defined in FMSs and BrIM refers to them for consistency. Inspection Elements indicate the location of the inspected bridge components, and the surfaces are divided into left, right, top, and bottom to facilitate image mapping. The Damage Information code follows the damage assessment standard outlined in the National Maintenance Guidelines of South Korea [
27]. These guidelines define specific damage types according to the bridge components, and the severity of each type is classified into five grades, ranging from “A” (excellent) to “E” (very poor), based on the assessment criteria. By employing this standardized coding system, the inventory of bridge data becomes comprehensive and enables efficient sorting of information for further bridge assessment. Each code is accompanied by a timestamp that represents the inspection date, which enables proper tracking and monitoring of bridge conditions over time. Specific details regarding the assessment process are presented in
Section 3.6, which provides a comprehensive overview of the evaluation criteria and methods employed in the inspection process.
3.4. Inspection Data According to the National Maintenance Guideline
The maintenance of highway bridges in SouthKorea is based on the national guidelines [
27]. The data attributes of the inspection history of the concrete bridges listed in
Table 2 were defined according to the inspection items for bridge assessment defined in the guidelines. Additional data not specified in the criteria were also defined from the manager’s requirements for their own purpose in the bridge management system, such as GPR data. The data attributes were stored at the component level of the bridge based on the inventory system shown in
Figure 4, and they had a timestamp indicating the inspection date. Data input can be performed directly by users through the user interface of the BrIM system and imported immediately using a predefined .xlsx template.
3.5. Damage Detection and Vectorization from a Scan Model
In existing visual inspection methods, inspectors would collect damage types and quantities measured on site and compile them into a report format, sometimes creating a damage map based on requirements. However, only the raw data of high-priority bridges are preserved, and even those are stored in a file format, resulting in low maintenance efficiency. Therefore, in this study, the detection and quantitative evaluation of damage were performed using a machine learning model, and the results were stored in BrIM for immediate access by users within the system. As numerous related studies have already been conducted on deriving damage from images using machine-learning techniques, this study did not develop a new damage-detection method. Instead, the most promising damage-detection algorithm, the You Only Look Once (YOLO) model [
28], was adopted. YOLO is known for its real-time applications in wide-ranging object detection and classification, offering faster and more accurate results than other detection models.
Additional considerations have been made to establish an efficient system. The main challenge in surface-scan model mapping is the storage capacity of the system database. Scan models with high damage-detection precision had significantly larger files, whereas the proportion of damage within the surface models was low. Therefore, continuously accumulating scan models within the system to display damage makes the system heavy and decreases its usability. In addition, small damages, such as crack widths of less than 1 mm, are difficult to visually identify within the system, limiting the ability of inspectors to locate them. For these reasons, this study applied damage vectorization, as shown in
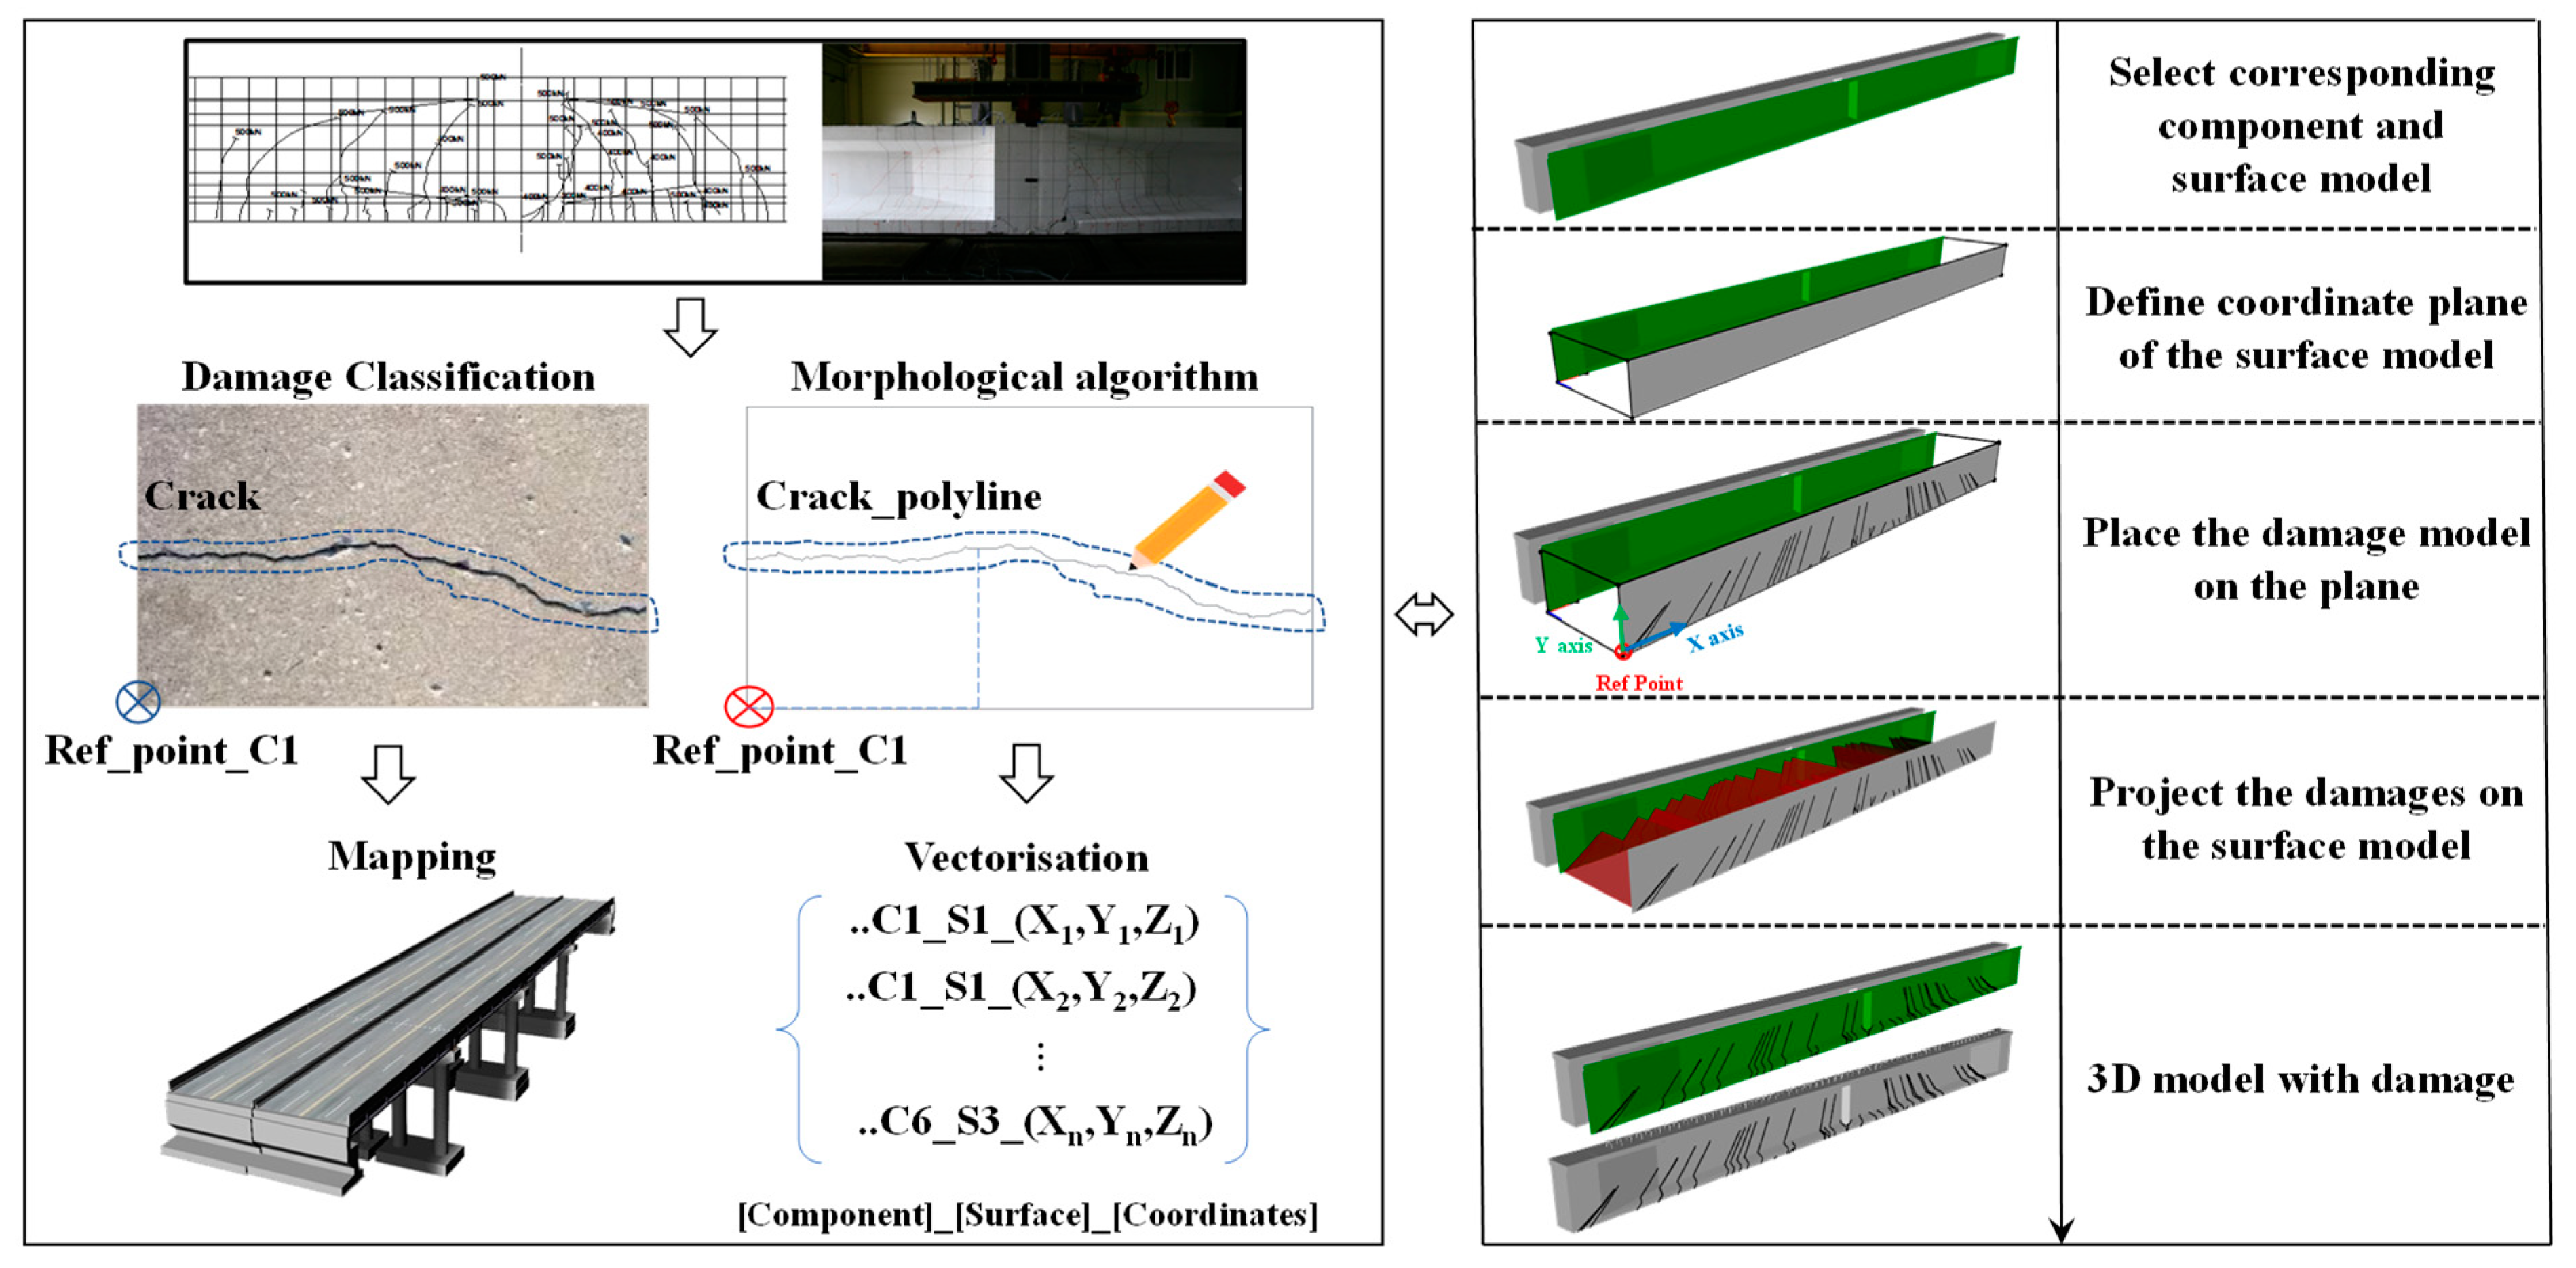
Figure 5, to enable quantitative assessment and visualization on an object-by-object basis.
The procedure for damage vectorization and its modeling were as follows. First, when damages were detected on a surface scan model by the YOLO model, the corresponding component and coordinate plane were selected from the digital model. Second, morphological algorithms (thinning, skeletonizing, etc.) were used to derive the damage model [
29], and vectorization of the detected shape was performed based on the reference point to obtain geometric data. Third, the damage model was placed on a plane and projected onto the surface of the component model. Fourth, the surface scan models were discarded or converted into lower-quality models to reduce the system’s storage load. The information obtained during this process, such as damage classification, severity, quantity, and inspection date, was stored as attribute data and included in the inventory code system. Consequently, users could manage and assess damage at the object level and intuitively track the progress of individual damages based on inspection dates.
3.6. Bridge Assessment
BrIM employed in this study includes bridge assessment procedures based on the regulations specified in South Korean bridge maintenance guidelines [
27]. According to these criteria, condition assessment is initially conducted through visual inspections at a six-month interval, and “precise safety inspection,” including safety assessment, is performed at intervals ranging from 1 to 4 years, depending on the grade and age of bridges. Moreover, for high-importance bridges or bridges with compromised safety, a “precise safety diagnosis” (
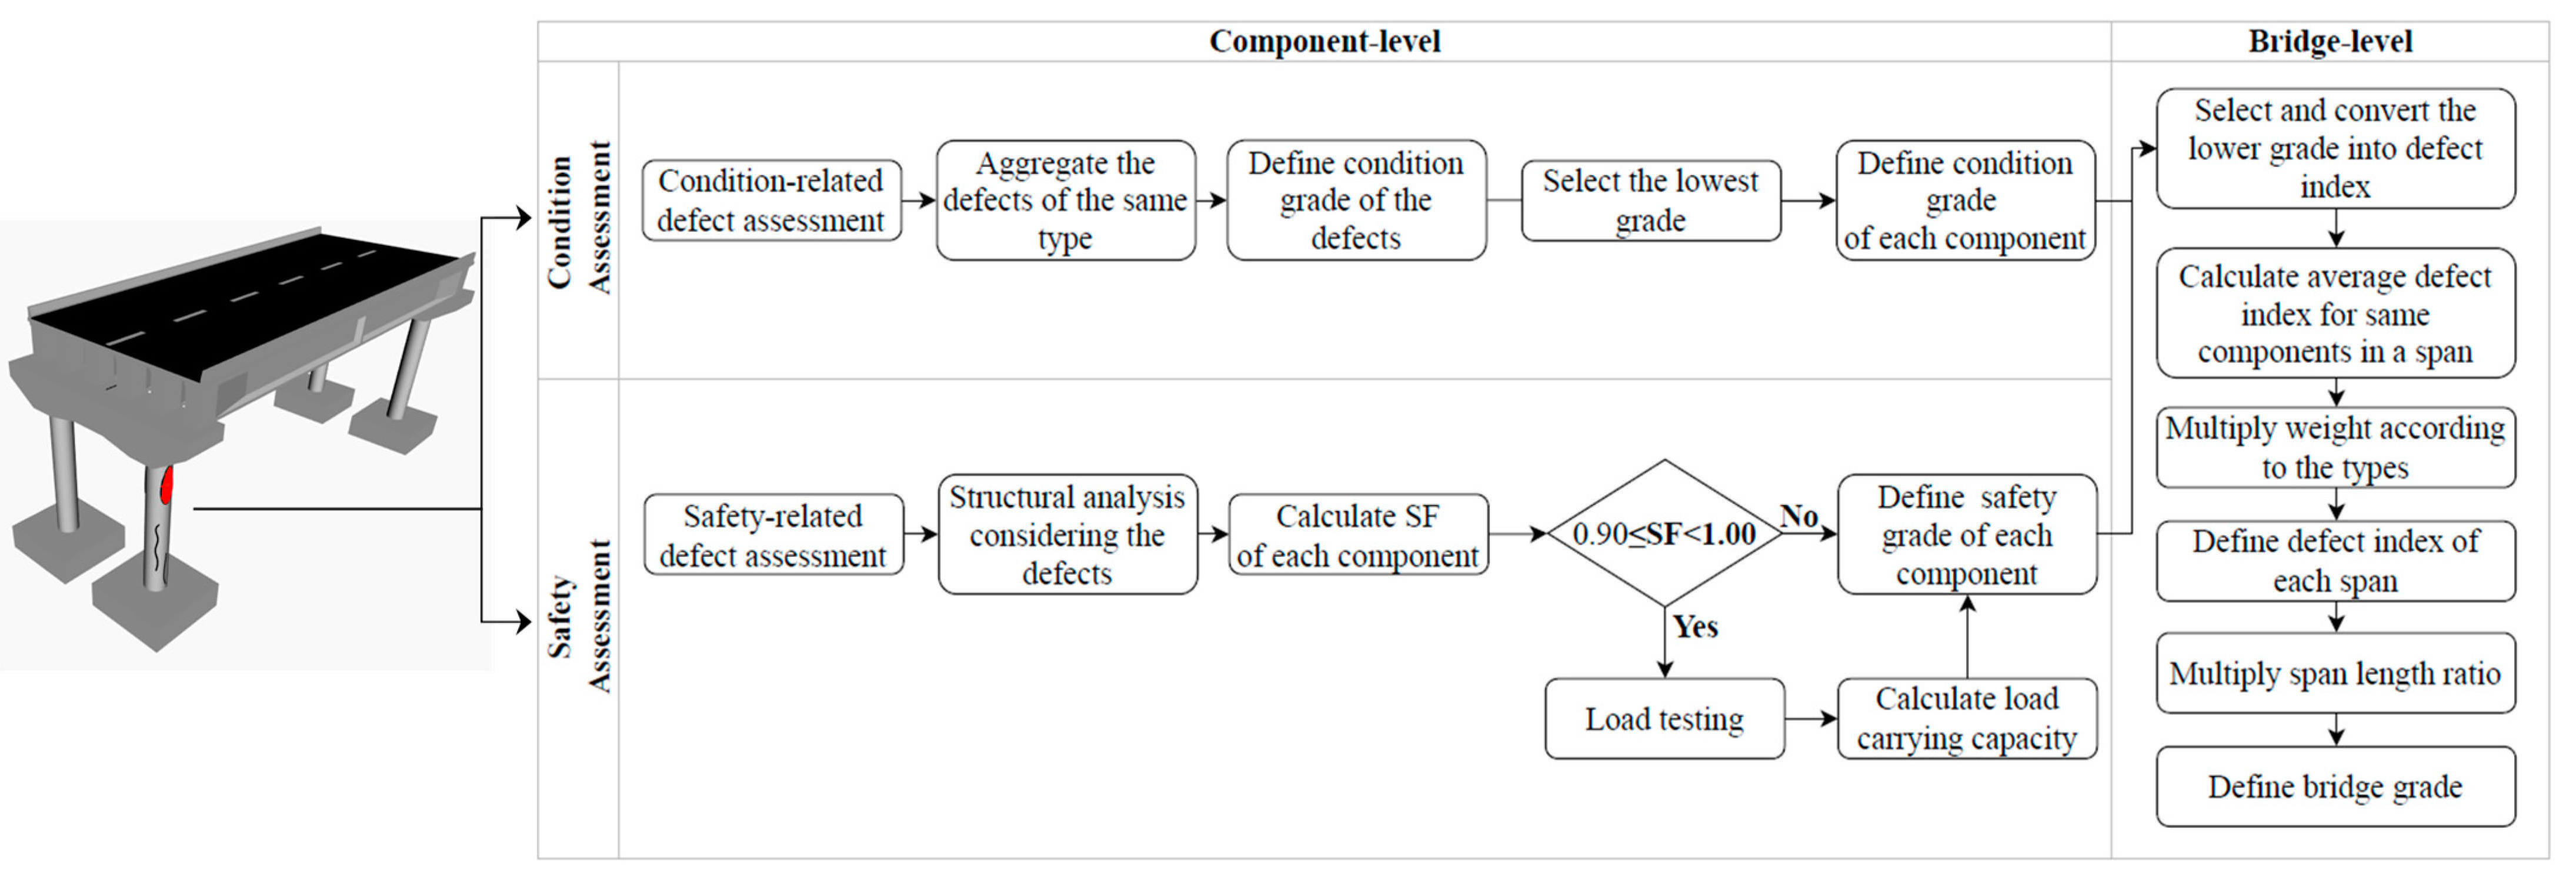
Figure 6) is conducted every 4 to 6 years, encompassing all inspection elements from lower-grade assessments, which means that establishing the precise safety diagnosis procedure in BrIM makes the lower-grade assessments feasible. In this regard, the precise safety diagnosis is analyzed, and its contents are as follows.
Condition assessment begins by aggregating defects of the same type for each bridge component, as listed in
Table 2. The defects are classified into five grades, from “A” (excellent) to “E” (very poor), based on the defect assessment criteria from the guidelines [
27], and the lowest grade (highest severity) of the defect defines the overall grade of a component if multiple defects exist. Once the component-level condition grades were determined, aggregation was performed at the span level, where the condition grades of all the components within a span were converted into a defect index (
Table 3). Subsequently, the defect indices were averaged for each component and multiplied by the weights specific to the component type, which determined the damage score for each component within a span. The span-level damage score was obtained by summing the damage scores of all the components. Finally, the span-level damage score was multiplied by the weight corresponding to the span length, and the overall bridge-level damage score was determined by summing the scores for all the spans. The bridge- and component-level condition grades were assigned based on the damage score ranges presented in
Table 3.
In the safety assessment, structural analysis, which incorporates the results of nondestructive field tests, material testing, and defect investigations, determines the safety factors for each bridge component according to Equation (1). If the safety factor (SF) is between 0.90 and 1.00, load testing is performed for a more precise evaluation, and Equations (2)–(4) are used to determine the actual load-carrying capacity of the bridge.
Table 4 presents the criteria for defining component-level grades based on the safety assessment results; the final grade for each component is defined as the lower grade between the safety and condition assessments. The bridge-level final grade was determined using
Table 3, similar to the condition assessment.
where
= safety factor
= rating factor
load carrying capacity of a bridge
system factor for different structures (steel = 1.0, concrete = 0.85)
nominal flexural moment
= ultimate flexural moment due to design load
= flexural moment due to dead load
= flexural moment due to live load
dead load factor
= live load factor
= response compensation factor
= design live load
deflection or strain response from structural analysis
= deflection or strain response from load testing
impact factor from design standards
= impact factor from load testing
Table 4.
Safety grade criteria [
27].
Table 4.
Safety grade criteria [
27].
| Grade | A | B | C | D | E |
|---|
| Safety factor | > 1.00 |
|
| < 0.90 | < 0.75 |
4. Case Study
4.1. Model Library and Template
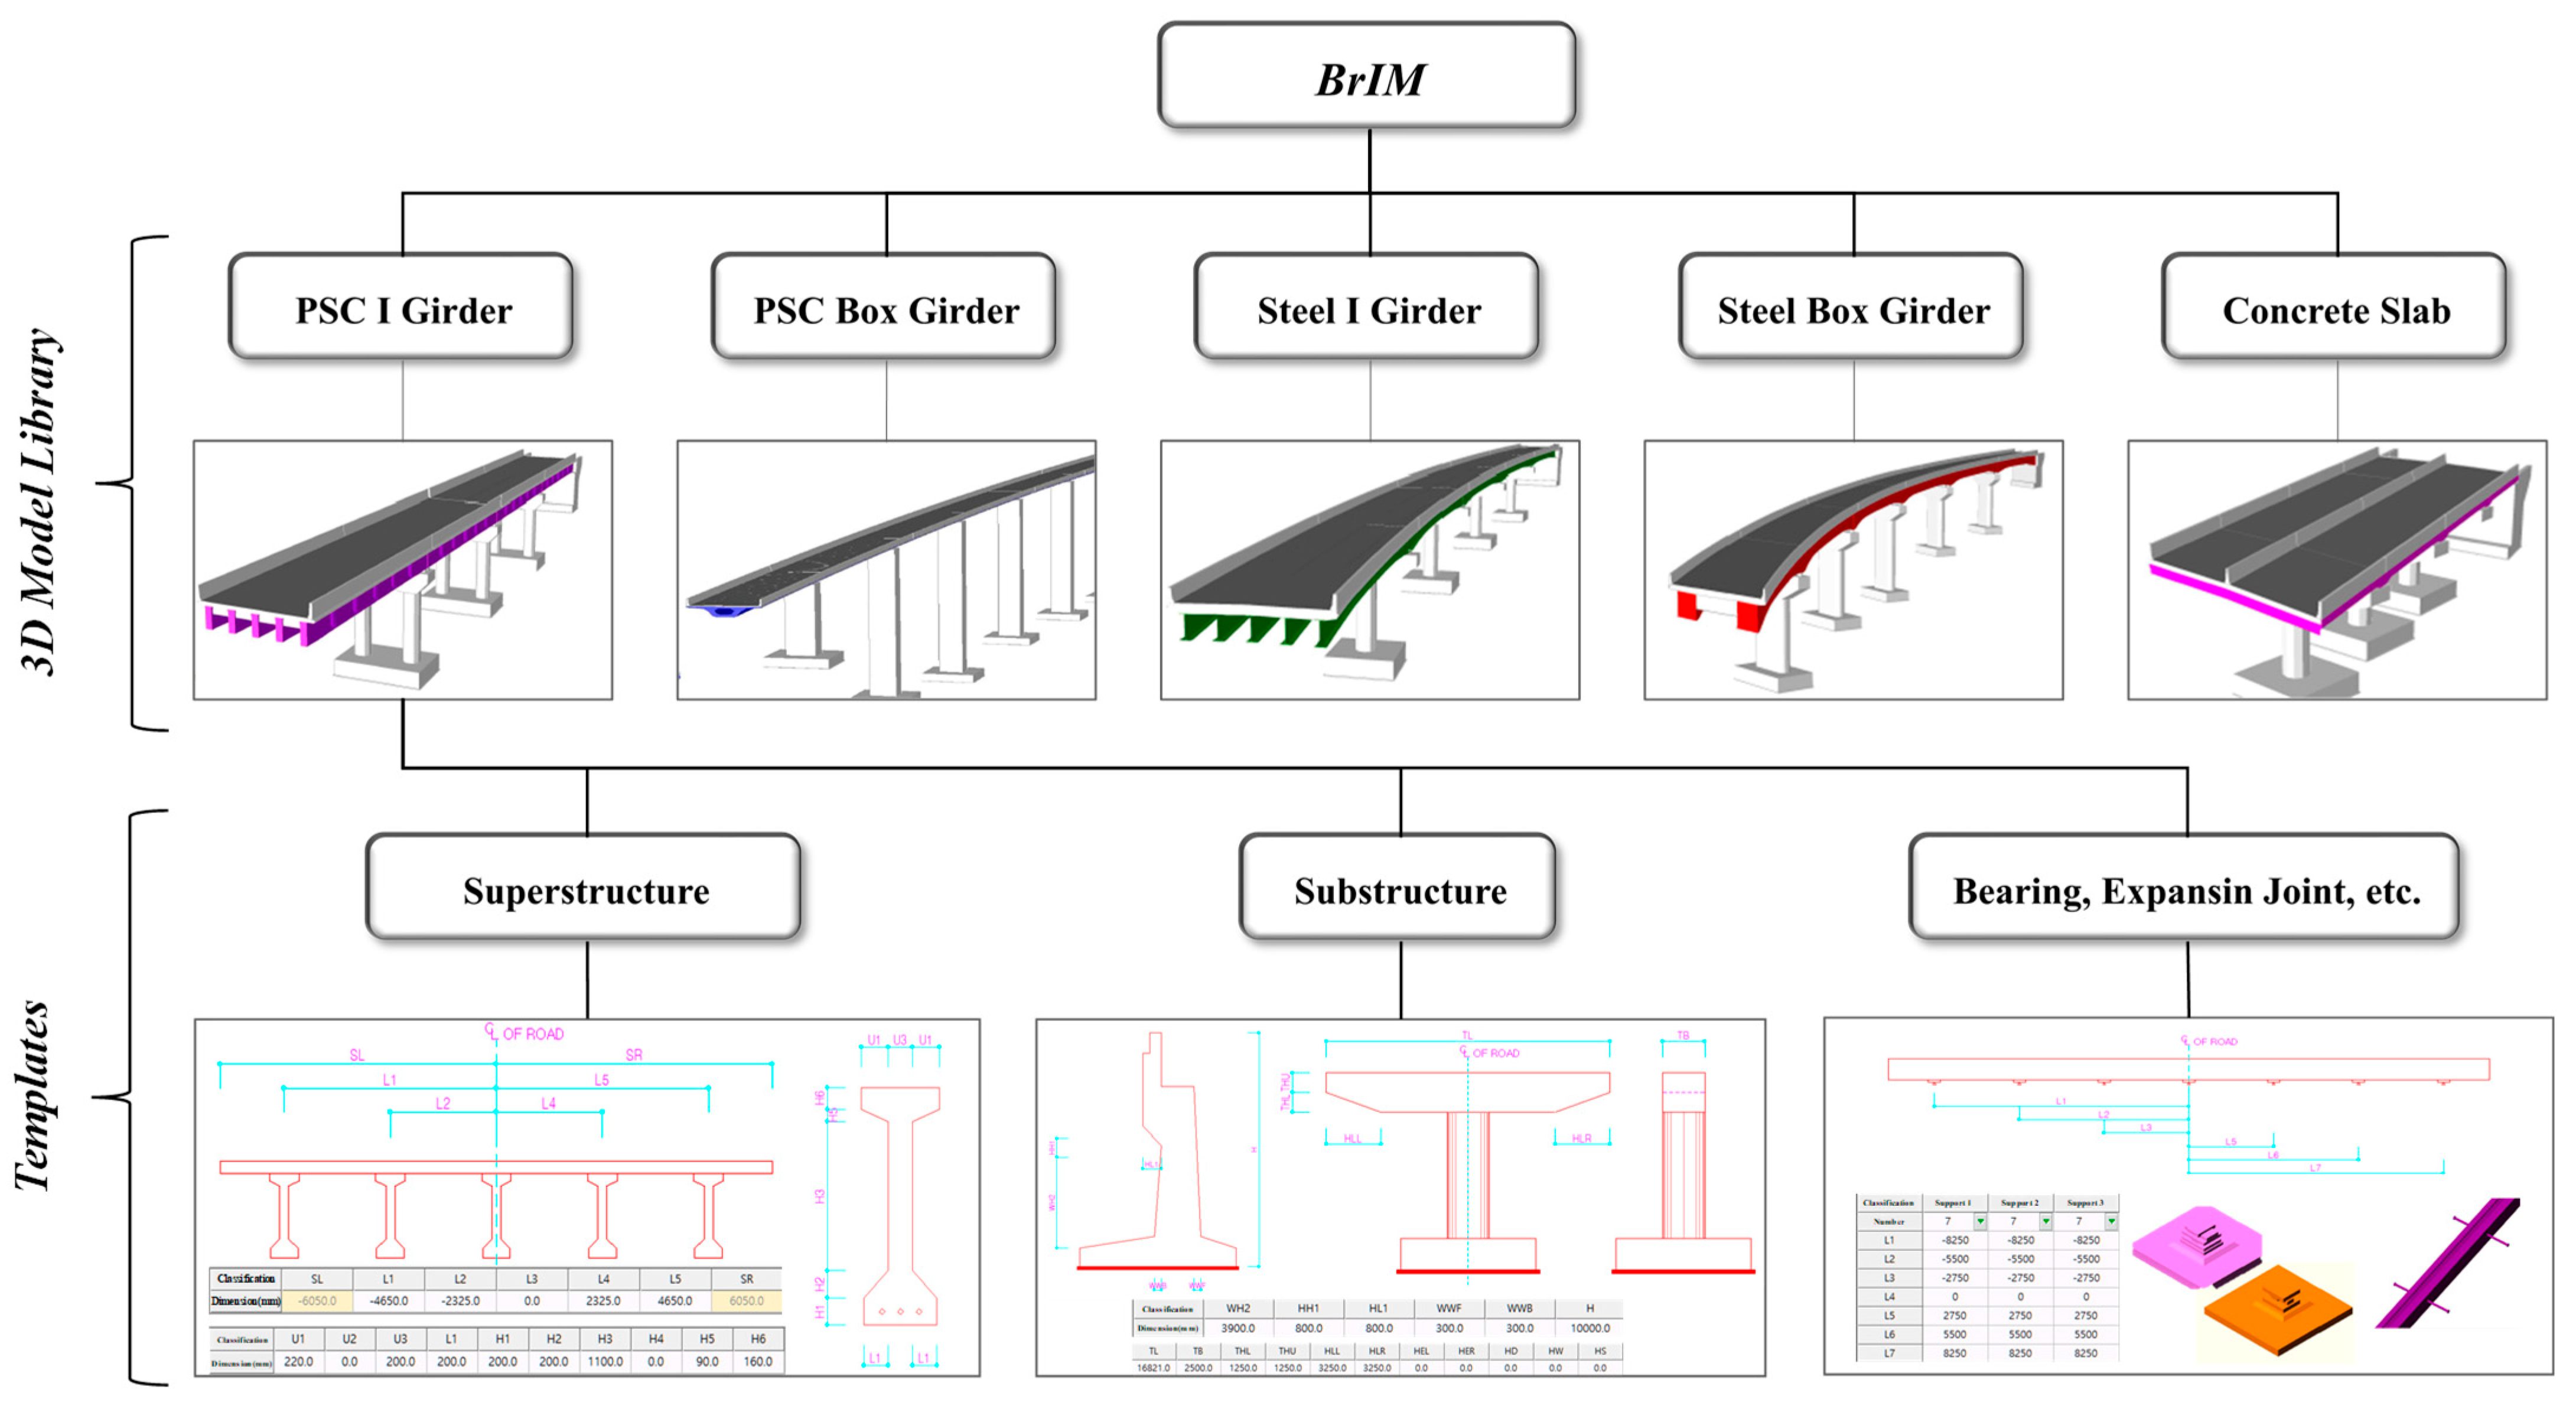
In this case study, the primary objective of BrIM development was to establish a model library and templates for the five most common types of bridges among the highway bridges managed by the KEC, as shown in
Figure 7. The five types are prestressed concrete (PSC) I girder, PSC box girder, steel I girder, steel box girder, and concrete slab bridge.
As mentioned in
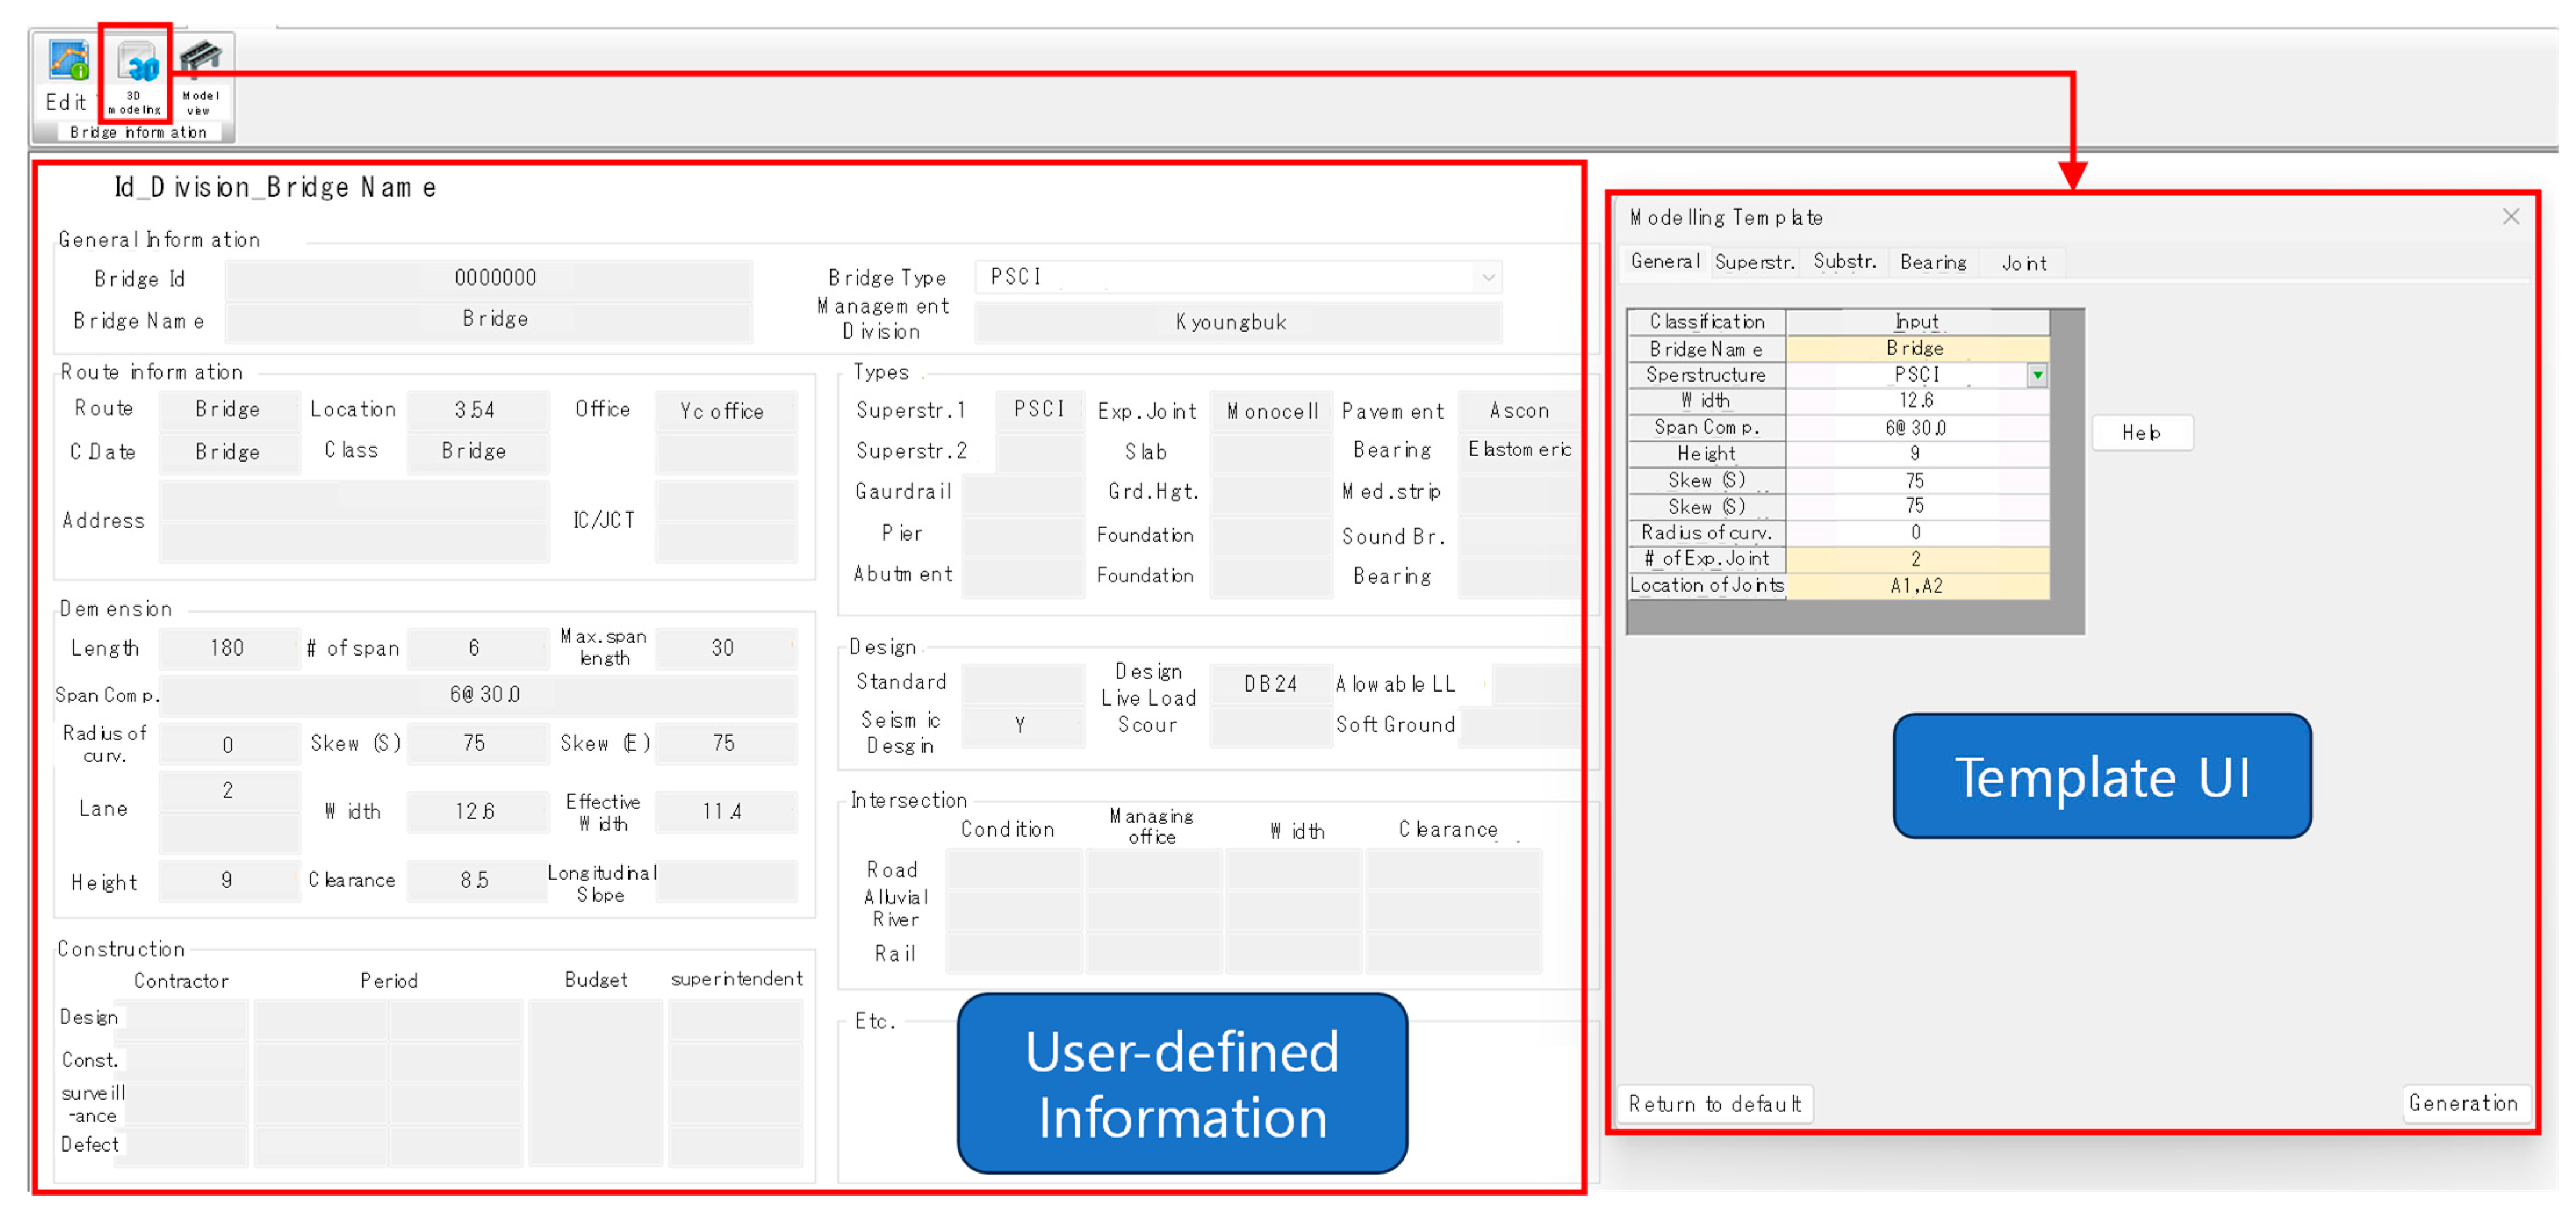
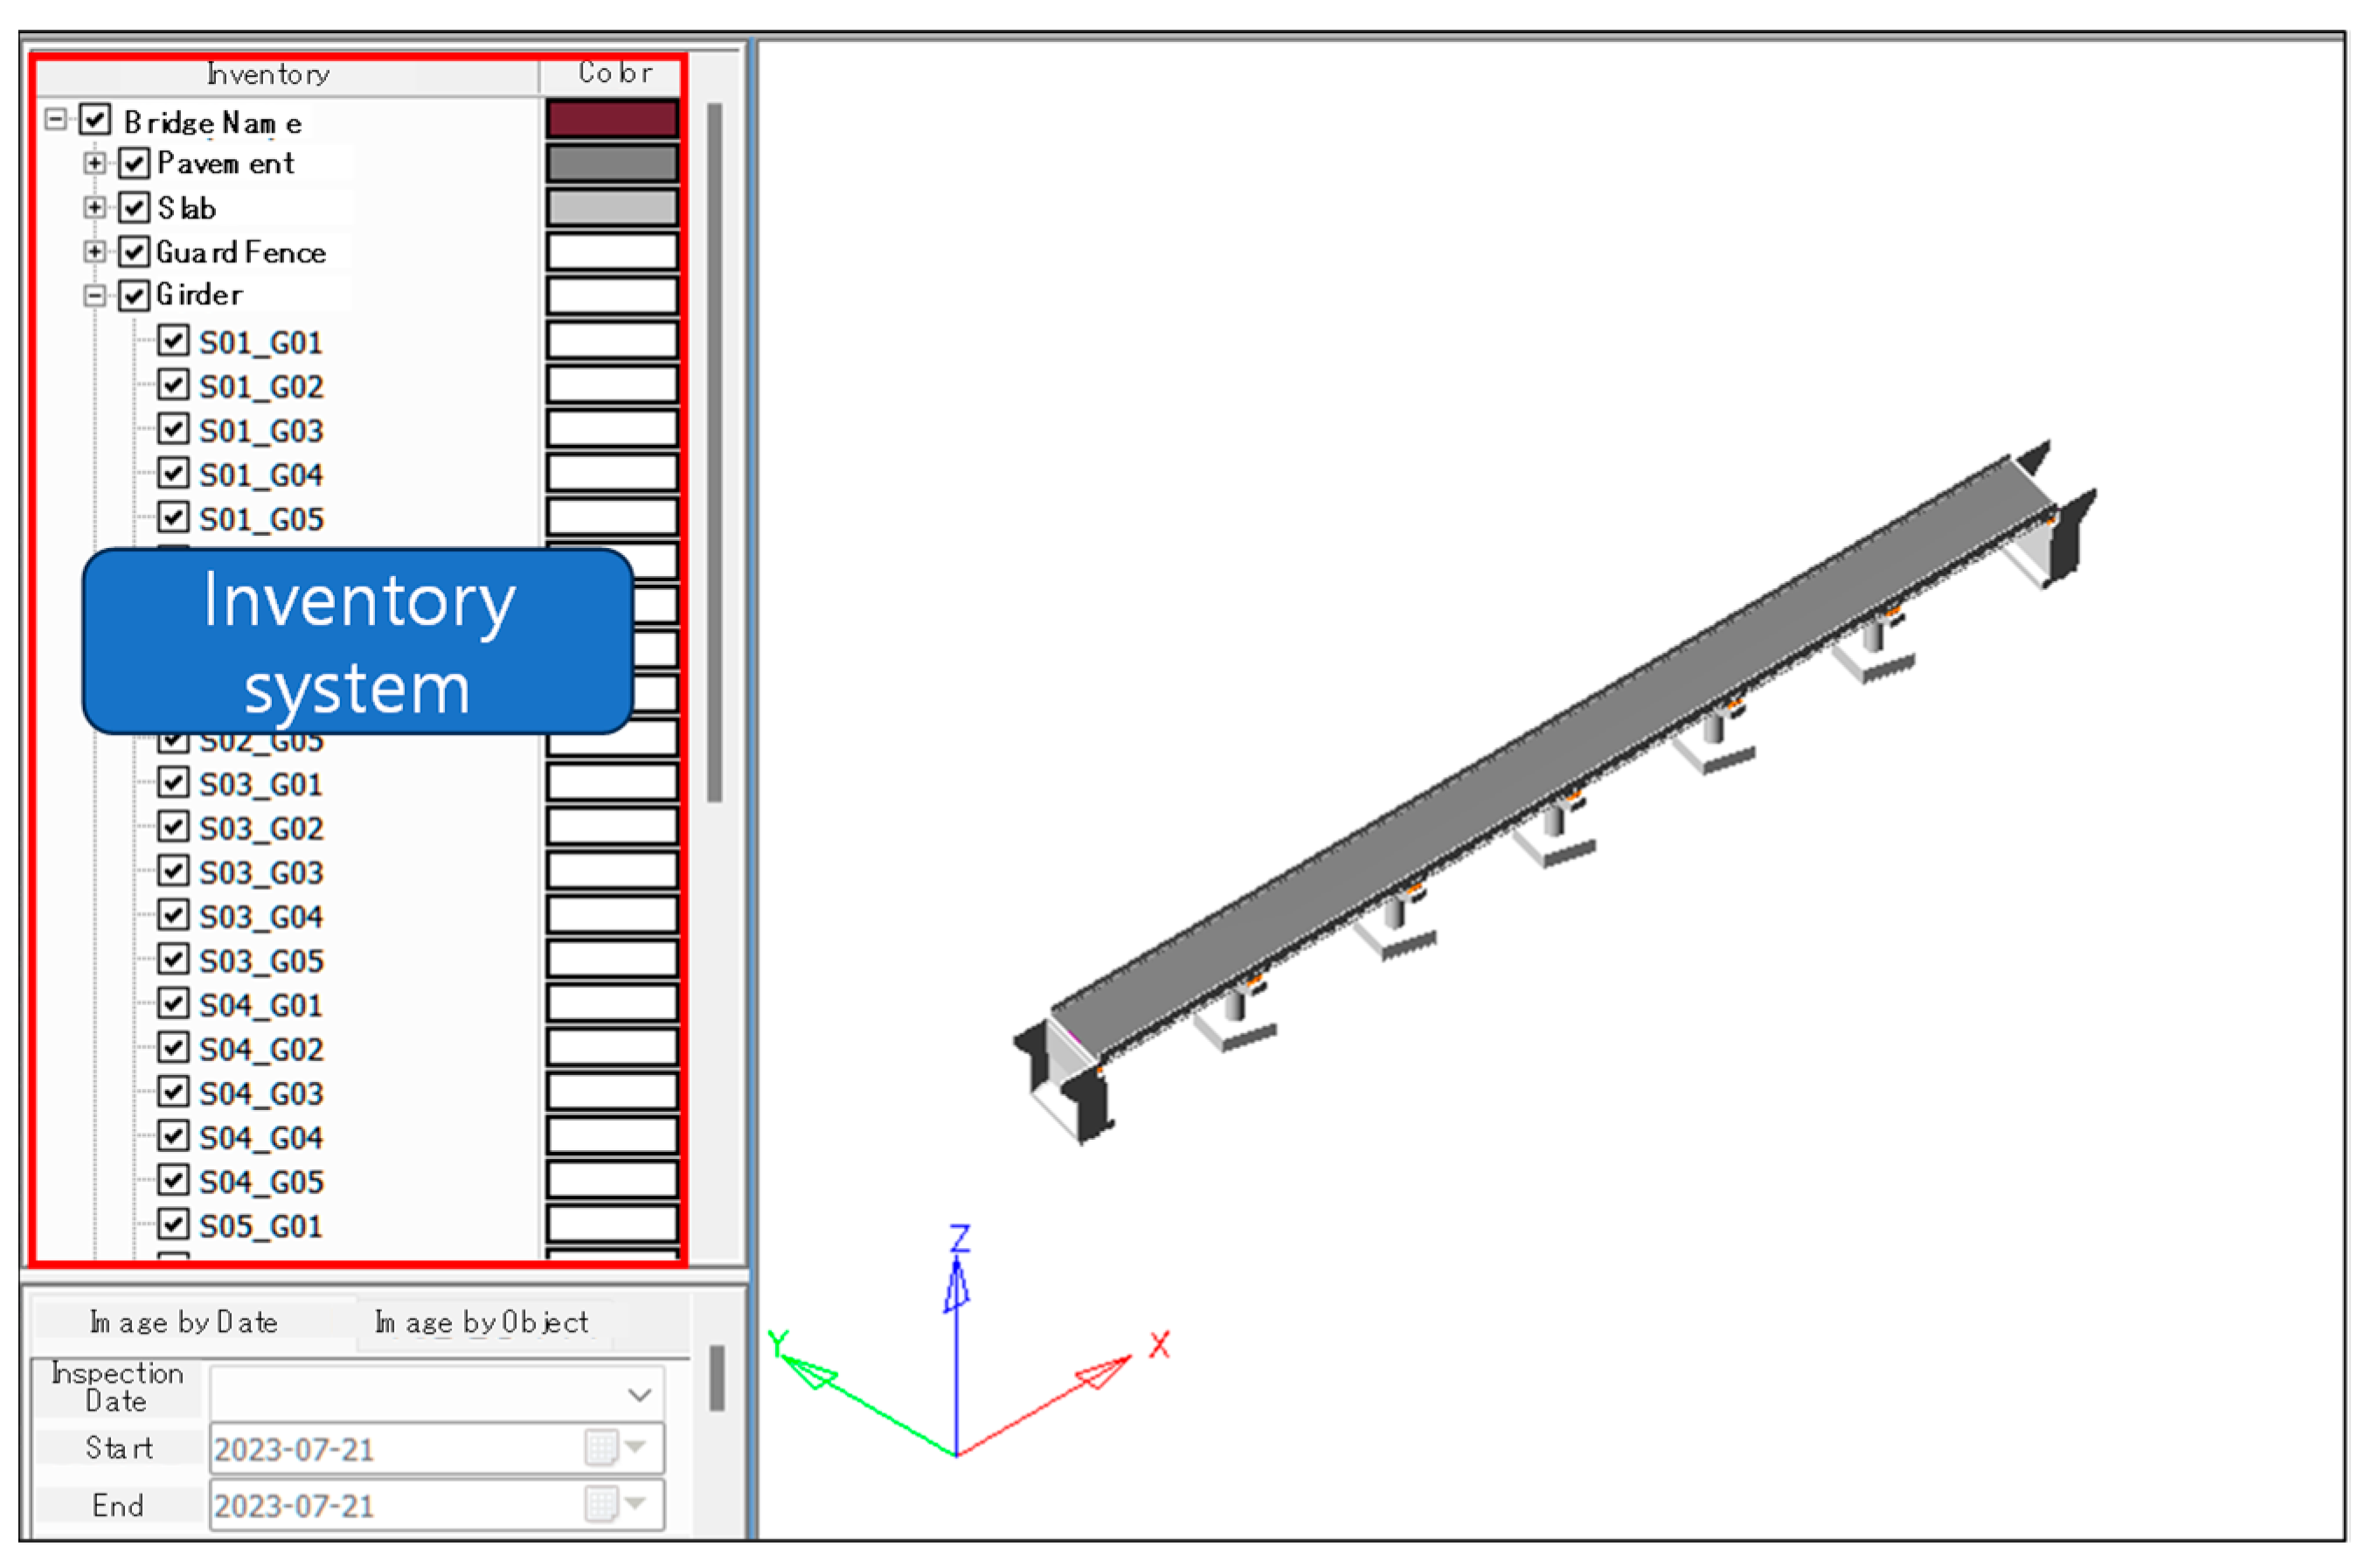
Section 3, users can define the type of bridge along with basic information, and templates with default dimensions are provided through the user interface (UI), enabling users the flexibility to make detailed modifications based on their purpose (
Figure 8). For the bearing and expansion joint elements, once their placement and types were entered, the model library automatically incorporated them into their respective positions, and an LOD that enabled better user awareness was applied. Furthermore, because the model library includes an inventory system defined for each bridge type, users can instantly utilize the inventory system as a 3D model is generated (
Figure 9), and they can isolate (or view) specific objects as required using the disabled function.
4.2. Application to a PSC Bridge
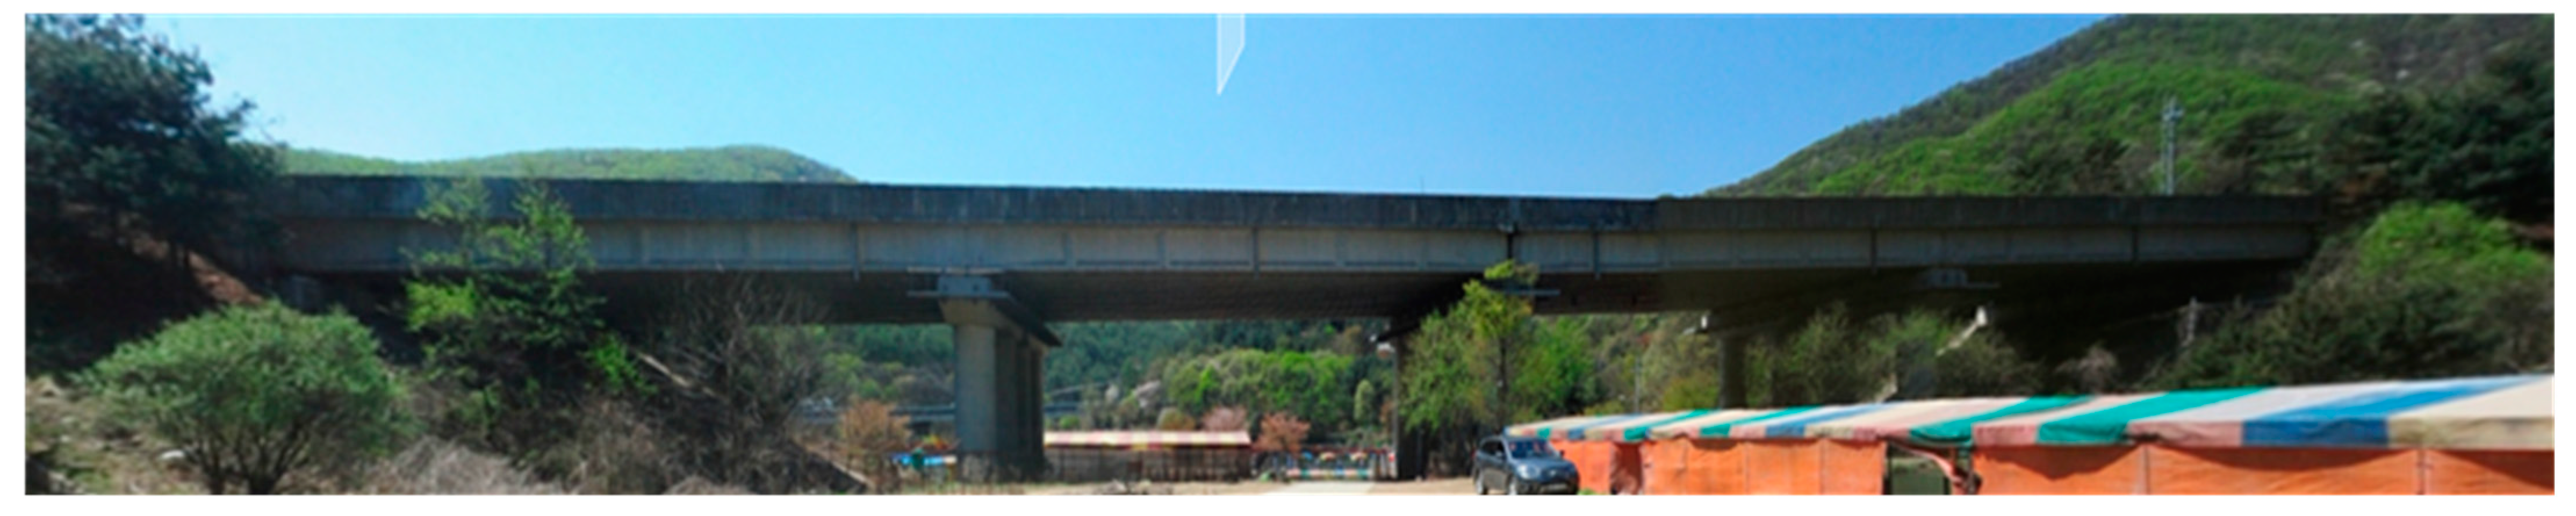
BrIM was applied to a pilot project on a PSC I girder bridge, as shown in
Figure 10. This bridge was constructed in 2001 and is located on a major highway connecting Seoul to the southern region of South Korea. The total length of the bridge is 120 m, with a width of 12.15 m, and it consists of four spans, each with a length of 30 m. Five inspection records from 2012 to 2018 were available in the FMS, and these records were analyzed for entering data into the BrIM (any information prior to this period was stored separately by regional offices and was not considered for this study, as no significant damage was identified). The analysis results revealed some damage, such as cracks, on the main components, as well as damage to expansion joints and bridge bearings. The records were rewritten in accordance with the template and entered into the BrIM. Additionally, image data were acquired through UAV and GPR scanning, and these data sets were also incorporated into the BrIM.
4.3. Mapping Inspection Data
Based on the mapping method introduced in a previous study [
26], the 3D bridge models were partitioned into surfaces, as shown in
Figure 4. Subsequently, images from three different sources (GPR, UAVs, and damage maps) were mapped onto the surfaces, as shown in
Figure 11. Because the surfaces were defined on a component basis, the images had to be prepared accordingly, with their sizes or directions defined based on different considerations specific to each data source. This approach enables the systematic integration of information from diverse sources onto the appropriate surfaces of a 3D model, ensuring a comprehensive representation of the bridge’s condition for inspection and maintenance purposes. Details of this process are discussed in the following subsections.
4.3.1. Mapping Images from GPR Data
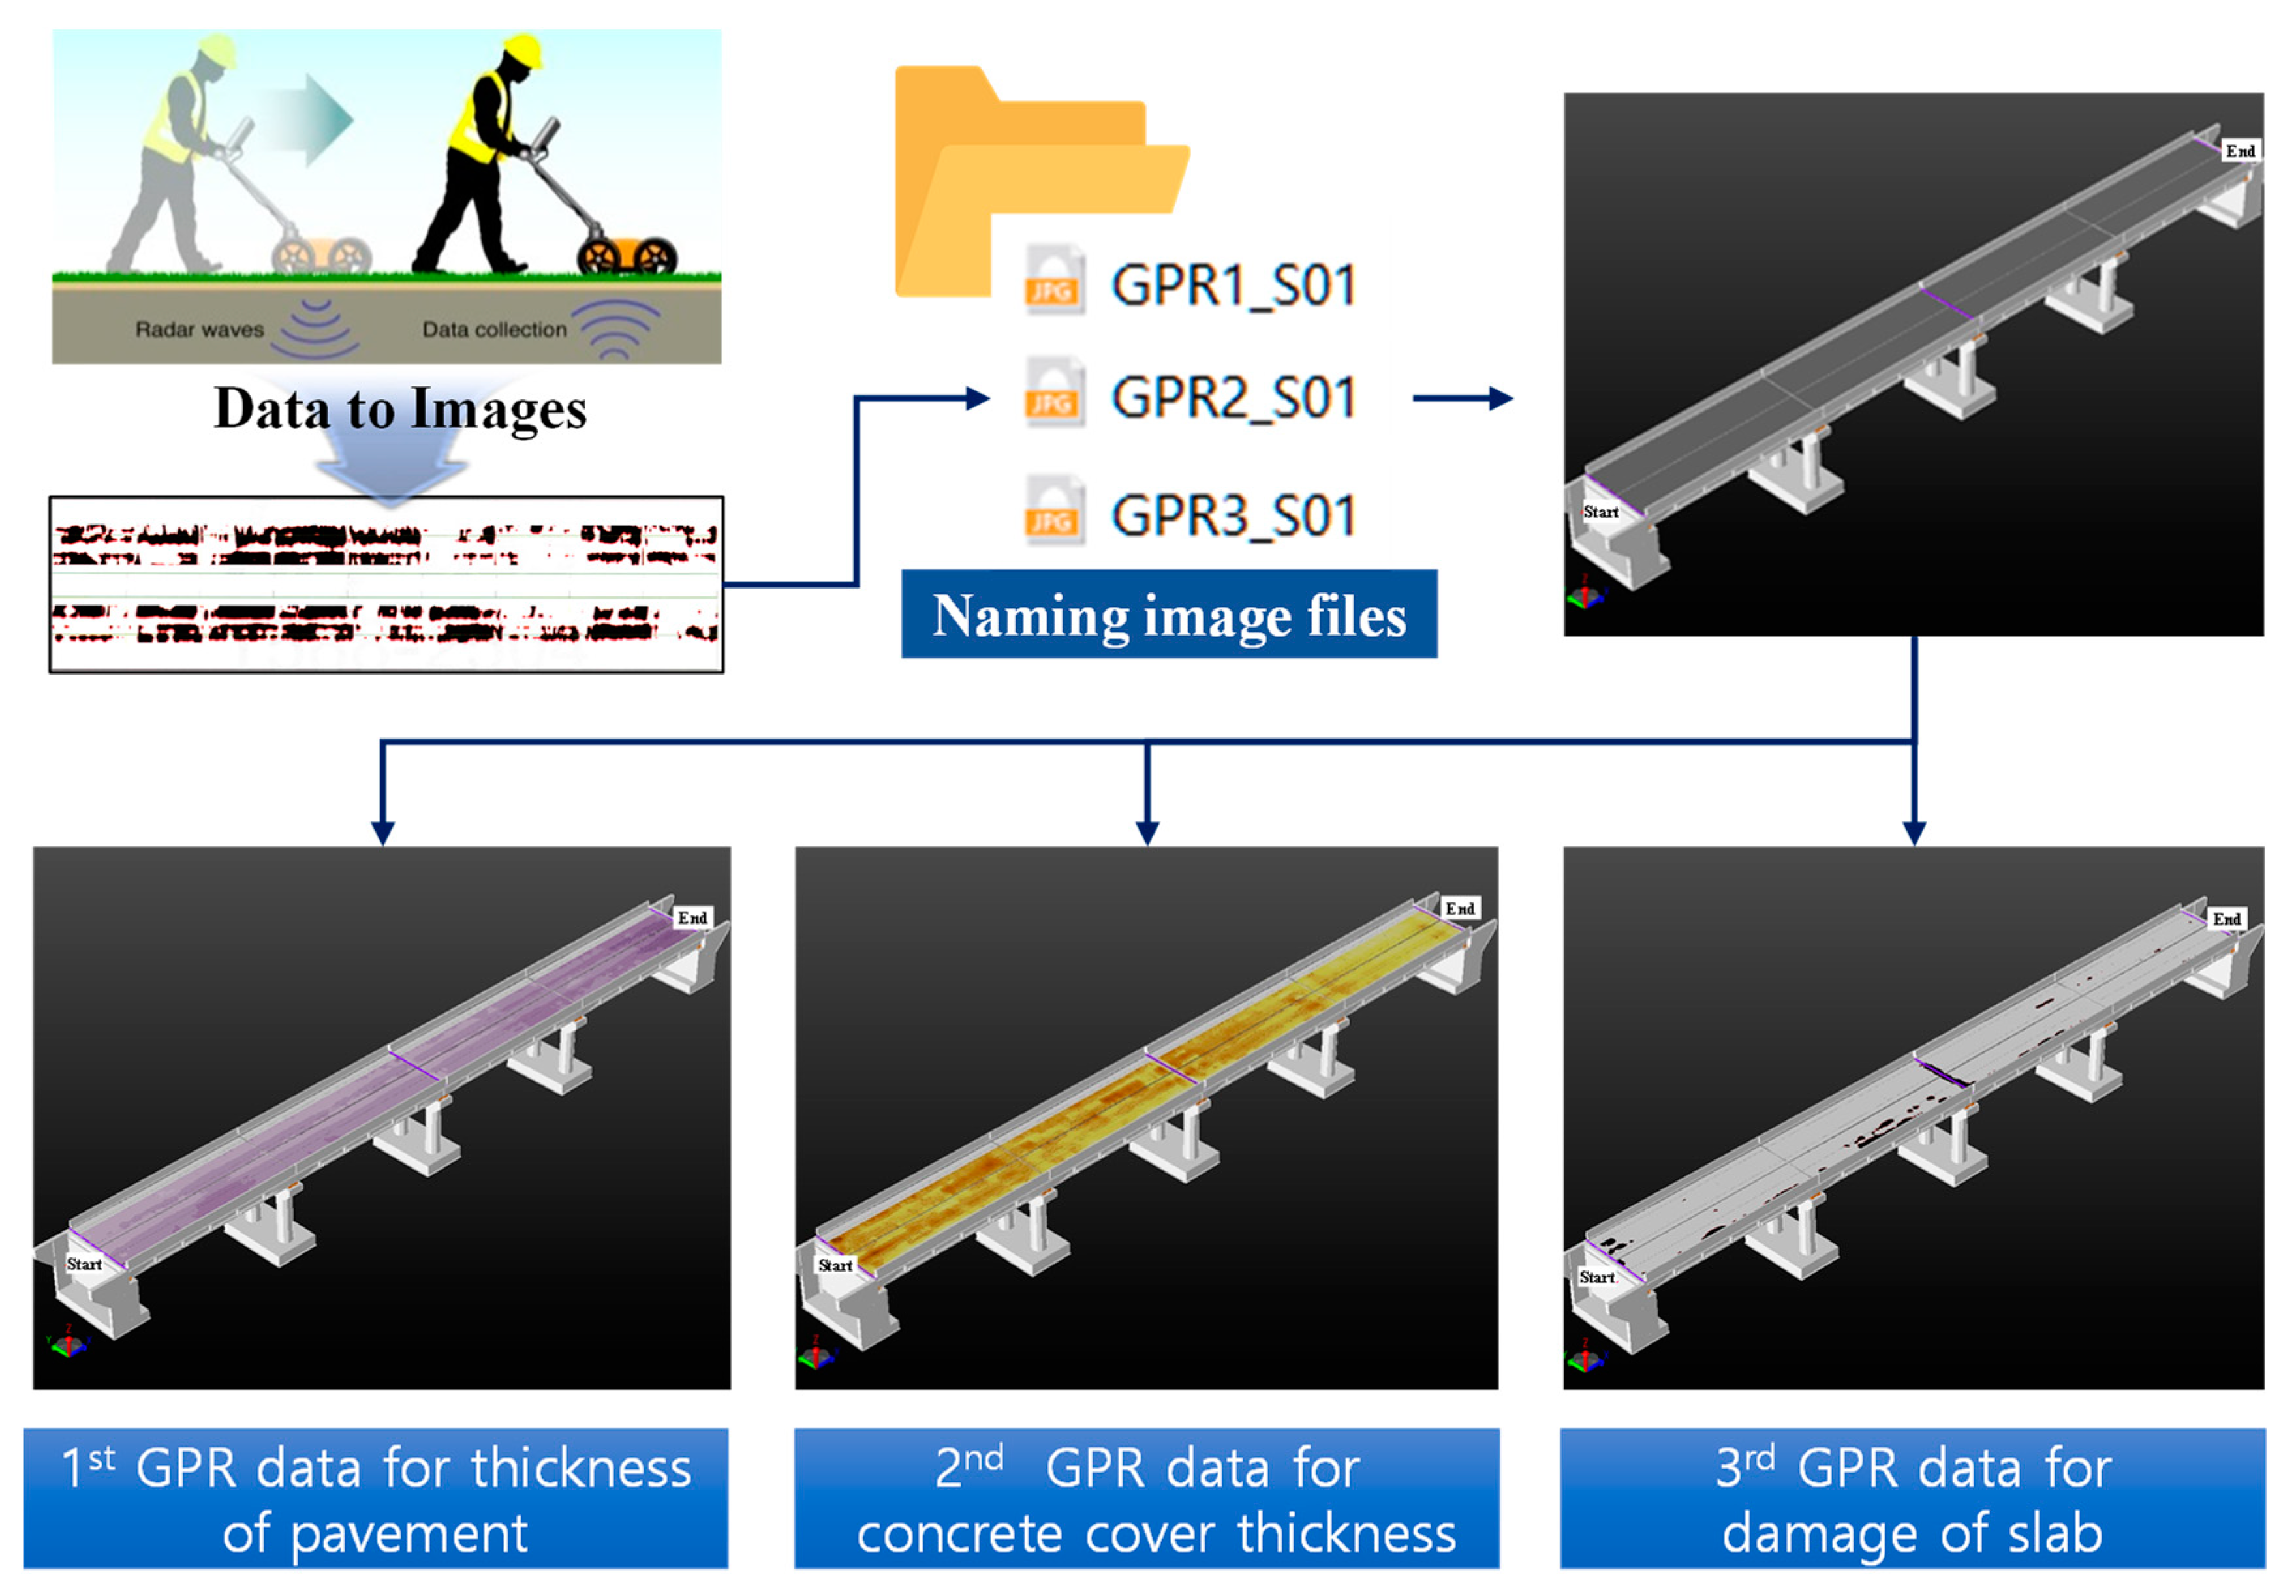
Figure 12 shows the image-mapping process for the GPR data. BrIM facilitates the import of image files converted from GPR data. The image files were organized into individual files corresponding to each bridge span. The GPR data contained three types of information: pavement thickness, cover thickness, and damage distribution. Consequently, these distinct pieces of information were saved as separate files. After specifying the file paths within the system, the files were automatically imported and integrated into the corresponding 3D bridge models. To achieve seamless integration, users must adhere to a predefined file-naming format. For instance, the image file names for the pavement thickness of the first span and the damage distribution of the second span would follow the format “GPR1_S01” and “GPR3_S02,” respectively.
4.3.2. Mapping UAV Scan Model
To ensure the attainment of high-quality scan models from the UAVs, a drone-operating plan, as depicted in
Figure 13, was devised. Although drones are equipped with Global Positioning System (GPS) devices, their effectiveness in constructing precise scan models is limited owing to the GPS signal loss experienced under superstructures. Consequently, the control points were strategically positioned on both the bridge and ground. Considering factors such as the surrounding terrain, altitude, and target precision, flight paths were meticulously established. Subsequently, the UAV-captured photos were acquired with a vertical overlap of 60% and a horizontal overlap of 80% to enhance the quality of the scan models and were converted into 3D scan models using the commercial software ContextCapture [
30]. In the initial version of BrIM, a feature was used to directly import 3D scan models. However, this approach was burdening the system owing to excessive file sizes and memory usage. Consequently, the scan models were divided and mapped onto the model as surface models following a mapping process similar to that used for the GPR images.
4.3.3. Mapping Damage Maps
According to South Korean bridge maintenance guidelines [
27], damage maps should be drawn for bridges undergoing precise inspections. The damage map represents the deterioration of a bridge in a visual drawing format, making it easier to observe the condition of the bridge and its changes over time. However, sorting the data for a damage map requires time and effort in an existing FMS. Because the damage map contained essential information regarding the condition of existing bridges before the establishment of BrIM, a mapping feature was incorporated to facilitate its utilization.
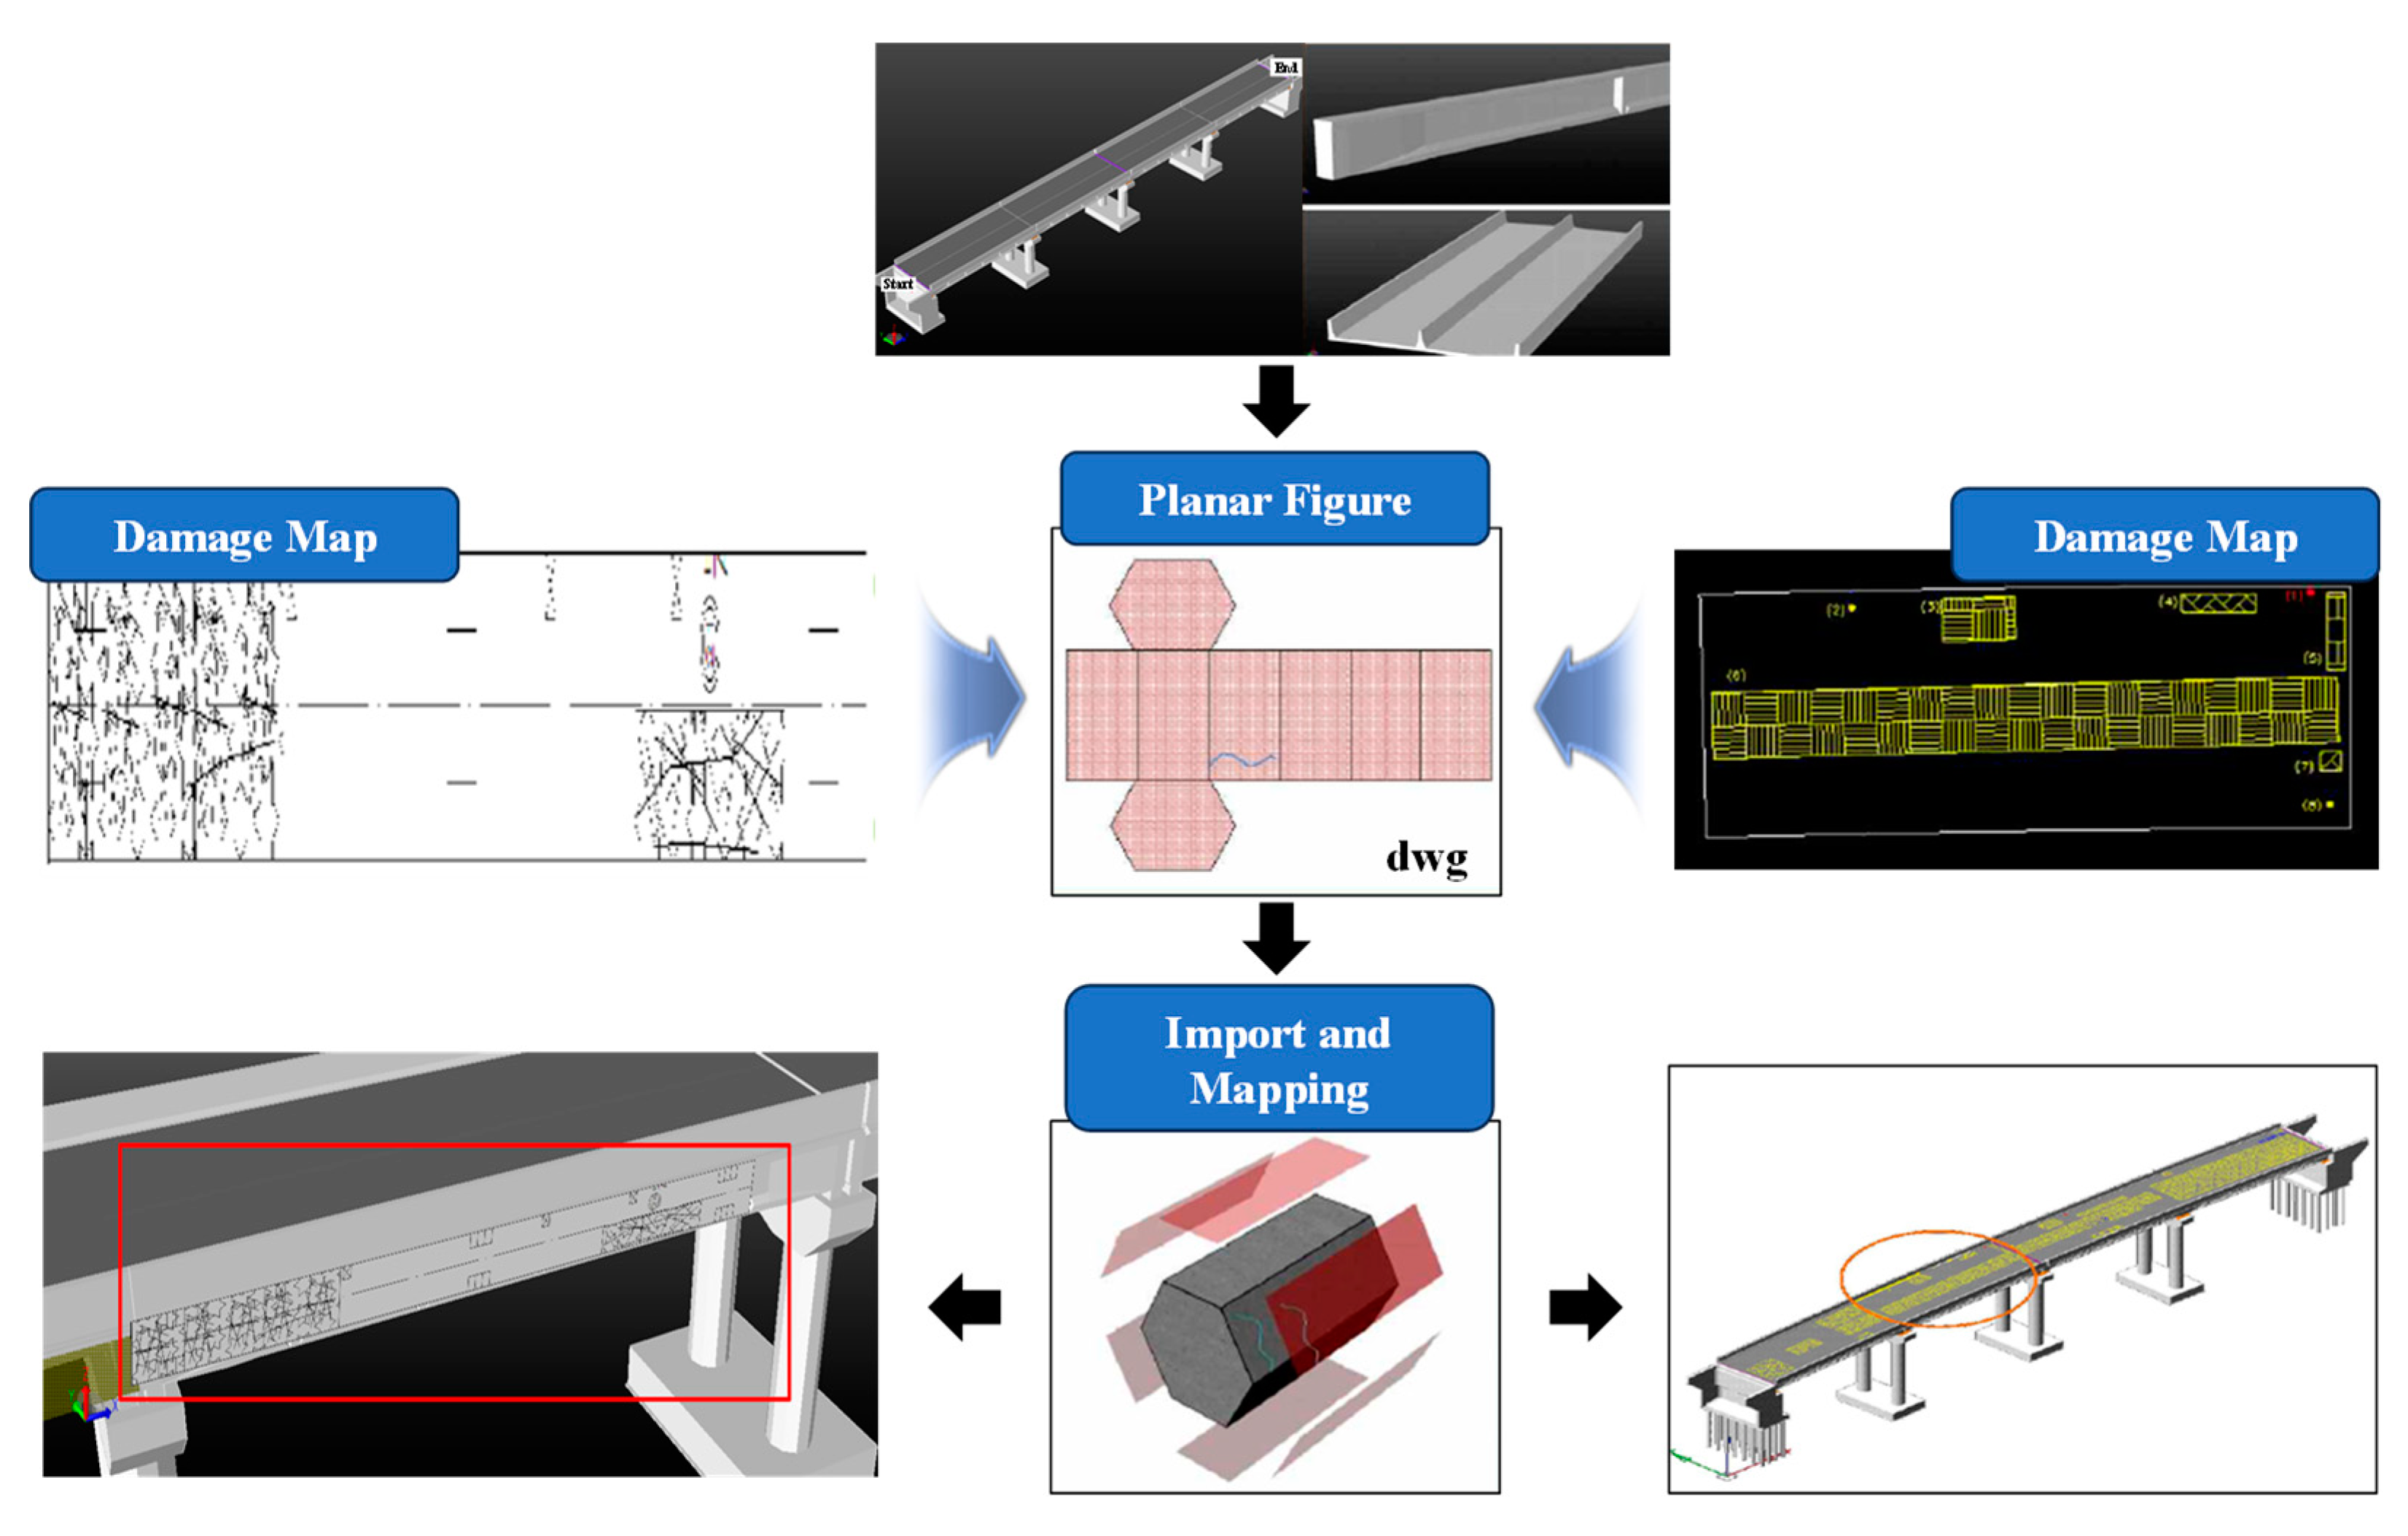
The mapping process for the damage map is different from the aforementioned mapping method, because the scale of the damage map is different from the actual scale, making it challenging to accurately locate defects during direct mapping. In addition, manually setting the image reference points for each map was cumbersome. To address this issue, BrIM was designed to incorporate a function that enables the export and import of planar figures of bridge components in the .dwg file format in AutoCAD, as shown in
Figure 14. Because the existing damage maps are available in the .dwg file format, they can be directly overlaid onto the exported planar figures and imported without the requirement for reference point settings. The advantage of this approach is that it simplifies the comparison and recording of component conditions during field inspections, and when creating future damage maps, only the changes must be reflected in the exported .dwg file, streamlining the maintenance process and enhancing efficiency.
4.4. Supporting Decision-Making
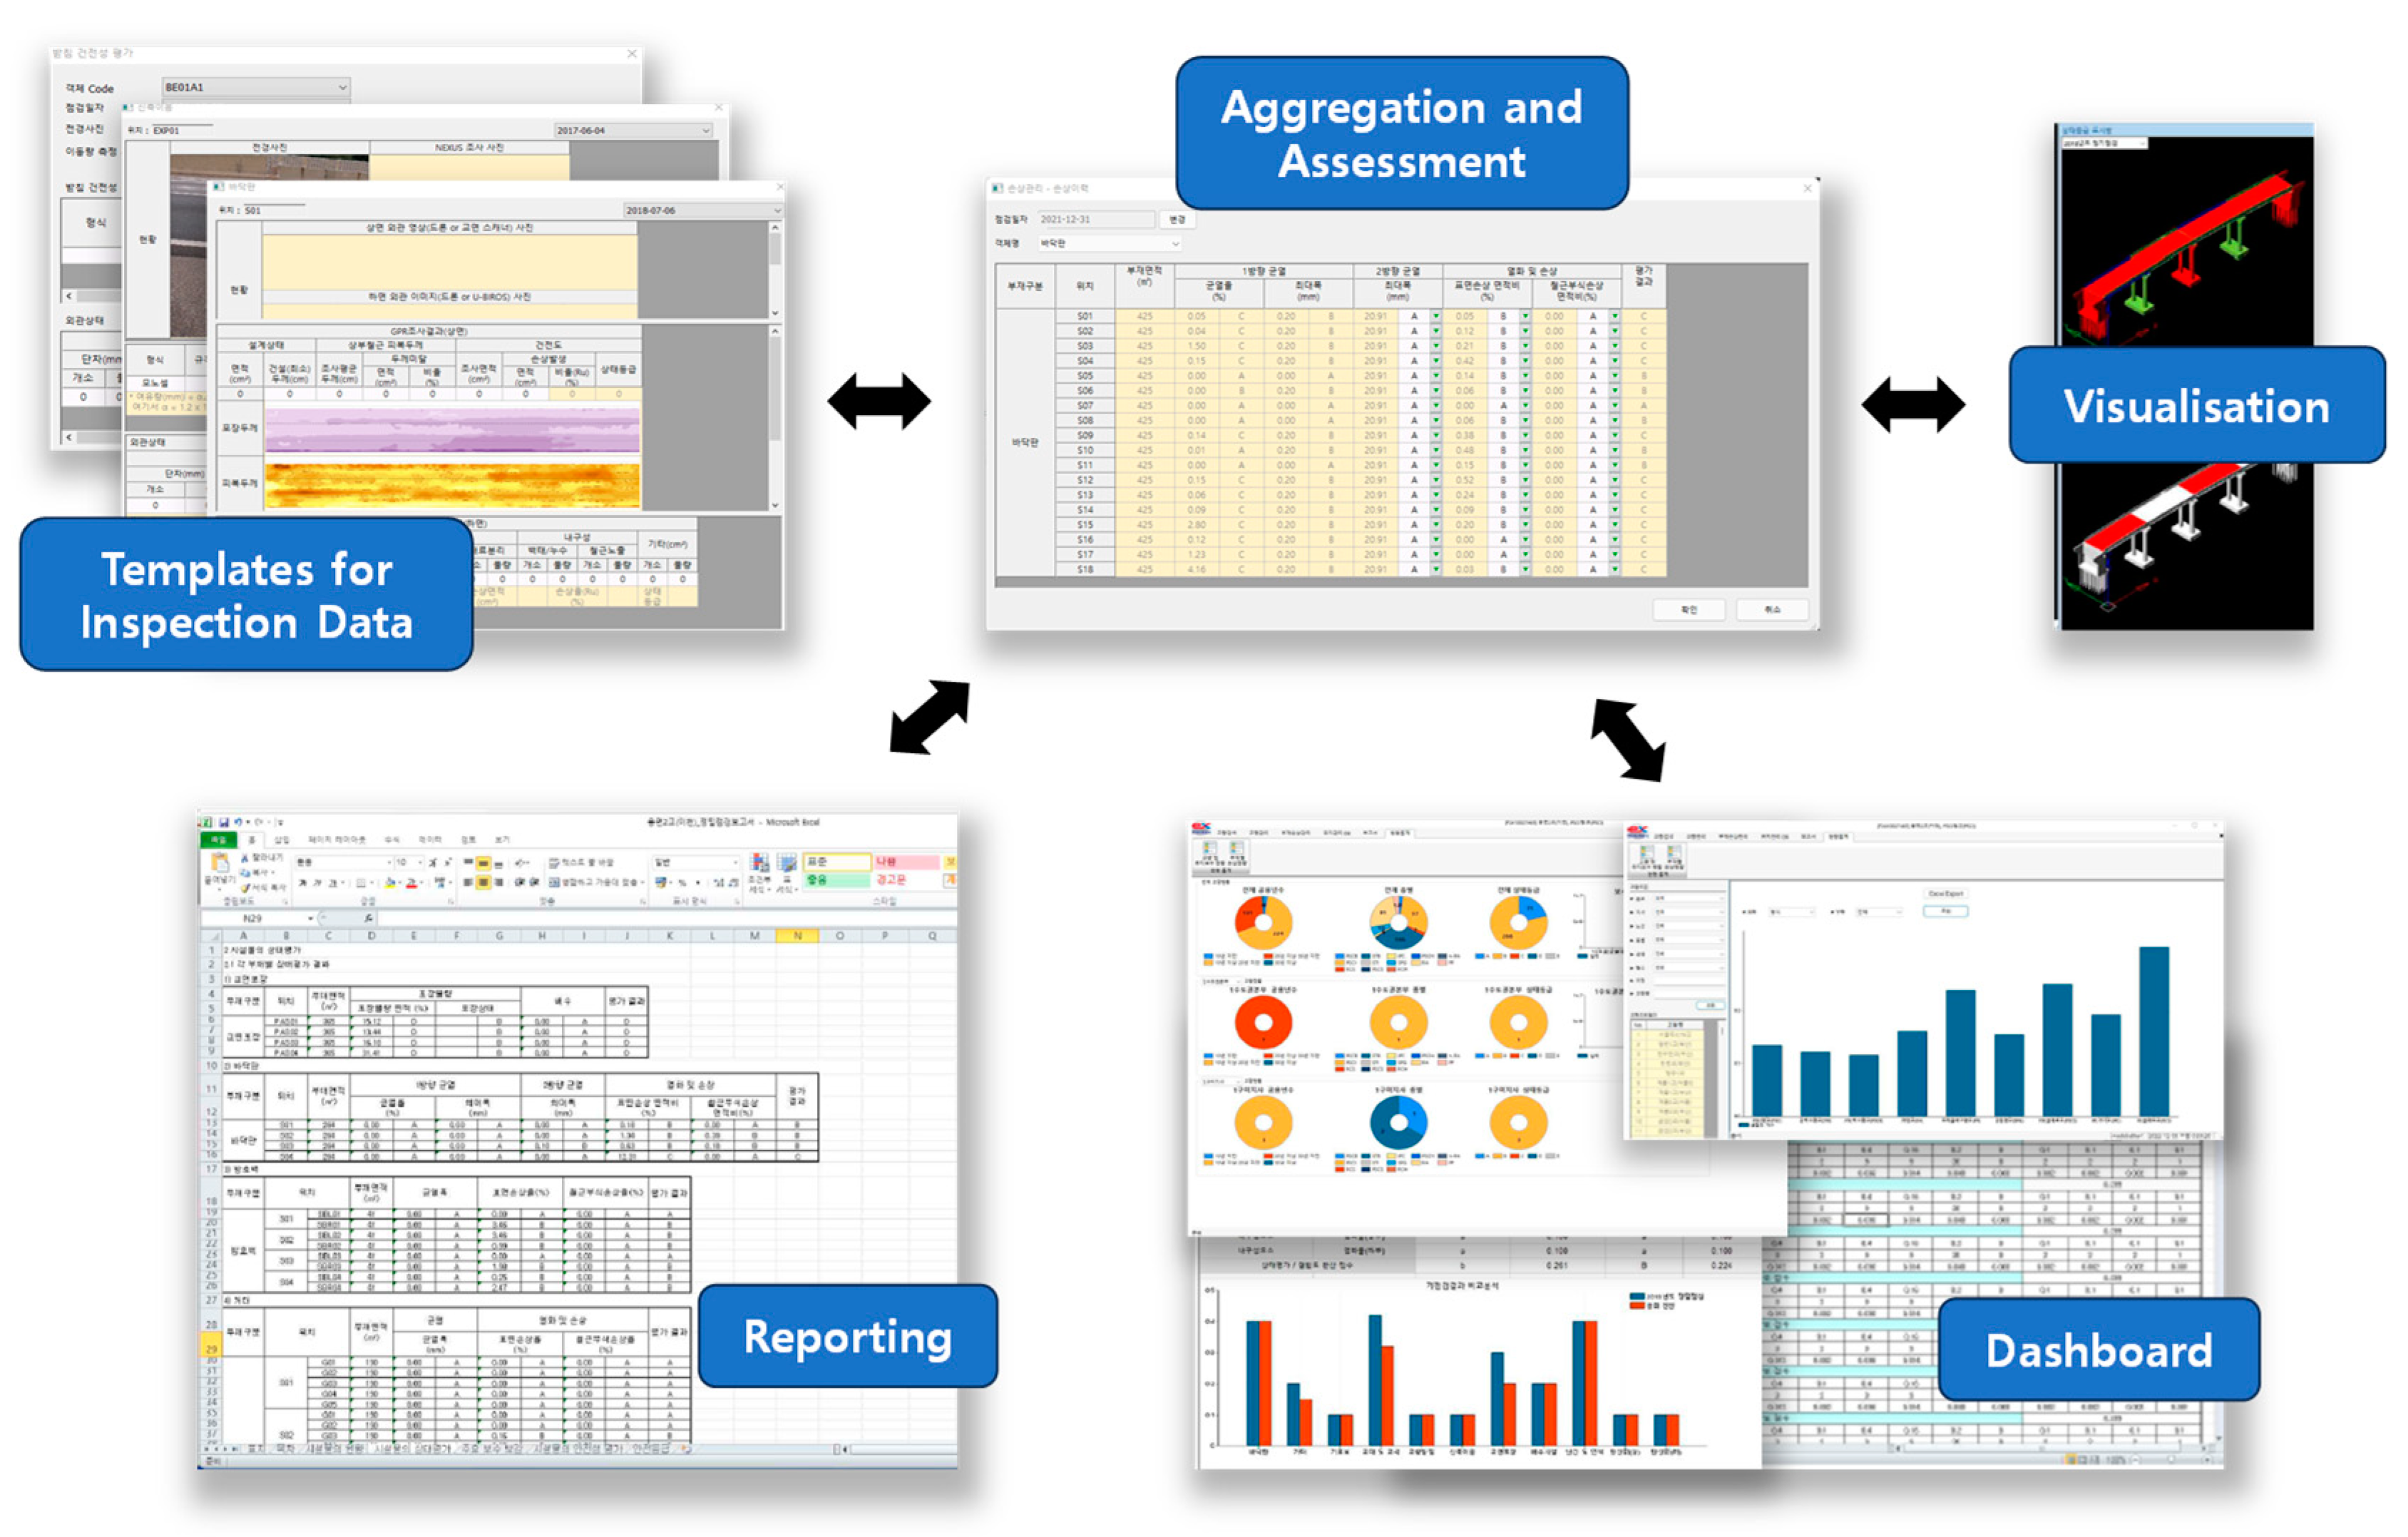
Figure 15 illustrates the decision-making support features provided by BrIM. As mentioned in
Section 3, preprocessing involved entering all existing inspection data of the target bridge into an .xlsx-based template, which was then imported into BrIM to automatically enter the damage information. BrIM was used to perform the assessment process (
Figure 6) and aggregate the assessment results at the component, span, and bridge levels. The resulting grades are represented by different colors to enable users to quickly identify vulnerable areas.
One of the most time-consuming tasks in reporting existing bridge inspections is organizing the maintenance information and deciding on the report’s presentation format. Therefore, to satisfy the requirements of bridge managers and the South Korean maintenance guidelines [
27], essential reporting items and standardized formats were defined within BrIM. The assessment results were tabulated and exported as .xlsx files. Users could report by commenting on the table content.
Several reporting items were visualized using a dashboard to enhance user decision-making support. The damage index, which is used for rating determination, is a quantitative metric for prioritizing bridge maintenance. Thus, according to user preferences, the dashboard provided comparison graphs and tables for the damage index at the component, span, and bridge levels. In addition, a damage-comparison graph was provided to monitor the progression of deterioration over time for bridges that experienced rapid deterioration. Users could define deterioration items to satisfy various requirements. Moreover, various aspects of decision-making support, such as sorting or statistical analysis using bridge rating scores, structural types, and age groups, were also considered.
5. Discussion
The BrIM approach developed in this study achieved flexibility not only for existing bridges but also for newly constructed bridges without the requirement for commercial BIM software or IFC. This adaptability was achieved by using a data-driven modeling method based on general bridge information (
Table 1). This method is valid because most typical bridges have a model LOD ranging from 200 to 300 for maintenance purposes. Thus, users can complete BrIM within minutes by entering basic bridge information into a template in .xlsx file format, making it user-friendly, even for those unfamiliar with BIMs.
Most of the maintenance history and design information was stored as documents in the FMS and was possibly unsuitable for allocating the data to BrIM because of discontinuity of the data, changes in guidelines, etc. The biggest problem experienced in this study regarding existing bridges was the reporting system of the summarized information and the loss of raw data. Because the old inspection guidelines were not as strict as recent ones, inspection information has been reported to be insufficient for assessment, and managers are unaware of the importance of information management, causing data discontinuity (the job rotation system also contributes to the problem). Therefore, the maintenance history had to be analyzed at the first data input and had to be adequately allocated to BrIM based on the engineer’s decision.
Despite these challenges, the developed BrIM enhanced the efficiency of maintenance tasks. Interviews conducted with inspection companies and the case study revealed that the conventional maintenance process for a single-span PSC girder bridge, including precise safety diagnosis, took approximately two months. During this period, 10% of the time was spent on data collection and the analysis of previous inspection records, 40% on on-site investigations, and 50% on analyzing the survey results and writing the report. In other words, approximately 60% of the time was dedicated to survey, analysis, and report writing, mainly because of the time spent searching and rewriting document-based data into inspectors’ own formats. When entering information into BrIM, there was a little difference in the initial 10% of the time. However, this time was expected to be reduced to within 1 day for the next inspection task because BrIM automatically aggregates survey results and provides reporting. Similarly, comparing the information already entered into the bridge inspection model with the additional inspection content that must be written contributed to increased work efficiency. In particular, the automatic bridge evaluation and standardized format-based reporting functions significantly reduced the time required for bridge analysis and inspection content writing.
BrIM is expected to contribute to institutional improvements. The mandatory preparation of a damage map, as stipulated in the maintenance guidelines [
27], requires the most time for maintenance tasks. The primary purpose of a damage map is to enable managers to quickly identify damage conditions and aggregate damage quantities. However, because of their presentation purpose, damage maps often do not match the actual scale of the bridge, leading to difficulties in making quick judgments when inspectors conduct on-site investigations using the maps. The mapping, vectorization, and aggregation functions of BrIM can replace the damage map; thus, the establishment of BrIM is expected to introduce institutional changes.
There were several considerations when acquiring a scan model using UAVs. The first consideration was the specifications of the drone and flight path settings. For the scan model to be used for damage detection, sufficient resolution must be secured, and the image quality and distance from the structure must be determined. In this case study, although capturing images at closer distances could result in better image quality, there was a risk of collision owing to wind interference. This consideration is crucial for mountainous areas and high-altitude bridges. Increasing camera specifications can be considered when capturing images from a longer distance; however, the high equipment cost often deters drone operators from choosing this option. In the case of concrete bridges, it is necessary to measure crack widths with a precision of 10−4 m as mandated by the maintenance guidelines. Achieving high-quality scan models posed challenges in this study; thus, the incorporation of close-up images captured by field workers contributed to improving the quality.
The second consideration was geometric complexity and lighting conditions. The more complex the geometry of the structures (for example, an I-girder bridge has more surfaces and complex shapes than a box-girder bridge), the higher the challenge of obtaining scan models owing to insufficient lighting and backlight. This phenomenon resulted in poor image quality, leading to distortions when the images were converted into surface models. In such cases, capturing more photographs and shooting at a close range are required, returning to the first consideration. Consequently, the suitable selection of UAVs and operation plans in alignment with the usability of scan models has emerged as a critical factor, with the experience and proficiency of the drone operator significantly influencing the quality of the scan models.
Accurate performance evaluation reflecting damage is crucial in the bridge maintenance process. The bridge assessment process in this paper was based on the national maintenance guidelines, where observed damage was incorporated into the analytical model according to the judgment of engineers. In other words, human intervention was necessary between BrIM and the analytical model, which is not ideal from a proactive maintenance perspective. The BrIM developed in this paper focuses on efficiently digitizing maintenance information of existing bridges; therefore, the assessment functionality was somewhat limitedly introduced. However, future research is needed to quantitatively link damage information with the analytical model so as to enable immediate assessment automatically.
Another area for further research is the importation of BIMs with IFCs. While BrIM in this study focused on existing bridges and did not consider IFCs, it is essential to note that the current construction market mandates BIM deliverables. Therefore, the importation of IFC files must be considered. In this context, the bridge owner, the KEC, also expressed the desire to develop a new BMS that takes into account the current trend of BIM deliverables during the construction phase.
6. Conclusions
In this study, a BrIM-based BMS was established for existing bridges constructed without BIM technology. During the planning, interviews were conducted with bridge owners, managers, and site inspectors, obtaining information and functional requirements. The requirements were used to design the system architecture of the BrIM-based BMS, facilitating data exchange with the existing FMS. By considering a model library and templates, data-driven modeling with fundamental bridge data was also achieved according to the requirements of avoiding duplicate works and fast modeling. Users thereby could complete BrIM within a few minutes, even for those unfamiliar with BIMs. An inventory code system was incorporated to ensure effective data management, enabling the organized storage and retrieval of not only the maintenance history but also new inspection data. This code system also facilitates the automatic aggregation and quantification of defect data and is used in the condition and safety assessment process defined under national maintenance guidelines. Based on three types of image sources (UAVs, GPR, and damage maps), image mapping methods with different approaches were applied to visualize the inspected data. In particular, for scan models from UAVs, deep learning-based damage vectorization was introduced, which enabled quantification and modeling of the damage, and subsequently, in-depth discussions regarding the difficulties and possibilities were conducted. Functionalities for supporting decision-making were also considered by providing visualizations, dashboards, and reporting systems. The aggregated inspection data and damage index of each bridge component are summarized according to a predefined reporting format and visualized in the model. Therefore, users can easily confirm bridge conditions, and the dashboard can provide many different insights based on the choice of data that users want to view.
Author Contributions
Conceptualization, C.-S.S.; methodology, C.-S.S. and C.-H.J.; software, C.-H.J., D.-C.N. and G.R.; validation, C.-S.S. and C.-H.J.; formal analysis, C.-H.J. and D.-C.N.; investigation, C.-S.S. and C.-H.J.; data curation, C.-H.J., D.-C.N. and G.R.; writing—original draft preparation, C.-H.J., D.-C.N. and G.R.; writing—review and editing, C.-S.S. and C.-H.J.; visualization, C.-H.J. and D.-C.N.; supervision, C.-S.S.; project administration, C.-H.J.; funding acquisition, C.-S.S. All authors have read and agreed to the published version of the manuscript.
Funding
This research was conducted with the support of the National R&D Project for Smart Construction Technology (RS-2020-KA156007) funded by the Korea Agency for Infrastructure Technology Advancement under the Ministry of Land, Infrastructure and Transport, and managed by the Korea Expressway Corporation.
Data Availability Statement
Data sharing is not applicable to this article.
Conflicts of Interest
The authors declare no conflict of interest.
References
- Choi, P. Jeongneungcheon Bidge in Naebu Expressway Resumes Operation from 0 o’Clock on the 19th (Total), Yonhap News Agency. 2016. Available online: https://www.yna.co.kr/view/AKR20160317039751004 (accessed on 26 July 2023).
- Korea Institute of Civil Engineering and Building Technology. Road Bridge and Tunnel Status Information System, (n.d.). Available online: https://bti.kict.re.kr/bti/publicMain/main.do (accessed on 18 October 2022).
- Shim, C.-S.; Lee, K.-M.; Kang, L.S.; Hwang, J.; Kim, Y. Three-Dimensional Information Model-Based Bridge Engineering in Korea. Struct. Eng. Int. J. Int. Assoc. Bridge Struct. Eng. 2012, 22, 8–13. [Google Scholar] [CrossRef]
- Shim, C.S.; Kang, H.; Dang, N.S.; Lee, D. Development of BIM-based bridge maintenance system for cable-stayed bridges. Smart Struct. Syst. 2017, 20, 697–708. [Google Scholar] [CrossRef]
- Saju, S. Smart Bridges Based on Bridge Information Modelling. In Proceedings of the 2022 IEEE International Conference on Signal Processing, Informatics, Communication and Energy Systems (SPICES), Thiruvananthapuram, India, 10–12 March 2022; Institute of Electrical and Electronics Engineers Inc.: Zurich, Switzerland, 2022; Volume 1, pp. 279–284. [Google Scholar] [CrossRef]
- Hajdin, R.; Samec, V. BIM and BMS: Current Status and Challenges. In Proceedings of the IABSE Symposium: Challenges for Existing and Oncoming Structures, Prague, Czech Republic, 25–27 May 2022; International Association for Bridge and Structural Engineering (IABSE): Zurich, Switzerland, 2022; pp. 710–715. [Google Scholar] [CrossRef]
- McGuire, B.; Atadero, R.; Clevenger, C.; Ozbek, M.E. Bridge Information Modeling for Inspection and Evaluation. J. Bridge Eng. 2016, 21, 04015076. [Google Scholar] [CrossRef]
- Wan, C.; Zhou, Z.; Li, S.; Ding, Y.; Xu, Z.; Yang, Z.; Xia, Y.; Yin, F. Development of a Bridge Management System Based on the Building Information Modeling Technology. Sustainability 2019, 11, 4583. [Google Scholar] [CrossRef]
- Tanaka, F.; Hori, M.; Onosato, M.; Date, H.; Kanai, S. Bridge Information Model Based on IFC Standards and Web Content Providing System for Supporting an Inspection Process. In Proceedings of the 16th International Conference on Computing in Civil and Building Engineering (ICCCBE 2016), Osaka, Japan, 6–8 July 2016; p. 1140. Available online: https://www.academia.edu/download/77107969/144-301.pdf (accessed on 26 July 2023).
- Byun, N.; Han, W.S.; Kwon, Y.W.; Kang, Y.J. Development of BIM-Based Bridge Maintenance System Considering Maintenance Data Schema and Information System. Sustainability 2021, 13, 4858. [Google Scholar] [CrossRef]
- Li, S.; Zhang, Z.; Lin, D.; Zhang, T.; Han, L. Development of a BIM-based bridge maintenance system (BMS) for managing defect data. Sci. Rep. 2023, 13, 846. [Google Scholar] [CrossRef]
- Artus, M.; Koch, C. Object-Oriented Damage Information Modeling Concepts and Implementation for Bridge Inspection. J. Comput. Civ. Eng. 2022, 36, 04022029. [Google Scholar] [CrossRef]
- Hüthwohl, P.; Brilakis, I.; Borrmann, A.; Sacks, R. Integrating RC Bridge Defect Information into BIM Models. J. Comput. Civ. Eng. 2018, 32, 04018013. [Google Scholar] [CrossRef]
- Petti, L.; Lupo, C.; De Gaetano, C.M. A Methodological Framework for Bridge Surveillance. Appl. Sci. 2023, 13, 4975. [Google Scholar] [CrossRef]
- Polania, D.R.; Tondolo, F.; Osello, A.; Fonsati, A.; De Gaetani, C.; Trincianti, C.; Gazulli, D. Digitalization Processes and Bridge Information Modeling for Existing Bridges. In Lecture Notes in Civil Engineering; Springer Science and Business Media: Berlin/Heidelberg, Germany, 2021; pp. 944–953. [Google Scholar] [CrossRef]
- Shirowzhan, S.; Sepasgozar, S.M.; Edwards, D.J.; Li, H.; Wang, C. BIM compatibility and its differentiation with interoperability challenges as an innovation factor. Autom. Constr. 2020, 112, 103086. [Google Scholar] [CrossRef]
- Ozturk, G.B. Interoperability in building information modeling for AECO/FM industry. Autom. Constr. 2020, 113, 103122. [Google Scholar] [CrossRef]
- Jeong, S.; Hou, R.; Lynch, J.P.; Sohn, H.; Law, K.H. An information modeling framework for bridge monitoring. Adv. Eng. Softw. 2017, 114, 11–31. [Google Scholar] [CrossRef]
- Park, S.I.; Park, J.; Kim, B.-G.; Lee, S.-H. Improving Applicability for Information Model of an IFC-Based Steel Bridge in the Design Phase Using Functional Meanings of Bridge Components. Appl. Sci. 2018, 8, 2531. [Google Scholar] [CrossRef]
- Isailović, D.; Petronijević, M.; Hajdin, R. The future of BIM and Bridge Management Systems. In Proceedings of the IABSE Symposium, Guimaraes 2019: Towards a Resilient Built Environment Risk and Asset Management—Report, Guimarães, Portugal, 27–29 March 2019; International Association for Bridge and Structural Engineering (IABSE): Zurich, Switzerland, 2019; pp. 1673–1680. [Google Scholar] [CrossRef]
- Achuthan, K.; Hay, N.; Aliyari, M.; Ayele, Y.Z. A Digital Information Model Framework for UAS-Enabled Bridge Inspection. Energies 2021, 14, 6017. [Google Scholar] [CrossRef]
- Partala, E. Data driven BIM models in bridges. In Proceedings of the IABSE Symposium: Challenges for Existing and Oncoming Structures, Prague, Czech Republic, 25–27 May 2022; International Association for Bridge and Structural Engineering (IABSE): Zurich, Switzerland, 2022; pp. 716–719. [Google Scholar] [CrossRef]
- FHWA. Specifications for the National Bridge Inventory. 2022. Available online: https://www.fhwa.dot.gov/bridge/snbi.cfm (accessed on 21 November 2022).
- Isailović, D.; Stojanovic, V.; Trapp, M.; Richter, R.; Hajdin, R.; Döllner, J. Bridge damage: Detection, IFC-based semantic enrichment and visualization. Autom. Constr. 2020, 112, 103088. [Google Scholar] [CrossRef]
- Xu, S.; Wang, J.; Wang, X.; Wu, P.; Shou, W.; Liu, C. A Parameter-Driven Method for Modeling Bridge Defects through IFC. J. Comput. Civ. Eng. 2022, 36, 04022015. [Google Scholar] [CrossRef]
- Shim, C.-S.; Dang, N.-S.; Lon, S.; Jeon, C.-H. Development of a bridge maintenance system for prestressed concrete bridges using 3D digital twin model. Struct. Infrastruct. Eng. 2019, 15, 1319–1332. [Google Scholar] [CrossRef]
- Korea Authority of Land and Infrastructure Safety (KALIS). Detailed Guideline for Safety and Maintenance Implementation of Facilities (Performance Evaluation); Korea Authority of Land and Infrastructure Safety (KALIS): Jinju, Republic of Korea, 2021; Available online: https://www.kalis.or.kr/www/brd/m_27/view.do?seq=117&srchFr=&srchTo=&srchWord=&srchTp=&itm_seq_1=0&itm_seq_2=0&multi_itm_seq=0&company_cd=&company_nm= (accessed on 26 September 2022).
- Bochkovskiy, A.; Wang, C.; Liao, H. YOLOv4: Optimal Speed and Accuracy of Object Detection. arXiv 2020, arXiv:2004.10934. Available online: http://arxiv.org/abs/2004.10934 (accessed on 26 July 2023).
- Trahanias, P. Binary shape recognition using the morphological skeleton transform. Pattern Recognit. 1992, 25, 1277–1288. [Google Scholar] [CrossRef]
- Bentley. ContextCapture—4D Digital Context for Digital Twins. 2023. Available online: https://www.bentley.com/software/contextcapture/ (accessed on 26 July 2023).
| Disclaimer/Publisher’s Note: The statements, opinions and data contained in all publications are solely those of the individual author(s) and contributor(s) and not of MDPI and/or the editor(s). MDPI and/or the editor(s) disclaim responsibility for any injury to people or property resulting from any ideas, methods, instructions or products referred to in the content. |
© 2023 by the authors. Licensee MDPI, Basel, Switzerland. This article is an open access article distributed under the terms and conditions of the Creative Commons Attribution (CC BY) license (https://creativecommons.org/licenses/by/4.0/).


