Article

Investigation on Behaviours along Weak Axes of Steel Beam under Low Velocity Impact Loading: Experimental and Numerical

by
Mohammad Manzoor Nasery
1,2
1
Department of Civil Engineering, Karadeniz Technical University, 61080 Trabzon, Turkey
2
Dynamica Mühendislik Co., 61010 Trabzon, Turkey
Buildings 2023, 13(9), 2331; https://doi.org/10.3390/buildings13092331
Submission received: 10 August 2023 / Revised: 30 August 2023 / Accepted: 6 September 2023 / Published: 14 September 2023
(This article belongs to the Section Building Structures)

Abstract

:
This study examines the behaviors of structural members in their most vulnerable state (fixed along their weak axes) against sudden loads such as impact loads. To do so, eight supported rectangular hollow steel beam samples were constructed, and a circular head hammer weighing 75 kg was dropped as a free fall along the weak axes of these beams. Each fall had a different drop height (ranging from 250 mm to 2000 mm) and different amounts of energy (ranging from 183 J to 1471 J) in order to compare the structural behaviors of the beams against low velocity impacts with different drop heights and energy levels. Additionally, finite element analyses were conducted to investigate the performances of the rectangular hollow steel beams against impact loading along the weak axes numerically as well as experimentally. Initially, six model verification and mesh convergence analyses were performed to determine the optimum mesh size. After that, eight finite element models were developed with verified data in order to calculate the displacements, accelerations, plastic denting values, distributed stresses, and plastic equivalent strains. Consequently, impact load factors for static analysis were calculated mathematically and compared with the experimental and numerical results. Overall, the results obtained from the FE analyses were in line with the results obtained from experimental and mathematical studies. To sum up, the increases in the drop height of the impact force and the amount of energy in beams placed along their weak axes will increase the amounts of acceleration, maximum deflection, internal stress, residual displacement, and plastic denting in such beams.

1. Introduction

Structures are exposed to static and dynamic loads throughout their useful lives. Therefore, experimental and numerical studies are important in assessing the structural performances and behaviors of elements under such loads. A vast amount of literature can be found regarding the structural behaviors of elements under static loads. Dynamic loads, on the other hand, can have different characteristics at different times, and the changes caused by these varying loads in the elements need to be examined separately. Therefore, experimental and numerical studies are required to understand the structural behaviors of elements under both static and variable characteristics of dynamic loading. Dynamic loads on the building, namely earthquake loading, are defined as loading those changes over time in the form of mechanical vibrations or impact loads. Watson et al. [1] conducted preliminary studies about the structural behaviors of steel structures under impact loading. In the literature, some test methods and design parameters that are used in determining the behaviors of elements under dynamic loading have been determined in accordance with only some of the design codes [2,3].
Static loading tests are used to determine the properties such as moment and load-carrying capacities of the elements under constant loading, while dynamic loading is used to evaluate the changes that occur in the elements under the influence of loads that change over time. Dynamic loading, such as earthquake and impact loading, is the type of loading such that the structure is not carrying them all the time but might be exerted on the structure instantaneously and vanish soon after their occurrence.
Recently, terrorist and suicide attacks, which result in strong impact forces on the buildings near the attacks, are becoming a serious threat to the safety of the structures. These forces might cause a local or total collapse of the structure and can be very costly for structures of vital importance, such as military structures, nuclear reactors, and high-rise steel structures. To ensure the safety of these structures and the lives of people inside them, it is important to consider this risk parameter during the project’s design phase.
There are two types of impact loads, namely high-speed impact and low-speed impact loads, based on the speed at which the hammer hits the sample. Impacts caused by a missile are a good example of high-speed impacts, and a drop in weight on a beam, slab, or column is a low-speed or low-velocity impact. As of now, there are only studies about the failure mechanism of high-speed impact loading [4], as well as the failure state caused by high-speed impact and fire [5,6]. In addition, global imperfections and residual stresses, especially along the weak axes, have proven to be important in determining the failure state of steel elements [7]. It is thought that a plastic joint is formed on the element under the effect of low-speed impact at the point where the load falls. Therefore, the behavior of the element under the low-speed impacts is defined by the rigid-plastic material acceptance. The dynamic behaviors under low-speed impact effects of reinforced concrete and composite beams [8,9,10], steel and composite columns [11,12,13], slabs [14,15,16], and wall elements with different geometric features [17] have been studied experimentally and numerically. Different material models can be selected while creating the finite element model of the floor element under the impact [18]. Particularly in determining the element’s behavior under impact, the thickness of the element, its rigidity, the height from which the load is applied, the speed of the falling mass [19], the geometry of the falling mass [20,21], and the support boundary conditions [22] are important factors.
When impact loads are applied to the structural elements, different stress distributions occur in the elements, which enable us to obtain information about the dynamic properties of the affected elements. In addition, different vibrations are created in the elements during the collision due to the stresses that occur because of impact loads on the elements. For this reason, experiments are carried out to make broader and more accurate predictions about the impact behaviors of different element types at different heights or under different weights. Thus, the damage to the elements caused by incidents such as airplanes crashing into buildings, cars crashing into bridge piers, explosions in industrial facilities, falling rocks on tunnels and similar structures, as well as the risk level of structures with military status being hit by a missile can be predicted. The preliminary studies available in the literature emphasized that the axial load is not important in determining the column behavior under the impact load [23]. The region in which deformation occurs in the direction of the falling load (impact load) is defined as the bending region. As the changes occurring in the bending region of the elements subjected to only axial load were examined, it was observed that the deformation in the bending region was not related to the axial load, and this deformation did not provide information about the dynamic properties of the element [23,24].
The hollow steel elements used in this study are commonly used in steel structures, offshore structures in the open sea, and bridge beams. Studies have been conducted on different joint configurations of these elements used especially in offshore structures [25], element collapse state [26,27,28], and collapse energy [29,30]. When the beam elements placed along the weak axis were subjected to impact force, the structure quickly reached the limit state, particularly in offshore structures. In addition to evaluating the effect of impact load on steel and concrete-filled steel tubular members, there are several studies focusing on reinforced concrete elements, composite elements [26,31,32], and reinforced elements [33,34,35] as well. The same amount of energy that is produced due to the impact load can be produced with different impact speeds, and these speeds cause displacements depending on the stiffness of the sample. In addition, different impact velocities with the same energy generated in the element change the local stress distribution in the element [36].
Structures are designed according to the type and number of loads that they will be exposed to during their service lives. Therefore, strong and weak axes that are determined by the inertial forces of the elements in building design are taken into consideration.
The aim of this study is to determine the behaviors of structural members in their most vulnerable state against low-velocity impact loading. For this purpose, eight rectangular hollow section beams were prepared and examined under simply supported conditions experimentally under different impact loadings on their weak axes. Moreover, to investigate the beam performances numerically, a mesh convergence study was initially performed on six FE models to validate the models’ boundary conditions and material properties and determine the optimum mesh size. Following the initial study, eight FE models were developed to investigate the performances of the rectangular hollow steel sections under impact loading on their weak axes. Lastly, the impact and reaction forces that are calculated experimentally and mathematically will be compared in order to evaluate the impact load factors for static analysis. The obtained results from experimental, mathematical, and numerical studies are discussed in Section 4. Consequently, the conclusions and recommendations are given in Section 5.

2. Experimental Study

2.1. Material Properties

We conducted a tensile stress test to determine the mechanical properties of the steel that was used in this experiment. To do so, three coupon samples were prepared according to ASTM standards [37]. Since the fabrication date of the steel has an effect on the tensile stress performance of the steel [38], and to avoid this marginal difference, test samples were selected from a set of steel that was fabricated at the same time. Three coupon samples, namely, S-1, S-2, and S-3, were taken from each beam, and uniaxial tensile tests were conducted. Figure 1 shows the obtained stress-strain curves as well as the images of the coupons before and after the test. In addition, Table 1 presents the mechanical properties of the coupon samples.

2.2. Specimen Geometry

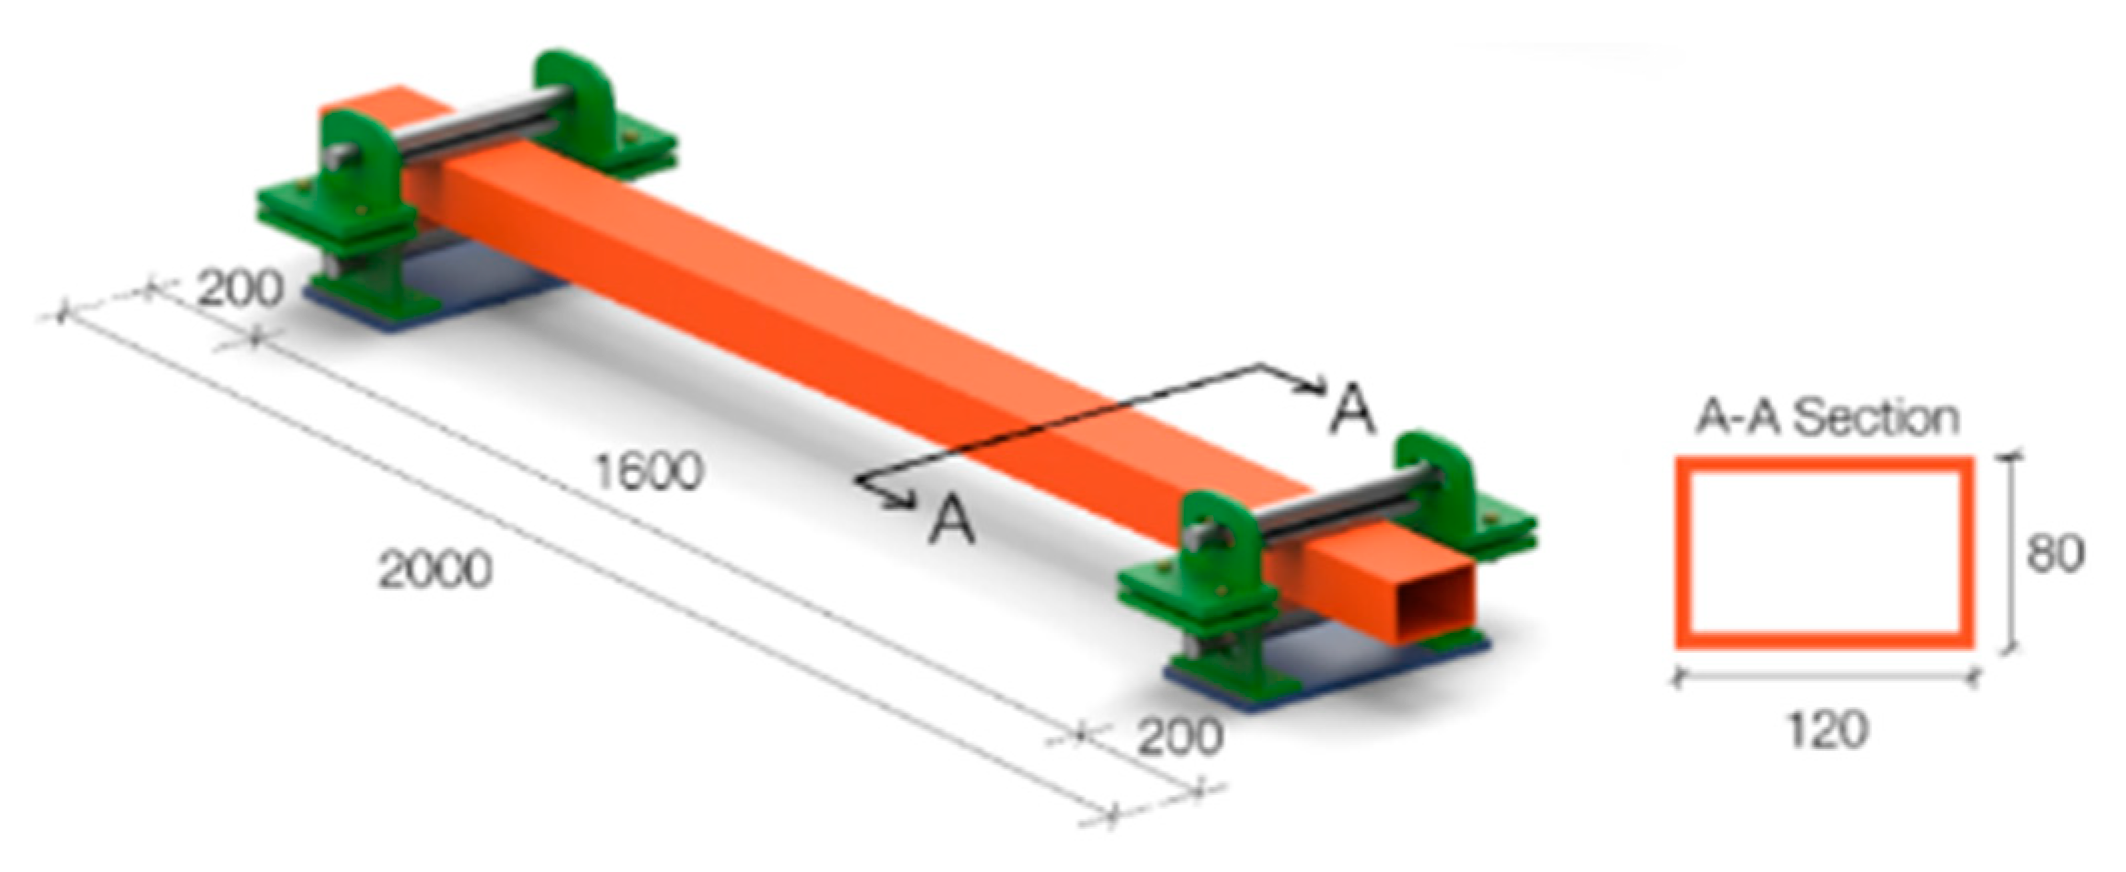
For the purpose of conducting the designed experiment to evaluate the effect of impact load on the weak axis of a rectangular hollow steel profile, a steel profile with sectional dimensions of 120 × 80 × 3 mm with a length of 2000 mm and S275 JR steel class was selected. The beams were placed on their weak axis in the prepared 8 samples. The samples were divided into A and B series in order to avoid any confusion and simplify the work process. Series A samples were the ones that would experience an impact ranging from a drop height of 250 mm to 1000 mm, and series B samples were the ones experiencing an impact from a drop height of 1250 mm to 2000 mm, as presented in Table 2. All test samples were constructed with the same geometry and mechanical properties, as well as the same structural supports. Furthermore, Table 2 provides details about the properties of test specimens.

2.3. Test Setup and Measurement

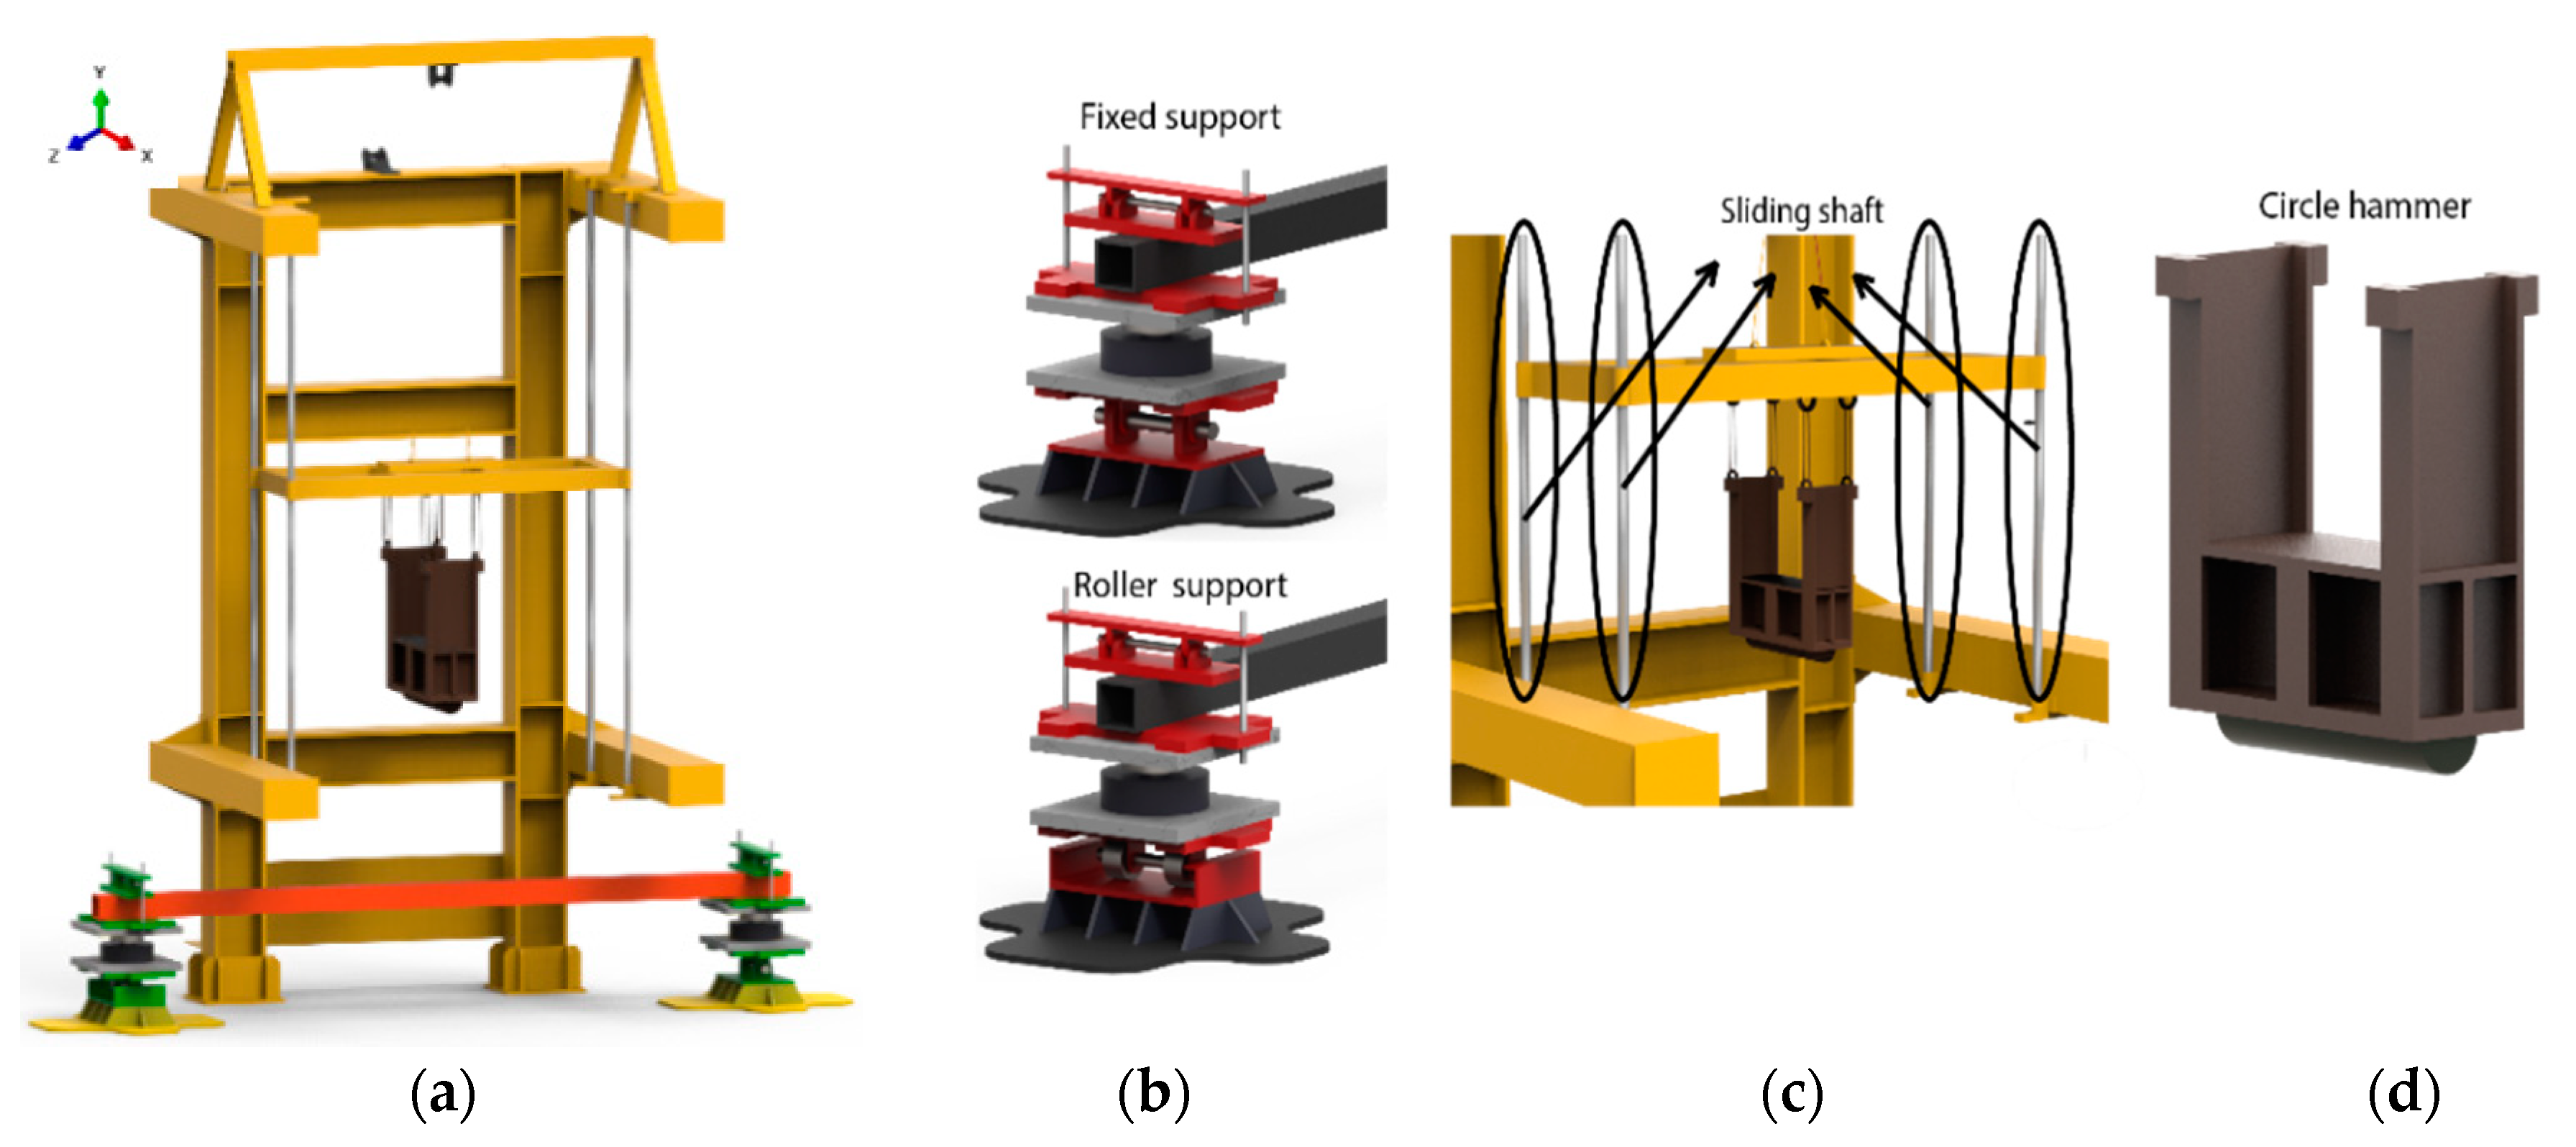
During the experiment, as it shown in the Figure 2, eight simply supported rectangular hollow steel beam samples with 2000 mm length, 120 × 80 mm width and height were constructed and tested under impact loading. A circular head hammer with a constant weight and same boundary conditions was dropped in a free fall manner from different heights (250–2000 mm) over a simply supported beam with a pin and a roller support in its two ends as shown in Figure 3a,b. While determining the impact energy, the impact energies during the ferrying to the offshore structure of the ships in real life were taken into account [29]. All translations in the pin support were equal to zero, while in the roller support, only the X and Y directions were zero, and the translation in the steel beam longitudinal direction (Z) was free. Moreover, the beam was fixed in a way that would absorb the impact load in its weak axis. The starting point of the drop height was controlled with four sliding shafts that were lubricated to minimize the friction before each free fall of the hammer, as shown in Figure 3c. The sliding shafts were also used to place the hammer exactly at the midpoint of the beam in order to avoid eccentricity during the impact. The dropped hammer had a circular head geometry with a constant weight of 75 kg made up of S355 steel, as shown in Figure 3d. The same hammer was used for all the experiments.

3. Numerical Studies

3.1. Finite Element Modeling

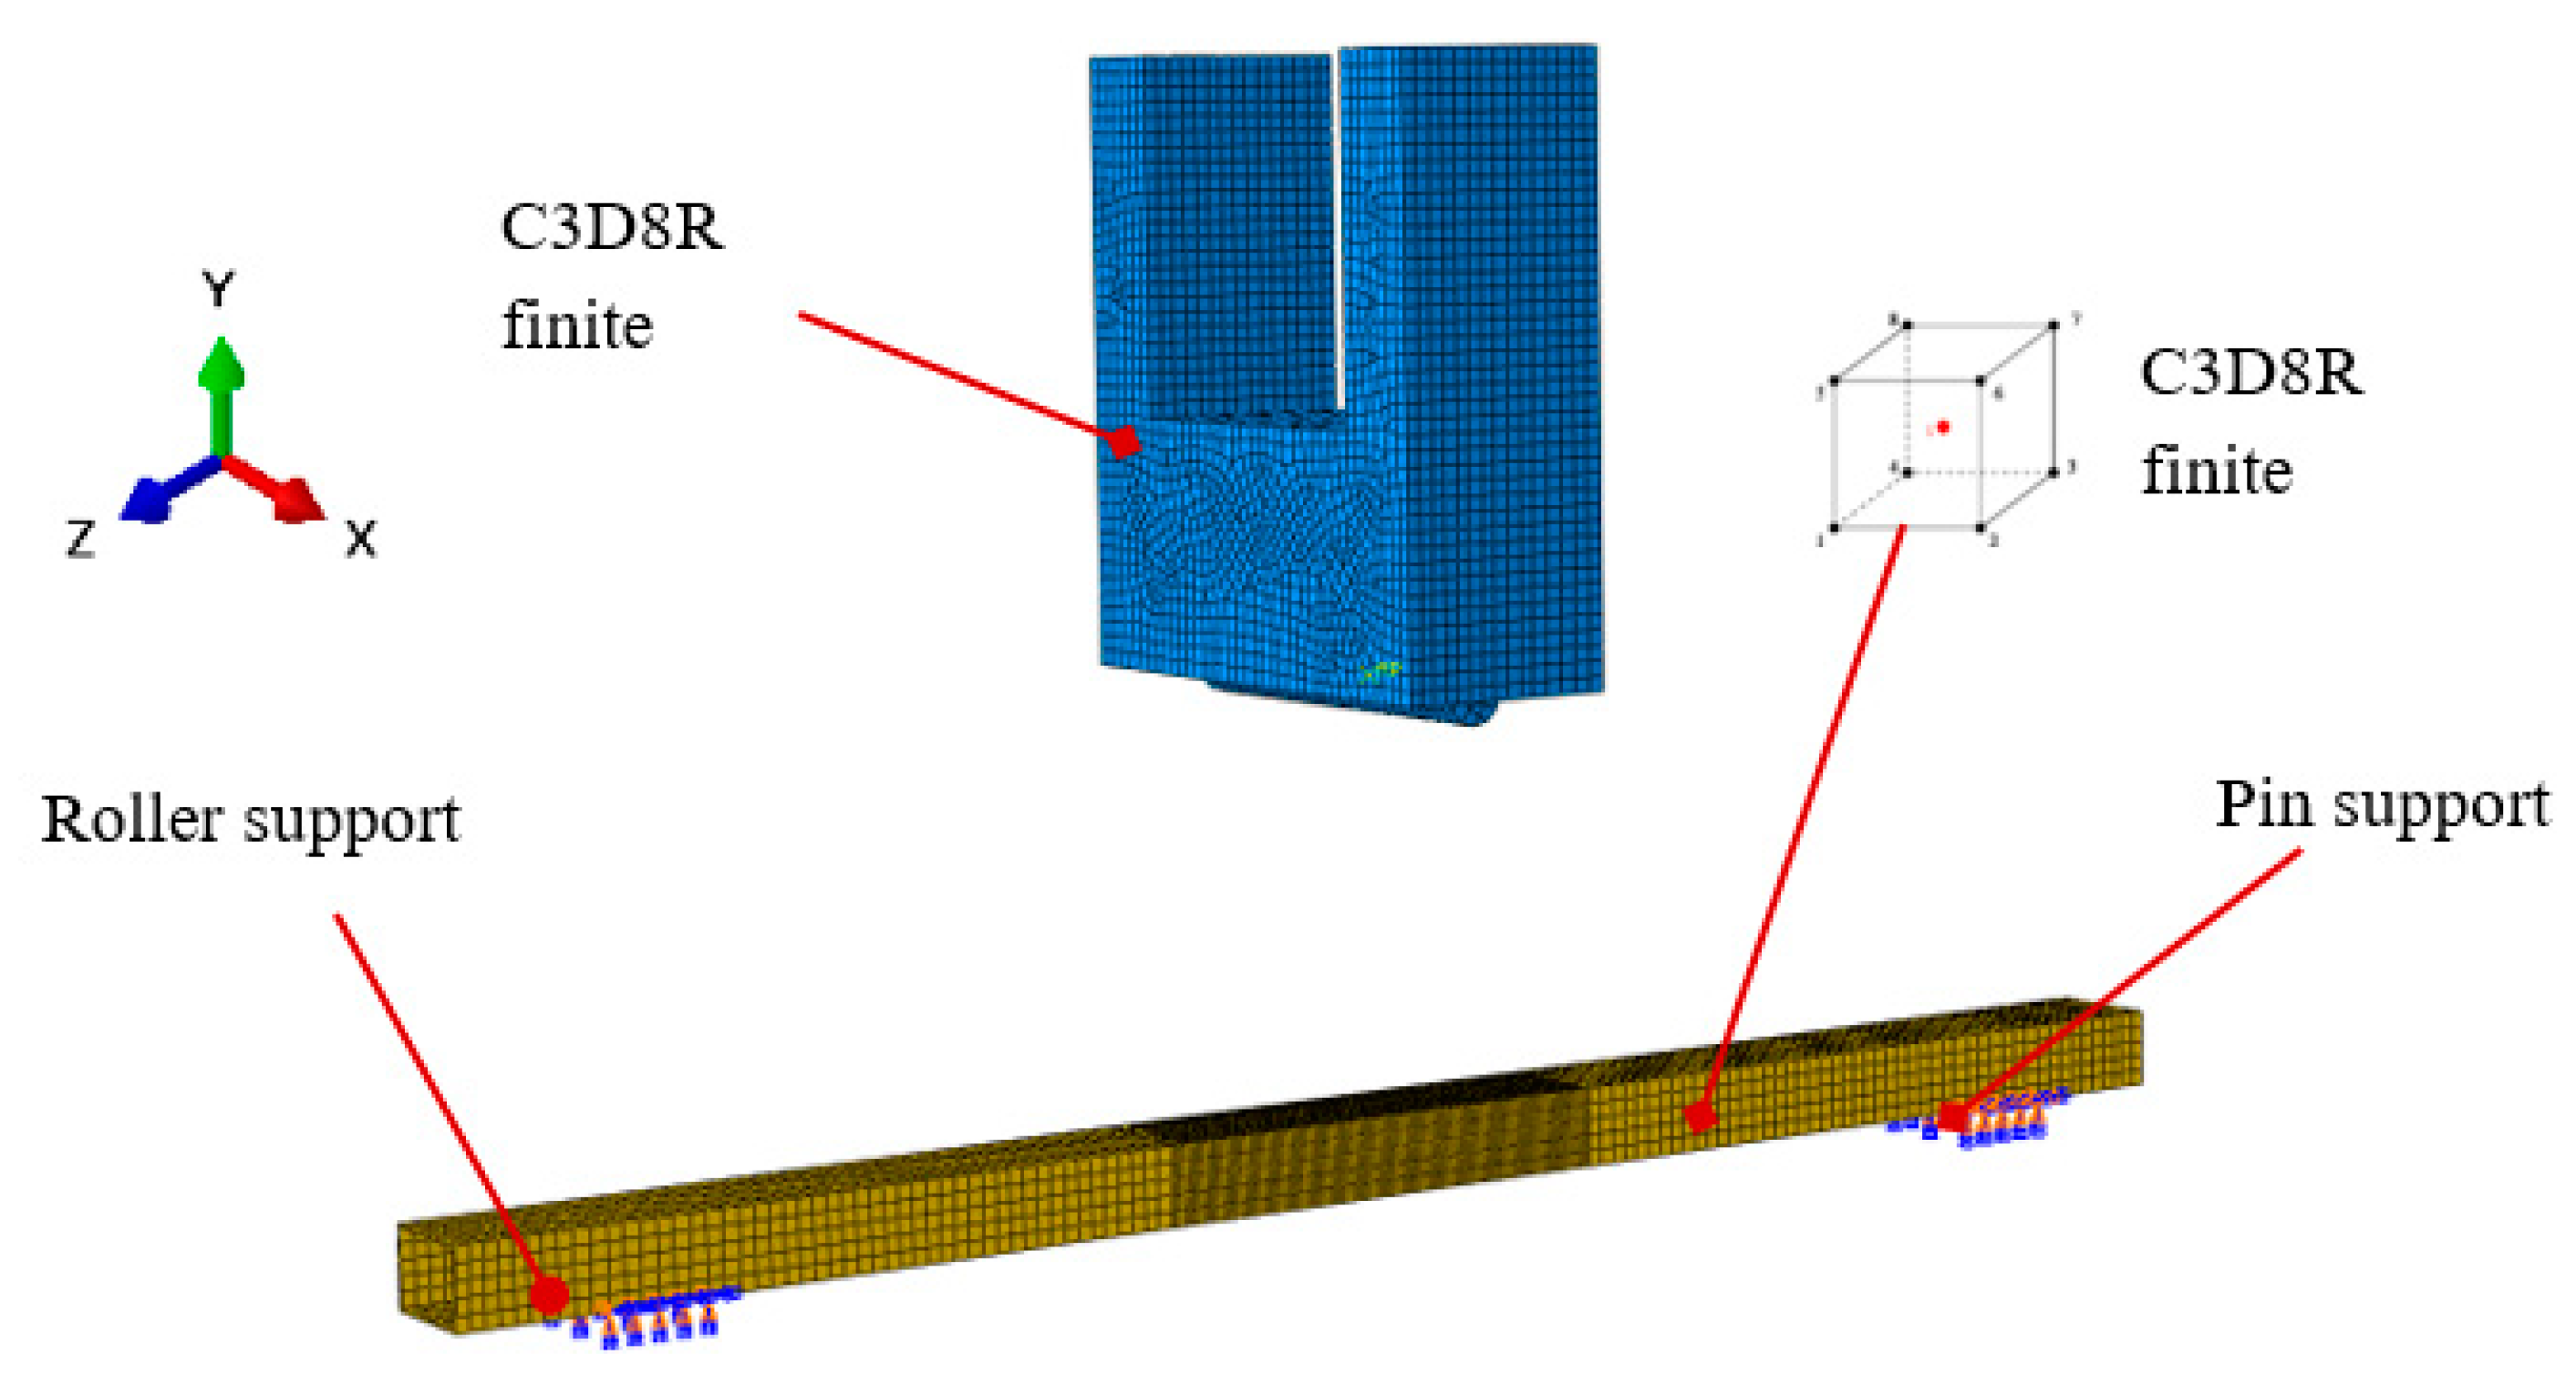
We developed 8 FE models, namely S#1Fem, S#2Fem, S#3Fem, S#4Fem, S#5Fem, S#6Fem, S#7Fem, and S#8Fem, resembling the samples in the experiment. After developing the models, we calculated the stress distributions, plastic deformations, reaction forces, displacements, and accelerations of each model. To achieve accurate results, we modeled all parts of steel profiles, and the impactors were modeled. We used the ABAQUS/Explicit [39] package to carry out 3D nonlinear finite element analysis. We used the eight-node brick element with reduced integration (C3D8R) element type in the modeling process. We modeled the impactors as having a discrete rigid body, and the element was modeled as C3D8R (Figure 4).
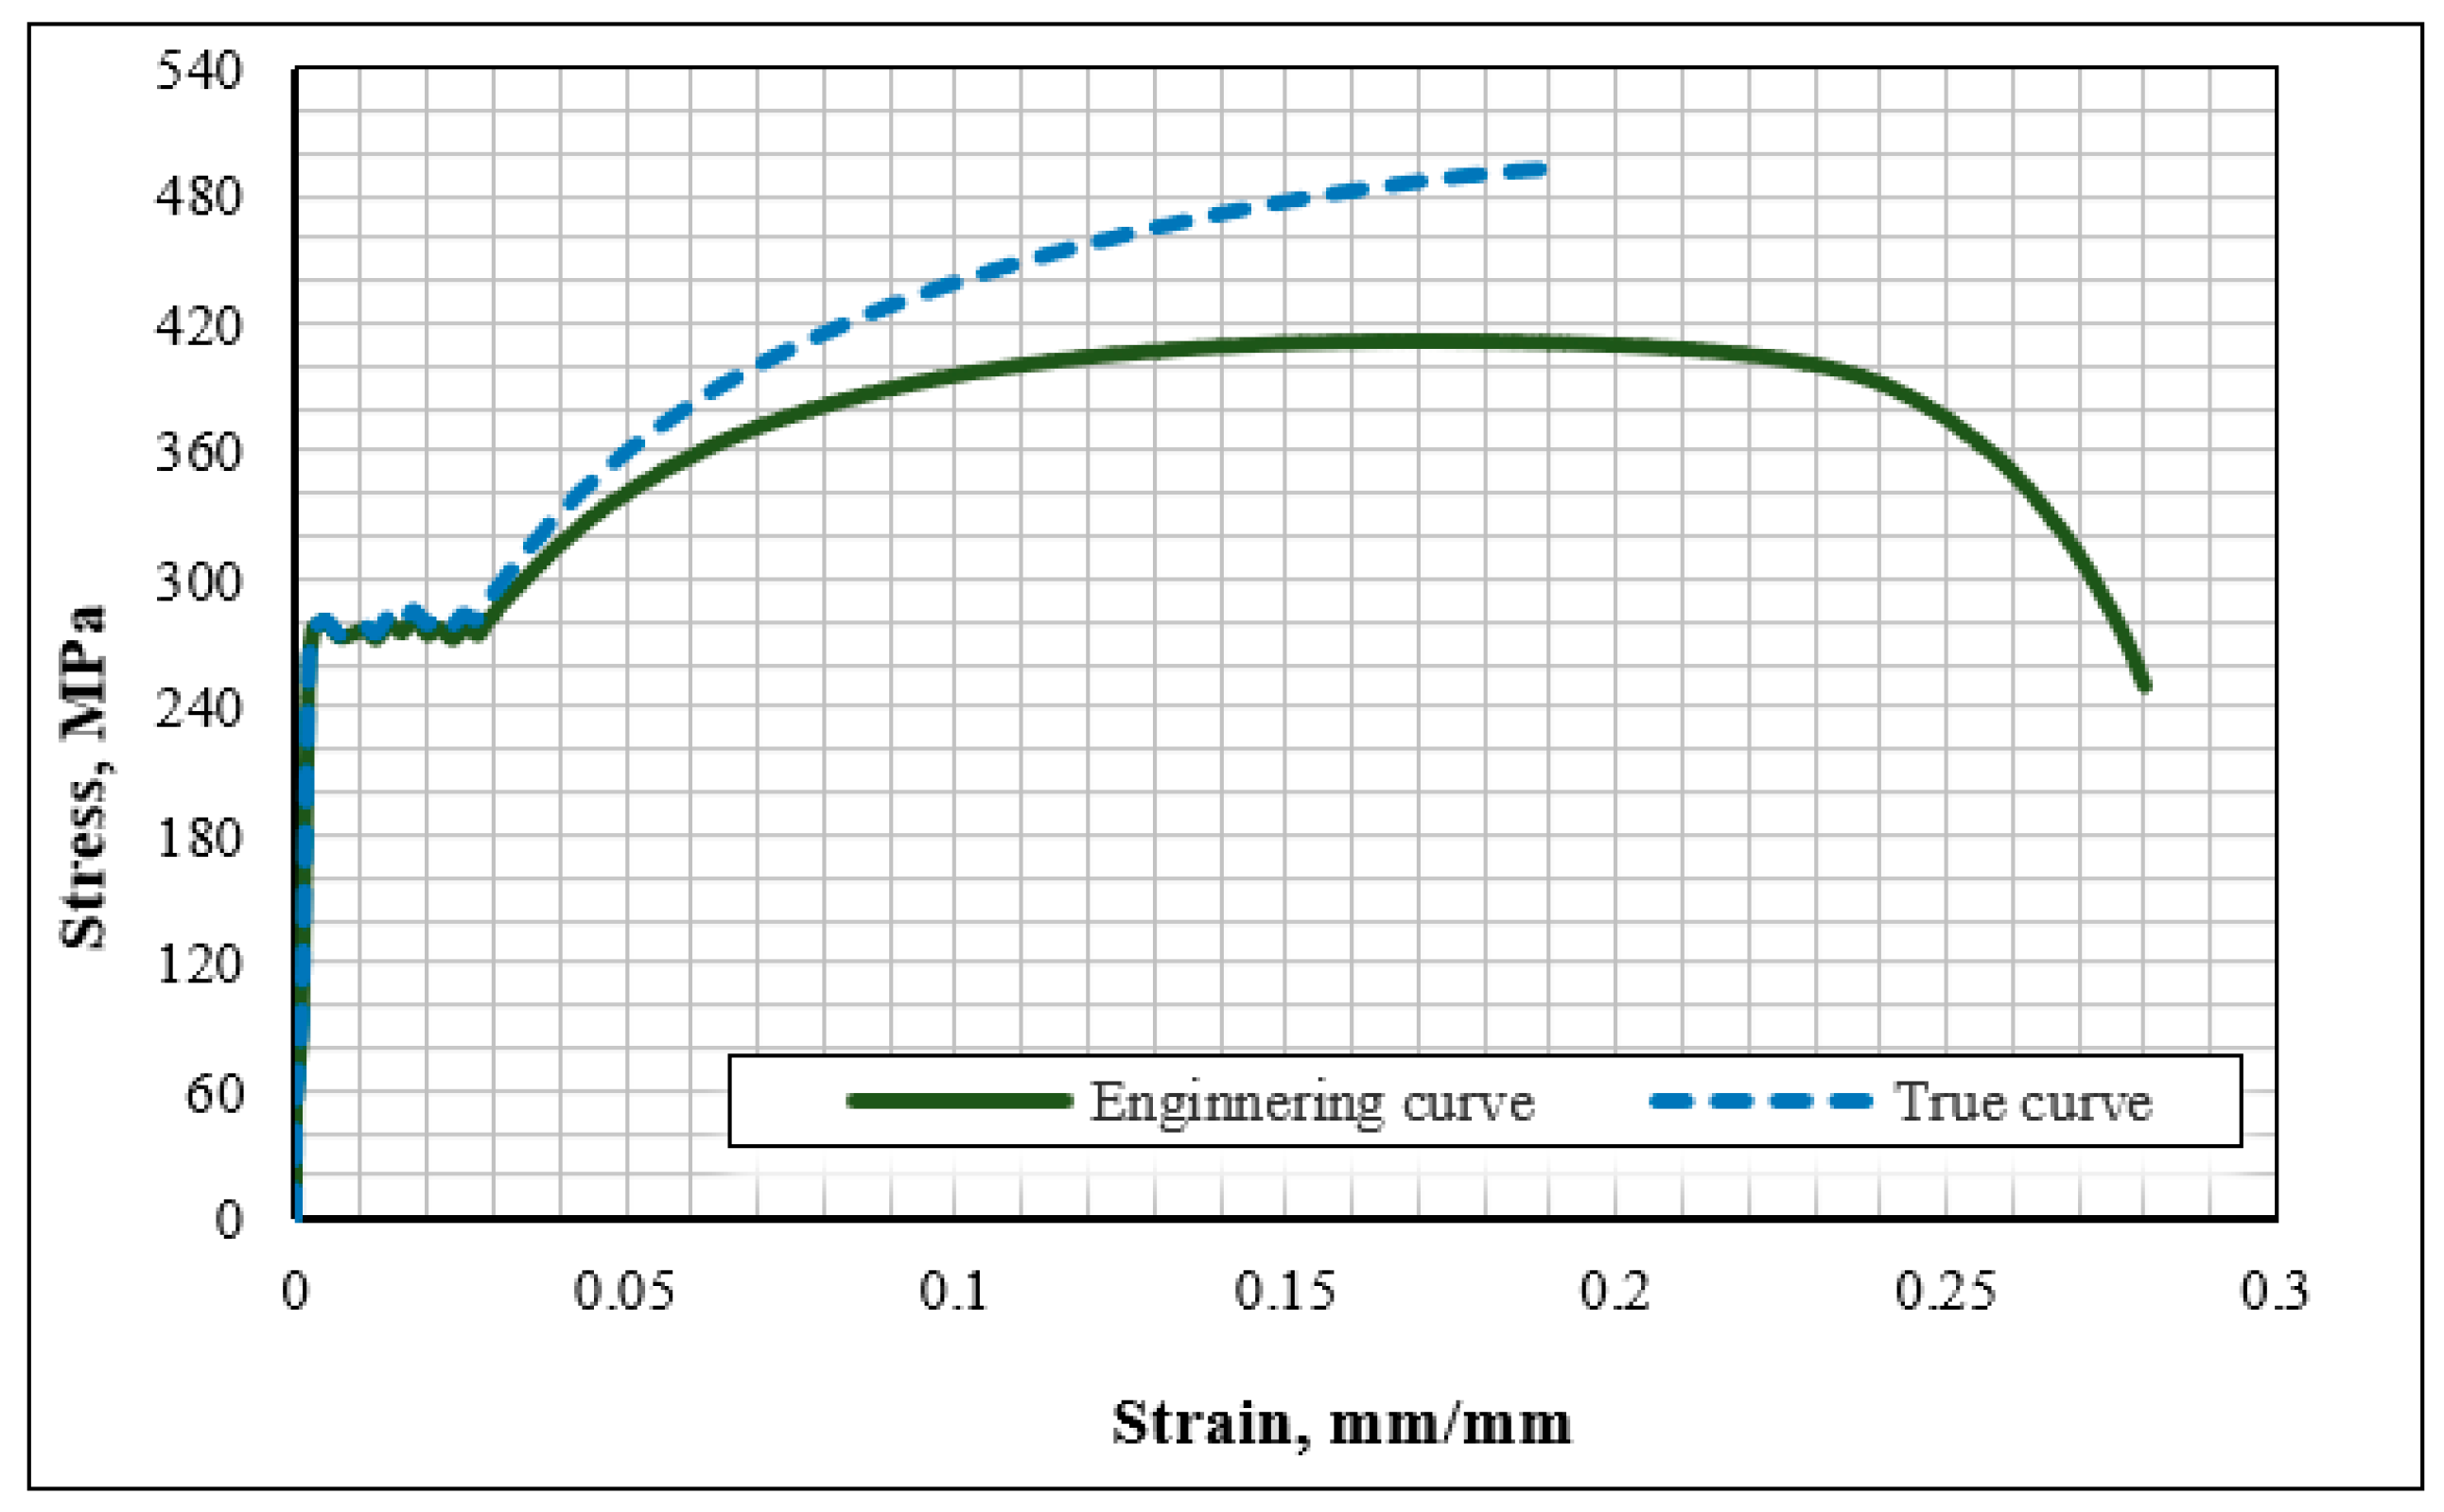
Regarding the properties of the materials, the tensile coupon average was calculated, and using Equations (1) and (2), we changed the engineering stress-strain response to the true diagram of the S275 JR steel grade. Then, we used the obtained true diagram in modeling the steel material as a nonlinear isotropic hardening model in the FE study.
σ t = σ 1 + ε
ε t = l n ( 1 + ε )
In Equations (1) and (2), σt is the true stress, εt is the true stain, σ stands for the average of the engineering stress diagram of three coupons, and ε shows the average of the engineering strain.
The obtained engineering stress-strain curve used in the numerical studies is illustrated in Figure 5. We defined the boundary conditions for the FE models as pin and roller supports at the right and left of the beam, respectively. We kept this condition the same during the experiment and FE analysis process. At the time of impact loading, the out-of-plane motions of the impactors were limited. The impact loading in the numerical studies was defined as the free fall impact of a circular head hammer with a drop height ranging from 250 mm to 1000 mm for test series A and 1250 mm to 2000 mm for test series B, respectively.
In the finite element (FE) simulations, the strain rate effects on steel materials were not taken into consideration, as all specimens were subject to low-velocity impacts. According to Richardson and Wishear’s research [40], strain rate effects are insignificant at initial impact velocities (Vo) under 10 m/s. In this study, all examined specimens have an initial velocity under 8 m/s; therefore, the strain rate effects have been ignored in numerical simulations.
To simulate the contact behavior during the impact analysis between the impactor and steel beam, normal and tangential behavior were used. In contact problems between two stiff materials, generally, hard contact is used. The friction coefficient for steel material in hard contact is used as µf = 0.3 for all FE models. In the elastic slip, the value of the fraction of characteristic surface dimension was used as 0.005 [41].

3.2. Mesh Convergence Studies

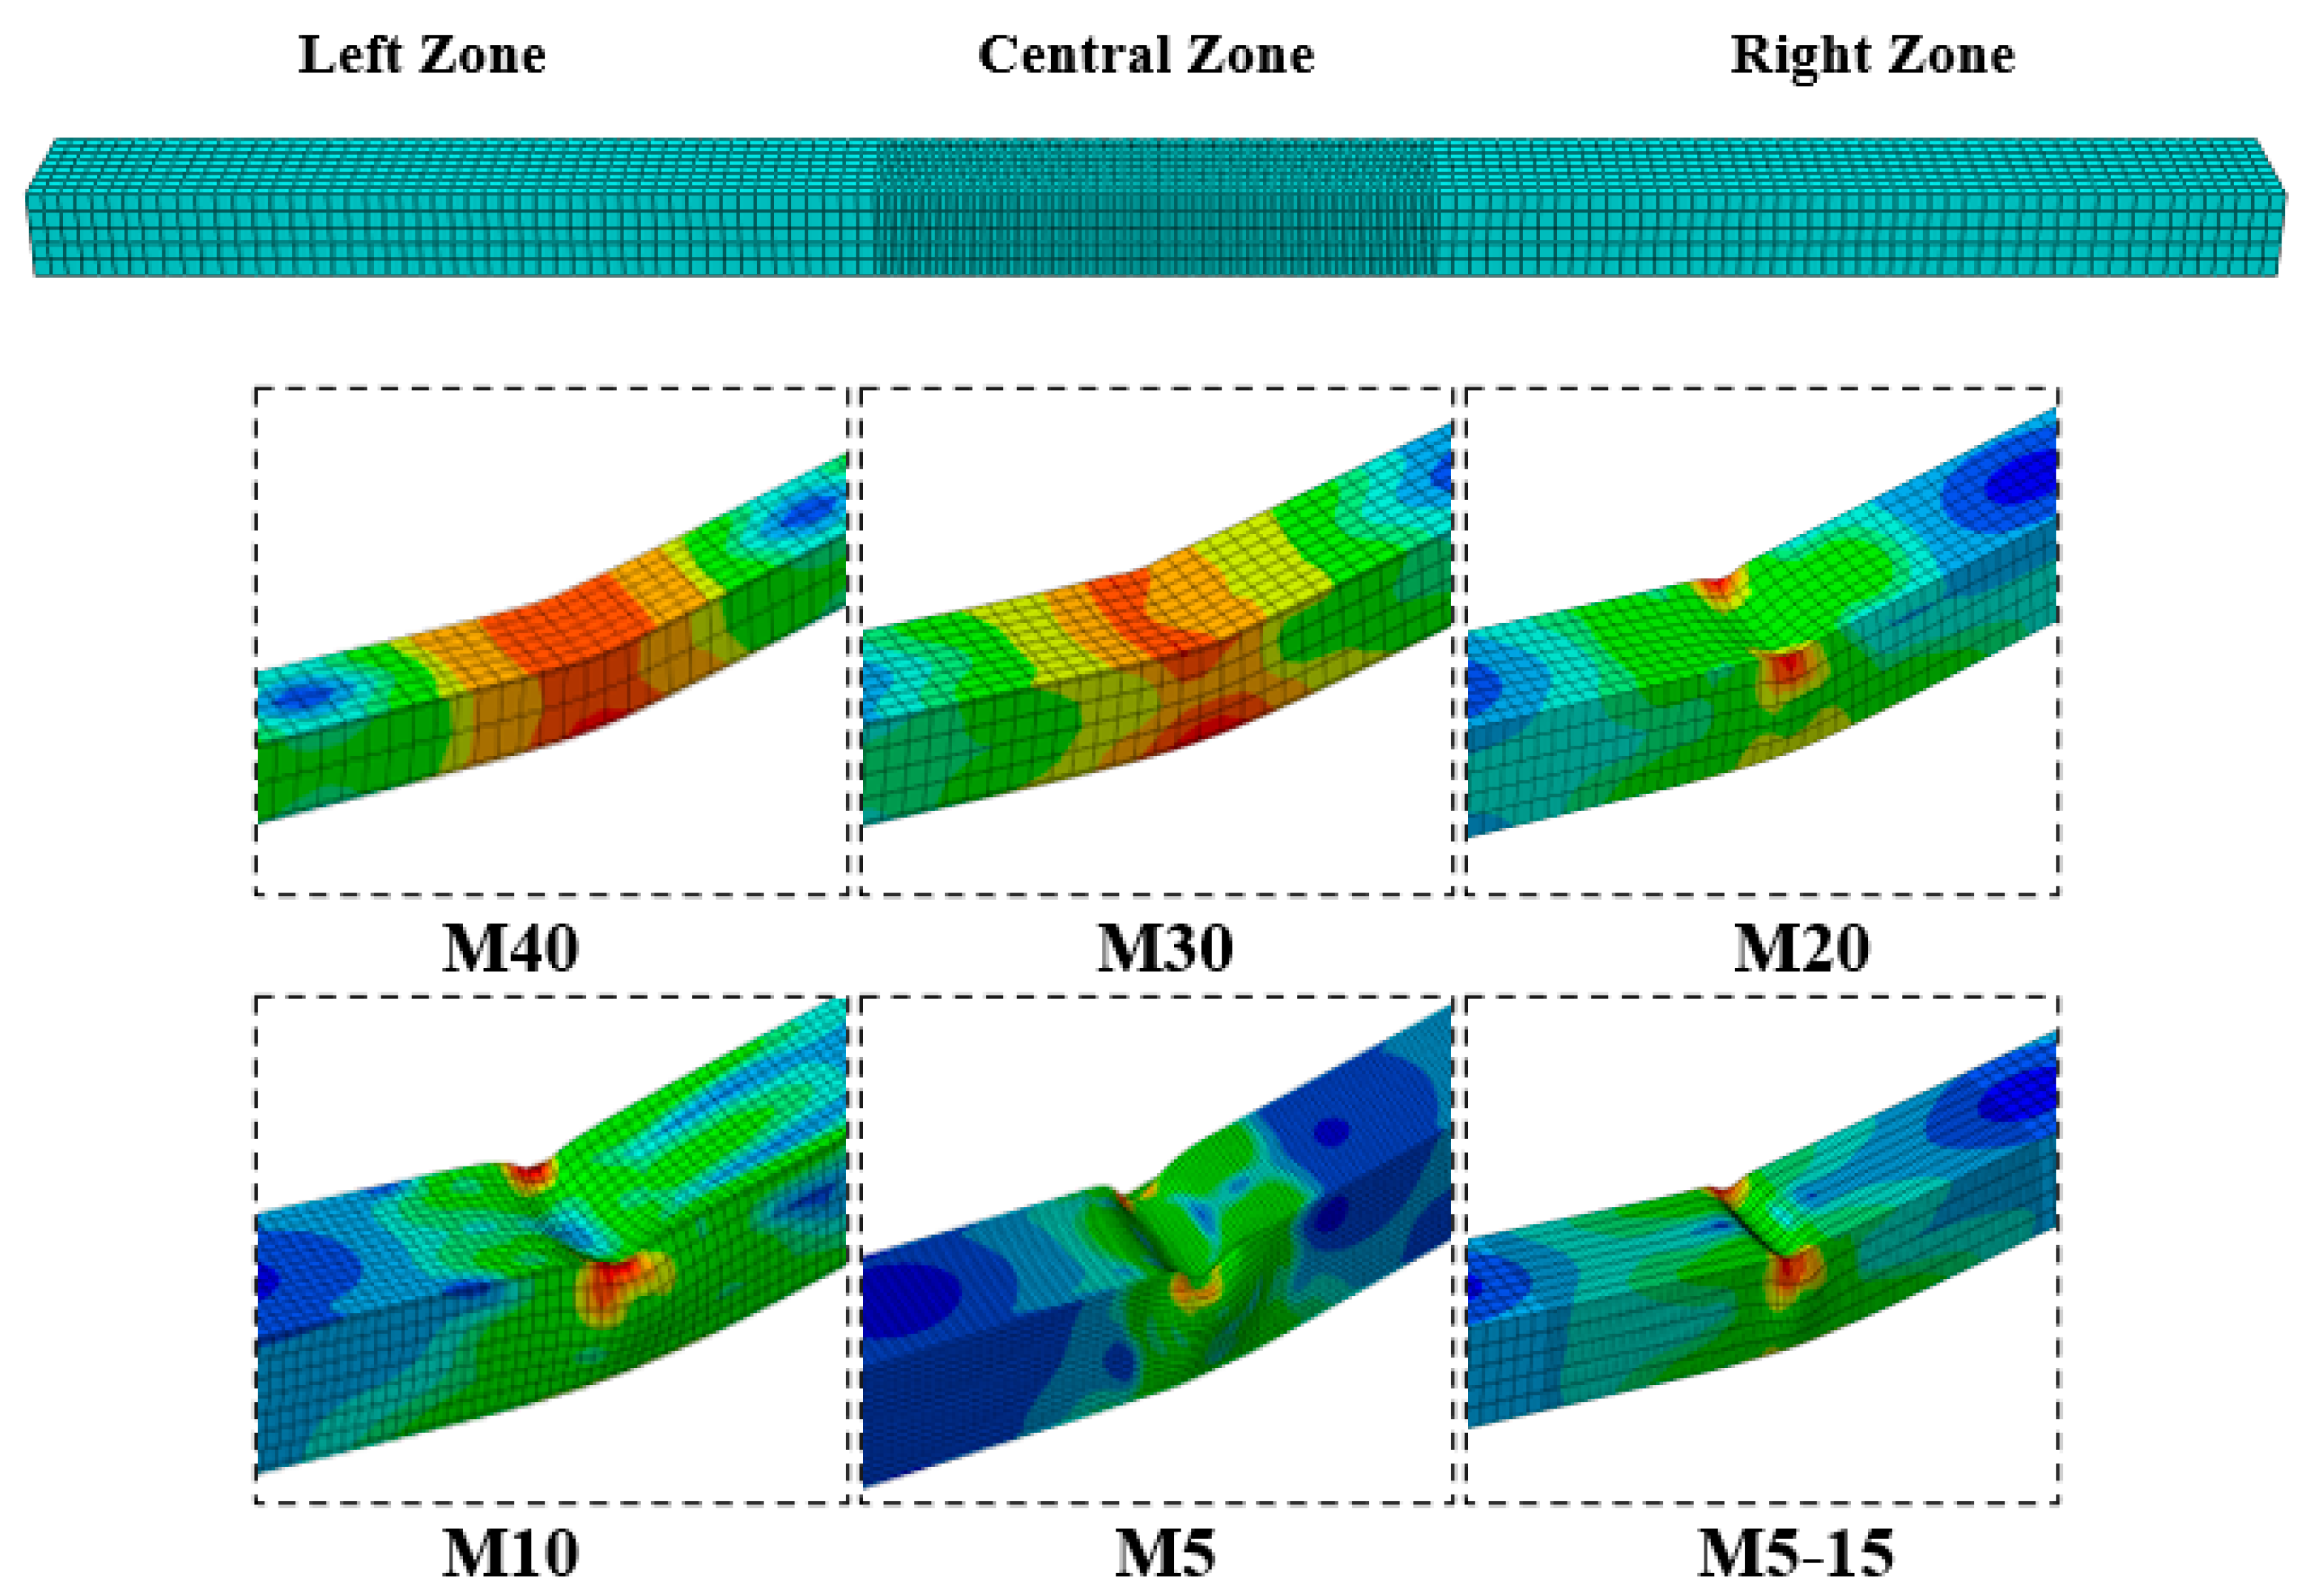
We conducted a mesh convergence study to determine the best size of the mesh. As the damage and denting of the beam in the experimental study were obtained with minimal data and time, it was possible to conduct the finite element analysis with a very small mesh size. However, that would increase the amount of data and analysis time drastically. Therefore, we conducted a mesh convergence study in order to specify the optimum mesh size. For this purpose, we initially divided the beam into three equal parts, namely, the right zone, central zone, and left zone, as shown in Figure 6. This is due to the fact that during impact loading on the simply supported beam, the damage is mainly caused around the denting area.
In order to verify the experimental results and finite element analysis, the analysis was conducted to the limit that was permitted in the literature. As a reference for this, the mid-span displacement of the experimental result, which was measured in three different ways, was taken. Moreover, for the finite element analysis, the C3R8D element was used.
Furthermore, six different mesh sizes, namely M40, M30, M20, M10, M5, and M5-15, were examined in order to determine the optimum mesh size. The number in the names of each mesh is equal to one side of the cubic mesh. Thus, the dimensions of the mesh sizes were 40 × 40 mm, 30 × 30 mm, 20 × 20 mm, 10 × 10 mm, and 5 × 5 mm, respectively. The impact load was exerted as the 75 kg impactor from 1 m height. The same load and boundary conditions were considered for all the FE models. The amounts of maximum displacement from the experimental study were compared with the results obtained from the different mesh sizes of finite element analysis in which the difference between the experimental result and M40 was 35.02%, while the differences in displacement of M30, M20, and M10 with the experimental results were 27.49%, 16.43%, and 7.29%, respectively. These results are presented in Table 3.
Moreover, an analysis for M5 was conducted in which the difference compared with the experimental results was only 3.52%. However, the analysis time was 2.5 times the M10 analysis, and the amount of data was 2.5 times the M10 data. In order to minimize the differences between the experimental results and FE results, a new rectangular mesh size named M5-15 (5 × 15 mm) was introduced [42]. As previously mentioned, most of the damage in simply supported beams under impact loading is around the denting area, and according to the existing literature, the maximum plastic dent zone longitudinal length is 3.5 D, where D is equal to the height of the rectangular hollow section beam [43]. However, in order to maintain the accuracy of the analysis, the longitudinal plastic dent zone was selected as 7 D [21]. As most of the plastic deformations would occur around the dent zone (in this case, the central zone of the beam), the M15 (15 × 15 mm) mesh size was selected for the right and left zones of the beam in order to reduce analysis time. The M5-15 mesh size was chosen for the central zone to estimate the vertical in-plane and out-of-plane plastic deformations of the beam. In line with our expectation, the difference between the experimental results and FE analysis was reduced to 1.12%. The analysis time and amount of data of M5-15 were almost 60% less than M5 and more accurate than all of the other mesh sizes.
Figure 7 illustrates the displacement-time graphs for all the finite element cases as well as the experimental results in which the closest graph to the experimental results was from the mesh size M5-15. Details of the mesh convergence analysis are presented in Table 3. As the results obtained from M40 were compared with those from M5-15, the results obtained by the latter were 31 times more realistic than M40.
To sum up, the M5-15 (5 × 15 mm) mesh size had the least difference with the experimental results, while out-of-plane denting could be observed in it and had the least analysis time and amount of data. Thus, the M5-15 mesh size was selected as the finite element mesh size for all upcoming finite element analyses.

4. Results and Discussion

4.1. Experimental Results

4.1.1. Displacement-Time Responses and Damage Status

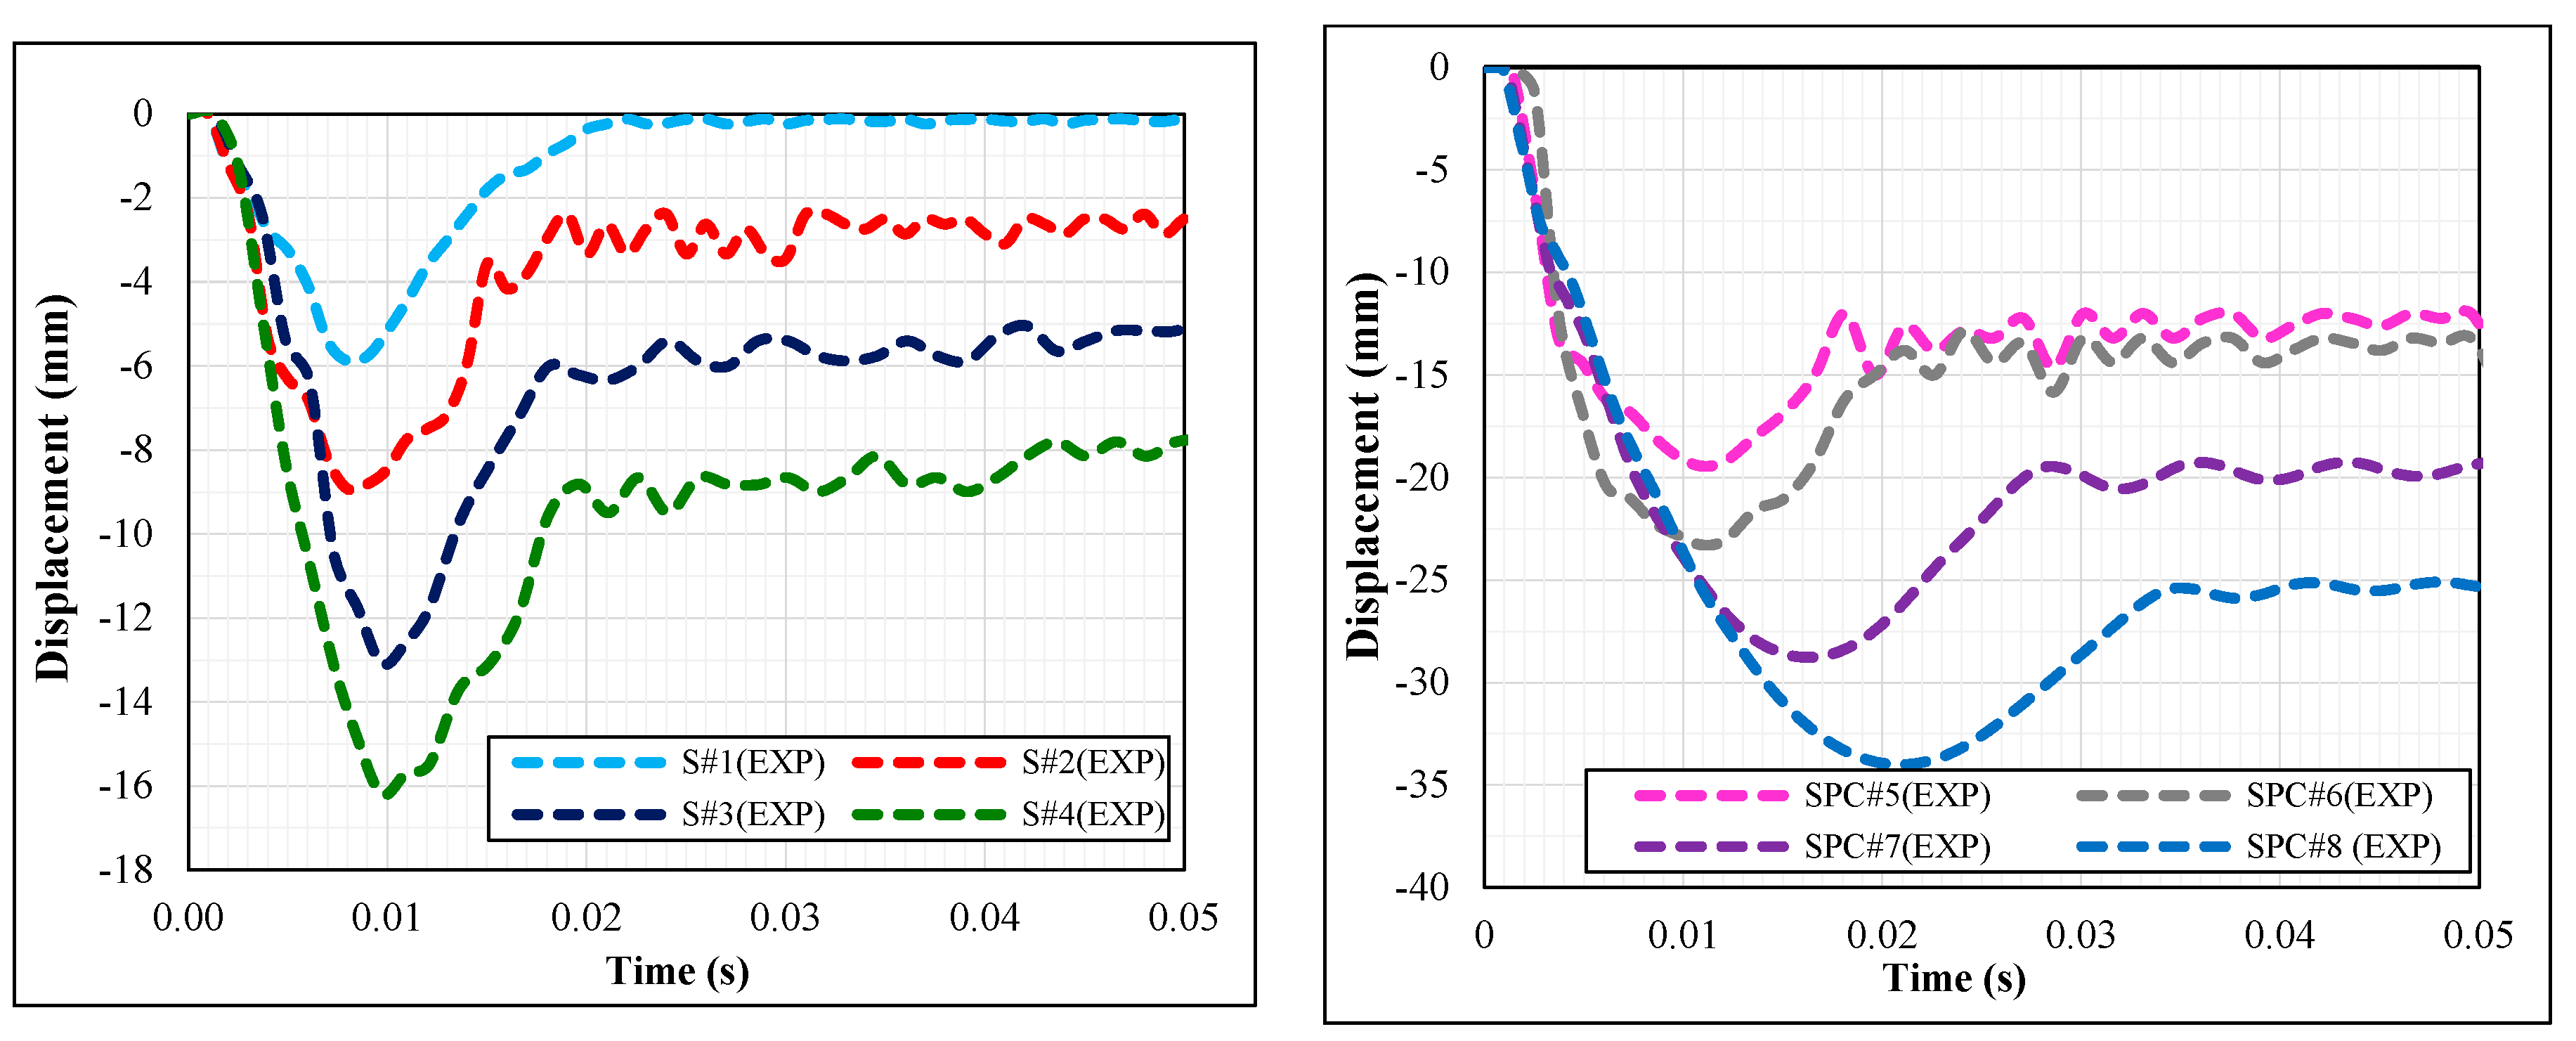
In the experimental study, the displacement-time curves of eight test specimens placed along the weak axes with the same support condition and hammer weight but different drop heights are shown in Figure 8, and the data obtained from these experiments are presented in Table 4.
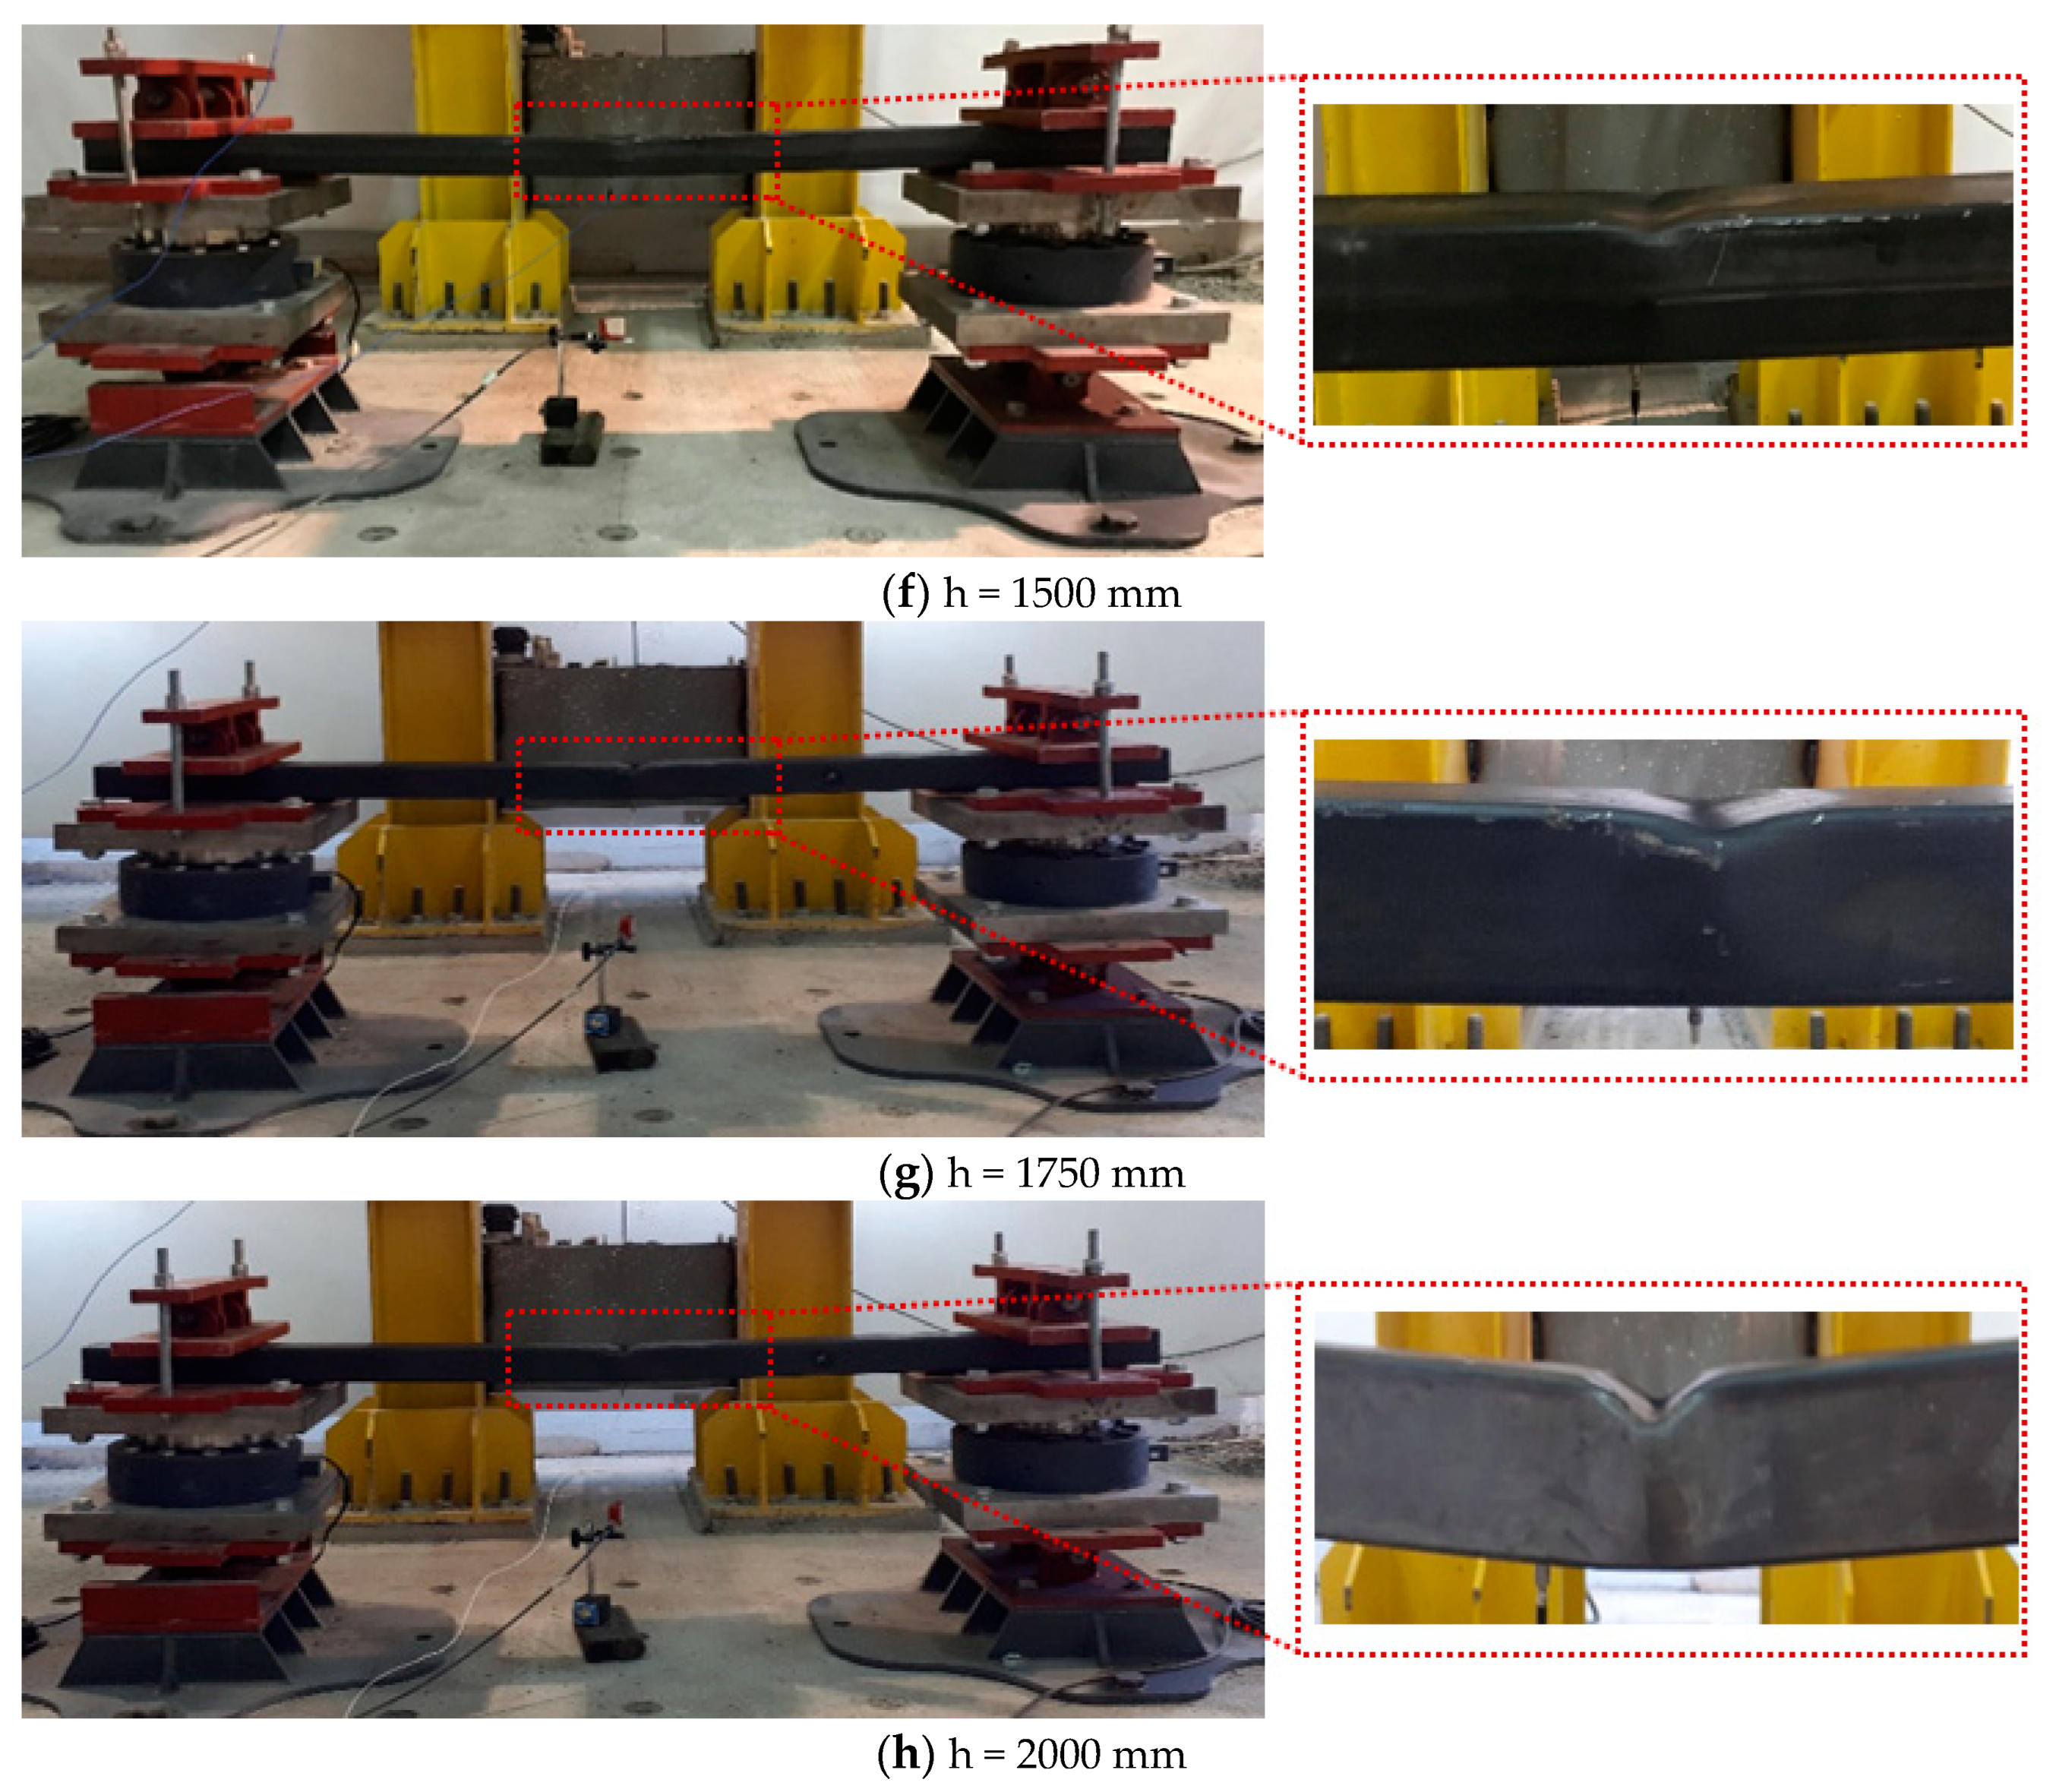
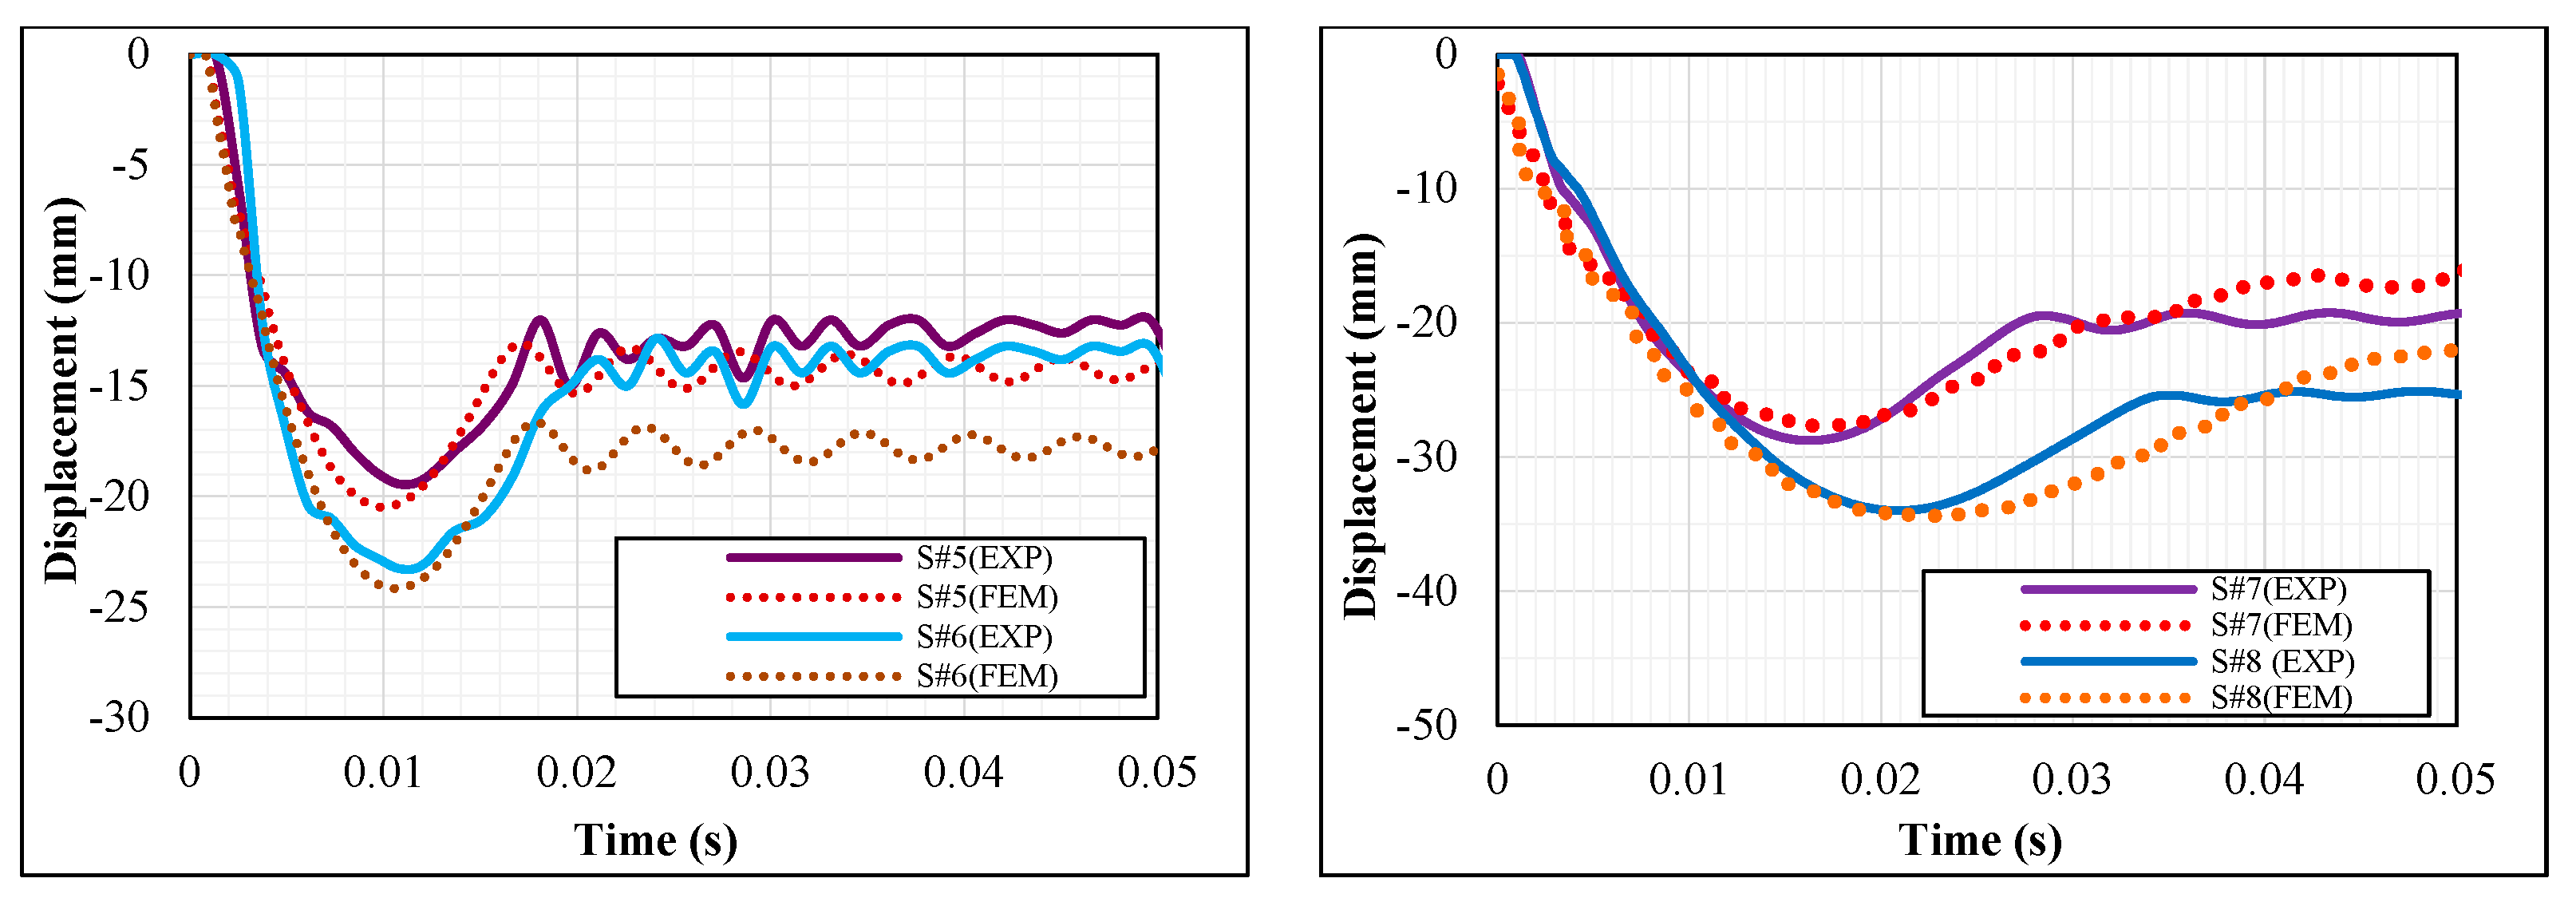
The mid-point maximum displacements of the samples named S#1EXP, S#2EXP, S#3EXP, S#4EXP, S#5EXP, S#6EXP, S#7EXP, and S#8EXP in which the load was placed along the weak axes of the series A and B were measured as 5.88 mm, 8.93 mm, 13.08 mm, 16.19 mm, 19.14 mm, 23.28 mm, 28.77 mm, and 33.99 mm, respectively. The images of the samples taken during and after the impact are illustrated in Figure 9. Moreover, the obtained displacements and the impact energies of the hammer calculated using 2 mgh are given in Table 4. The series A samples with a drop height of 1000 mm and a hammer weight of 75 kg, which produced 735.75 J energy, had partially performed in an elastic state. Particularly, the local denting or residual deformations in the beams of S#1EXP and S#2EXP in the impact area were not large enough to be measured in centimeters, and the occurring displacement could only be measured using an experimental instrument. Plastic deformations were observed in S#3EXP and S#4EXP, but the displacement measurement was only possible using an experimental instrument similar to S#1EXP and S#2EXP. However, plastic deformation started to occur in considerable size in the test elements in series B starting from 919.69 J impact energy and started to create visible differences in the displacement values of the test elements at every 250 mm height increase.
The deformation by 1471.50 J energy caused the maximum displacement (33.9 mm) in series B (S#8EXP). The hammer drop-height difference and amount of energy between S#1EXP and S#8EXP have increased 8 times, while the midpoint maximum displacement values have increased approximately by 6 times. As per the available studies in the literature, the plastic deformation occurrence depends on the speed of the impact force and the boundary conditions [1,22]. The results obtained from the experimental study were in line with the literature, and the increase in the plastic deformation of the test elements was directly proportional to the hammer drop height and amount of impact energy. In addition, the distances of the denting that occurred in the sample were examined as well.

4.1.2. Acceleration-Time

In order to determine the behaviors of all the test specimens with different drop heights right after the impact force application, accelerometers were placed under the point where the impact force was applied to measure the acceleration values with respect to time and interpret the obtained results mathematically. Since the accelerometers are very sensitive, the obtained data would be affected by the external noise, and the noise can be seen as vibration on the acceleration-time curves. As Saatci [14] concluded that the deformations in the elements develop in accordance with the acceleration values, the acceleration values obtained from the experimental study are important in determining the element behaviors. The acceleration values of the test samples S#1EXP, S#2EXP, S#3EXP, and S#4EXP placed along the weak axis in series A were measured as 260 g, 290 g, 570 g, and 743 g, respectively. The acceleration values of the test samples S#5EXP, S#6EXP, S#7EXP, and S#8EXP placed along the weak axis in series B were measured as 910 g, 1092 g, 1306 g, and 1706 g, respectively.
Figure 10 shows the acceleration-time curves obtained from the previously mentioned experiment, and Table 4 presents the values obtained from these curves. As expected, the minimum and maximum acceleration values were obtained from the test samples S#1EXP (260 g) and S#8EXP (1706 g), respectively. Comparing the two test samples, which were made of the same material and had the same test conditions with hammer drop height and impact energy being increased by about 8 times, the acceleration value increased only by 6.5 times. After looking into the acceleration data of all test samples, it could be seen that the maximum acceleration values increased with an increase in the hammer drop height. In addition, it was observed that the acceleration values started to form local deformations after 600 g, and then the increasing acceleration values caused plastic deformations in the test elements. In addition, the local deformations formed in the test samples were symmetric. This means that there was no eccentricity when the hammer slid from the sliding shaft in a free fall movement over the frictionless rail.

4.1.3. Impact Force

The impact force value that occurred in the test could be obtained from the sum of the inertial force generated in the opposite direction to the impact force and the reaction forces formed in the opposite direction in the supports [14]. The impact force curves of all eight test specimens are illustrated in Figure 11, and the data obtained from these curves are given in Table 5. Support reactions are obtained from the values taken from the load cell placed in the support area. The inertial force values of the sample were obtained by measuring the acceleration values at different points along the beam. However, under the existing laboratory conditions, it was not possible to measure the acceleration values at different points along the beam. Therefore, when calculating the inertia force of the test sample, the continuous beam theory [44] was assumed. Therefore, the inertia force values were calculated for an idealized shape. In the continuous beam theory, the inertia force of the test sample is considered to be the maximum inertia force at the midpoint of the beam where the impact is applied, while it is assumed that the values at the support points are zero and behave linearly [45]. As a result, the inertia force was obtained by multiplying the acceleration value at the midpoint of the beam by the unit length weight of the test sample and the gravitational acceleration value. Equation (3) is obtained when the balance equation is written in accordance with the D’Alembert rule in the beam element under impact.
0 L m ¯ ü x , t d x + R s t + R c t I t
where I(t) is the impact force, m ¯ is the unit length weight of the beam, ü(x, t) is the acceleration of the beam, Rs(t) is the moving (roller) support reaction, Rc(t) is the pin support reaction, and L is the length of the beam [14,46]. Impact force was obtained by summing the inertia force and support reaction value of the test sample.
The values for the support reactions of eight beam elements are shown in Figure 11.
As per the experiment, the reaction force values obtained from the load cells in pin and roller supports increased as the drop height increased. Therefore, the biggest support reaction was obtained in S#8EXP, and the smallest support reaction was seen in S#1EXP along the weak axis of the steel beam. The inertia force value was obtained from the accelerometer placed in the middle of the test sample. Therefore, when the hammer drop height increased on the test sample, the acceleration value increased, increasing the inertia force in the element. Therefore, the highest and lowest inertia forces were observed in S#8EXP and S#1EXP, respectively. Maximum impact, inertia, and total reaction force values were obtained as a result of the experiments and are given in Table 5. According to the D’Alembert dynamic equation principle, the sum of the beam inertia force and support reactions constitutes the impact force. The greatest impact force was generated in S#8EXP (388.18 kN), and the lowest impact force was generated in S#1EXP (71.80 kN).

4.1.4. Impact Load Factors for Static Analysis

As mentioned in the previous sections, impact loading is an important kind of load that must be taken into consideration during the design phase of the structure. However, the challenge is the lack of availability of several non-destructive methods for the calculation of the dynamic impact loading experimentally, and the experimental study is difficult because of the data collection, data filtration, conversion, etc. It is generally assumed that every kinetic energy of the moving object is changed with an efficiency of η to the strain energy in the object [47]. In the case of a weight dropping vertically from a height h, the vertical impact factor η is calculated as in Equation (4). In this study, the impact loads along the weak axis of rectangular hollow steel beams were calculated with the energy assumption in addition to the experimental and numerical studies. Later, the mathematical impact forces were compared to the experimentally and numerically obtained impact forces.
n = 1 + 1 + 2 h δ s t
In Equation (4), η is the impact load factor, δ s t is the maximum deflection of the member due to a static force (W) applied at the impact point in the impact direction on the simply supported beam [48]. As mentioned, the experimental specimens were all simply supported beams, and therefore, they were calculated as Equation (5). The equivalent dynamic loads of the midpoint of the beam were calculated with Equation (6).
δ s t = ( m g ) L 3 48 E I
In Equation (5), m is the mass of the weight, L is the total length of the beam, E is the elastic modulus, and I is the moment of inertia of the cross-section about the weak axis.
P m a x = n   × m g
Table 6 presents the impact factor and support reaction values obtained from Equation (4). Impact factor values change depending on the hammer drop height and static displacement value. There was no relationship between the static deflection obtained from Equation (5) and the beam displacement value that was obtained experimentally. Static displacement values have been calculated only for calculating the impact factor values. The impact factor values used in the transition from static loading to dynamic loading were used in Equation (6) to find Pmax.
The percentage difference between the Pmax values (sum of support reactions) obtained mathematically from the equation and the support reactions obtained experimentally varied between 30% (highest) and 6% (lowest). As the height of the hammer dropped on the simple beam used in the study increased, the impact factor value increased as well. In addition, it was observed that the difference between the support reactions calculated experimentally and mathematically increased as the impact factor value increased. Particularly, the differences were reductions in Series A tests where there were no or minimal plastic deformations. It is thought that the greater difference is due to the fact that the element is in the elastic region at such energy levels. Residual stress and imperfection are more important in determining the behavior of an element in the elastic region compared to the plastic region. The differences between the support reactions calculated experimentally and mathematically from series B test samples having high plastic deformations varied between 20% and 30%.

4.2. Numerical Results and Discussion

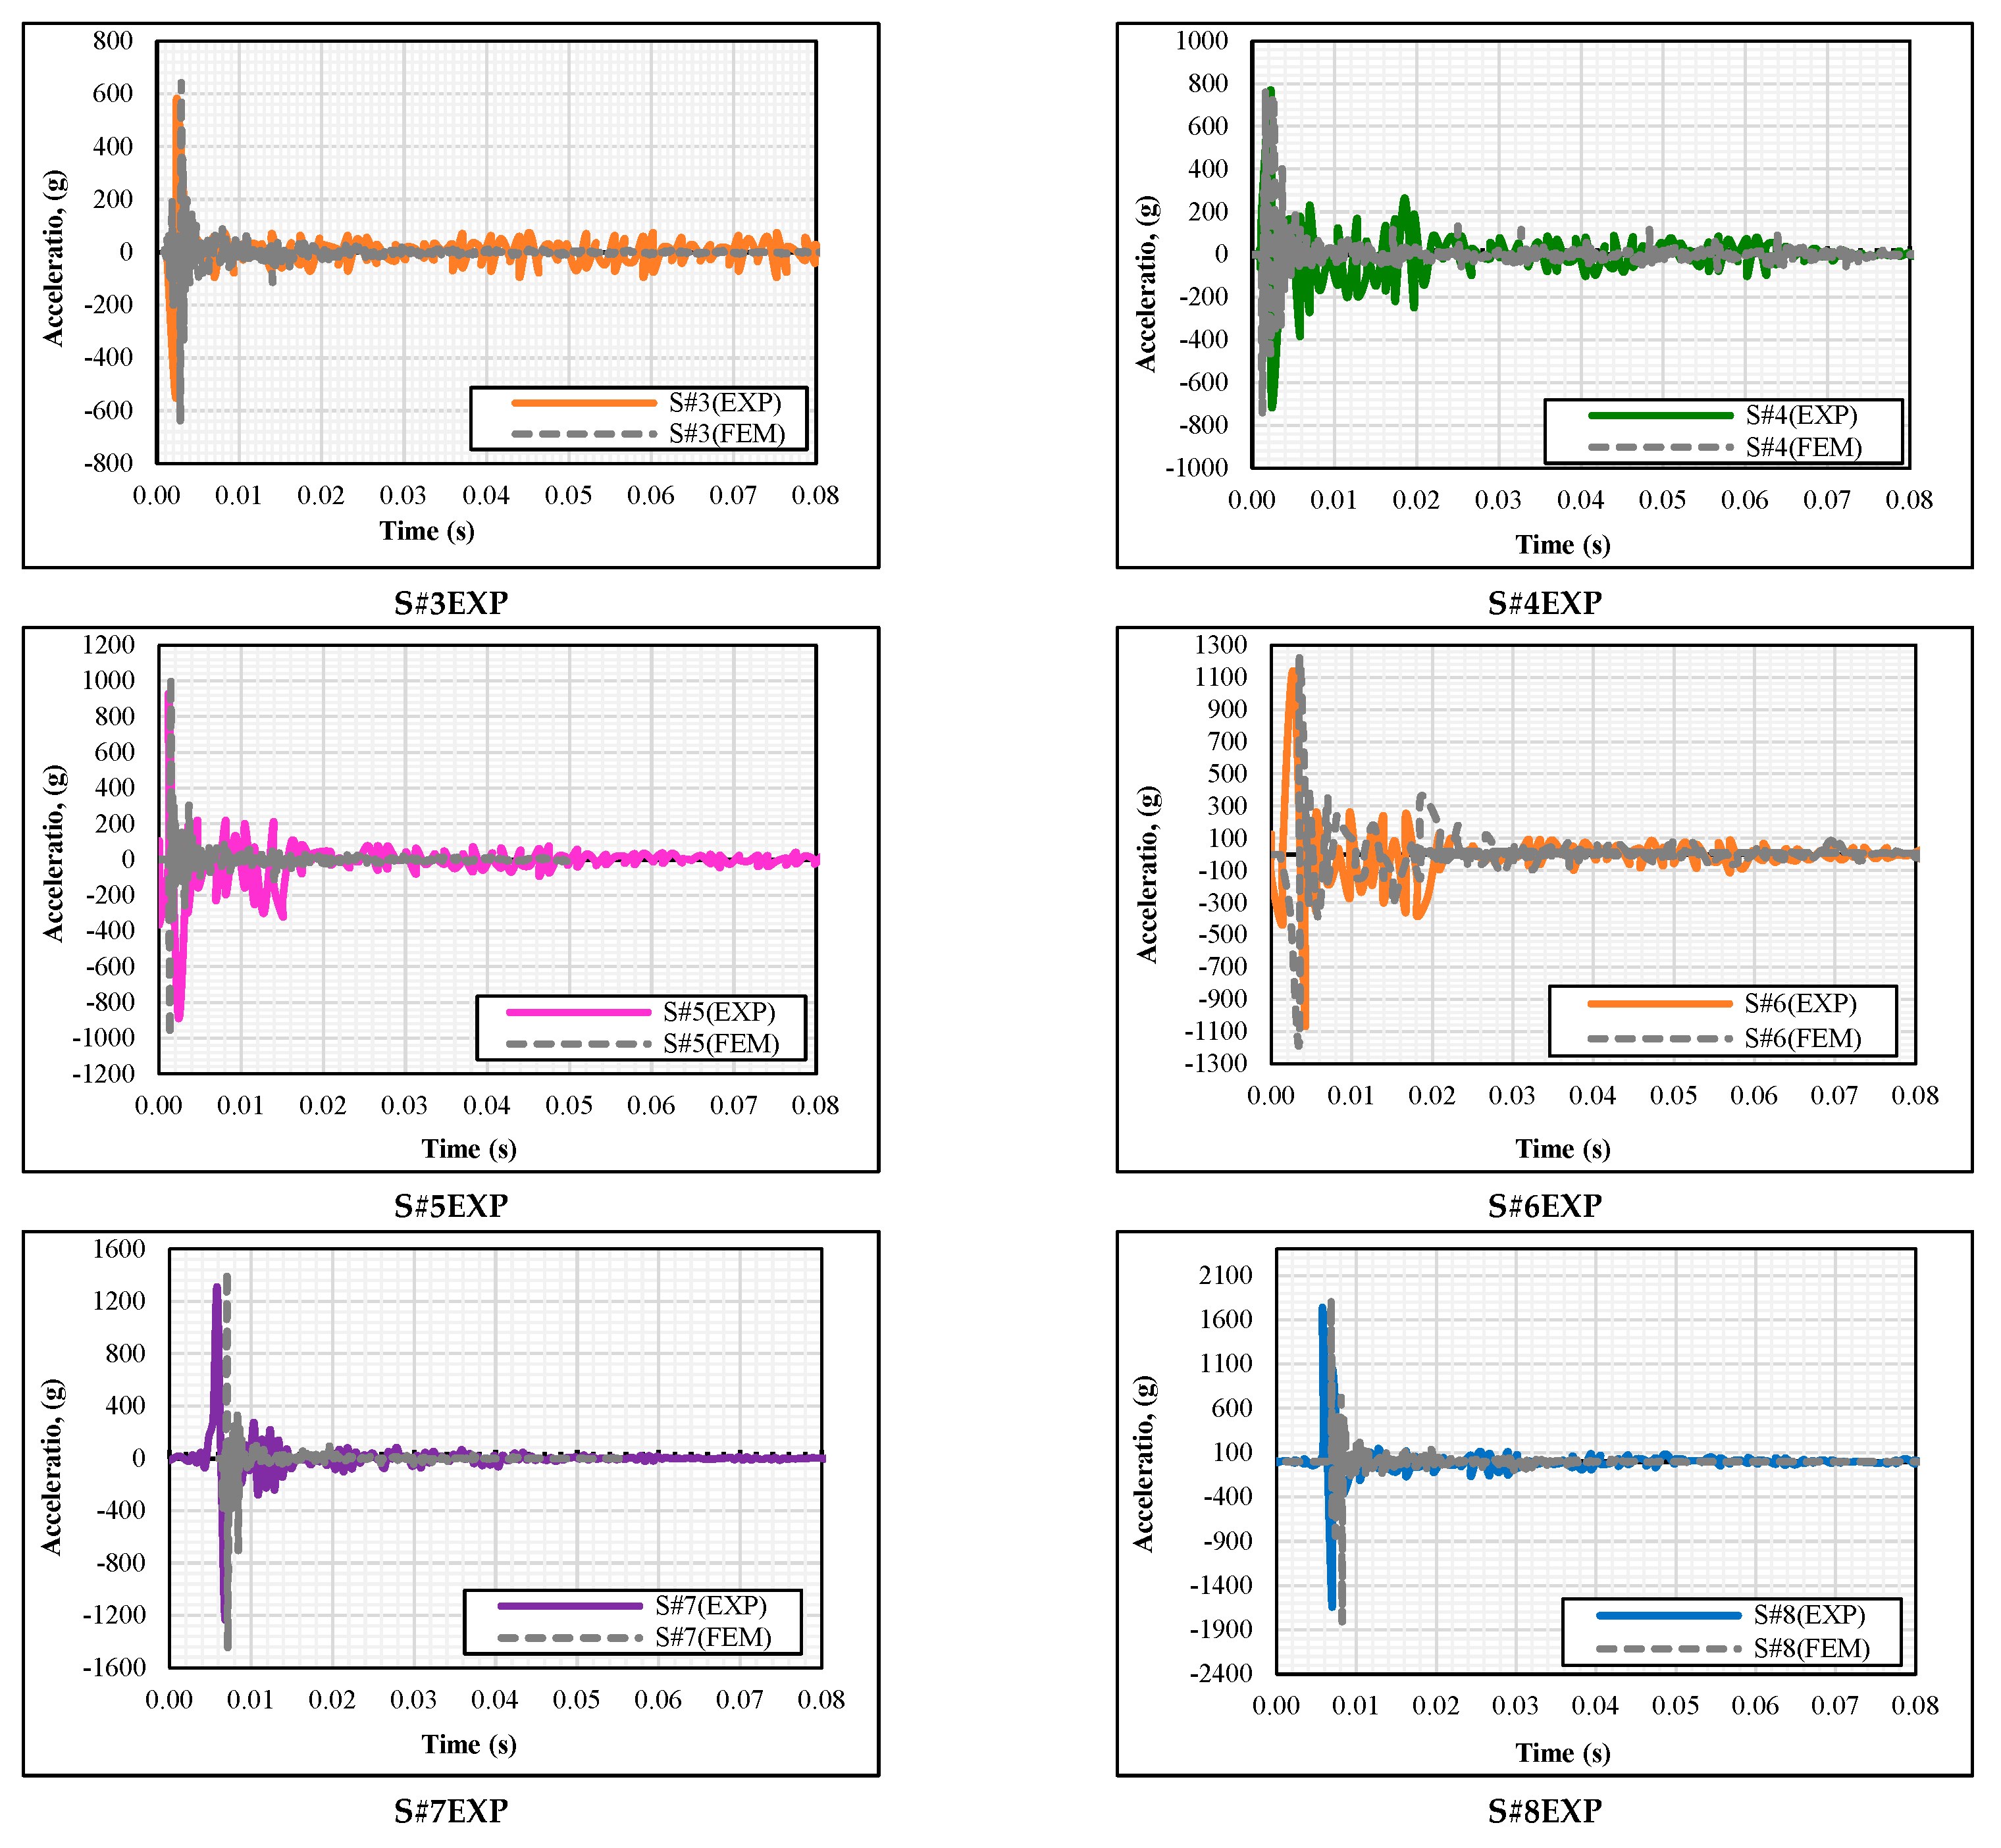
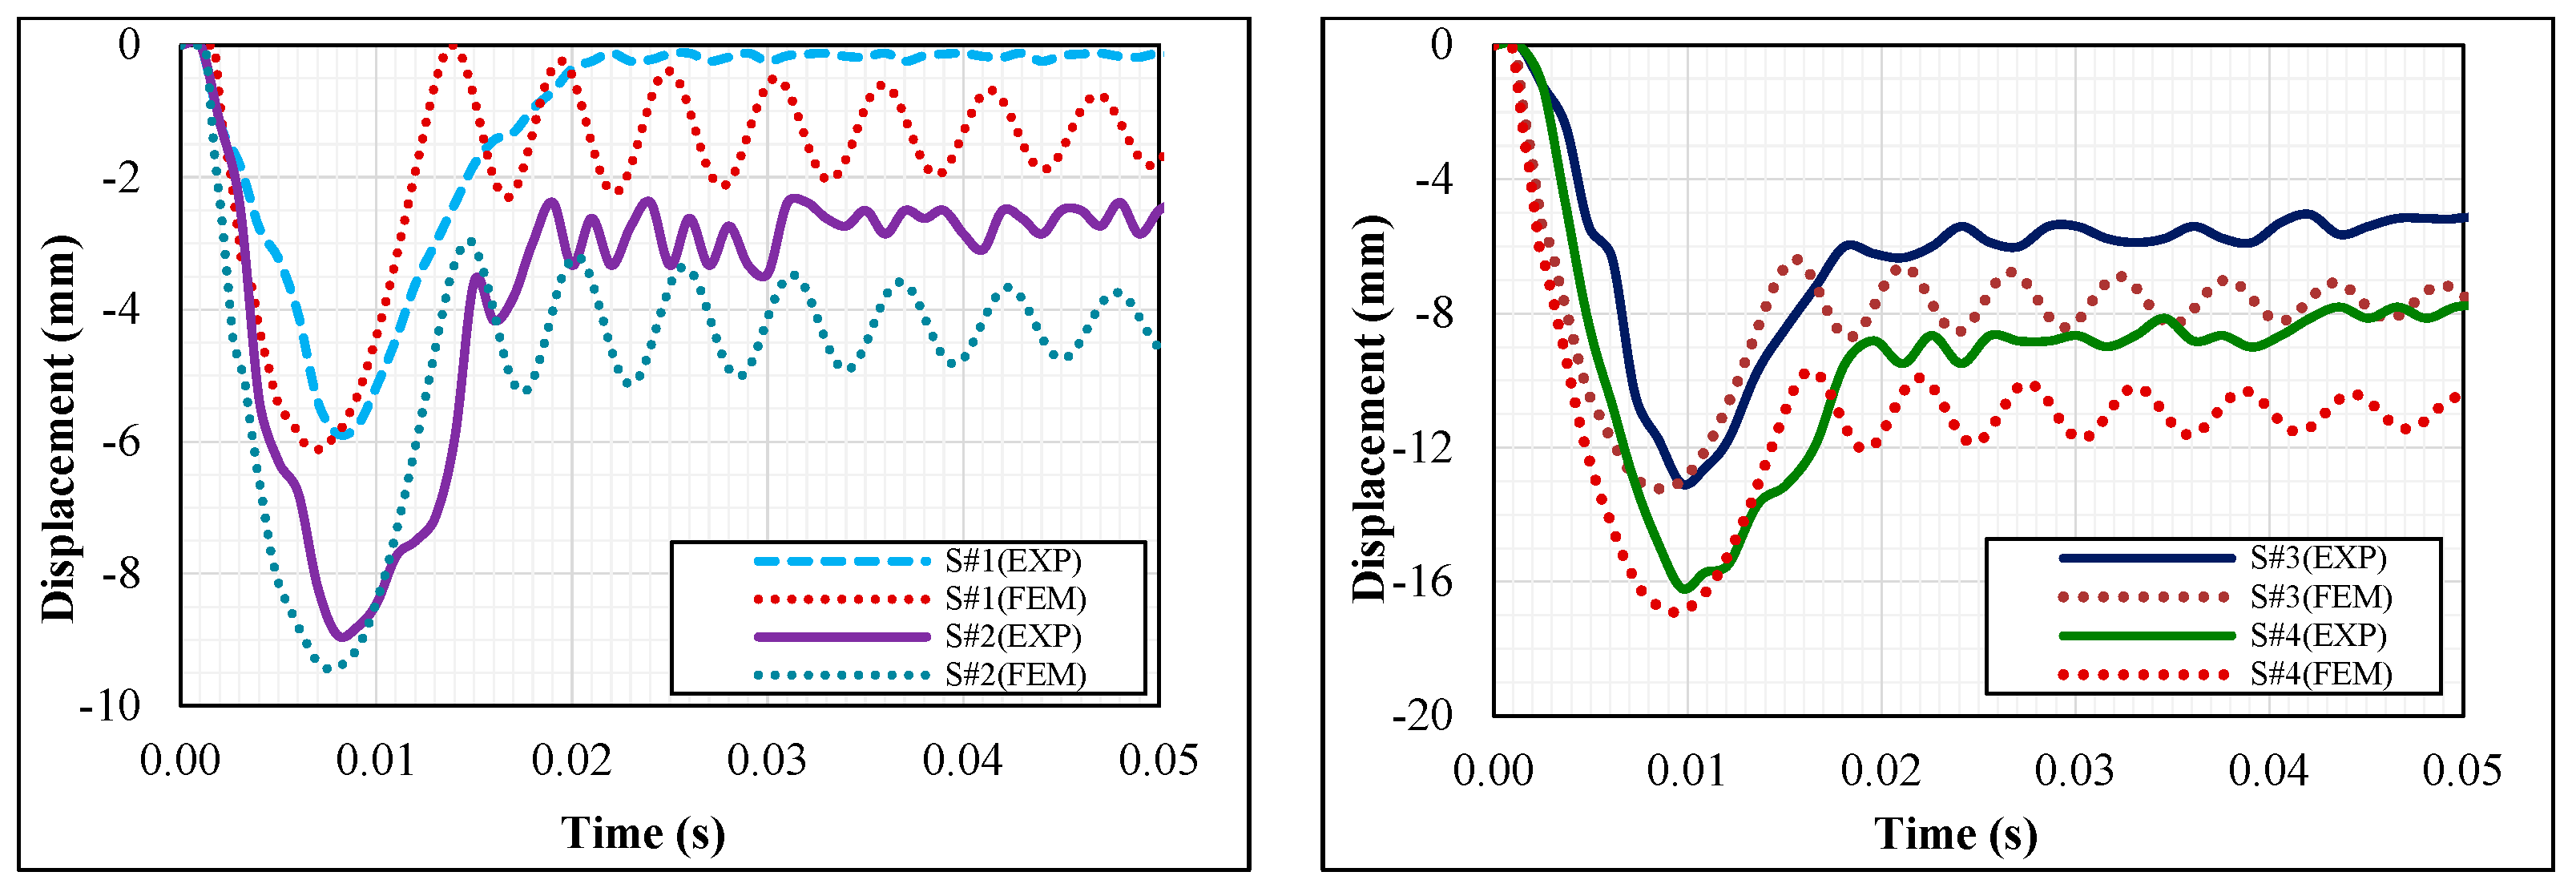
In our study, there was a good fit between the experimental results and finite element models (FEM). Figure 12 illustrates comparative acceleration data of both experimental and FEM results. The values obtained from the experiments and FEM have increased as the hammer drop height and amount of energy were increased. Since the impact force is a spontaneous loading, the maximum value was obtained at a single point in the acceleration-time curves, and the acceleration values gradually decreased due to damping formed in the element and were completely damped out after 0.08 s. This behavior was not only observed experimentally but also in the finite element models. As shown in Figure 12, the maximum acceleration value under the midpoint of the beam was 290 g in S#2EXP and 301 g in S#2FEM. The difference between the finite element model and the experimental result was only 3.7%. However, S#3EXP achieved an acceleration value of 570 g, and S#3FEM achieved 640 g, having the largest difference (12.28%) between the finite element model and the experiment.
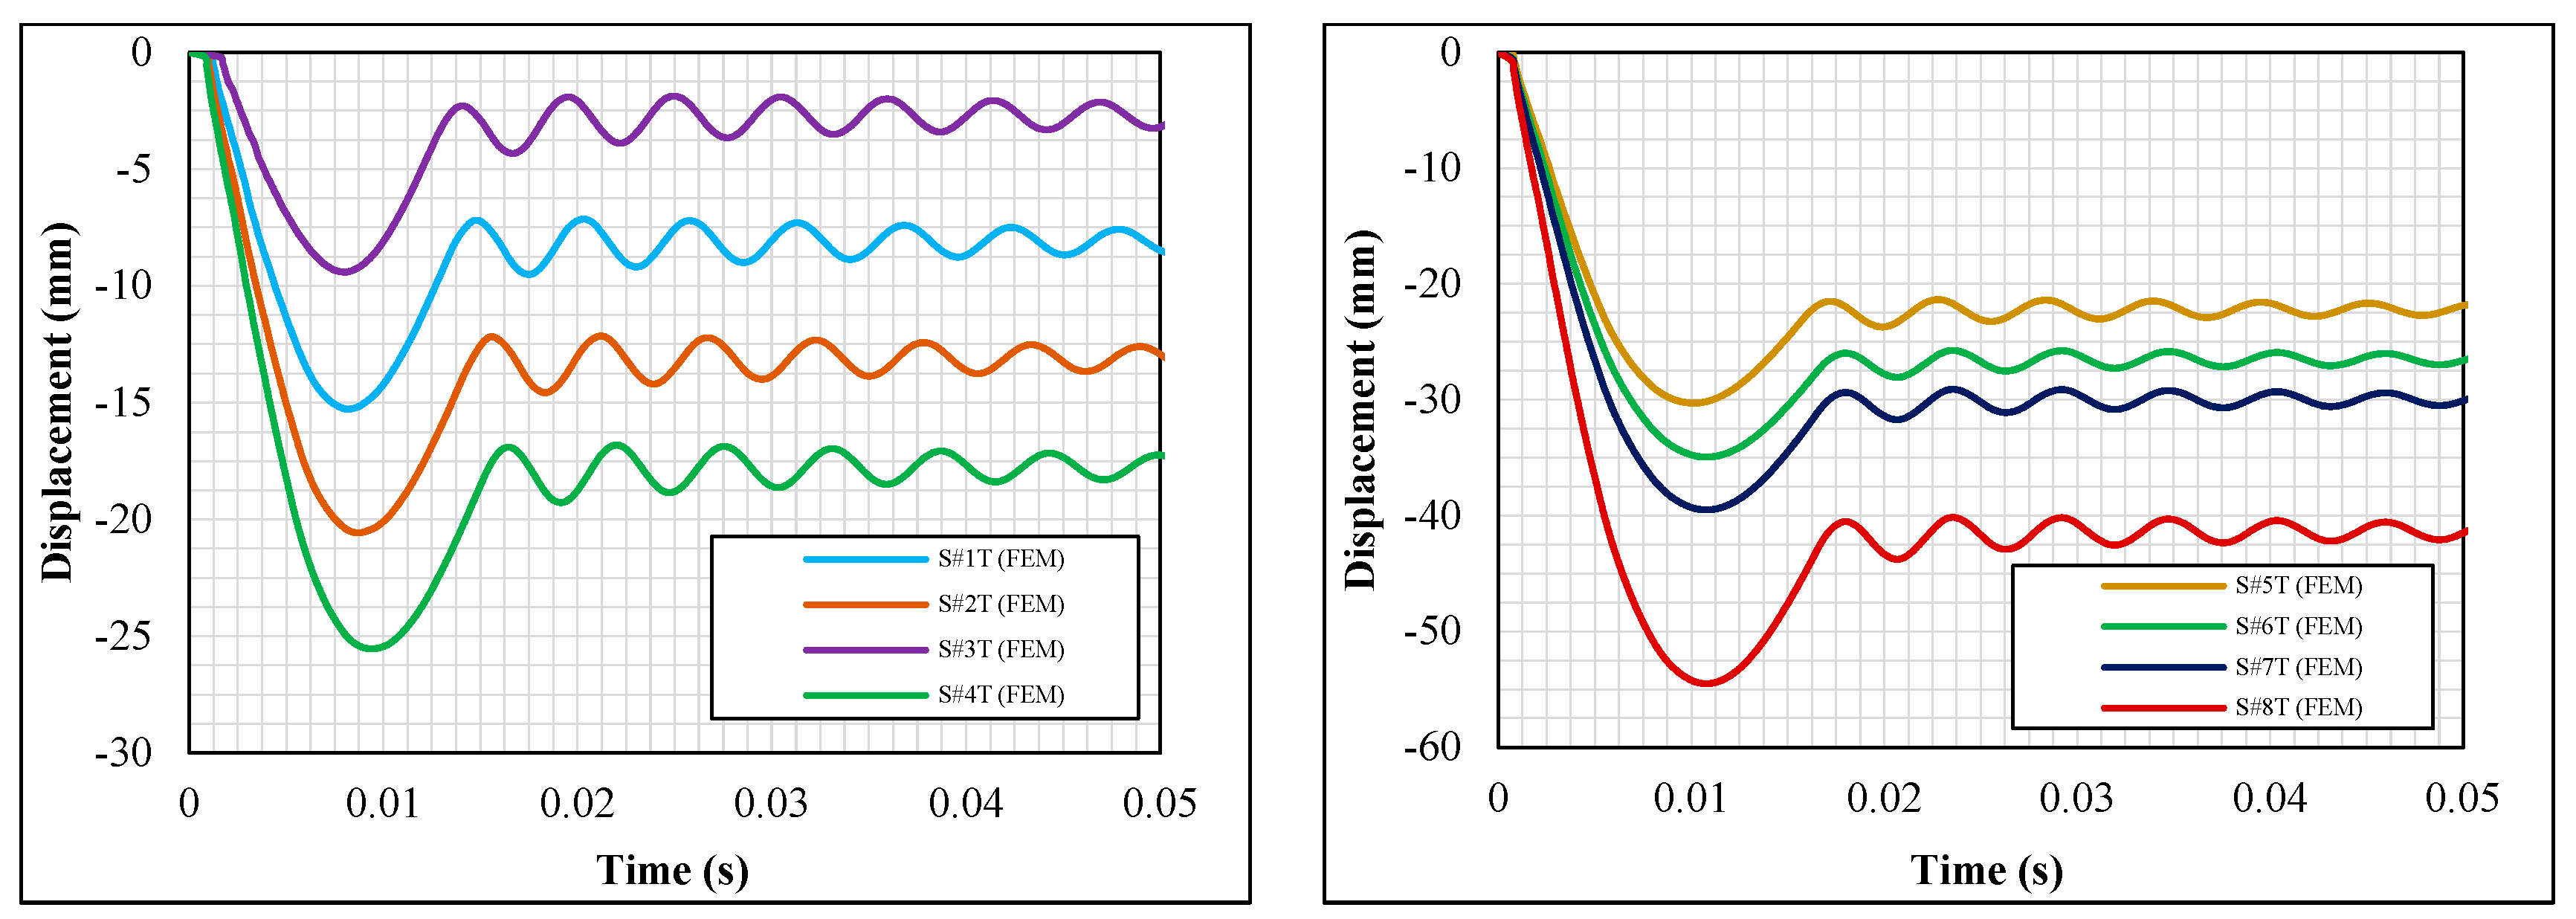
The displacement values on the bottom and top of the beam are given in Figure 13 and Figure 14. Additionally, Table 7 presents the detailed values of the displacement for both experiment samples and FE models. As shown in Figure 13, the maximum deflection value under the midpoint of the beam was recorded in S#3EXP (13.08 mm), while S#3FEM recorded 13.23 mm. The difference between the finite element and the experimental results was minimal (1.11%). However, the displacement values in S#2EXP and S#2FEM were 8.93 mm and 9.43 mm, respectively. The difference between these two values was 5.59%, which was the largest error in all the obtained values. This difference is remarkably small in the case of impact loading, and it means that the finite elements models are verified quite well. These values were determined according to the maximum displacement values obtained from the experimental study and finite element models on the bottom face of the beam at the midpoint. When the residual displacement values of the experimental models were compared with the finite element models, it was observed that displacements in the finite element models were bigger than in experimental test samples.
Although denting on the top face of the beam at the midpoint was not measured experimentally, the deformation values on the top face of the beam obtained from the finite element analysis are shown in Figure 14, and the values are presented in Table 7. The displacement on the bottom face of S#1FEM was 6.12 mm, while the displacement on the top face of S#1TFEM was 9.40 mm, with a difference of 3.28 mm between them. Although the data taken from the bottom of the beam of S#1FEM samples were in the elastic region, the deformations on the top face were plastic. Moreover, the displacements on the top and bottom face of S#8FEM were 34.4 mm and 54.50 mm, with a difference of 20.05 mm. The denting distance obtained from the finite element analysis increased as the hammer drop height and amount of energy increased. It was observed that the dynamic loads (in this case, impact force) caused more plastic deformation on the surface where it touched the test specimen. If the denting distance formed as a result of finite element analysis in each test element is proportional to the un-deformed shape of the element, it was determined that the lowest denting rate was S#1 (FEM) with 3.28%, and the large denting was determined as 25.06% in the test element S#8 (FEM). The plastic deformation on the top of sample S#1EXP had a very small value (3.28 mm) at the first impact; however, the deformation that would occur on the beam element if the loads were exerted repeatedly might result differently. Thus, it is recommended to examine such a situation for a better understanding of the beam behaviors. Especially, the elements subjected to repetitive impact loading along the weak axis can switch the mechanism state more easily due to having a low moment of inertia.
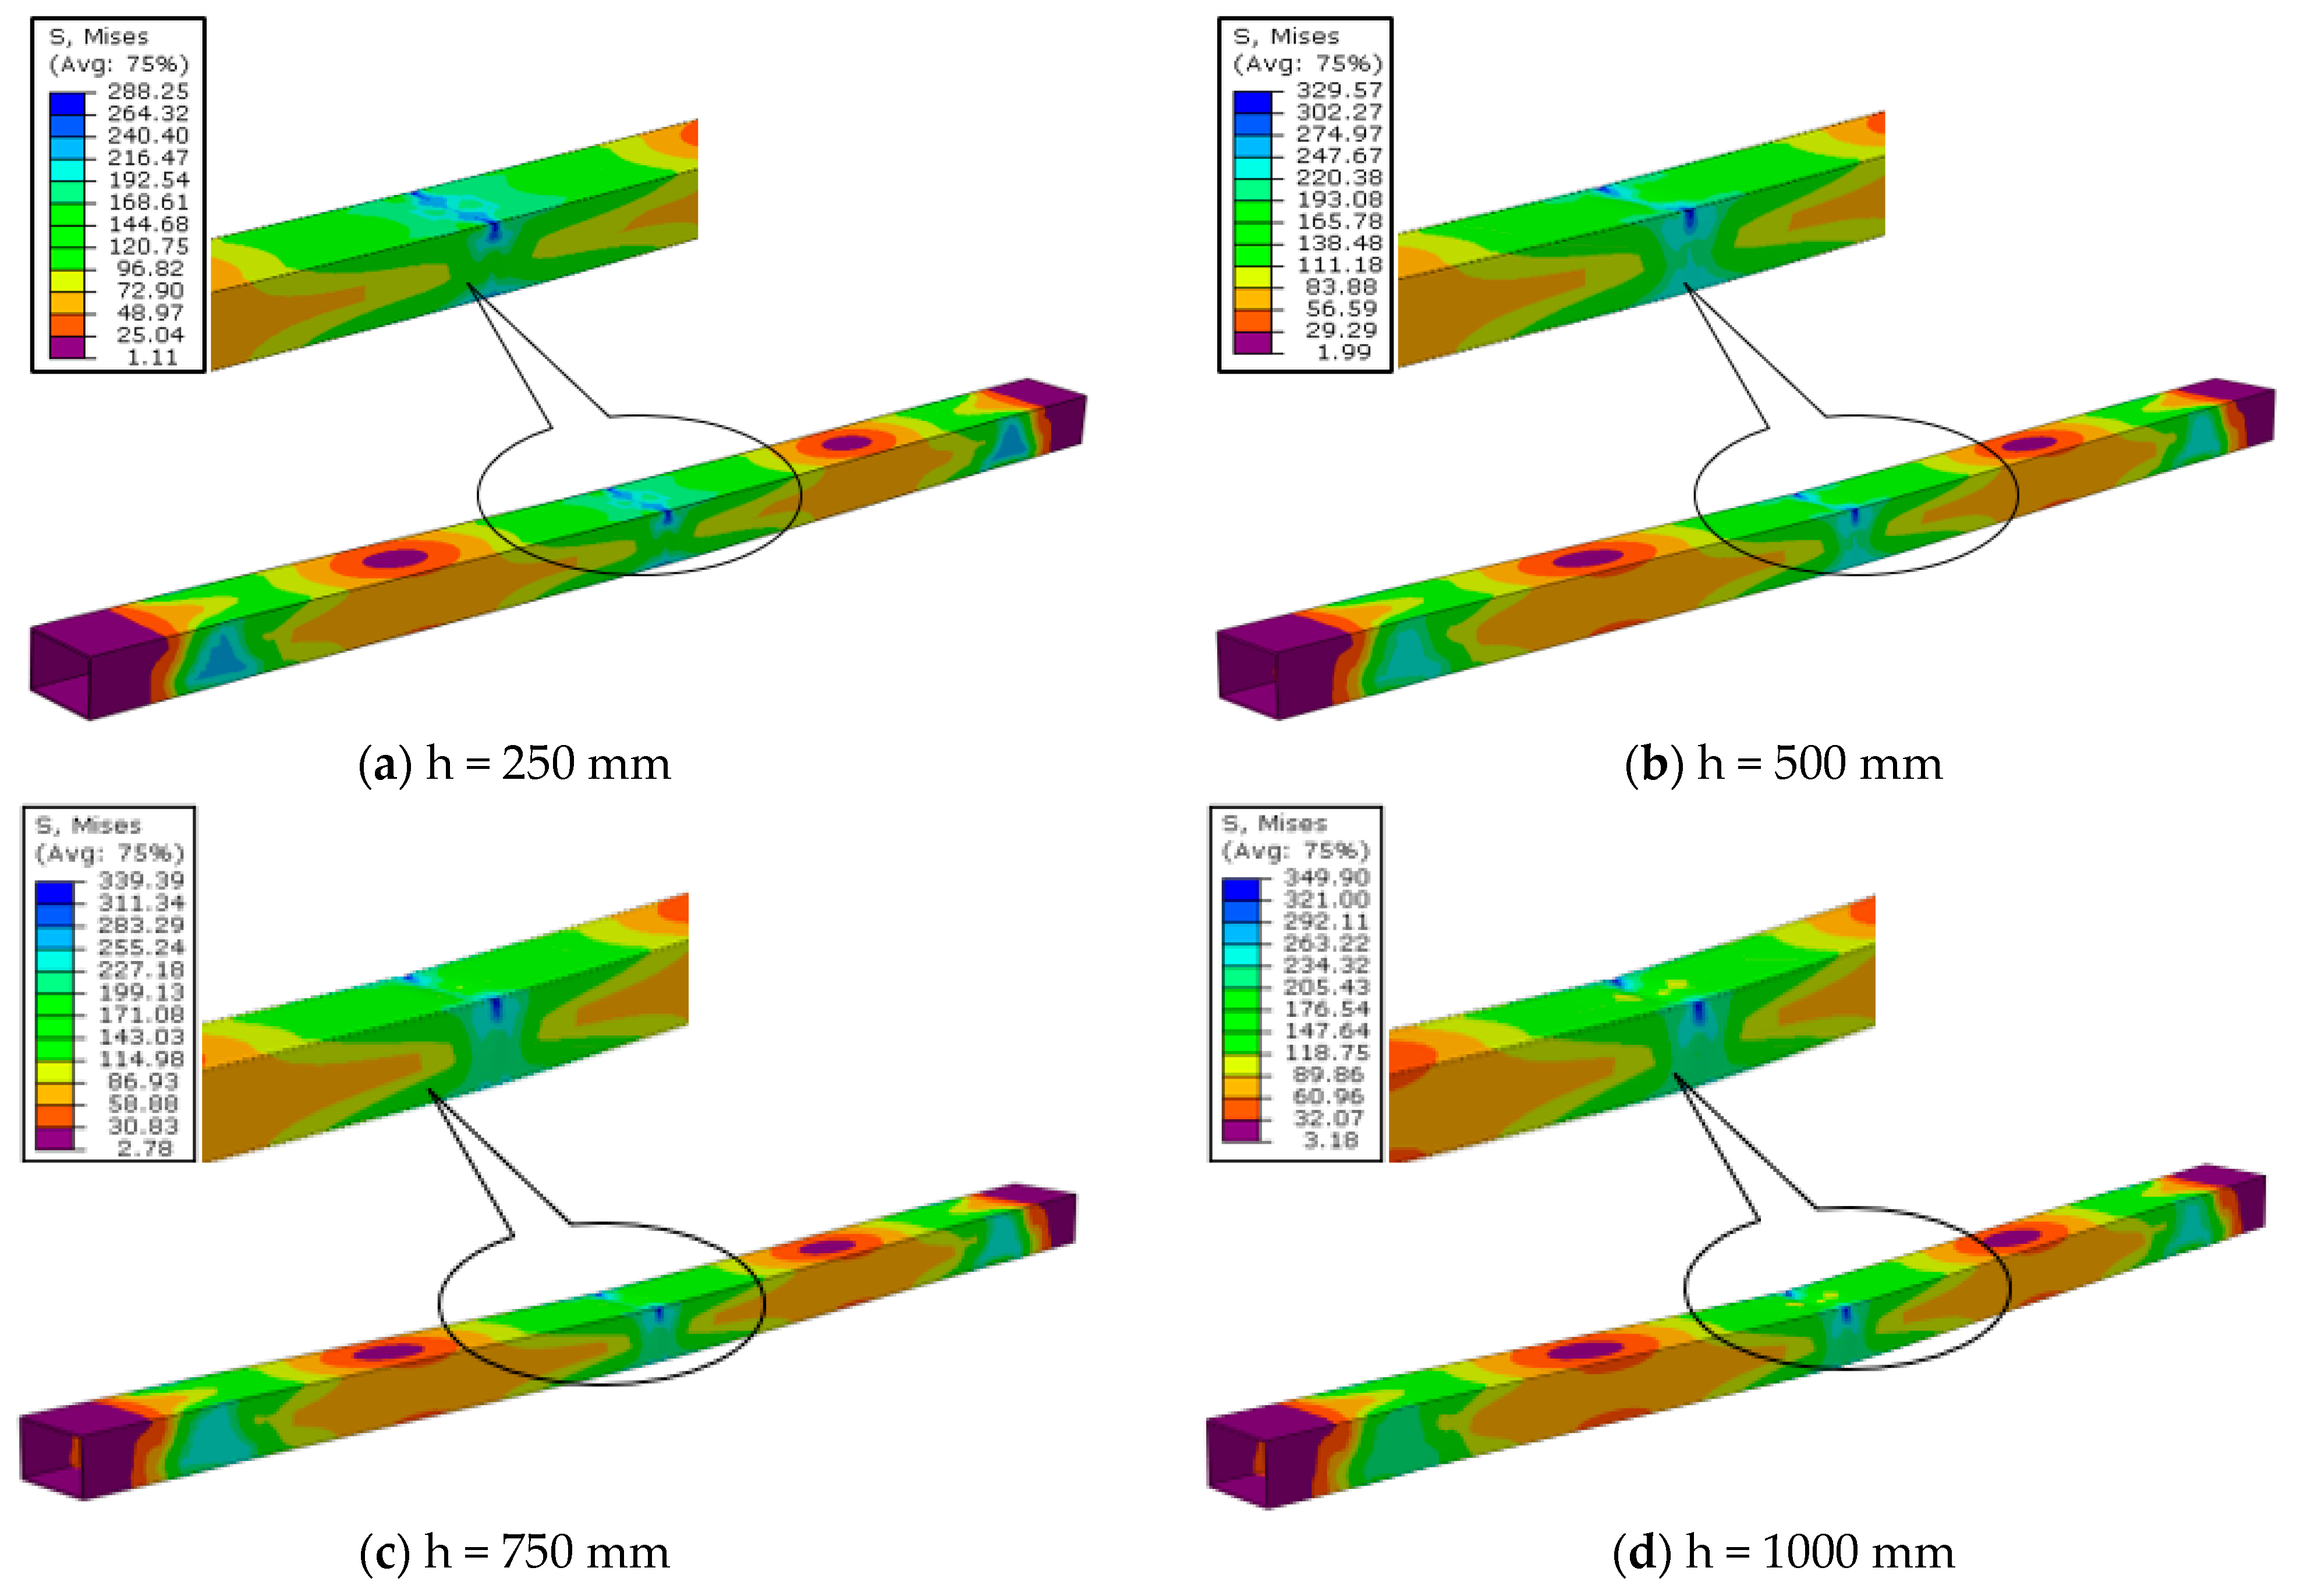
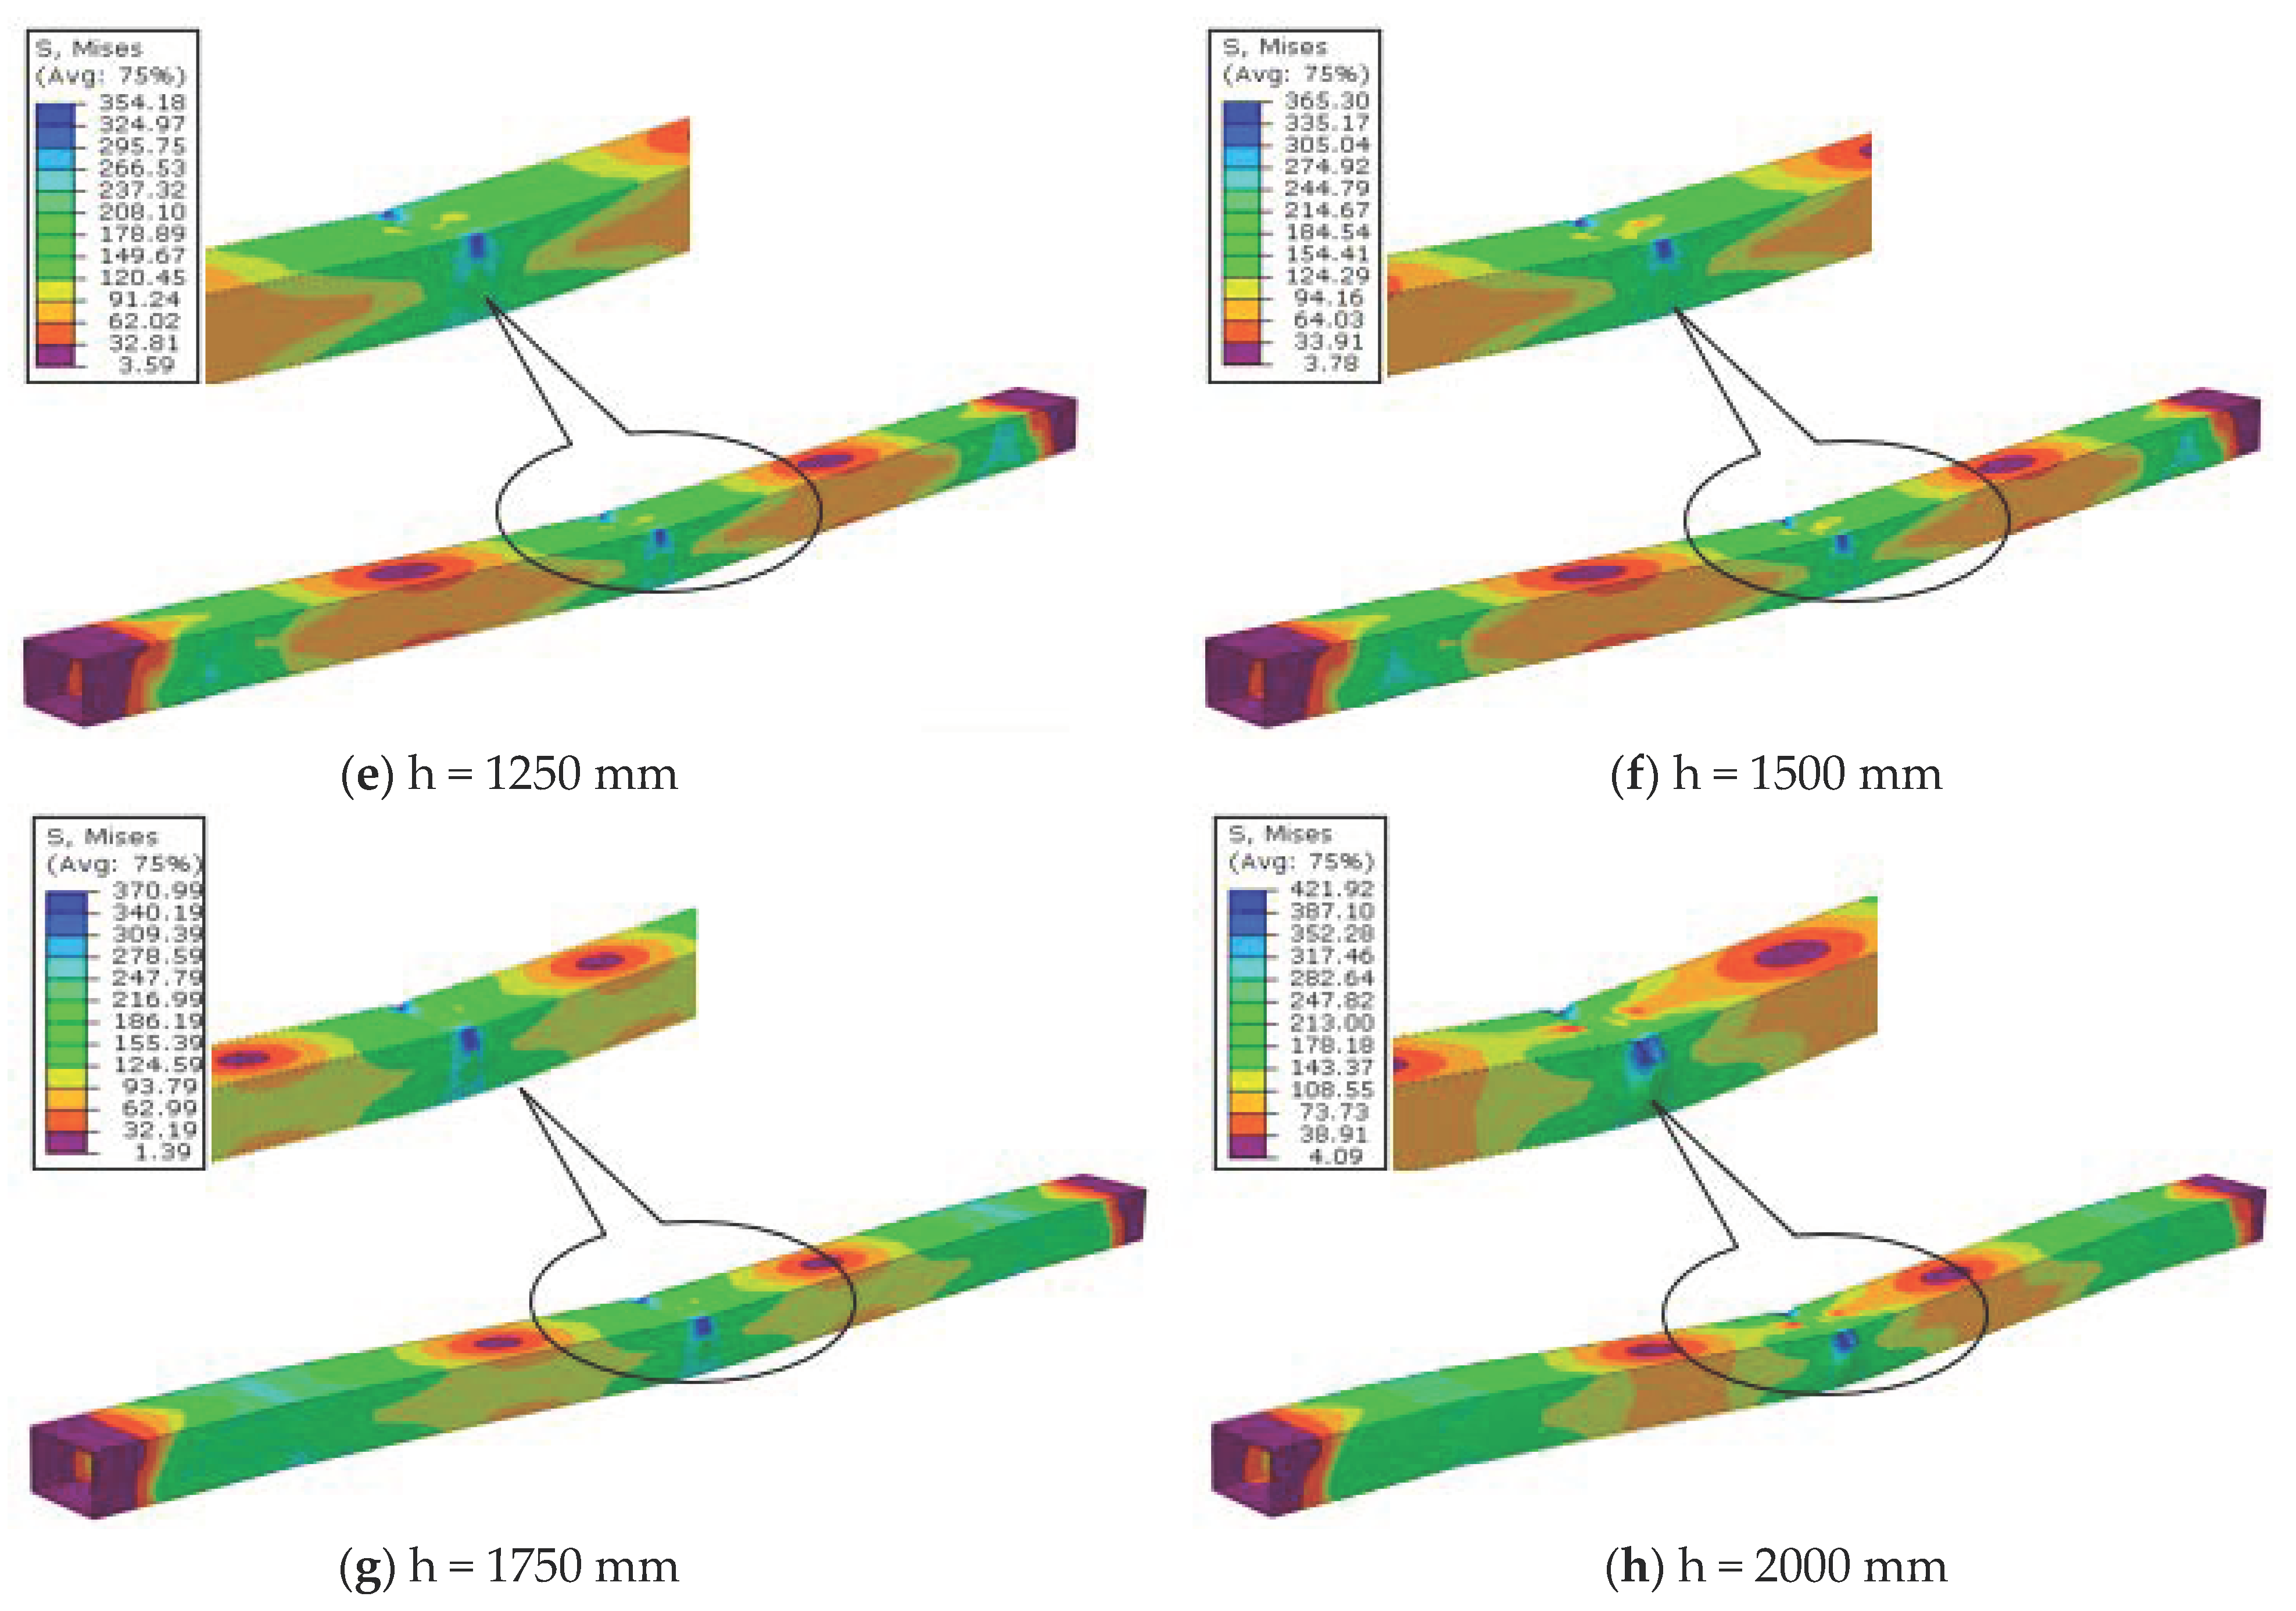
The von Misses stress distributions against time are given in Figure 15. The stress values obtained from the finite element analysis were taken from the same point in eight samples, and the lowest stress was calculated as 288 MPa in S#1FEM, while the highest stress was 421 MPa which was recorded in S#8FEM sample. As the hammer drop height and amount of energy were increased by 8 times, the stress value increased by 46.2%. In addition, stress value, amount of energy, and plastic deformation in the element increased equivalently.
As the deformation distributions in the finite element models were examined, they were exactly compatible with the deformations obtained in the experimental study. Since the impact test is spontaneous loading, some element behaviors that were not noticed during the experiment could be seen more clearly in finite element modeling. In addition, as the amount of energy increased in the finite element models, the heat map color changed in the stress distributions, and the stress moved toward the bottom parts of the beams, as shown in Figure 15.
The same deformation patterns were also observed in the experimental test samples as well. Due to the fact that the load was applied to a single point, the deformation was distributed symmetrically, as seen in Figure 15. The same stress distribution behaviors were observed in all eight samples. The stress value reached the lowest value in the sample in the vicinity of the pin and roller supports. Finally, all experimental and finite element model results of the eight elements are comparatively given in Table 8.
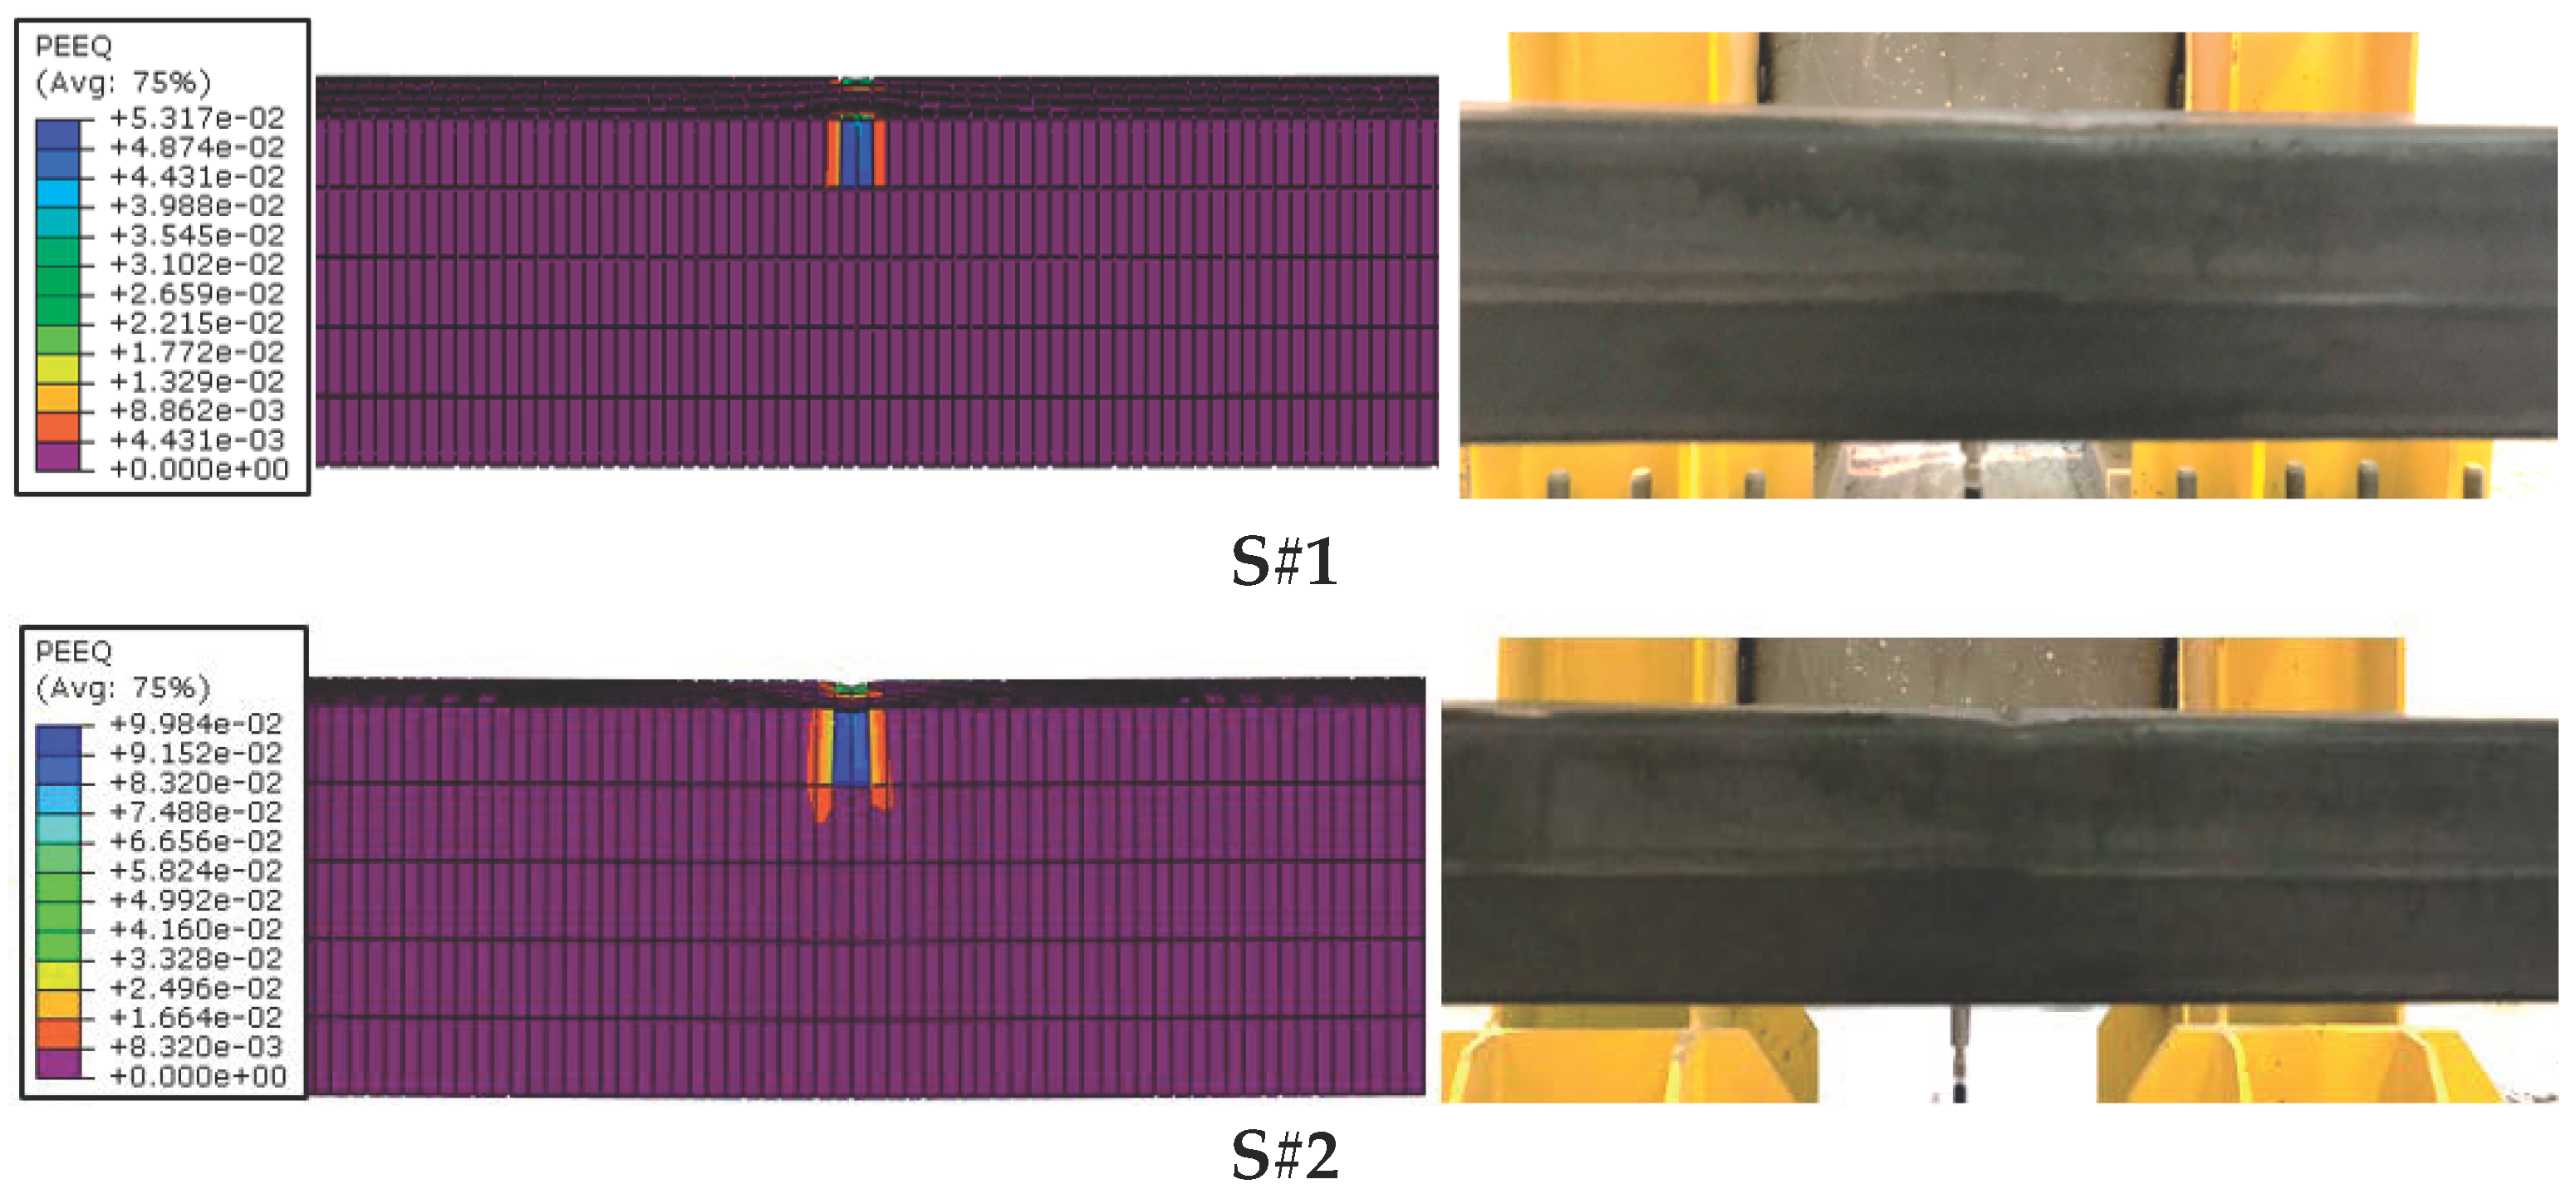
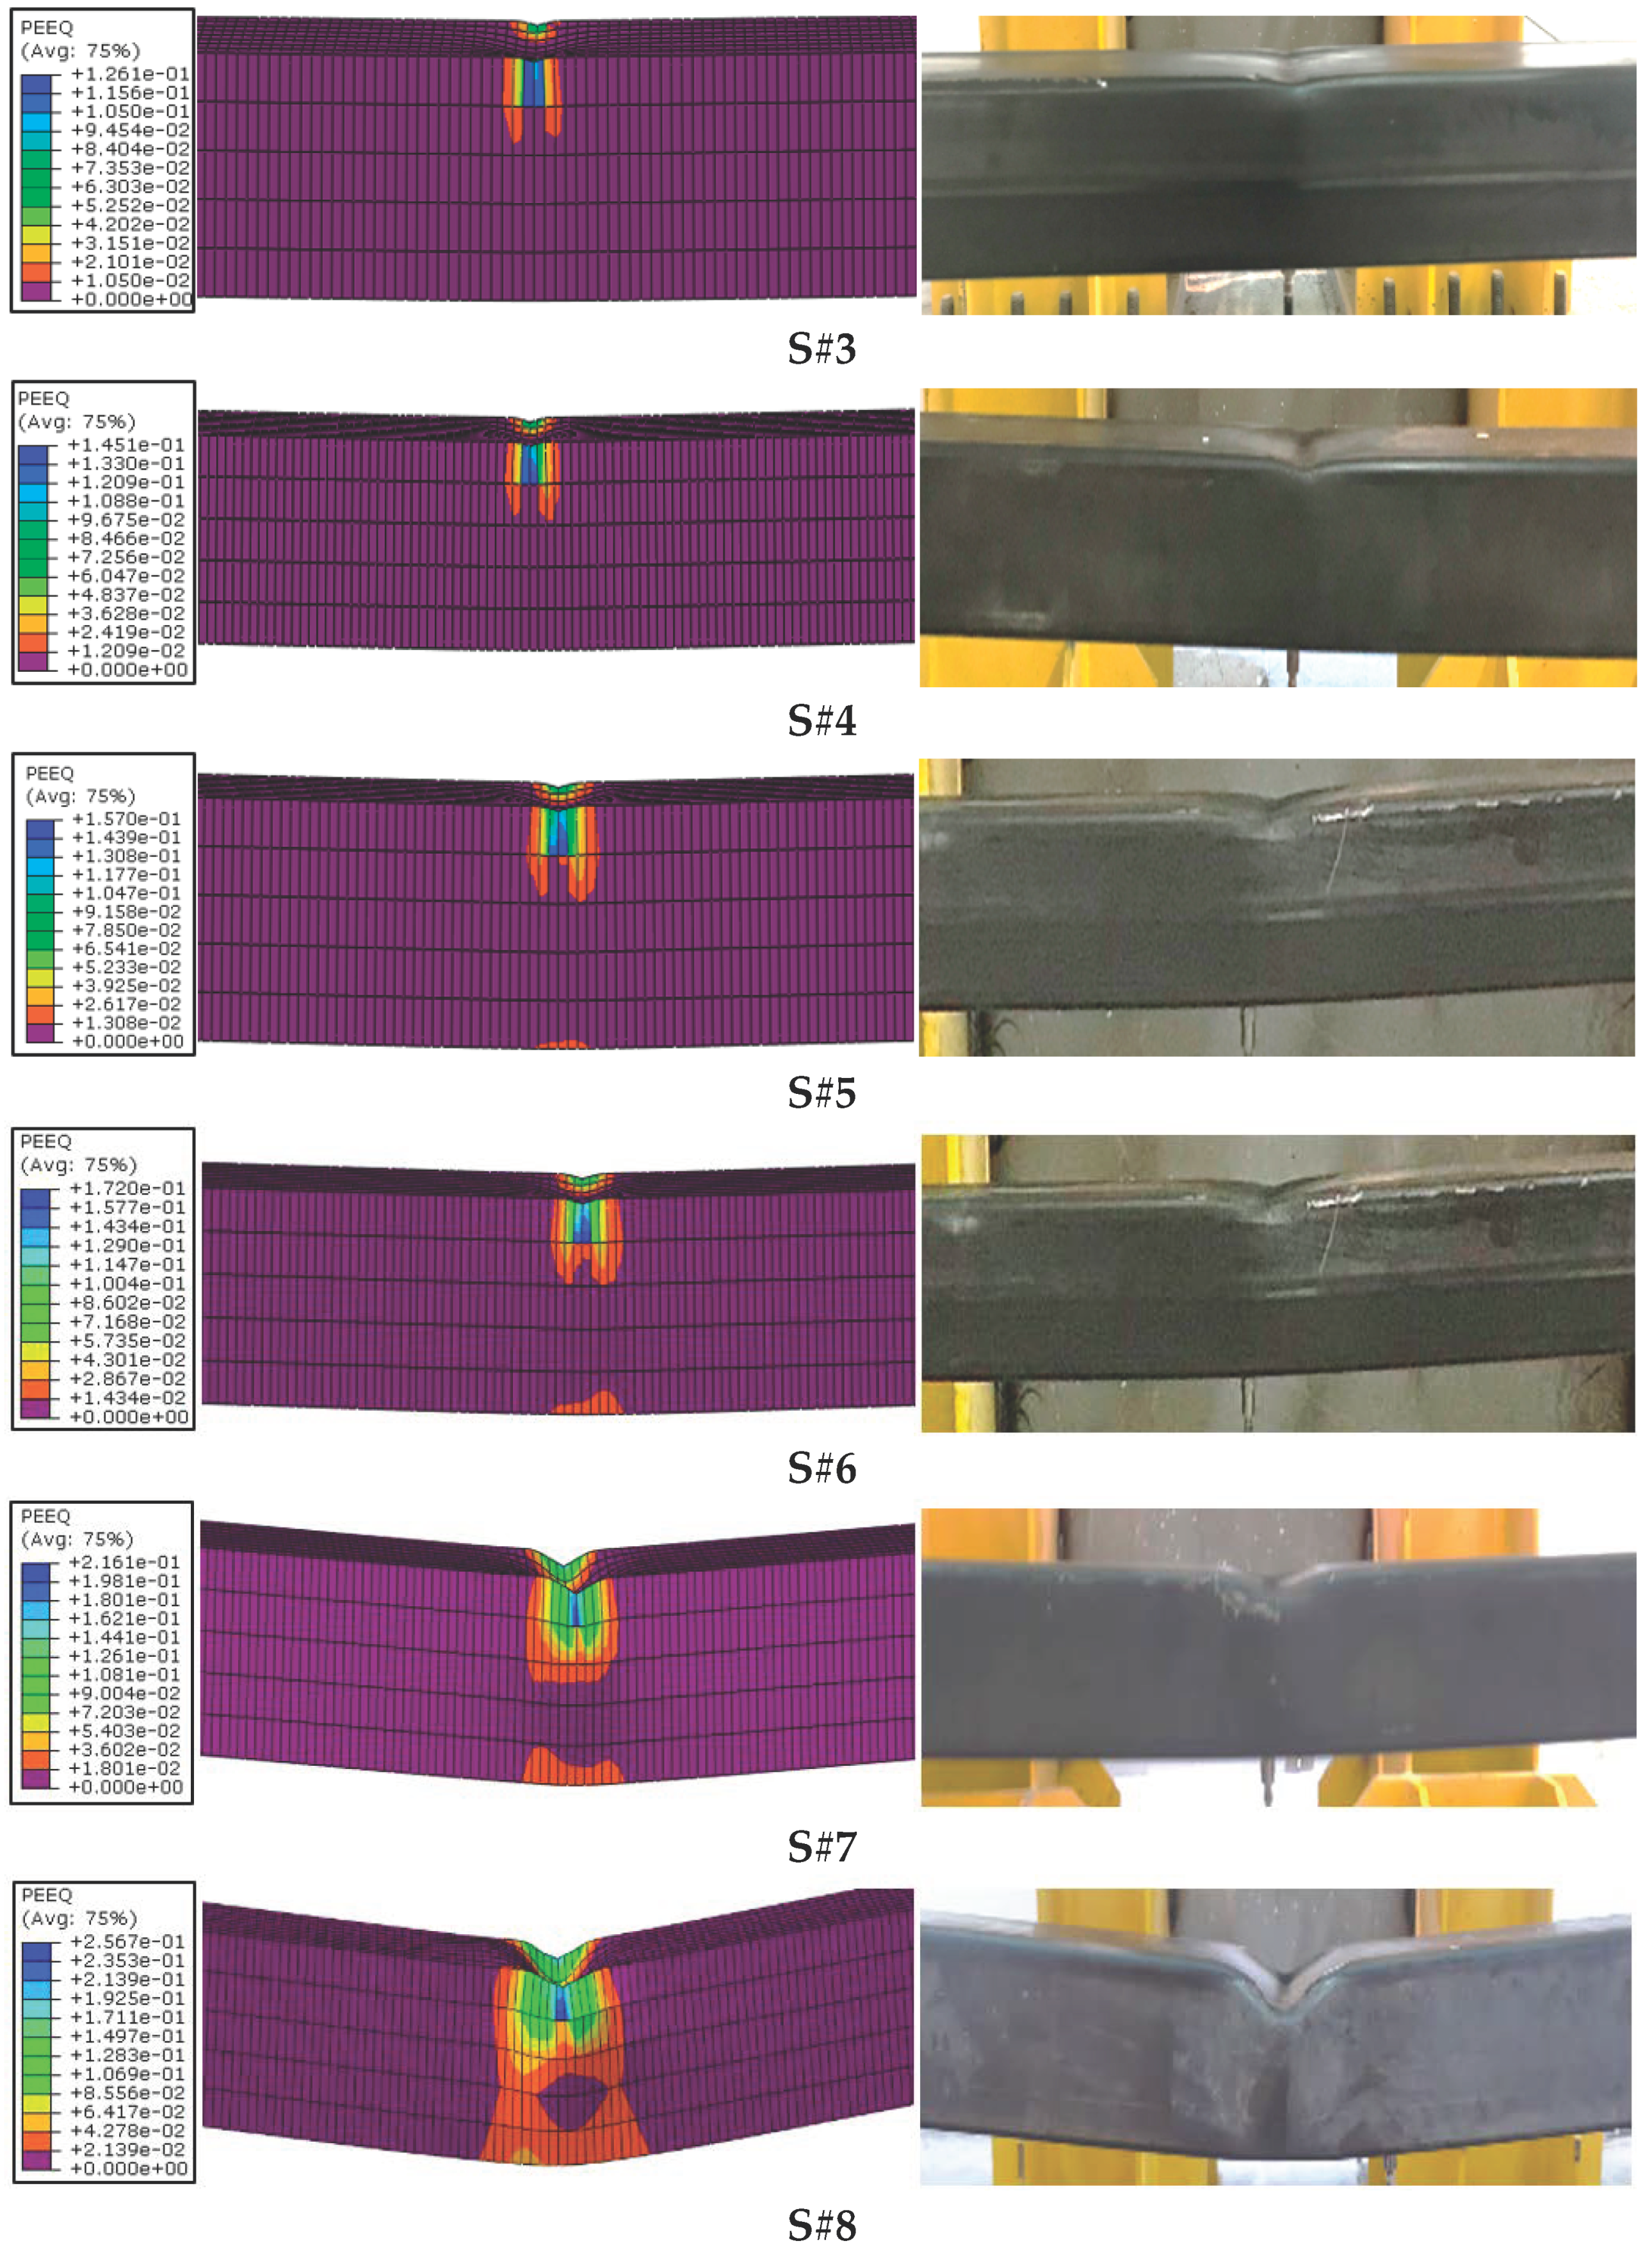
Finite element equivalent plastic strain (PEEQ) and experimental damages are given and compared with the strain values in Figure 16. As can be seen, the predicted and observed findings are similar, where an increase in drop height and amount of energy caused larger stresses in the elements and, consequently, larger displacements. Among all the samples, the highest energy and displacement occurred in the S#8 test element, and this produced the highest stress value in the finite element analysis. The lowest energy and displacement value occurred in the S#1 test element, which produced the lowest stress in the finite element analysis. The strain obtained from the finite element analysis was measured at the same point in all samples, and the lowest strain was calculated as 5.31 × 10⁻² in S#1FEM, while the highest strain was calculated as 2.56 × 10⁻¹ in S#8FEM. As a result of increasing the hammer drop height and amount of energy by 8 times, the strain increased by 482%.

5. Conclusions

This study closely looked into the effects of impact loading, especially low-velocity impacts along the weak axes of rectangular hollow steel beams. To do so, eight simply supported beam samples, namely S#1EXP, S#2EXP, S#3EXP, S#4EXP, S#5EXP, S#6EXP, S#7EXP, and S#8EXP, were constructed and were divided into test series A and test series B based on the impact drop height. A circular head hammer was dropped as a free fall on these eight samples. Each fall had a different drop height (ranging from 250 mm to 2000 mm) and increased amount of energy in order to compare the damages caused by the impacts with different drop heights and energy levels. In the second part of the study, beam performances were investigated numerically, and the stress distributions and plastic equivalent strains were evaluated. Initially, a mesh convergence study was performed on 6 FE models to validate the boundary conditions and material properties of the models and to determine the optimum mesh size. Later on, 8 FE models were developed to investigate the performances of the rectangular hollow steel section under impact loading along their weak axis. Lastly, the impact and reaction forces that were calculated experimentally and mathematically were compared in order to evaluate the impact load factor for static analysis. The following conclusions can be drawn from this study:
  • In mesh convergence studies under impact loading on a rectangular hollow section (RHS) beam along its weak axis, the differences between the experimental and numerical results were calculated in the midpoint displacement as 35.02% for M40, 27.04% for M30, 16.43% for M20, 7.29% for M10, 3.52% for M5 and 1.12% for M5-15, respectively. It means that the optimum mesh size could not be the smallest one and directly affected the midspan displacement and out-of-plane plastic denting of the RHS steel beam along its weak axis.
  • Test series A samples, which had 183.94–735.75 J energy, experienced a 16.19 mm residual deformation and were within the elastic deformation region, while test series B samples, which were exposed to 919.69–1471.50 J energy, experienced a 19.44 mm residual deformation and were within plastic deformation zone. This means that with an increase in the impact energy, the deformation went from the elastic region to the plastic region.
  • The maximum displacement at the midpoint of the S#1EXP (test series A) sample was recorded as 5.88 mm, while it was recorded as 33.9 mm for sample S#8EXP (test series B). Although the amount of impact energy on S#8EXP was 8 times more than S#1EXP, the deflection was almost 5.8 times bigger. It can be inferred that in beams that are placed along their weak axes, the deflection increment coefficient was not equal to that of the energy.
  • In addition, the accelerations generated due to the impact energy, which were 260 g for S#1EXP (183.94 J energy) and 1760 g for S#8EXP (1471.5 J energy), were compared. Similar to the deflection, the amount of the increase in acceleration was not equivalent to the amount of the increase in energy since there was an 8 times increase in energy, but only a 6.5 times increase could be observed in acceleration.
  • Using D’Alembert dynamic equations, the impact forces were estimated where the maximum impact force was seen in S#8EXP (388.18 kN) and the minimum impact force was seen in S#1EXP (71.80 kN). The inertial force values were obtained from the accelerometers, and the sum of the reaction forces was estimated from the load cell.
  • As the loading was changing from static to dynamic, the reaction forces estimated using the impact factor coefficient had differences ranging from 4% to 30% with the reaction forces estimated experimentally. It is worth mentioning that the difference tended to increase as the impact factor coefficient value increased.
  • The maximum difference in the acceleration values obtained experimentally and numerically was recorded in S#2, which was 12.28%, while the biggest differences in the maximum deflection and residual displacement were seen in S#1 (5.7%) and S#8 (16%), respectively. As the supports experienced some partial damage in the experimental study and the situation was ideal in finite element analysis, the difference in the residual displacement was higher.
  • Moreover, the stresses in the finite element analysis were estimated using Von Misses stress distributions for all eight samples (both test series A and B). The minimum stress was observed in S#1FEM, which was 288 Mpa, and the maximum stress was observed in S#8FEM, which was 421 Mpa. With the amount of energy increased by 8 times, the amount of stress only increased by 45.80%. This means that in beams that are placed along their weak axes, the Von Misses stress distribution increment coefficient is not equal to that of the energy.
  • Furthermore, as the equivalent plastic strain deformation was calculated using FE analysis, it was revealed that the lowest plastic deformation occurred in model S#1FEM, which was 0.531 mm, and the highest plastic deformation occurred in S#8FEM with a value of 2.56 mm.
  • To sum up, based on our experimental and FEM studies, it was concluded that the increases in the drop height of the impact force (particularly low-velocity impact) and the amount of energy in beams that are placed on their weak axes would increase the amount of acceleration, maximum deflection at beam midpoint, internal stress, residual displacement, and plastic deformation in such beams.
  • The plastic deformation on the top of the sample S#1EXP had a very small value (3.28 mm) at the first impact; however, the deformation that would occur on the beam element if the load were to be exerted repeatedly might result differently. For instance, the repetitive, very low-impact loading that is exerted on the beam of an offshore structure during stoppage is a real situation such as this. Thus, it is highly recommended to examine such a situation for a better understanding of the beam behaviors.

Funding

This research received no external funding.

Data Availability Statement

Not applicable.

Acknowledgments

The author heartily thank Elif Ağcakoca and Zeynep Yaman for assisting with the experimental studies.

Conflicts of Interest

The authors declare no conflict of interest.

References

  1. Watson, A.R.; Reid, S.R.; Johnson, W.; Thomas, S.G. Experimental study of the crushing of circular tubes by centrally applied opposed wedge-shaped indenters. Int. J. Mech. Sci. 1976, 18, 387–397. [Google Scholar] [CrossRef]
  2. ASTM E23; ASTM Standard Test Methods for Notched Bar Impact Testing of Metallic Materials. American Society for Testing and Materials (ASTM): Filadelfia, PA, USA, 2002.
  3. Det Norske Veritas (DNV). Design Against Accidental Loads, Recommended Practice DNV-682 RP-C204. 2010. Available online: https://rules.dnvgl.com/servicedocuments/dnv (accessed on 16 July 2022).
  4. Li, G.Q.; Zhang, Y.; Yang, T.C.; Jiang, J.; Lu, Y.; Chen, S.W. Effect of blast-induced column failure pattern on collapse behavior of steel frames. Adv. Steel Constr. 2018, 14, 376–390. [Google Scholar]
  5. Yu, H.X.; Liew, J.R. Steel framed structures subjected to the combined effects of blast and fire-Part 1: State-of-the-art review. Adv. Steel Constr. 2005, 1, 67–84. [Google Scholar]
  6. Yu, H.X.; Liew, J.R. Steel framed structures subjected to the combined effects of blast and fire: Part 2: Case study. Adv. Steel Constr. 2005, 1, 85–104. [Google Scholar]
  7. Teixeira, F.B.; Caldas, R.B.; Grilo, L.F. Influence of different shapes of geometric imperfections on the structural behavior of beams with large web openings. Adv. Steel Constr. 2020, 16, 272–278. [Google Scholar]
  8. Kantar, E.; Erdem, R.T.; Anıl, Ö. Nonlinear finite element analysis of impact behavior of concrete beam. Math. Comput. Appl. 2011, 16, 183–193. [Google Scholar] [CrossRef]
  9. Wang, Y.; Qian, X.; Liew, J.R.; Zhang, M.H. Experimental behavior of cement filled pipe-in-pipe composite structures under transverse impact. Int. J. Impact Eng. 2014, 72, 1–16. [Google Scholar] [CrossRef]
  10. He, X.; Soares, C.G. Experimental study on the dynamic behavior of beams under repeated impacts. Int. J. Impact Eng. 2021, 147, 103724. [Google Scholar] [CrossRef]
  11. Zeinoddini, M.; Parke, G.A.R.; Harding, J.E. Axially pre-loaded steel tubes subjected to lateral impacts: An experimental study. Int. J. Impact Eng. 2002, 27, 669–690. [Google Scholar] [CrossRef]
  12. Zeinoddini, M.; Harding, J.E.; Parke, G.A.R. Axially pre-loaded steel tubes subjected to lateral impacts (a numerical simulation). Int. J. Impact Eng. 2008, 35, 1267–1279. [Google Scholar] [CrossRef]
  13. Merwad, A.M.; El-Sisi, A.A.; Mustafa, S.A.; Sallam, H.E.D.M. Lateral Impact Response of Rubberized-Fibrous Concrete-Filled Steel Tubular Columns: Experiment and Numerical Study. Buildings 2022, 12, 1566. [Google Scholar] [CrossRef]
  14. Saatci, S. Structures Subjected to Impact Loads. Ph.D. Thesis, University of Toronto, Toronto, ON, Canada, 2007. [Google Scholar]
  15. Batarlar, B. Behavior of Reinforced Concrete Slabs Subjected to Impact Loads. Master’s Thesis, Izmir Institute of Technology, Izmir, Turkey, 2013. [Google Scholar]
  16. Gu, S.; Zhao, J.; Li, J.; Peng, F.; Kong, C.; Yang, L. Application of Fractal Theory to the Analysis of Failure Characteristics of Low-Velocity-Impact Concrete Slabs. Buildings 2023, 13, 2190. [Google Scholar] [CrossRef]
  17. Husem, M.; Cosgun, S.I.; Sesli, H. Finite element analysis of RC walls with different geometries under impact loading. Comput. Concr. Int. J. 2018, 21, 583–592. [Google Scholar]
  18. Kezmane, A.; Chiaia, B.; Kumpyak, O.; Maksimov, V.; Placidi, L. 3D modelling of reinforced concrete slab with yielding supports subject to impact load. Eur. J. Environ. Civ. Eng. 2017, 21, 988–1025. [Google Scholar] [CrossRef]
  19. Breen, C.; Guild, F.; Pavier, M. Impact of thick CFRP laminates: The effect of impact velocity. Compos. Part A Appl. Sci. Manuf. 2005, 36, 205–211. [Google Scholar] [CrossRef]
  20. Zhang, R.; Zhi, X.D.; Fan, F. Plastic behavior of circular steel tubes subjected to low-velocity transverse impact. Int. J. Impact Eng. 2018, 114, 1–19. [Google Scholar] [CrossRef]
  21. Nasery, M.M.; Ağcakoca, E.; Yaman, Z. Experimental and numerical analysis of impactor geometric shape effects on steel beams under impact loading. Structures 2020, 27, 1118–1138. [Google Scholar] [CrossRef]
  22. Anil, Ö.; Kantar, E.; Yilmaz, M.C. Low velocity impact behavior of RC slabs with different support types. Constr. Build. Mater. 2015, 93, 1078–1088. [Google Scholar] [CrossRef]
  23. Allan, J.D.; Marshall, J. The Effect of Ship Impact in the Load Carrying Capacity of Steel Tubes; ETDEWEB: London, UK, 1992. [Google Scholar]
  24. Frieze, P.A.; Cho, S.R. Impact damage and assessment of offshore tubulars. In Proceedings of the Offshore Technology Conference, Houston, TX, USA, 3–6 May 1993. [Google Scholar]
  25. Qu, H.; Huo, J.; Xu, C.; Fu, F. Numerical studies on dynamic behavior of tubular T-joint subjected to impact loading. Int. J. Impact Eng. 2014, 67, 12–26. [Google Scholar] [CrossRef]
  26. Kharazan, M.; Sadr, M.H.; Kiani, M. Delamination growth analysis in composite laminates subjected to low velocity impact. Steel Compos. Struct. 2014, 17, 387–403. [Google Scholar] [CrossRef]
  27. Zhao, W.; Guo, Q.; Dou, X.; Zhou, Y.; Ye, Y. Impact response of steel-concrete composite panels: Experiments and FE analyses. Steel Compos. Struct. 2018, 26, 255–263. [Google Scholar]
  28. Chen, Z.H.; Yang, J.G.; Liu, Z.S. Experimental and numerical investigation on upheaval buckling of free-span submarine pipeline. Adv. Steel Constr. 2019, 15, 323–328. [Google Scholar]
  29. Zhang, S.; Pedersen, P.T.; Ocakli, H. Collisions damage assessment of ships and jack-up rigs. Ships Offshore Struct. 2015, 10, 470–478. [Google Scholar] [CrossRef]
  30. Baaskaran, N.; Ponappa, K.; Shankar, S. Assessment of dynamic crushing and energy absorption characteristics of thin-walled cylinders due to axial and oblique impact load. Steel Compos. Struct. 2018, 28, 179–194. [Google Scholar]
  31. Kadhim, M.M.; Wu, Z.; Cunningham, L.S. Experimental study of CFRP strengthened steel columns subject to lateral impact loads. Compos. Struct. 2018, 185, 94–104. [Google Scholar] [CrossRef]
  32. Kang, X.J.; Liu, Y.H.; Zhao, L.; Yu, Z.X.; Zhao, S.C.; Tang, H. Dynamic response analysis method for the peak value stage of concrete-filled steel tube beams under lateral impact. Adv. Steel Constr. 2019, 15, 329–337. [Google Scholar]
  33. Behinaein, P.; Cotsovos, D.M.; Abbas, A.A. Behaviour of steel-fibre-reinforced concrete beams under high-rate loading. Comput. Concr. 2018, 22, 337–353. [Google Scholar]
  34. Ağcakoca, E.; Bıyıklıoğlu, E. Experimentally and numerically investigating the performances of aramid fiber-reinforced steel beams under impact loadings. Arab. J. Sci. Eng. 2020, 45, 8053–8068. [Google Scholar] [CrossRef]
  35. Wu, Q.J.; Zhi, X.D.; Guo, M.H. Finite element analysis for the progressive failure of FRP-reinforced steel component under low-velocity impact. Adv. Steel Constr. 2019, 15, 267–273. [Google Scholar]
  36. Ding, X.; Fan, Y.; Kong, G.; Zheng, C. Wave propagation in a concrete filled steel tubular column due to transient impact load. Steel Compos. Struct. Int. J. 2014, 17, 891–906. [Google Scholar] [CrossRef]
  37. ASTM A370-13; ASTM Standard Test Methods and Definitions for Mechanical Testing of Steel Products A370-13. American Society for Testing and Materials (ASTM): West Conshohocken, PA, USA, 2010.
  38. Han, F.; Wang, Y.; Zhang, T.; Li, Q.; Song, Y. Effect of different roll forming processes on material properties of square tubes. Adv. Steel Constr. 2020, 16, 181–190. [Google Scholar]
  39. ABAQUS/CAE, version 6.12; Dassault Systemes Simulia Corp.: Providence, RI, USA, 2016.
  40. Richardson, M.O.W.; Wisheart, M.J. Review of low-velocity impact properties of composite materials. Compos. Part A Appl. Sci. Manuf. 1996, 27, 1123–1131. [Google Scholar] [CrossRef]
  41. Hibbitt, H.; Karlsson, B.; Sorensen, P. ABAQUS Analysis User’s Manual, Version 6.11; Dassault Systèmes Simulia Corp.: Providence, RI, USA, 2011.
  42. Nasery, M.M.; Ağcakoca, E.; Yaman, Z. Inspecting the mesh size effects in finite element modelling of steel beams under impact loading. In Proceedings of the International Science and Engineering Applications Symposium on Hazards, Karabuk, Turkey, 25–27 July 2019. [Google Scholar]
  43. Ellinas, C.P. Damage on Offshore Tubular Bracing Member. In Proceedings of the IABSE Colloquium, Copenhagen, Denmark, 30 May–2 June 1983. [Google Scholar]
  44. Soleimani, S.M.; Banthia, N. A novel drop weight impact setup for testing reinforced concrete beams. Exp. Tech. 2014, 38, 72–79. [Google Scholar] [CrossRef]
  45. Pham, T.M.; Hao, H. Plastic hinges and inertia forces in RC beams under impact loads. Int. J. Impact Eng. 2017, 103, 1–11. [Google Scholar] [CrossRef]
  46. Soleimani, S.M.; Banthia, N.; Mindess, S. Behavior of RC beams under impact loading: Some new findings. In Proceedings of the Sixth International Conference on Fracture Mechanics of Concrete and Concrete Structures, Catania, Italy, 17–22 June 2007. [Google Scholar]
  47. Biggs, J.M.; Biggs, J. Introduction to Structural Dynamics; McGraw-Hill College: Chicago, IL, USA, 1964. [Google Scholar]
  48. Pytel, A.; Kiusalaas, J. Mechanics of Material; Brooks/Cole-Thomson Learning: Belmont, CA, USA, 2003. [Google Scholar]
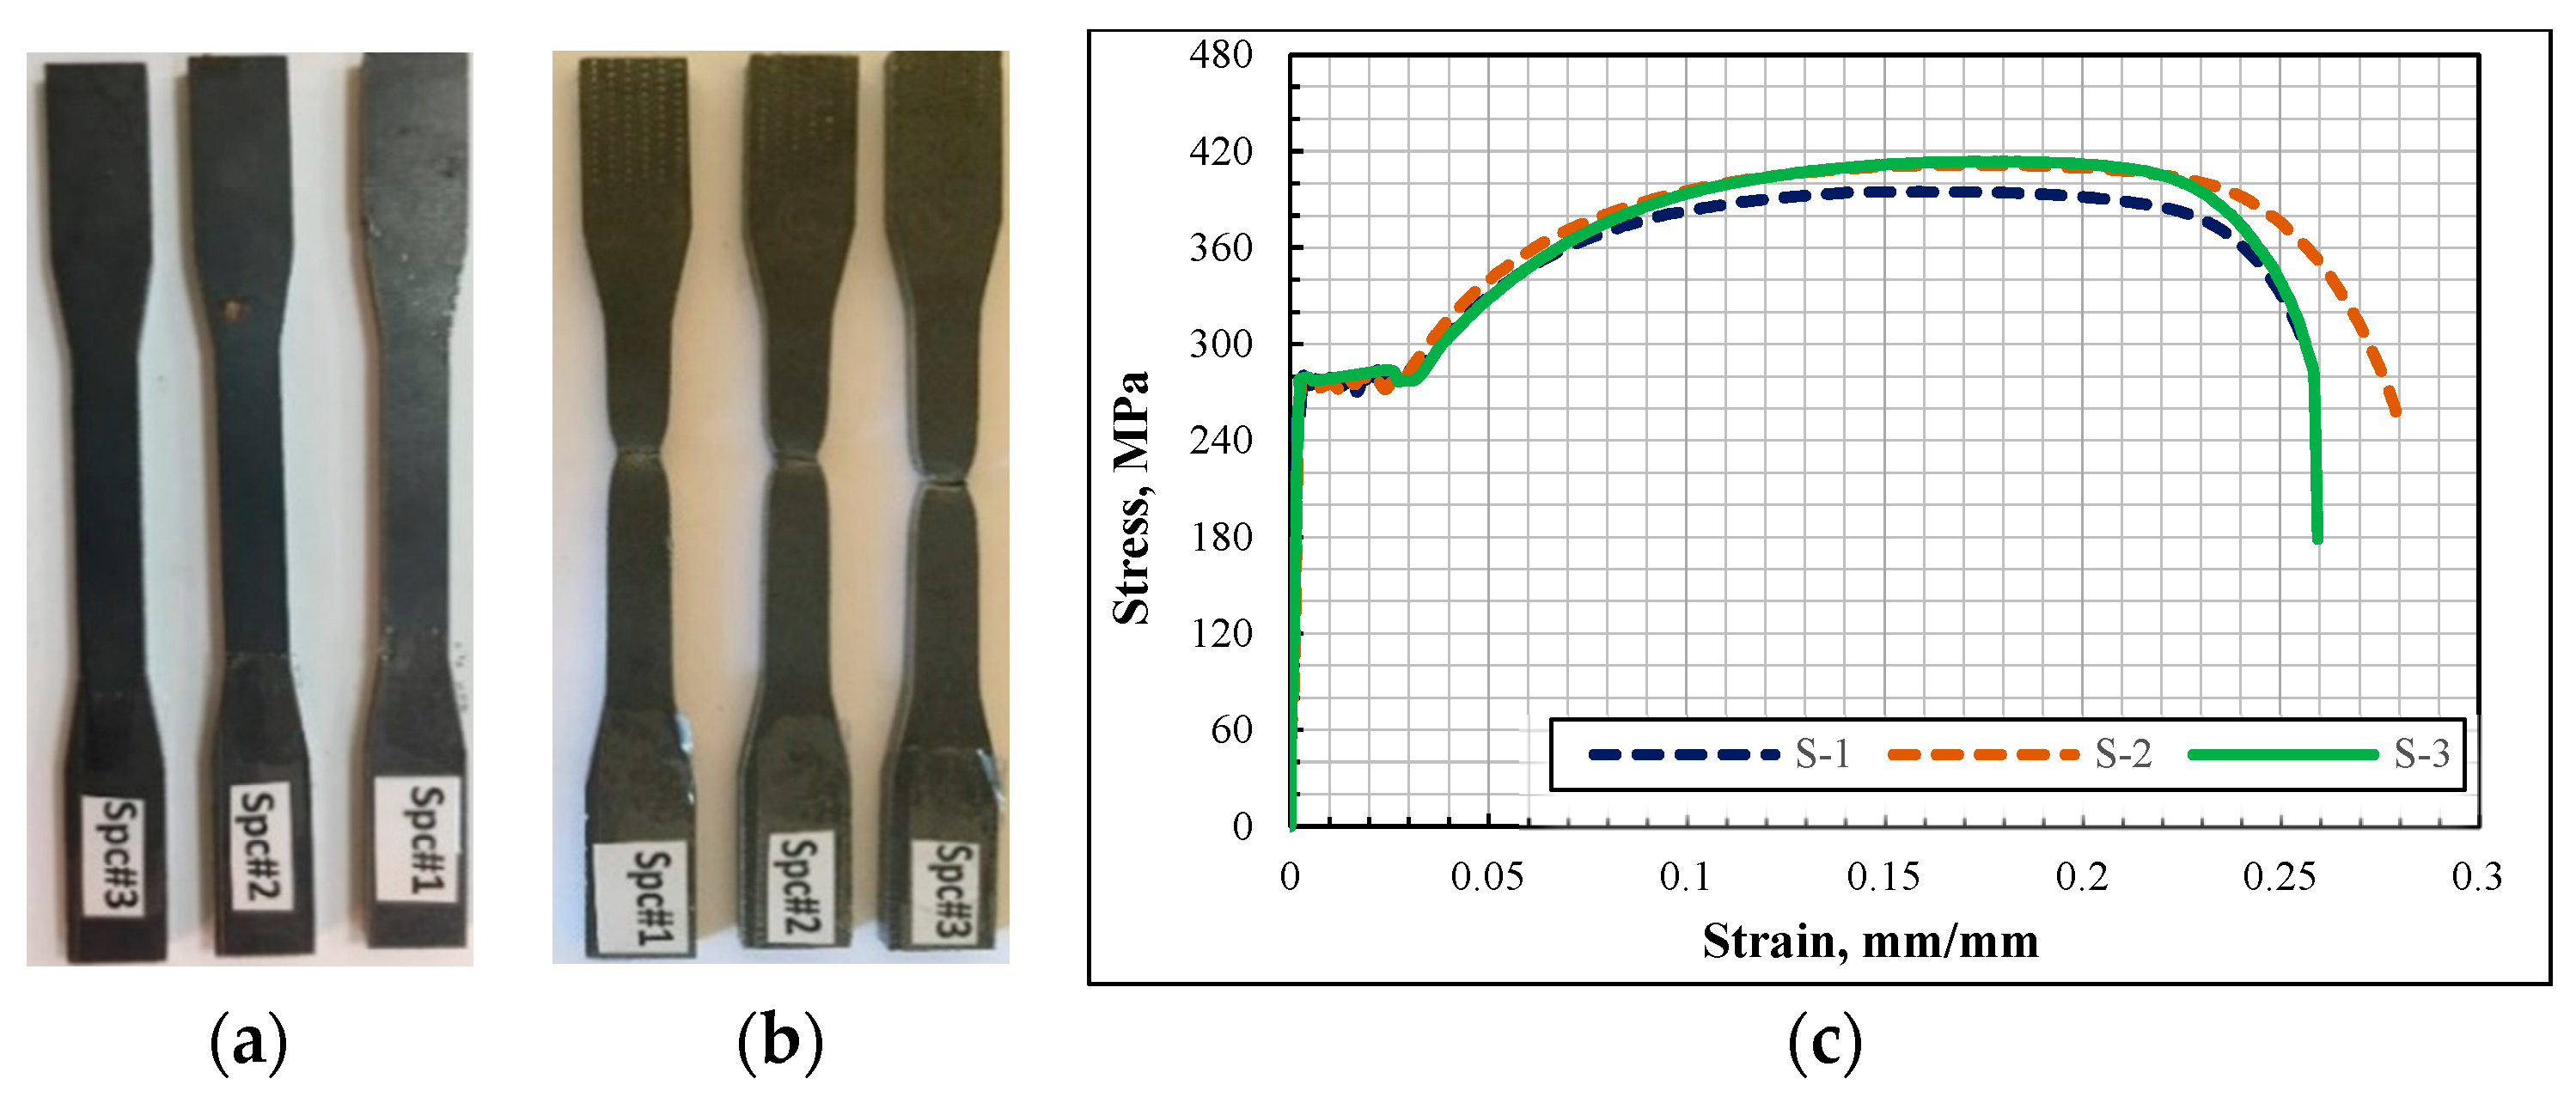
Figure 1. Coupon samples (a) before, (b) after the uniaxial tensile test, and (c) stress-strain responses of the tensile test coupons.
Buildings 13 02331 g001
Figure 2. Dimensions (mm) and details of a typical specimens.
Buildings 13 02331 g002
Figure 3. (a) Test setup, (b) beam supports, (c) sliding rods, (d) circular head hammer.
Buildings 13 02331 g003
Figure 4. Finite element model and detail of S#4Fem.
Buildings 13 02331 g004
Figure 5. Average engineering and true stress-strain curve of the steel material.
Buildings 13 02331 g005
Figure 6. Meshed finite element models and midspan deformation shapes.
Buildings 13 02331 g006
Figure 7. Displacement-time history curves in the mesh convergence studies.
Buildings 13 02331 g007
Figure 8. Displacement-time curves of Series A and Series B test specimens.
Buildings 13 02331 g008
Figure 9. Images of the experimental studies and specimens after the impact load applications from different drop heights.
Buildings 13 02331 g009aBuildings 13 02331 g009b
Figure 10. Acceleration-time curves of (a) series A and (b) series B test samples.
Buildings 13 02331 g010
Figure 11. Impact force-time, reaction force-time and inertia force-time curves of series A and series B test samples.
Buildings 13 02331 g011
Figure 12. Experimental and FEM acceleration-times curves of test series A and B.
Buildings 13 02331 g012aBuildings 13 02331 g012b
Figure 13. Displacement-time curves obtained from experiments and FEM for test series A and B.
Buildings 13 02331 g013aBuildings 13 02331 g013b
Figure 14. Displacement-time curves obtained from FEM models for series A and B (Top face).
Buildings 13 02331 g014
Figure 15. Von Misses stress distributions for test series A and B after the impact load analysis from different drop heights.
Buildings 13 02331 g015aBuildings 13 02331 g015b
Figure 16. Equivalent plastic strains (PEEQ) and deflections views of test series A and B.
Buildings 13 02331 g016aBuildings 13 02331 g016b
Table 1. Mechanical properties of the steel materials used in the experiment.
Sample CodeYield Stress
(MPa)
Tensile Stress
(MPa)
Elongation
(%)
Elastic Modulus
(GPa)
S-1 268.74392.1524.94174.88
S-2 276.97409.3223.74176.38
S-3 272.67411.4123.82177.66
Table 2. Properties of the test specimens.
CodesDimensions
(mm)
Length
(mm)
Cross
Sectional Area (mm²)
Weight of the Beam
(kg/m)
Moment of İnertia about the Strong Axes
(104 × mm4)
Moment of
İnertia about the Weak Axis
(104 × mm4)
Drop Height
(mm)
Hammer Weight
(kg)
Impact Energy
(J)
Series AS#1120 × 80 × 3200011408.923012325075183.94
S#2120 × 80 × 3200011408.923012350075367.88
S#3120 × 80 × 3200011408.923012375075551.81
S#4120 × 80 × 3200011408.9230123100075735.75
Series BS#5120 × 80 × 3200011408.9230123125075919.69
S#6120 × 80 × 3200011408.92301231500751103.63
S#7120 × 80 × 3200011408.92301231750751287.56
S#8120 × 80 × 3200011408.92301232000751471.50
Table 3. Details of the mesh convergence analysis compared with experimental results.
Model NameBeam RegionsFEM
Displacement
(mm)
Experimental
Displacement
(mm)
%Difference of
Experimental and FEM
Displacements
RightCentralLeft
M4040 × 4040 × 4040 × 4021.8616.1935.02
M3030 × 3030 × 3030 × 3020.6427.49
M2020 × 2020 × 2020 × 2018.8516.43
M1010 × 1010 × 1010 × 1017.377.29
M55 × 55 × 55 × 516.763.52
M5-1515 × 155 × 1515 × 1516.011.12
Table 4. Experimental results of the displacements and accelerations for all specimens.
Test SeriesSample
Code
Drop Height
(mm)
Max. Midpoint
Displacement (mm)
Max. Midpoint
Acceleration
(g)
Impact Energy
(J)
Series AS#1EXP2505.88260183.94
S#2EXP5008.93290367.88
S#3EXP75013.08570551.81
S#4EXP100016.19743735.75
Series BS#5EXP125019.44910919.69
S#6EXP150023.2811201103.63
S#7EXP175028.7713061287.56
S#8EXP200033.9917061471.50
Table 5. Maximum impact, inertia, and reaction forces in the test samples.
Sum of Maximum
Reaction Forces (kN)
Maximum İnertia
Force (kN)
Maximum İmpact
Force (kN)
S#1(EXP)34.7237.0871.80
S#2(EXP)49.6946.2295.91
S#3(EXP)61.9489.71151.65
S#4(EXP)72.65116.43189.08
S#5(EXP)82.94132.05214.99
S#6(EXP)92.78172.43265.21
S#7(EXP)102.16205.21307.37
S#8(EXP)121.05267.13388.18
Table 6. Impact load factors for static analysis.
Specimen CodeStatic Deflection
( 10 8   mm )   ( δ )
Impact Factor (η)Impact Factor Total Reaction Force (kN) (Pmax)Exp. Total Reaction Force (kN)Diff. between Impact Factor and Experiment Forces (%)
S#125.545.2933.3234.724.20
S#225.563.6346.8249.696.13
S#325.577.7057.1761.948.34
S#425.589.5765.9072.6510.24
S#525.5100.0273.5982.9412.71
S#625.5109.4780.5492.7815.19
S#725.5118.1686.94102.1617.50
S#825.5126.2592.89121.0530.31
EXP. Experimental; Diff.: Differences.
Table 7. Maximum displacements on the top and bottom faces of the beams under impact loading.
Specimen
Code
Max. Displacement on the Bottom Face of the Beam (EXP) (mm)Max. Displacement on the Bottom Face of the Beam (FEM) (mm)Differences on the Bottom Face
(%)
Max. Displacement on the Top Face of the Beam (FEM) (mm)Difference between the Top and Bottom Face of the FEM (%) Vertical Denting (FEM) (mm)Percentage of the Vertical Plastic Denting (%)
S#1 5.886.124.089.4053.593.284.10
S#2 8.939.435.5915.2761.935.847.31
S#3 13.0813.231.1520.5655.407.339.16
S#416.1916.914.4525.5350.978.6210.78
S#5 19.4420.485.3530.2747.809.7912.24
S#623.2824.153.7434.9444.6810.7913.49
S#728.7727.653.8939.4942.8211.8414.80
S#8 33.9934.451.3554.5058.2020.0525.06
Table 8. Comparisons between the experimental, mathematical, and FE results.
Specimen NumberDrop Height of Hammer (mm)Hammer Weight (N)Max. Displacement
(mm)
Residual Displacement
(mm)
Acceleration
(g)
Reaction Forces
(kN)
Von Mises Stress
(MPa)
PEEQ (Equivalent Plastic Strain) (10−1)
EXPDif (%)FEMEXPDif (%)FEMEXPDif (%)FEMEXPDif (%)MathematicallyFEMFEM
S#12507505.884.086.120.12-1.78−2336.90−25834.724.0333.322880.531
260278
S#25007508.935.609.432.3812.602.68−2583.79−30849.695.7846.823290.998
290301
S#375075013.081.1113.233.2313.933.68−54012.28−62461.947.7057.173391.26
570640
S#4100075016.194.4516.914.6028.045.89−7002.29−74072.659.2865.913491.45
743760
S#5125075019.445.3520.4814.6429.9919.03−8807.95−95082.9411.2773.593541.57
9101015
S#6150075023.283.7424.1515.846.5714.80−10567.95−114092.7813.1980.543651.72
11201218
S#7175075028.773.8927.6519.5230.0313.60−12308.35−1402102.1614.9086.943702.16
13061415
S#8200075033.991.3534.4525.3315.9929.38−16367.85−1801121.0523.2692.894212.56
17061840
Max. Differences
(%)
5.6030.3312.2823.26
EXP: Experimental results; Dif: Differences; FEM: Finite element model.
Disclaimer/Publisher’s Note: The statements, opinions and data contained in all publications are solely those of the individual author(s) and contributor(s) and not of MDPI and/or the editor(s). MDPI and/or the editor(s) disclaim responsibility for any injury to people or property resulting from any ideas, methods, instructions or products referred to in the content.