Article

Climate-Adaptive Design Strategies of Sports Stadia in a Hot Summer and Cold Winter Zone: A Case Study of Nanjing

1
Nanjing Institute of Technology, College of Architecture and Engineering, Nanjing 211167, China
2
Jiangsu Institute of Urban & Rural Planning and Design Co., Ltd., Nanjing 210019, China
*
Author to whom correspondence should be addressed.
Buildings 2023, 13(9), 2238; https://doi.org/10.3390/buildings13092238
Submission received: 28 June 2023 / Revised: 23 August 2023 / Accepted: 29 August 2023 / Published: 4 September 2023
(This article belongs to the Special Issue Green Building Design and Construction for a Sustainable Future)

Abstract

:
Urban planning and design, with the objectives of energy efficiency and climate adaptation, is receiving more and more attention as urban energy consumption keeps rising. As technical representatives with large spans and high difficulties, sports stadia have a broad range of energy conservation and emission reduction compared with traditional buildings and have an extremely close relationship with the energy consumption of the building environment and urban microclimate, so it is necessary to study the climate adaptation design strategy of sports stadia. However, climate adaptive design has not given much thought to sports stadia nowadays. And the energy-saving strategies of sports stadia rely mostly on engineering expertise without taking into account the effect of sports stadia layout, shape, and structure on the urban microclimate. This paper investigates the energy-saving and climate-adaptive design techniques of sports stadia in the hot summer and cold winter zone of China using the layout of sports stadia as the research object. Firstly, we construct a climate adaptive design framework of sports stadia of “layout-shape-structure” based on the characteristics of sports stadia. Secondly, combined with typical examples of large-scale sports stadia in hot summers and cold winters, we establish an abstract model of architectural layout, shape, and structure based on climatic environment. In order to provide climate-adaptive design methods for sports stadia in hot summer and cold winter zones, the ventilation of the external and internal spaces of sports stadia is simulated, quantified, and compared using CFD software. The study’s findings suggest that the layout of sports stadia should take into account the direction of the local wind, that the goal of low energy consumption should guide the choice of building form, and that the internal wind and temperature environment should be stabilized during construction. The study’s findings can serve as a guide for comparable designs that aim to construct sports stadia with reduced carbon footprints.

1. Introduction

The idea that climate change could have a significant impact on energy demand is generally acknowledged. China is currently the top emitter of greenhouse gases in the world as a result of its expanding energy consumption. At present, China actively participates in international efforts to reduce emissions and has set its own emission reduction targets of peaking carbon emissions by 2030 and achieving carbon neutrality by 2060 [1]. An important contributor to the nation’s economy, the building sector, is responsible for a sizeable portion of urban energy use. According to reports, 67% of the world’s energy needs comes from buildings [2]. Therefore, a significant stakeholder that may be successful in accomplishing this goal is the building industry. The issue of energy use and carbon emissions in public structures, particularly sizable public structures, is very apparent when looking at the construction business [3]. Previous studies have revealed that large-scale public buildings consume 2~4 times more energy than small-scale public buildings [4] and 10~20 times more energy than residential buildings in China [5]. Sports stadia, as typical large-scale public buildings, are typical representatives of large space and high performance in terms of building form, with unique volume and energy demand. For example, sports facilities consume about 8% of building energy in Europe [6]. In terms of the construction scale, according to China’s most recent Sixth National Stadium Census in 2013, there were 1.69 million sports facilities nationwide, with an area of 1.99 billion square meters [7]. In recent years, the “Healthy China 2030” plan has emphasized the need to improve people’s health by strengthening the construction of sports facilities [8]. It can be seen that under the impetus of the policy, the construction of sports stadia shows a rapid growth trend in the future. Therefore, there is an urgent need for the low-carbon development of sports stadia.
Climate change affects building energy consumption mainly through changes in heating and cooling demand. However, the impacts of climate change vary in different regions. For example, in hot climates, the built environment is challenged by drought and overheating, whereas this challenge does not exist in cold coastal climates [9]. In China, the climate strip of the hot summer and cold winter zone is characterized by scorching heat in summer and severe cold in winter. At the same time, the large capacity of public space in sports stadia leads to a large heating and cooling demand. The above reasons cause the energy consumption of sports stadia in hot summer and cold winter areas to be large [10]. In response to this problem, the state has promulgated policies and regulations on energy conservation in residential buildings. However, policies and regulations on sports stadia for hot summer and cold winter areas are still lacking, which makes the study of sustainable design of sports buildings in this area a meaningful exploration.
As global heating increases, all cities need to adapt to climate change. For the building industry, a range of measures are being taken to change building design and urban planning and to adapt existing buildings to climate change. In this process, climate-resilient design is emerging as an effective means of greening and low-carbon buildings. For example, Cerra (2016) proposed a framework for climate-resilient design applicable in non-coastal areas [11] and Liu et al. (2017) made recommendations for the climate-resilient design of new rural housing in their study area based on a literature review and field survey [12]. After a preliminary case study on the design of urban multi-family buildings at an early stage, Shen et al. (2020) proposed to incorporate future climate scenarios into the initial building design of two representative sites in Rome, Italy and Stockholm, Sweden [13]. Depending on the focus of the study, research on climate-resilient design can be broadly divided into three themes: (1) climate zoning, climate characteristics, and design responses [14,15]; (2) theoretical models for evaluating human thermal adaptation to spatial environments and thermal comfort [16,17]; (3) adaptation relationships between architectural spaces, urban spaces, and regional climates [18,19]. The first two themes focus on strengthening the climate adaptation of architectural spaces by analyzing the regional climate and meteorological conditions as well as the human physiological and psychological perception of the thermal environment and are mostly concerned with the determination and optimization of design principles and evaluation criteria. The third theme is mainly for the research of specific architectural spaces, generally based on specific cases such as design practice and actual engineering and around specific design methods and technologies.
In general, the design of climate-resilient buildings should consider building form and envelope [20]; climate and thermal comfort [21]; passive heating and cooling [22]; site planning [23]; windows, doors, and lighting [24]; natural ventilation [25]; adaptive low-energy technologies [26] to creatively answer the local climate and ecology through design. In the climate-adapted design process, corresponding design tools such as CFD (Computational Fluid Dynamics) simulation methods [27,28,29], Energy Plus [13,30], Radiance [31,32], Fluent 2016 software [33,34], and airflow network [35,36] can help to create a more climate-resilient building from the outset. Compared with residential buildings, there are fewer studies on the climate-adaptive design of public buildings at this stage. However, some scholars have paid attention to public buildings in recent years. For example, Qi and Wei (2020) proposed a climate-adaptive natural ventilation design adapted to the local climate and quantitatively evaluated the ventilation performance of the design using CFD [27]. Additionally, climate-adaptive design for public buildings is more often combined with green buildings. For example, Xu (2020) proposed a set of performance optimization design strategies for green public buildings adapted to the marine climate after analyzing the relationship between green public buildings and the external environment as well as the functional space design of coastal green public buildings [37]. Xue et al. (2016) explored the ventilation patterns of workplaces in order to optimize the passive climate-adaptive design strategies for green buildings in high-density tropical or subtropical cities on individual health perception; the results showed that the hybrid ventilation design could enable people to get in touch with nature [38]. Jing et al. (2021) proposed a cold-climate-adapted green public building design using the Chinese Pavilion of the 2019 World Horticultural Expo in Beijing, China as a research object [39]. Although more fruitful results have been accumulated on climate adaptation of public buildings, there are fewer studies on climate adaptation of buildings in hot summer and cold winter regions. At the same time, more studies have focused on office buildings and fewer studies have related to large-scale public buildings such as sports stadia. In addition, due to the lack of effective climate quantification tools and mature climate building strategies, a large number of architects rely on mechanical equipment when solving problems such as the difficulty of natural ventilation and lighting brought about by large spans, the difficulty of air intake demand brought about by large volumes, and the difficulty of coordinating the spatial arrangement of the grandstand and ventilation organization. They give less consideration to the impact of the layout of the sports stadia on the urban microclimate and the requirements of the energy saving of the built environment. Therefore, it is necessary to alleviate the problem of high energy consumption by strengthening the method of climate design.
To fill the research gap, this study intends to give systematic and practical design solutions for a new construction and restoration of sports stadia, as well as to improve the sports stadia climate adaption to hot summer and cold winter zones. This study begins with three aspects of building layout, building form, and building structure and uses typical examples of large sports stadia in hot summer and cold winter zones as the basis for refining a set of representative standardized abstract models based on the three main objectives of climate environment, low energy demand, and climate control. The “simulation-quantification-comparison” method is then used to conduct a comparative analysis of the design measures for sports stadia in order to develop a set of recommendations for climate-resilient design strategies for sports stadia. This study investigated the climate-adaptive design of sports stadia in hot summer and cold winter regions. The findings of this research can help provide architects with unique perspectives on designing and evaluating sports stadia and serve as a reference for carrying out similar designs in order to promote the decarbonization of sports stadia.

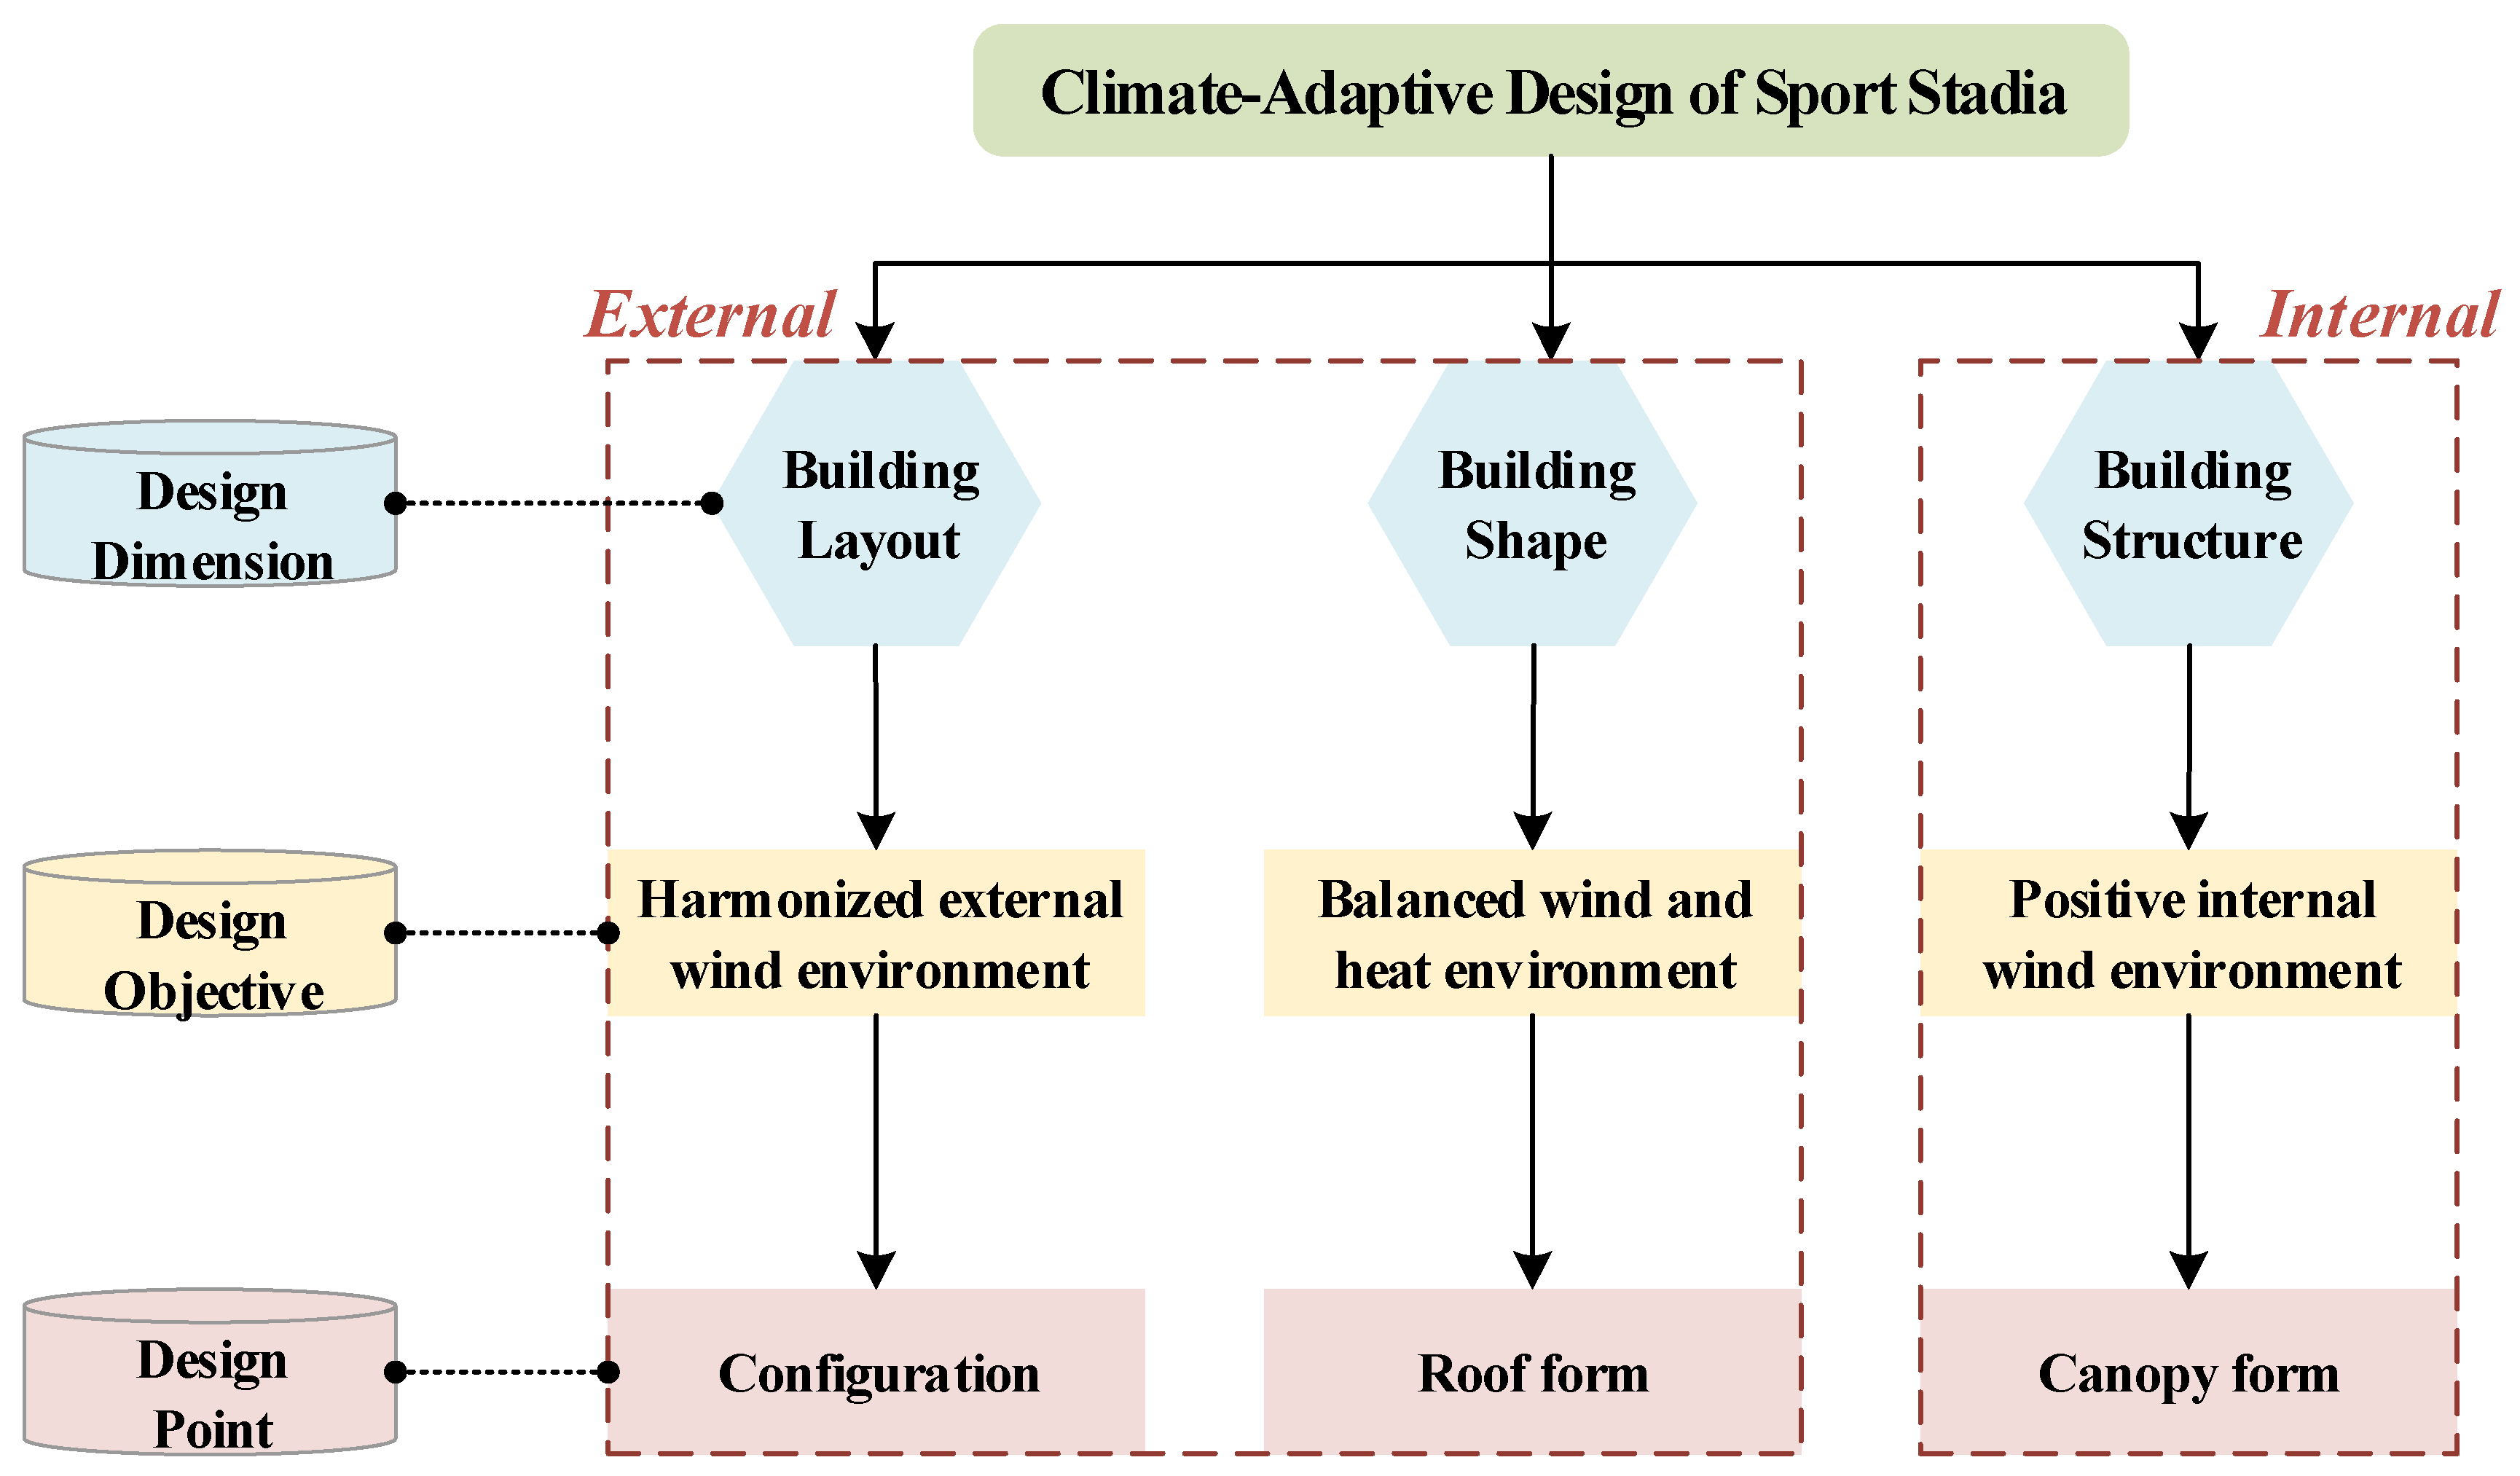
2. Climate-Adaptive Design Principles and Key Points

2.1. Design Principles for the Climatic Adaptation of Buildings in Hot Summer and Cold Winter Zones

Climate adaptive design is also known as climate design of buildings. In the stage of building scheme design, the climate environment of the area where the building is located is effectively and reliably analyzed; after considering the selection of appropriate climate adjustment measures, the design technology of better comfortable building space is achieved by using favorable climate factors and offsetting adverse climate factors [40]. From a climatic perspective, climate-responsive architecture not only responds to climatic factors through building site selection, community layout, building units, and architectural design details but also considers the impact of climatic factors on the indoor physical environment and comfort [41,42]. The climate conditions in China’s hot summer and cold -winter zone are harsh, with most areas experiencing sultry summers and high-temperature extremes, wet and cold winters, high annual precipitation, and high humidity in both winter and summer [43]. The extremes of climate create different thermal environmental needs in the region in winter and summer. In summer, there is a need to reduce the absorption of solar radiation, increase building shading, promote outdoor ventilation, and increase wind speed, which requires the provision of open spaces to guide ventilation and carry heat away from the building envelope; in winter, there is a need to increase the absorption of human solar radiation, reduce building shading, weaken outdoor ventilation, and reduce wind speed, which requires the provision of barriers to protect against wind and avoid the intrusion of cold winds into the building interior. Winter protection and warmth and summer ventilation and insulation are therefore key considerations in the design of buildings in the hot summer and cold winter zone [44]. This is also a contradiction in the design of buildings and climate adaptive design is the optimal solution to this contradiction. The advantage of this is that the design of buildings can be designed in such a way to shield the building from excessive solar radiation and to enhance natural ventilation, so that excess heat and humidity can be removed while blocking external heat intrusion as much as possible, indirectly affecting the temperature and humidity of the air and thus achieving better thermal comfort in the space. Therefore, according to the statements mentioned above, two principles of climate-adaptive design of sports stadia in hot summer and cold winter zones are proposed below:
  • Actively prevent external adverse climatic factors.
Climate adaptability is not passive, rather actively optimizes the microclimate environment of the building (which is conducive to energy saving) and attaches importance to and utilizes various climatic factors, such as the dominant wind direction, topography, landform, and other natural factors in summer and winter.
  • Balance the demand of buildings in different climates.
The climate adaptability design of buildings in hot summer and cold winter areas can not only meet the needs of one side and ignore the needs of the other but is necessary to reasonably deal with the different needs of winter and summer. Carefully analyze the contradictory subjects and explore the best design method without affecting the basic needs of both parties, balance the thermal comfort of the two, and achieve the purpose of building energy conservation and climate adaptability.

2.2. Key Points for the Climatic Design of Sports Stadia in Hot Summer and Cold Winter Zones

Sports stadia are buildings used for competition, teaching, entertainment, exercise, and other activities, with the characteristics of large investment, complex technology, large volume, and long service life. This research focuses on climate adaptation strategies in large spaces and complex structures, so the sports stadia in this research mainly consist of stadiums and various gymnasiums. Stadium refers to the building that can provide outdoor venues and provide users with certain seats for watching the games. Gymnasium refers to an indoor building that contains certain activity functions, commonly including swimming pools, basketball halls, badminton, etc. In the schematic design process of a gymnasium, the design process of “planning layout–shape design–structure modeling” is generally followed, so these points will be closely integrated in the climate adaptation design. The space of a sports stadia consists of two parts—the external space and the internal space—which are divided by the skin of the building. In terms of the areas of focus for the study of external and internal spaces, the focus of this study is on the public space for public use, as the aim of climate design is to provide a spatial environment with good thermal comfort for users. In this study, the external space is focused on the building layout and building shape.
Numerous studies have shown that the external layout form of a sports center has an important impact on the wind environment of its external space [45]. Although the architectural layout of the sports center is rich and diverse, it can be briefly considered from the location relationship between the buildings and the final formation of the architectural layout of the sports center that is the result of several basic layout forms combined with adjusting the orientation of groups and individuals; the more common basic layout forms are the “one-line layout” and the “triangle layout”. The shape of a gymnasium is rich in variations and, from the examples of sports buildings, both planes and curved surfaces are used in the shape design. It is worth noting that, according to the authors’ practical experiences, it is found that the gymnasium has the physical characteristics of a very large external surface and the roof is the most important part for its heat exchange. Therefore, in the shape of the gymnasium, the roof form is most closely related to the thermal environment. Meanwhile, except for special structure stadia, the functions of stadia are generally more fixed; all are grandstands arranged around the internal center field and the shape is generally oval or nearly oval. Therefore, when analyzing the shape, this study does not consider the shape of the stadium. The structural form of sports stadia has the characteristics of large selectivity, deep influence, and strong acceptability, e.g., the canopy form, which, with greater selectivity, is taken as the research object. On the one hand, because the infield wind environment defined by the canopy is an important factor affecting the quality of on-site exercise and game use, on the other hand, because the canopy form has a more obvious and intuitive impact on the sports stadia structure, it is one of the exploration forms that unifies design form and physical properties. Therefore, the key points of climate adaptation design for sports stadia are shown in Figure 1.
The unique massing and energy requirements of sports stadia lead to more pressing climate-resilient design needs than typical buildings. In general, starting from “planning layout–shape design–architectural modeling”, the design points of climate-adaptive design of sports stadia in hot summer and cold winter zones are proposed below. (1) In order to cope with the impact of climate factors on the regional environment of sports stadia, it is necessary to fully consider the particularity of regional climate, seek a reasonable layout mode of the sports stadia, and realize the unity of ventilation and wind protection. (2) In order to cope with the impact of climate factors on the outside of the gymnasium, it is necessary to seek a reasonable form to balance the wind and heat environment inside the gymnasium. (3) In order to cope with the disturbance of the wind environment inside the sports stadia caused by climate factors and combine the design requirements of architectural aesthetics, it is necessary to conduct reasonable discussions through reasonable structural design.

3. Methods

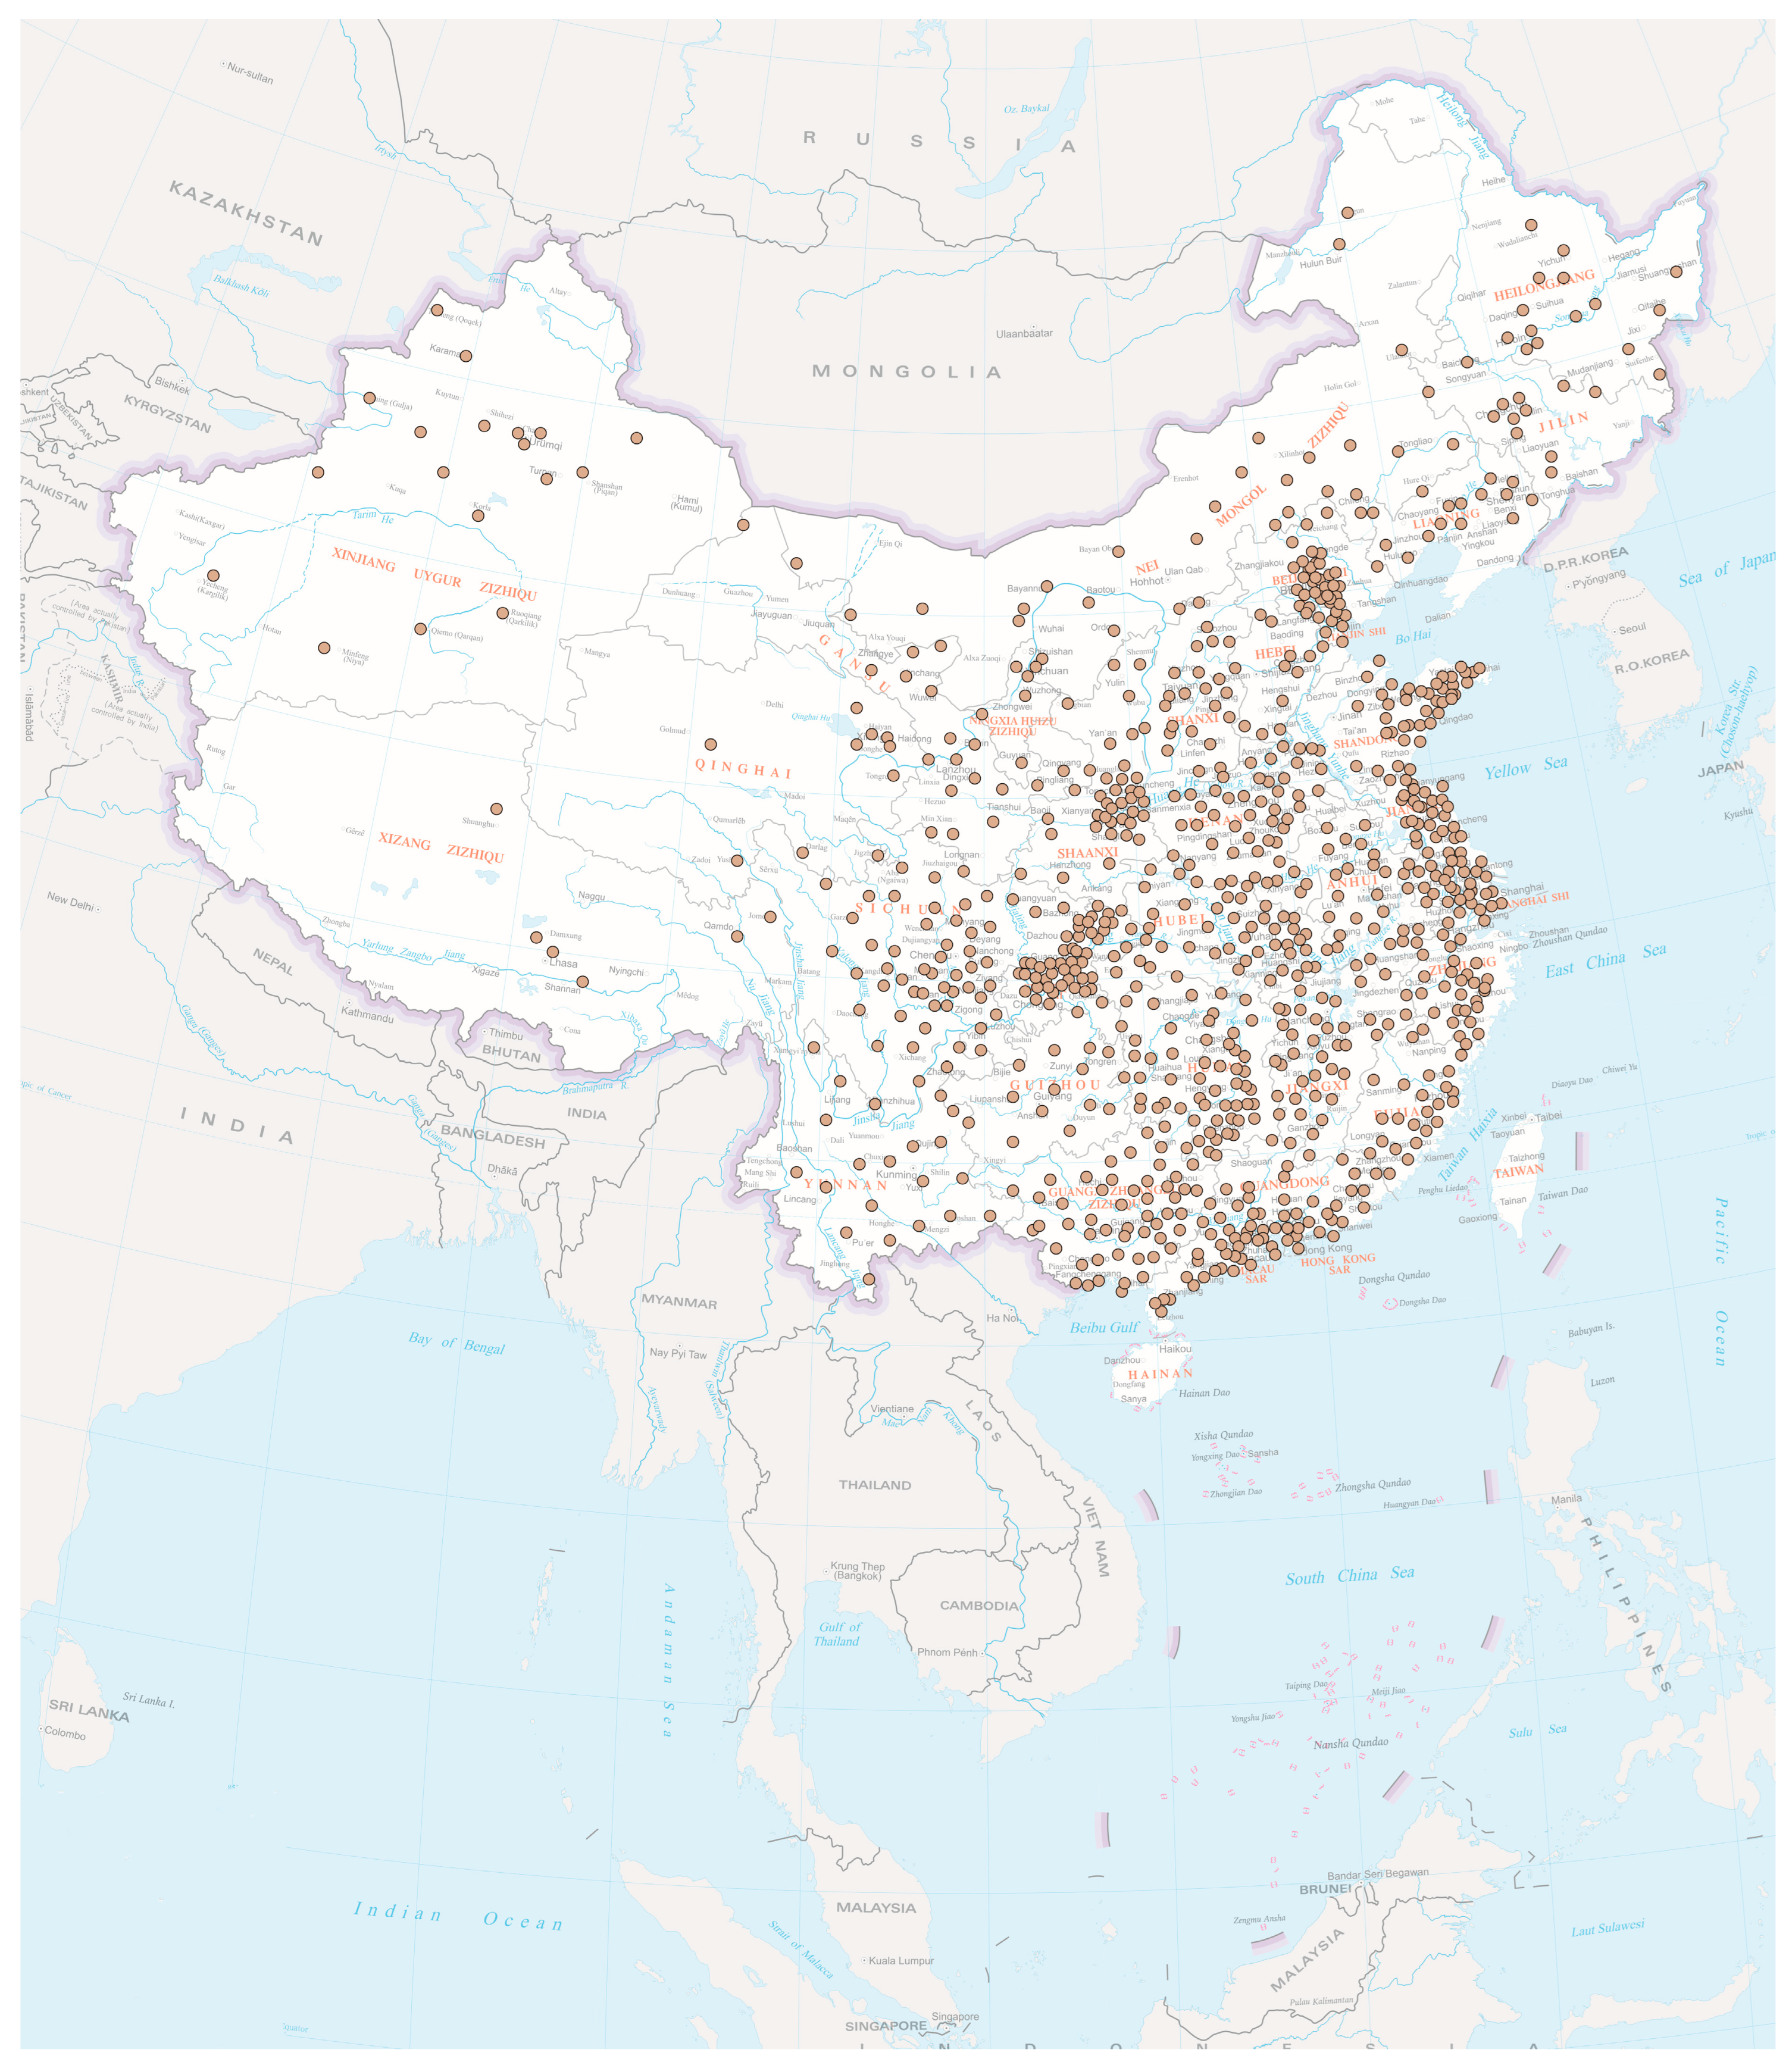
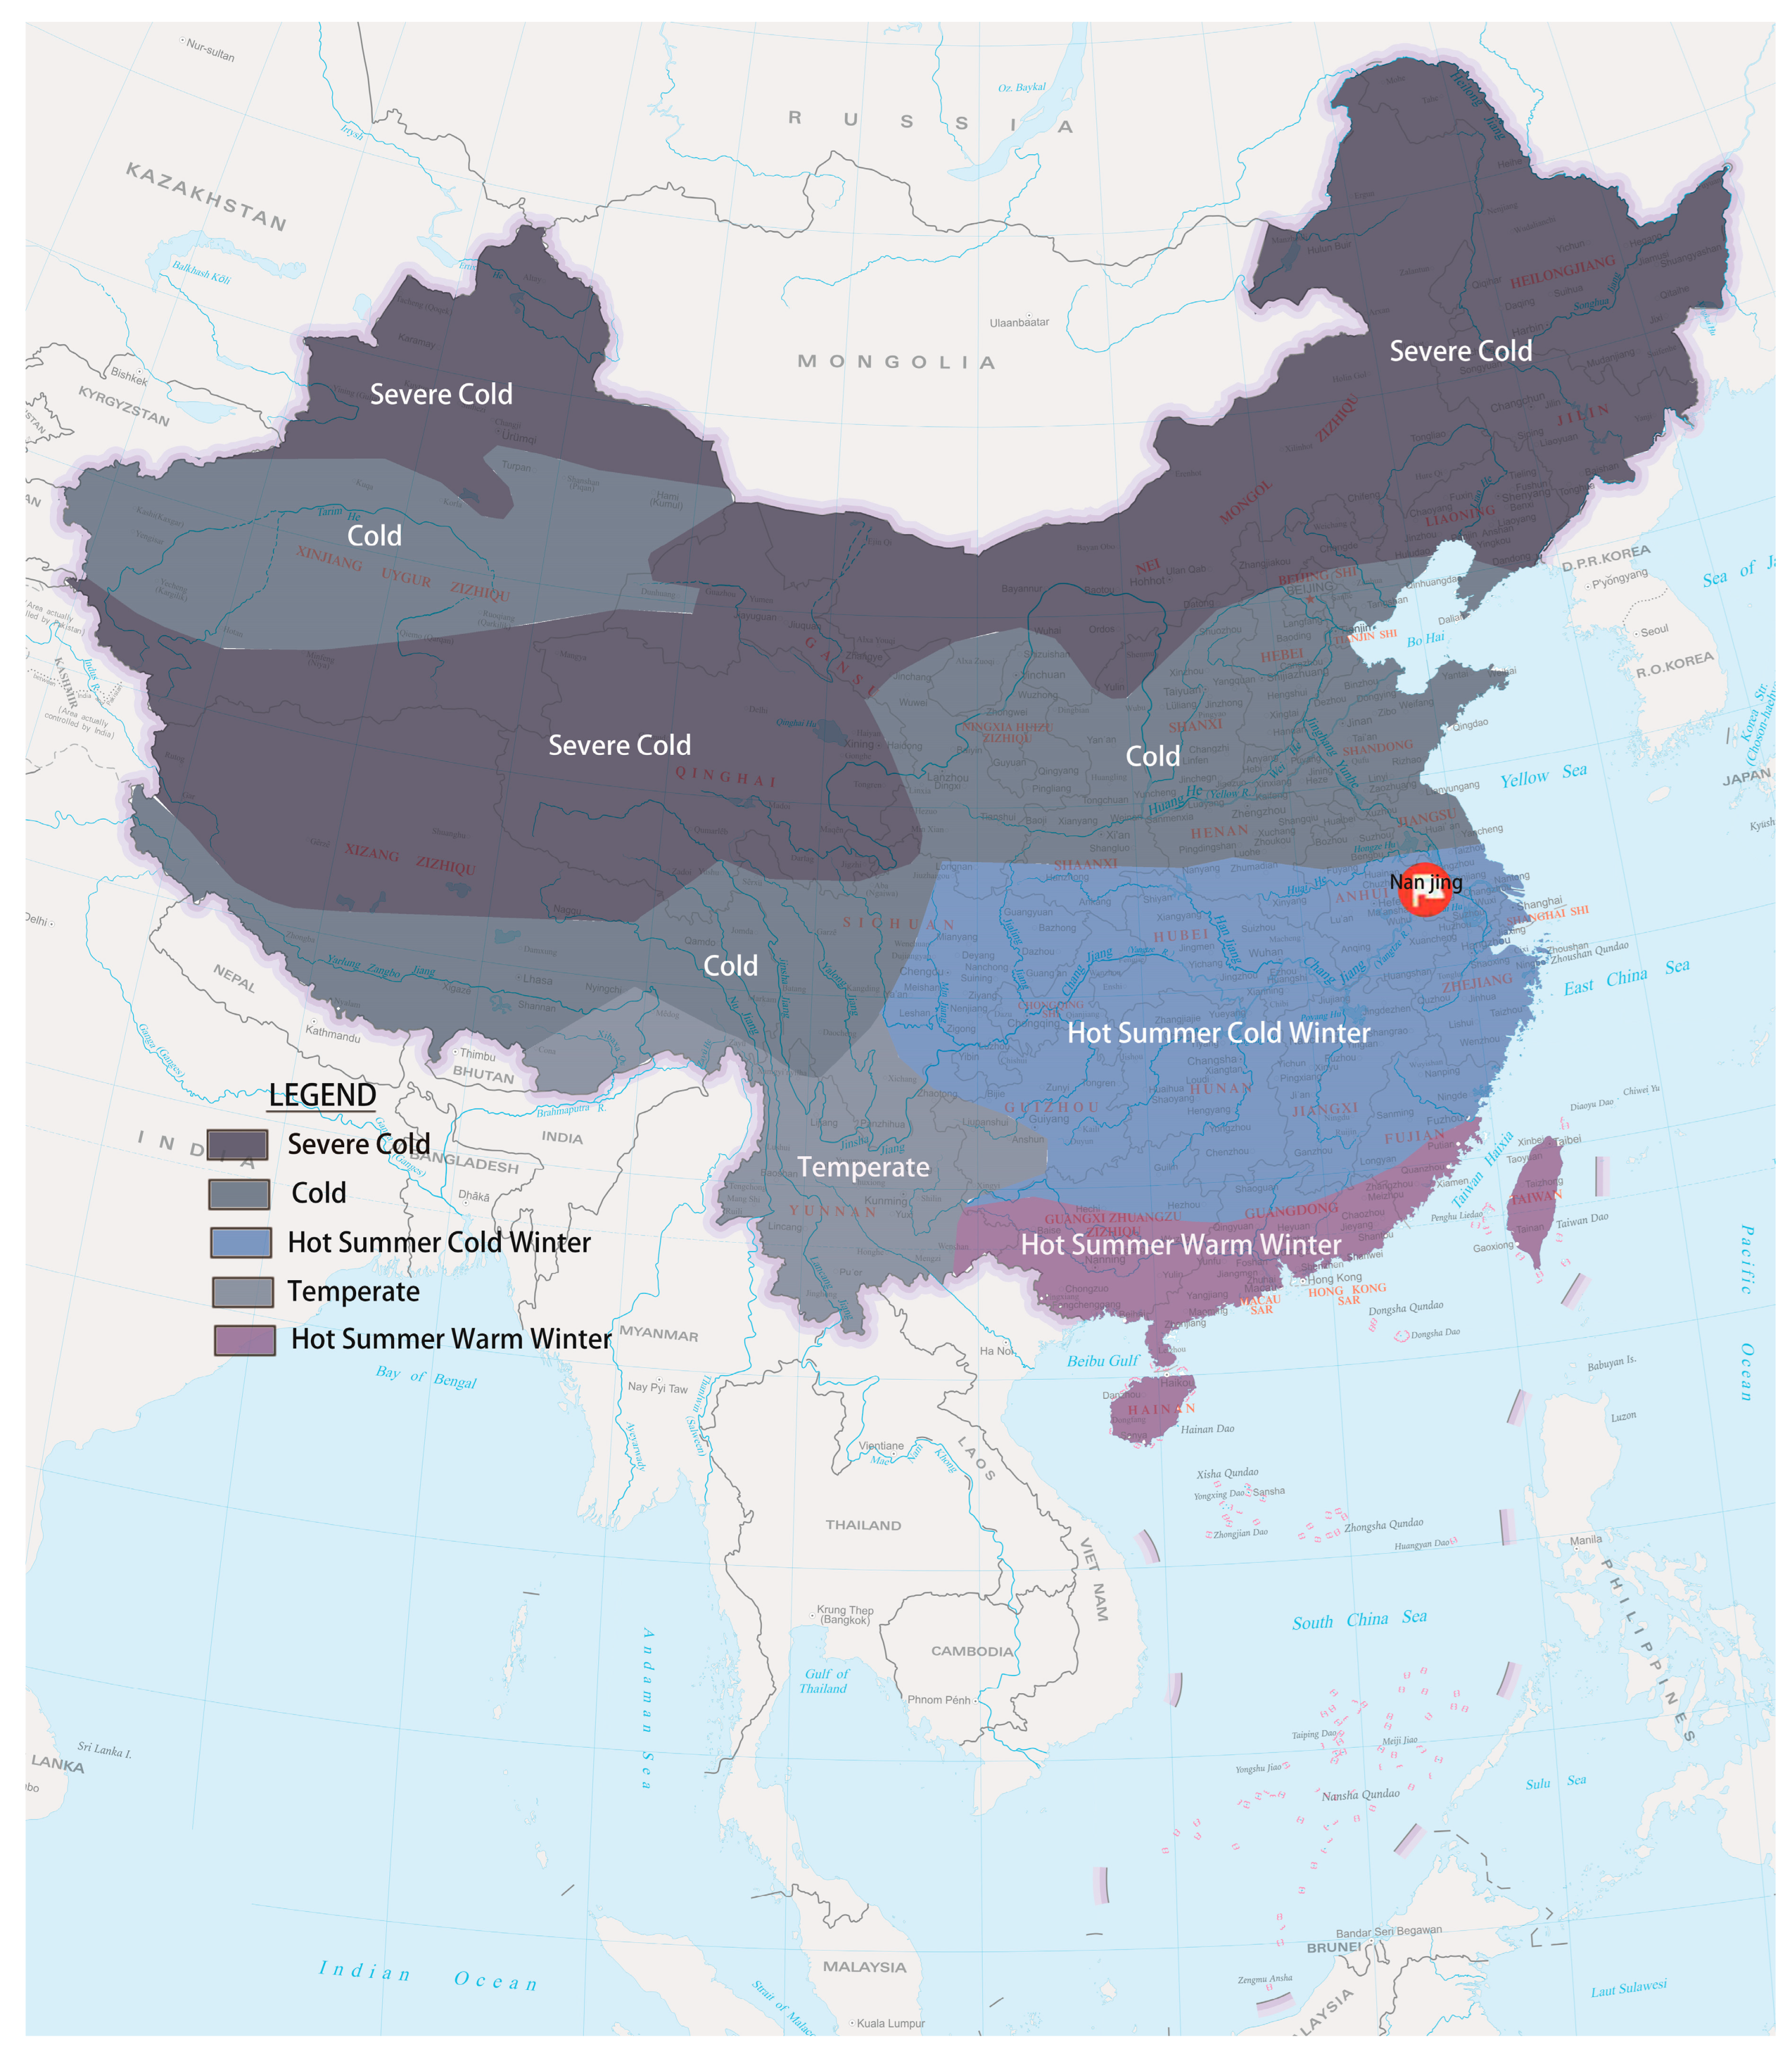
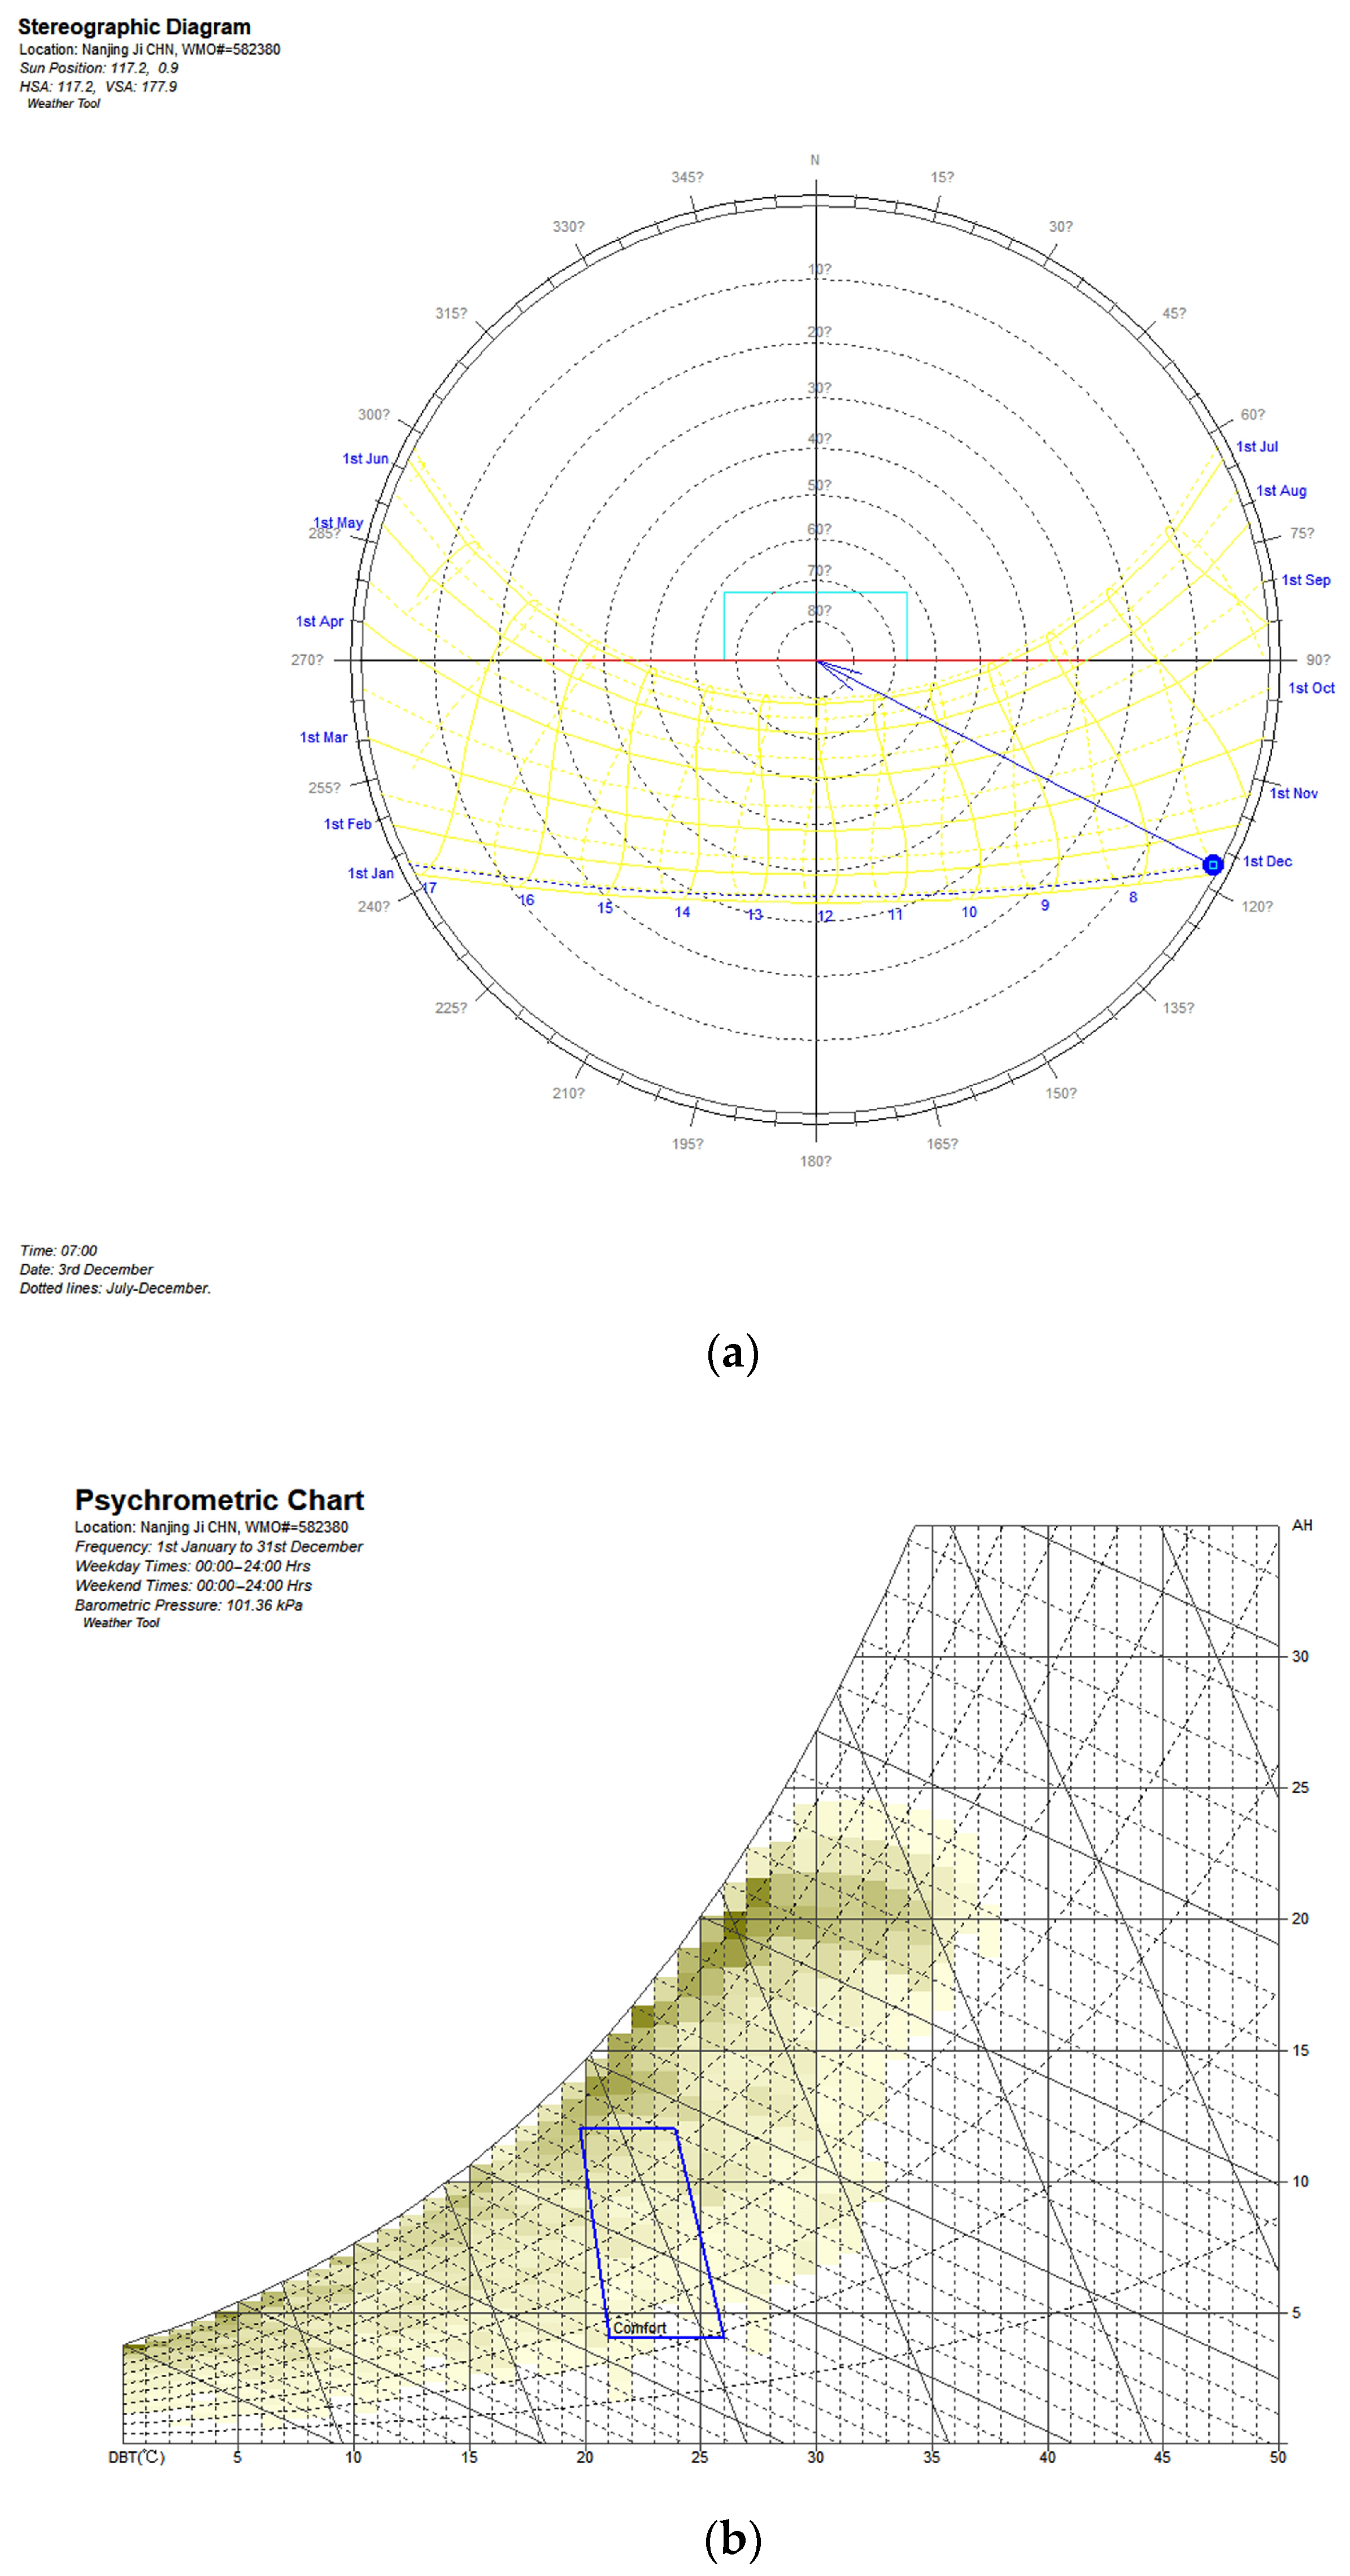
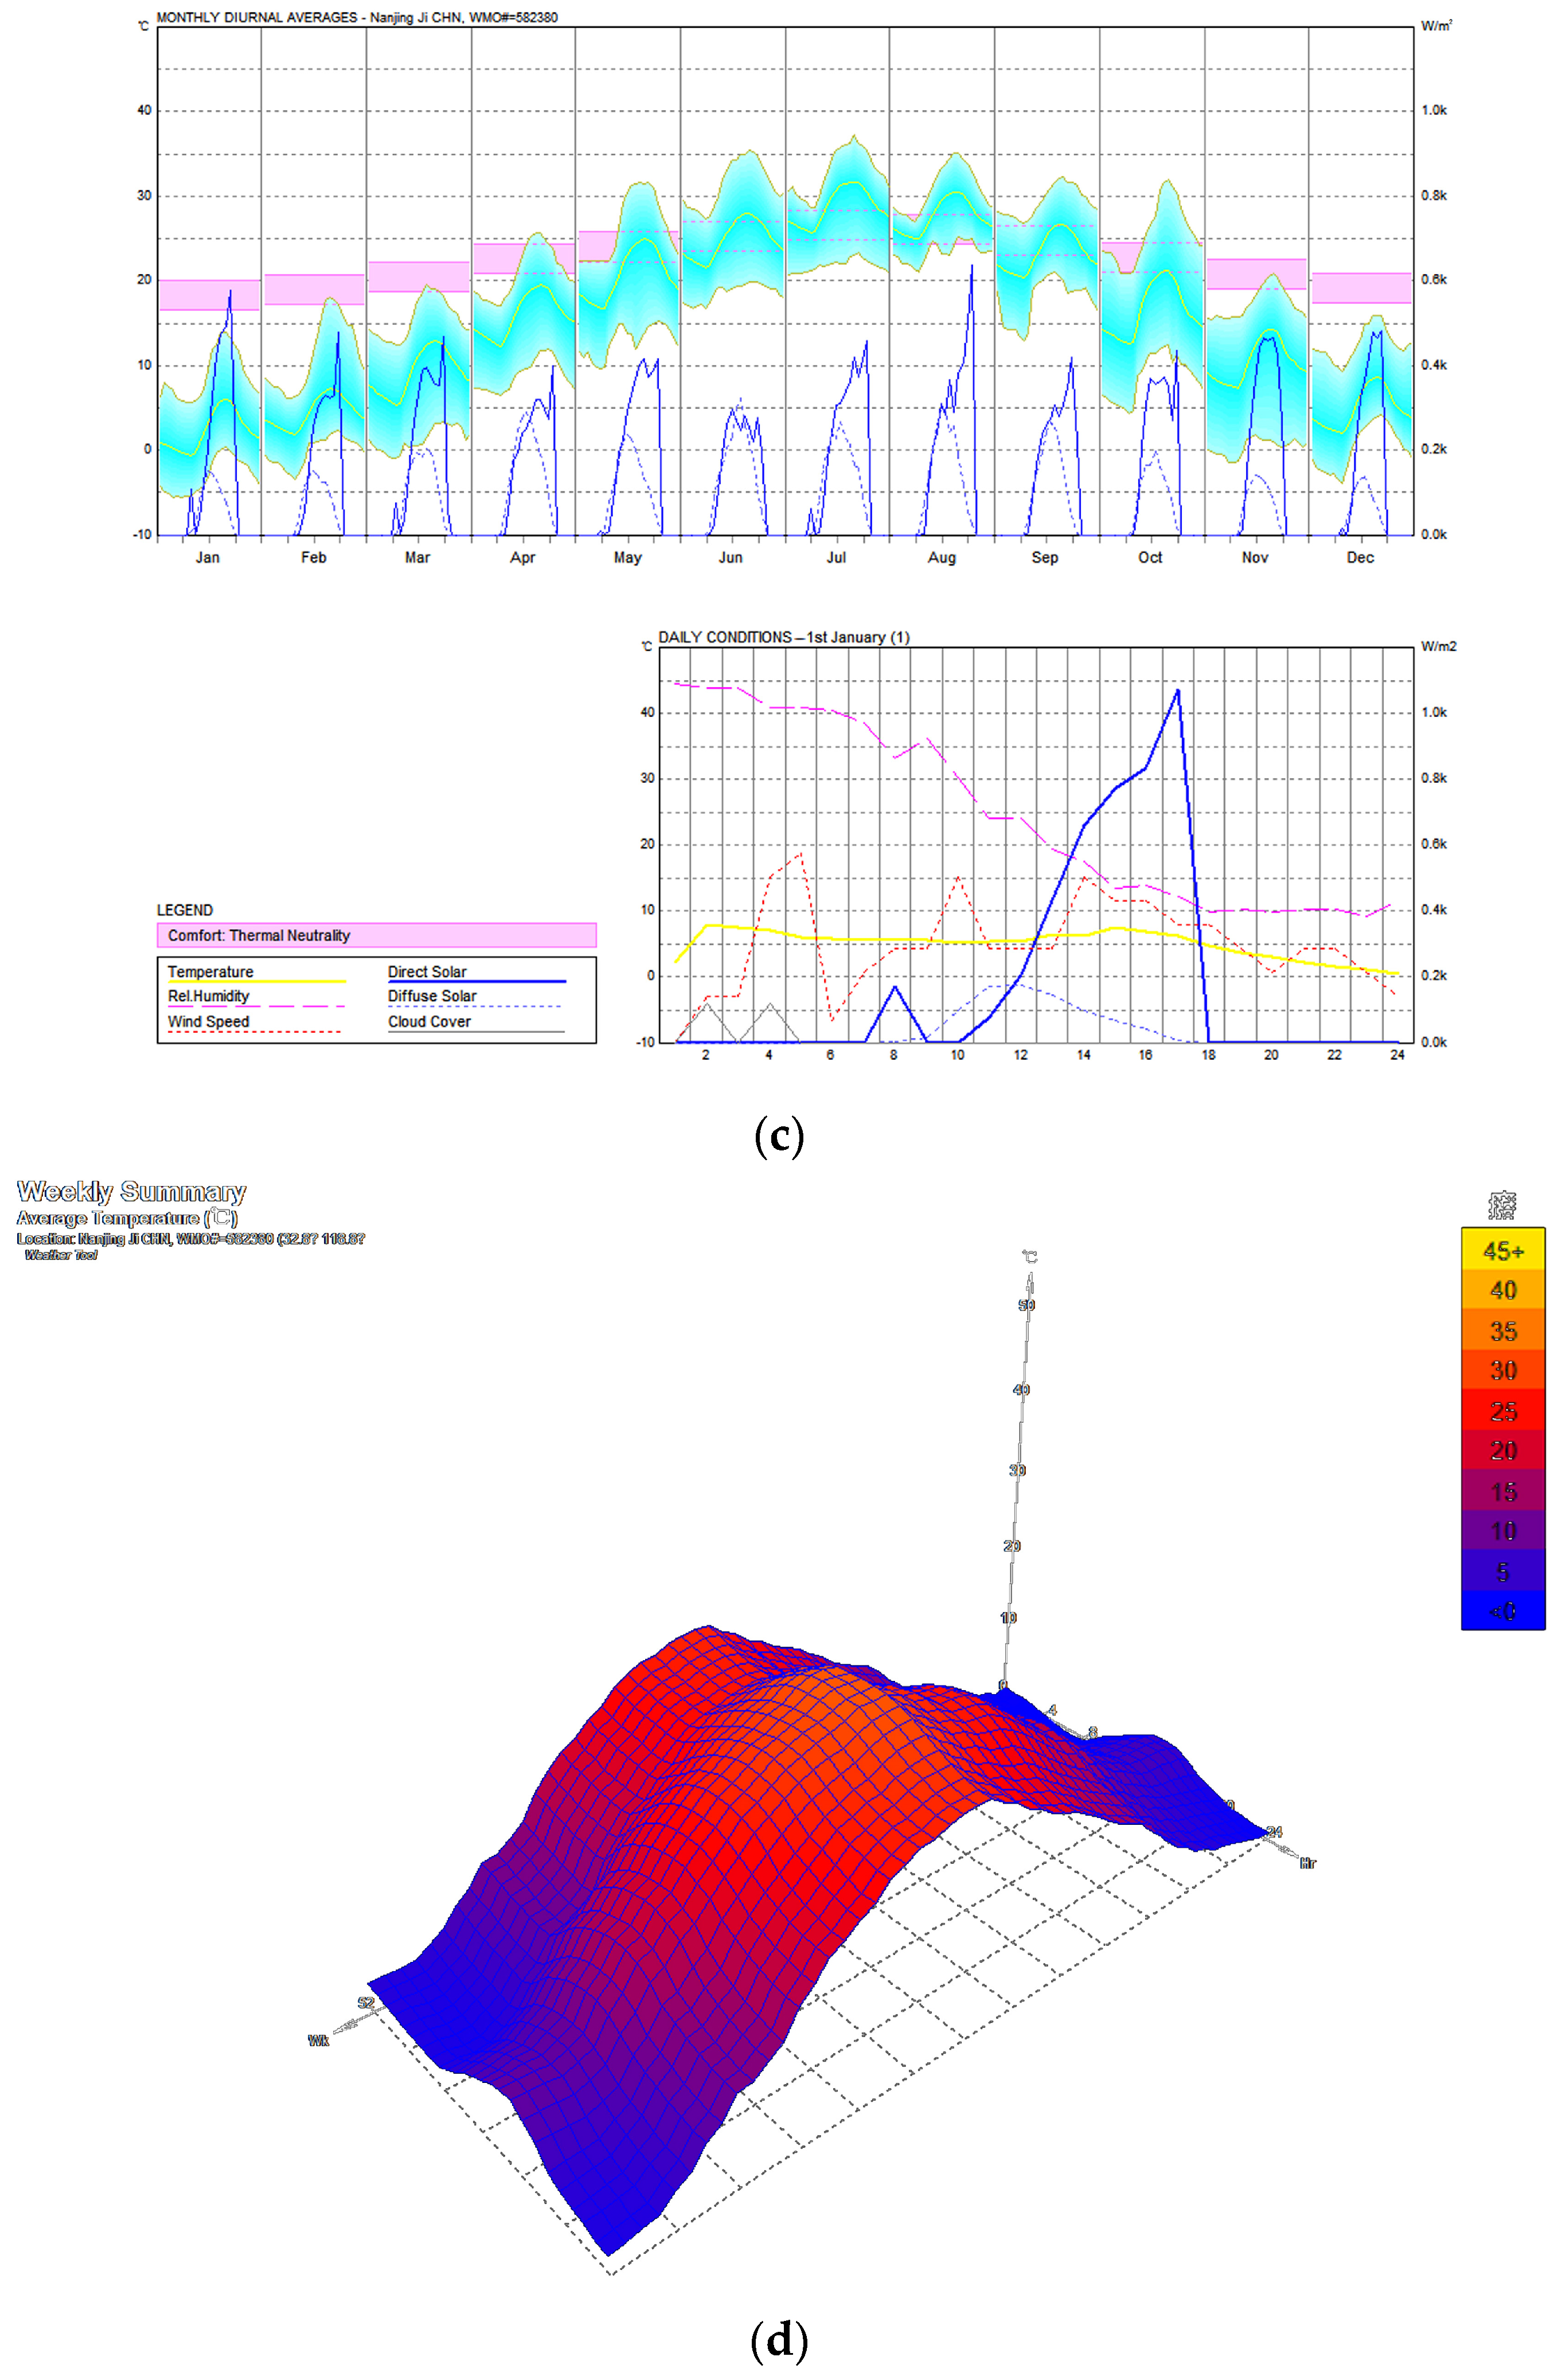
3.1. Overview of the Study Area

According to the standard of climatic regionalization for architecture, diverse climates are divided into five main zones in China, including the severe cold zone, cold zone, hot summer and cold winter zone, hot summer and warm winter zone, and temperate zone [46]. Among them, climate-adapted building design in the hot summer and cold winter zone faces the greatest conflicts and challenges because of the region’s hot and humid summers, cold and wet winters, high precipitation, high air humidity, and high average annual temperatures leading to a conflicting heat–light balance and a balance between insulation and openness throughout the year [47].
According to the statistics of the sixth national sports stadia survey, there are 1093 large-scale sports stadia in China, of which 300 are distributed in the hot summer and cold winter zone, accounting for 27.4% of the total number of sports stadia in the country, showing a clear trend of “dense in the east and sparse in the west” and “more in the south and fewer in the north” (Figure 2). Therefore, the hot summer and cold winter zone is the most active region for sports stadia construction. As economic growth in the hot summer and cold winter zone increases, so do people’s expectations of thermal comfort and the energy consumption of sports stadia.
Therefore, Nanjing (118.76 E, 32.04 N), a typical large city located in the hot summer and cold winter zone of China (Figure 3), was chosen for the simulation study. Nanjing has abundant rainfall; annual temperature extremes range from a maximum of over 40 °C to a minimum of below 0 °C [48] and there is a clear wind shift between winter and summer, with northeasterly winds predominating in winter, easterly and southeasterly winds in summer, southeasterly and easterly winds in spring, and northeasterly winds in autumn, with some typhoon weather.

3.2. Architectural Examples and Abstract Models

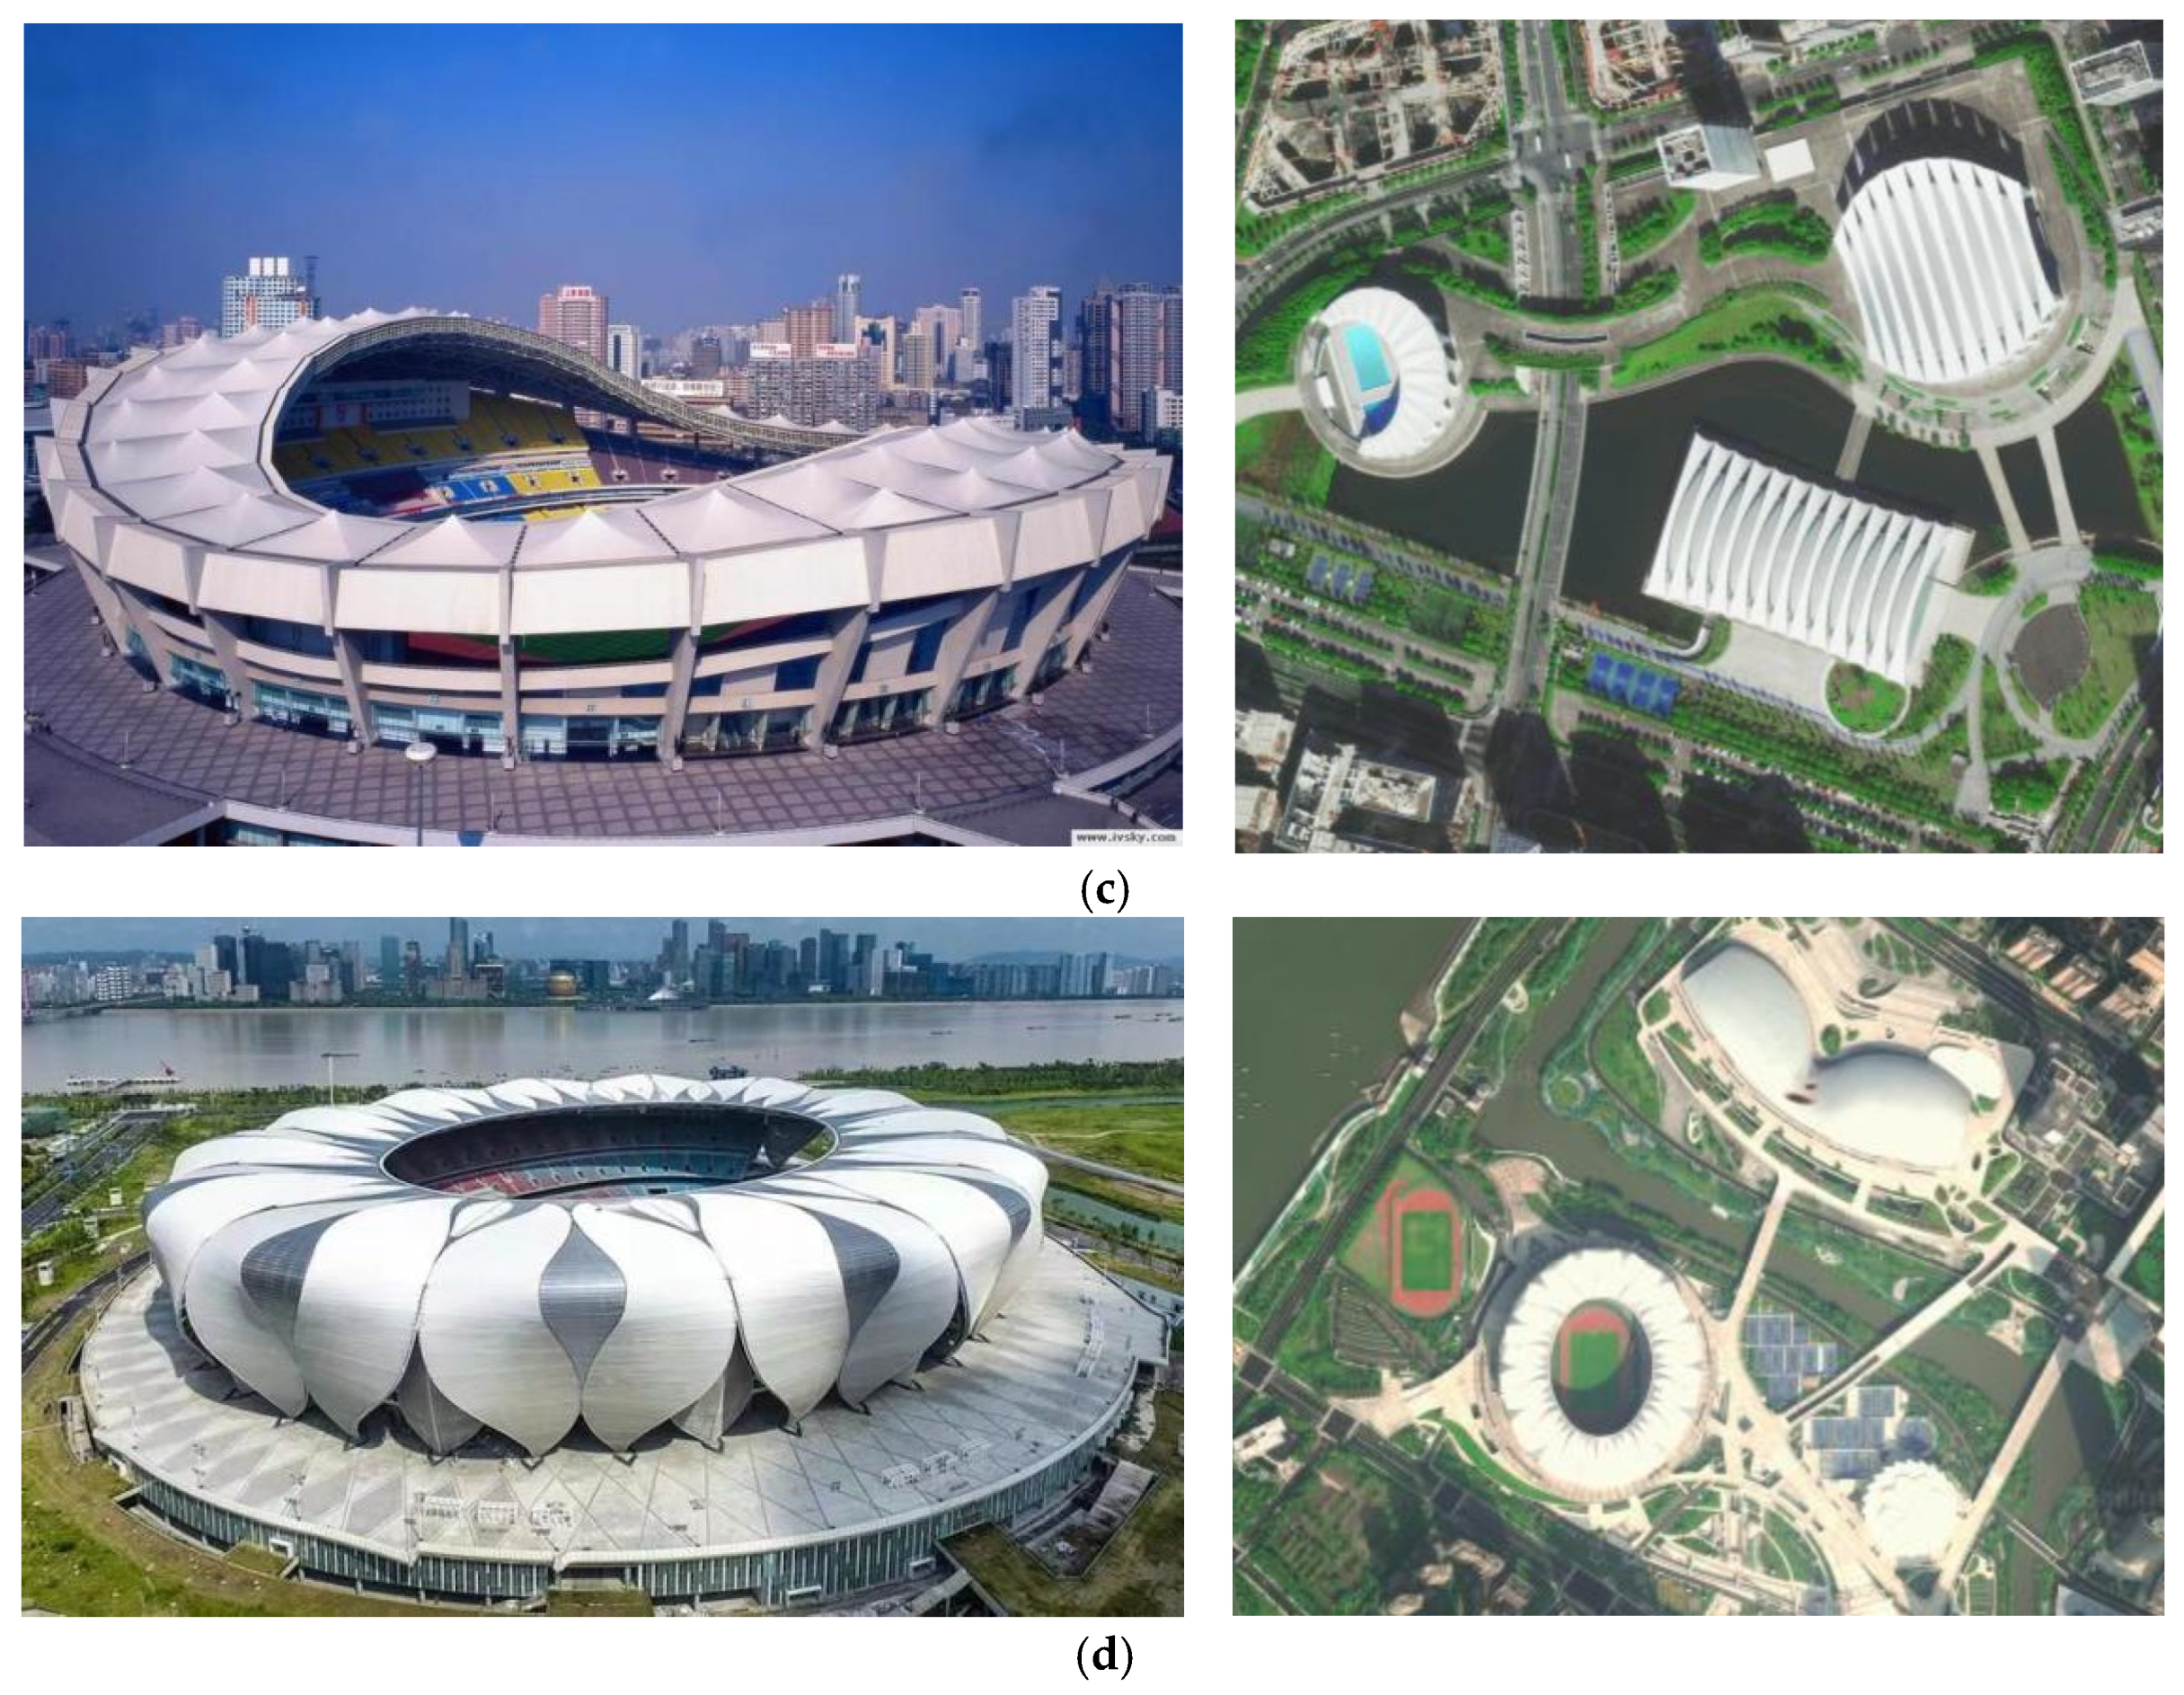
3.2.1. Selection of Architectural Examples

With a number of major sporting events taking place, a range of sports stadia have been built throughout the hot summer and cold winter zone, including sports centers, stadiums, gymnasiums, and swimming pools, with a wide range of types, sizes, and functions. The existence of these buildings provides excellent conditions for the study of climate design. In this study, the following representative sports centers and stadiums that have hosted major events in the hot summer and cold winter zone of China were selected as prototypes for the abstract study: Nanjing Olympic Sports Center (Figure 4a), Wuhan Sports Center (Figure 4b), Shanghai Stadium (Figure 4c), and Hangzhou Olympic Sports Center (Figure 4d).
The selected architectural examples are geographically located in Nanjing, Shanghai, Hangzhou, and Wuhan in the hot summer and cold winter zone. The stadia cover the classical shapes of sports stadiums and have strong typicality and orientation, which can comprehensively reflect the shape profile of sports stadia in the hot summer and cold winter zone.

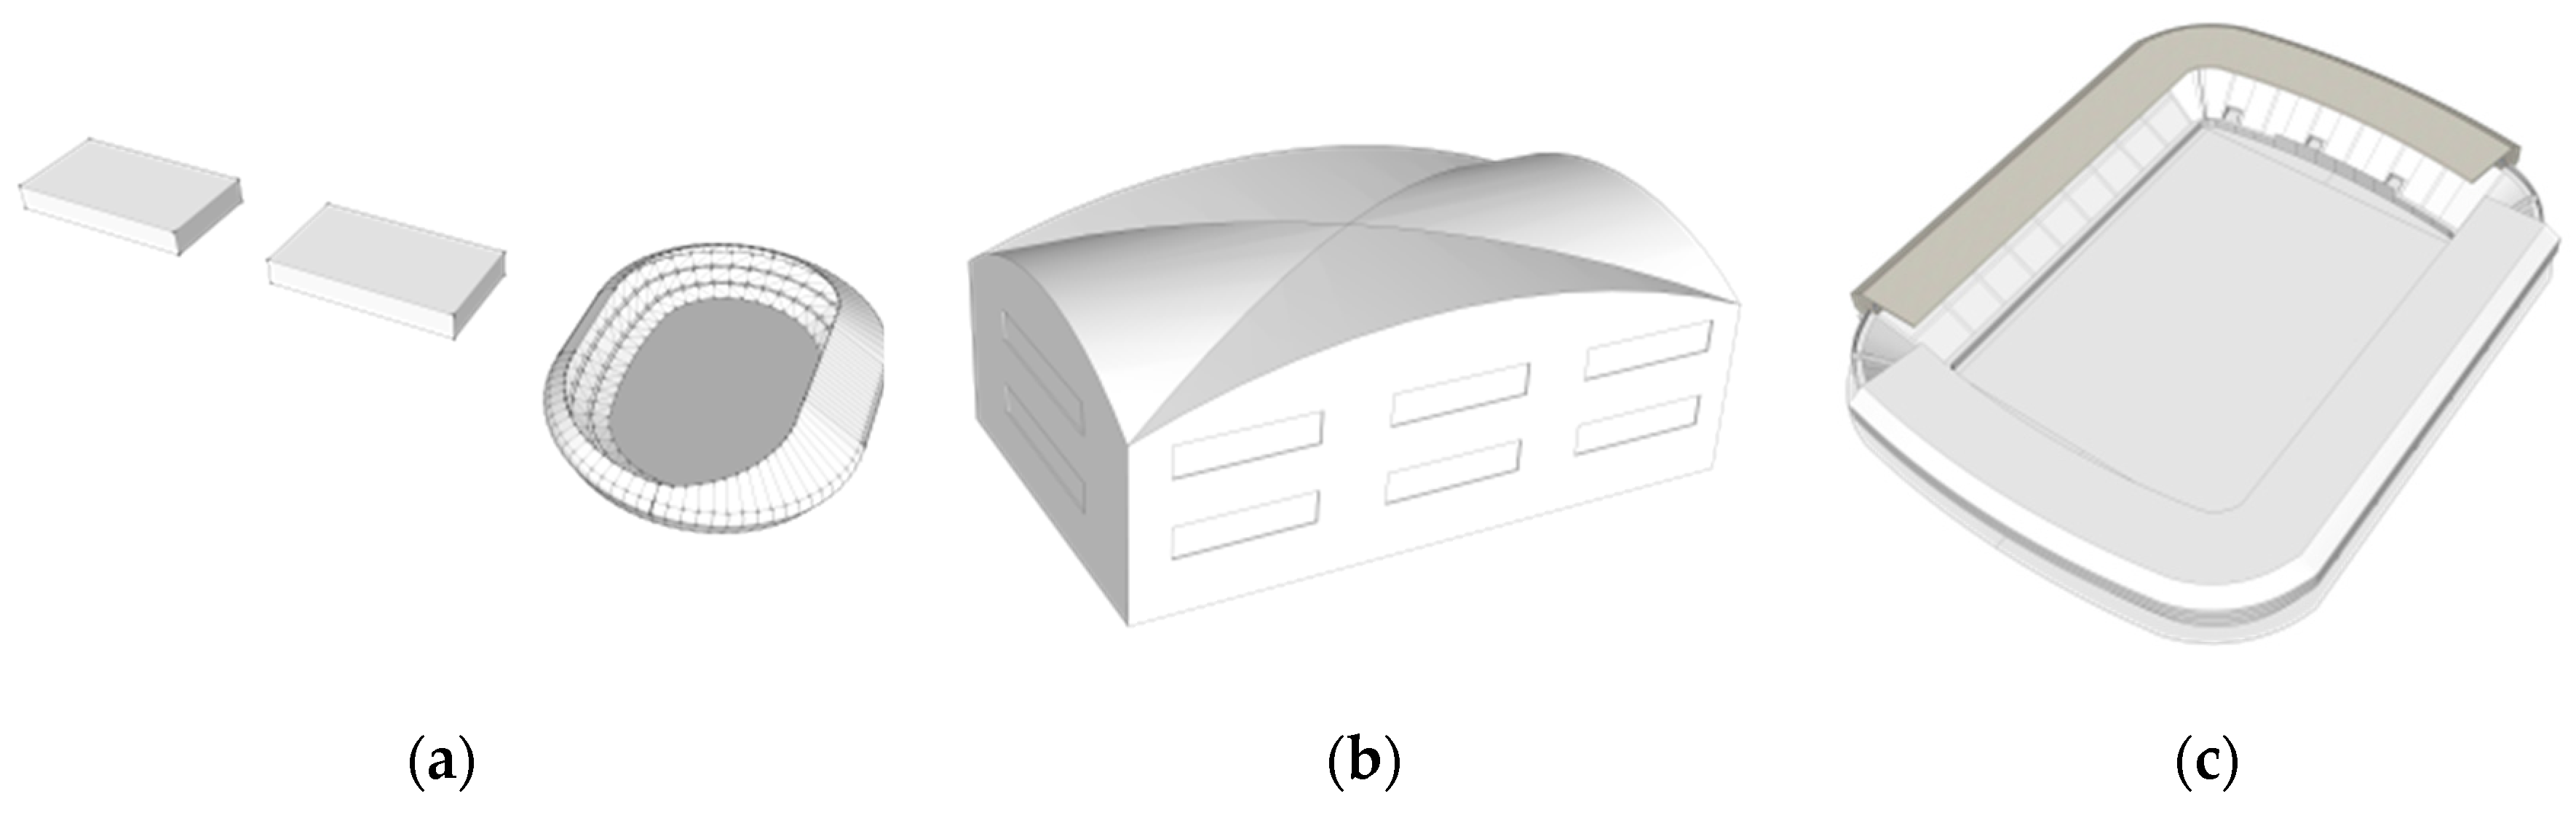
3.2.2. Construction of Abstract Models

Quantitative research using abstract models of sports stadia can better circumvent some of the problems that exist in simulation research using architectural examples, such as the research object being too dissimilar in volume, the influencing elements being too complex, and the simulation parameters being too uncontrollable. The main focus of this study is on the coordination with the layout, shape, and the structure of the sports stadia. The abstract models of Nanjing Olympic Sports Center, Wuhan Sports Center, Shanghai Stadium, and Hangzhou Olympic Sports Center were used as the basis and a set of control models were generated by controlling the variables to be studied. For example, the layout is based on the same layout as the Wuhan Sports Center, while the building shape is extracted from the Shanghai Stadium and the building structure is generated from the Nanjing Olympic Sports Center. The specific abstract model is shown in Figure 5.

3.3. Tools for Simulation Experiments

3.3.1. Software Introduction

The wind environment of the building layout and building form is simulated using Phoenics. In accordance with the boundary conditions set, quantitative wind data such as wind speed and wind direction are calculated for each location in the building space in the undisturbed steady state. Tecplot 2021 software is used to select points in the wind environment and measure the wind speed at a single point. The combination of Phoenics 2016 and Tecplot 2021 allows for more accurate measurement of the wind speed in the field under different conditions. Using Ecotect 2011 analysis, five parameters—heat transfer coefficient, access coefficient, solar absorption coefficient, decay time, and delay time—are set to simulate the thermal radiation conditions of each building form and to measure the radiant heat increment outside the building under different conditions.

3.3.2. Basic Meteorological Parameter Setting

For the simulation of built environment spaces, the accurate setting of initial conditions is fundamental to the success of the simulation. Meteorological conditions are particularly important for the accuracy of the simulation results as they are an important initial condition. Although the building examples in this study are located in different parts of China’s hot summer and cold winter zone, the climatic conditions are generally very similar, despite slight differences. Also, the aim of this study is to investigate climate adaptation strategies for sports stadia in Nanjing. Therefore, all the simulations in this study choose uniform meteorological data as the initial condition setting, i.e., the meteorological data of Nanjing city is used to start the simulation study in order to facilitate a uniform standard cross-sectional comparison and to avoid errors arising from different meteorological parameters (as shown in Figure 6). In this paper, the weather tool is used to obtain the meteorological data of Nanjing and the data time is obtained as the average wind speed and sunshine radiation between 08:00 and 20:00 during the summer solstice in Nanjing in 2022.

4. Result

4.1. Simulation Analysis of Building Layout

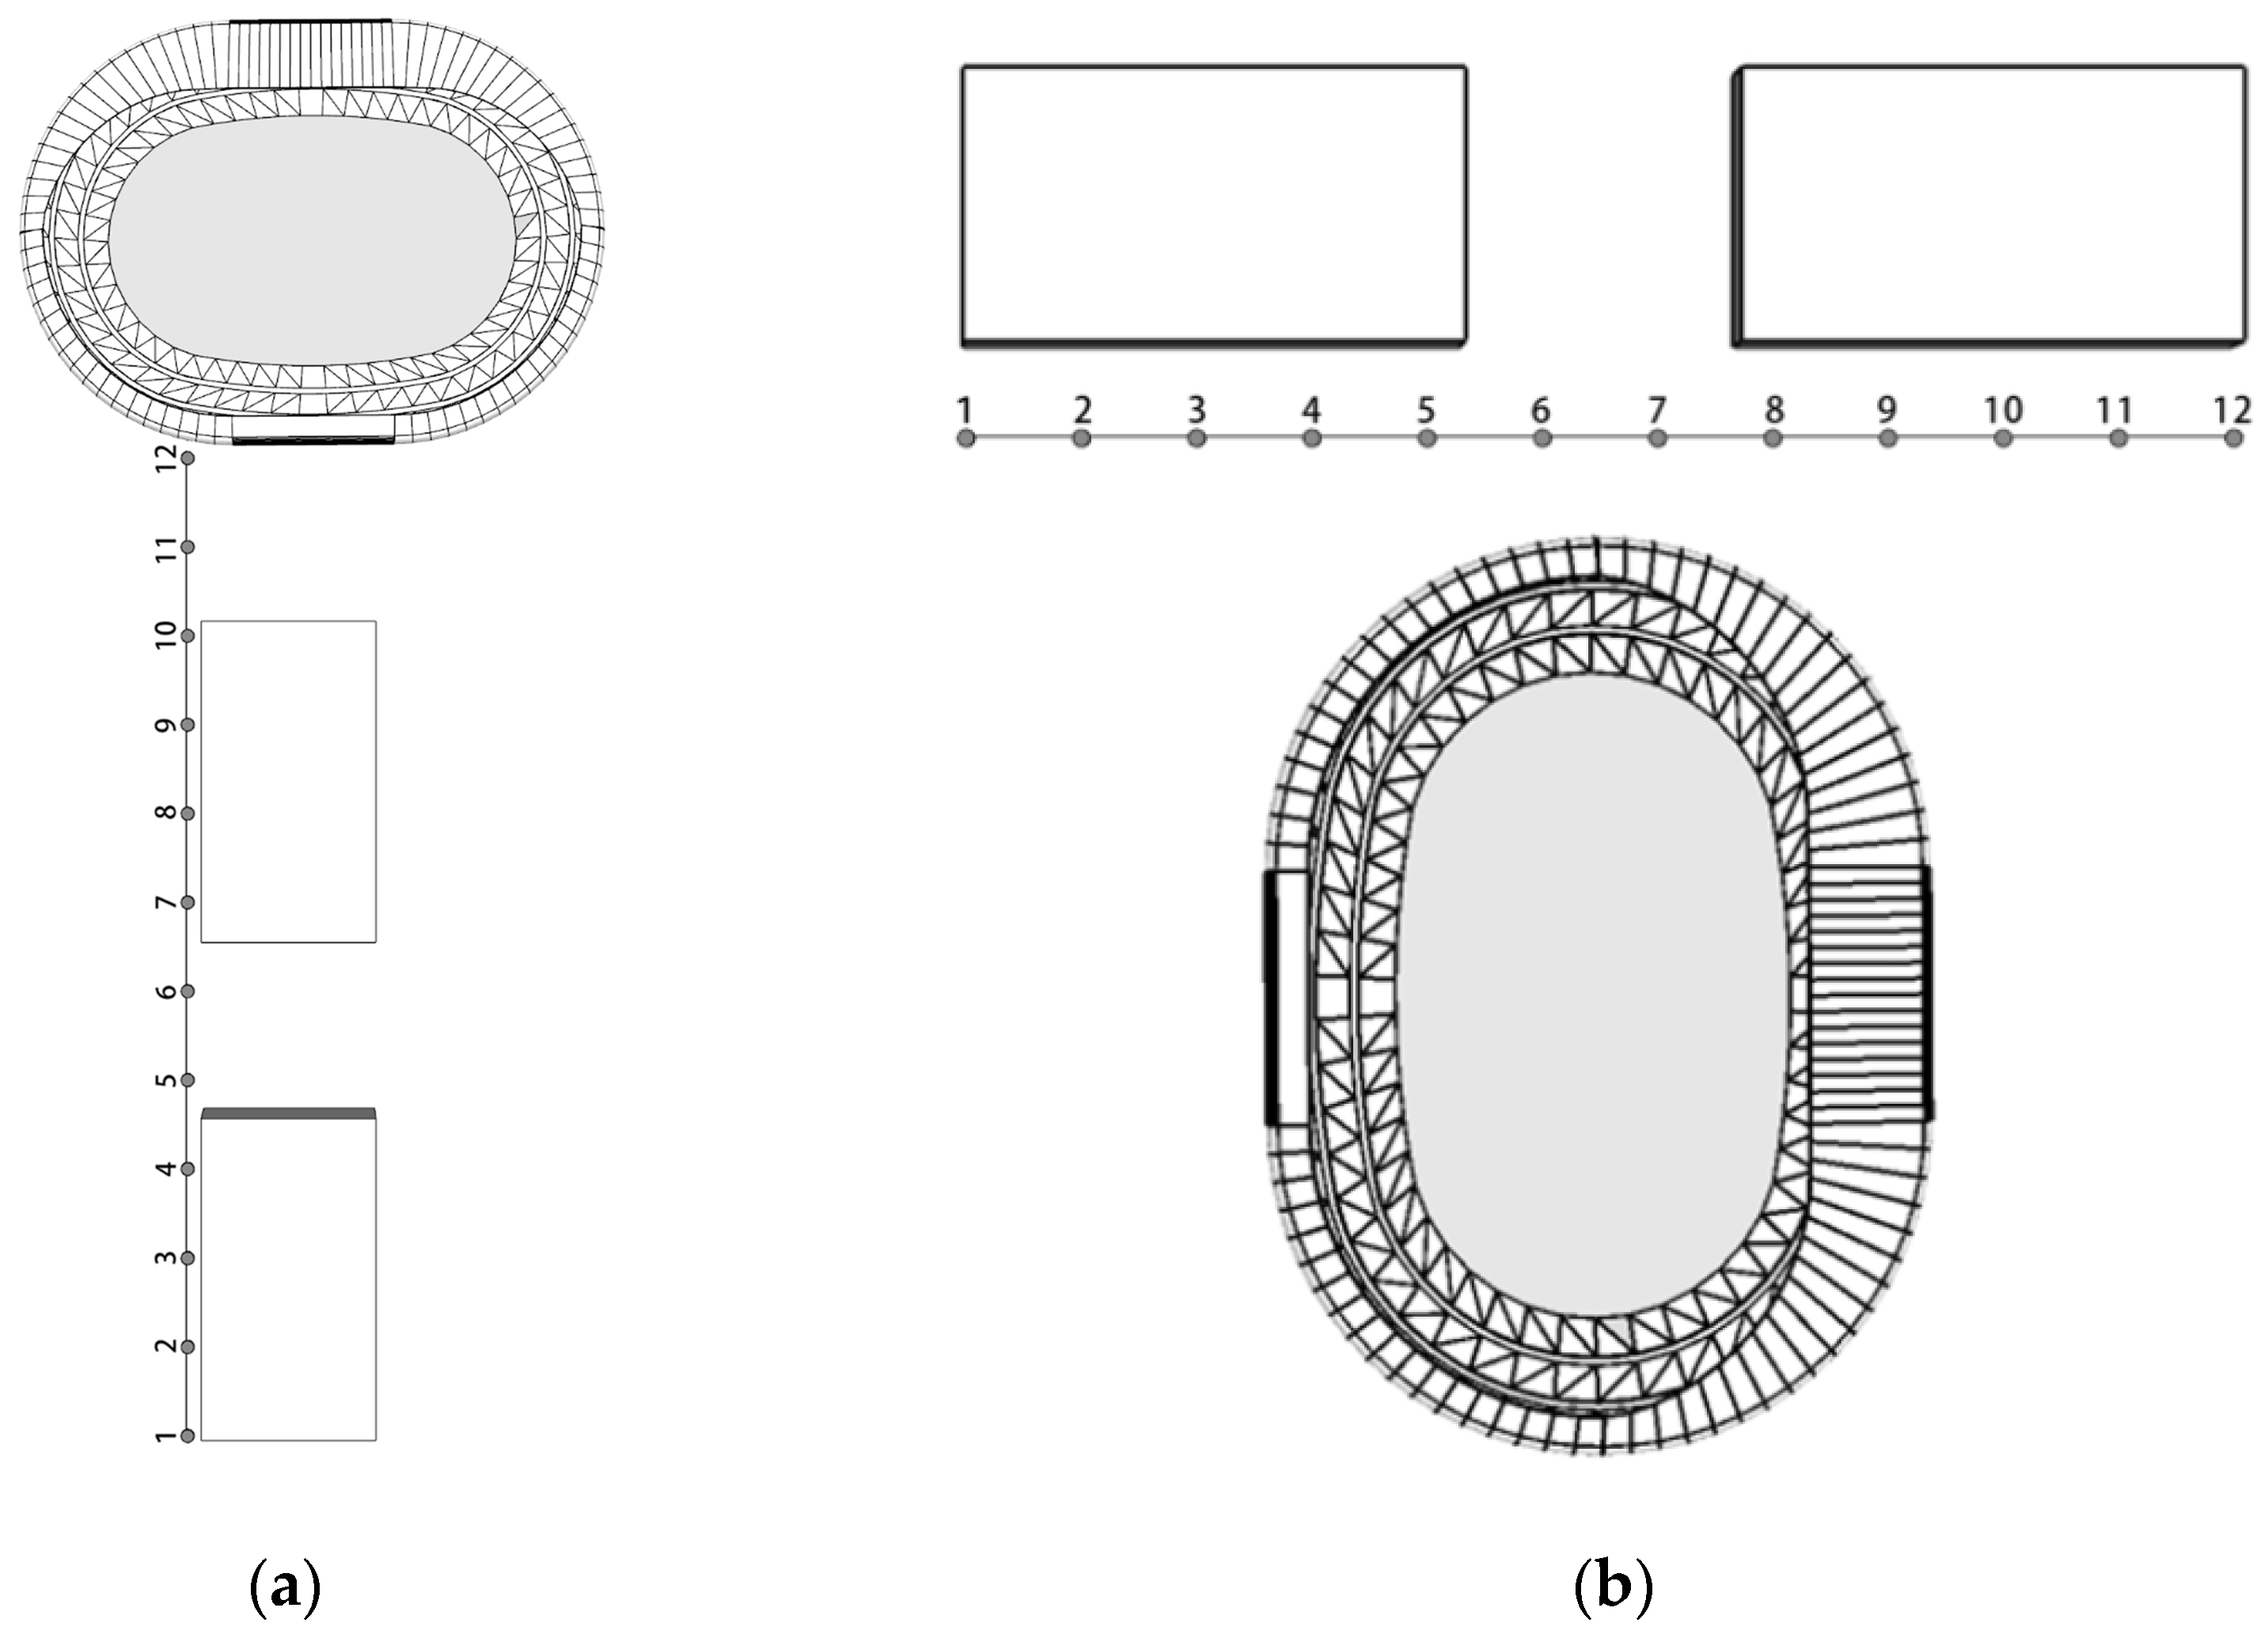
4.1.1. Construction of Layout Abstract Model

Among the selected examples of sports stadia, the gymnasiums are rich in form, with a great variety of shapes, styles, and volumes. The richness of the architectural forms is derived from the basic plan forms. In the architectural examples, the planned form of the stadiums is predominantly oval and the planned form of the gymnasium is predominantly rectangular. Therefore, the shape of the stadium abstract model is regarded as an oval and that of the gymnasium abstract model is determined as a rectangle. According to the analysis of the actual case of the sports center, it can be found that the layout of the sports center is mostly in the form of a one-line layout and a triangle layout. Therefore, in the abstract simulation of the overall planning layout, the abstract model is constructed for these two categories. The dimensions of the oval stadium are 270 × 170 × 32 m with a height of 32 m, while the dimensions of the gymnasium are 180 × 100 × 25 m.
As can be seen from the architectural examples, there are multiple ways of orienting the whole of both layout forms. In order to clarify the impact of the change in orientation of the general layout on the external environment, the simulation experiment chooses eight directions, including east, south, west, north, southeast, northeast, southwest, and northwest, as orientation variables for specific assignments. Among them, the direction of the square opening of the triangle layout is the orientation direction of the layout as a whole; the direction of the stadium of the one-line layout is the orientation direction. The final abstract model is shown in Figure 7.

4.1.2. Simulation Condition Setting of Layout Abstract Model

For the overall planning layout, the 3D heat flow CFD Phoenics 2016 software is used to simulate the outdoor airflow velocity, atmospheric pressure, and wind profile index in order to quantify the degree of impact of different layout strategies on the environment of the arena area. In the specific simulation process, typical climate data of Nanjing city throughout the year are selected as the atmospheric boundary conditions and wind speed data are set with an initial wind speed of 6.2 m/s and a wind direction of 45° (northeast). The model grid is set at 130 × 130 × 30, the simulation time is 120 s, and the time interval is 0.1 s. The simulation analysis of the planning layout and climate environment uses the wind speed distribution map and the wind speed data at the sampling point as the measurement parameters. The sampling points are located on the symmetry axis of the site layout and are named in order of orientation. In this simulation study, we first carry out 20 sampling points, 12 sampling points, and 8 sampling points for simulation calculation comparison. From the results point of view, the analysis results of the 12 sampling points are better, that is, the data are clearer and do not cost a lot of computing power, so the one-line layout is set with 12 sampling points and the triangle layout is set up with 12 sampling points. The data of the sampling point can better reflect the wind environment of the stadium surrounding the square space and can intuitively show the square wind environment of the stadium under different climatic conditions. The specific locations of the sampling points are shown in Figure 8.

4.1.3. Simulation Results of Layout Abstract Model

(1)
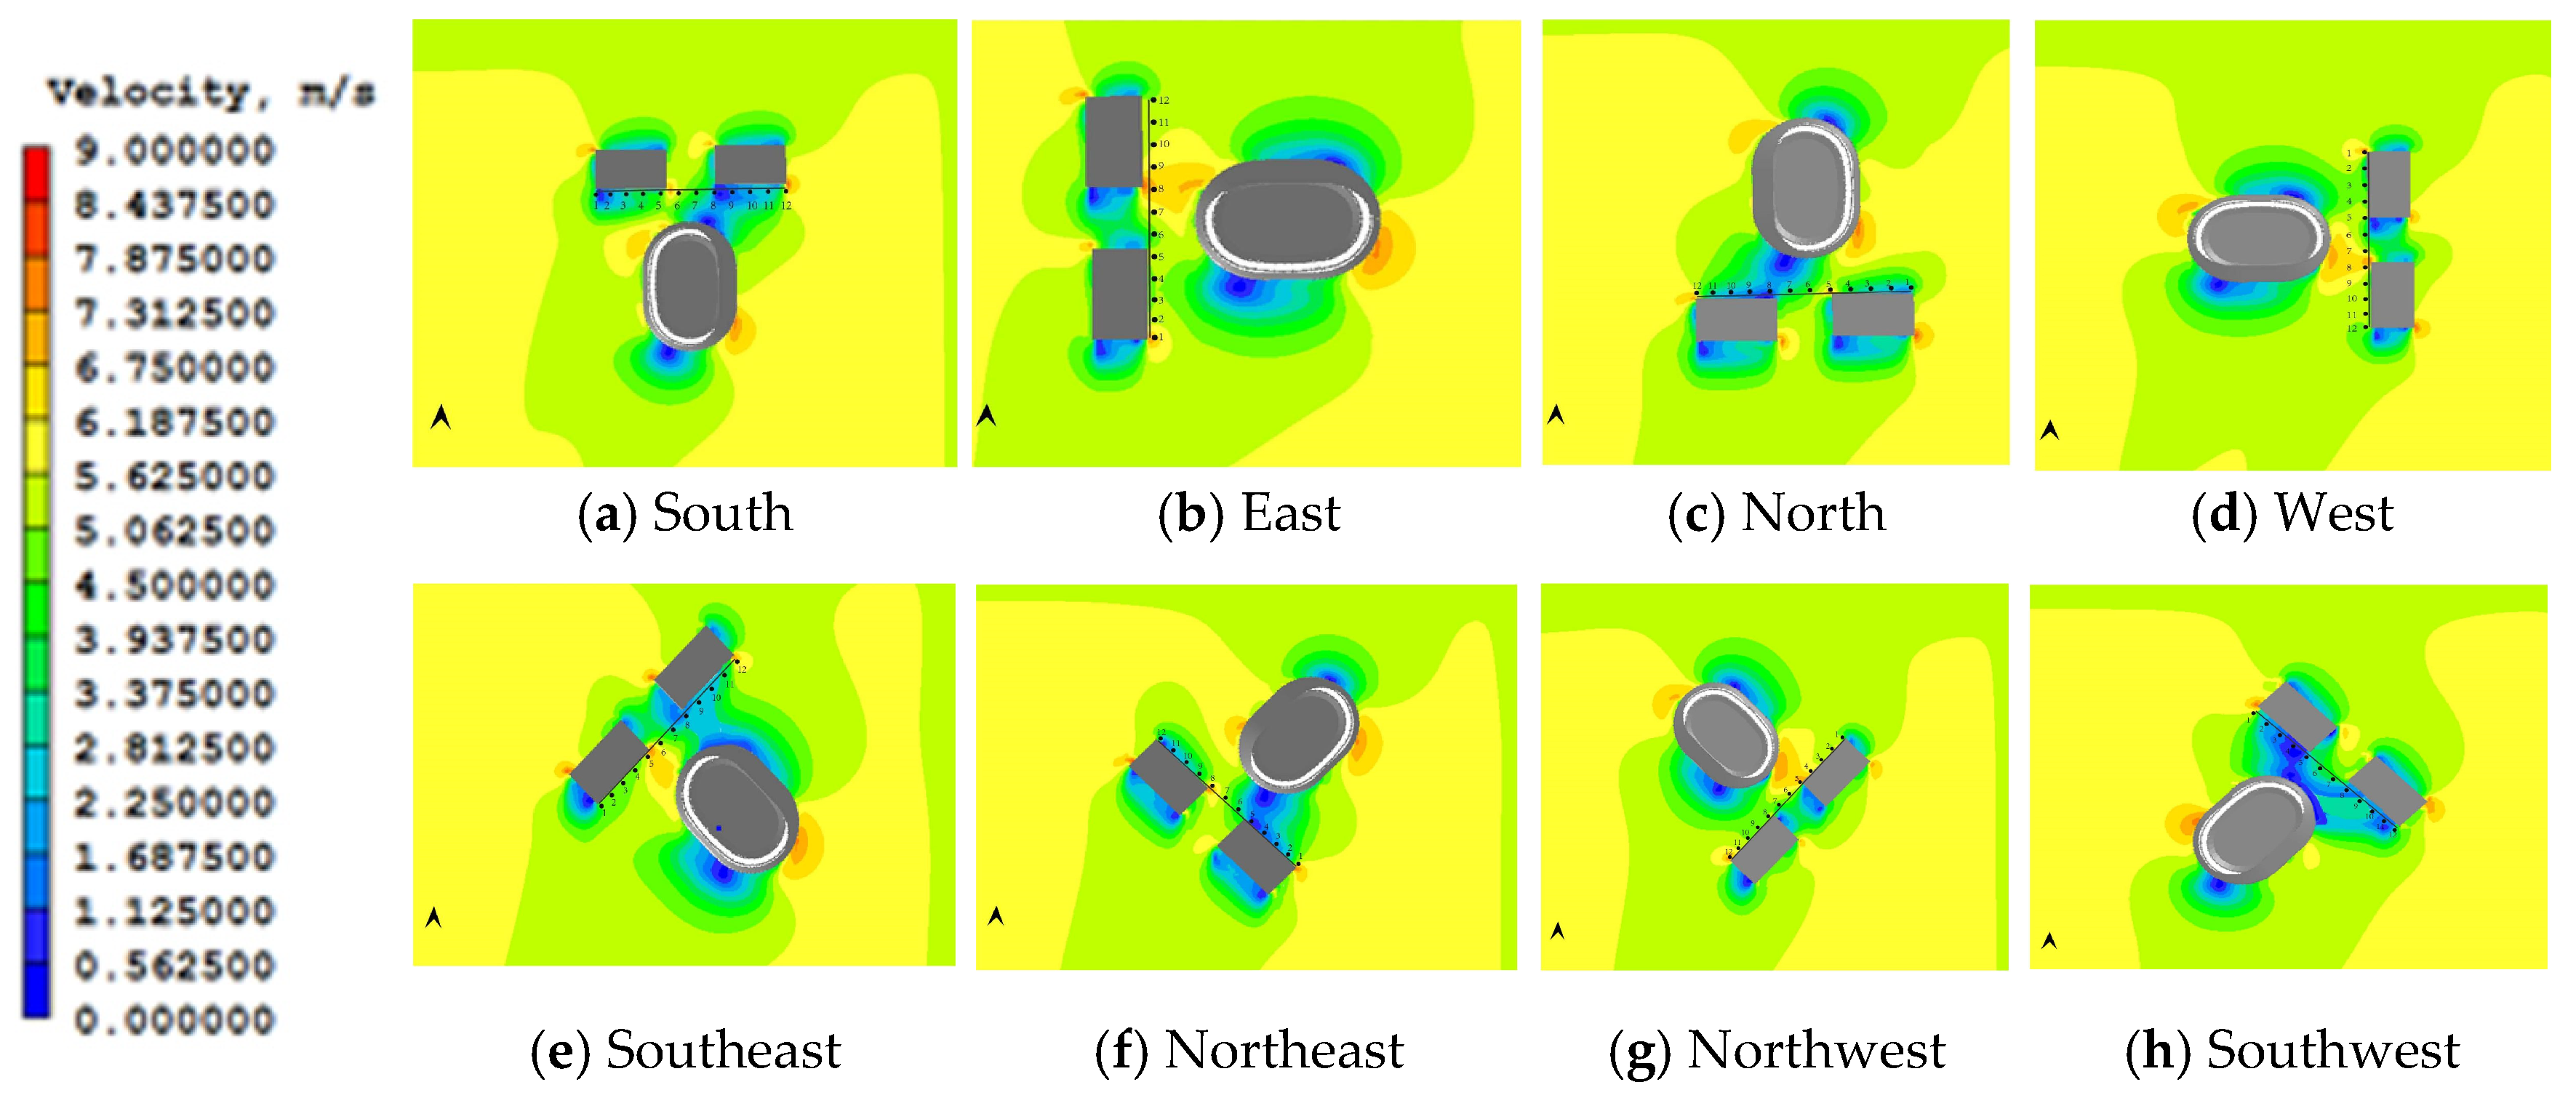
Orientation and wind speed distribution in a triangle layout
The Tecplot 2021 software is used to sample the wind speed at 12 points selected from the enclosed plaza of the sports center in a triangle layout and the data are summarized in Table 1.
As can be observed from the wind speed and distribution maps of the sampling points in Table 1, the average wind speed at each sampling point in the triangle layout of the square ranges from 1.8963 m/s to 4.7980 m/s, with an overall average value of 3.5594 m/s. The average wind speed in descending order of orientation is southwest > northeast > southeast > northwest > south > east > west > north. Under the wind speed condition of 6.2 m/s, wind environment simulations are carried out for eight different orientations of the triangle layout model, respectively, and the wind speed distribution is obtained (as shown in Figure 9).
It is found that, when the axis of the triangular layout is southwest, the wind speed in the field is the largest, at about 4.7980 m/s. Followed by the northeast direction, the wind speed is about 4.6715 m/s. The wind speed in the north direction is the lowest, at only 1.8963 m/s. It can be said that, from the demand for ventilation in the field, the wind environment of the oblique layout is better than the positive layout and the wind blowing from the side of the square can make the square space obtain the maximum wind speed. When the axis of the field is north, the average wind speed of the field is the smallest; it is found that this is due to the air inlet and outlet being blocked by the stadium. Therefore, when choosing the overall orientation of the triangle layout, if ventilation is the main choice, priority can be given to the site axis parallel to the prevailing wind direction and the square space can be opened on the windward side, so that the external wind environment can pass through the site with less obstruction.
(2)
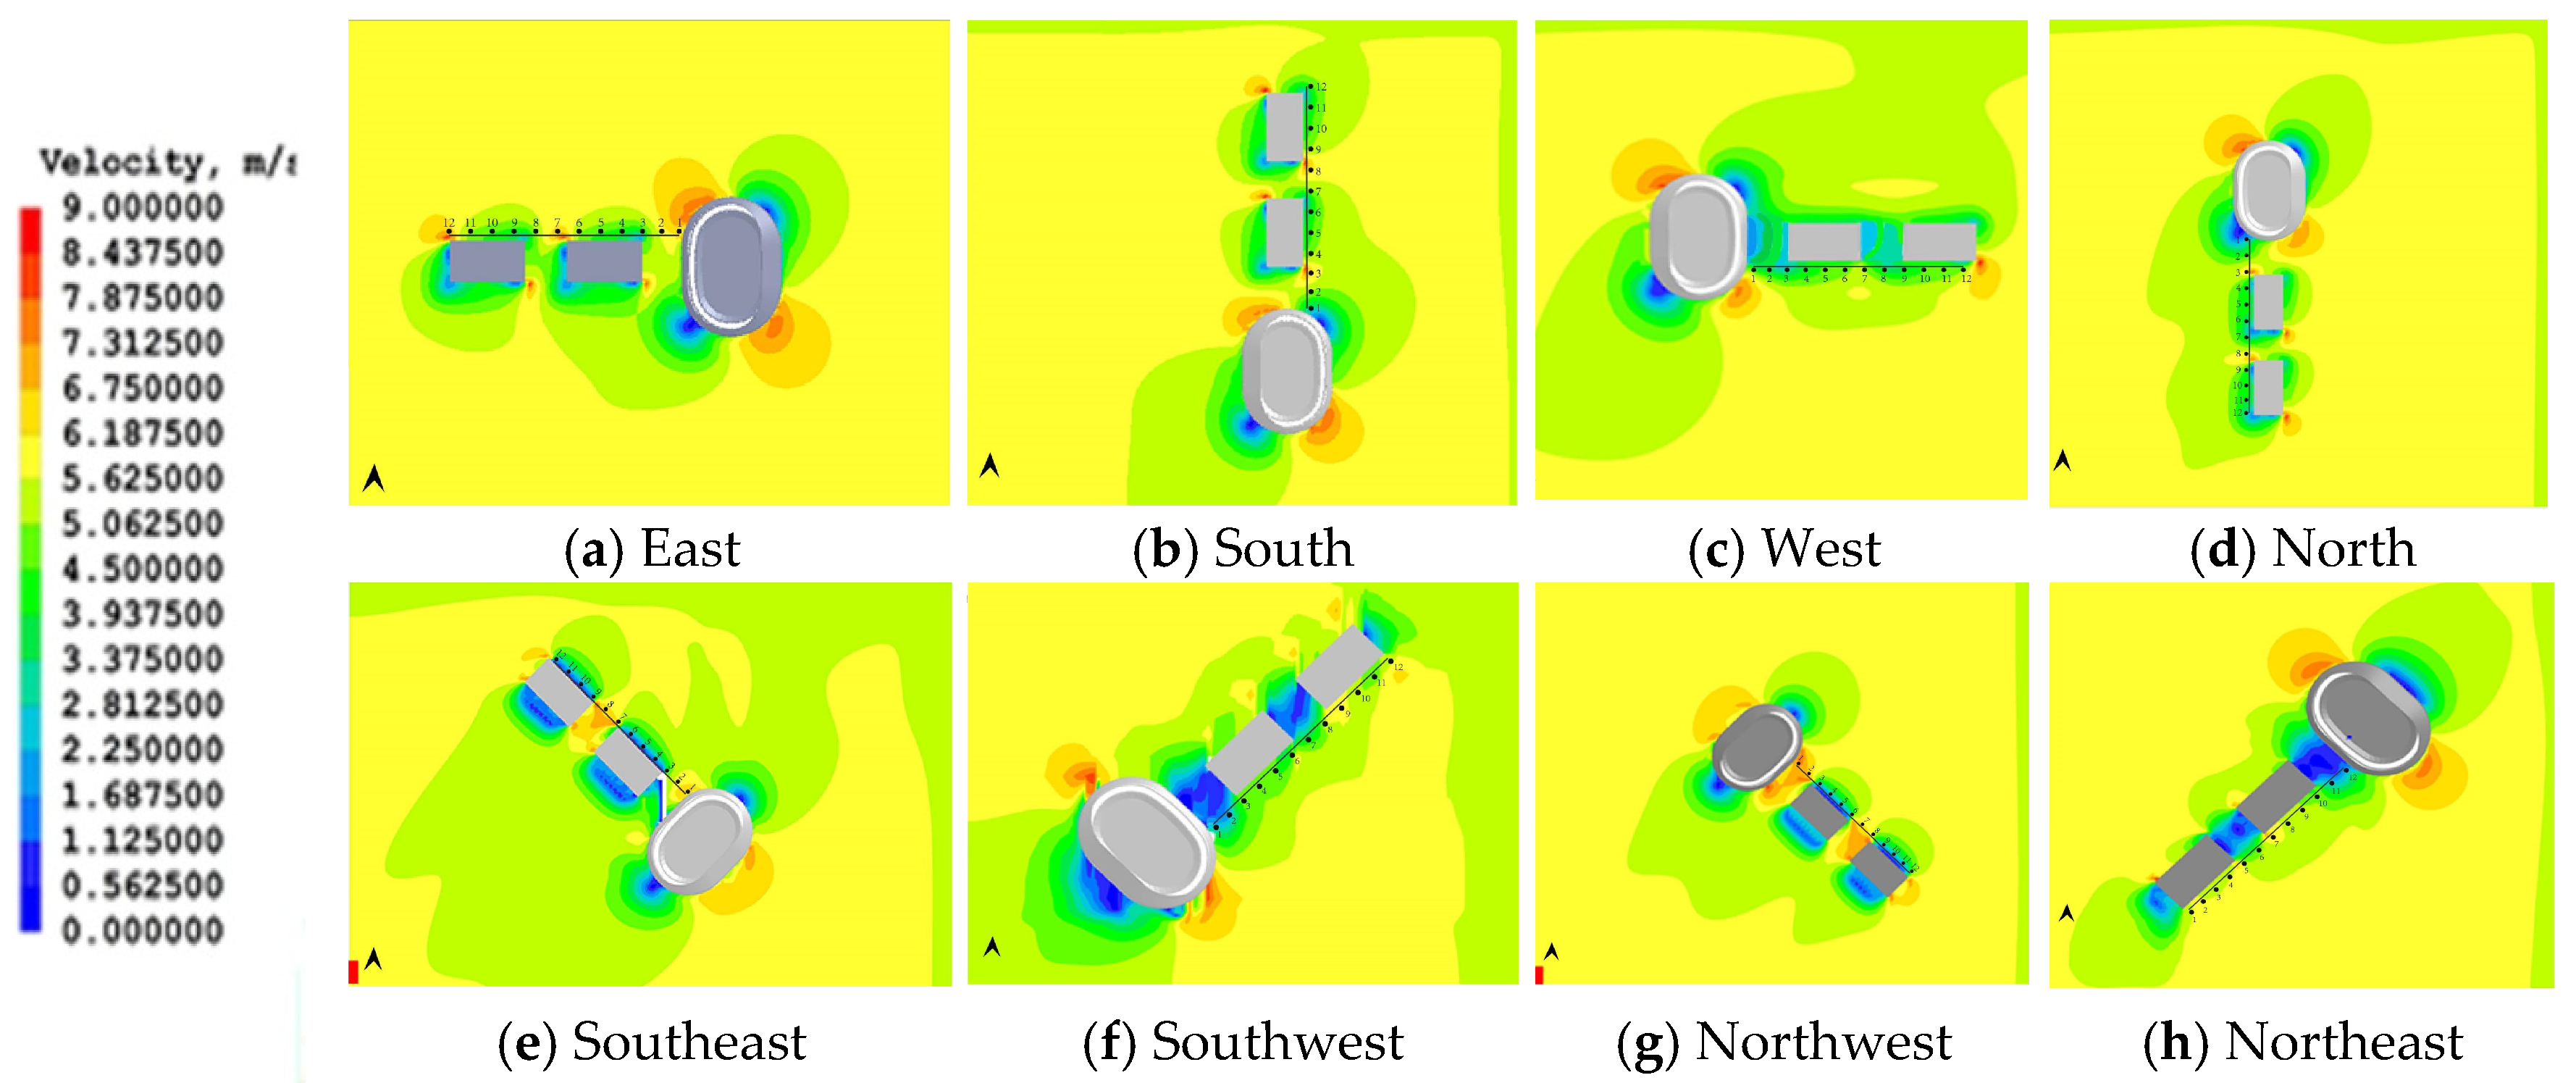
Orientation and wind speed distribution in one-line layout.
Using tecplot 2021 software, 12 points are selected for wind speed sampling in the enclosed plaza of the sports center in the one-line layout; the data are summarized in Table 2.
As can be observed in Table 2, from the wind speed and distribution map of the sampling points, the average wind speed in the square with the one-line layout ranges from 2.0393 to 4.0338 m/s, with an overall average value of 3.1521 m/s; the average wind speed in descending order of orientation is east > west > north > south-east > south > south-west > north-east > north-west.
As shown in Figure 10, under the condition of a wind speed of 6.2 m/s, eight one-line layout models are simulated and calculated to obtain wind speed distribution diagrams. It can be found that, when the axis of the one-line layout is east-west, the wind speed of the site is up to 4.0338 m/s; after analysis, it is found that this is due to the wind direction crossing the site (the wind blows from the side of the site and the square space obtains a larger wind speed). At the same time, when the axis of the one-line is northeast and northwest, the axis of the sports stadia is parallel to the field and the wall of the gymnasium blocks most of the wind, so the wind speed of the site is minimal and the wind effect is significantly lower than that of other directions. Therefore, when choosing the orientation of the one-line layout, it is necessary to cross the site axis at 45° with the prevailing wind direction.

4.2. Simulation Analysis of Building Shape

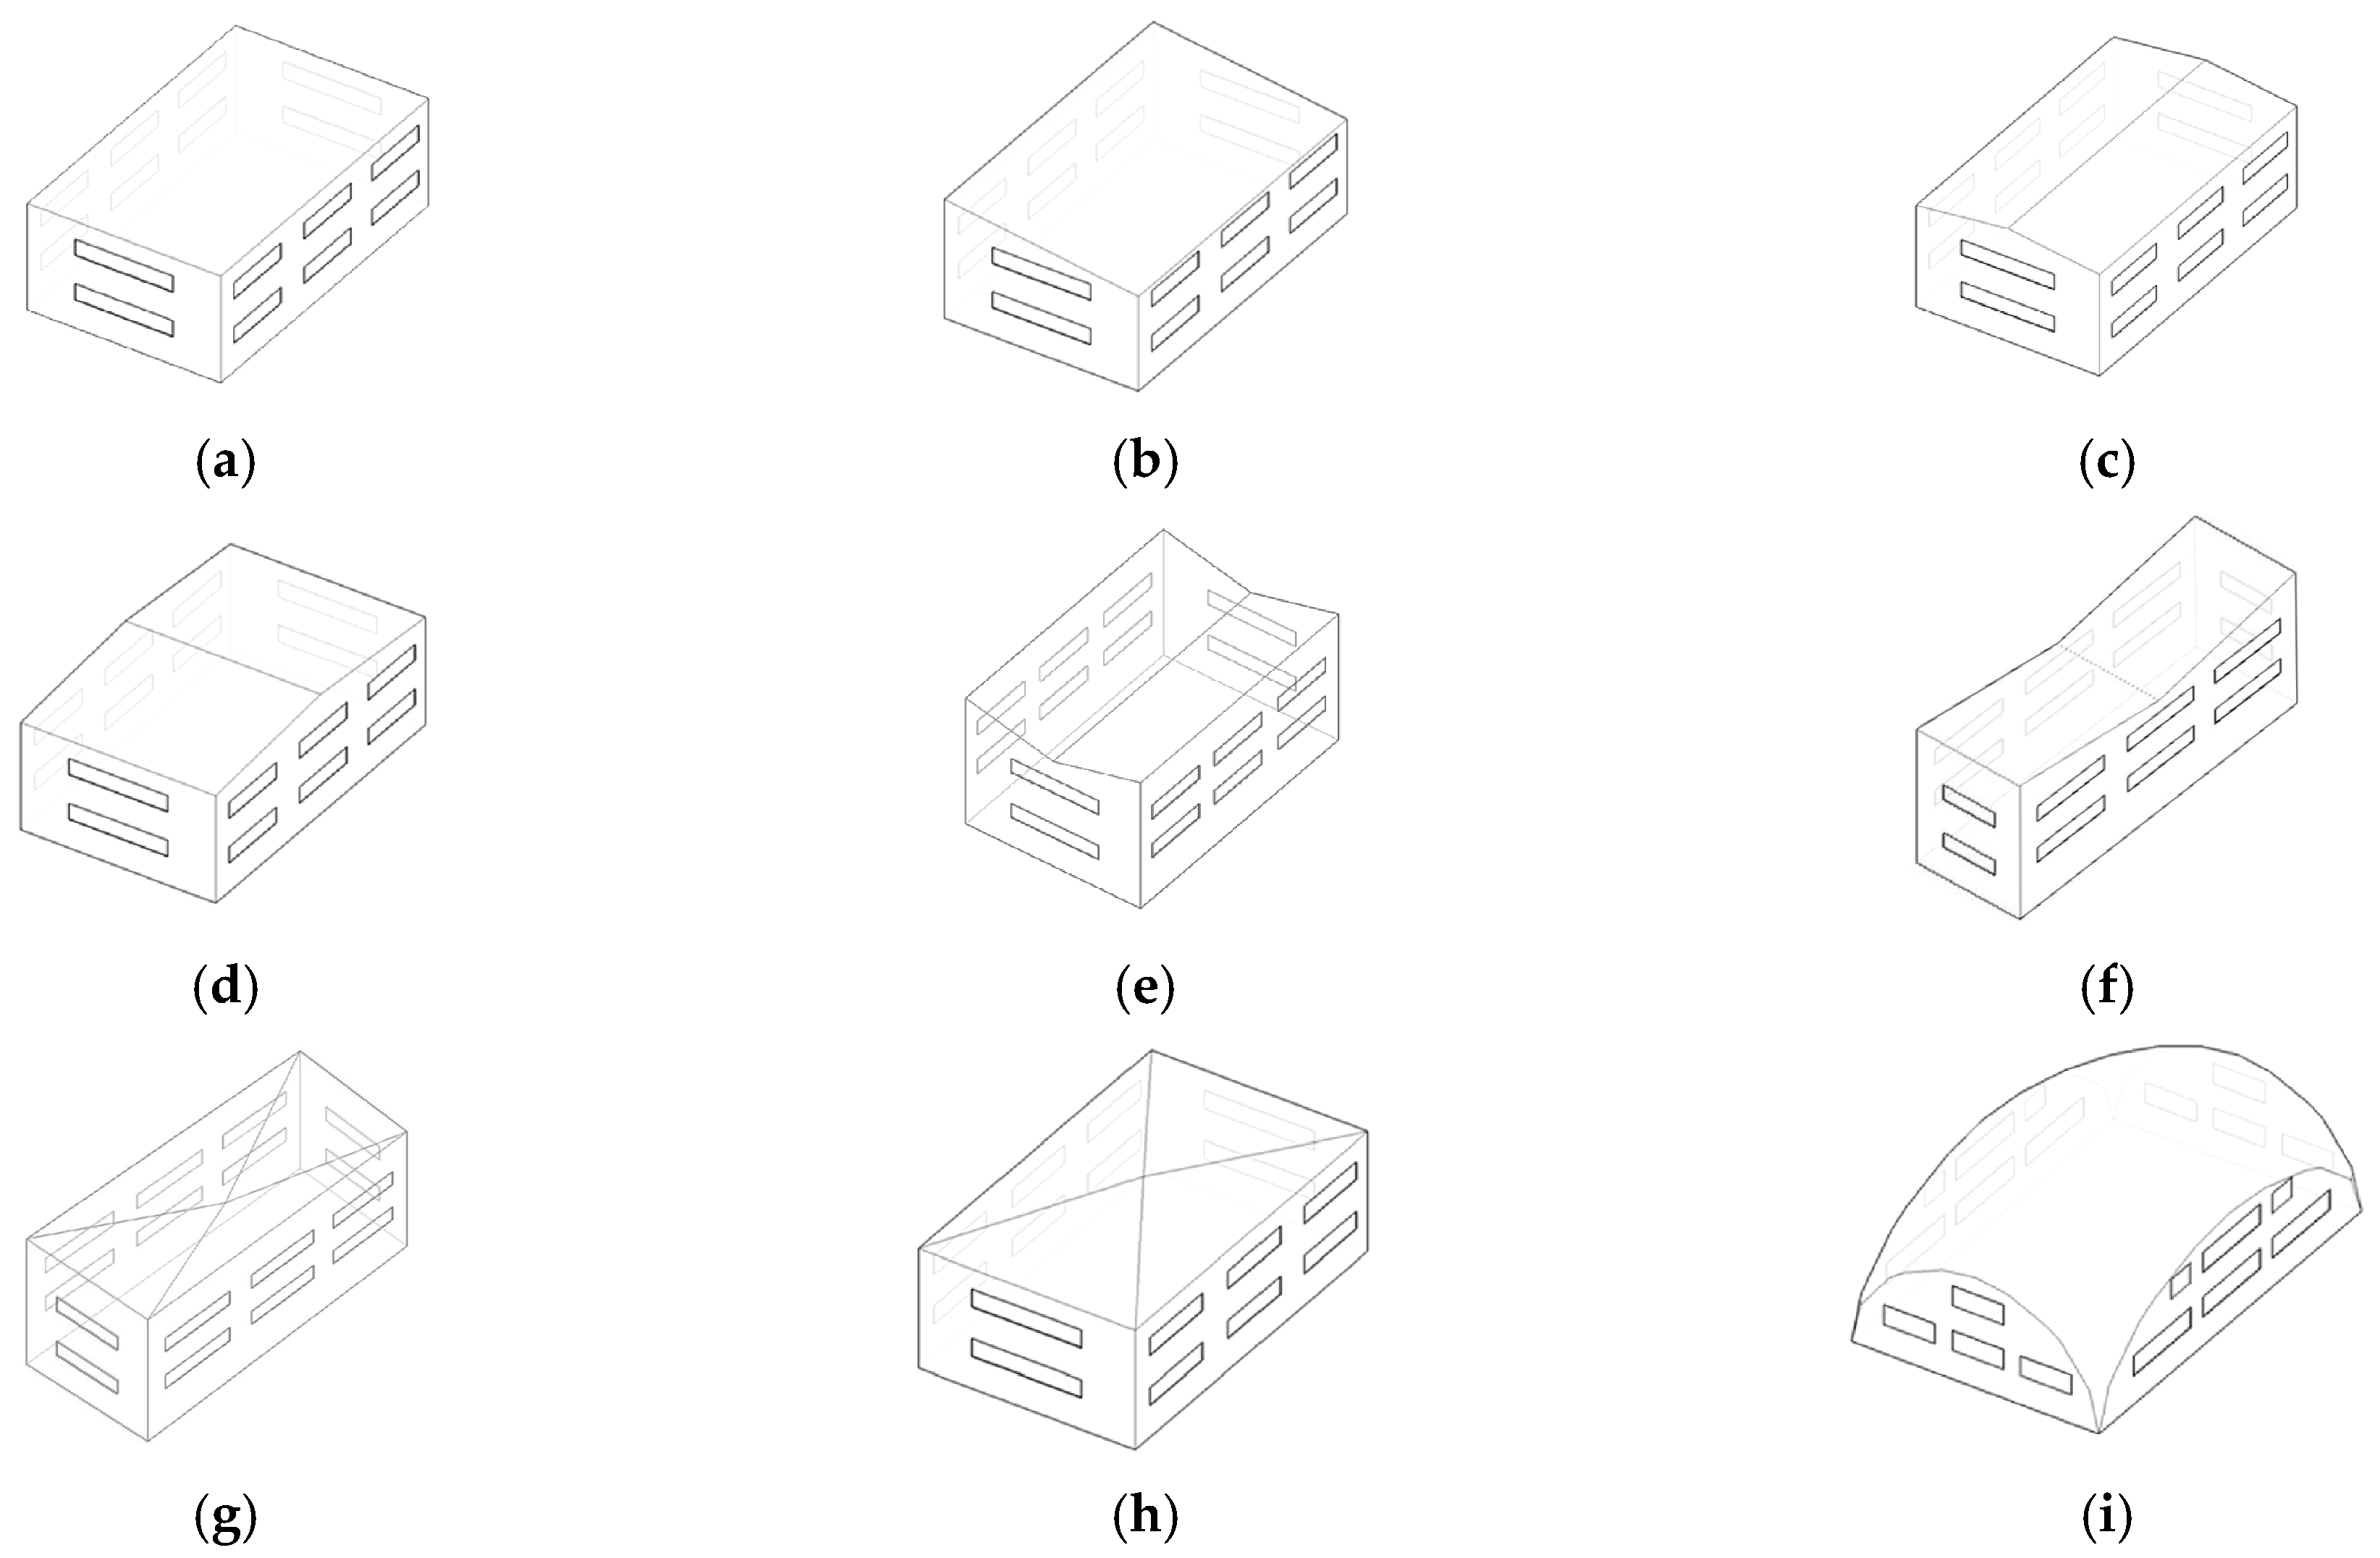
4.2.1. Construction of Shape Abstract Model

The construction of sports stadia in the hot summer and cold winter zone is at a leading level and the construction of stadiums has also developed rapidly, with the completion of a number of gymnasiums such as the Nanjing Olympic Sports Center and the Hangzhou Olympic Sports Center. The design of these gymnasiums is innovative and the roof forms of the buildings are abundant. In order to systematically study nine types of roof interface forms of gymnasiums, such as flat roofs, four-pitch roofs, and gable roofs,; individual details are ignored (e.g., jagged simplified into corresponding sloping or curved surfaces, etc.). Then, based on the average dimensions of major gymnasium, a flat roof form of 65 × 40 × 22 m is used as the basic form and a set of abstract models of gymnasiums regarding the variation of roof forms is formed based on the unification of the nine types of gymnasiums in terms of internal volume, as shown in Figure 11.

4.2.2. Simulation Condition Setting of Shape Abstract Model

Ecotect 2011 analysis software is used to simulate the heat gain of building shapes in different roof forms. In the specific simulation process, the same Nanjing meteorological data is selected and a flat roof form of 65 × 40 × 22 m is used as the basic form, based on the nine types of gymnasiums being unified in terms of internal volume and unified in terms of the conditions of unshaded areas. The dome is taken as an example to calculate the heat increment of the external surface area. The amount of heat increment can better measure the relationship between solar radiation on the outer surface of the gymnasium (Figure 12). For areas with hot summers and cold winters, the smaller the heat increment of the outer surface in summer, the lower the indoor temperature rises and the easier it is to maintain the indoor environment at a better level.

4.2.3. Simulation Results of Shape Abstract Model

As shown in Table 3, after simulation and comparison of each form, it is found that there is an overall positive correlation between the area of the external surface form and the amount of solar radiation.
According to the results revealed in Table 3, we find that: (1) Compared with the other eight types, the heat increment of the outer interface of the dome (27,436,078.01 wh) obviously has the advantage of the lowest radiant heat increment, among which, compared with the short-sided concave type with the highest heat increment (136,742,413.30 wh), the radiant heat increment can even be reduced (79.93%), mainly because the dome is a spherical curved surface change and the heating surface area is smaller. The dome shape has the lowest radiant heat increment, so the dome has a significantly better radiant heat increment ability than other roof forms; it is widely used as the roof form of sports stadia. (2) Compared with the flat roof (53,983,330.70 wh), the radiant heat increment of a single slope roof (47,542,246.08 wh) increases (13.55%) and the radiation amount does not change significantly. (3) Compared with the average number of double slopes (74,511,081.39 wh), there is also a certain radiation reduction phenomenon (38.03%) in the flat roof form (53,983,330.70 wh), mainly because the double slope roof increases the roof surface area, which to a certain extent causes the increase of radiant heat increment. (4) The difference in radiation between the short-sided (73,880,238.81 wh) and the long-sided (75,141,923.97 wh) concave in the double slope form is not obvious. (5) The average heat increment of the concave roof is the highest and, after analysis, it is found that this is due to the fact that on the one hand, the concave part accumulates more energy and is not easy to volatilize and, on the other hand, the surface area of the concave building is the largest. Therefore, according to the amount of heat gained by the building shape, it can be sorted from largest to smallest: concave roof–sloped roof–flat roof–dome.

4.3. Simulation Analysis of Building Structure

4.3.1. Construction of Structure Abstract Model

The construction form of sports stadia takes a more microscopic approach to the external form and physical properties of the stadium, with the characteristics of being highly selective, influential, and acceptable. This study adopts the stadium canopy as a structural form because, on the one hand, the wind environment in the inner field defined by the stadium canopy is an important factor affecting the quality of exercise and competition use in the field and, on the other hand, because the canopy form has a more obvious and intuitive impact on the form of the stadium and is one of the forms explored to unify the design form and physical performance. Based on the previous case study, most of the stadiums are rounded flat and the impact of the canopy on the indoor wind environment is more direct. The permeability model of the canopy connection can be divided into three types: fully enclosed connection, semi-closed connection, and fully open connection, with the same floor plan using four-sided through canopy, with the size the same as the three models in the canopy profile form. Among them, the fully enclosed connection model is the gap between the canopy and the agent is completely shielded by the baffle. The semi-closed connection model is not set at the corner of the open connection model without occlusion. This study simulates the three forms and, from the results of the study, the internal wind environment has little relationship with the canopy connection form. In order to study readability, the semi-closed connection type is used here as an example to discuss the research results. This study uses the square inverted rounded building plan form in the site and the canopy profile form is divided into three kinds of upward tilt, flat and downward tilt, upward tilt canopy, and downward tilt canopy, respectively, on the basis of flat and straight canopy upward and downward tilt of 15°. The final abstract model is shown in Figure 13.

4.3.2. Simulation Condition Setting of Structure Abstract Model

For the building construction analysis, three initial wind speed conditions are selected (5 m/s, 10 m/s, and 15 m/s) at a height of 10 m and urban gradient wind parameters are chosen for the air inlet. The specific expression for the gradient wind is as follows:
U ( y ) U 0 = ( y δ ) n
where U ( y ) represents the wind speed at height y, m/s; U 0 is initial wind speed (in this experiment, three wind speeds of 5 m/s, 10 m/s, and 15 m/s are taken); y is height, m; δ represents reference height, taken as 10 m; n is roughness coefficient, taken as 0.15.
The model selected in this paper is an abstract model and the research content is the influence of canopy morphology on the infield wind environment. In the course of the study, each wind direction is simulated. The data results show little to do with the wind direction, considering that the composite variables would greatly increase the complexity of the study and weaken the accuracy of the single variable. Therefore, this paper ignores the influence of different wind directions and only discusses the influence of professional stadium canopy morphology on the infield wind environment from the perspective of an abstract model and selects a single wind direction as the initial condition.

4.3.3. Simulation Results of Structure Abstract Model

After simulation analysis, the following observations are noted under the same wind speed and direction in the external environment. (1) When the canopy is an upward canopy, a vortex is formed in the northeast and southwest areas, the average wind speed in the audience area on the west side is significantly higher than that in the east side, a small area of vortex circle appears locally on the northeast side, and the static wind area is actively small and has poor stability. (2) The average wind speed of the sports area is the smallest under the three canopy profile forms when the canopy is a flat canopy and there are many areas with sudden wind speed changes in the entire audience area, e.g., when the wind speed at the entrance is 15 m/s, the wind speed difference is about 7 m/s. (3) When the canopy is a downward canopy, the average wind speed in the field is large and a large area of low wind speed circle appears locally on the southeast side and the area of the quiet wind area is small. (4) In general, the whirlpool area in the field of the upward canopy and downward canopy is more obvious and less stable, especially in the sports area, and will have a certain impact on sports, while the flat canopy has the best stability and is the best for competitive sports. The wind speed difference between the inside and outside of the downward canopy is obvious and the speed reduction is the best. The speed reduction of the flat canopy is moderate and the area with sudden wind speed change in many places only appears in the audience area. The wind speed difference inside and outside the field of the upward canopy is not obvious and the speed reduction is poor (Figure 14).

5. Discussion

The unique wind and heat environment in the hot summer and cold winter zone has a great impact on sports stadia and the climate adaptation strategy of stadia is also more complicated. According to the simulation analysis above, climate adaptation strategies are proposed from three aspects: building layout, building shape, and building structure, as shown in Table 4.
First of all, in the layout of the building, it is necessary to strengthen the air-induced air capacity of the sports stadia and balance the internal thermal environment of the gymnasium through ventilation and heat dissipation. After simulation studies, climate response can be summarized as follows: in the one-line layout, the axis is east-west and the wind speed of the site is the largest; when the axis is northeast and northwest, the wind speed of the site is the smallest and the induced wind effect is significantly lower than that of other directions. Therefore, under the demand of induced wind, the one-line layout is subject to wider changes in the ratio of external wind speed and site-affected area and whether the layout is reasonable or not has a greater impact on it. Through this simulation, the orientation of the one-line layout needs to cross the site axis with the prevailing wind direction at 45° to achieve the highest wind speed in the site. In the triangular layout, the southwest orientation has the largest wind speed in the field, followed by the northeast orientation, and the wind speed in the due north direction is the lowest. Regarding the need for ventilation, the wind environment of the oblique layout is better than the positive layout, that is, the wind blowing from the side of the square can make the square space obtain the maximum wind speed. At the same time, the square space needs to be made as little as possible on the windward side.
Secondly, due to its large surface area and the most direct form of external contact, the roof of the gymnasium has huge radiant heat, which directly affects the thermal environment inside the gymnasium. Through simulation studies, it is found that there is a positive correlation between the external surface area of the roof and the amount of solar radiation as a whole. The dome is a spherical surface change, the heating surface area is smaller, and the dome has the lowest radiant heat increment, so the dome ability to reduce radiant heat increment is significantly better than that of other roof forms. The concave roof increases the external surface area of the building because the concave part increases; the concave part is easy to accumulate energy and is not easy to volatilize, resulting in the highest average radiant heat increment of such roofs. In the form of sloped roofs and flat roofs, the amount of radiant heat increment is directly related to its own shape system number and slope orientation. Therefore, according to the size of the heat gained by the roof shape of the building, it can be sorted from largest to smallest: concave roof–sloped roof–flat roof–dome. Therefore, the priority use of the dome can greatly reduce the radiant heat increment of the roof interface of the gymnasium and, in specific engineering practice, it should also be combined with subsequent measures such as reducing the building size coefficient, increasing external shading, and improving natural ventilation to effectively improve the thermal environment quality of indoor space.
Finally, because of its semi-open form, the stadium has a direct connection between the internal environment and the external environment. The wind speed in the hot summer and cold winter zone is generally large; how to reduce the wind speed and stabilize the wind field in the field is one of the main concerns of stadia in this area. According to simulation results, it is found that the stability of the upward canopy and the downward canopy are poor, especially the whirlpool formed in the sports area, which will have a certain impact on sports, while the flat canopy has the best stability and is the best for competitive sports. The downward canopy has the best speed reduction. The flat canopy has moderate speed reduction and many areas with sudden wind speed change only appear in the audience area. The upward canopy has poor speed reduction, forming a vortex in the northeast and southwest areas. Therefore, compared with the upward canopy and the downward canopy, the flat canopy has more low wind speed areas and better wind resistance, which can effectively avoid the impact of windy weather on the training and competition of personnel in the stadium, improve the quality of use of the sports stadia, and improve the comfort of the overall environment.

6. Conclusions

This study uses Phoenics 2016, and Ecotect 2011 software as simulation tools and explores the general layout, building form, and canopy form of sports stadia in terms of wind and sunlight environment simulation, in response to the above-mentioned usage requirements and spatial characteristics. The findings of the study are summarized in a “simulation-quantification-comparison” approach and the rules and design strategies that are useful for climate design are summarized to propose a more comprehensive climate adaptation design strategy. According to the simulation results, when the triangular layout is made, the axis of the sports stadia is parallel to the dominant wind direction and the wind can better penetrate the square space formed by the two gymnasiums. In the one-line layout, due to the difference in layout, there is no enclosure space, so the wind speed is highest when the dominant wind direction runs diagonally through the site. For building shape, in the selection of roof form, it is better to choose the form with the smallest external surface area, such as a dome, because the external interface has the least contact and the external heat radiation also has the least interference with the indoor environment. When choosing the structure of the building, it is necessary to pay attention to the initial interference of the ground wind and choose a flat canopy with better wind resistance, more low wind speed areas, and better wind resistance, which will improve the comfort of the overall environment in the sports stadia.
This study provides a reference and basis for the climatic design practice of sports stadia in hot summer and cold winter zones in a theoretical sense, thereby accelerating the pace of greening sports stadia. At the same time, at the practical level, the climate adaptation design strategies proposed in this paper provide a system of ideas and methods for contemporary sports stadia design with mutual perspectives and appropriate strategies, which enhance the green, healthy, and economic value of sports stadia.
Although the results of the study are more instructive, there are still some shortcomings in this study. First of all, the simulation setting conditions in this study are relatively single, ignoring the influence of site greening, terrain, and other factors. At the same time, the abstract model of this study is also subject to the research methods, only considering the influence effect of the main aspects, and does not study the role of various details on the experimental results from the perspective of the fine model.

Author Contributions

Conceptualization, D.X.; methodology, D.X.; software, K.C. and J.C.; validation, D.X. and K.C.; formal analysis, D.X. and K.C.; investigation, D.X. and K.C.; resources, D.X. and K.C.; data curation, D.X. and K.C.; writing—original draft preparation, D.X. and K.C.; writing—review and editing, D.X., K.C. and J.C.; visualization, D.X., K.C. and J.C.; supervision, D.X.; project administration, D.X.; funding acquisition, D.X. All authors have read and agreed to the published version of the manuscript.

Funding

This research was funded by the Major project of philosophy and social sciences in colleges and universities of Jiangsu, grant number 2020SJZDA095.

Data Availability Statement

The data presented in this research are available upon request from the corresponding author. The data are not publicly available due to privacy.

Conflicts of Interest

The authors declare no conflict of interest.

References

  1. Zhao, X.; Ma, X.; Chen, B.; Shang, Y.; Song, M. Challenges toward carbon neutrality in China: Strategies and countermeasures. Resour. Conserv. Recycl. 2022, 176, 105959. [Google Scholar] [CrossRef]
  2. Bazazzadeh, H.; Nadolny, A.; Safaei, S.S.H. Climate Change and Building Energy Consumption: A Review of the Impact of Weather Parameters Influenced by Climate Change on Household Heating and Cooling Demands of Buildings. Eur. J. Sustain. Dev. 2021, 10, 1–12. [Google Scholar] [CrossRef]
  3. Liu, X.; Liu, X.; Luo, X.; Wang, M.; Fu, H.; Wang, B.; Sun, Y.; Hu, W. Analysis on the influencing mechanism of informational policy instrument on adopting energy consumption monitoring technology in public buildings. Energy Effic. 2020, 13, 1485–1503. [Google Scholar] [CrossRef]
  4. Wang, L.; Huang, Q.; Zhang, Q.; Xu, H.; Yuen, R.K. Role of atrium geometry in building energy consumption: The case of a fully air-conditioned enclosed atrium in cold climates, China. Energy Build. 2017, 151, 228–241. [Google Scholar] [CrossRef]
  5. Xu, P.; Huang, J.; Shen, P.; Ma, X.; Gao, X.; Xu, Q.; Jiang, H.; Xiang, Y. Commercial building energy use in six cities in Southern China. Energy Policy 2013, 53, 76–89. [Google Scholar] [CrossRef]
  6. Yuce, B.; Li, H.; Rezgui, Y.; Petri, I.; Jayan, B.; Yang, C. Utilizing artificial neural network to predict energy consumption and thermal comfort level: An indoor swimming pool case study. Energy Build. 2014, 80, 45–56. [Google Scholar] [CrossRef]
  7. Wang, K.; Wang, X. Providing Sports Venues on Mainland China: Implications for Promoting Leisure-Time Physical Activity and National Fitness Policies. Int. J. Environ. Res. Public Health 2020, 17, 5136. [Google Scholar] [CrossRef] [PubMed]
  8. Vogeler, C.S.; van den Dool, A.; Chen, M. Programmatic action in Chinese health policy—The making and design of “Healthy China 2030”. Rev. Policy Res. 2023, 40, 534–552. [Google Scholar] [CrossRef]
  9. Stagrum, A.E.; Andenæs, E.; Kvande, T.; Lohne, J. Climate Change Adaptation Measures for Buildings—A Scoping Review. Sustainability 2020, 12, 1721–1738. [Google Scholar] [CrossRef]
  10. Oropeza-Perez, I.; Østergaard, P.A. Potential of natural ventilation in temperate countries—A case study of Denmark. Appl. Energy 2014, 114, 520–530. [Google Scholar] [CrossRef]
  11. Cerra, J. Inland Adaptation: Developing a Studio Model for Climate-adaptive Design as a Framework for Design Practice. Landsc. J. 2016, 35, 37–55. [Google Scholar] [CrossRef]
  12. Liu, Y.; Wang, J.; Ren, J.; Xiao, Q.; Zhao, J. A Preliminary Study on the Climate Adaptive Design of Green Rural Houses in west China. Procedia Eng. 2017, 180, 735–740. [Google Scholar] [CrossRef]
  13. Shen, J.; Copertaro, B.; Sangelantoni, L.; Zhang, X.; Suo, H.; Guan, X. An early-stage analysis of climate-adaptive designs for multi-family buildings under future climate scenario: Case studies in Rome, Italy and Stockholm, Sweden. J. Build. Eng. 2020, 27, 100972. [Google Scholar] [CrossRef]
  14. Liu, L.; Liu, J.; Jin, L.; Liu, L.; Gao, Y.; Pan, X. Climate-conscious spatial morphology optimization strategy using a method combining local climate zone parameterization concept and urban canopy layer model. Build. Environ. 2020, 185, 107301. [Google Scholar] [CrossRef]
  15. Teshnehdel, S.; Akbari, H.; Di Giuseppe, E.; Brown, R.D. Effect of tree cover and tree species on microclimate and pedestrian comfort in a residential district in Iran. Build. Environ. 2020, 178, 106899. [Google Scholar] [CrossRef]
  16. Aboulnaga, M.; Alwan, A.; Elsharouny, M.R. Climate Change Adaptation: Assessment and Simulation for Hot-Arid Urban Settlements—The Case Study of the Asmarat Housing Project in Cairo, Egypt. In Sustainable Building for a Cleaner Environment: Selected Papers from the World Renewable Energy Network’s Med Green Forum 2017; Sayigh, A., Ed.; Springer International Publishing: Cham, Switzerland, 2019; pp. 437–449. [Google Scholar]
  17. Mughal, M.O.; Li, X.-X.; Norford, L.K. Urban heat island mitigation in Singapore: Evaluation using WRF/multilayer urban canopy model and local climate zones. Urban Clim. 2020, 34, 100714. [Google Scholar] [CrossRef]
  18. Mabon, L.; Kondo, K.; Kanekiyo, H.; Hayabuchi, Y.; Yamaguchi, A. Fukuoka: Adapting to climate change through urban green space and the built environment? Cities 2019, 93, 273–285. [Google Scholar] [CrossRef]
  19. Mauree, D.; Naboni, E.; Coccolo, S.; Perera, A.; Nik, V.M.; Scartezzini, J.-L. A review of assessment methods for the urban environment and its energy sustainability to guarantee climate adaptation of future cities. Renew. Sustain. Energy Rev. 2019, 112, 733–746. [Google Scholar] [CrossRef]
  20. Kim, H.; Clayton, M.J. A multi-objective optimization approach for climate-adaptive building envelope design using parametric behavior maps. Build. Environ. 2020, 185, 107292. [Google Scholar] [CrossRef]
  21. Yang, L.; Fu, R.; He, W.; He, Q.; Liu, Y. Adaptive thermal comfort and climate responsive building design strategies in dry-hot and dry-cold areas: Case study in Turpan, China. Energy Build. 2019, 209, 109678. [Google Scholar] [CrossRef]
  22. Zhou, Y.; Zheng, S.; Liu, Z.; Wen, T.; Ding, Z.; Yan, J.; Zhang, G. Passive and active phase change materials integrated building energy systems with advanced machine-learning based climate-adaptive designs, intelligent operations, uncertainty-based analysis and optimisations: A state-of-the-art review. Renew. Sustain. Energy Rev. 2020, 130, 109889. [Google Scholar] [CrossRef]
  23. Wilson, K.L.; Tittensor, D.P.; Worm, B.; Lotze, H.K. Incorporating climate change adaptation into marine protected area planning. Glob. Chang. Biol. 2020, 26, 3251–3267. [Google Scholar] [CrossRef] [PubMed]
  24. Juan, X.; Ziliang, L.; Weijun, G.; Mengsheng, Y.; Menglong, S. The comparative study on the climate adaptability based on indoor physical environment of traditional dwelling in Qinba mountainous areas, China. Energy Build. 2019, 197, 140–155. [Google Scholar] [CrossRef]
  25. Izadyar, N.; Miller, W.; Rismanchi, B.; Garcia-Hansen, V. Impacts of façade openings’ geometry on natural ventilation and occupants’ perception: A review. Build. Environ. 2020, 170, 106613. [Google Scholar] [CrossRef]
  26. Ghosh, A.; Norton, B. Advances in switchable and highly insulating autonomous (self-powered) glazing systems for adaptive low energy buildings. Renew. Energy 2018, 126, 1003–1031. [Google Scholar] [CrossRef]
  27. Qi, J.; Wei, C. Performance evaluation of climate-adaptive natural ventilation design: A case study of semi-open public cultural building. Indoor Built Environ. 2020, 30, 1714–1724. [Google Scholar] [CrossRef]
  28. Li, Y.; Tong, Z. Development of real-time adaptive model-free extremum seeking control for CFD-simulated thermal environment. Sustain. Cities Soc. 2021, 74, 103166. [Google Scholar] [CrossRef]
  29. Javad, K.; Navid, G. Thermal comfort investigation of stratified indoor environment in displacement ventilation: Climate-adaptive building with smart windows. Sustain. Cities Soc. 2019, 46, 101354. [Google Scholar] [CrossRef]
  30. Hu, J.; Yu, X. Adaptive building roof by coupling thermochromic material and phase change material: Energy performance under different climate conditions. Constr. Build. Mater. 2020, 262, 120481. [Google Scholar] [CrossRef]
  31. Gaspari, J.; Emanuele, N.; Caterina, P.; Adele, R. A Study on the Impact of Climate Adaptive Building Shells on Indoor Comfort. J. Facade Des. Eng. 2019, 7, 27–40. [Google Scholar] [CrossRef]
  32. Vasigh, B.; Shiri, T. Climatic Adaptation of the Dome Body Based on Solar Radiation Received; Case Study: The Domes of Shah Mosque, Sheikh Lotfollah Mosque, Al-Nabi Mosque of Qazvin and Jameh Mosque of Urmia. Arman. Archit. Urban Dev. 2021, 13, 211–225. [Google Scholar] [CrossRef]
  33. Sakiyama, N.; Carlo, J.; Frick, J.; Garrecht, H. Perspectives of naturally ventilated buildings: A review. Renew. Sustain. Energy Rev. 2020, 130, 109933. [Google Scholar] [CrossRef]
  34. Bensafi, M.; Ameur, H.; Kaid, N.; Hoseinzadeh, S.; Memon, S.; Garcia, D.A. Thermophysics Analysis of Office Buildings with a Temperature–Humidity Coupling Strategy Under Hot-Arid Climatic Conditions. Int. J. Thermophys. 2021, 42, 118. [Google Scholar] [CrossRef]
  35. Kuru, A.; Oldfield, P.; Bonser, S.; Fiorito, F. Performance prediction of biomimetic adaptive building skins: Integrating multifunctionality through a novel simulation framework. Sol. Energy 2021, 224, 253–270. [Google Scholar] [CrossRef]
  36. Fosas, D.; Coley, D.A.; Natarajan, S.; Herrera, M.; de Pando, M.F.; Ramallo-Gonzalez, A. Mitigation versus adaptation: Does insulating dwellings increase overheating risk? Build. Environ. 2018, 143, 740–759. [Google Scholar] [CrossRef]
  37. Xu, W. Environmental Performance Optimization Design of Marine Climate Adaptive Green Public Buildings. J. Coast. Res. 2020, 106, 342–346. [Google Scholar] [CrossRef]
  38. Xue, F.; Gou, Z.; Lau, S.S. Human Factors in Green Office Building Design: The Impact of Workplace Green Features on Health Perceptions in High-Rise High-Density Asian Cities. Sustainability 2016, 8, 1095. [Google Scholar] [CrossRef]
  39. Jing, Q.; Li, J.; Li, L.; Jia, M.; Zhou, Y.; Zhao, X. Passive design of green public buildings adapted to cold climate: A case study of China pavilion of the international horticultural exhibition 2019 Beijing China. IOP Conf. Ser. Earth Environ. Sci. 2021, 768, 012130. [Google Scholar] [CrossRef]
  40. Hong, Y.; Ezeh, C.; Deng, W.; Lu, J.; Ma, Y.; Jin, Y. Climate adaptation of design scheme for energy-conserving high-rise buildings—Comparative study of achieving building sustainability in different climate scenarios. Energy Rep. 2022, 8, 13735–13752. [Google Scholar] [CrossRef]
  41. Manni, M.; Nicolini, A. Multi-Objective Optimization Models to Design a Responsive Built Environment: A Synthetic Review. Energies 2022, 15, 486. [Google Scholar] [CrossRef]
  42. Upadhyay, A.K.; Yoshida, H.; Rijal, H.B. Climate Responsive Building Design in the Kathmandu Valley. J. Asian Archit. Build. Eng. 2006, 5, 169–176. [Google Scholar] [CrossRef]
  43. Huang, Z.; Cheng, B.; Gou, Z.; Zhang, F. Outdoor thermal comfort and adaptive behaviors in a university campus in China’s hot summer-cold winter climate region. Build. Environ. 2019, 165, 106414. [Google Scholar] [CrossRef]
  44. Guo, Y.; Bart, D. Optimization of Design Parameters for Office Buildings with Climatic Adaptability Based on Energy Demand and Thermal Comfort. Sustainability 2020, 12, 3540. [Google Scholar] [CrossRef]
  45. Lee, J.; Lee, K.S.; Lim, J. Passive Design Techniques Aplied to Green Buildings As An Aesthetic and Spatial Design Concept. J. Green Build. 2015, 10, 79–109. [Google Scholar] [CrossRef]
  46. Cheng, Z.; Lei, N.; Bu, Z.; Sun, H.; Li, B.; Lin, B. Investigations of indoor air quality for office buildings in different climate zones of China by subjective survey and field measurement. Build. Environ. 2022, 214, 108899. [Google Scholar] [CrossRef]
  47. Pan, L.; Xu, Q.; Nie, Y.; Qiu, T. Analysis of climate adaptive energy-saving technology approaches to residential building envelope in Shanghai. J. Build. Eng. 2018, 19, 266–272. [Google Scholar] [CrossRef]
  48. Wu, H.; Zhang, T. Multi-objective optimization of energy, visual, and thermal performance for building envelopes in China’s hot summer and cold winter climate zone. J. Build. Eng. 2022, 59, 105034. [Google Scholar] [CrossRef]
Figure 1. The design framework for the climate adaptation of sports stadia in hot summer and cold winter zones.
Buildings 13 02238 g001
Figure 2. Distribution of large sports stadia in China.
Buildings 13 02238 g002
Figure 3. Location of the study area.
Buildings 13 02238 g003
Figure 4. Architectural examples. (a) Nanjing Olympic Sports Center. (b) Wuhan Sports Center. (c) Shanghai Stadium. (d) Hangzhou Olympic Sports Center.
Buildings 13 02238 g004aBuildings 13 02238 g004b
Figure 5. Abstract model of sports stadia. (a) Building layout model. (b) Building shape model. (c) Building structure model.
Buildings 13 02238 g005
Figure 6. Nanjing meteorological data. (a) Analysis of solar orbit in Nanjing. (b) Enthalpy humidity map of Nanjing. (c) Average daily climatic conditions in Nanjing. (d) Analysis of weekly average sunshine radiation in Nanjing.
Buildings 13 02238 g006aBuildings 13 02238 g006b
Figure 7. Abstract model of the building’s orientation.
Buildings 13 02238 g007
Figure 8. Sampling point diagram of layout abstract model. (a) Sampling points for one-line layout. (b) Sampling points for triangle layout.
Buildings 13 02238 g008
Figure 9. Site wind speed of triangle layout with different orientations.
Buildings 13 02238 g009
Figure 10. Site wind speed of the one-line layout with different orientations.
Buildings 13 02238 g010
Figure 11. Different types of abstract architectural form models. (a) Flat slope. (b) Single slope. (c) Short-sided double slope. (d) Long-sided double slope. (e) Short-sided concave. (f) Long-sided concave. (g) Double-sided concave. (h) Double side double slope. (i) Dome.
Buildings 13 02238 g011
Figure 12. 24 h heating simulation analysis of the dome in Nanjing area in each month of the year. (a) Average daily radiation analysis. (b) Radiant heat map of the façade.
Buildings 13 02238 g012aBuildings 13 02238 g012b
Figure 13. Building structure abstract models. (a) Upward canopy. (b) Flat canopy. (c) Downward canopy.
Buildings 13 02238 g013
Figure 14. Wind speed maps in stadiums in different canopy forms.
Buildings 13 02238 g014
Table 1. Wind speed at sampling points for different orientations of the triangle layout (m/s).
Triangle123456789101112Mean
West1.12402.30263.36613.95916.11186.94584.17770.59601.01351.17551.08864.37853.0199
North-west3.35973.48073.29843.26335.91604.64972.45130.02901.27461.26243.33477.33723.3047
South-west6.48133.68393.15833.60703.17684.13016.89907.11246.29234.43334.32154.27964.7980
East3.15312.21432.01231.90720.72474.00195.33776.51614.57404.46391.25110.82913.0821
South2.13642.21692.01693.91176.17733.16062.10562.29952.14692.21652.72886.93693.1712
North-east2.43573.45183.38586.00587.05434.92703.93983.98573.81403.81875.76797.47114.6715
South-east6.17842.82133.20783.22454.06644.39495.01126.11064.47135.74405.22463.92644.5318
North4.68960.81170.55610.14532.58133.15864.06021.75272.14751.97640.26580.61051.8963
Table 2. Wind speeds at sampling points for different orientations of the one-line layout (m/s).
One-Line123456789101112Mean
West5.13364.49041.87382.05353.54044.62266.18423.17622.50932.17752.85537.27443.8243
North-west2.36883.13971.83602.15742.15272.03831.66481.26172.27833.18331.00991.30892.0393
South-west0.08413.69426.48352.72463.46532.31273.51296.58522.01031.55811.41781.56512.9511
East0.12291.44145.57155.20044.37553.32473.79015.28925.96615.26463.06024.99904.0338
South1.42212.28121.36132.34965.02305.25983.18312.35833.32523.91163.15723.34243.0812
North-east6.92645.17152.25121.01361.05751.08885.27894.44231.18801.04401.13342.43432.5025
South-east1.05592.63475.97983.20813.47362.65933.08765.85602.03693.48423.70811.71323.2414
North3.17433.02503.16123.72973.81363.22187.15074.17844.51893.77671.49311.27493.5432
Table 3. Thermal radiation analysis of building forms.
TypeThe Radiant Surface Area (m2)Total Radiation Value (wh/m2)Mean Radiation Value (wh/m2)
Flat slope790053,983,330.76833.333
Single slope7918.67847,542,246.086003.811
Short-sided double slope7673.86373,880,238.819627.516
Long-sided double slope7733.10575,141,923.979716.915
Short-sided concave8237.863136,742,413.316,599.258
Long-sided concave8133.10595,773,630.811,775.777
Double-sided concave8758.484116,453,232.413,296.049
Double side double slope7453.48489,399,211.3411,994.285
Dome2063.47627,436,078.0113,296.049
Table 4. Climate adaptation strategy.
DimensionTypeSimulation ResultCauseStrategy
LayoutOne-lineWhen the axis is east west, the maximum wind speed of the site is 4.0338 m/s; when the axis is northeast and northwest, the wind speed of the site is the smallest and the induced wind effect is significantly lower than that of other directions.Since the prevailing wind direction crosses the axis at 45° in summer, the wind speed is highest when the dominant wind direction runs diagonally through the site; the axis of the stadia runs parallel to the field and the walls of the gymnasiums block most of the wind.Under the demand for induced wind, the orientation of the layout needs to cross the site axis with the prevailing wind direction at 45° to achieve the highest wind speed of the site.
TriangleThe wind speed in the field is the largest in the southwest orientation, about 4.7980 m/s; the second is the northeast orientation, with a wind speed of about 4.6715 m/s; the wind speed in the due north direction is the lowest at only 1.8963 m/s.When the axis of the stadia intersects diagonally with the dominant wind direction, the wind can better penetrate the square space formed by the two gymnasiums; the average wind speed in the north direction is the smallest and, after analysis, it is found that this is due to the fact that the air inlets and outlets are blocked by the gymnasiums, so the wind speed is the smallest.From the perspective of the demand for ventilation in the field, the wind environment of the oblique layout is better than the positive layout. Wind blowing through the sides of the square can maximize wind speed in the square space. At the same time, it is necessary to try to make the square space as little as possible on the windward side.
ShapeFlat slopeRadiant surface area:
7900.00 m2. Radiant heat increment:
53,983,330.70 wh.
Because of the uniform solar radiation, the flat slope is not greatly affected by the orientation of the building.Follow-up measures include reducing the body size factor and improving natural ventilation and
Single slopeRadiant surface area:
7918.678 m2. Radiant heat increment:
47,542,246.08 wh.
The orientation of the single slope has a critical effect on heat increment.adjusting the orientation and shape of the building to achieve a good relationship between solar radiation and radiant heat increment, while also considering synergy with natural ventilation technology.
Short-sided double slopeRadiant surface area:
7673.863 m2. Radiant heat increment:
73,880,238.81 wh
There is a positive correlation between the external surface area of the roof slope and the amount of solar radiation.The change of the roof shape of the building itself is used to form an effective shading surface and create a suitable thermal environment for the interior and exterior space of the building.
Long-sided double slopeRadiant surface area:
7733.105 m2. Radiant heat increment:
75,141,923.97 wh.
The surface area and orientation of the long slope determine the amount of solar radiation.Adjust the orientation of the outer surface of the long slope, increase the effective shading surface, and effectively reduce solar radiation.
Short-sided concaveRadiant surface area:
8237.863 m2. Radiant heat increment:
136,742,413.30 wh.
Because the short side is concave and the long side is completely exposed to solar radiation, the surface area exposed to solar radiation is larger than that of other roofs. At the same time, the concave part of the roof is easy to accumulate large energy and is not easy to volatilize.Adjust the orientation of the building, reduce the solar radiation on the long side, rationally use the wind pressure above and below the roof, increase the wind pressure on the welcoming and leeward sides of the gymnasium, strengthen the power of natural ventilation, and accelerate the rapid dissipation of accumulated energy.
Long-sided concaveRadiant surface area:
8133.105 m2. Radiant heat increment:
95,773,630.80 wh.
The concave part of the roof is easy to accumulate large energy and is not easy to evaporate. At the same time, the roof is concave, resulting in a larger surface area than other roofs.The formation of area changes at different interfaces in the wind direction strengthens the power of natural ventilation, accelerates the rapid dissipation of the accumulated energy of the roof, and then aggravates the contrast between the wind pressure of the stadium and the leeward side.
Double-sided concaveRadiant surface area:
8758.484 m2. Radiant heat increment:
116,453,232.40 wh.
Because there are two concave parts, it is easier to accumulate more energy than the single concave, it is not easy to volatilize, and the surface area of the double-concave building is also larger.On the basis of the area change of different interfaces in the wind direction, measures such as reducing the body size coefficient, reducing the total daily average solar radiation of the building, and effectively reducing the external surface area of external heat radiation can be taken.
Double side double slopeRadiant surface area:
7453.484 m2. Radiant heat increment:
89,399,211.34 wh.
All four slopes are likely to have a positive correlation with the amount of solar radiation as a whole.A more desirable body size factor of a building can be studied to form an effective shading surface and an external surface area that reduces heat source radiation.
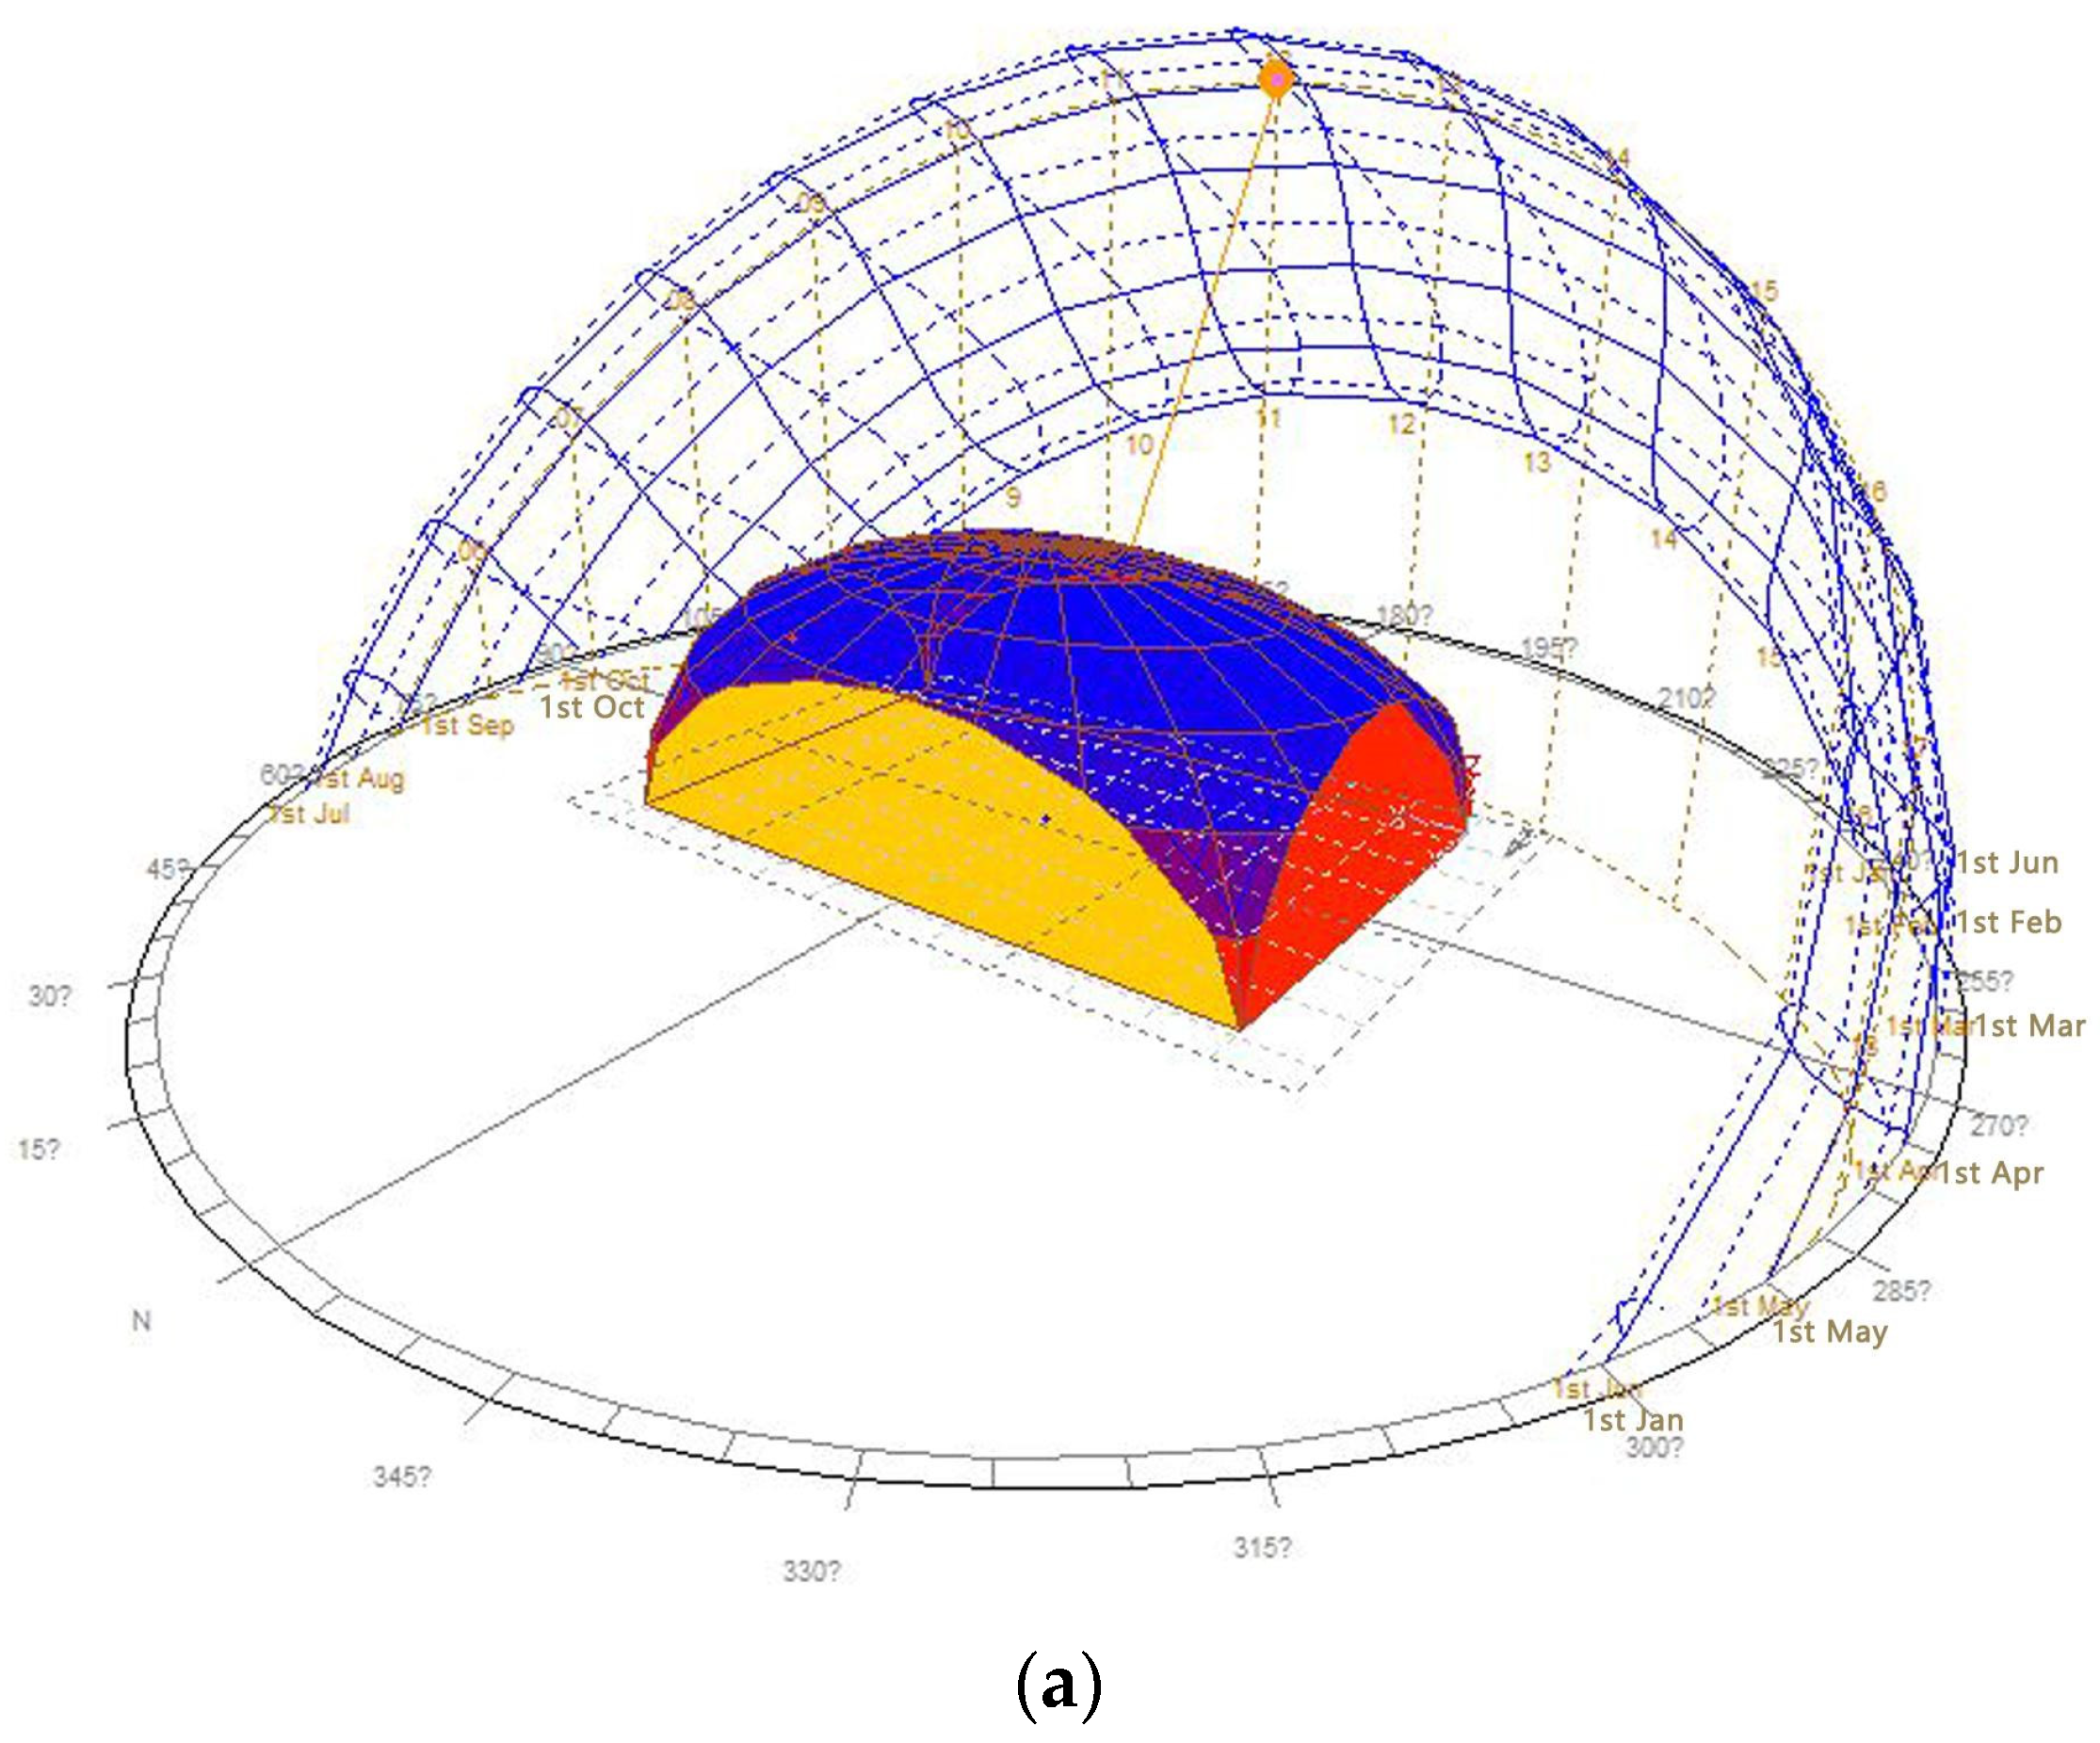
DomeRadiant surface area:
2063.476 m2. Radiant heat increment:
27,436,078.01 wh.
Because the dome is a spherical curved surface, the heating surface area is smaller and the dome has the lowest radiant heat increment, so the dome has a significantly better ability to reduce radiant heat increment than other roof forms.Shading components can be added to block the direct radiation of sunlight to the building interface and improve natural ventilation and other follow-up measures.
StructureUpward canopyThe wind speed stability is not good and the speed reduction is poor.Whirlpools are formed in the northeast and southwest areas, the average wind speed in the audience area on the west side is significantly higher than that on the east side, and a small area of vortex circles appear locally on the northeast side. The static wind area is actively small, the wind speed difference inside and outside the field is not obvious, and the speed reduction is poor.Pay attention to the upward tilt angle of the upward canopy, as a roof with too high an upward tilt angle will cause external airflow to pass above the site and prevent access to the interior space.
Flat
canopy
The wind speed stability is good and the speed reduction is moderate.The average wind speed in the sports area is the smallest under the three canopy profiles; there are many areas with sudden wind speed changes in the entire audience area, such as when the wind speed at the entrance is 15 m/s, the wind speed difference is about 7 m/s, and the area with multiple sudden wind speed changes only appears in the audience area.Reasonable setting of openings in the grandstand area can make the wind environment in the field more uniform and, when selecting unilateral openings, it should be set on the inlet side. When setting up bilateral openings, try to stagger the settings to avoid alignment.
Downward canopyThe wind speed reduction is the best, but the stability is poor.The average wind speed inside the field is large and a large area of low wind speed circle appears locally on the southeast side. The area of static wind is small, the wind speed difference between inside and outside the field is obvious, and the speed reduction is the best.Try to keep a gap height of more than 3 m between the canopy and the stand so that the stability of the wind environment in the field can be improved.
Disclaimer/Publisher’s Note: The statements, opinions and data contained in all publications are solely those of the individual author(s) and contributor(s) and not of MDPI and/or the editor(s). MDPI and/or the editor(s) disclaim responsibility for any injury to people or property resulting from any ideas, methods, instructions or products referred to in the content.

