Abstract
Using coral debris as coarse and fine aggregates and seawater as mixing water has been proposed to address transportation and material shortage issues in island and reef construction projects. However, the utilization of coral may result in impurities, such as shellfish and other marine organisms, which could impact the mechanical properties of the resulting concrete. The goal of this study is to find out how different amounts of shellfish and marine organism impurities affect the mechanical properties and microstructure of coral concrete. This study builds on the process of making full coral concrete. Substitution optimization is carried out using the response surface method (RSM), with the polynomial work expectation serving as a validation measure. The experimental findings indicate that impurities have an insignificant impact on the mechanical properties of coral concrete when their dosage is below 2%, causing a decrease of only around 6%. The mechanical properties of coral concrete containing shellfish and marine organism impurities exhibit a strong correlation at 28 days. SEM and XRD analysis revealed that the primary factor contributing to the decline of mechanical properties in coral concrete with shellfish and marine organism impurities is the weak strength of the impurity shell structure, in addition to the rehydration of internal biomass during the cement hydration process, leading to the formation of numerous small pores within the coral concrete. The results of an ANOVA test indicate that the model is statistically significant, with a p-value of less than 0.05.
1. Introduction
In contemporary times, due to expeditious economic progress, the availability of terrestrial resources has progressively diminished. The importance of developing and utilizing marine resources has become increasingly prominent, and people have accelerated the pace of island development and construction. Concrete is an essential building material for the construction of deep-sea island infrastructure. Still, due to the island’s distance from the mainland, scarce resources on the island, and relatively blocked transportation, most islands lack the sand, gravel, and freshwater required for concrete production [1,2,3]. Transporting concrete from inland to islands is expensive and delays construction periods. To solve this problem, the researchers used sand, coral reefs dredged from ports and waterways, and sand and coral reefs washed together by strong winds and waves to build coarse and fine aggregates, and using seawater instead of fresh water to prepare coral concrete; the collection and application of these materials do not damage the ecosystem [4]. The feasibility of coral concrete has been widely demonstrated [5,6]. Therefore, coral concrete has become an important way to save costs and achieve sustainable economic development of islands and reefs [7,8,9].
Many scholars have conducted a lot of research on coral concrete. Coral aggregates have the characteristics of light weight and high porosity [10,11], resulting in obvious brittleness and poor compressive strength of coral concrete [12]. In addition, due to the high porosity of coral aggregates, coral concrete needs more water during preparation to achieve the corresponding workability and strength [13]. Akbar M [14] studied the constitutive relationship of coral concrete under uniaxial compression, established a nonlinear hyperbolic equation for the concrete material, and fitted a nonlinear elastic-plastic model suitable for sustainable concrete. Under the same water-cement ratio and curing conditions, Yu Qiang et al. [15] found that coral reef sand seawater concrete has a faster early compressive strength growth rate than regular concrete, and its compressive strength increases linearly with the net water-binder ratio. Su Chen et al. [16] found that the compressive failure mode of coral concrete is not affected by the type of coral aggregate. Cao, H et al. [17] found that coral concrete and coral concrete that has been treated with alkali fail in the same way under uniaxial compression and that all coral reefs are completely crushed. Su Weiwei [18] et al. found that coral aggregate concrete exhibits higher early strength and better fatigue and impact resistance compared to the same natural concrete strength grade. In addition, many studies have shown that polypropylene fiber (MPPF), imitation steel fiber (ISF) and other fiber materials incorporated into coral concrete can overcome environmental problems, solve the shortcomings of brittle failure of coral concrete, and have a certain enhancement effect on its ultimate tensile strain and crack control, and enhance the sustainability of concrete [19,20,21].
Currently, research on coral concrete mainly focuses on mechanical properties and durability [22,23,24,25,26]. However, due to the limited construction area on islands and the poor construction environment, raw materials obtained from dredging ports and waterways cannot be well screened and cleaned, resulting in some marine biological impurities being included in them [27]. So far, there have been few reports on coral concrete mixed with marine biological impurities at home and abroad. Therefore, carrying out corresponding research is of practical significance for the practical engineering application of coral concrete. This study investigates the trial mix and preparation process of seawater-mixed full coral concrete using the concrete preparation principle, completes the exploration of raw material configuration and preparation procedures, and defines the fundamental mix ratio. The concrete property prediction indicator is obtained through optimization using the Response Surface Method. The optimization outcomes are also acceptable in principle. Based on determining the optimal mix ratio of full coral concrete, this paper investigates the basic mechanical properties such as compressive strength, axial compressive strength, splitting tensile strength, and flexural strength of concrete mixed with different amounts of marine biological impurities and analyzes the impact of different dosages of marine biological impurities on the strength of concrete. This paper also conducts SEM and XRD observations to examine the hydration products and microstructure of coral concrete mixed with marine biological impurities, revealing the erosion damage mechanism and the influence mechanism of marine biology on the microstructure and properties of coral concrete.
2. Raw Material Performance
2.1. Cement
Due to the low strength of coral aggregates, it is necessary to increase the cement grade to improve the overall strength of coral concrete. This experiment used PO42.5 ordinary Portland cement, suitable for general industrial and civil buildings, produced by Jiangsu Helin Cement Co., Ltd. (Zhenjiang, China). Its specific physical and mechanical properties are shown in Table 1 [28]. The cement is a water-hard cementitious material, the hydration reaction occurs after adding water, the main chemical reactions are silicate hydration reaction and aluminate hydration reaction.

Table 1.
Physical and Mechanical Properties of Cement.
2.2. Water
Artificial seawater is used for mixing coral concrete. As the composition of seawater varies in different coastal ports, to avoid the influence of different seawater ratios on the analysis of test results, this experiment uses uniformly proportioned artificial seawater, mainly composed of NaCl, MgCl2, Na2SO4, CaCl2, etc. The mass concentration of Cl is about 19.00 g/L. The composition of the seawater is shown in Table 2 [29].
Table 2.
Chemical Composition of Artificial Seawater.
2.3. Reducing Agents
To improve the workability of concrete and disperse cement particles more easily during mixing, reducing agents need to be added. This article selects the high-efficiency reducing agent of Polycarboxylate produced by Jiangsu Subote, whose basic performance parameters are shown in Table 3.
Table 3.
Polycarboxylate high-efficient reducing agent parameters.
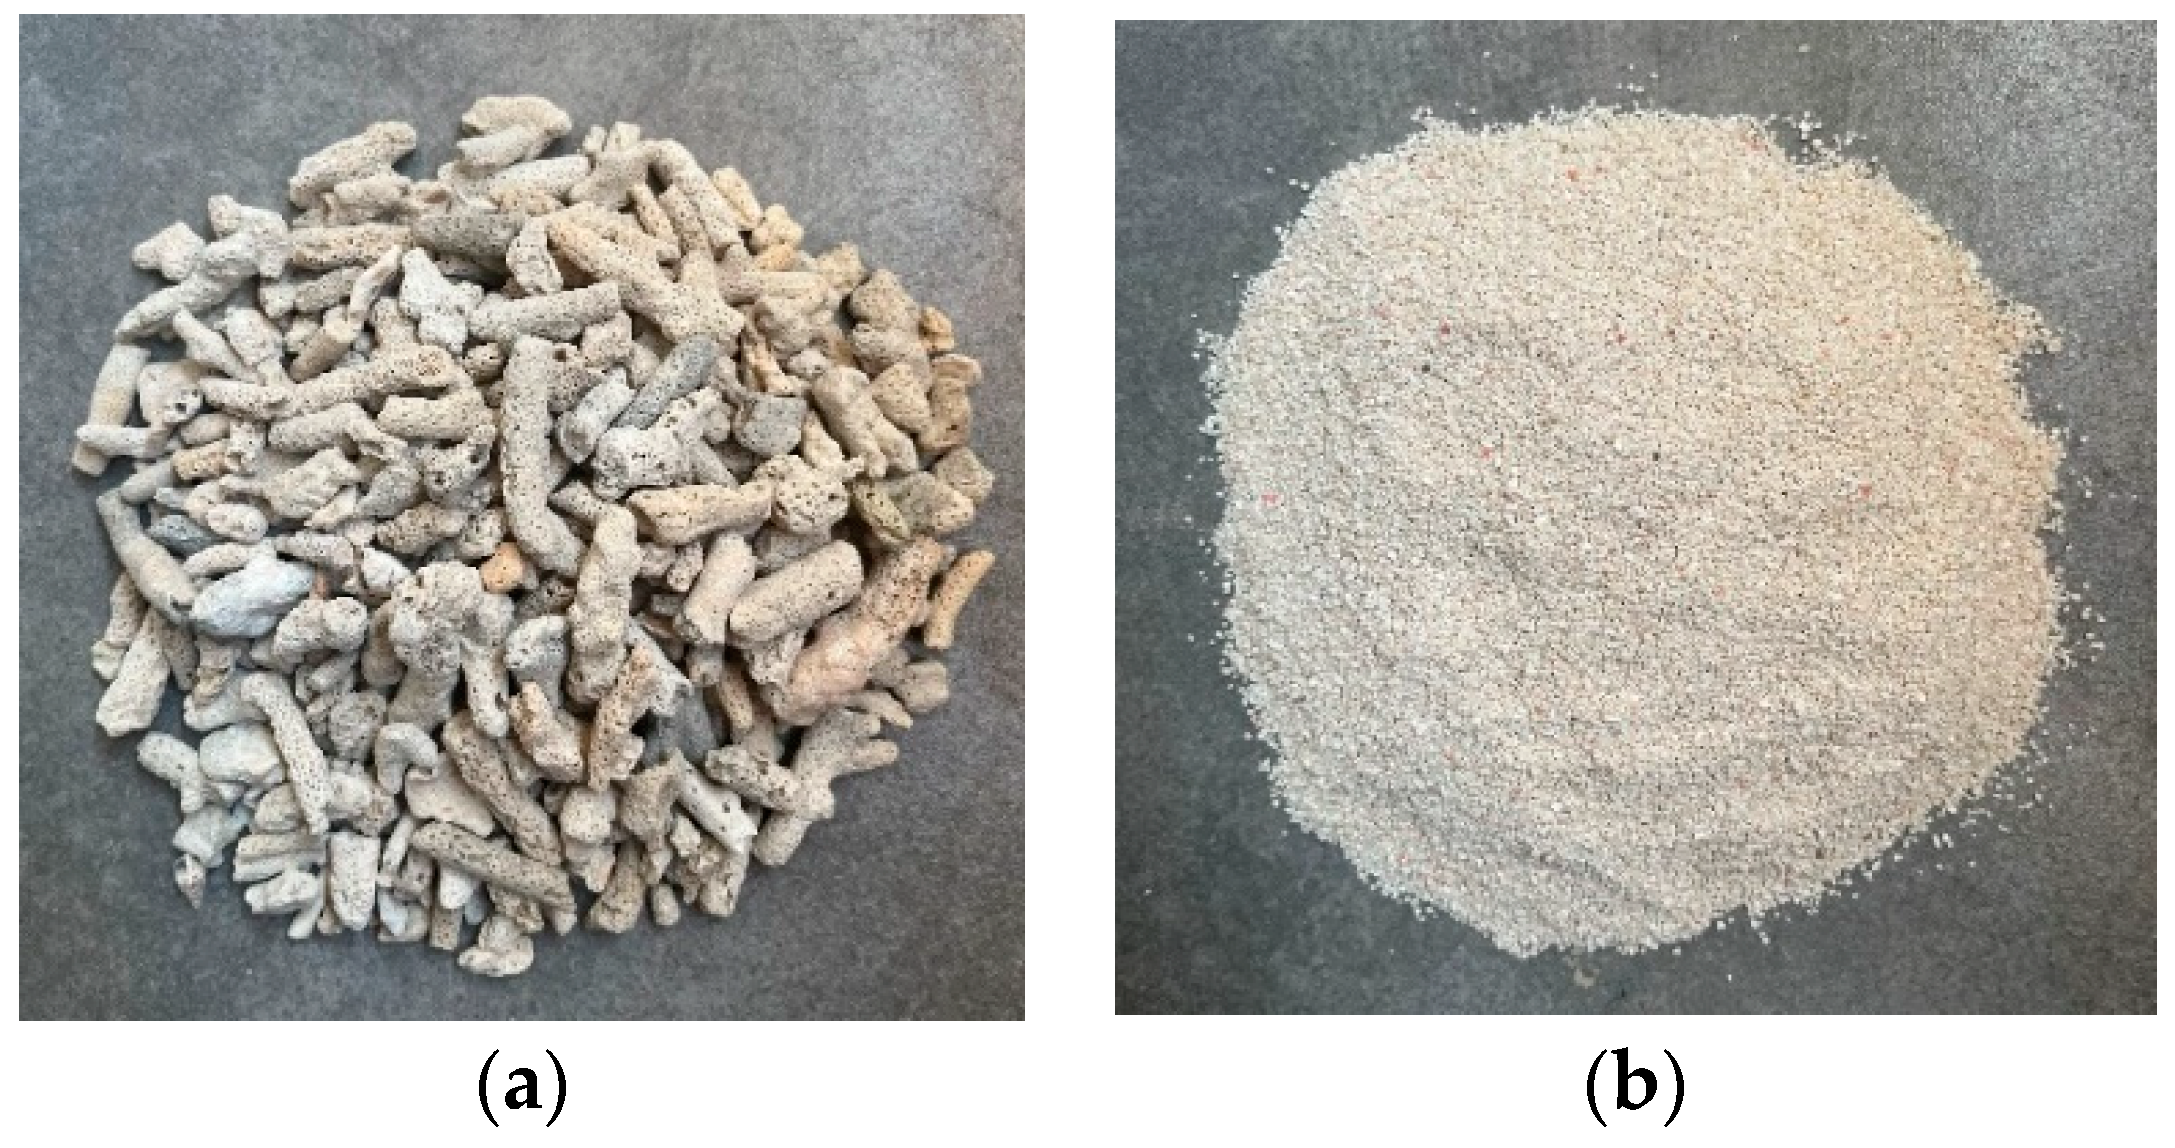
2.4. Coral Coarse Aggregate
The coarse aggregate is from coral reefs near a particular island in the South China Sea. The aggregate surface is uneven with many apertures, and many coral reefs in the form of rods, antlers, and slabs exist, as shown in Figure 1a. Due to the different shapes and sizes of corals, the particle size distribution is uneven. Therefore, the coral aggregate should be crushed and sieved before being mixed with concrete [30]. The internal porosity of the coral coarse aggregate is high, and the density is low. According to the classification standards for aggregates, it belongs to the lightweight aggregate category. The coarse aggregate particle size is graded between 5 and 20 mm and is continuously screened. In this paper. The physical parameters of coral coarse aggregate were assessed according to “Technical Standard for the Application of Light Aggregate Concrete” (JGJ/T12-2019) [31]; the results are shown in Table 4.
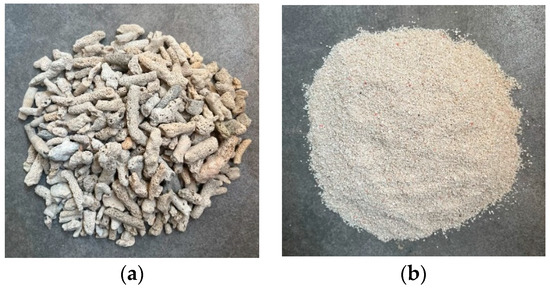
Figure 1.
(a) Coral reef; (b) Coral sand.
Table 4.
Physical Property Parameters of Coral Coarse Aggregate.
2.5. Coral Fine Aggregate
The fine aggregate used in this study is coral sand from the South China Sea region of China, as shown in Figure 1b. Coral sand is mainly composed of calcium carbonate, has a well-graded particle size distribution, is classified as Zone II sand, and falls under the category of medium sand according to the fineness modulus. The physical properties of the coral sand used in this study were determined according to the “Experimental Regulations for Hydraulic Concrete” (SL/T 352-2020) [32], with the results presented in Table 5.
Table 5.
Physical Properties of Coral Sand.
2.6. Marine Shellfish Impurities
The marine shellfish impurities used in this experiment were oysters and mussels that are easily attached to coral reefs and representative in the South China Sea [33], with their main components shown in Table 6. The standard form of oysters and mussels is relatively large, so they cannot be uniformly mixed into the concrete specimens. Therefore, they were crushed into 2–3 cm fragments before mixing. The proportions of oysters and mussels in the marine shellfish impurities were mixed at a ratio of 1:1. The dosage of marine shellfish impurities is shown in Equation (1).
In the equation: —Quality of coarse aggregates of coral concrete;
—Quality of marine shellfish biological impurities;
Table 6.
Main Chemical Components of Yibeis and Oysters.
Table 6.
Main Chemical Components of Yibeis and Oysters.
| Creature | Type | Water | CaCO3 | Protein | Fat | Other | Carbohydrates |
|---|---|---|---|---|---|---|---|
| Mussel | Content/% | 28 | 54 | 5 | 2 | 8 | 3 |
| oysters | 30 | 62 | 2 | 1 | 2 | 3 |
2.7. Response Surface Method
Quantifiable mathematical frameworks that illustrate responses within a sequence of input variables can be generated using the response surface method (RSM) [14]. The RSM establishes a polynomial connection between the input and the output variables, reflecting the relevance and importance of the demonstration. This illustration may be used to foresee and enhance the response of a mixed design. The initial stage in building a statistical model is collecting experimental data and choosing a suitable model. The prediction is based on how well the model works. Design Expert v11 [34,35] optimized the exam approach, numerical equations, factual research, and responses. Examining variance (ANOVA) is useful for designing the relationship between the inputs and the output. This study examines three types of reactions: compression strength (y1), splitting tensile strength (y2), and flexure strength (y3). Element x1 is coral aggregate, and x2 is the Impurity content in this reaction.
3. Experimental Design
3.1. Concrete Mix Design
Based on the principles of concrete preparation, research was conducted on the trial mixing and preparation process of sea-water mixed whole coral concrete. The raw material configuration and preparation process were explored, and the primary mix ratio was determined. On this basis, a three-factor, three-level orthogonal experiment focused on cement dosage, water-binder ratio, and sand ratios. The aim was to achieve concrete’s most important compressive strength while meeting the basic work performance requirements [36]. The optimal cement: coral sand: coral reef ratio for whole coral concrete was 1: 1.34: 1.34, with a water-binder ratio of 0.35. Referring to relevant literature [37], the impurity content is about 1–6%, and several groups of typical groups are selected for qualitative research. The calculation results were incorporated into marine shellfish biological impurities according to formula 1. The mix ratios for each group of coral concrete are shown in Table 7.
Table 7.
Coral Concrete Mix Design.
This article aims to designate the target strength grade of coral concrete as C30. Due to its porous appearance, coral aggregate has a high water absorption rate. Therefore, the regular amount of water used in mixing concrete cannot meet the requirements, and additional water is needed. The extra water amount is 8% of the total mass of coral reefs and coral sand. The water-reducing agent is expressed as a percentage of the cement mass.
3.2. Specimen Preparation and Maintenance
Compared with ordinary stone, coral aggregate has a high porosity, low density, and strong water absorption properties. It belongs to the category of lightweight aggregate, and its various shapes, such as long strips and rods, are abundant. Therefore, the conventional concrete mixing method is unsuitable for all-coral concrete. The preparation of all-coral concrete in this article refers to the “Technical Specification for Lightweight Aggregate Concrete” (JGJ/T 12-2019) [38].
There are many types of blocks for different tests, and the specimen sizes used in the cube compressive strength test and split tensile strength test are ; the size of the specimen used in the axial compressive strength test is . The specimen size used in the flexural strength test is .
In the traditional mixing process, shellfish marine impurities will agglomerate and mix into the concrete during the mixing process with cement, which affects the test results. The mixing process used in this experiment is the second-feeding method, which has better effects than the traditional one. Although the process is slightly more complicated, the result is better [39].
The specific feeding and mixing steps after the improvement are as follows:
- (1)
- Mix coarse and fine aggregates, some water, and shellfish marine impurities for the 40 s.
- (2)
- Add cement and mix for 60 s.
- (3)
- Add the remaining water and admixtures to the mixture, continue to mix for 40 s, and then discharge.
Due to the abundance of rod-shaped and strip-shaped coral aggregates, their strength and density are low and prone to float on the mixture. Therefore, their bonding performance with cement mortar could be better. A one-time molding will lead to low compactness and more holes in the bottom of the mold, and the concrete is prone to segregation if the vibration time is too long. Therefore, the concrete is divided into two parts and put into the mold twice. The first time, add 1/2 of the concrete and vibrate for about the 20 s, then add the remaining 1/2 of the concrete and vibrate on the shaking table. After the vibration, we level the surface of the specimen and put it into the standard curing room for maintenance. After 24 h, the specimen is numbered with a waterproof marker and put into the curing room until the specified age is reached for testing its performance.
3.3. Performance Testing Methods
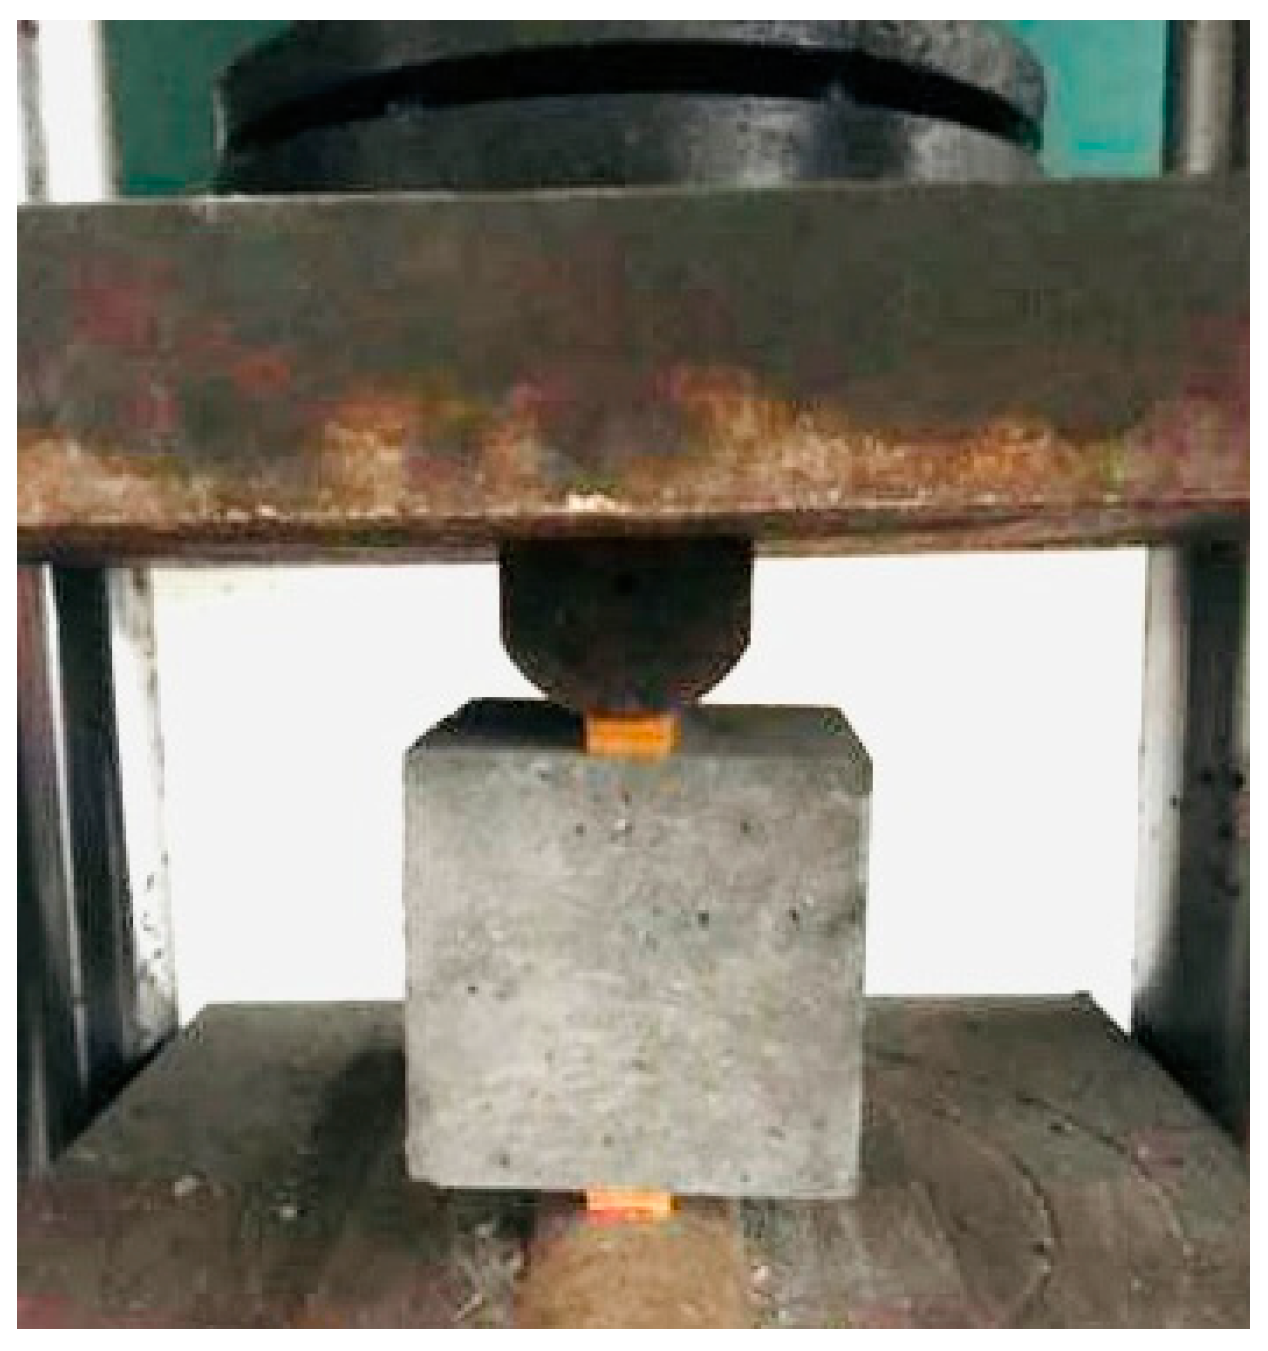
3.3.1. Cubic Compression Strength Test
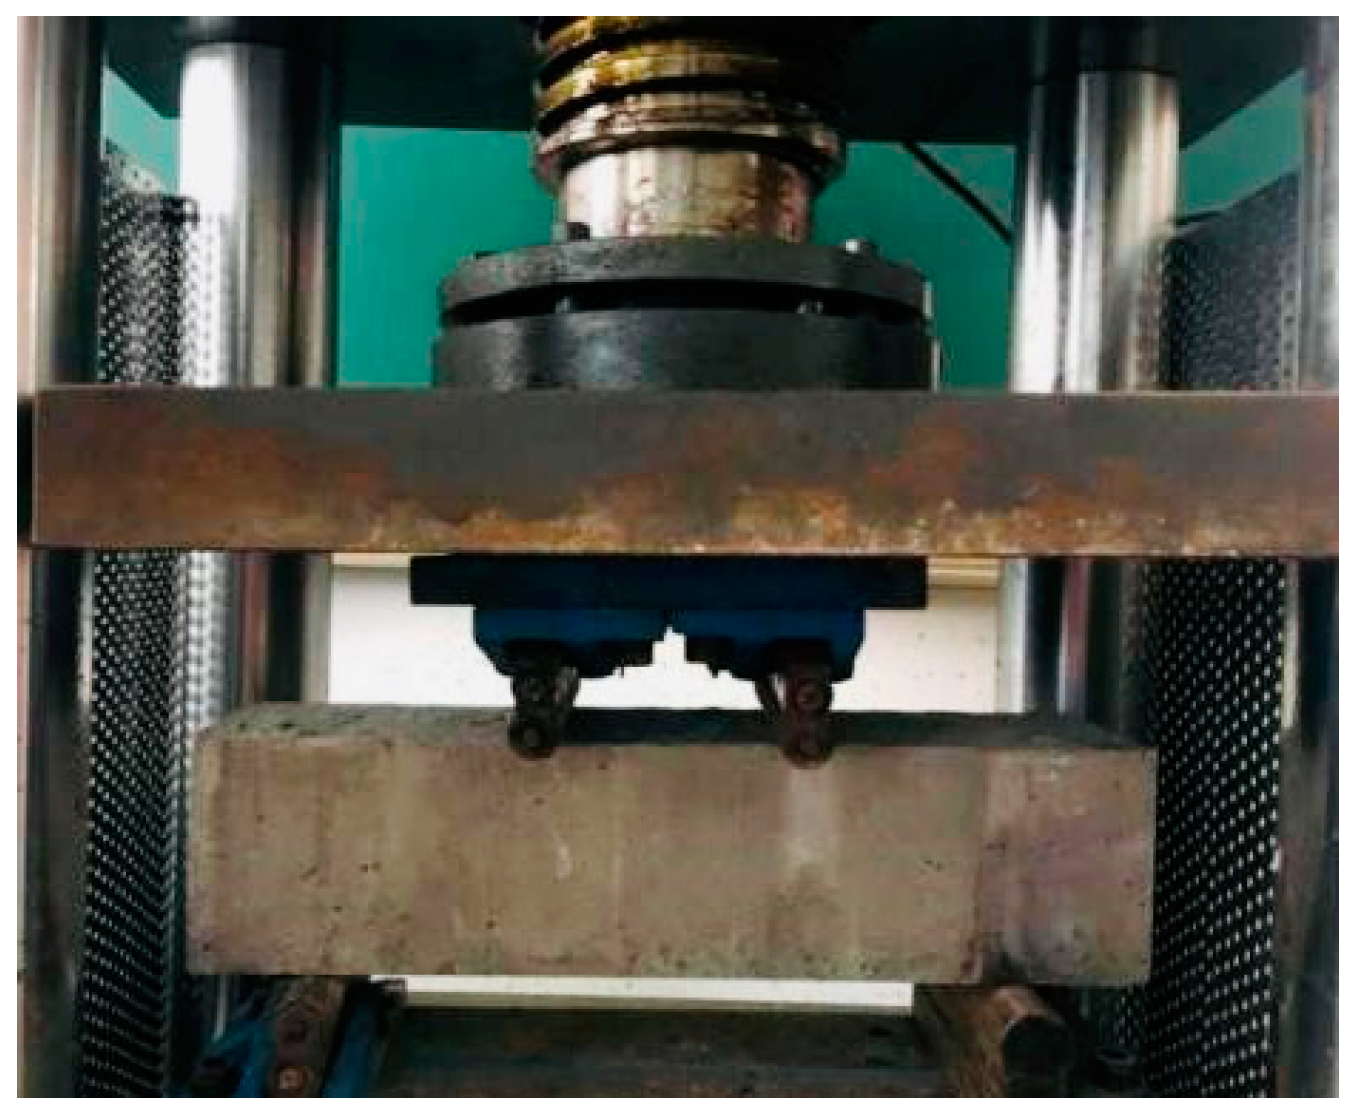
The experiment is carried out according to the standard test methods for concrete’s physical and mechanical properties specified in GB/T 50081-2019 [40]. The test uses non-standard specimens of varying sizes and multiplies the results’ strength values by a conversion factor of 0.95. The concrete specimens are taken out of the curing room at 3 d, 7 d, 1 4 d, and 28 d, respectively, while the remaining tests are conducted after completing the 28 d curing. The cube compressive strength test diagram is shown in Figure 2.

Figure 2.
Cubic compression specimen placement diagram.
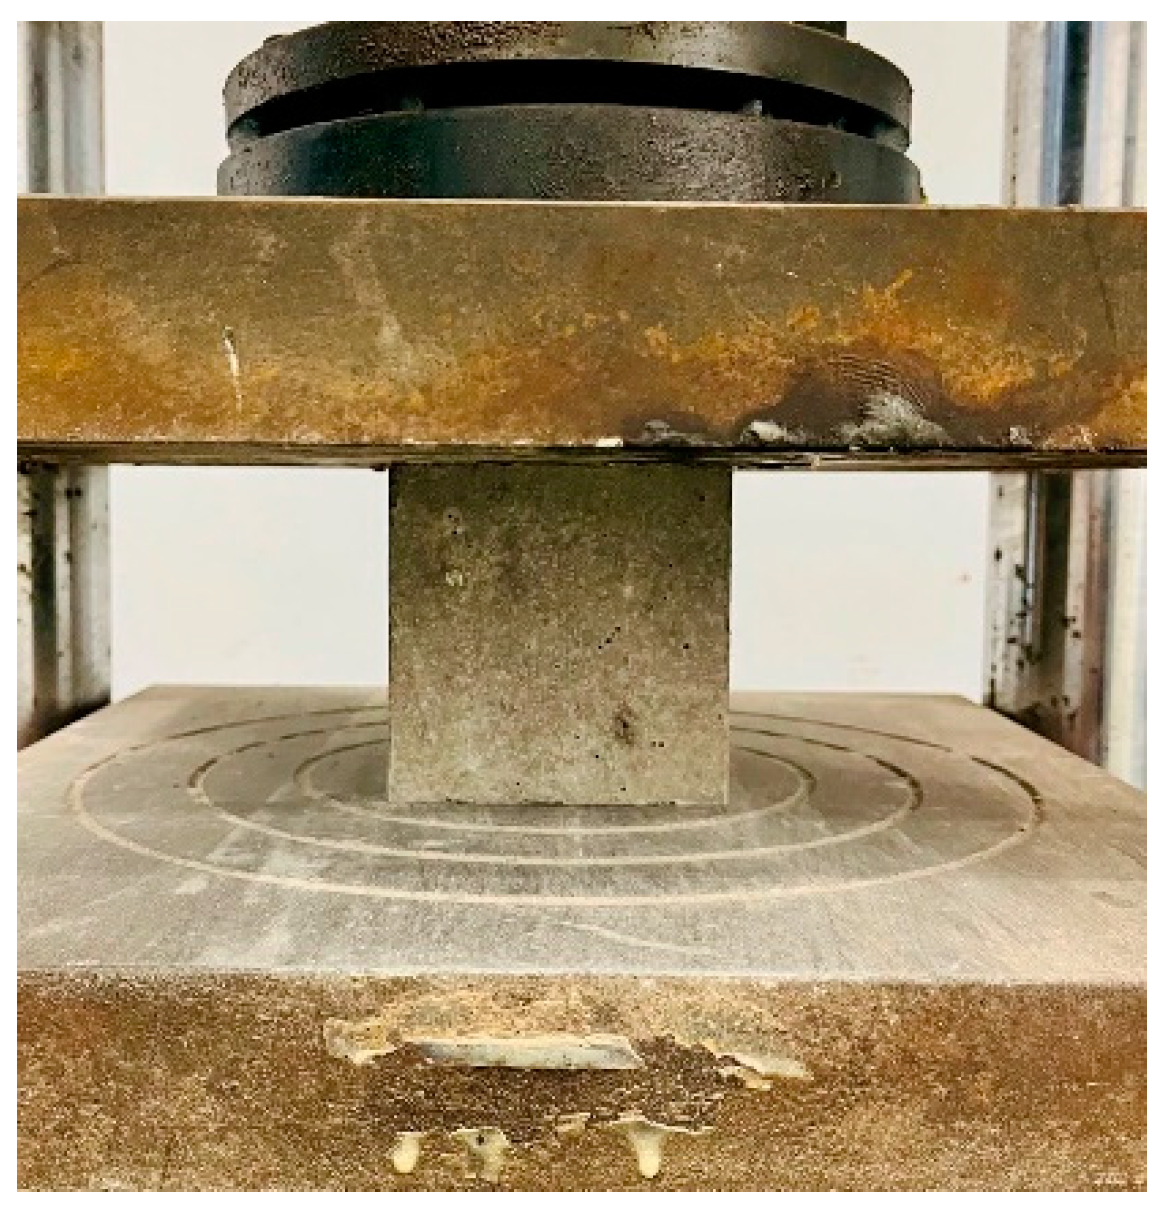
3.3.2. Axial Compressive Strength Test
Select 100 mm × 100 mm × 300 mm non-standard specimens, reduce the test results by a reduction factor of 0.95, and remove them for testing after curing for 28 days. The axial compressive strength test is shown in Figure 3.
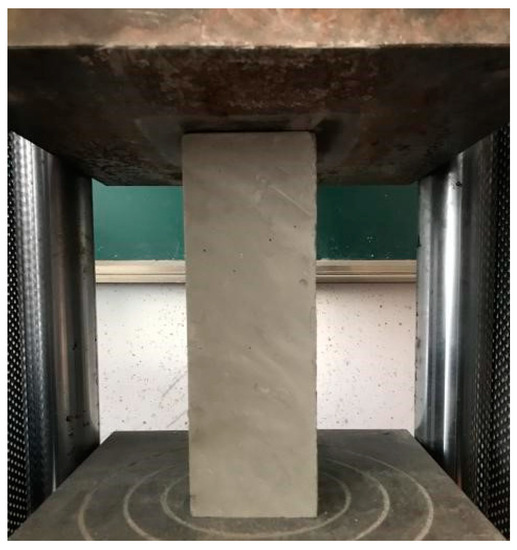
Figure 3.
Axial compressive strength specimen placement diagram.
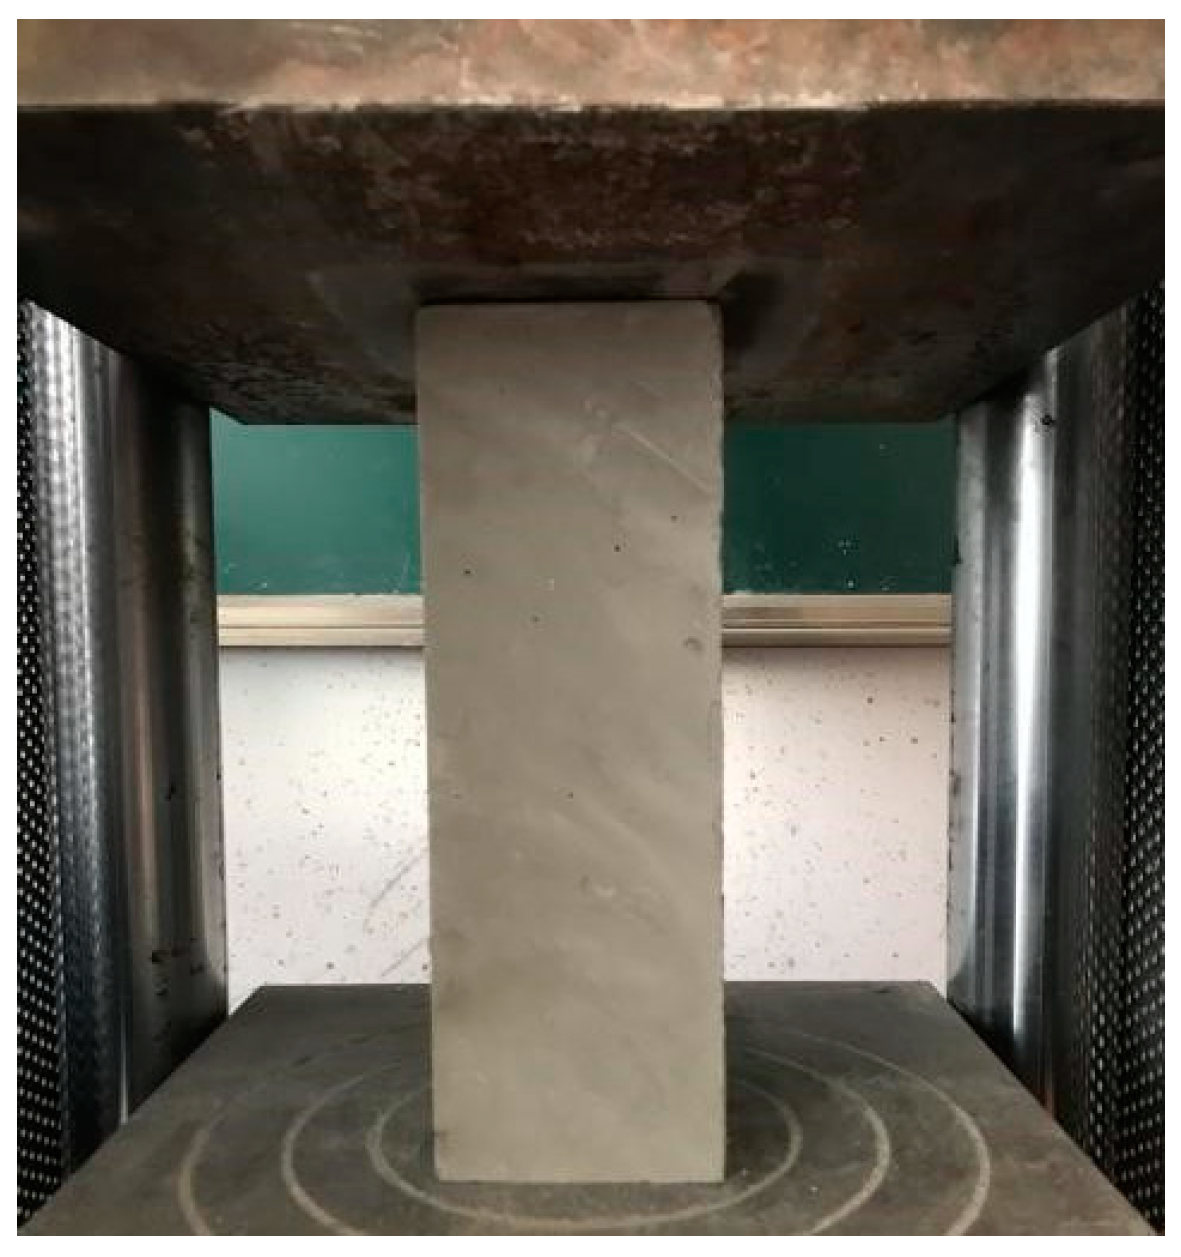
3.3.3. Splitting Tensile Strength Test
The test uses non-standard specimens, and the test results are multiplied by a reduction factor of 0.85.
The Splitting tensile strength test is shown in Figure 4.

Figure 4.
Split tensile strength specimen placement diagram.
3.3.4. Flexural Strength Test
Apply a three-point bending method for loading with a specimen size of 100 mm × 100 mm × 400 mm. The test results must be multiplied by a reduction coefficient of 0.85. As shown in the following Figure 5.

Figure 5.
Flexural strength specimen placement diagram.
3.3.5. SEM Scanning Electron Microscope and XRD Diffractometer
In this experiment, the KESSEM EM-30AX Plus emission scanning electron microscope produced by COXEM Co., Ltd. in Daejeon Metropolitan City, Republic of Korea was used for observation. Smooth surface samples were selected as test samples and treated with gold spray before testing. Imaging of the sample surface through electron beam scanning was used to qualitatively and semi-quantitatively analyze the microstructure of the sample. Sample XRD diffraction analysis was conducted using a TD-3500 diffractometer produced by Dandong Tongda Technology Co., Ltd., Dandong City, Liaoning Province, China with scanning angles of 10–80° and a scanning interval of 0.03° to determine the sample’s crystalline phase and crystal size.
4. Experimental Results and Analysis
4.1. Compressive Strength of Cubes
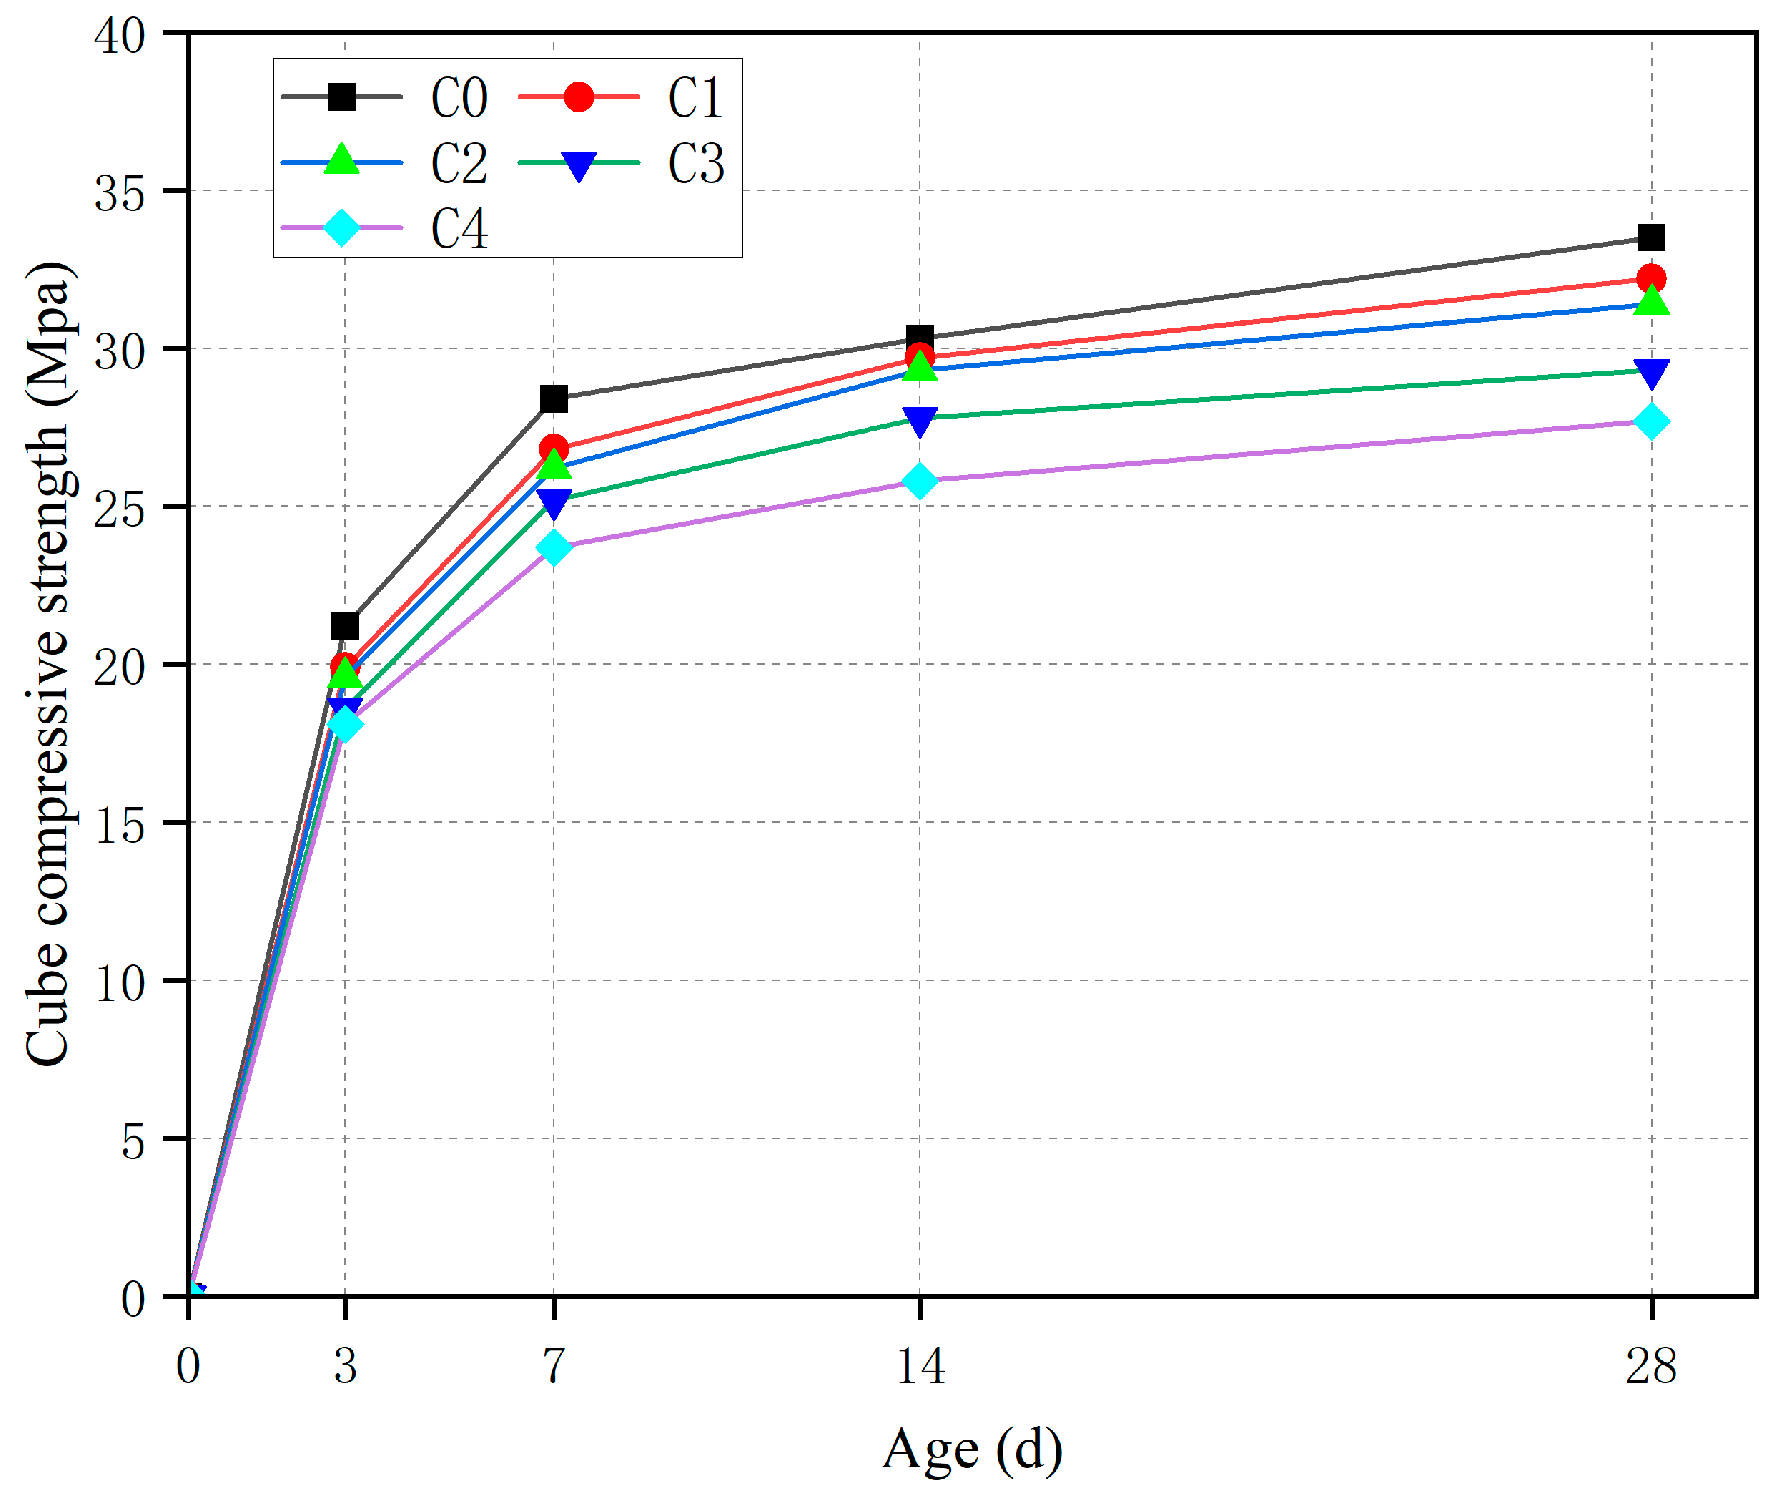
Table 8 shows the compressive strength values of four species’ cubes of different ages and different amounts of shellfish and marine impurities, as well as the values for the control group, all of which were cured under standard conditions. It can be observed that the compressive strength of all groups increased to varying degrees with age. However, among the cubes made with coral aggregate, an increase in shellfish marine impurities decreased compressive strength at the same age. Compared to the control group C0, the cubes containing C1, C2, C3, and C4 shellfish marine impurities had decreased compressive strength by 3.9%, 6.2%, 12.5%, and 17.3%, respectively, at the 28-day age. The above statement indicates that an increase in the amount of shellfish marine impurities leads to a gradual decrease in compressive strength. As coral aggregate has a low density and absorbs some water during concrete mixing, the actual water-to-cement ratio of the concrete is lower than expected [28]. The attachment and filling of the paste within the coral aggregate partially enhance aggregate strength, which is beneficial for early strength development. Therefore, cubes with lower amounts of shellfish marine impurities showed higher strength before curing, and the strength difference between them and the higher-amount group was relatively significant. As shown in Figure 6, the curve of compressive strength variation for concrete with different amounts of shellfish marine impurities was lower than that of the control group C0 at 7 days.
Table 8.
Compressive strength of cubes (Mpa).
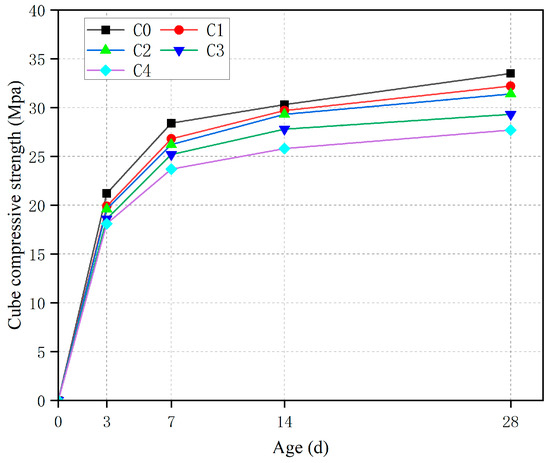
Figure 6.
Compressive Strength of Cubes with Different Dosages.
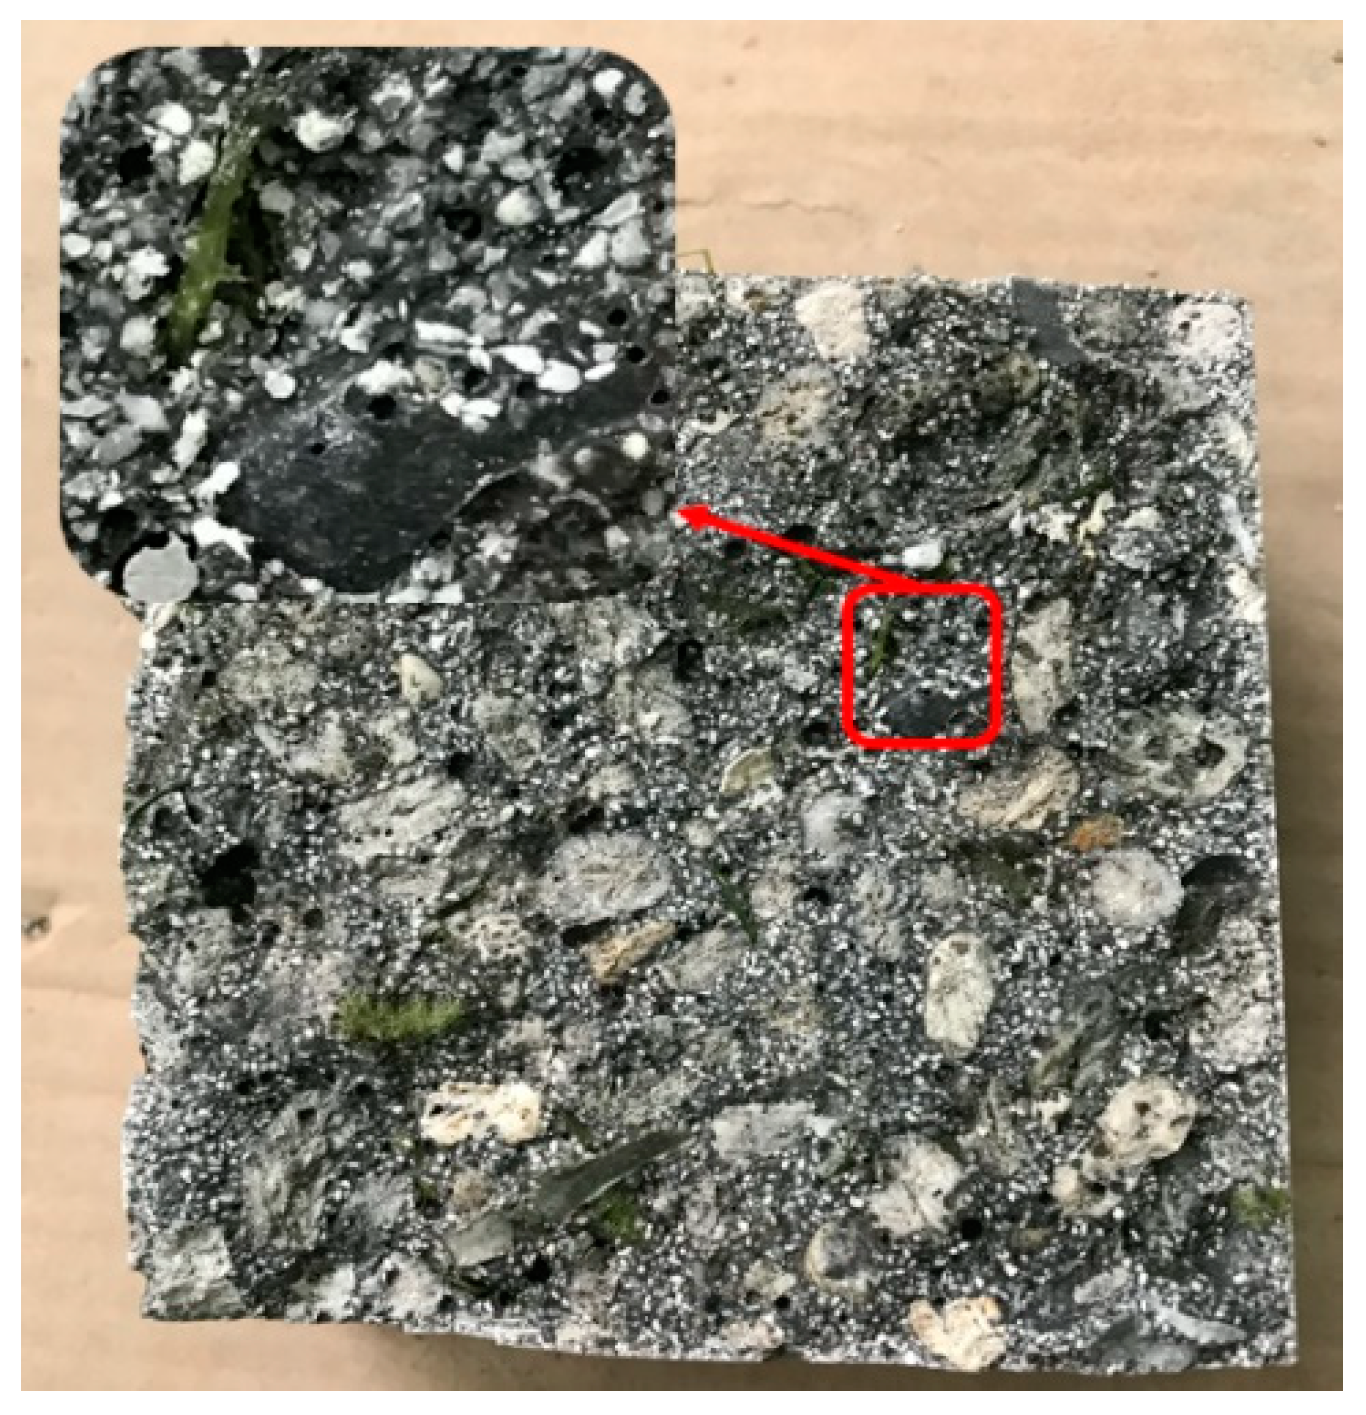
Additionally, the compressive strength of cubes made with C2 shellfish marine impurities was not significantly different from that of C1 cubes. The observed phenomenon could be attributed to the impact of shellfish marine impurities on the hydration process in coral concrete. As coral aggregate has low strength and porous characteristics that increase water absorption, it cannot effectively suppress the development of fracture surfaces, and cracks often penetrate along the aggregate. The addition of shellfish marine impurities exacerbates this phenomenon, this is shown in Figure 7.
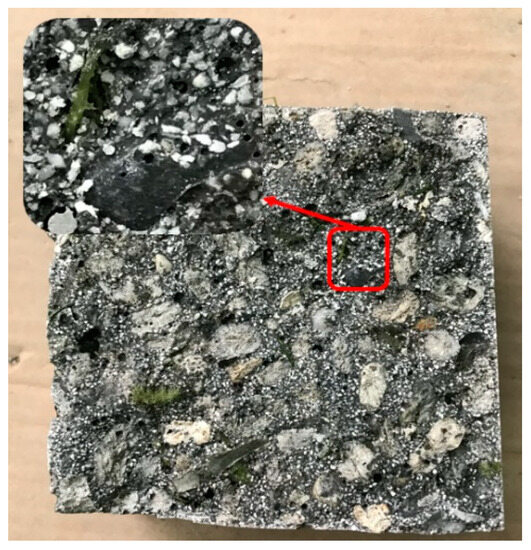
Figure 7.
Photographs of damaged specimens.
As shown in the 2D contour plot of coral concrete strength in Figure 8b, the red zone denotes an area of higher strength, whereas the green zone denotes an area of lower strength. The compressive strength is greatest in the red zone, then in the yellow zone, and finally in the green zone, where it is weakest. At 2% and 100%, respectively, the optimum compressive strength for impurity content and coral aggregate was 32.2 MPa. The weak interplay between the components (proportions of impurity content and coral aggregate) was reflected in the asymmetrical appearance of the outlines. Figure 8a,b of the 3D response surface plot shows that as impurity content concentration increases, compressive strength decreases drastically.
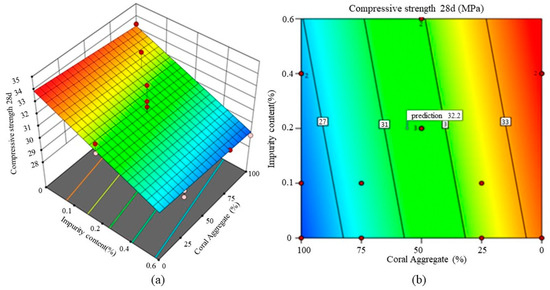
Figure 8.
(a) 3D Surface Diagram for Compressive Strength (b) 2D Contour Plot for Compressive Strength.
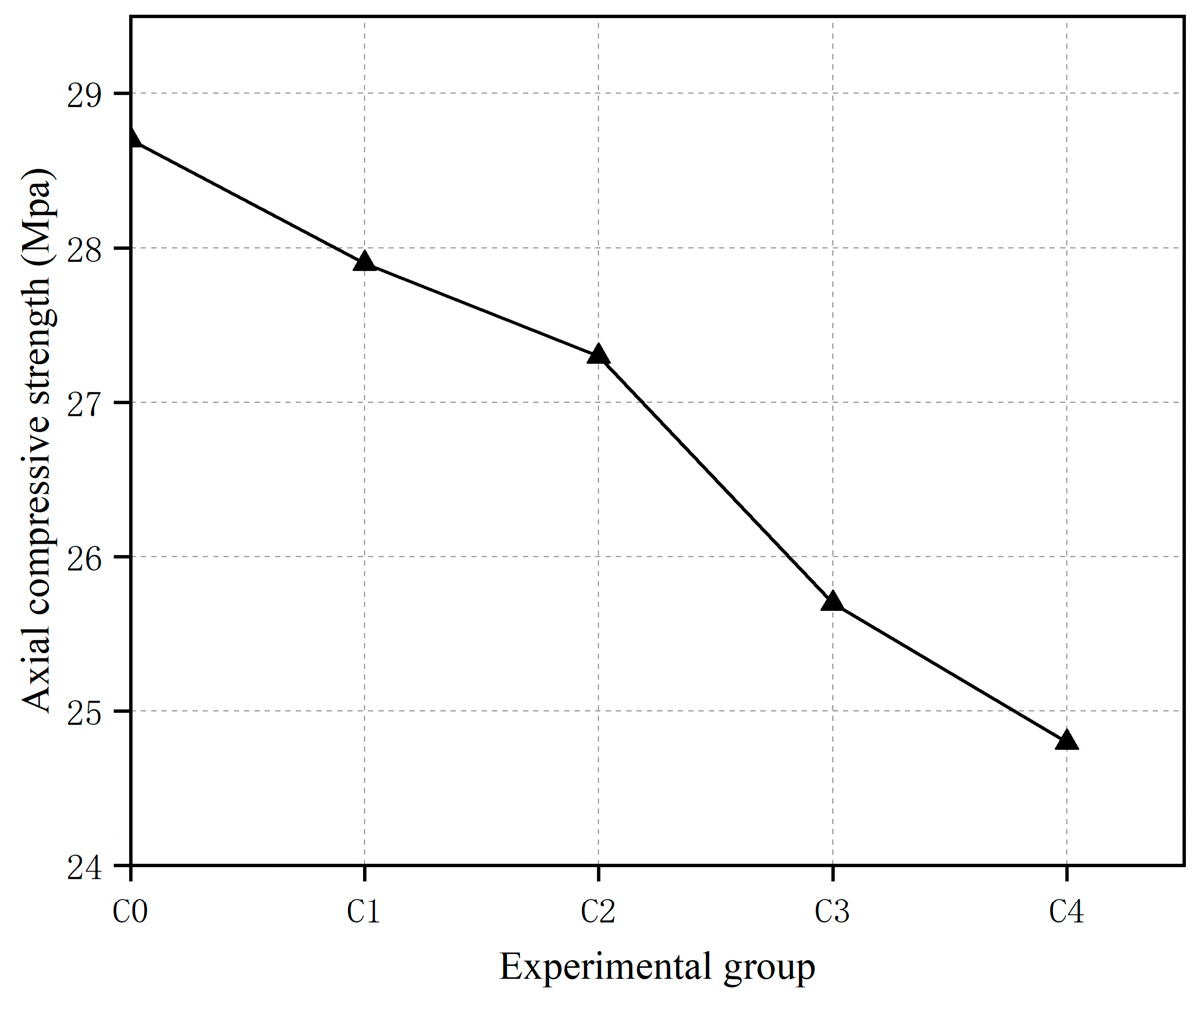
4.2. Axial Compressive Strength
Table 9 presents the values of the axial compressive strength of coral concrete prisms containing impurities of shellfish marine organisms at 28 days of age. Figure 9 shows the line graph of the axial compressive strength of coral concrete at 28 days of age. Similar to the compressive strength values of cubes, the impurities of shellfish marine organisms harm the axial compressive strength of coral concrete. As shellfish marine organisms’ impurities increase, coral concrete’s axial compressive strength shows a decreasing trend. The effect on the axial compressive strength is insignificant at lower dosages, and the results of the dosage groups C1 and C2 do not differ substantially. However, when the dosage reaches 4%, the axial compressive strength significantly decreases.
Table 9.
28-Day Axial Compressive Strength (MPa).
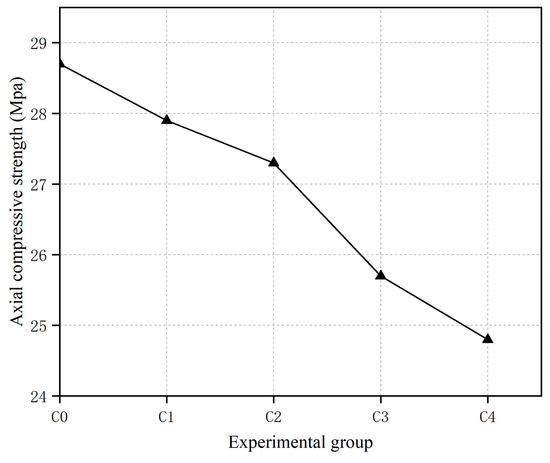
Figure 9.
Axial compressive strength curve of coral concrete under different levels of 28 d doping.
Figure 10 shows a two-dimensional contour plot (b) and a three-dimensional response surface plot (a) of Axial compressive strength obtained by the RSM. The optimal composition of 2% impurity content and 100% coral aggregate yielded an Axial compressive strength of 27.3 MPa. On the other hand, this model’s impurity content variable has a steep slope, suggesting that small changes in impurity content can substantially impact flexural tensile strength. An increase in impurity content decreases Axial compressive strength when the proportion of coral aggregate in the design mix remains the same. The straight lines in the contour plot corroborate this, showing that the yellow, green, and blue regions are rather evenly dispersed over the graph.
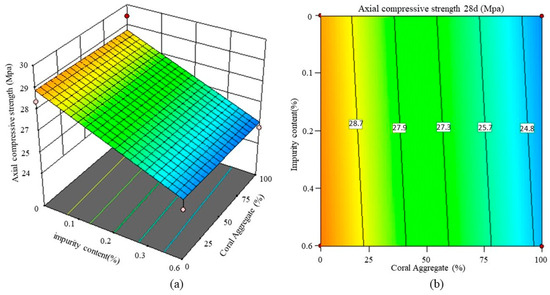
Figure 10.
(a) 3D Surface Diagram for Axial Compressive Strength (b) 2D Contour Plot for Axial Compressive Strength.
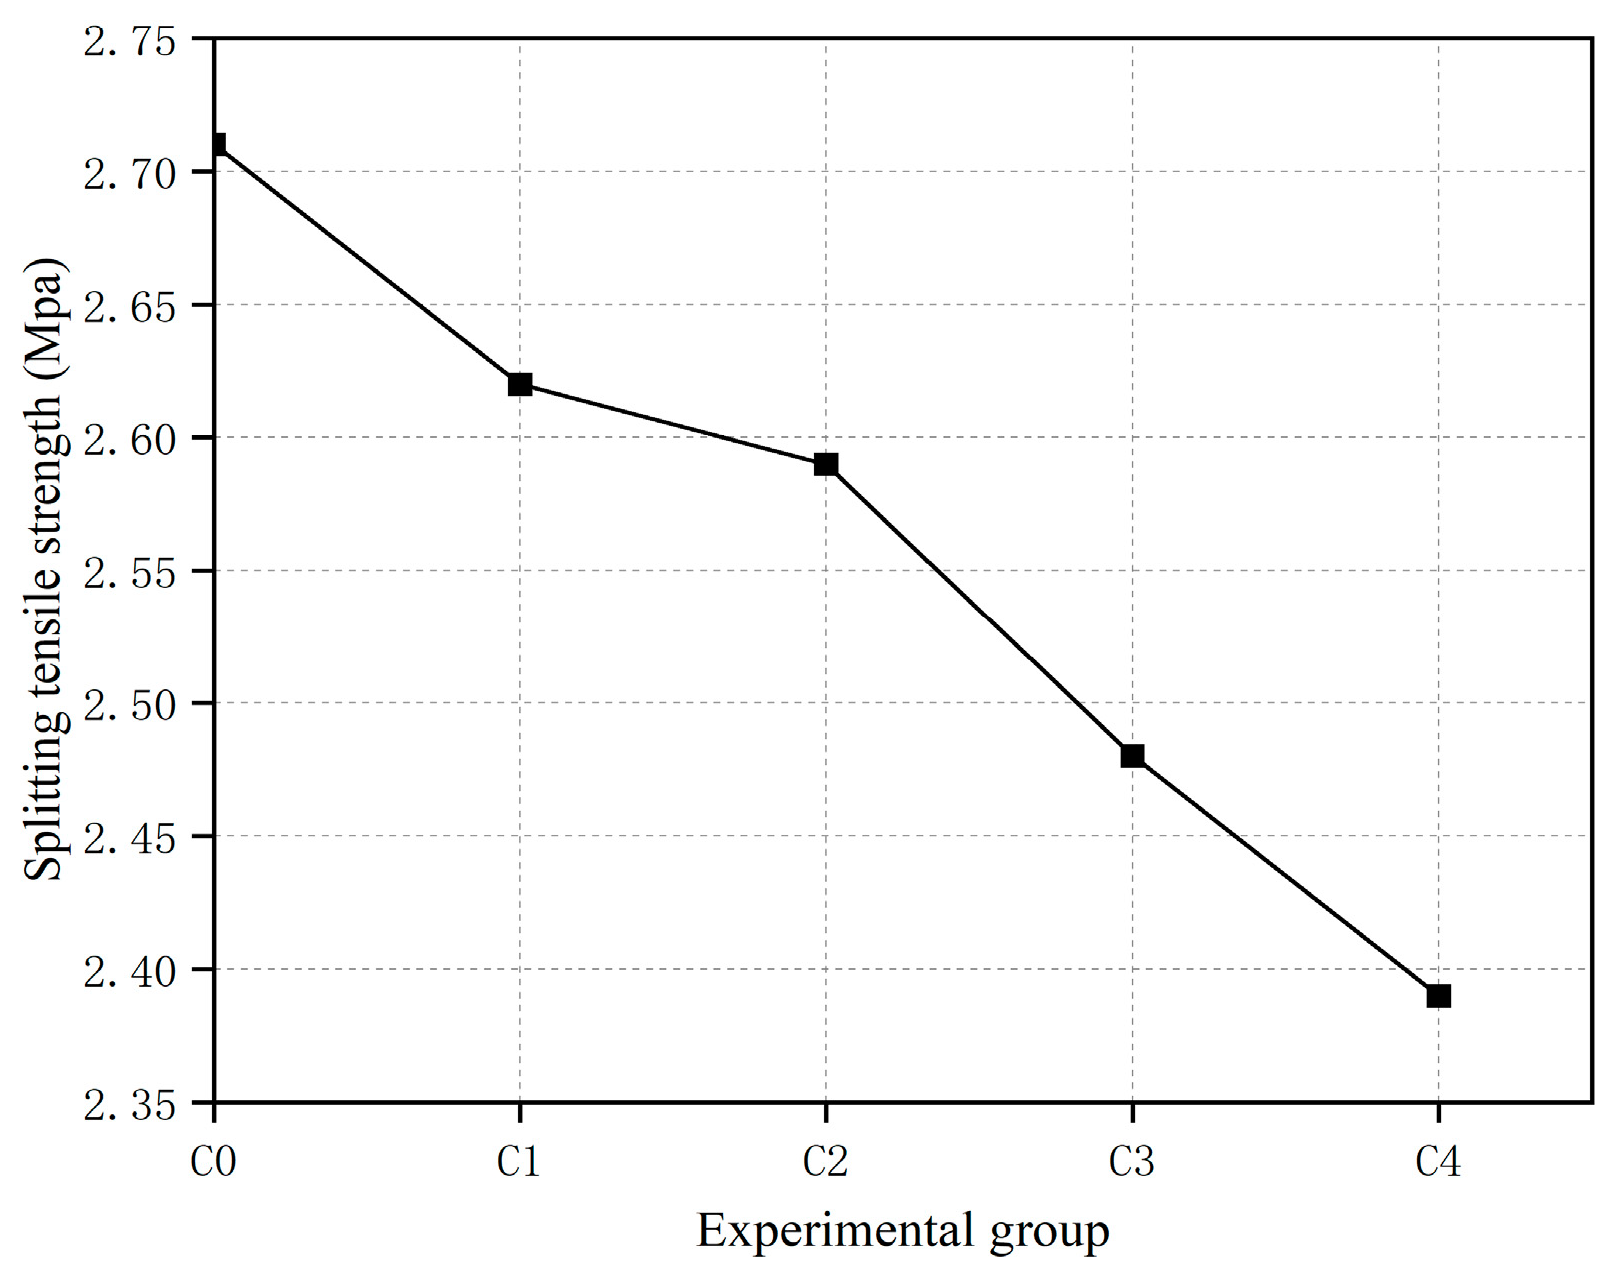
4.3. Split Tensile Strength
The results of the split tensile strength test for specimens cured for 28 days are shown in Table 10. The split tensile strength test results for specimens with various doses under standard curing conditions are shown in Figure 11. As can be seen from Figure 11, the split tensile strength of coral concrete decreases with an increase in dosage. When the impurity content of shellfish marine impurities is 6%, the reduction in split tensile strength of coral concrete under standard curing conditions at 28 days reaches 12% compared to the reference concrete. During the experiment, regardless of whether or not the specimens had impurities from shellfish marine organisms, they all exhibited brittle failure. During the test, the crack propagation rate was rapid. Near the ultimate failure load, the crack rapidly propagated along the longitudinal direction from both ends of the specimen, with clear aggregate fracture sounds. Subsequently, the specimen was split into two halves, and the coral aggregate and mortar along the fracture surface were both cut off. From the split tensile failure surface, it can be observed that most of the coral aggregates were split, and the fracture surface directly broke from the middle of the larger volume of coral aggregate, with a smooth fracture surface and shellfish marine organism impurities at the interface of the aggregate fracture. At the same time, due to shellfish marine organism impurities and backwater impurities, the porosity of the concrete increased and the split tensile strength of the concrete decreased.
Table 10.
Split Tensile Strength at 28 days (MPa).
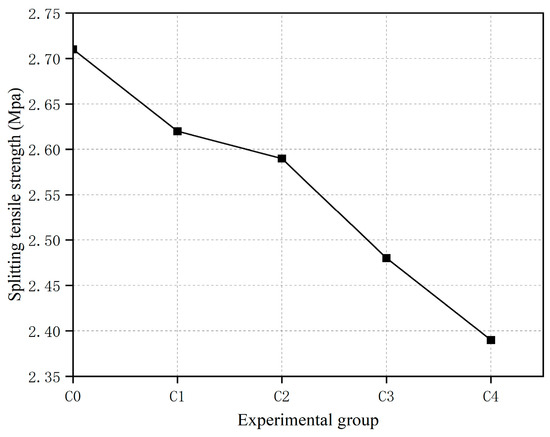
Figure 11.
Split Tensile Strength Curve of Coral Concrete with Different Dosages of 28d Splitting.
Using a maximum splitting tensile strength of 2.5 MPa, Figure 12a,b illustrates two-dimensional contour and three-dimensional response surface plots. The data show that the parameterized model is accurate and effective. Based on the model’s split tensile strength, the contour map in Figure 12 has lines that are half-elliptical. This shows that there is a close relationship between the amount of impurities and the coral aggregate. The 3D surface diagram clearly shows that the splitting tensile strength dropped with increasing quantities of impurity content.
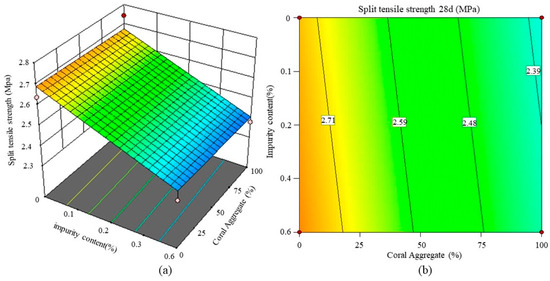
Figure 12.
(a) 3D Surface Diagram for Split Tensile Strength (b) 2D Contour Plot for Split Tensile Strength.
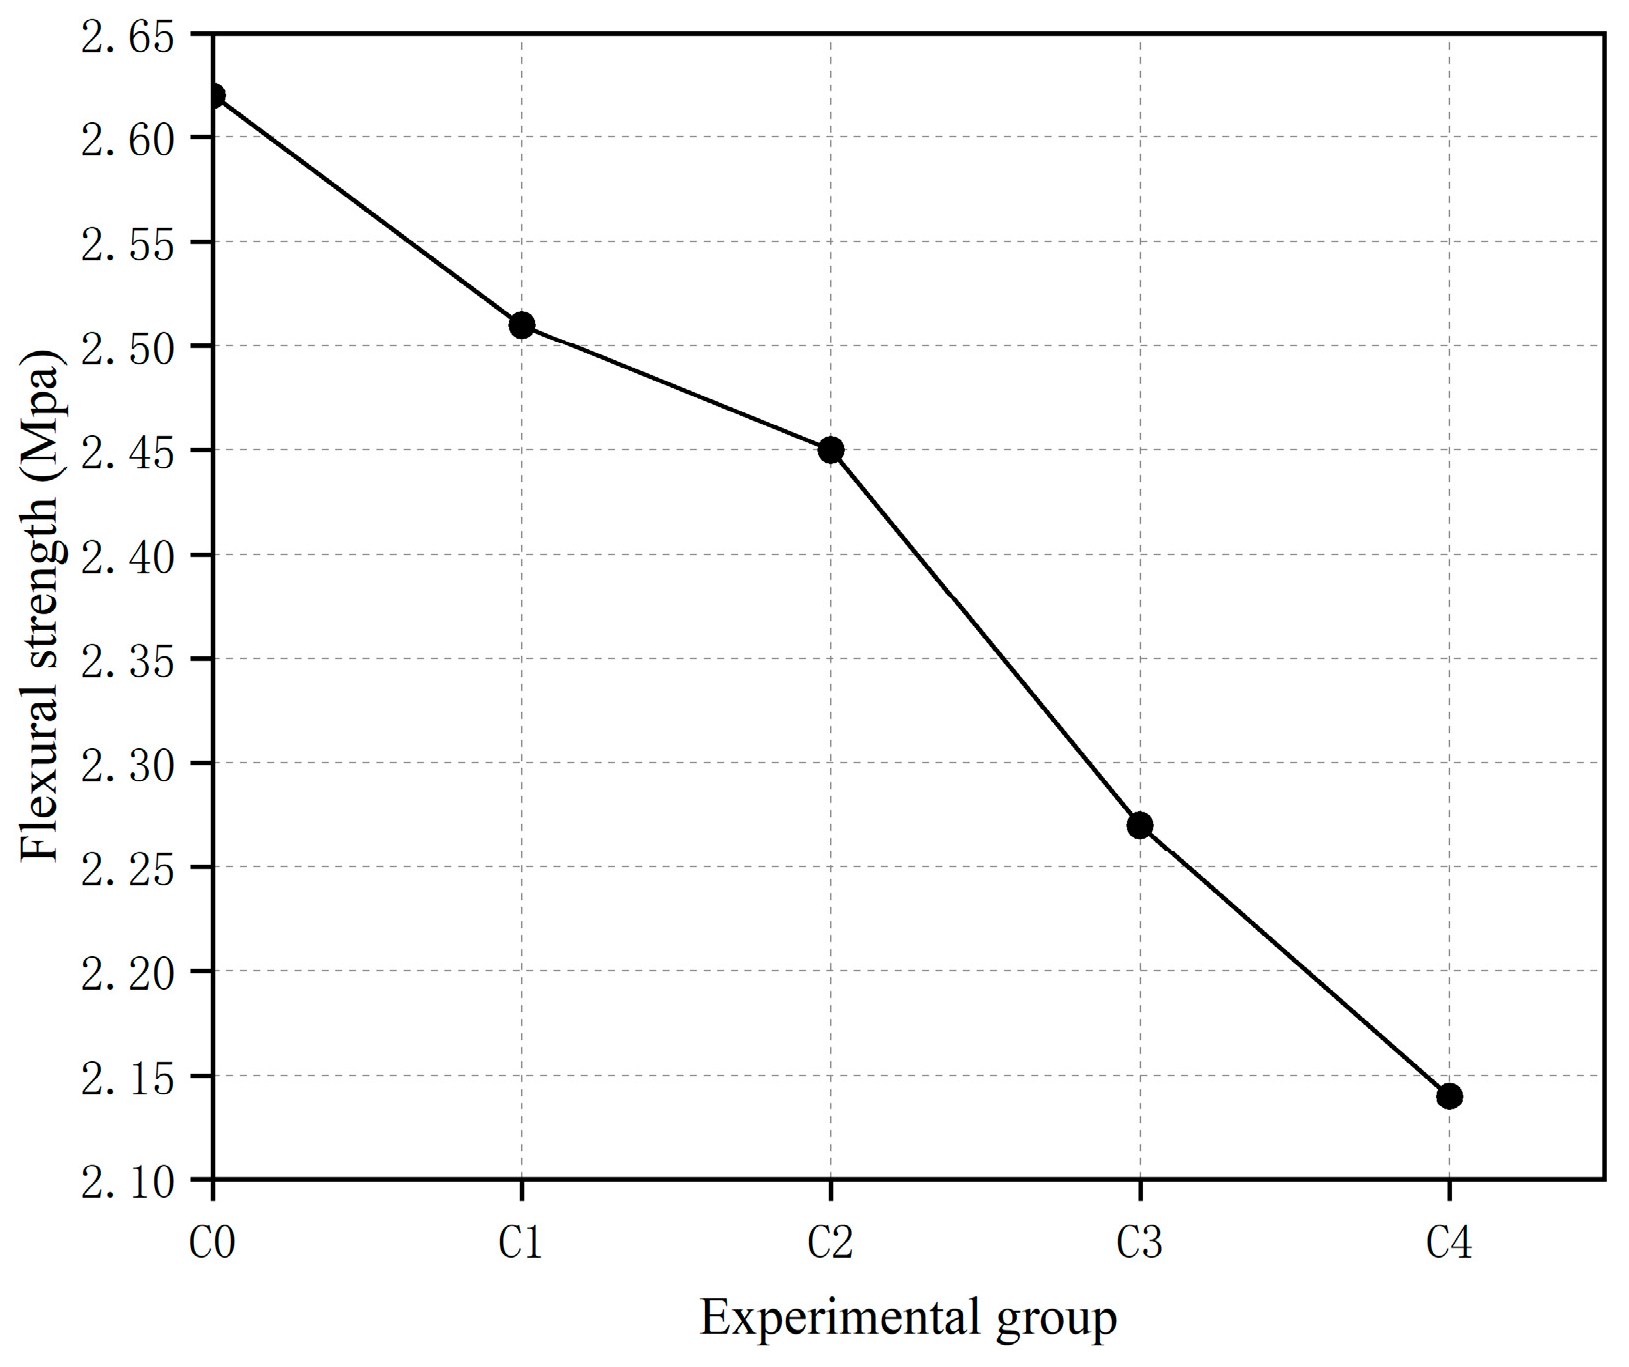
4.4. Flexural Strength
The results of the tensile strength test for curing at 28 days are shown in Table 11. The flexural strength test results for various mixtures under standard curing conditions are shown in Figure 13. It can be seen from the test results that when the shellfish marine impurity content is C1, C2, C3, and C4, the flexural strength of coral concrete gradually decreases, with values decreasing by 4.2%, 6.5%, 13.4%, and 18.3% relative to the blank control group C0. Compared with the reduction in compressive strength of the cube mentioned earlier, it can be inferred that adding marine shellfish impurities has a more significant impact on the flexural strength of concrete than on its compressive strength. The presence of micro-cracks and pores of varying dimensions within coral concrete, resulting from expansion and contraction, accounts for this occurrence. During the hydration process of cement, the added shellfish marine impurities accelerate the generation and development of these micro-cracks and pores due to their strength and rebound shrinkage while increasing the crack width. This causes stress concentration [41,42] by increasing the stress intensity factor at the crack tip. Therefore, the flexural strength of coral concrete significantly decreases after adding shellfish marine impurities, and the reduction range becomes more evident with higher impurity content.
Table 11.
28 d Flexural strength (MPa).
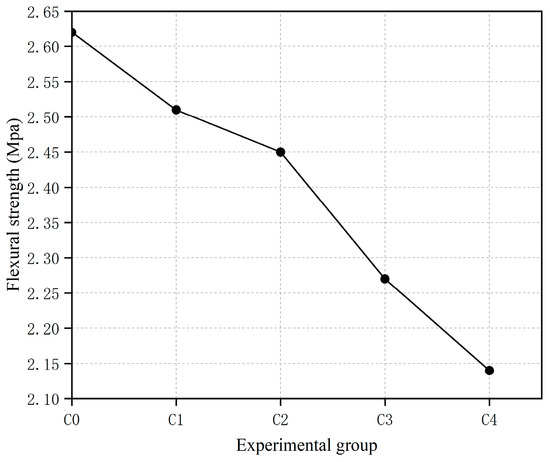
Figure 13.
The flexural strength curve of coral concrete with varying dosages of 28 d.
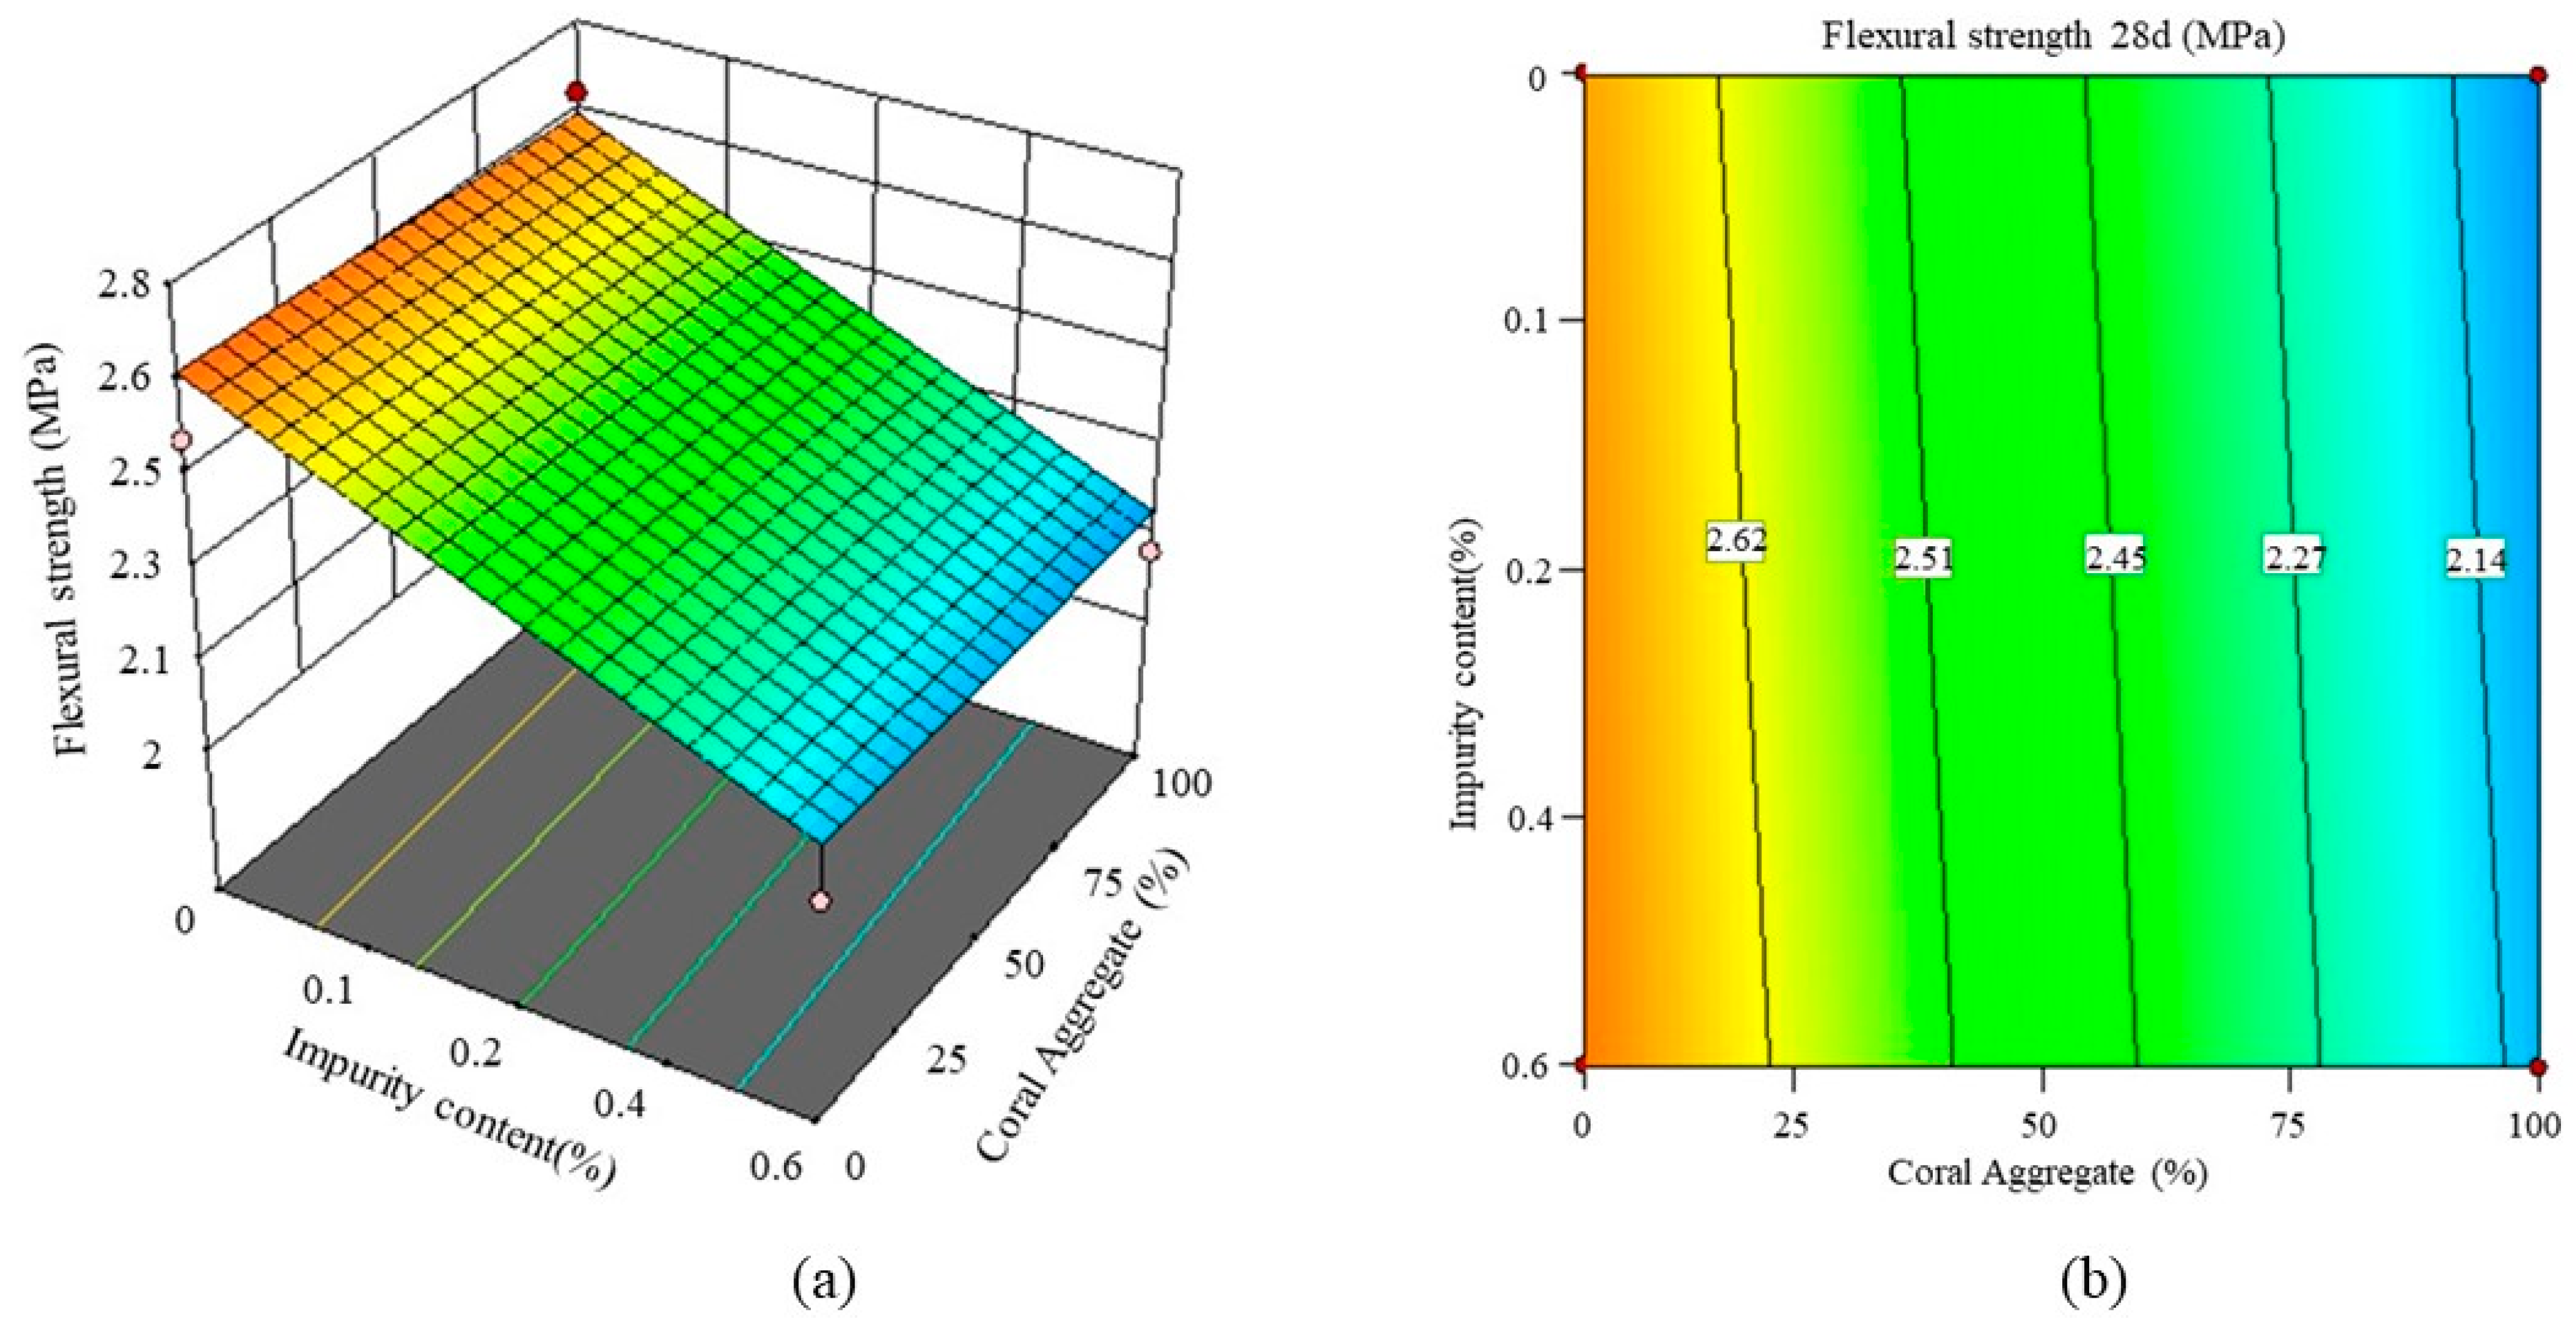
Figure 14 displays a two-dimensional contour plot (a, b) and a three-dimensional response surface plot (c, d) of the RSM’s calculated flexural strength. The optimal composition of 2% impurity content and 100% coral aggregate yielded a flexural tensile strength of 2.9 MPa. On the other hand, this model’s impurity content variable has a steep slope, suggesting that small changes in impurity content can substantially impact flexural tensile strength. An increase in impurity content decreases flexural tensile strength when the proportion of coral aggregate in the design mix remains the same. The straight lines in the contour plot corroborate this, showing that the red, green, and blue regions are rather evenly dispersed over the graph.

Figure 14.
(a) 3D Surface Diagram for Flexural Strength. (b) 2D Contour Plot for Flexural Strength.
4.5. Conversion Relationships of Various Mechanical Properties
4.5.1. Conversion Relationship between Axial Compressive Strength and Cubic Compressive Strength
Figure 15 shows the distribution of measured values of coral concrete’s axial and cubic compressive strength at 28 days of age. It can be seen from Figure 15 that the two are linearly related, with axial compressive strength increasing as cubic compressive strength increases. In the “Code for Design of Concrete Structures” (GB 500010-2010) [43], the relationship between axial compressive strength and cubic compressive strength of ordinary concrete is roughly linear, with an empirical expression formula of:
In the equation: —Axial compressive strength (MPa)
—Compressive strength of the cube (MPa)
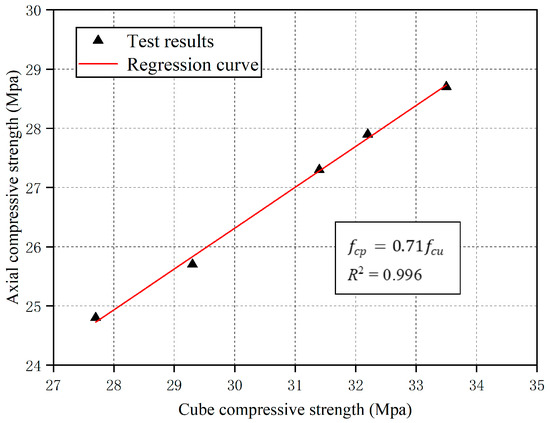
Figure 15.
Relationship between axial compressive strength and compressive strength of cubic specimens.
Figure 15.
Relationship between axial compressive strength and compressive strength of cubic specimens.
Based on the results of this experiment, a linear regression model in the form of Equation (2) is used to analyze the data shown in Figure 15 statistically. The coefficient of regression, = 0.71, while its correlation coefficient, = 0.996.
The correlation coefficient of the regression fit reaches 0.996, indicating a high level of correlation.
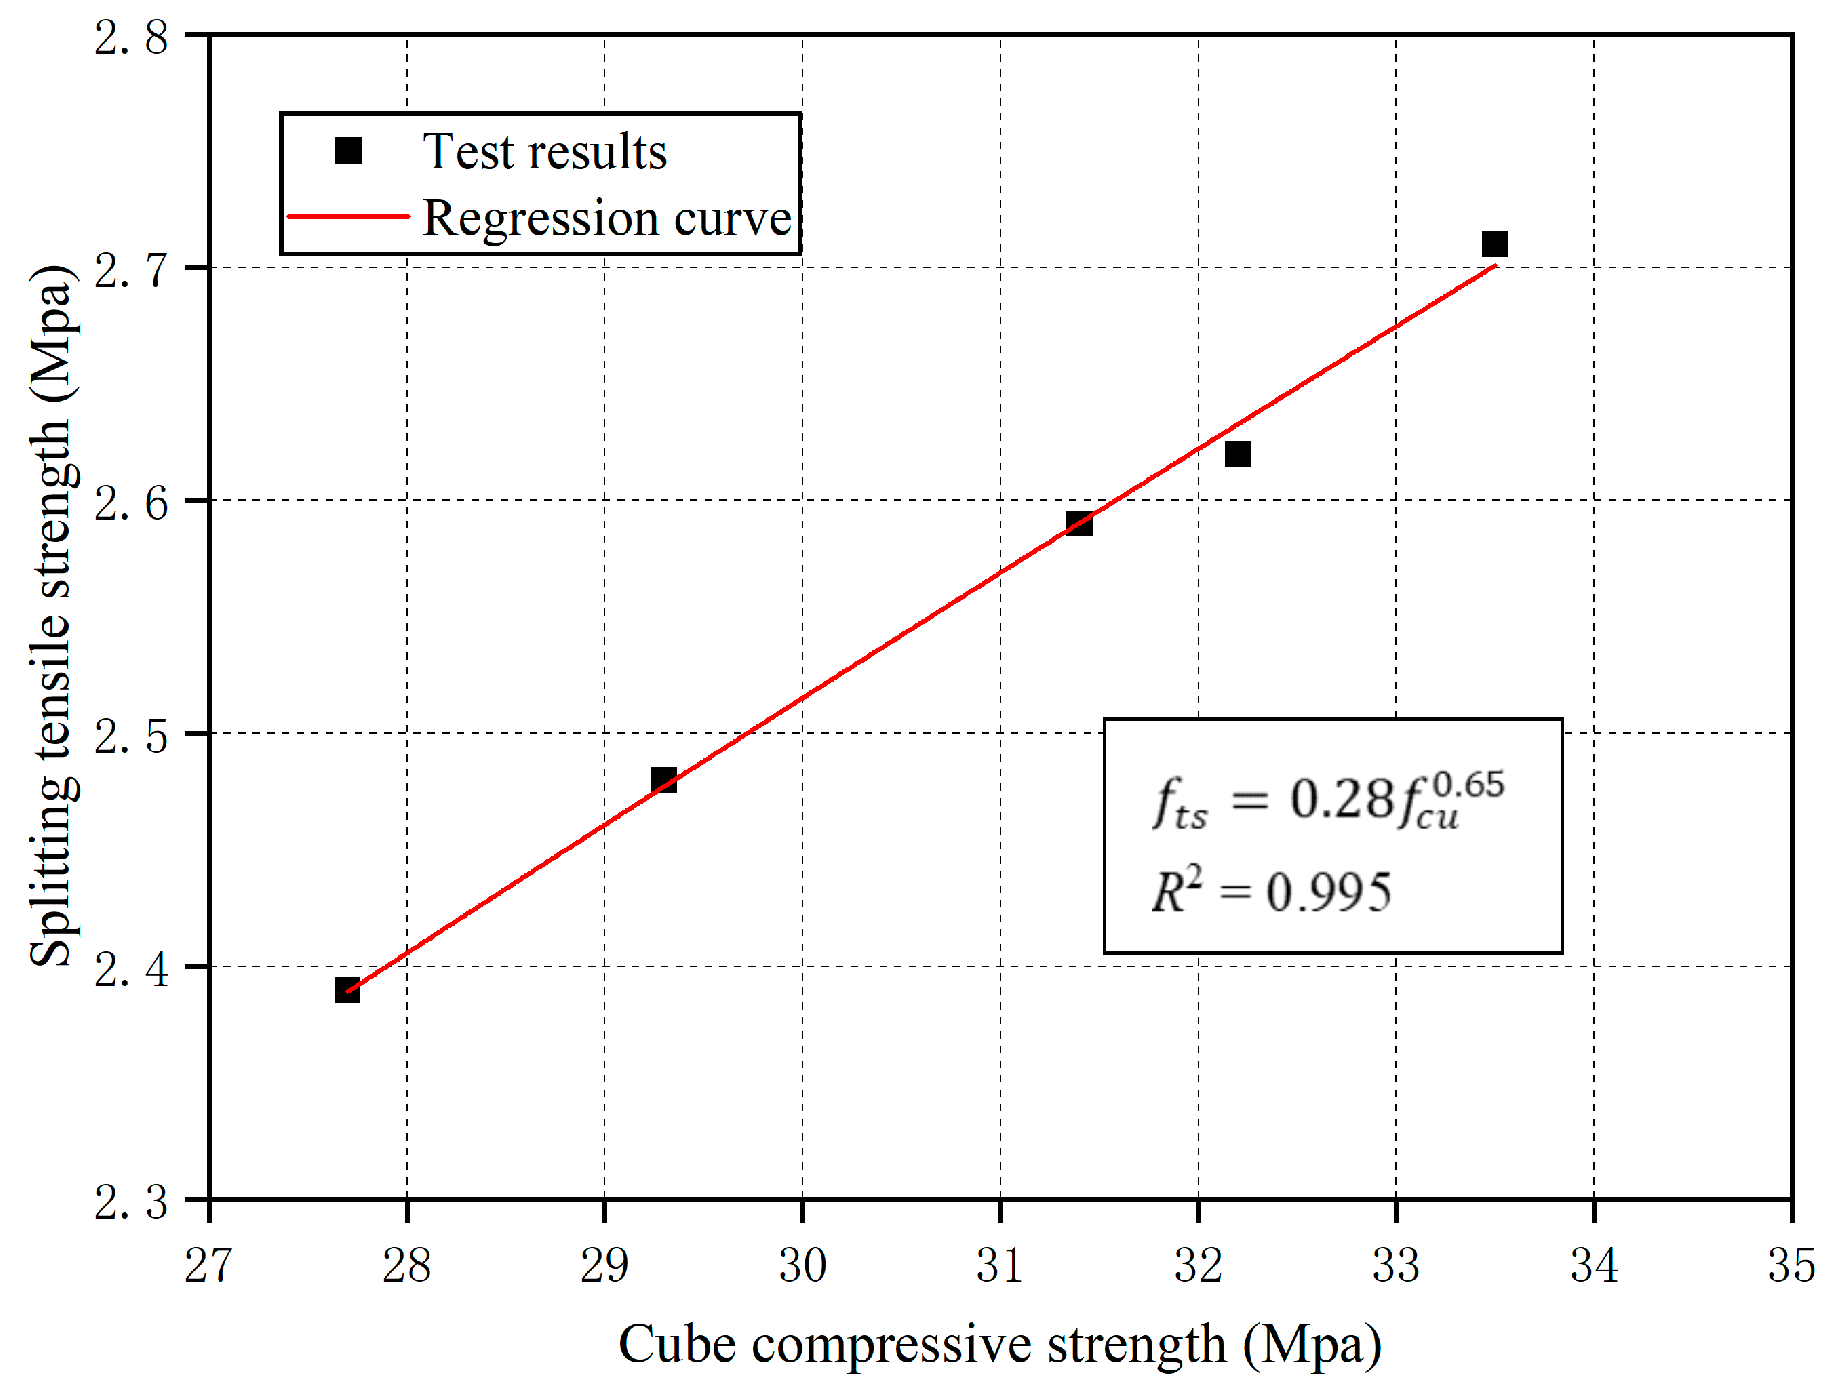
4.5.2. Conversion Relationship between Splitting Tensile Strength and Compressive Strength of Concrete Cubes
The “Code for Design of Concrete Structures” (GB 500010-2010) [43] provides the conversion relationship between the splitting tensile strength and compressive strength of normal concrete as follows:
In the equation: —Tensile strength of concrete under splitting
Figure 16 presents the distribution of split tensile strength and compressive strength of coral concrete with varying impurities of different shellfish marine organisms at 28 days of age. It can be observed that the two factors exhibit a linear relationship, with the split tensile strength showing an upward trend as the compressive strength increases. Based on the data results of this experiment, a linear regression model in the form of Equation (4) was used to perform statistical analysis on the data shown in Figure 16. The relationship equation between the split tensile strength and compressive strength at 28 days of age is:
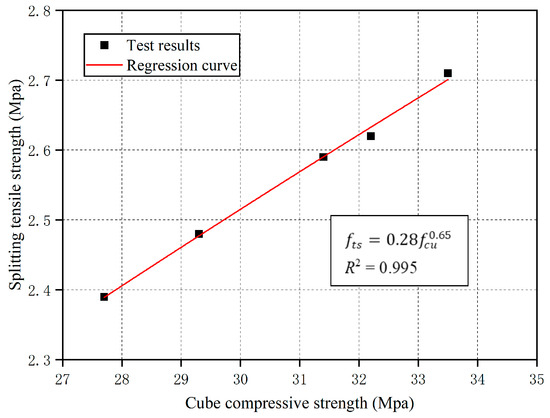
Figure 16.
Relationship between splitting tensile strength and cube compressive strength.
The correlation coefficient = 0.995, indicating a strong correlation.
4.5.3. Conversion Relationship between Flexural Strength and Compressive Strength of Cubes
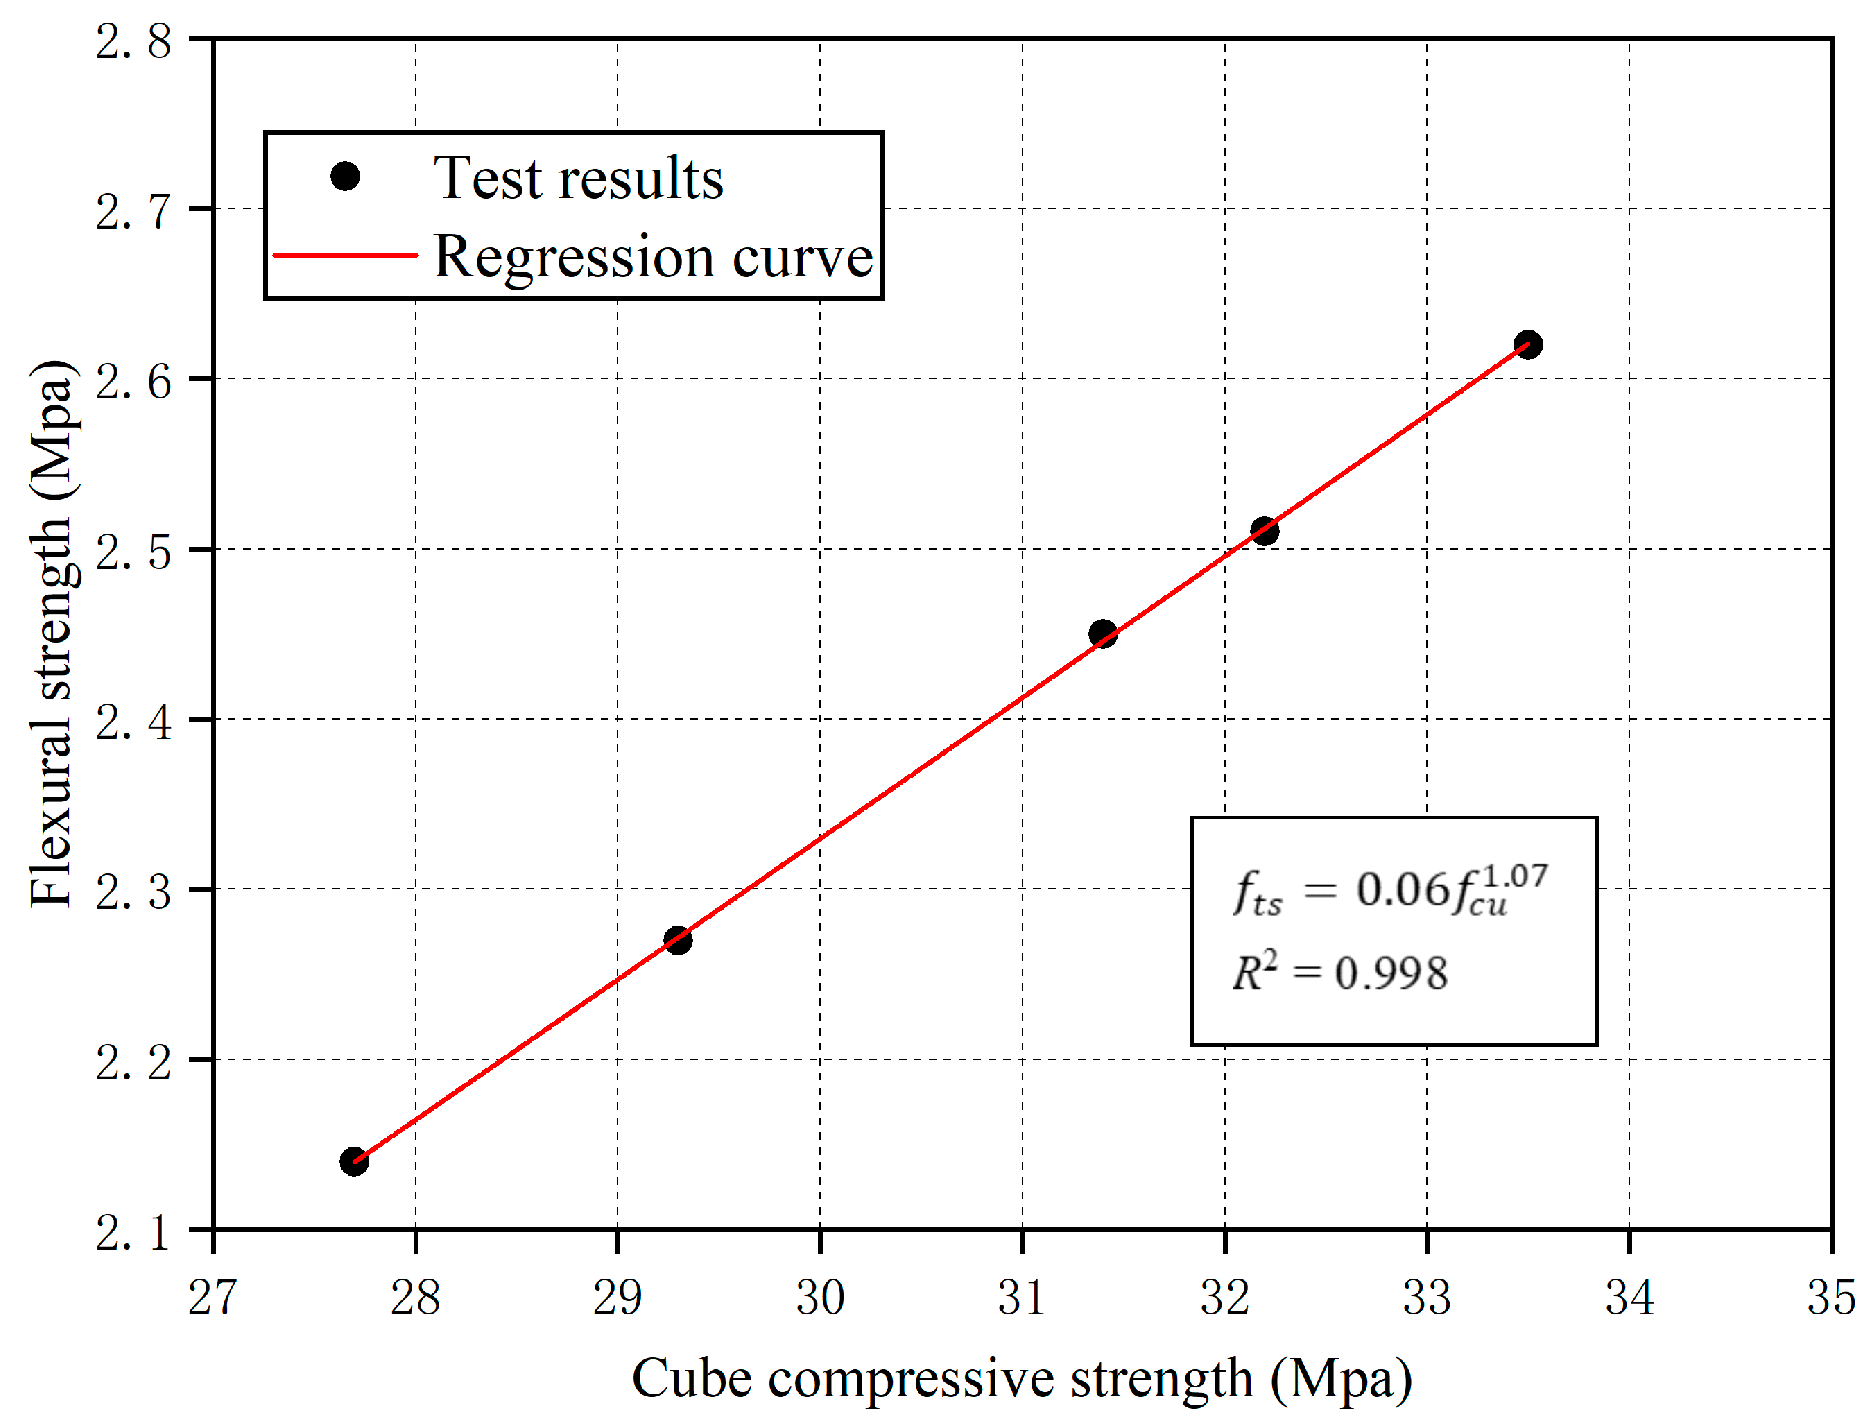
Referring to the mathematical model, Figure 17 depicts the distribution of coral concrete’s split tensile strength and cubic compressive strength with various contaminant contents of marine shellfish organisms after 28 days. The conversion formula is obtained between 28 d flexural strength and 28 d cubic compressive strength.

Figure 17.
Relationship between flexural strength and compressive strength.
The correlation coefficient = 0.998, indicating a strong correlation.
4.6. Microscopic Mechanism Analysis
4.6.1. SEM Analysis
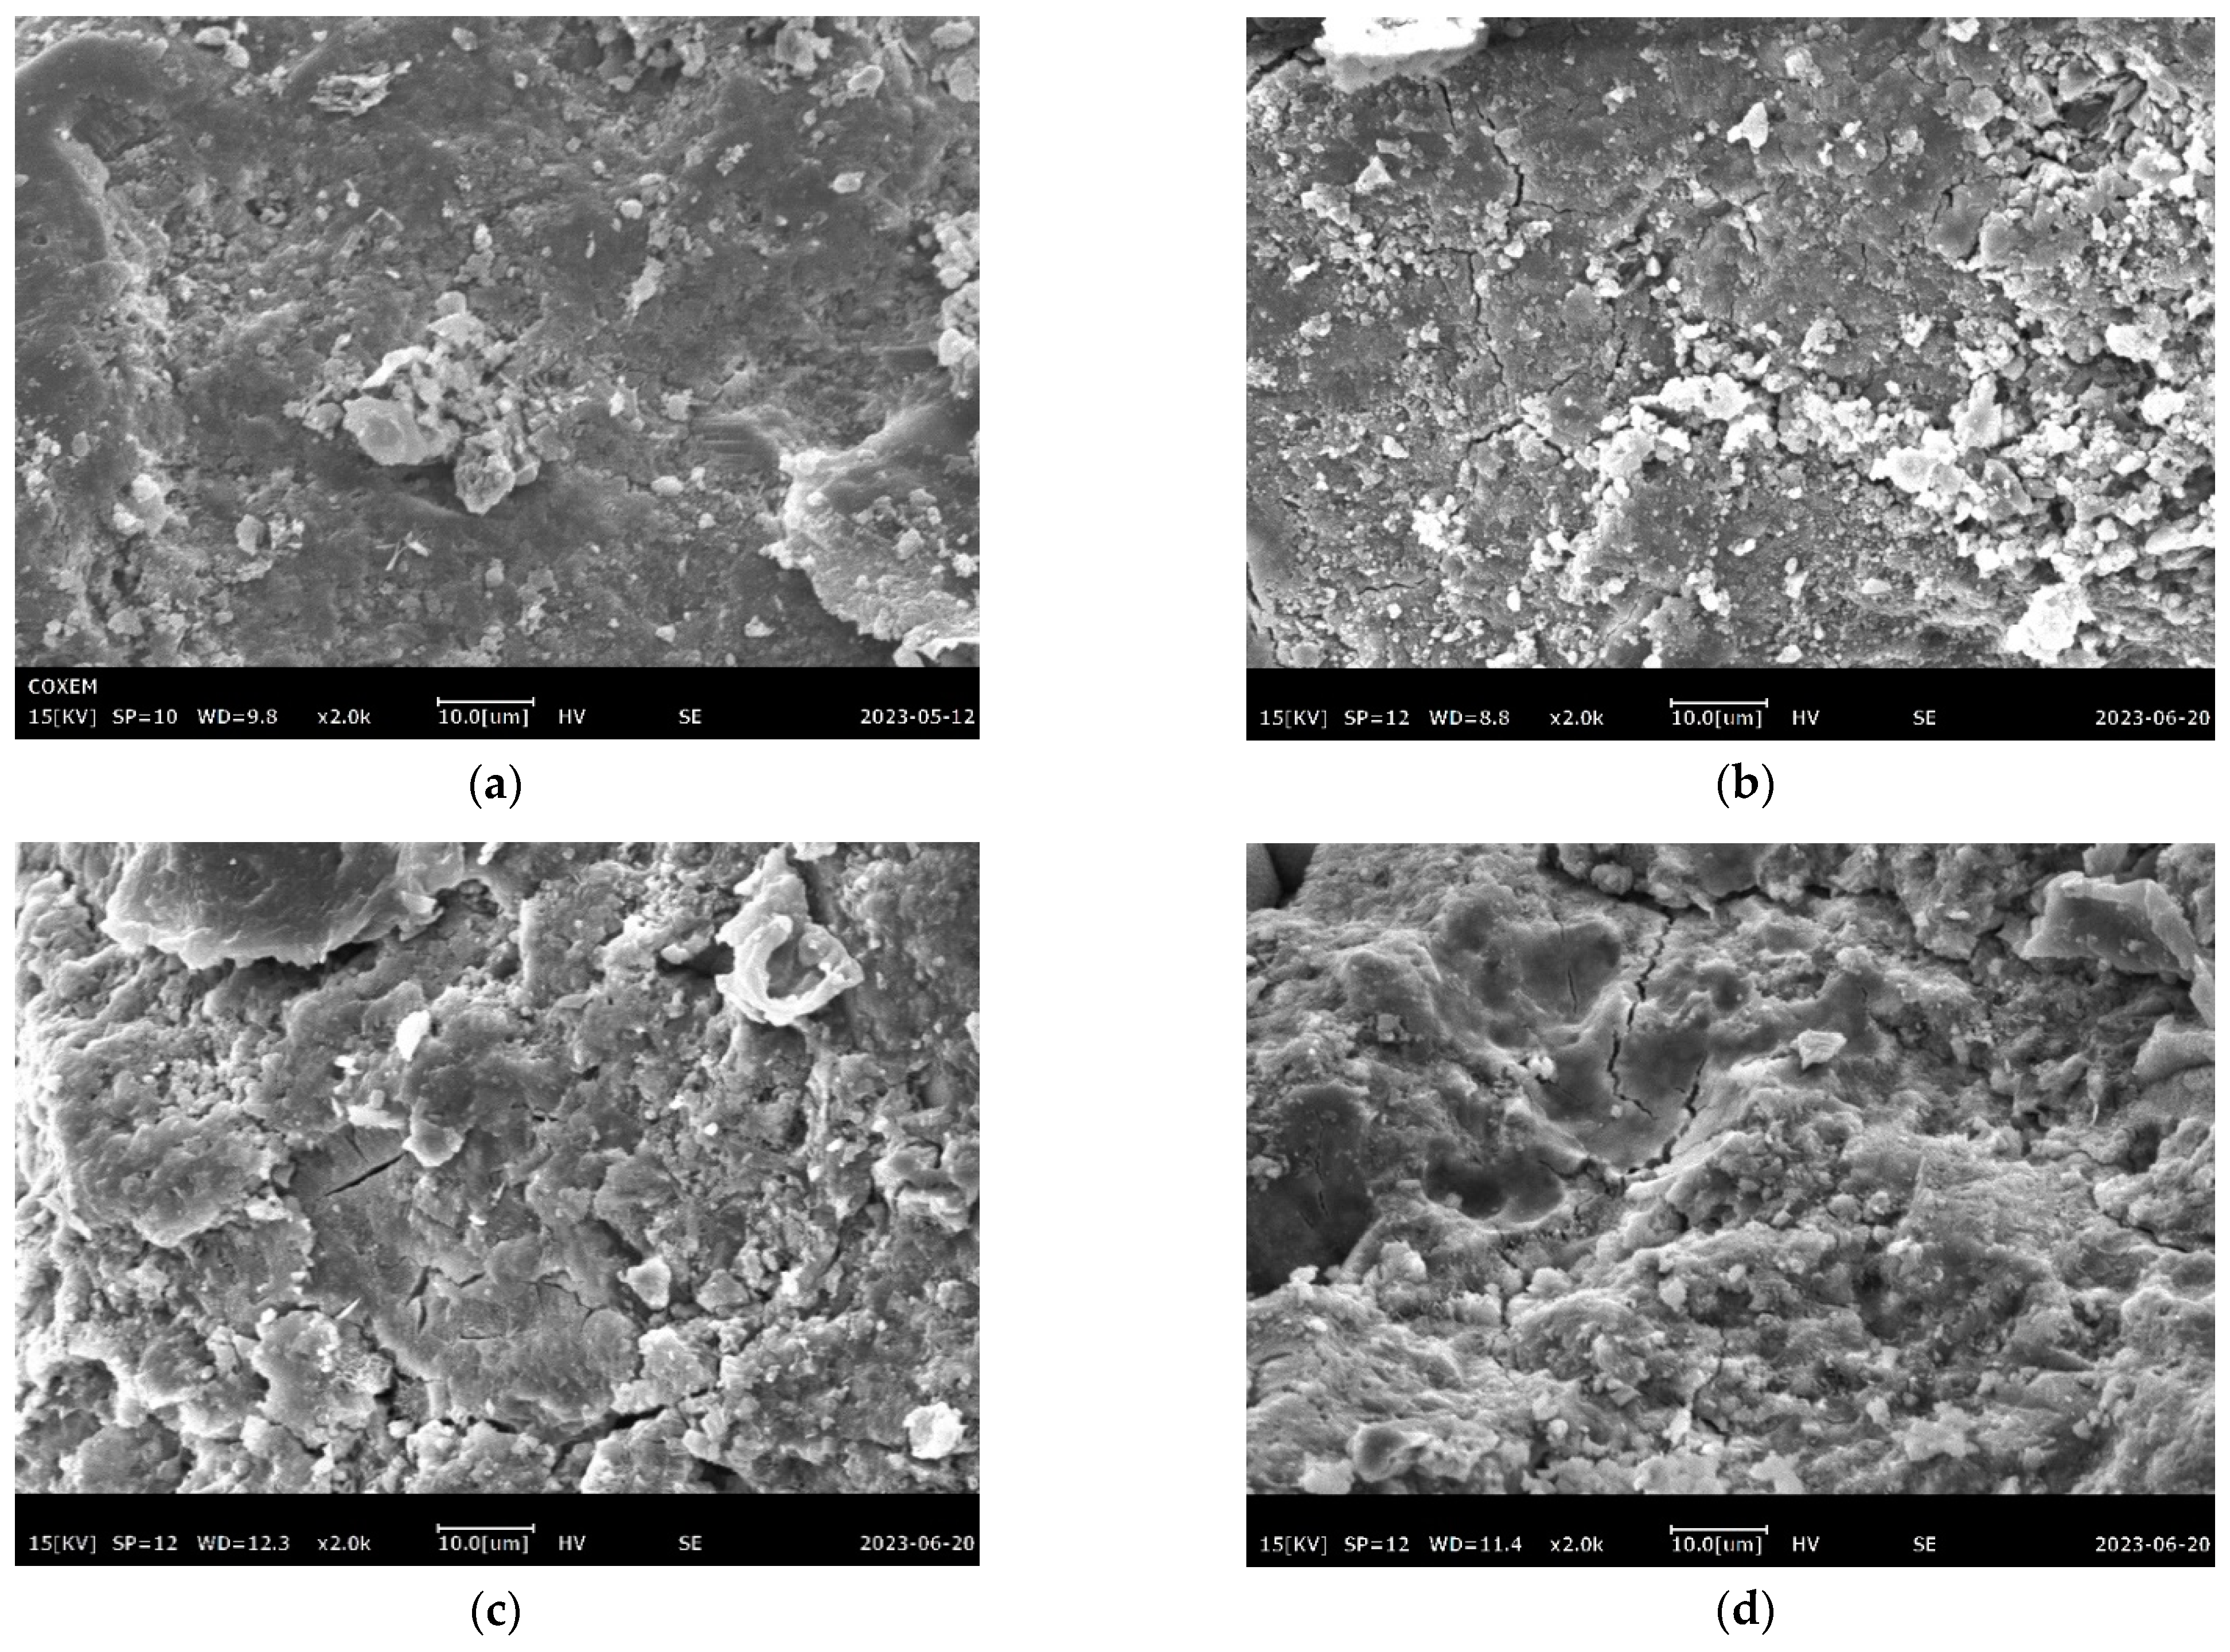
Scanning Electron Microscopy (SEM) is used to analyze the cement hydration products and microscopic structure of coral concrete mixed with impurities of shellfish marine creatures from a microscopic perspective. The effects of shellfish marine organism impurities on the mechanical properties of the entire coral concrete are determined by combining the results of the mechanical properties presented in the preceding sections with comparative analysis.
The main types of products generated during the hydration reaction of ordinary Portland cement include calcium silicate hydrate (C-S-H), calcium aluminate hydrate gel (C-A-H), calcium hydroxide crystals (CH), ettringite (AFt), and mono sulfate (AFm). Among these, C-S-H has more significant surface energy, no fixed shape, and the highest proportion in the hydration products. It combines with surrounding free ions and tends towards equilibrium. The aggregate particles inside C-S-H can bond with each other to form a spatial system [44], which largely determines the strength of concrete. Figure 18a shows the microscopic morphology of hydration products in full coral concrete without being mixed with shellfish marine impurities. It can be seen that the main product is the dense C-S-H, and there is also a large amount of calcium hydroxide crystals. Calcium hydroxide production affects the bond strength development in the interfacial transition zone between aggregate and mortar. It reduces the overall strength of the full coral concrete. However, some of these hydration products are formed when cement mortar penetrates the pore of coral aggregate and is closely connected with the cement matrix around the aggregate [45], resulting in a nested structure that increases the bond strength of the aggregate and mortar interface in coral concrete compared to ordinary concrete.
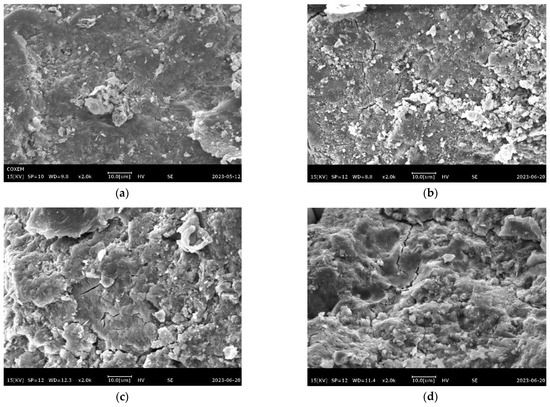
Figure 18.
(a) Blank control group C0; (b) 1% impurity content group C1; (c) 2% impurity content group C2; (d) 4% impurity content group C4; (e) 6% impurity content group C6; (f) Transition interface.
Figure 18b–e shows the hydration products of full coral concrete mixed with shellfish marine impurities. It can be observed that the microstructure of the interface between coral aggregate and mortar has undergone significant changes after mixing with shellfish marine impurities. Shellfish marine impurities have good water absorption and backwater of impurities capabilities. It can be observed from Figure 18b–e that the compactness of the cement around the shellfish marine impurities has increased significantly. However, the volume of the shellfish marine impurities shrinks significantly after the backwater of impurities, leaving many small pores in the concrete. From the microstructure, it can be seen that with the increase in shellfish marine impurities content, the internal pore rate of the concrete increases, and its initial defects are increased. Under stress, the concrete has fine cracks that continuously extend and develop through the pores left by shellfish marine impurities, accelerating the destruction of coral concrete and reducing its mechanical strength. This verifies the reason why the mechanical strength of the experimental group deteriorates more and more obviously than that of the control group with the increase in impurity content. With the increasing amount of impurities, there is a tendency to increase the fine cracks and holes inside the concrete, and chlorides in seawater will accelerate the corrosion of concrete and internal steel bars with these cracks and holes. However, due to the backwater of impurities phenomenon, the compactness of the concrete around the pores is increased. The low content of shellfish marine impurities has a relatively small effect on the mechanical properties of full coral concrete. Figure 18f shows the state of the interface between shellfish marine biological impurities and concrete, and it is clear that there is no interaction between the interface, which also reduces the strength of coral concrete and accelerates harmful ion erosion in seawater.
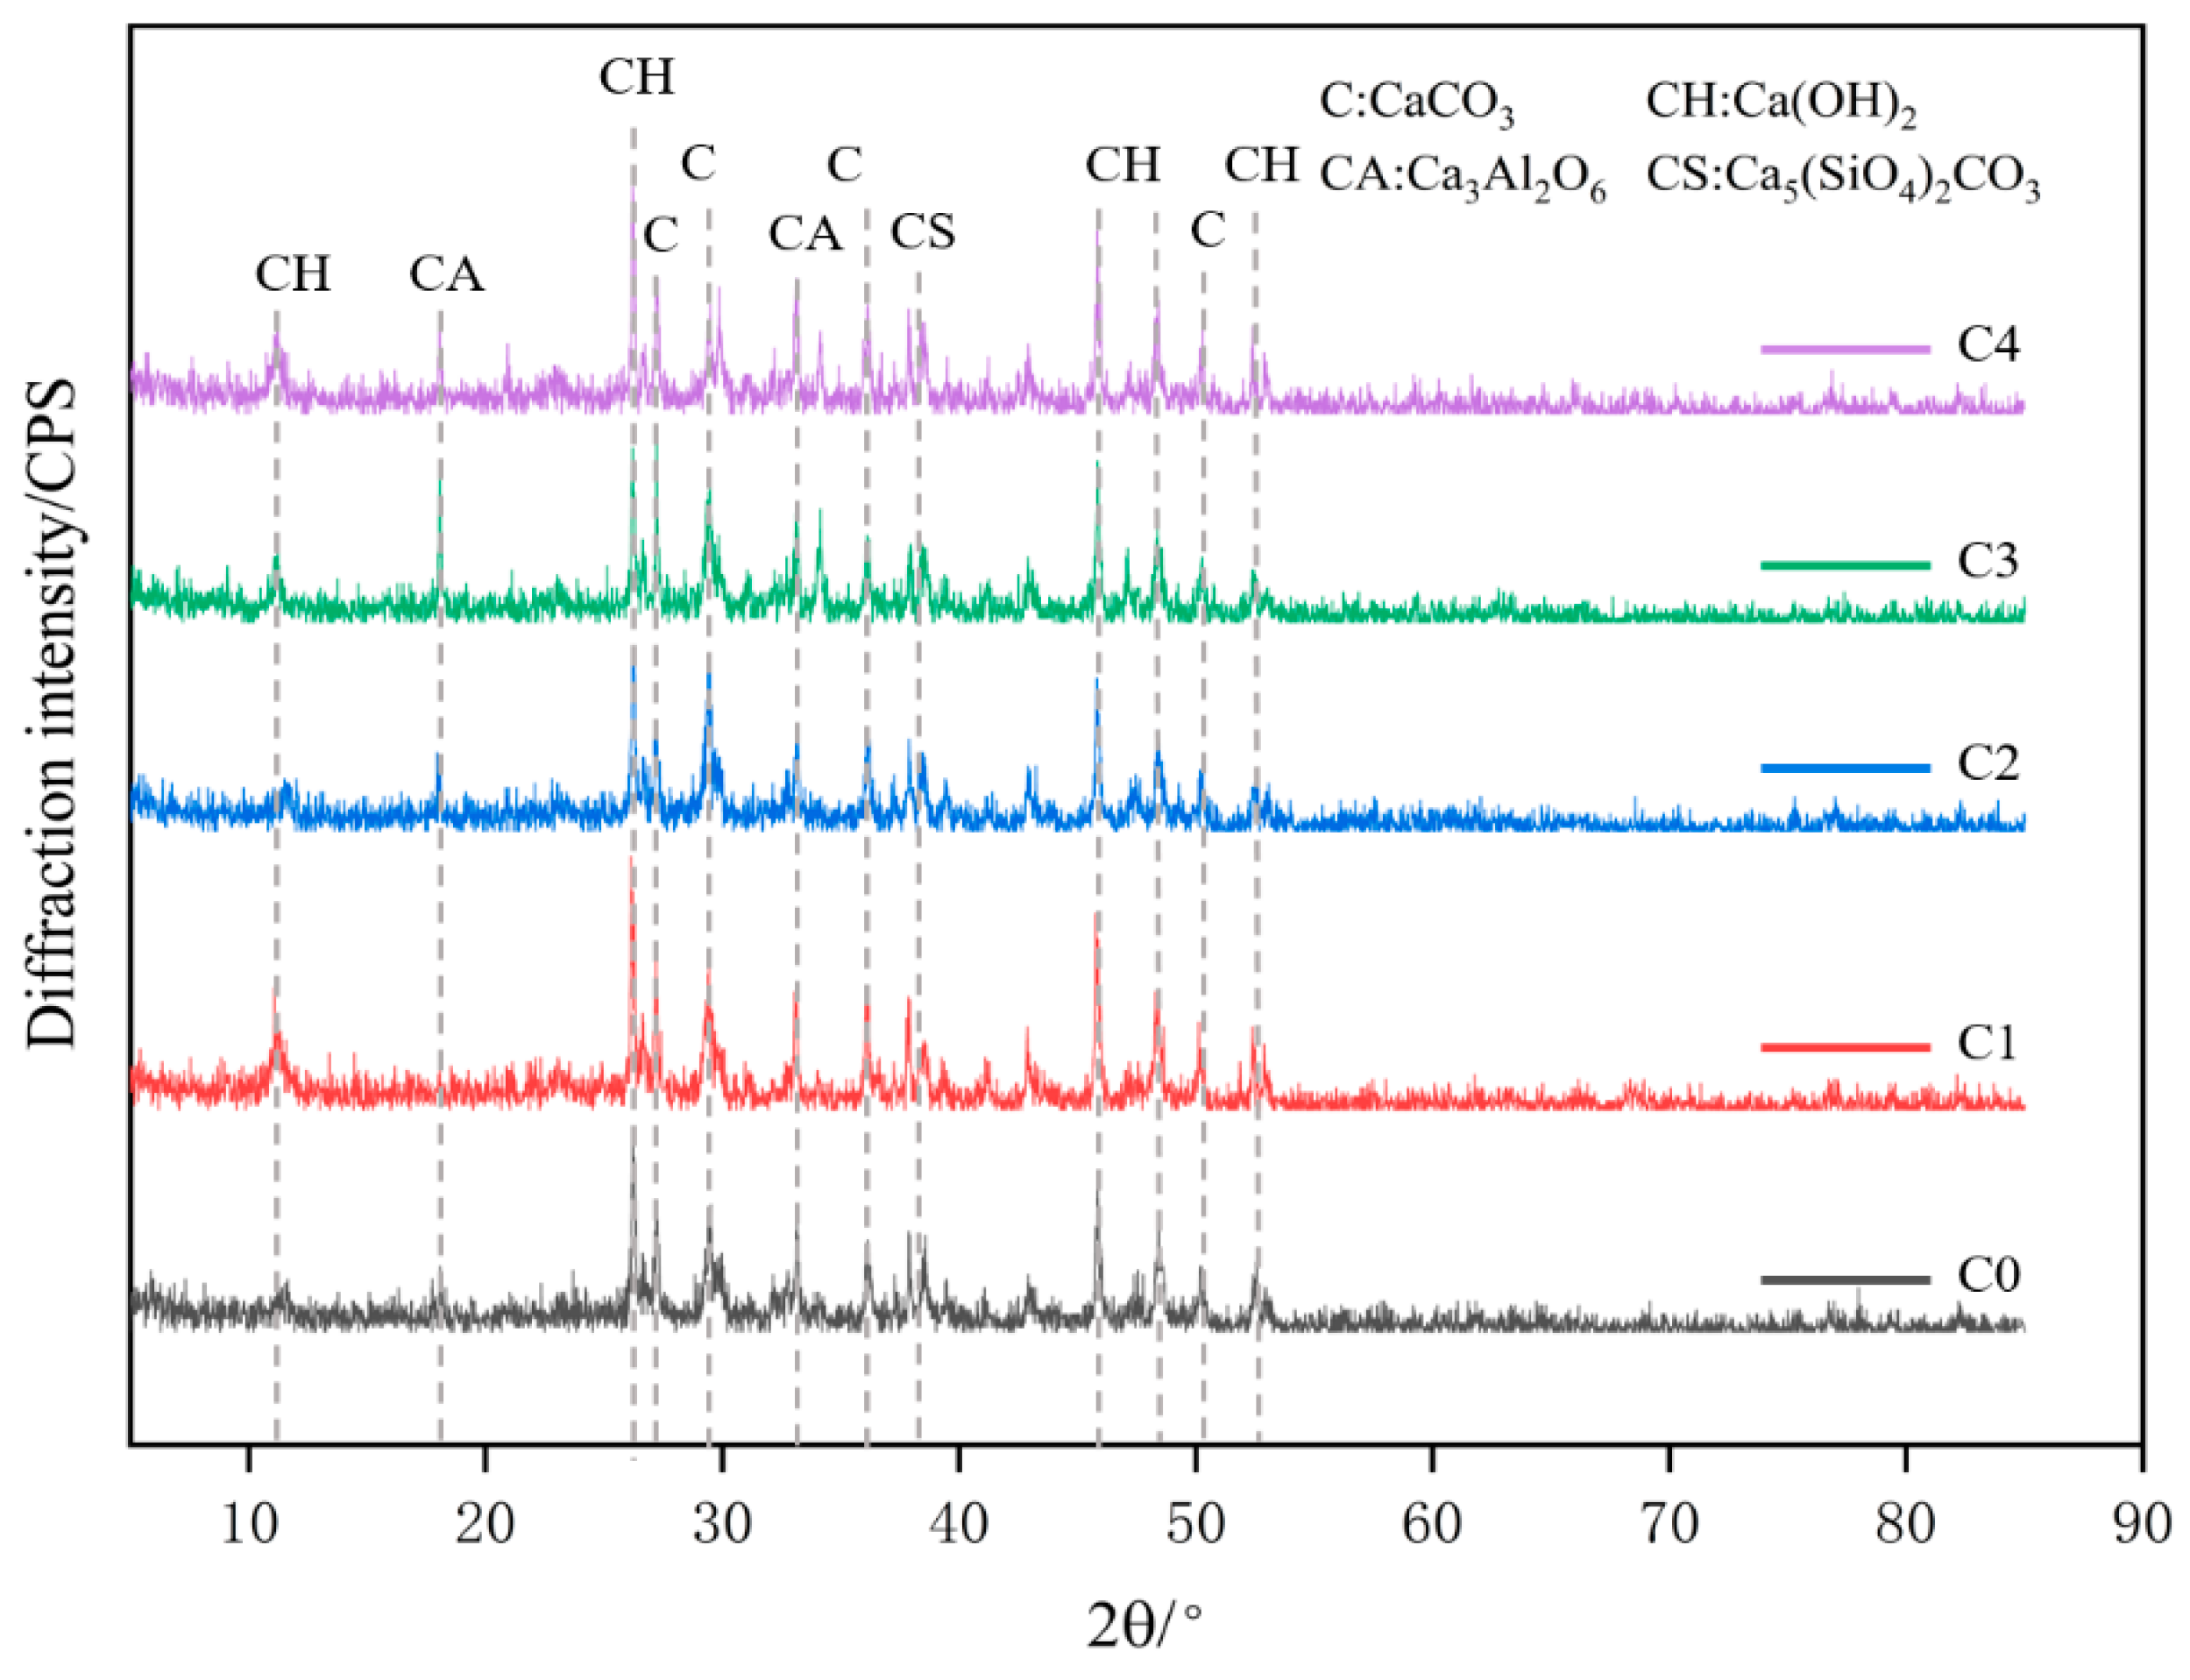
4.6.2. XRD Analysis
X-ray diffraction (XRD) analysis was performed on 28-day test specimens of each group. The XRD diffraction patterns of specimens with different contents are shown in Figure 19. From Figure 19, it can be concluded that the overall composition of groups C0, C1, C2, C3, and C4 is similar, mainly composed of Ca(OH)2, followed by Ca3Al2O6 and Ca5(SiO4)2CO3. The main component of shellfish marine impurities is CaCO3 and its characteristic peak intensity slightly increases with the increase in its content. The biomass components in the impurities did not react significantly with the coral concrete, and the increased strength around the holes formed after the reflux in the biomass was mainly due to secondary hydration. At the crystal phase level, it is verified that the effect of shellfish marine impurities on coral concrete is mainly because its characteristics increase the internal porosity rate, leading to a decrease in mechanical strength.
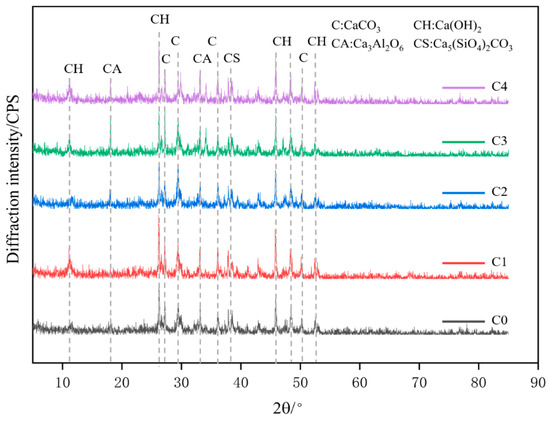
Figure 19.
XRD diffraction patterns of different shellfish marine bio-impurity dosage samples.
4.7. ANOVA Analysis
In this investigation, we utilized response surface methodology (RSM) to model the interactions between Impurity content and coral aggregate particles and their mechanical strength properties. Once the first mixture’s data are successfully collected, 14 more mixture designs are created using the first mixture design as a reference and re-implemented in the RSM to test their efficacy. The impact of two separate parameters on impurity content potency, specifically the clustering of 0–4% Impurity content (B) and 100% coral aggregate (B), is studied. An analysis of variance (ANOVA) tested the model’s significance. According to Table 6, the model has a compressive strength of 32.2 MPa, a flexural strength of 2.45 MPa, and a split tensile strength of 2.59 MPa. A high F-number indicates the usefulness and applicability of a model. These numbers demonstrate the validity of all models. The F-number of the model is just 0.01% likely to be influenced by random noise. P-values below 0.05 for models are deemed crucial. The results are demonstrated in Table 12 below. Table 13 displays an R-squared (R2) value for the model of roughly 0.82, demonstrating its reliability. The difference between adjusted and predicted R2 is less than 0.1. This shows a fair degree of consistency between the changed R2 and the predicted R2. Maximum (Adeq) precision can also be achieved by measuring the signal-to-noise ratio. As indicated in the table, any of the presented models can be used to probe the feasible range of alternatives.
Table 12.
Testing hypotheses with analysis of variance.
Table 13.
Models’ validation.
Optimization and Experimental Validation
The validation combination design is a product of many techniques for response optimization. This solution provides four choices to enhance response and mechanical strength. Choose the two-way ANOVA that comes closest to satisfying your requirements. The RSM method is used for experimental verification. Ordinary scatter plots are used to evaluate the model and pick appropriate extraction parameters in light of response outcomes. The experimental and RSM findings are summarized in Table 14 for easy reference. According to the mean and standard deviation, the compression strength was 32.2 MPa, the flexure strength was 2.45 MPa, and the split tensile strength was 2.59 MPa when they used 2% impurity content and 100% coral aggregate.
Table 14.
Summary of Optimization Mix.
5. Conclusions
This study conducted comparative experiments on coral concrete with various impurities from different marine shellfish species and tested and analyzed their basic mechanical properties and micro-morphology. The following conclusions can be drawn:
- Under standard curing conditions, the impurities from marine shellfish have a negative impact on the compressive strength, axial compressive strength, splitting tensile strength, and flexural strength of coral concrete. Adding impurities from marine shellfish has a more significant impact on the flexural strength than on the compressive strength of concrete. This is because there is no coupling bonding between impurities and the transition surface of the cementitious material, which has a greater impact on the folding strength.
- When the impurity content from marine shellfish is less than 2%, it has little effect on the mechanical properties of concrete. The mechanical properties of the groups with impurity content of 1% and 2% are almost the same, and the change in the mechanical properties curve is small. However, when the impurity content of marine shellfish exceeds 4%, it has different degrees of impact on various mechanical properties. A small amount of shellfish marine impurities have little effect on the performance of concrete.
- Linear regression analysis of coral concrete with impurities from marine shellfish showed that the compressive strength axial compressive strength, splitting tensile strength, and flexural strength have a linear relationship and good correlation. Under the same compressive strength, coral concrete’s axial compressive strength and splitting tensile strength are more significant than ordinary concrete’s.
- Microscopic analysis revealed no significant difference in the hydration products between full coral concrete and coral concrete with impurities from marine shellfish. The main element is dense C-S-H, and many calcium hydroxide crystals reduce the overall strength of coral concrete. Introducing impurities from marine shellfish will form micro-pores inside coral concrete due to material properties and backwater of impurities, these gaps and holes accelerate the erosion of the interior of concrete by harmful ions in seawater, further decreasing the strength of coral concrete. These results are consistent with the results of mechanical property tests.
- The two-way ANOVA was utilized to test predictive models and was deemed significant if the p-values were less than 0.05. The errors resulting from an inadequate fit or chance are negligible. The predicted and modified R2 values demonstrate that the predictive model accurately represents the connection between dependent variables and independent results.
- A linear equation connecting the coral aggregate compressive strength and Impurity content in concrete was formulated. The RSM model and the corresponding equations can accurately predict coral concrete’s flexural strengths, compressive strengths, and split tensile strengths. The findings of the prediction model confirm the minor inconsistency between the experimental outcomes.
- The studied model can reveal the actual effect of different levels of biological impurities on coral concrete, and the internal micropores will provide channels for the erosion of harmful ions in the ocean to erode the interior of the concrete, and in addition to the influence on the mechanical properties themselves, the durability will also have a significant impact. In the actual construction process, attention should be paid to screening, the impurity content of marine shellfish in coral concrete should be controlled within a reasonable range during construction, or coral sand and reefs should be placed for a period of time, waiting for the natural decay or water loss of biomass impurities inside them, and then use.
There were some limitations to this study, for example, there is a wide variety of marine life within the coral, and the impurities selected for this study were two of the most abundant shellfish in corals, these choices are made to facilitate the qualitative analysis of the experiment. However, other small marine organisms may also have an impact on the concrete produced. In addition, the erosion of harmful ions present in seawater can significantly affect the strength of coral concrete. Durability studies of concrete mixed with marine biological impurities were not carried out herein. Future research should strive to strengthen research in this area to gain a more comprehensive understanding.
Author Contributions
Conceptualization and methodology, Q.W.; validation, Y.Z.; formal analysis, M.A.; resources, S.M.; data curation, R.Y.; writing—original draft preparation, X.Z. All authors have read and agreed to the published version of the manuscript.
Funding
This research was funded by the Jiangsu Province postgraduate research and innovation plan (KYCX22_3832).
Institutional Review Board Statement
This research complied with ethical standards. We declare that we do not have human participants, human data, or human tissue.
Informed Consent Statement
We do not have any individual person’s data in any form.
Data Availability Statement
Data will be provided from the corresponding author on request.
Acknowledgments
College of Civil Engineering and Architecture, Jiangsu University of Science and Technology, Zhenjiang, Jiangsu, China.
Conflicts of Interest
The authors declare no conflict of interest.
References
- Rao, L.; Wang, L.; Zheng, Y. Experimental Research on Mechanical Properties and Compression Constitutive Relationship of PVA Fiber-Reinforced Coral Concrete. Materials 2022, 15, 1762. [Google Scholar] [CrossRef] [PubMed]
- Abed, M.M. Using Ultrasonic Wave to Study Modulus of Elasticity, Shear Modulus and Poissons’s Ratio of Polymer Concrete. Chem. Mater. Res. 2014, 8, 41–46. [Google Scholar]
- Kim, Y.J.; Gebrehiwot, H. Shear Capacity of Glass Fiber-Reinforced Polymer-Reinforced Ultra-High-Performance Concrete Beams without Stirrups. ACI Struct. J. 2023, 120, 1313814919. [Google Scholar]
- Dubois, V.; Abriak, N.E.; Zentar, R.; Ballivy, G. The use of marine sediments as a pavement base material. Waste Manag. 2009, 29, 774–782. [Google Scholar] [CrossRef]
- Da, B.; Feng, J.H.; Ni, L.; Wang, J.Y.; Fang, L.T.; He, Y.H.; Chen, D. Mechanical properties and enhancement measures of coral aggregate concrete in islands and reefs. J. Harbin Eng. Univ. 2023, 44, 204–210. [Google Scholar]
- Wang, A.G.; Lyu, B.C.; Zhang, Z.H. The development of coral concretes and their upgrading technologies: A critical review. Constr. Build. Mater. 2018, 187, 1004–1019. [Google Scholar] [CrossRef]
- Feng, X.G.; Lu, X.; Lu, X.Y. Corrosion rate of stainless steel reinforcement in coral concrete mixed with seawater. J. Build. Mater. 2021, 24, 1322–1327. [Google Scholar]
- Wang, Y.; Zhang, S.H.; Niu, D.T.; Su, L.; Luo, D. Strength and chloride ion distribution brought by aggregate of basalt fiber reinforced coral aggregate concrete. Constr. Build. Mater. 2020, 234, 117390. [Google Scholar] [CrossRef]
- Niu, D.T.; Su, L.; Luo, Y.; Huang, D.; Luo, D. Experimental study on mechanical properties and durability ofbasalt fiber reinforced coral aggregate concrete. Constr. Build. Mater. 2020, 237, 117628. [Google Scholar] [CrossRef]
- Zhang, J.H.; Wu, Z.Y.; Zhang, Y.D.; Fang, Q.; Yu, H.; Jiang, C. Mesoscopic characteristics and macroscopic mechanical properties of coral aggregates. Constr. Build. Mater. 2021, 309, 125125. [Google Scholar] [CrossRef]
- Da, B.; Yu, H.; Ma, H.; Tan, Y.; Mi, R.; Dou, X. Experimental Investigation of Whole Stress-Strain Curves of Coral Concrete. Constr. Build. Mater. 2016, 122, 81–89. [Google Scholar] [CrossRef]
- Zhou, W.; Feng, P.; Lin, H. Constitutive Relations of Coral Aggregate Concrete under Uniaxial and Triaxial Compression. Constr. Build. Mater. 2020, 251, 118957. [Google Scholar] [CrossRef]
- Lyu, B.; Wang, A.; Zhang, Z.; Liu, K.; Xu, H.; Shi, L.; Sun, D. Coral Aggregate Concrete: Numerical Description of Physical, Chemical and Morphological Properties of Coral Aggregate. Cem. Concr. Compos. 2019, 100, 25–34. [Google Scholar] [CrossRef]
- Akbar, M.; Umar, T.; Hussain, Z.; Huali, P.; Ou, G. Effect of Human Hair Fibers on the Performance of Concrete Incorporating High Dosage of Silica Fume. Appl. Sci. 2023, 13, 124. [Google Scholar] [CrossRef]
- Yu, Q. Proportioning design and compressive strength law of coral reef sand sea water concrete. Concrete 2017, 2, 155–157+160. [Google Scholar]
- Su, C.; Ma, H.Y.; Yu, H.F.; Yue, C.J.; Zhang, Y.D.; Mei, Q.Q.; Sha, H.Y.; Liu, T. Influence of different coral aggregates on mechanical properties of coral concrete. J. Chin. Ceram. Soc. 2020, 48, 1771–1780. [Google Scholar]
- Cao, H.; Wu, Q.; Akbar, M.; Yang, N.; Hussain, Z. Protective Performance of Coated Reinforcement in Coral Concrete under Dry/Wet Cycling. Materials 2023, 16, 4037. [Google Scholar] [CrossRef]
- Su, W.W.; Liu, J.H.; Liu, L.P.; Chen, Z.; Shi, C. Progresses of high-performance coral aggregate concrete (HPCAC): A review. Cem. Concr. Compos. 2023, 140, 105059. [Google Scholar] [CrossRef]
- Dai, B.Q. Experimental Study on Durability of Modified Polypropylene Fiber Concrete. Master’s Thesis, Zhengzhou University, Zhengzhou, China, 2010. [Google Scholar]
- Zheng, Z.H.; Ren, H.Q.; Longz, L.; Guo, R.Q.; Cai, Y.; Li, Z.J. Study on impact compressive mechanical properties of PP/CF reinforced coral sand cementitious composites. Explos. Shock. 2022, 42, 61–73. [Google Scholar]
- Wang, L.; Xiong, Z.J.; Liu, C.P.; Li, Q.L. Study on mechanical properties of polypropylene fiber coral concrete. Concrete 2014, 7, 96–99. [Google Scholar]
- Wang, Q.; Sun, S.K.; Wang, Z.M.; Lyu, X.J. Physical properties, hydration mechanism, and leachingevaluation of the Portland cement prepared from carbide residue. J. Clean. Prod. 2022, 366, 132777. [Google Scholar] [CrossRef]
- Yum, W.S.; Yu, J.; Jeon, D.; Song, H.; Sim, S.; Kim, D.H.; Oh, J.E. Mechanical and Durability Properties of Cementless Concretes Made Using Three Types of CaO-Activated GGBFS Binders. Materials 2021, 15, 271. [Google Scholar] [CrossRef] [PubMed]
- Tian, W.; Gao, F.F. Damage and Degradation of Concrete under Coupling Action of Freeze-Thaw Cycle and Sulfate Attack. Adv. Mater. Sci. Eng. 2020, 2020, 8032849. [Google Scholar] [CrossRef]
- Bai, Y.H.; Lu, Y.; Zhang, D.Y. Preparation of nano-carbon black and silica fume modified foamconcrete: Compressive strength, pore structure and electromagnetic property. Constr. Build. Mater. 2023, 369, 130553. [Google Scholar] [CrossRef]
- Ali, A.; Hussain, Z.; Akbar, M.; Elahi, A.; Imran, M. Influence of Marble Powder and Polypropylene Fibers on the Strength and Durability Properties of Self-Compacting Concrete (SCC). Adv. Mater. Sci. Eng. 2022, 2022, 9553382. [Google Scholar] [CrossRef]
- Wu, Q.; Wang, H.; Ma, S.L.; Zhang, C.S.; Cheng, W. Effect of seaweed impurities on the mechanical properties of coral concrete. Concrete 2022, 12, 172–175. [Google Scholar]
- Wang, G.; Wu, Q.; Zhou, H.; Peng, C.; Chen, W. Diffusion of chloride ion in coral aggregate seawater concrete under marine environment. Constr. Build. Mater. 2021, 284, 122821. [Google Scholar] [CrossRef]
- Li, Z.H.; Feng, S.R.; Su, C.; Ma, J.W. Erosion of cement-based materials by seawater chemical composition. Concrete 2012, 05, 8–11. [Google Scholar]
- Wang, F.; Sun, Y.Z.; Xue, X.Y. Mechanical properties of modified coral aggregate seawater sea-sand concrete: Experimental study and constitutive model. Case Stud. Constr. Mater. 2023, 18, e02095. [Google Scholar] [CrossRef]
- JGJ/T12-2019; Technical Standard for the Application of Light Aggregate Concrete. Ministry of Housing and Urban-Rural Development of the People’s Republic of China: Beijing, China, 2019.
- SL/T 352-2020; Experimental Regulations for Hydraulic Concrete. Ministry of Water Resources of the People’s Republic of China: Beijing, China, 2020.
- Wen, H.A.; Zheng, W.; Hu, L.S.; Ma, P.; Xu, M.; Huang, X.; Wang, Y.; Wang, Y.; Yu, K.; Wang, Y. Community characteristics of benthic shellfish in coral reefs of Weizhou Island, Beibu Gulf. Acta Oceanol. 2020, 42, 62–69. [Google Scholar]
- Wu, Z.Y.; Yu, H.F.; Zhang, J.H. Mesoscopic study of the mechanical properties of coral aggregate concrete under complex loads. Compos. Struct. 2023, 308, 116712. [Google Scholar] [CrossRef]
- Tariq Umar Yousaf, M.; Akbar, M.; Abbas, N. An Experimental Study on Non-Destructive Evaluation of the Mechanical Characteristics of a Sustainable Concrete Incorporating Industrial Waste. Materials 2022, 15, 7346. [Google Scholar]
- Zhang, H.B. Experimental Study on Coral Reef Sand Concrete Mixed with Seawater; Shenyang University of Technology: Shenyang, China, 2020. [Google Scholar]
- Li, X.M.; Du, Y.; Lin, C.X. Composition and population distribution of benthic shellfish in the intertidal zone of West Yaozhou Island, Hainan. J. Anhui Agric. Sci. 2010, 38, 2406–2408. [Google Scholar]
- Shi, W.H. Performance Study of All-Coral Concrete; Jiangsu University of Science and Technology: Zhenjiang, China, 2020. [Google Scholar]
- Li, J.; Yu, H.; Zheng, S.K.; Li, X. Application of secondary feeding method in concrete production. Jiangxi Build. Mater. 2006, 4, 54–55. [Google Scholar]
- GB/T50081-2019; Test Method Standard for Physical and Mechanical Properties of Concrete. Ministry of Housing and Urban-Rural Development of the People’s Republic of China: Beijing, China, 2019.
- Guo, R.X.; Guo, J.D.; Yan, F.; Xia, H.T.; Wang, F.X.; Lin, Z.W.; Ma, Q.M. Mechanical properties and failure mechanism of lightweight concrete with polypropylene fiber as aggregate. Bull. Chin. Ceram. Soc. 2019, 5, 38. [Google Scholar]
- Bindiganavile, V.; Banthia, N. Polymer and steel fiber-reinforced cementitious composites under impact loading-part 1: Bondslip response. ACI Mater. J. 2001, 98, 10–16. [Google Scholar]
- GB 50010-2010; Code for Design of Concrete Structures. Ministry of Housing and Urban-Rural Development of the People’s Republic of China: Beijing, China, 2010.
- Lv, H.J.; Chen, J.K.; Lu, C.S. A Statistical Evolution Model of Concrete Damage Induced by Seawater Corrosion. Materials 2021, 14, 1007. [Google Scholar] [CrossRef]
- Akbar, M.; Hussain, Z.; Pan, H.; Imran, M.; Thomas, B.S. Impact of waste crumb rubber on concrete performance incorporating silica fume and fly ash to make a sustainable low carbon concrete. Struct. Eng. Mech. 2023, 85, 275–287. [Google Scholar]


Disclaimer/Publisher’s Note: The statements, opinions and data contained in all publications are solely those of the individual author(s) and contributor(s) and not of MDPI and/or the editor(s). MDPI and/or the editor(s) disclaim responsibility for any injury to people or property resulting from any ideas, methods, instructions or products referred to in the content. |
© 2023 by the authors. Licensee MDPI, Basel, Switzerland. This article is an open access article distributed under the terms and conditions of the Creative Commons Attribution (CC BY) license (https://creativecommons.org/licenses/by/4.0/).