Article

A Study of the Mechanical Properties of Polyester Fiber Concrete Continuous Rigid Frame Bridge during Construction

1
Jiangxi Provincial Communications Investment Group Co., Ltd., Project Construction Management Company, Nanchang 330052, China
2
Jiangxi Ganyue Expressway Engineering Co., Ltd., Nanchang 330069, China
3
Department of Bridge Engineering, College of Civil Engineering, Tongji University, No. 1239 Siping Road, Shanghai 200092, China
*
Author to whom correspondence should be addressed.
Buildings 2023, 13(11), 2849; https://doi.org/10.3390/buildings13112849
Submission received: 7 October 2023 / Revised: 4 November 2023 / Accepted: 12 November 2023 / Published: 14 November 2023
(This article belongs to the Special Issue Research on the Mechanical and Durability Properties of Concrete)

Abstract

:
This study investigates the mechanical performance of a polyester fiber concrete continuous rigid frame bridge during construction and the spatial stress distribution of the 0# block box girder, with a focus on the backdrop of the bridge in Pipa Zhou, Jiangxi Province. Stress monitoring at critical cross-sections during bridge construction was combined with FE simulations to analyze the stress and alignment deviation variations along the cantilevered construction process of the bridges. Subsequently, after validating the accuracy of the whole bridge model, the actual internal force of the box girder cross-section was extracted to act on the 0# block box girder solid model, and the spatial force of the 0# block box girder under the state of maximal cantilever and the completed bridge was further investigated. The results indicate that during cantilever construction, the top, and bottom plates of the box girder were subjected to compression, with the bottom plates having relatively low compression stress close to the critical values for compression and tension. Attention should be paid to controlling tensile stress application. After reaching a quarter of the bridge’s span in construction, the alignment deviation of the main beam increases, necessitating enhanced monitoring and adjustments of the main beam elevation. Furthermore, FE analysis shows that under maximum cantilever and the completed bridge states, the stress variations of the top and bottom plates of the 0# block box girder remain consistent, with the top plate stress varying by no more than 2.5 MPa and the bottom plate stress varying by approximately 1 MPa. Moreover, the 0# block box girder shrinkage cracks were mainly located in the bottom and web plate, and the number of cracks in the 0# block box girder with polyester fibers was reduced compared to the cracks in the ordinary concrete box girder.

1. Introduction

Continuous rigid frame bridges find extensive use in bridge engineering due to their efficient utilization of concrete’s compressive properties and prestressed reinforcement’s tensile strength. However, in comparison to other bridge structures, the construction process of continuous rigid frame bridges is often more intricate, necessitating a comprehensive exploration of their mechanical behavior to ensure safety and reliability [1,2]. Furthermore, within continuous rigid frame bridges, the 0# block box girder is conventionally built using on-site pouring. Due to the large volume of its concrete elements, early shrinkage cracks present a notable challenge for this bridge type [3,4].
To gain an understanding of the load-bearing performance of continuous rigid frame bridges, researchers have conducted studies related to static features [5,6,7,8], dynamic attributes [9,10], and behavior under seismic loading conditions [11,12,13,14]. Continuous rigid frame bridges are considered fully prestressed structures and fall into hyperstatic structures. To ensure that the bridge’s stress and structural alignment align with the intended objectives during construction and upon completion, the stress and alignment deviations of the structure should be controlled within an ideal range. Therefore, reasonable construction process monitoring is a crucial measure for improving construction quality, preventing construction errors, and ensuring the safety of bridge structures [2,15]. Presently, a variety of non-destructive testing techniques are available for structural damage monitoring [16,17]. Furthermore, the internal structure of the 0# block box girder of continuous rigid frame bridges is intricate, and it is firmly connected to the bridge piers, which places the 0# block box girder in a complex three-dimensional stress state. Many scholars have researched the spatial stress conditions of the number 0 segmental box girder. Yang et al. [18] researched the shear hysteresis distribution of the 0# block box girder in a hybrid girder continuous rigid frame bridge under maximum cantilever states. Zhao et al. [19], in conjunction with a cantilever construction case of a continuous rigid frame bridge, proposed the main factors influencing the stress distribution of the 0# block box girder by analyzing the monitoring data of critical sections at various stages of cantilever construction. Zheng et al. [20] focused on a three-span continuous rigid frame bridge to study the impact of structural parameters on the structural response during construction. Nonetheless, the finite element models of the 0# block box girder created in the aforementioned studies are frequently based on idealized conditions and do not incorporate the genuine structural loads into the simulation of the 0# block box girder. To attain an authentic understanding of the mechanical response of the 0# block box girder, there is a need for further research in the establishment of a spatial solid model that takes into account the actual load conditions of rigid frame bridges.
On the other hand, the 0# block box girder of continuous rigid frame bridges consists of a large volume of concrete. Due to the characteristics of large-volume concrete, it is susceptible to shrinkage cracks induced by the heat generated during the hydration process [21,22,23]. To mitigate the issue of concrete cracking, fiber-reinforced concrete has emerged as an innovative composite material built upon traditional concrete. Research indicates that incorporating fiber materials into concrete can enhance the internal structure of the concrete matrix. This enhancement occurs without altering the chemical properties of the individual concrete materials while mitigating early cracking and improving the overall performance of the concrete [24,25,26]. One of the primary reasons for the occurrence of cracks in the 0# block box girder of continuous rigid frame bridges is early concrete shrinkage cracks. To mitigate the formation of early shrinkage cracks in the 0# block box girder, some researchers have incorporated fiber-reinforced concrete into the girders, with results showing a significant inhibitory effect on crack formation [27,28,29]. Kasu et al. [30] studied the flexural strength of concrete containing polyester ultra-fine fibers under static loads. The findings suggest that including polyester fibers significantly enhances the concrete’s flexural and fatigue performance. In experiments by Qiao et al. [31], polyester fiber concrete exhibited a substantial increase in load-bearing capacity, improved deformation behavior, and prevented brittle failure in structural components. Nirmala et al. [32] investigated the influence of polyester fibers on concrete’s compressive performance, revealing that their incorporation enhances concrete’s resistance to shrinkage crack formation and improves its mechanical properties. Koniki et al. [33] introduced polyester and polypropylene fibers into concrete to enhance its supplementary properties. The results indicate that adding fibers led to an increase in the concrete’s compressive strength. Specifically, polypropylene fibers were found to prevent the formation of shrinkage micro-cracks, while polyester fibers proved to be more effective in reducing crack propagation. In summary, the literature reviewed suggests that adding polyester fibers to concrete enhances its compressive strength and significantly reduces early shrinkage cracks. This indicates that the application of polyester fiber concrete to the 0# block box girder of continuous rigid frame bridges has the potential to ameliorate the issue of early shrinkage cracks in the concrete of the 0# block box girder. However, research on the application of polyester fiber concrete in bridge engineering remains relatively scarce. Further investigations are required to assess the impact of polyester fibers on the mechanical performance during rigid frame bridge construction and their influence on early shrinkage cracks.
Based on a comprehensive review of current research, this paper introduces the idea of applying polyester fiber concrete to the 0# block box girder in continuous rigid frame bridges to reduce early age shrinkage cracks. Additionally, this study combines real on-site construction monitoring data with FE analysis techniques to analyze the mechanical performance of polyester fiber continuous rigid frame bridges during construction. Through an examination of the stress distribution and alignment deviation variations along the cantilevered construction process of continuous rigid frame bridges, as well as an investigation into the spatial stress distribution and shrinkage cracks patterns in polyester fiber concrete the 0# block box girder, this research establishes the viability of using polyester fibers in continuous rigid frame bridges. This contribution offers guidance for the construction of similar bridges and the application of polyester fibers in rigid-frame bridges.

2. Engineering Background
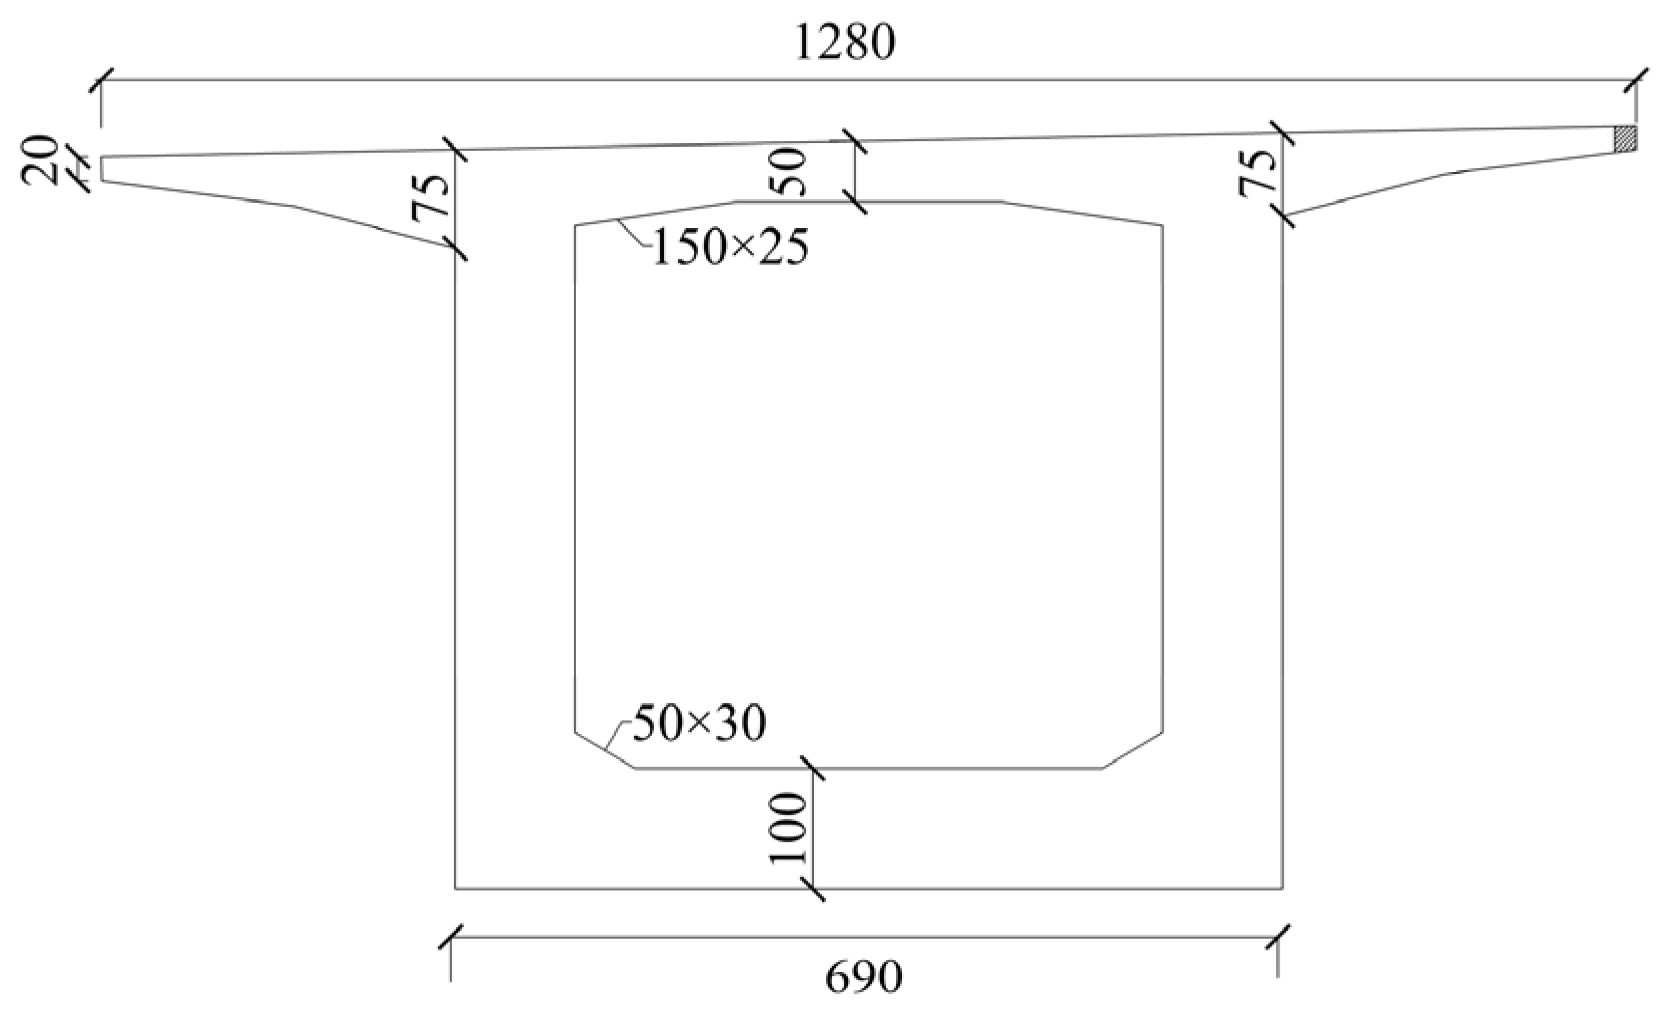
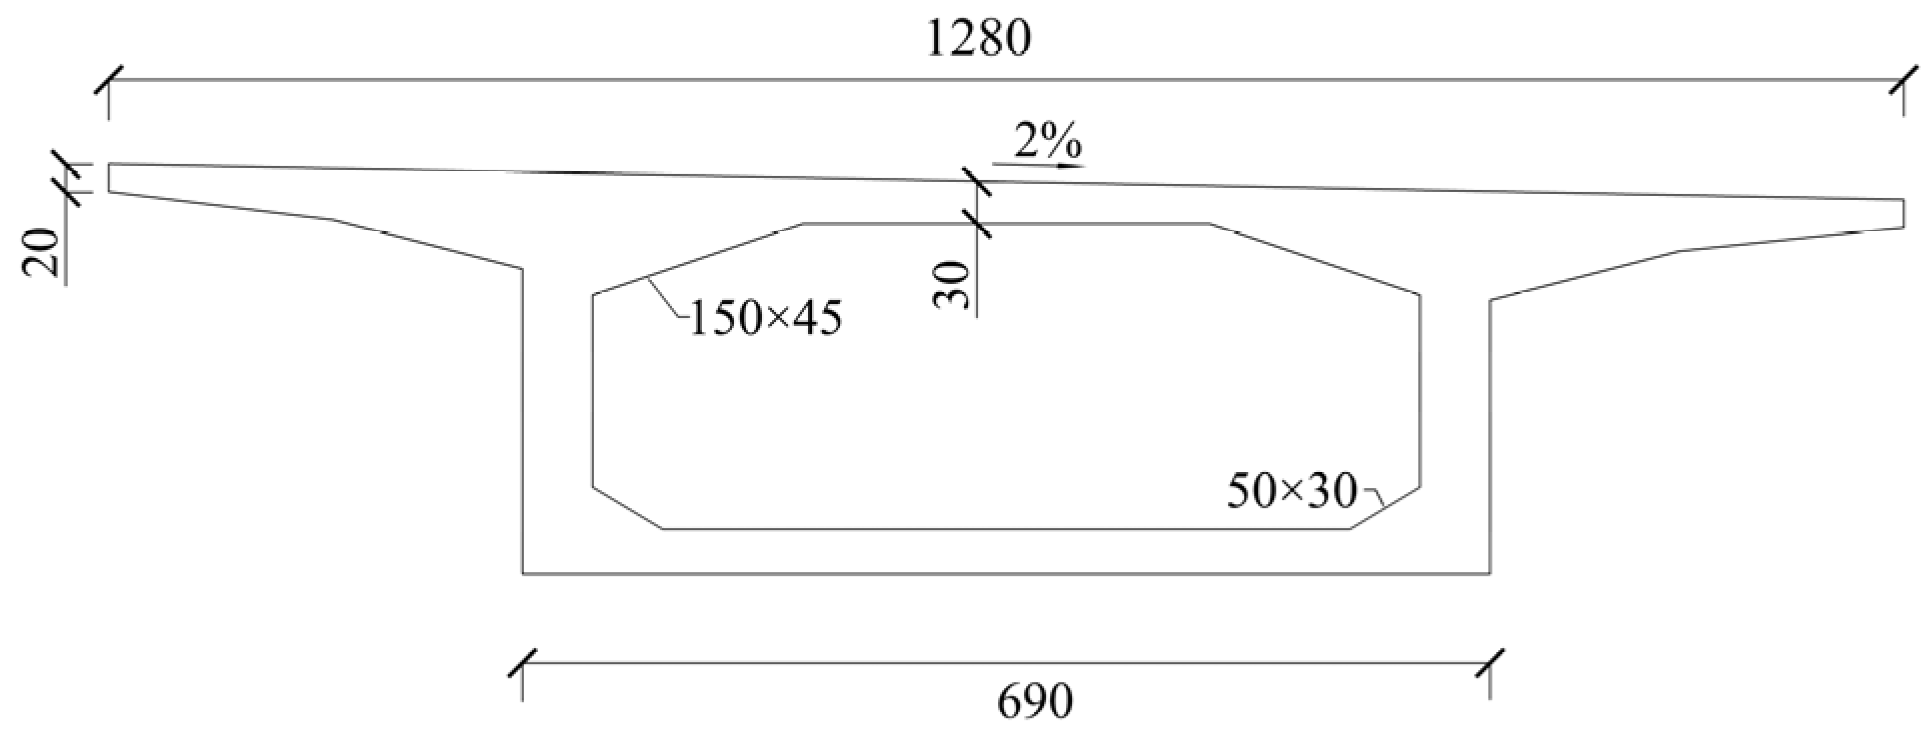
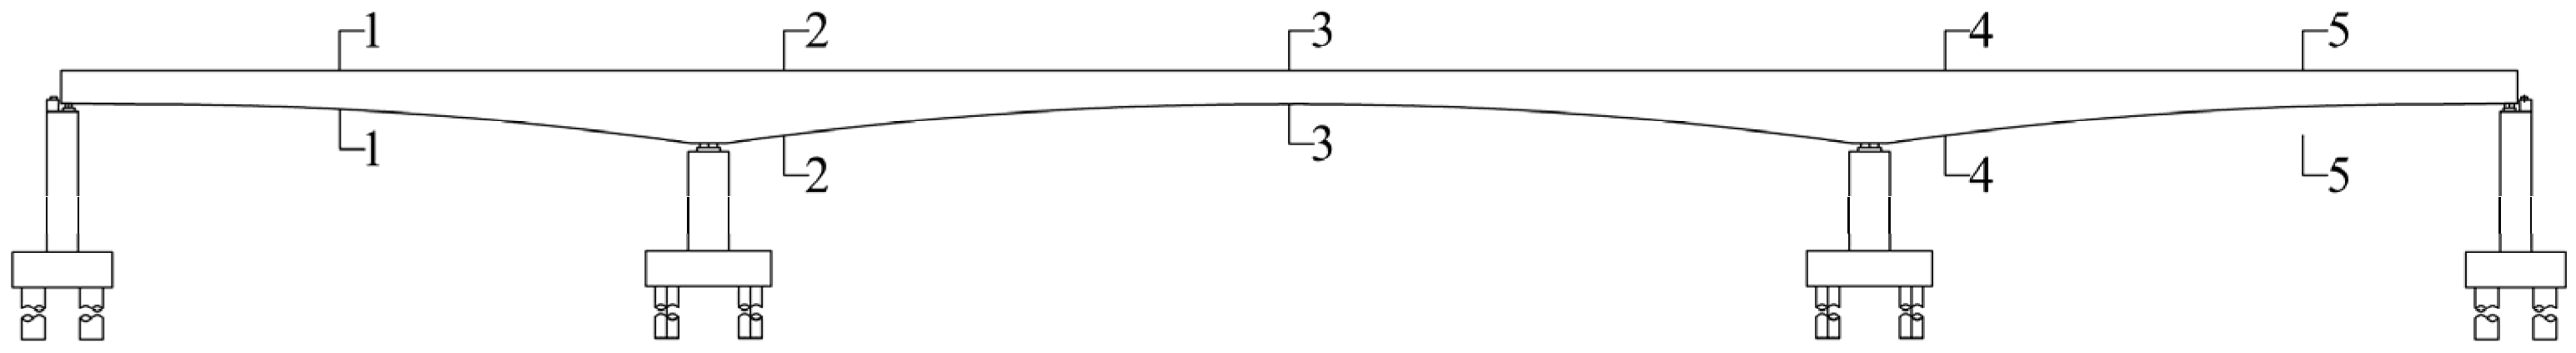
2.1. Overall Design

The Pipa Zhou continuous rigid frame bridge spans a combination of 55 m + 100 m + 55 m. The primary beam structure consists of a variable-section prestressed concrete box girder with a three-way prestressing system. The top plate of the box girder is 12.8 m wide; the bottom plate is 6.9 m wide, and the flange plate has a cantilever length of 2.95 m. The beam heights range from 2.8 to 6.2 m. Except for the block 0# box girder, each single “T” box girder is divided into 13 pairs of beam segments with longitudinal segmental lengths of 6 × 3.0 m + 4 × 3.5 m +3 × 4.0 m. The total length of block 0# is 10 m, the length of the side and middle span of the main bridge is 2 m, and the length of the side span cast-in-place section is 3.86 m. The main bridge pier adopts a double-limbed thin-walled pier, single-limbed section size is 6.9 m × 2 m, and double-limbed spacing is 4.0 m. The main bridge’s block 0# box girder is cast-in-place construction on the pier side bracket. The box girder adopts the hanging basket cantilever cast-in-place construction method. The side mid-span joint section adopts hanger cast-in-place construction, the side span cast-in-place section sets up bracket cast-in-place construction, and the foundation adopts bearing platform bored pile. Figure 1, Figure 2, Figure 3 and Figure 4 show the bridge layout and main beam segment.

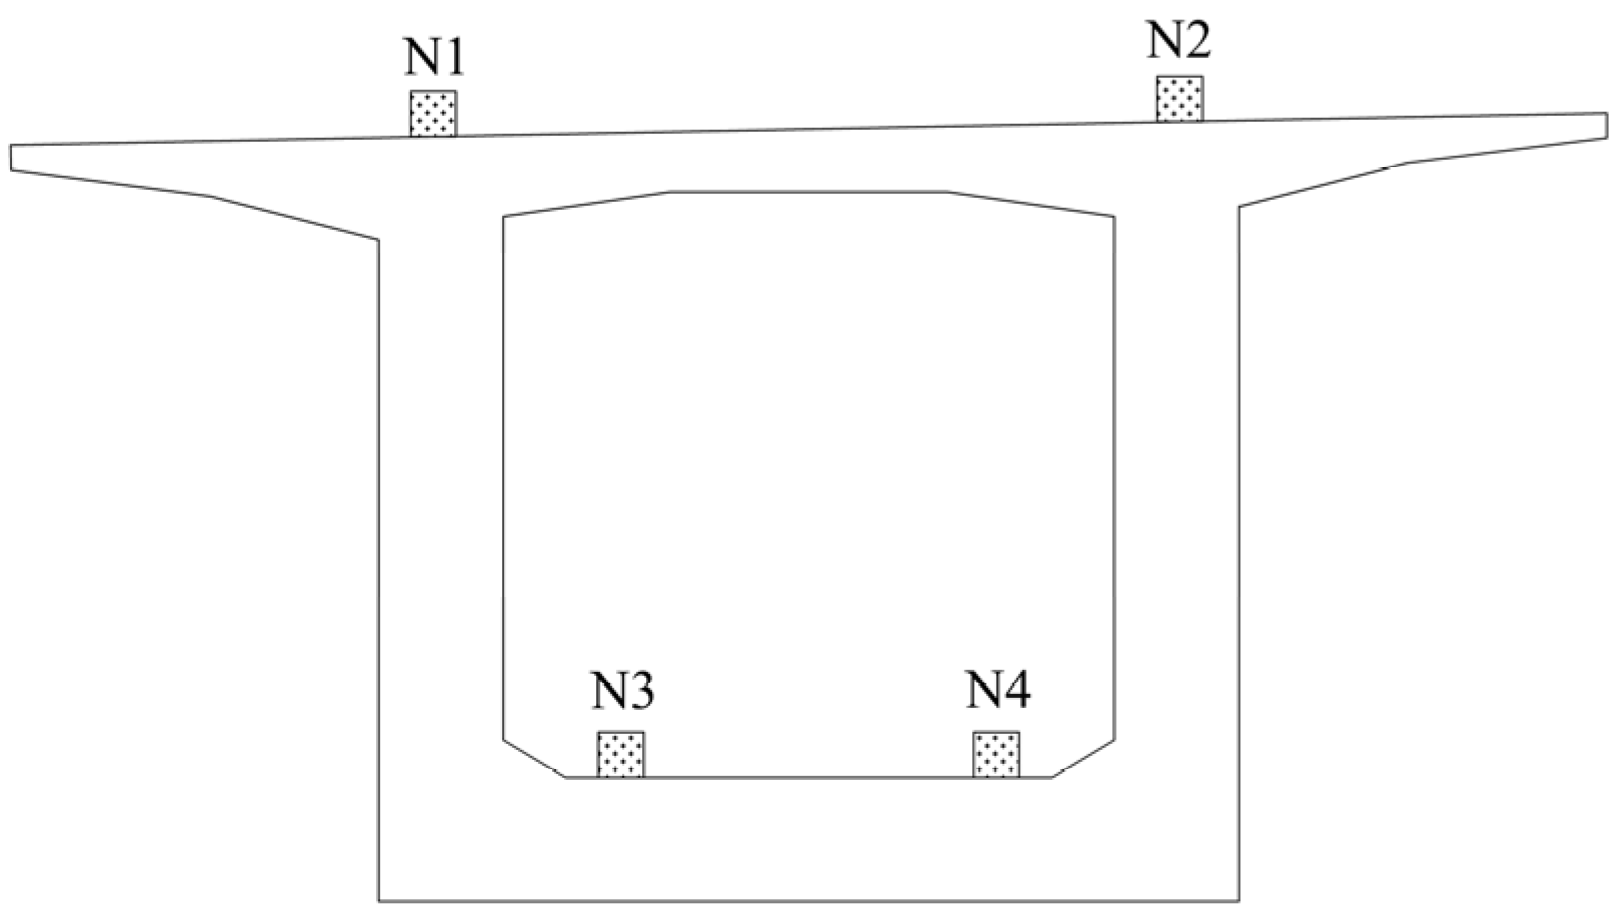
2.2. Monitoring Program

In order to analyze the force characteristics of the continuous rigid frame bridge, the stress, and deformation of the critical cross-section of the main beam were monitored during the construction of the continuous beam bridge. The most unfavorable locations were selected for monitoring in the construction process, which was the maximum positive moment cross-section of the side spans, the pivot cross-section, and the mid-span cross-section of the middle span, and the specific location of each cross section was shown in Figure 5.
The main beam stress monitoring aims to ensure the main beam’s safety during construction and provide data support for the stress warning. The measurement points of the main beam test section were selected from the top edge of the box beam top plate and the bottom edge of the plate, and the location of the cross-section arrangement is shown in Figure 6. Main beam elevation monitoring aims to ensure the correctness of the construction beam section sampling position and provide measured parameters for error analysis and parameter identification of construction control. Deflection measurement is achieved through a high-precision total station that mainly measures the elevation of each control point of the hanging basket before and after pouring concrete and the elevation of the main beam control points before and after prestressing tensioning. The arrangement position is shown in Figure 7.

2.3. Measurement of Construction Conditions

The construction process was categorized into 18 conditions in the monitoring, as shown in Table 1. Strain measurements were made for the concrete pouring, prestressing tensioning, and joining each span for each beam section during construction.

3. Analysis of the Mechanical Behavior during Construction of the Continuous Rigid Frame Bridges

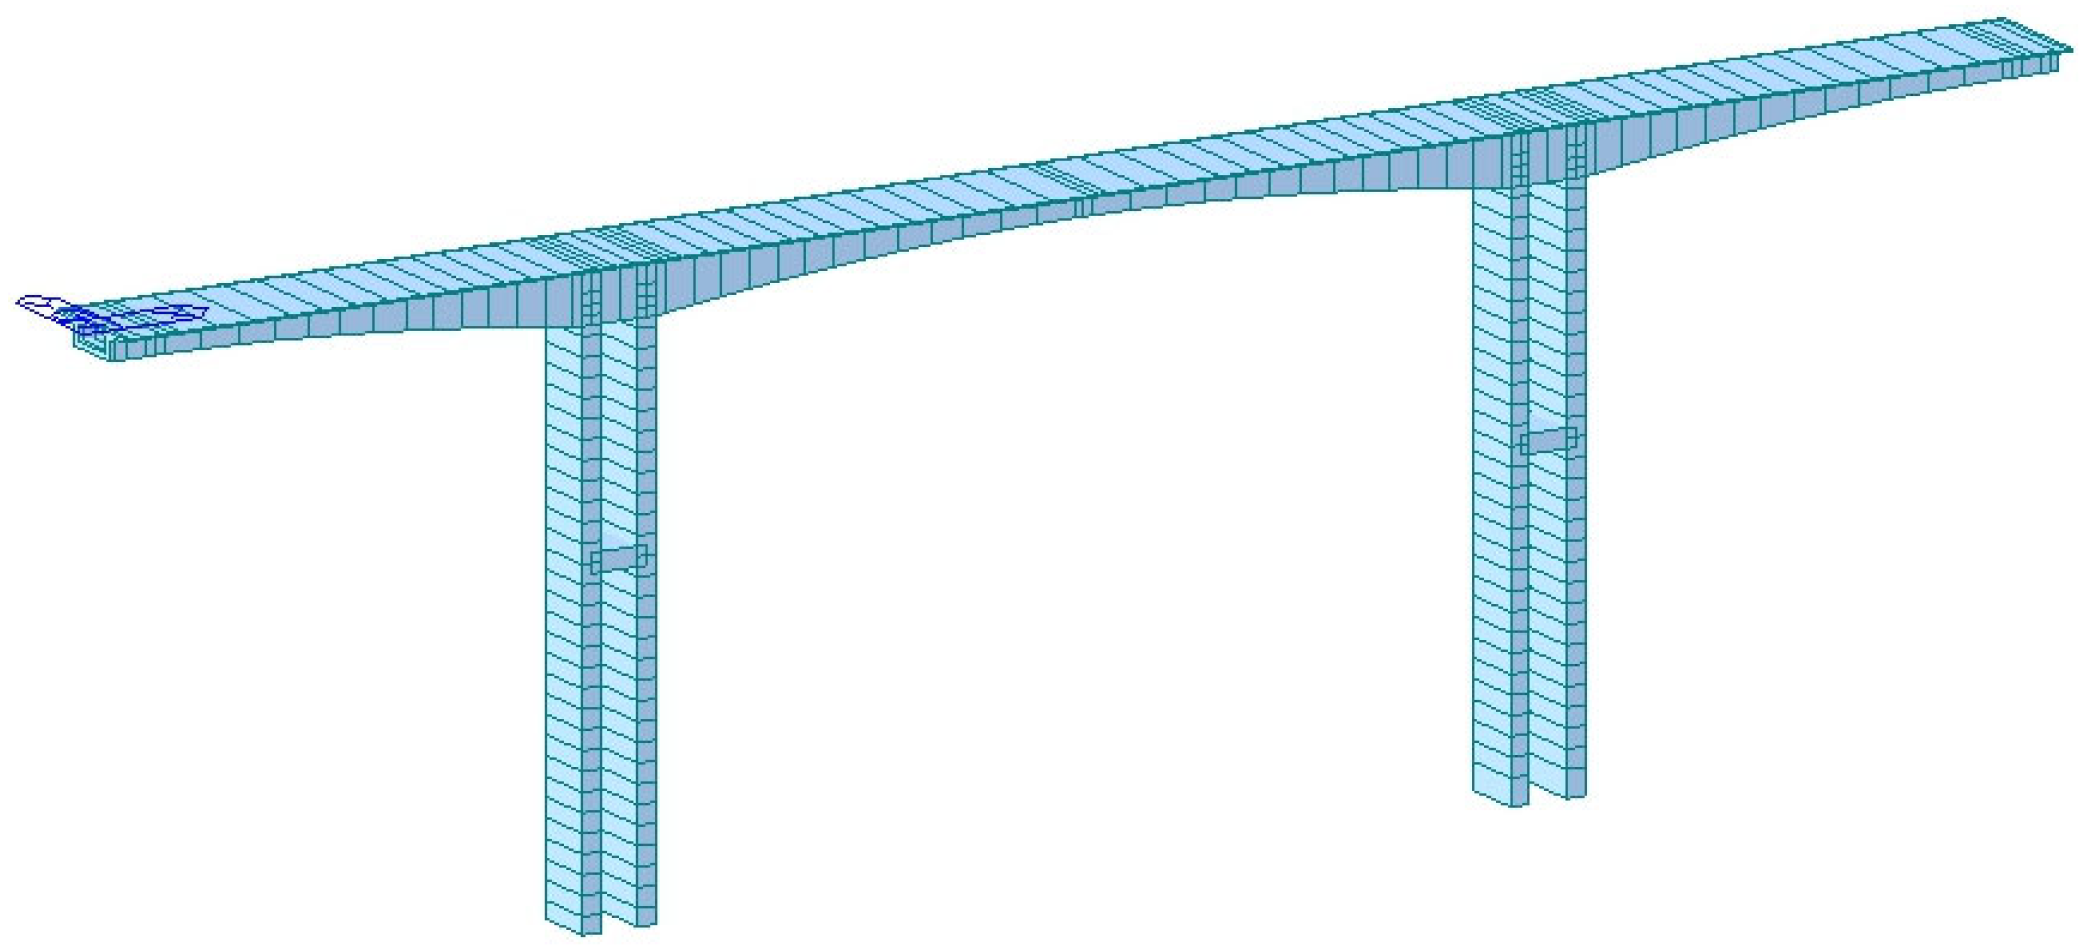
3.1. FE Model of the Whole-Bridge

To investigate the mechanical properties of polyester fiber concrete continuous rigid frame bridge during the construction process, MIDAS/CIVIL was chosen to establish a FE calculation model for the whole bridge. The beam girder was constructed using of C50 concrete. The double-limb thin-walled pier was constructed using C40 concrete. The top plate employs 15.2 mm prestressed steel strands with a tensile strength standard of 1860 MPa. The tension control stress is set at 1395 MPa, using a single-end stressing method with alternating strands—the vertical tendon employed JL32 finely-rolled rebar with a standard tensile strength of 785 MPa. The tension control stress for this tendon was set at 706.5 MPa, and it was single-end tensioned. The longitudinal steel bundle also used a 15.2 mm prestressing steel strand with a standard tensile strength of 1860 MPa and a tension control stress of 1395 MPa. The material properties are shown in Table 2.
In the FE model, beam elements were employed to simulate various components of the bridge. The whole bridge consisted of 145 nodes and 128 beam elements. The main piers were divided into 24 elements, while the main beam was divided into 104 elements. Specifically, each upper box girder section on the main piers, denoted as block 0# box girder, was further divided into 6 elements to account for the influence of transverse diaphragms. The cantilevered beam segments were divided into 13 elements, the mid-span closure section into 1 element, and the side-span closure section into 1 element. Additionally, each of the end-span cast-in-place sections was divided into 1 element. Boundary conditions were set to be fixed at the bottom of the piers, the pier-beam combination was simulated with a common node, the longitudinal bridge displacement and bending moment were released at the side span supports, and the other directions were restrained, and the acting loads consider the self-weight of the concrete, the temporary load, the temperature, and the concrete shrinkage and creep. The whole bridge is modeled as shown in Figure 8.

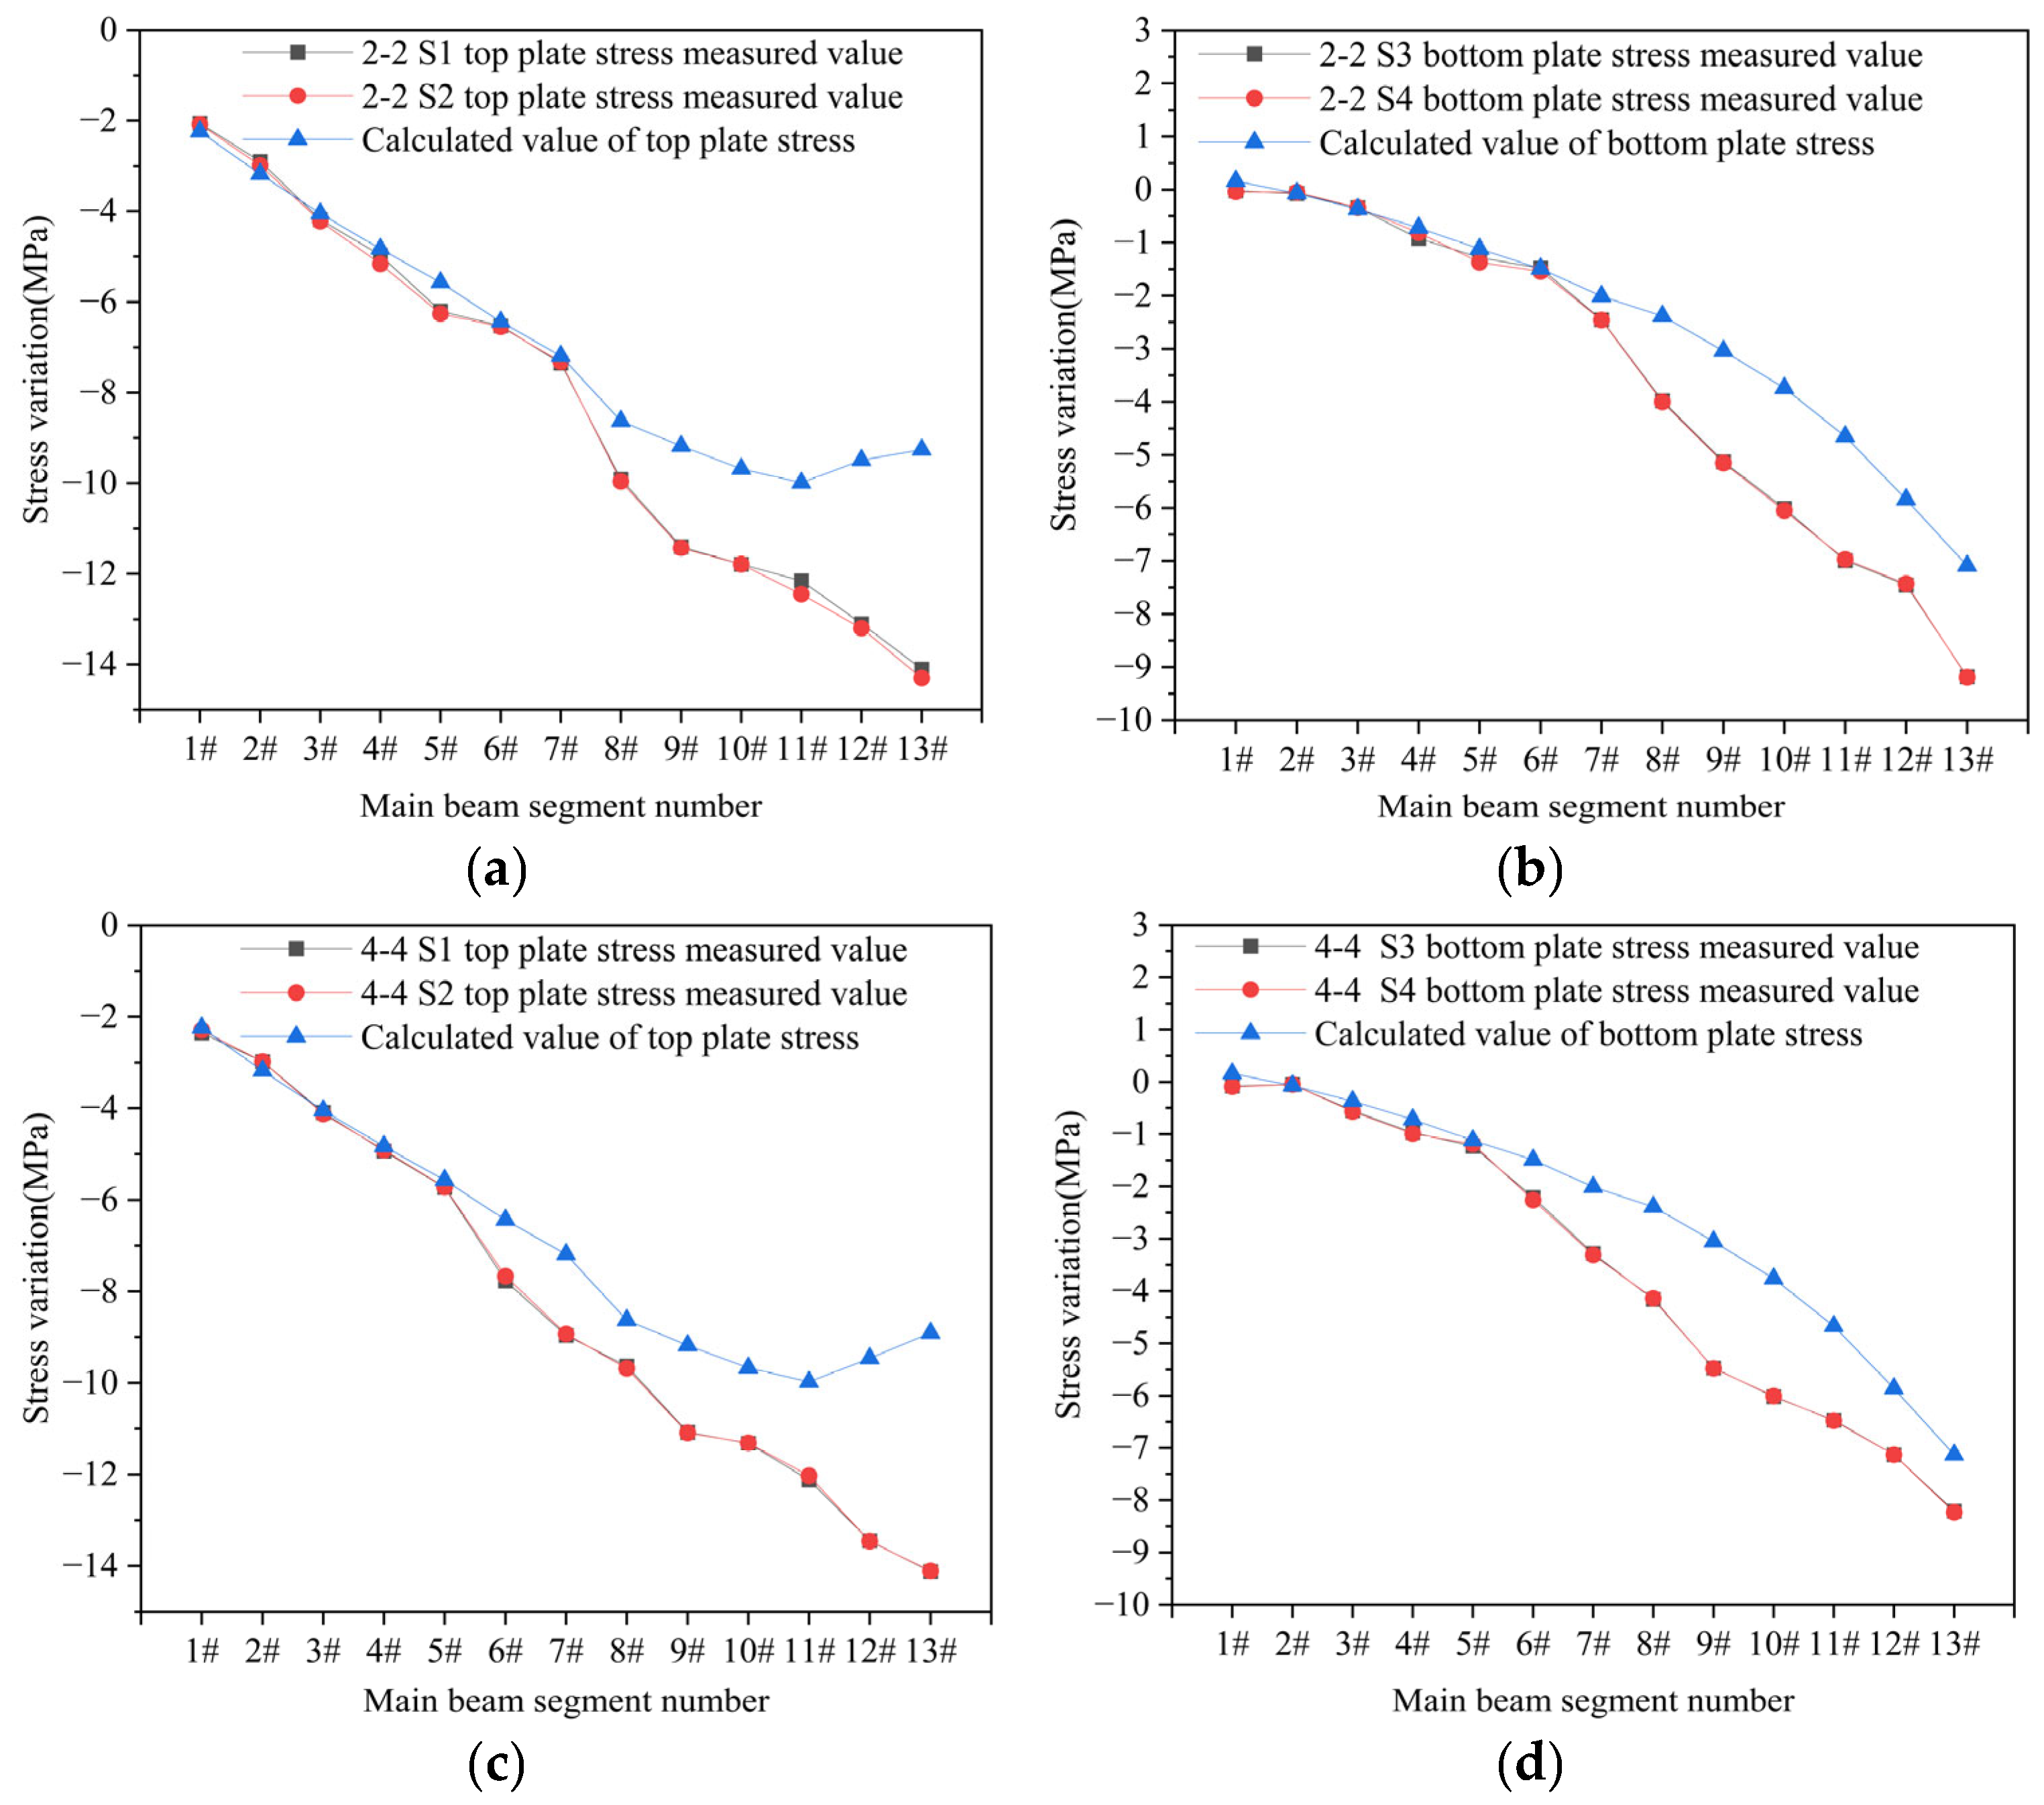
3.2. Analysis of Main Beam Stress during Construction of the Continuous Rigid Frame Bridge

During the cantilever construction of the continuous rigid frame bridge, the most unfavorable stress part of the main beam is located at the cantilever 0# block box girder. Therefore, this paper selects the 2-2 and 4-4 sections of the 0# block box girder located at the left and right piers to analyze the stress change of the box girder under the prestressing tendon tensioning construction condition of each main girder segment.
Figure 9 shows the stress changes in the top and bottom plates of 0# block box girder after prestressing tendon tensioning in each main beam segment. It can be seen that during the cantilever construction of the bridge, the top and bottom plates of the control section of the main beam were in the state of compression, and the main beam section was compressed without tensile stress, which is in line with the design requirements of prestressed concrete members. The figure also shows that with the tensioning of prestressing tendons in each segment of the main beam, the compressive stresses in the top and bottom plates of the box girder were increasing. The values of the compressive stresses in the top plate’s S1 and S2 measurement points of the top plate and the S3 and S4 measurement points were the same, which also indicates the accuracy of the strain monitoring results. The trend of the strain monitoring values was consistent with the calculated values of the FE model.
Furthermore, as illustrated in Figure 9b,d, it is apparent that the main beam of the continuous rigid frame bridge experiences minimal variations in the compressive stress value of the bottom plate prior to the tensioning of prestressing tendons in beam segment 6#. The compressive stress remains relatively low, reaching a minimum of only 0.02 MPa, which closely approaches the critical threshold between compression and tension. It can be seen that in the early stage of the cantilever construction stage, the main beam prestressing tendon tensioning control stress is crucial for the control of box girder bottom plate stress, and the stress change of the box girder bottom plate should be emphasized in the actual project.
It is worth noting that, in the stage before the tensioning construction of the main beam segment 7# or prior to the construction of the main beam segment reaching the mid-span at L/4, the measured stress values for both the top and bottom plates closely matched the calculated model values, with a deviation of 15% or less. However, after the tensioning construction of beam segment 7#, the measured stress values for the main beam segment deviated further from the modeled values. Especially for the main beam top plate stress, it can be seen from Figure 9a,c that the maximum deviation of both stresses reaches about 35% after the prestressing tensioning of the 13# beam segment, which also indicates that the main beam needs to pay attention to the control of the tensioning prestressing in the beam segment merging stage in the process of the cantilever construction, to avoid the production of tensile stresses that cannot meet the design requirements. Generally speaking, the monitoring values of the stresses in the main beam coincide with the calculated values, which also shows the accuracy of the FE model in this paper.

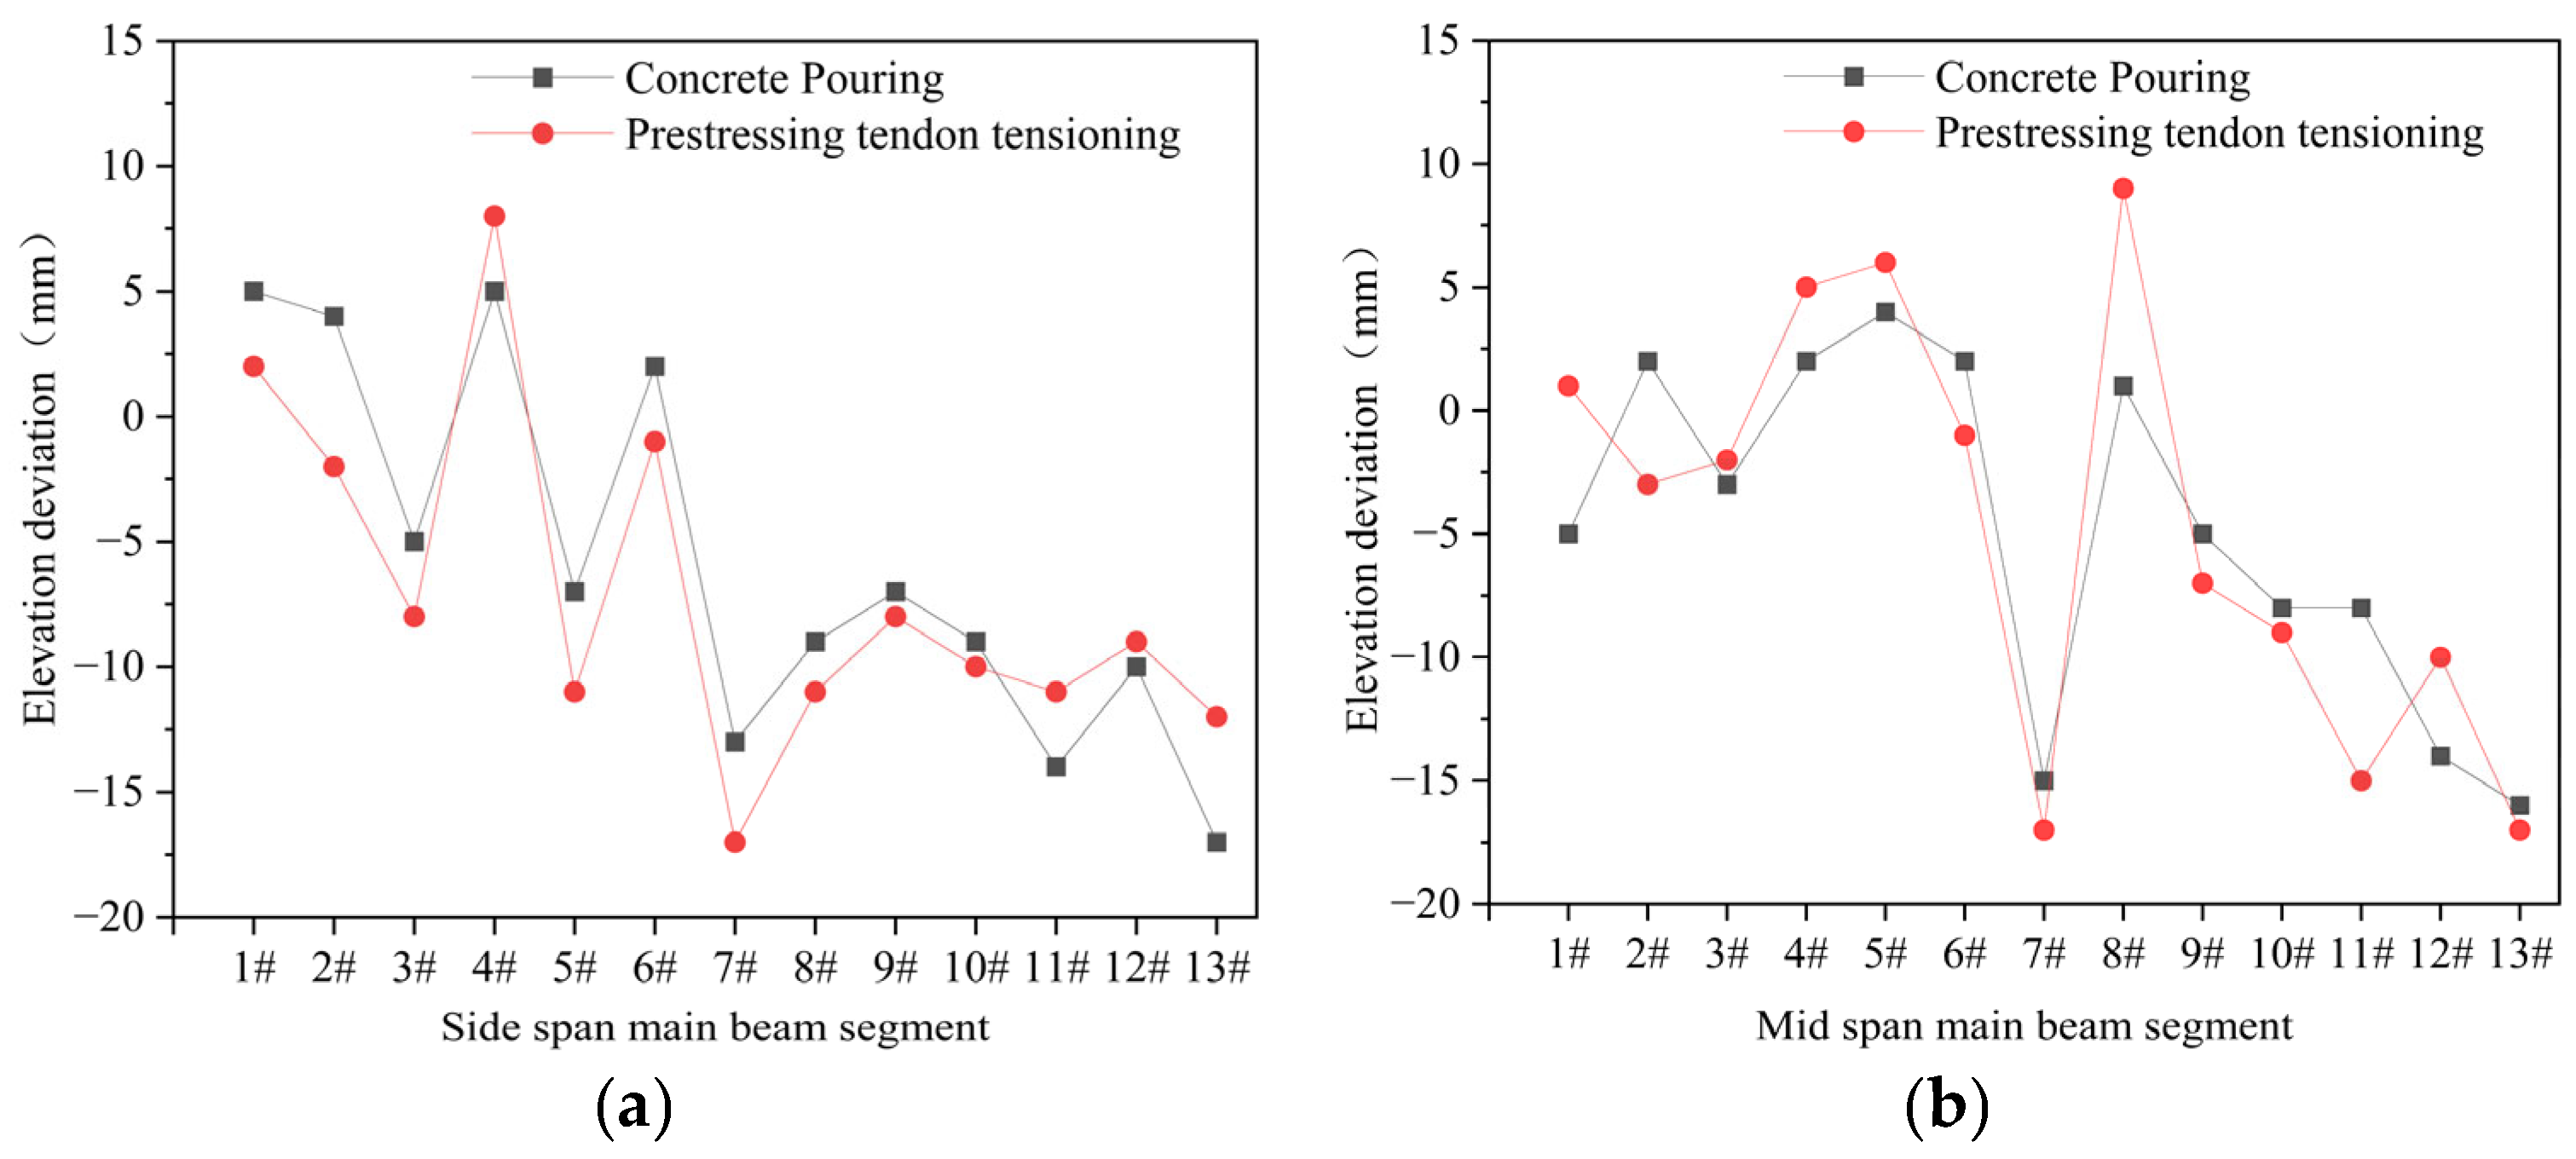
3.3. Analysis of Main Beam Alignment during Construction of the Continuous Rigid Frame Bridge

The control of the main beam alignment of a continuous rigid frame bridge is of paramount importance for assessing construction quality, ensuring the precision of the beam section geometry, and maintaining the stability of the bridge structure. The elevation of each beam segment of the main beam was monitored during the construction of the Pipa Zhou continuous rigid frame bridge.
Figure 10 shows the variation of the deviation of the measured and control values of the main beam elevation before concrete placement and after prestressing tensioning of each beam segment. It can be seen that the deviation of the elevation of the main beam before the concrete pouring and after the prestressing tensioning of each beam section was changing, especially after the construction of beam segment 6#, the deviation of the elevation of the main beam increased obviously. As can be seen from Figure 10a,b, for the left pier, the average values of elevation deviation before concrete pouring for the side and middle spans of the first six beam segments were 4.6 mm and 3 mm, respectively. In comparison, the average values of elevation deviation for the last 7 beam segments were 13.16 mm and 11.16 mm, respectively. The elevation deviation variations were 64.56% for the side and 73.13% for the midspans. Following the tensioning of the prestressing tendons, the side span and midspan elevation deviation averages for the first six beam segments were 3.0 mm and 5.33 mm, respectively. For the last seven beam segments, the average elevation deviation values were 13 and 14 mm. The elevation deviation variations were 58.94% for the side and 78.57% for the midspans. Similarly, for the right pier, it can be seen from Figure 10c,d that the elevation deviation of the main beam was changing during the cantilever construction, especially the elevation deviation of the last seven beam segments was more noticeable compared to the first six beam segments.
These observations indicate that the elevation control of the main beam after prestressing tendon tensioning was relatively stable in the first six beam segments during the cantilever construction process. In comparison, the elevation deviation in the last seven beam segments had increased, which needs to be focused on monitoring during the construction process. In addition, it can also be seen that after the construction of the last seven beam segments, the elevation deviation of the main beam after prestressing tensioning was negative, which also indicates that the actual elevation of the main beam did not reach the control elevation during the construction process. It is necessary to strengthen the monitoring and adjustment of the main beam elevation and to assess the loss of prestressing force and prestressing relaxation.

4. Analysis of Mechanical Properties of the 0# Block of Continuous Rigid Frame Bridge

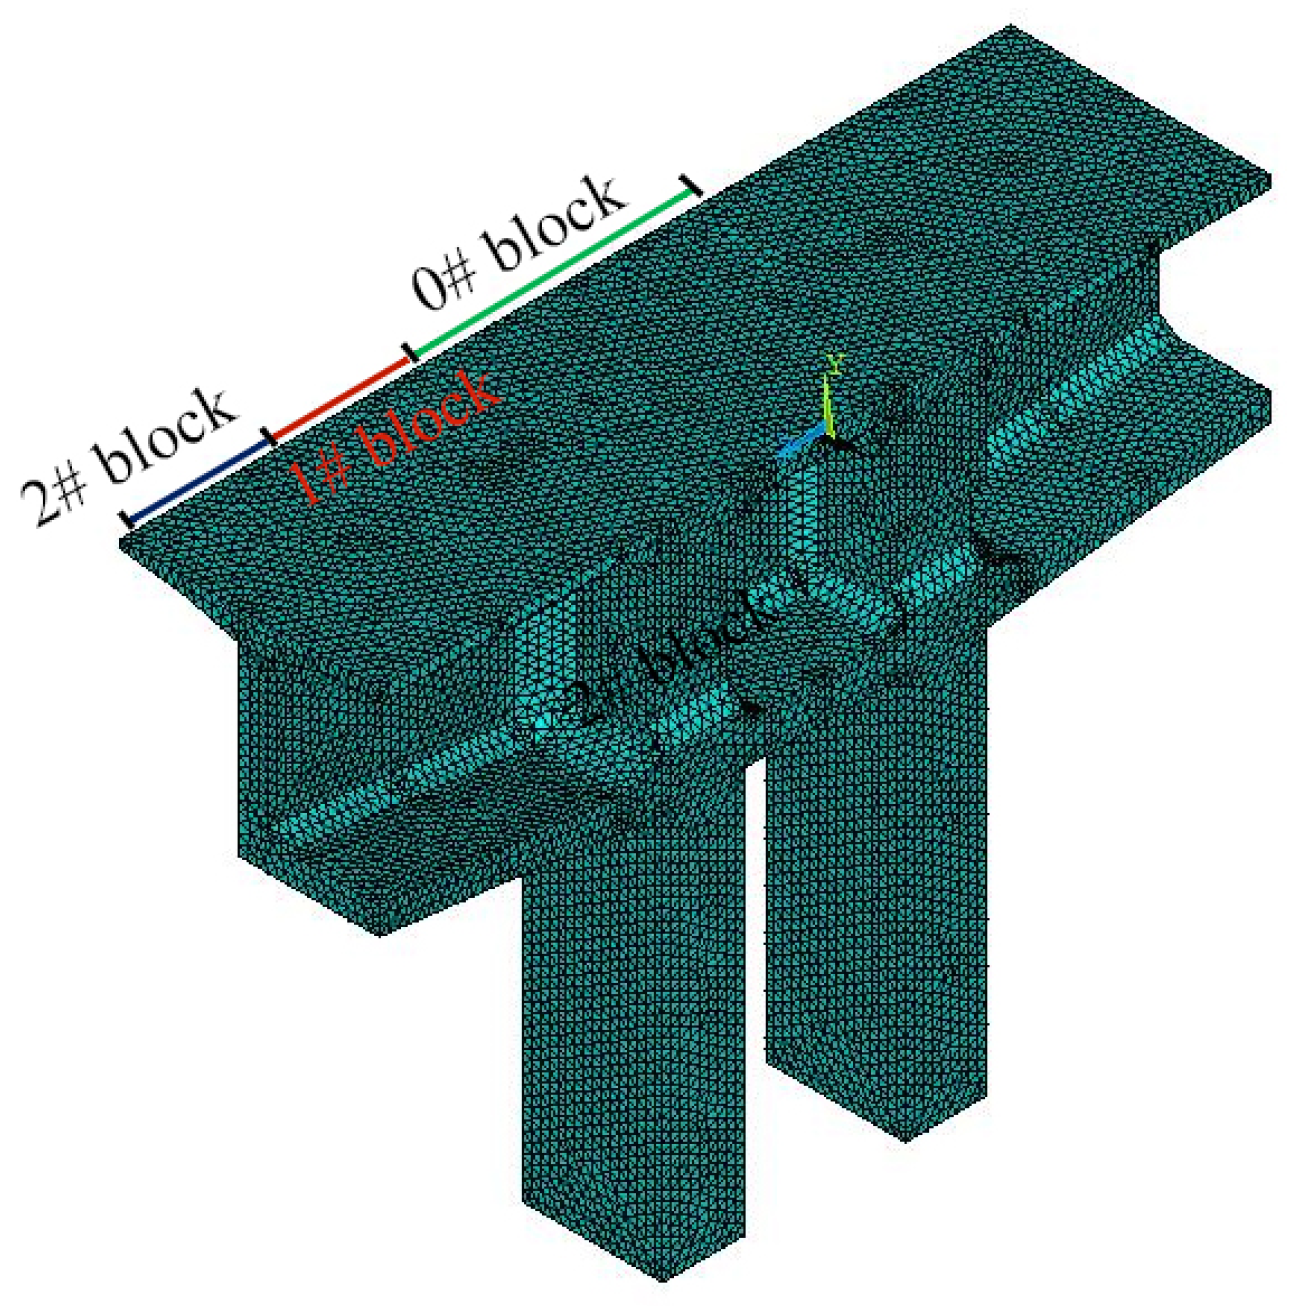
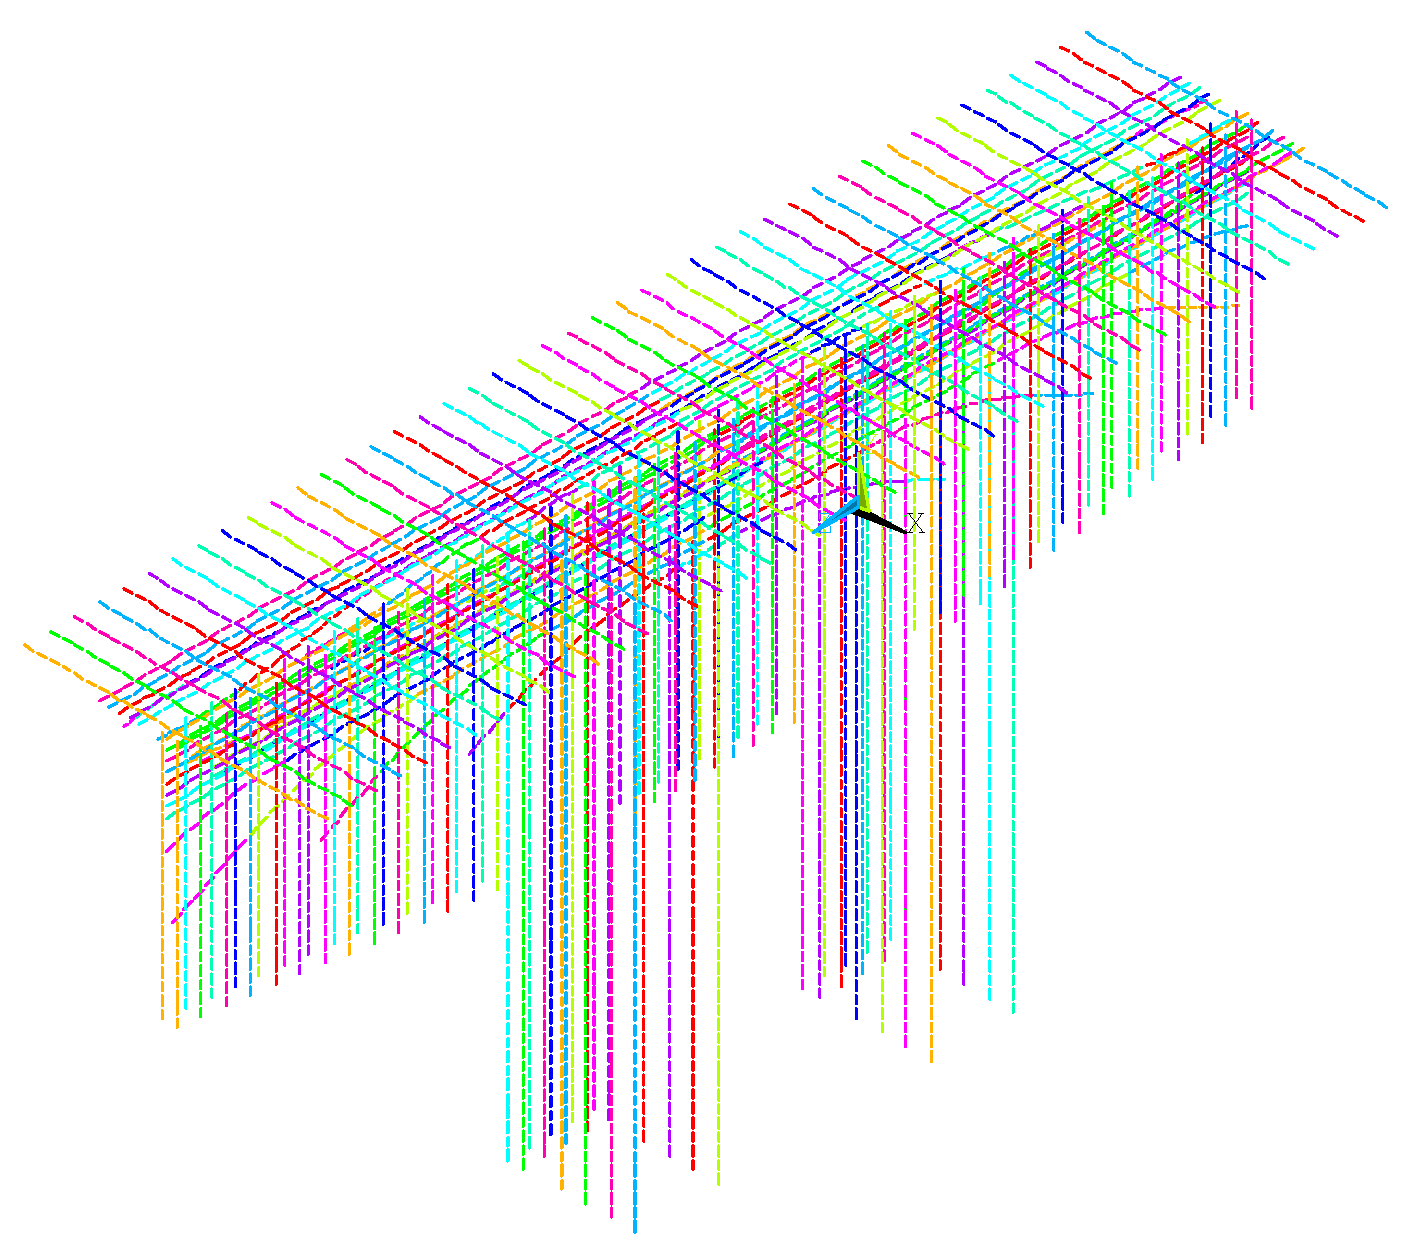
4.1. Block 0# FE Simulations

The continuous rigid frame bridge adopts a cantilever pouring construction method. Initially, temporary supports are erected at the top of the main piers, and the 0# block box girder at the summit of the main piers is poured in situ. Subsequently, symmetrical hanging baskets are installed on both sides of the 0# block to pour the next segment of the box girder. It is evident that the 0# block box girder at the top of the main piers is a critical structural element for the continuous rigid frame bridge. Given the intricate spatial structure of the 0# block box girder and the non-uniform stress distribution in its various sections during construction, ensuring its quality and structural safety is paramount. To achieve this, the study further employs the FE software ANSYS version 18.2 to create a solid model of the 0# block box girder. The initial analysis focuses on assessing the spatial stress distribution of the 0# block box girder in both the maximum cantilever and completed bridge states. Subsequently, the study discusses the influence of temperature on early shrinkage cracks within the box girder and conducts a comparative analysis of crack distribution between the 0# block box girder with incorporated polyester fibers and a standard concrete box girder.

4.2. Parts of FE Model

The solid model consists of the 0# block + 1# block + 2# block in order to adhere to the Saint-Venant principle and lessen the effect of stress concentration on the stress distribution of the 0# block box girder. The longitudinal length of the model is 22 m, with the 0# block box girder spanning 10 m, and the total model height is 16.2 m, including a 10 m pier height. This model represents concrete using Solid65 elements, while longitudinal, transverse, and vertical prestressing tendons are simulated using Link10 elements. The application of prestress is simulated using a cooling method, with an allowance for a 20% prestress loss. The model elements are structured using a free meshing format with dimensions of 25 cm. Concrete elements are divided into tetrahedral meshes, and the connection between prestressing tendons and concrete is established through constraint equations. Information about the element type and mesh for each part is presented in Table 3. The concrete solid model and the prestressing steel bundles model are shown in Figure 11 and Figure 12.

4.3. Material Properties

To address the issue of early shrinkage cracking in the 0# block box girder after its pouring, 0.9 kg/m³ of polyester fibers were incorporated during the construction. They were dispersed throughout the concrete elements when simulating. This distribution was achieved by utilizing the properties of the Solid65 element in ANSYS, which allowed for the setting of a three-dimensional fiber volume fraction to represent the presence of polyester fibers in the concrete. Furthermore, adjustments were made to the mechanical properties of the concrete material to account for the influence of polyester fibers. The concrete’s constitutive behavior was modeled using ANSYS’ Multilinear Kinematic (MKIN) enhancement model for capturing the mechanical response of the concrete, with material properties detailed in Table 4 and Table 5.

4.4. Boundary Conditions

The box girder exhibits symmetry in both the longitudinal and transverse directions, thus the selection of a 1/2 box girder structure for analysis. In the 1/2 box girder model, symmetric constraints are applied to the longitudinal cross-section, and the internal force values at the end section of the 2# block box girder, calculated from the Midas Civil whole-bridge FE model, are utilized as boundary conditions and imposed on the end section of the solid model. Specifically, axial forces are represented as uniformly distributed loads, shear forces are uniformly distributed across nodes on the end section, and bending moments are simulated as a pair of force couples, evenly applied to nodes on both the upper and lower sides of the centroid axis of the 2# block box girder end section. The detailed load boundary conditions are provided in Table 6. Additionally, when simulating the shrinkage cracks in the 0# block box girder, the influence of ordinary and prestressed steel reinforcement on concrete shrinkage is considered. Furthermore, the simulation accounts for the representation of equivalent temperature differential shrinkage by setting a reference temperature of 18 °C and a uniform temperature of 8 °C to model temperature-induced shrinkage.

4.5. Analysis Steps

In the FE nonlinear analysis of the 0# block box girder model, an automated solver selection and time step predictor are utilized. The substep count is fixed at 100, and a maximum balance iteration limit of 100 is set for each substep. Convergence is assessed using a combined force and displacement control approach, with convergence checks conducted using both the L2 norm and the infinity norm. The convergence tolerance is uniformly defined as 1%. Lastly, using the ‘Concrete Plot’ functionality, the ANSYS universal post-processing framework generates a plot showing the distribution of cracks in the box girder’s concrete.

5. Results of FE Analyses

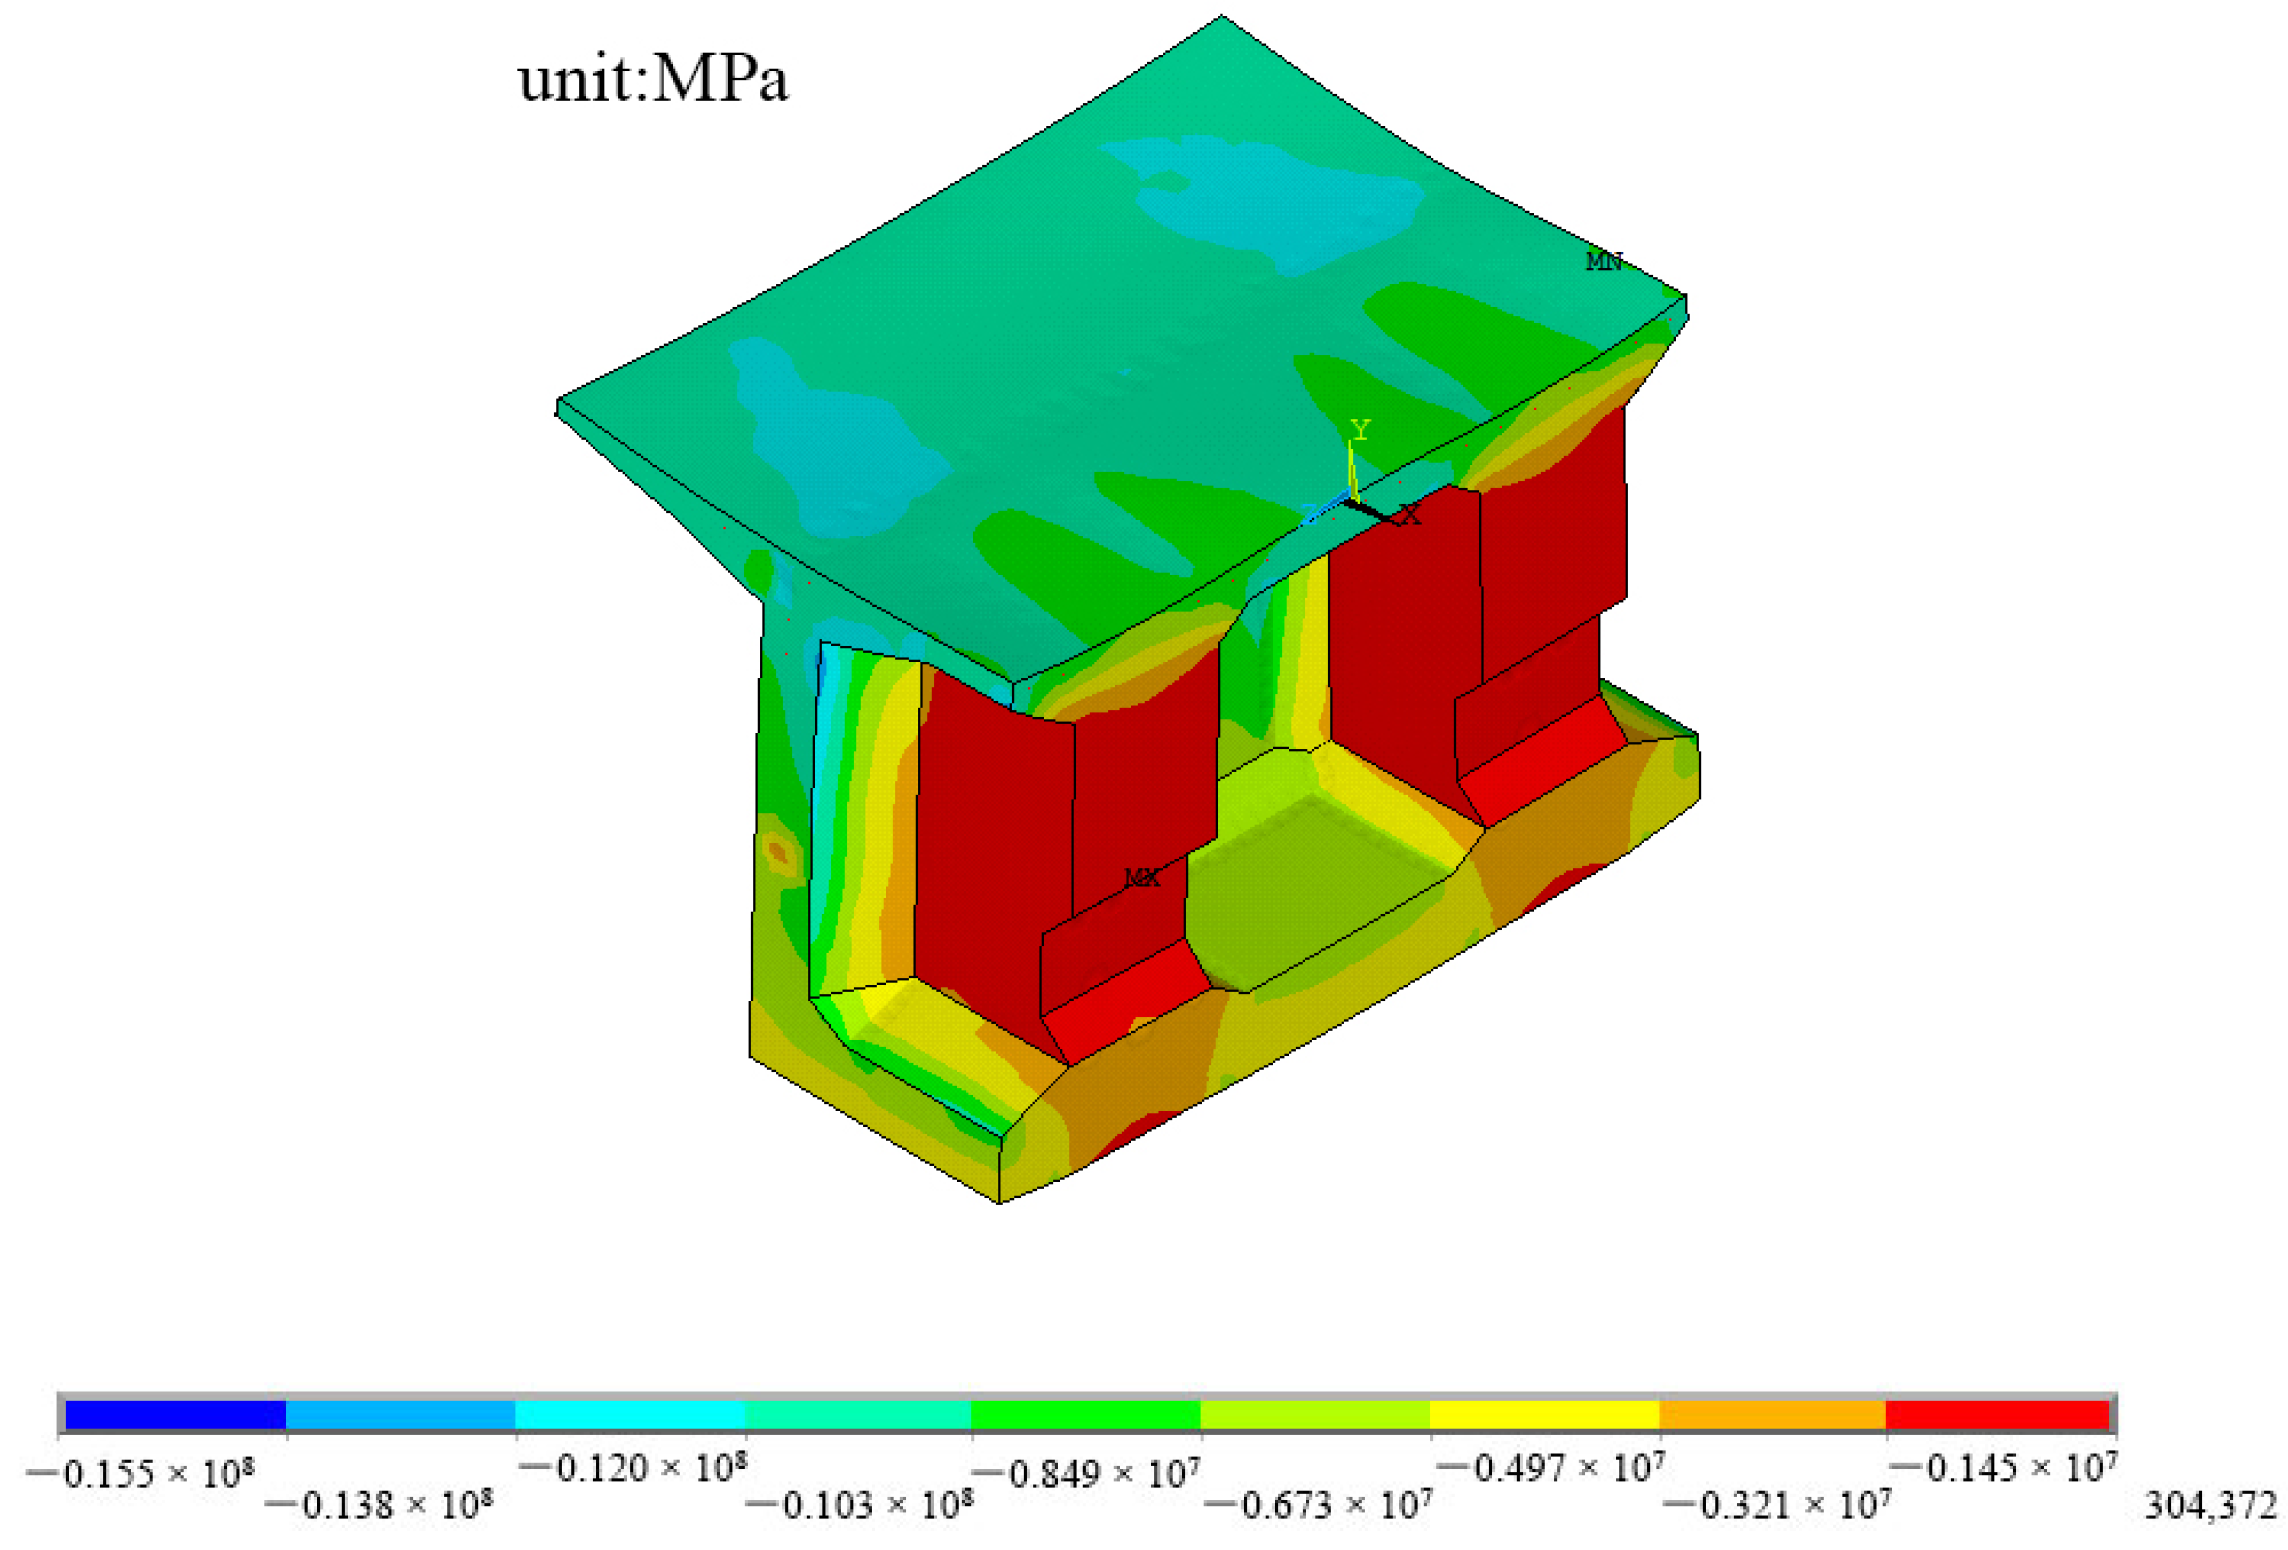
5.1. Stress Analysis of the Maximum Cantilever State

Figure 13 shows the longitudinal stress distribution in 0# block box girder under the maximum cantilever state. From the figure, it is evident that the top, bottom, and web plate locations were predominantly under compression, while tension stresses primarily occurred at the areas of the transverse diaphragms, and these tension stresses were relatively low. Additionally, stress concentrations were observed in the anchorage zones of the prestressing tendons and at the junctions of piers and beams, albeit within small-localized areas. The stress distribution in 0# block ranges from −15.5 MPa to 0.304 Mpa, with the maximum compressive stress of −15.5 Mpa located beneath the top slab at the end of the 0# block. In contrast, the ultimate tensile stress appears at the location of the maintenance hole, only 0.304 MPa.
To analyze the stress of the 0# block box girder, this paper establishes a FE model of the block 1/2 0# block box girder, where it is considered that the stress distribution is consistent on the left and right sides, with the centerline of the bridge as the axis of symmetry. When analyzing the top plate stress, adopt the stress at 0.1 m under the top surface of the top plate of the mid-span section in 0# block as top_z. Meanwhile, the symmetrical position of top_z about the bridge centerline was recorded as top_z’. When analyzing the bottom plate stress, adopt the stress at 0.39 m above the bottom surface of the bottom plate of the mid-span section in 0# block as bot_z. Meanwhile, the symmetrical position of bot_z about the bridge centerline was recorded as bot_z’.
Figure 14 shows the distribution of stresses in the transverse direction in 0# block top_z and top_z’ at the maximum cantilever state. The compressive stress distribution of top_z and top_z’ exhibits multiple peaks. The compressive stress level between the web and the bridge centerline was higher than between the web and the flange plate. The minimum compressive stress was located near the web, while the maximum compressive stress occurred on the two sides of the web. The stress distribution ranges from −10.6 MPa to −8.7 MPa, with a difference of no more than 2 MPa, indicating a relatively even distribution. Between the web plates, the stress shows fluctuations, but the range was not substantial, with an amplitude of about 1 MPa.
Figure 15 shows the stress distribution in the transverse direction of the 0# block bot_z and bot_z’ at the maximum cantilever state. It can be seen that the compressive stress of bot_z and bot_z’ from the web to the bridge centerline was in the overall trend of increasing and then decreasing. The minimum compressive stress occurs at the web position, while the maximum compressive stress occurs at approximately 1.5 m from the bridge centerline. The stress distribution in bot_z and bot_z’ ranges from −4.6 MPa to −5.6 MPa, with an amplitude of about 1 MPa. The stress distribution in the bottom plate was more uniform. These stress distributions provide insights into the behavior of 0# block under the maximum cantilever states, which is crucial for assessing structural integrity and safety during construction.

5.2. Stress Analysis of the Completed Bridge State

Figure 16 shows the longitudinal stress distribution in the 0# block under the completed bridge state. It can be seen that the top plate, bottom plate, and web plate locations were in overall compression, with tensile stresses occurring mainly at the diaphragm. There was a small range of stress concentration at the prestressing tendon anchorage and pier and beam solidification locations. The stress distribution of the 0# block was between −17.2 MPa~0.294 MPa, and the maximum compressive stress was −17.2 MPa, which was located on the lower side of the top plate at the end of the 0# block. In contrast, the maximum tensile stress was 0.294 MPa, which was located in the position of the maintenance hole, from which it can also be seen that the maximum tensile stress was reduced compared with that of the maximum cantilever state.
The stress distribution of the 0# block in the completed bridge state was analyzed in the same manner as the maximum cantilever state analysis, with the same stress locations recorded. Figure 17 shows the stress distribution in the transverse direction in 0# block top_z and top_z’ in the completed bridge state. The compressive stress distribution of top_z and top_z’ exhibits multiple peaks. The compressive stress level between the web and the centerline of the bridge was higher than that between the web and the flange plate. The minimum compressive stress was located near the web, while the maximum compressive stress occurred on both sides of the top plate. The stress distribution ranges from −12 MPa to −9.5 MPa, with a difference of no more than 2.5 MPa, indicating a relatively even distribution. Fluctuations in stress between the web plates were insignificant, with an amplitude of about 1 MPa. The stress distribution at this location in the bridge construction condition was similar to that of the maximum cantilever state. However, the compressive stress was generally higher than in the maximum cantilever state.
Figure 18 shows the stress distribution in the transverse direction of bot_z and bot_z’ in 0# block under the completed bridge state. It can be seen that the bottom plate stress from the web to the bridge centerline range of compressive stress overall in the trend of increasing and then decreasing. The minimum compressive stress was observed at the web’s location, while the maximum compressive stress was found approximately 1.5 m away from the bridge’s centerline. The stress distribution at both the bot_z and bot_z’ positions ranged from −2.75 MPa to −3.75 MPa, showing a variability of about 1 MPa. The distribution of stress across the bottom plate was relatively uniform. The stress distribution at this location was similar to that of the maximum cantilever state, but the compressive stress was smaller than that of the latter. These stress distributions provide insights into the behavior of 0# block under the completed bridge state, which is essential for assessing structural integrity and safety during construction.

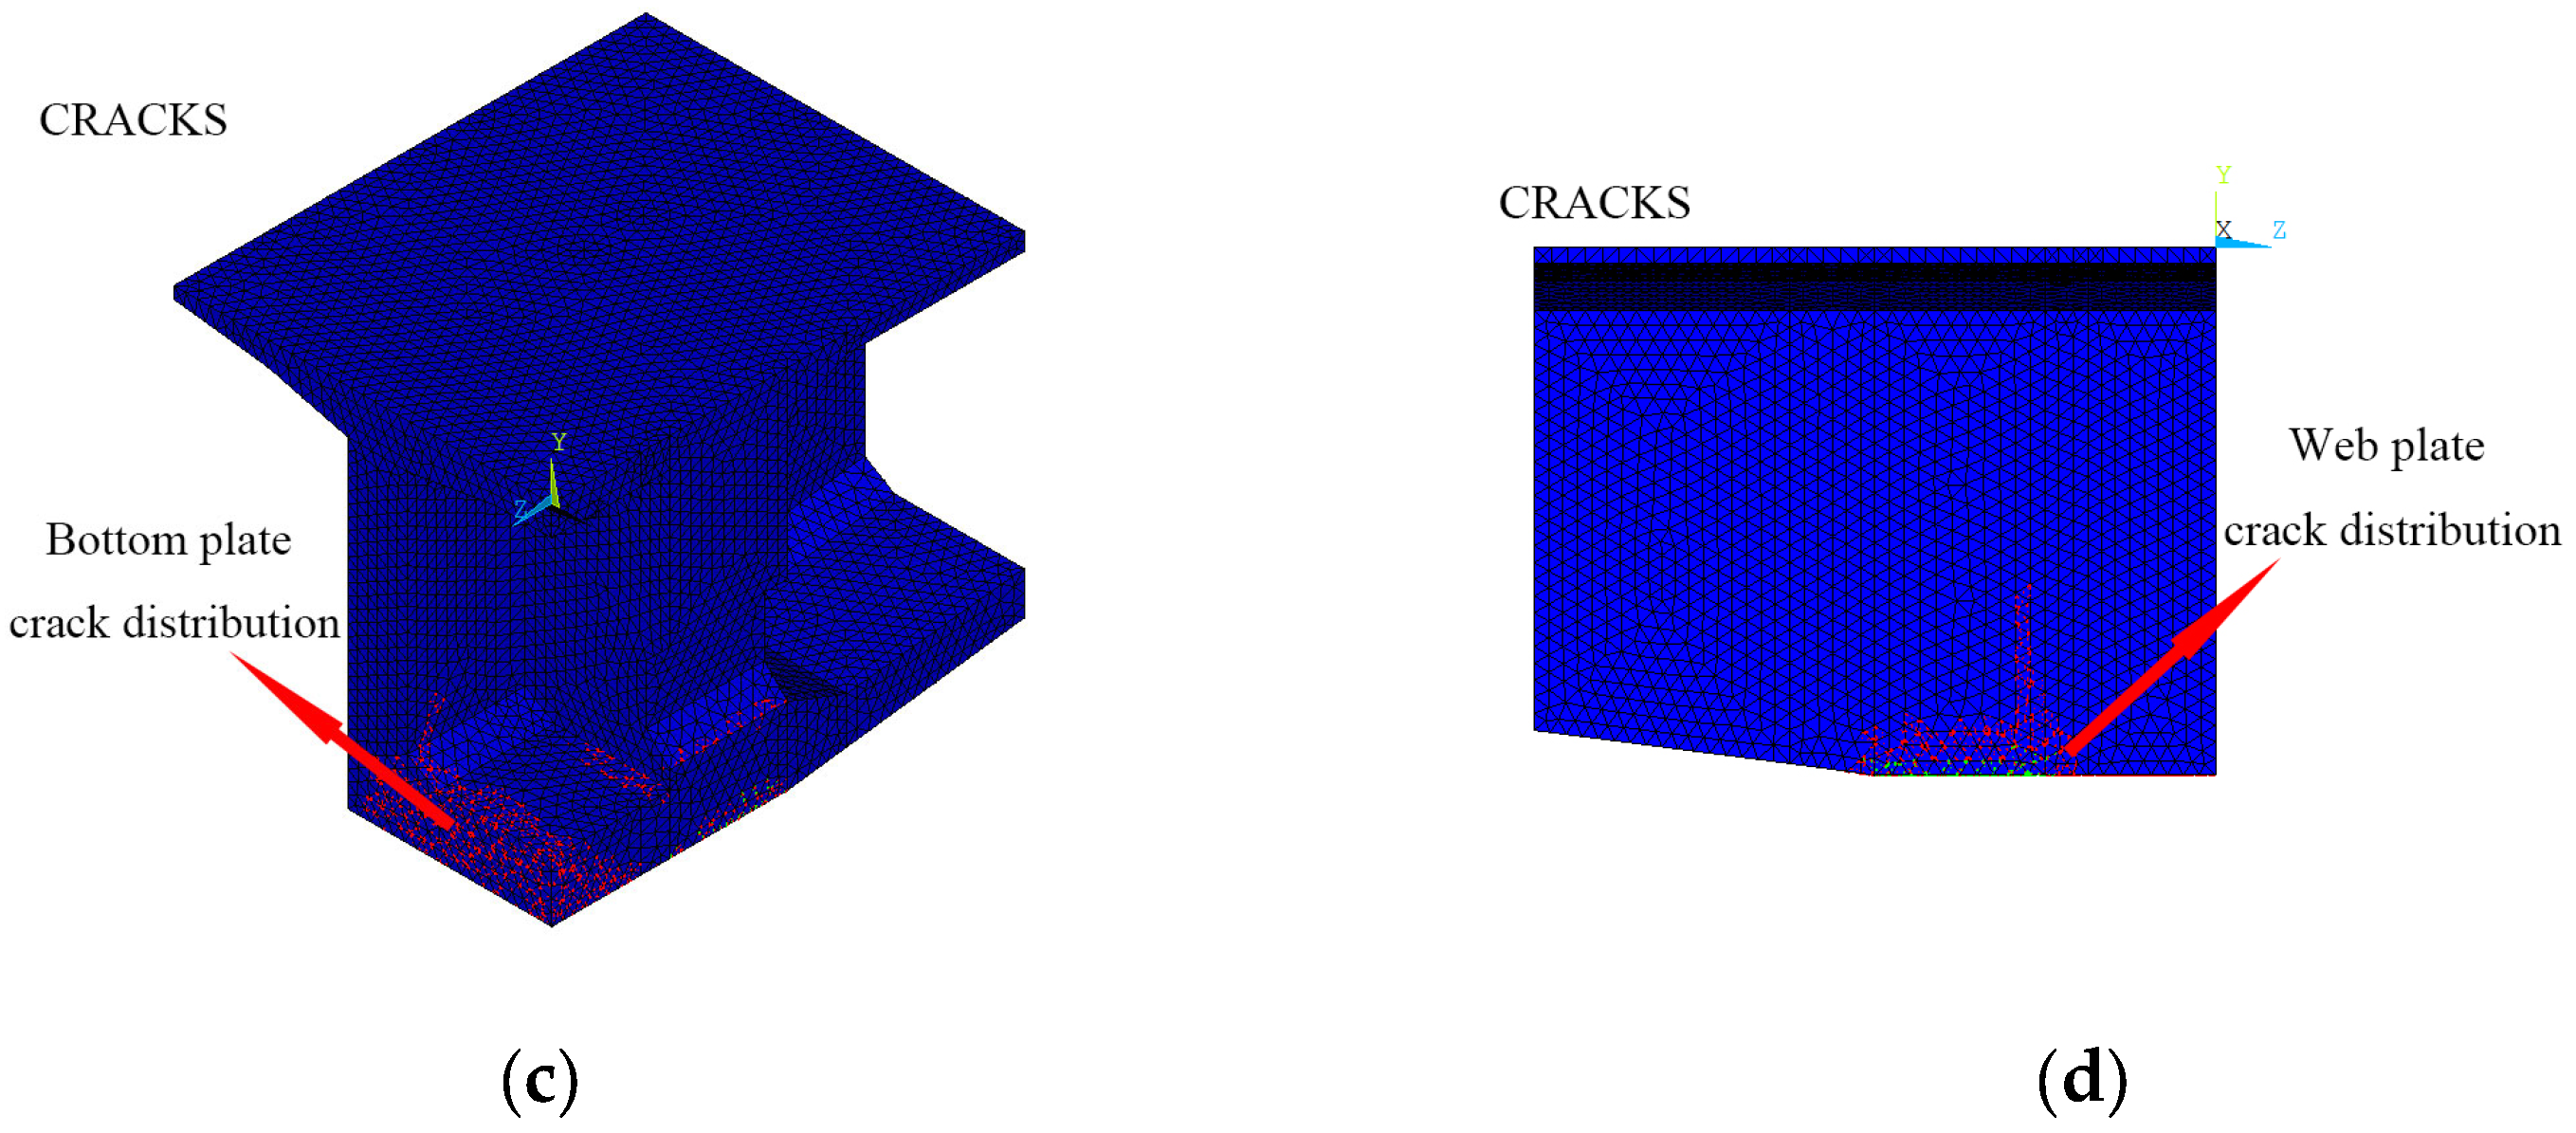
5.3. Analysis of Shrinkage Cracks in the 0# Block Box Girder

The 0# block box girder represents the largest component by volume in the upper structure of a continuous rigid frame bridge and is also the location where crack development is most severe. Therefore, this paper conducts a comparative analysis to further investigate the impact of incorporating polyester fibers on the shrinkage cracks in the 0# block box girder. Figure 19 presents the distribution of shrinkage cracks in polyester fiber concrete and conventional concrete 0# block box girders. From the figure, it is evident that the shrinkage cracks in the 0# block box girder are primarily concentrated in the bottom plate and web plate areas. Moreover, a comparison of the extent of crack distribution in both scenarios reveals a significant reduction in the number of cracked concrete elements when polyester fibers are introduced. This indicates that the inclusion of polyester fibers can effectively prevent the initiation and propagation of shrinkage cracks, underscoring the improved crack resistance of the 0# block box girder when polyester fiber concrete is utilized in continuous rigid frame bridges.

6. Conclusions

This paper investigates the mechanical behavior of polyester fiber concrete in continuous rigid frame bridges during construction and the spatial stress distribution, including early shrinkage crack patterns in the 0# block box girder, by employing FE analysis and on-site monitoring data. The following relevant conclusions were obtained:
  • In the initial stages of cantilever pouring construction, the bottom plate stresses in the main beam segments exhibit slight variations in various working conditions. The compressive stresses on the bottom plate are relatively low, nearing critical values for compression and tension. This underscores the importance of addressing tensile stress control during construction to meet prestressed concrete member design specifications.
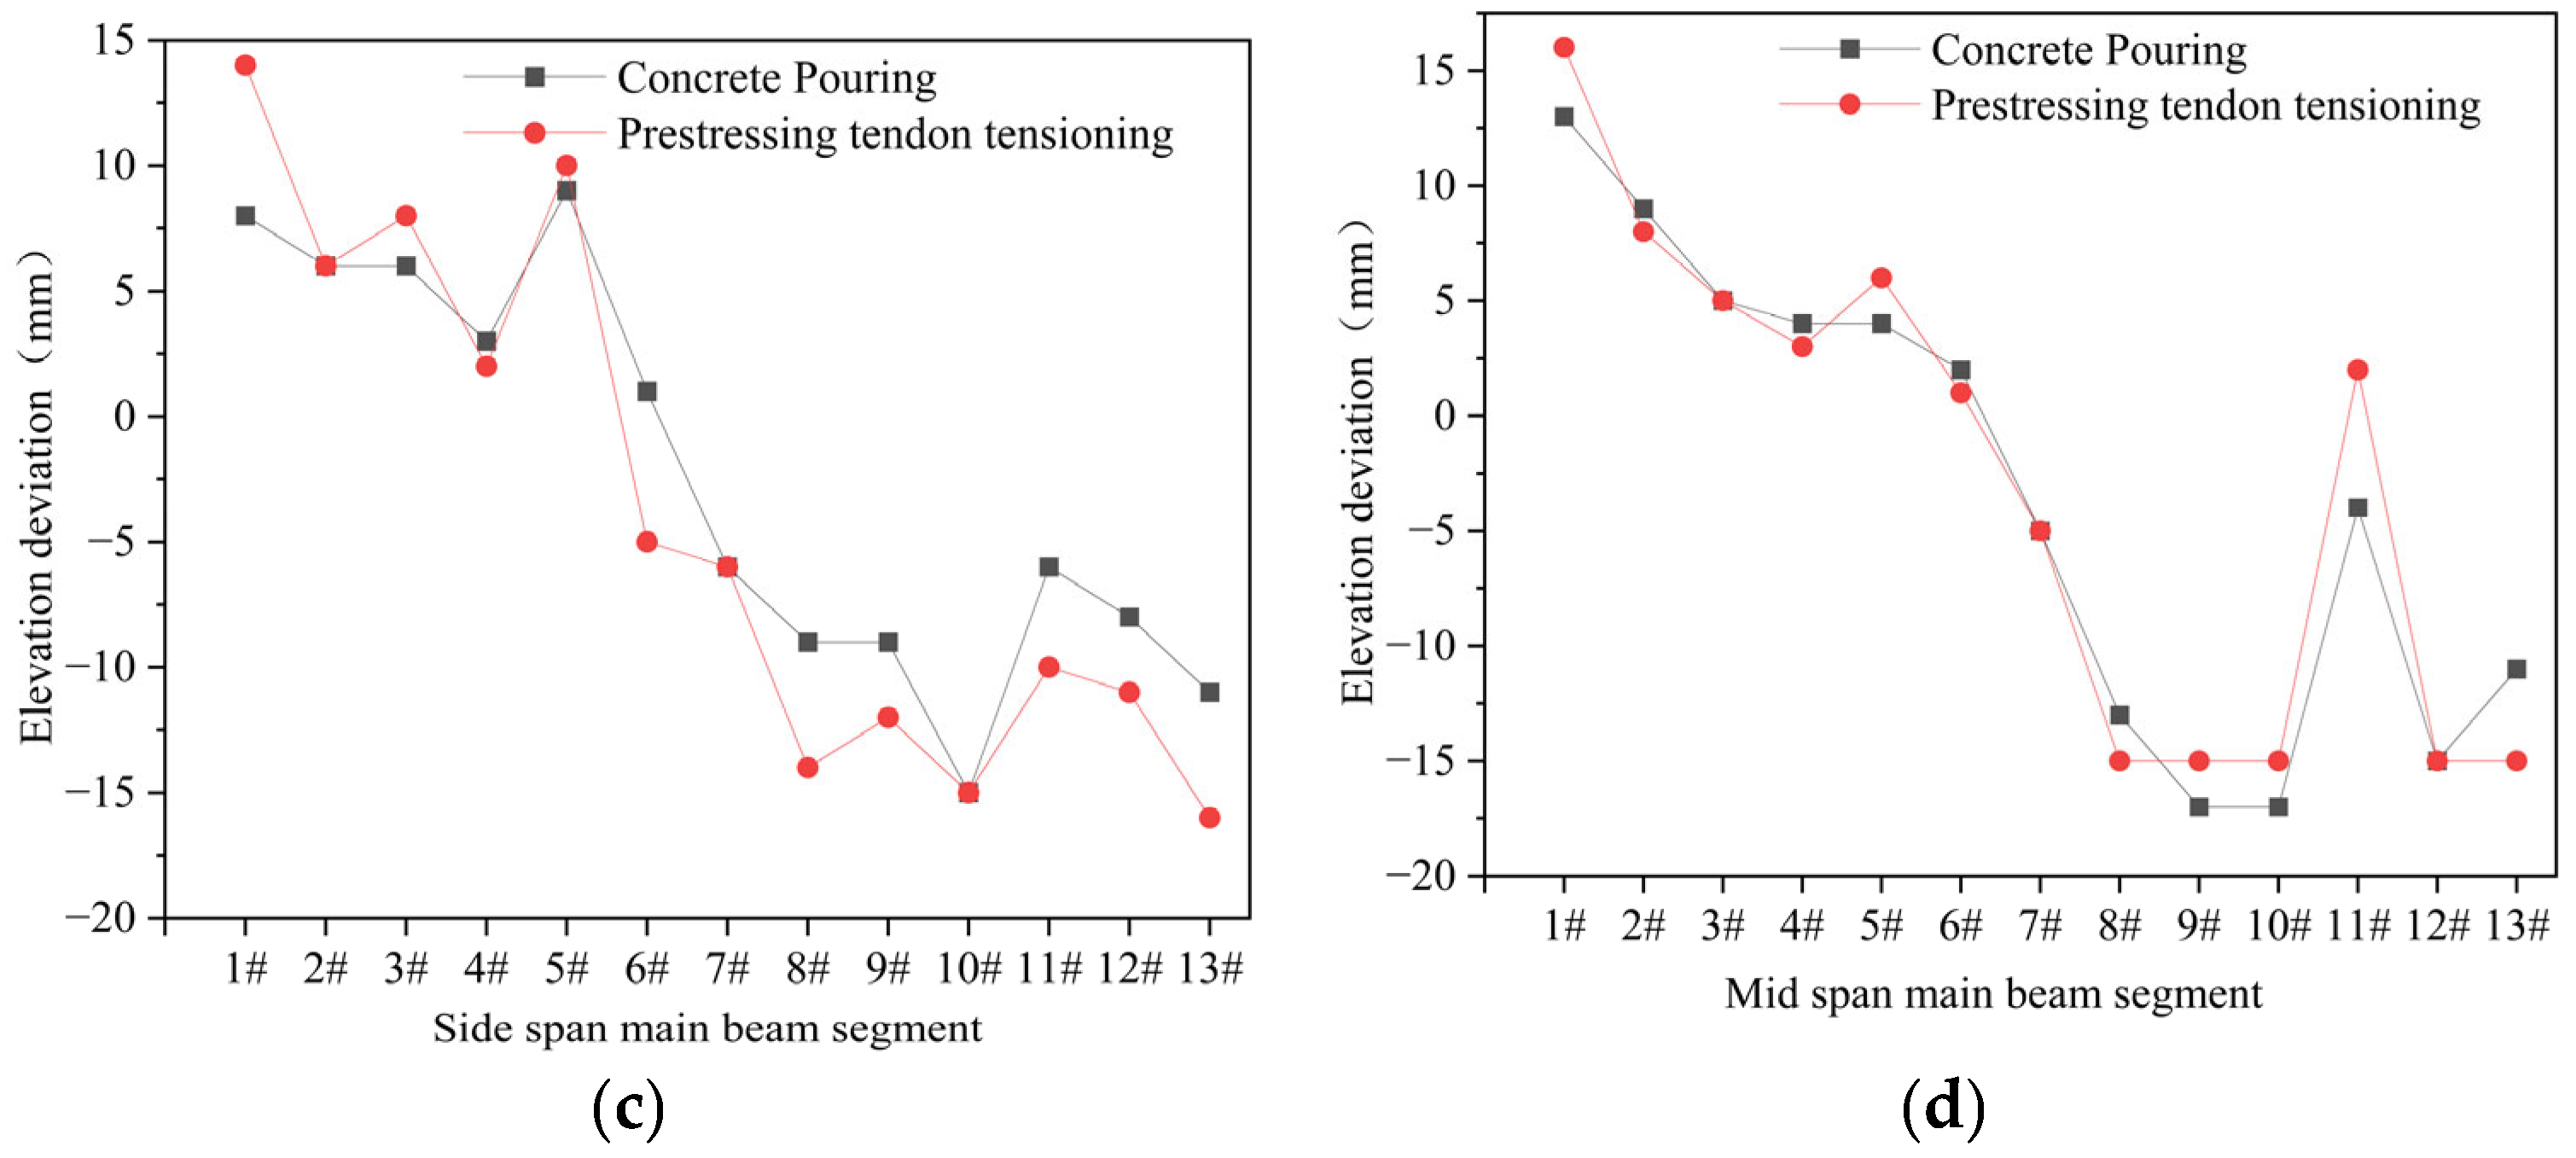
  • As the continuous rigid frame bridge’s cantilever pouring construction progresses to mid-span L/4, a notable change in main beam stress distribution becomes evident. Simultaneously, elevation deviations in the main beam show instability, particularly after constructing the L/4 beam segment. It is essential to evaluate prestress losses and relaxation and make necessary adjustments.
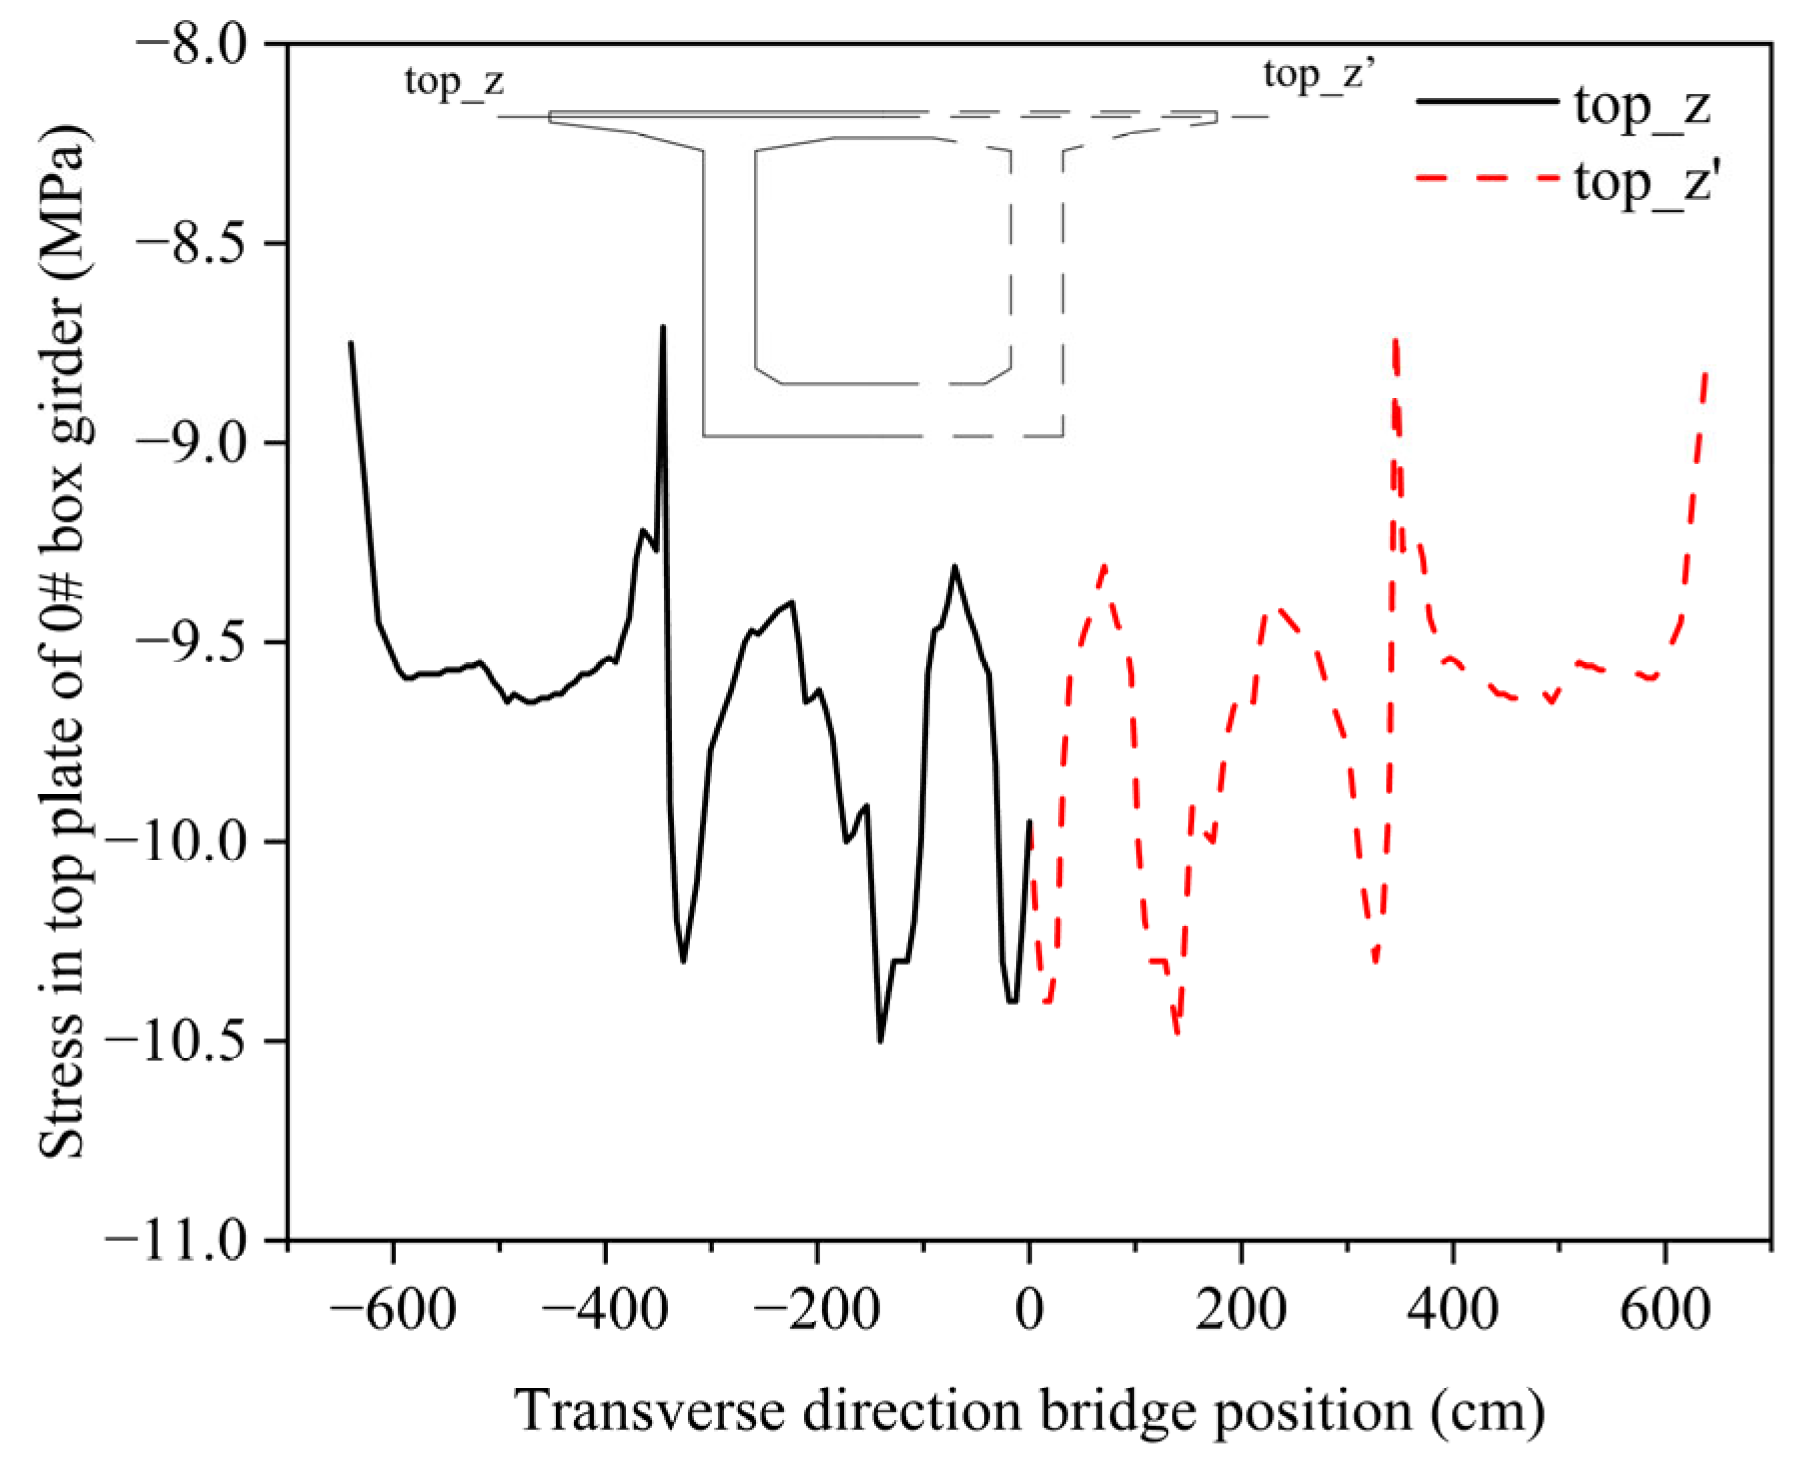
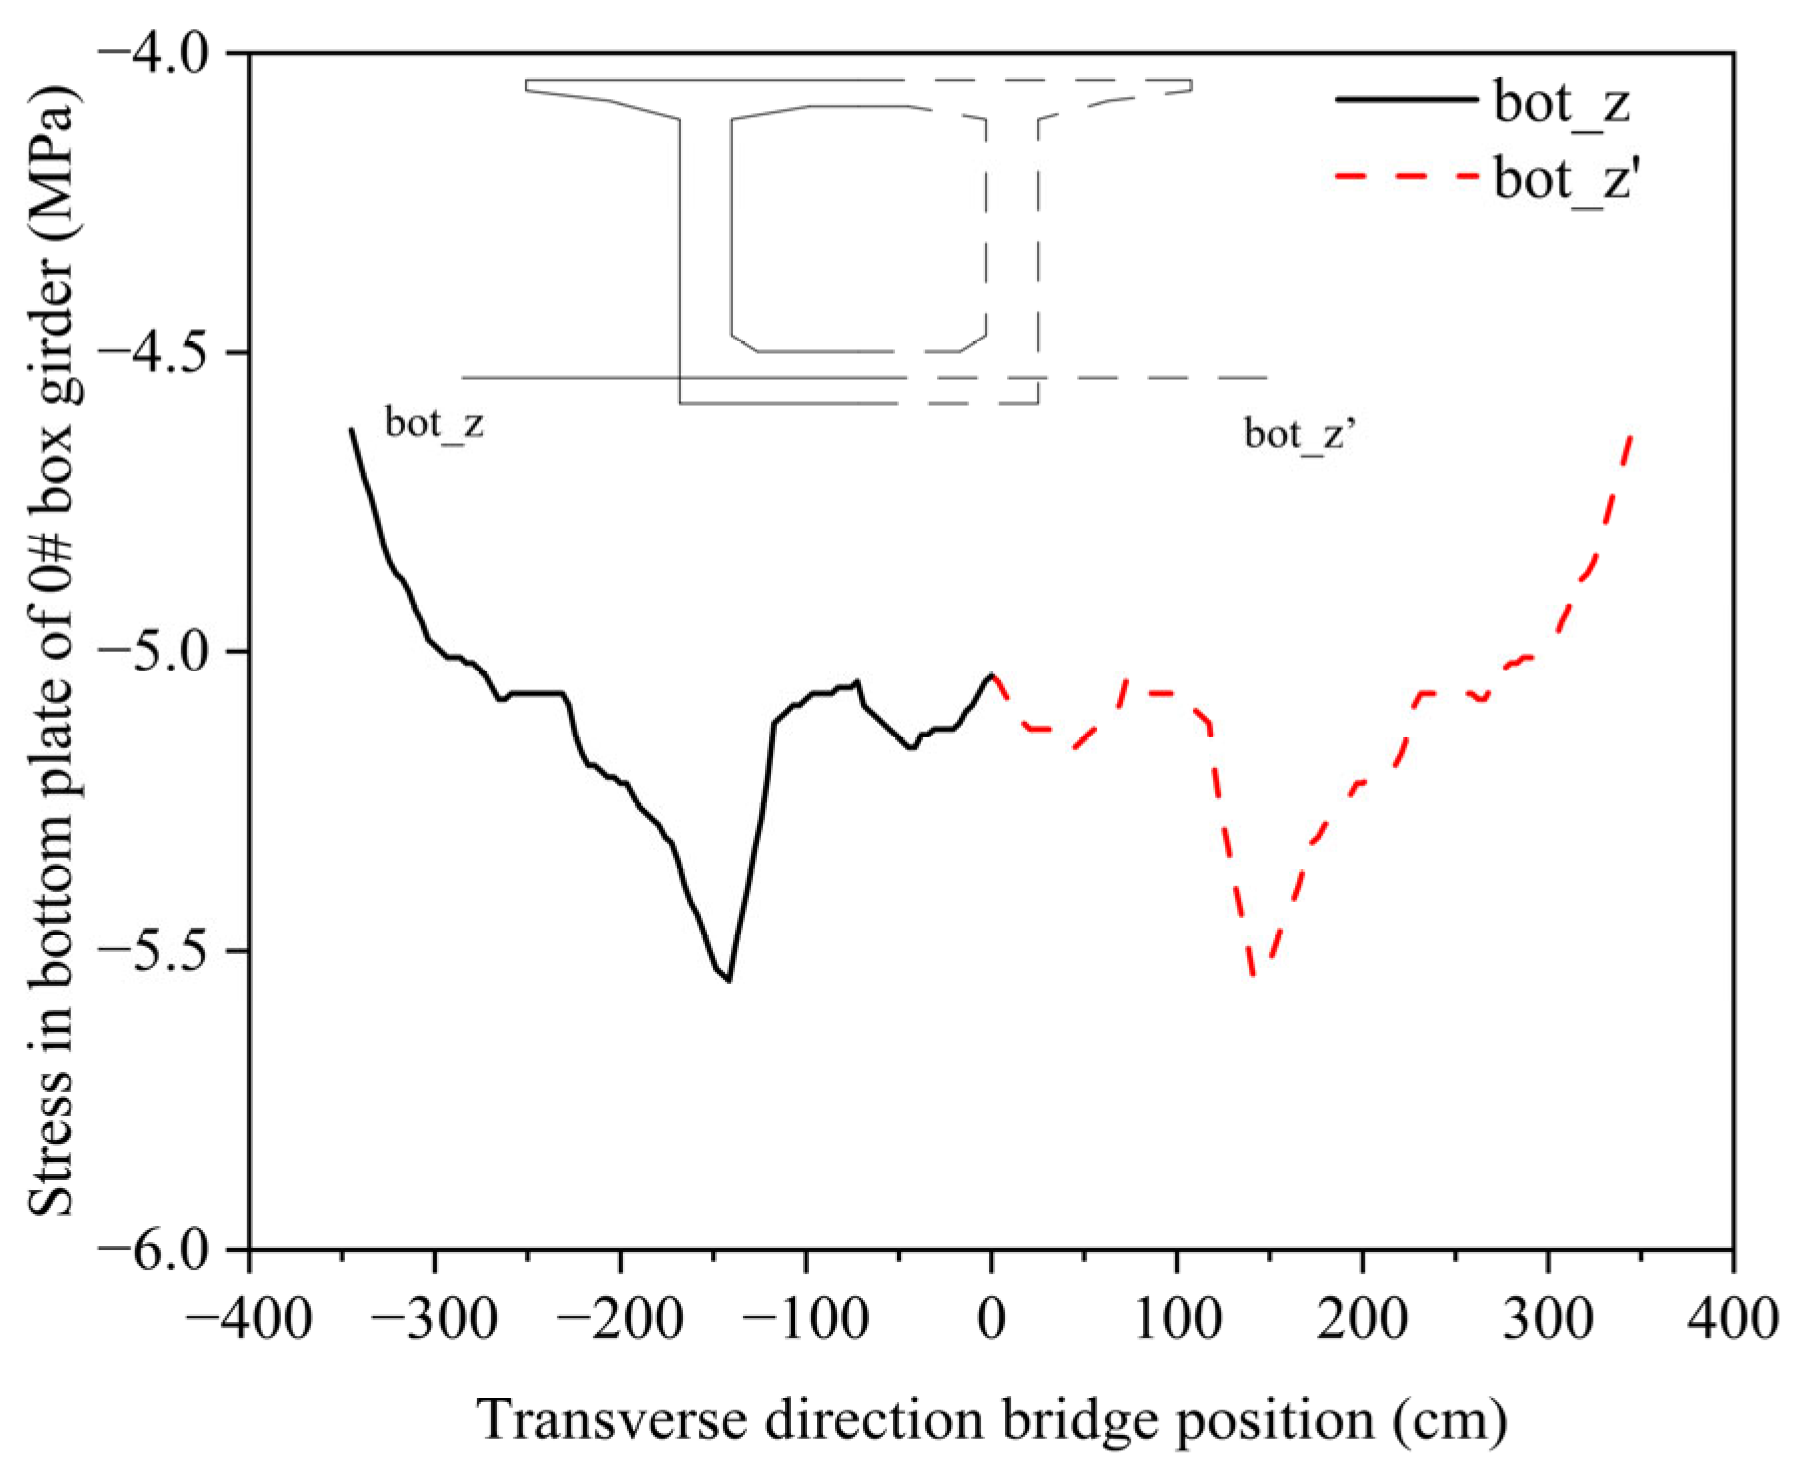
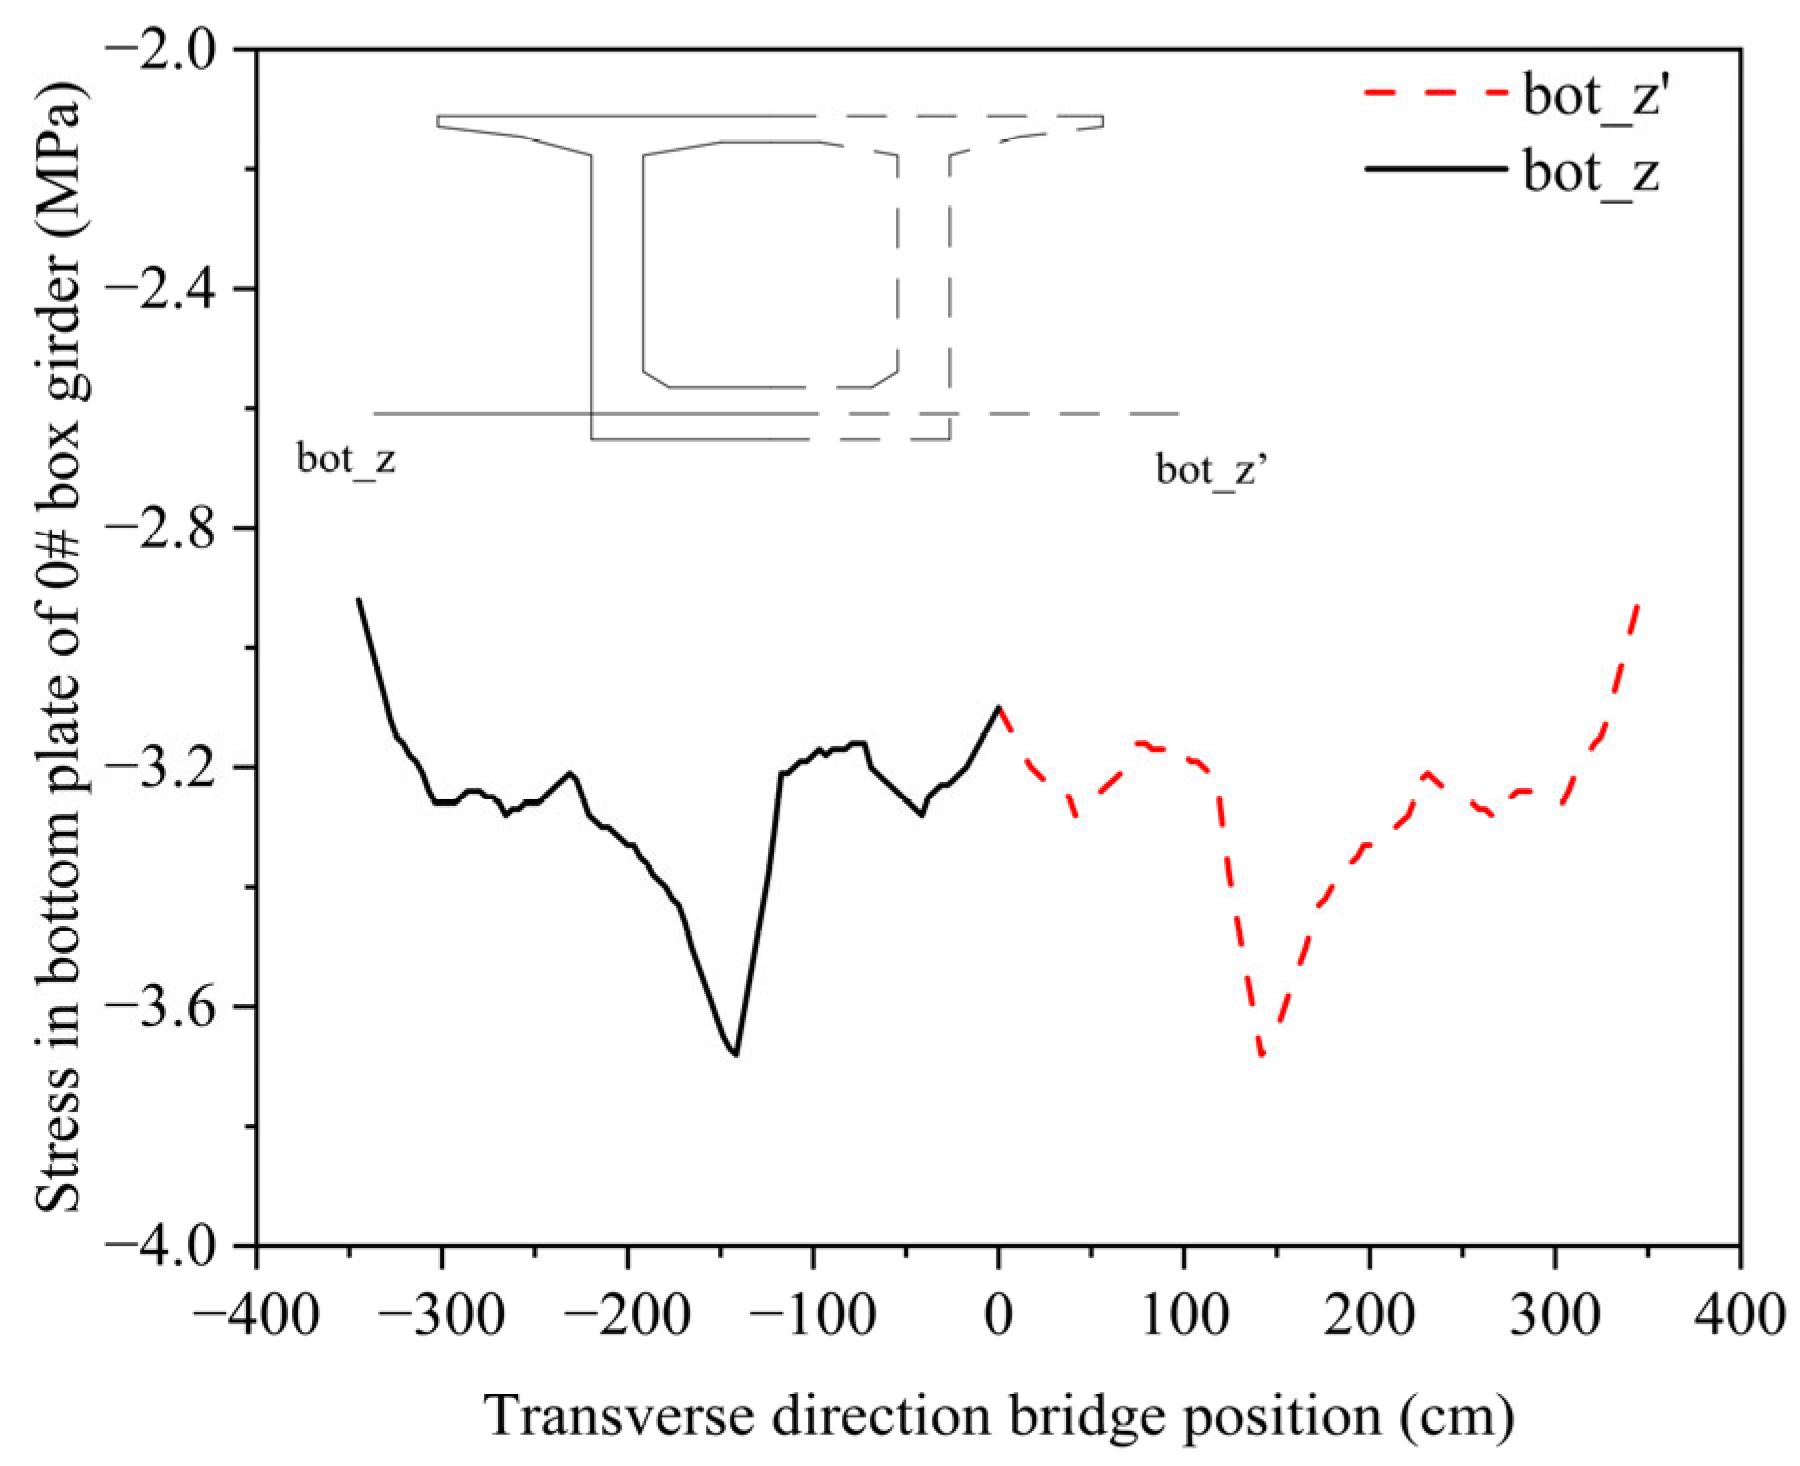
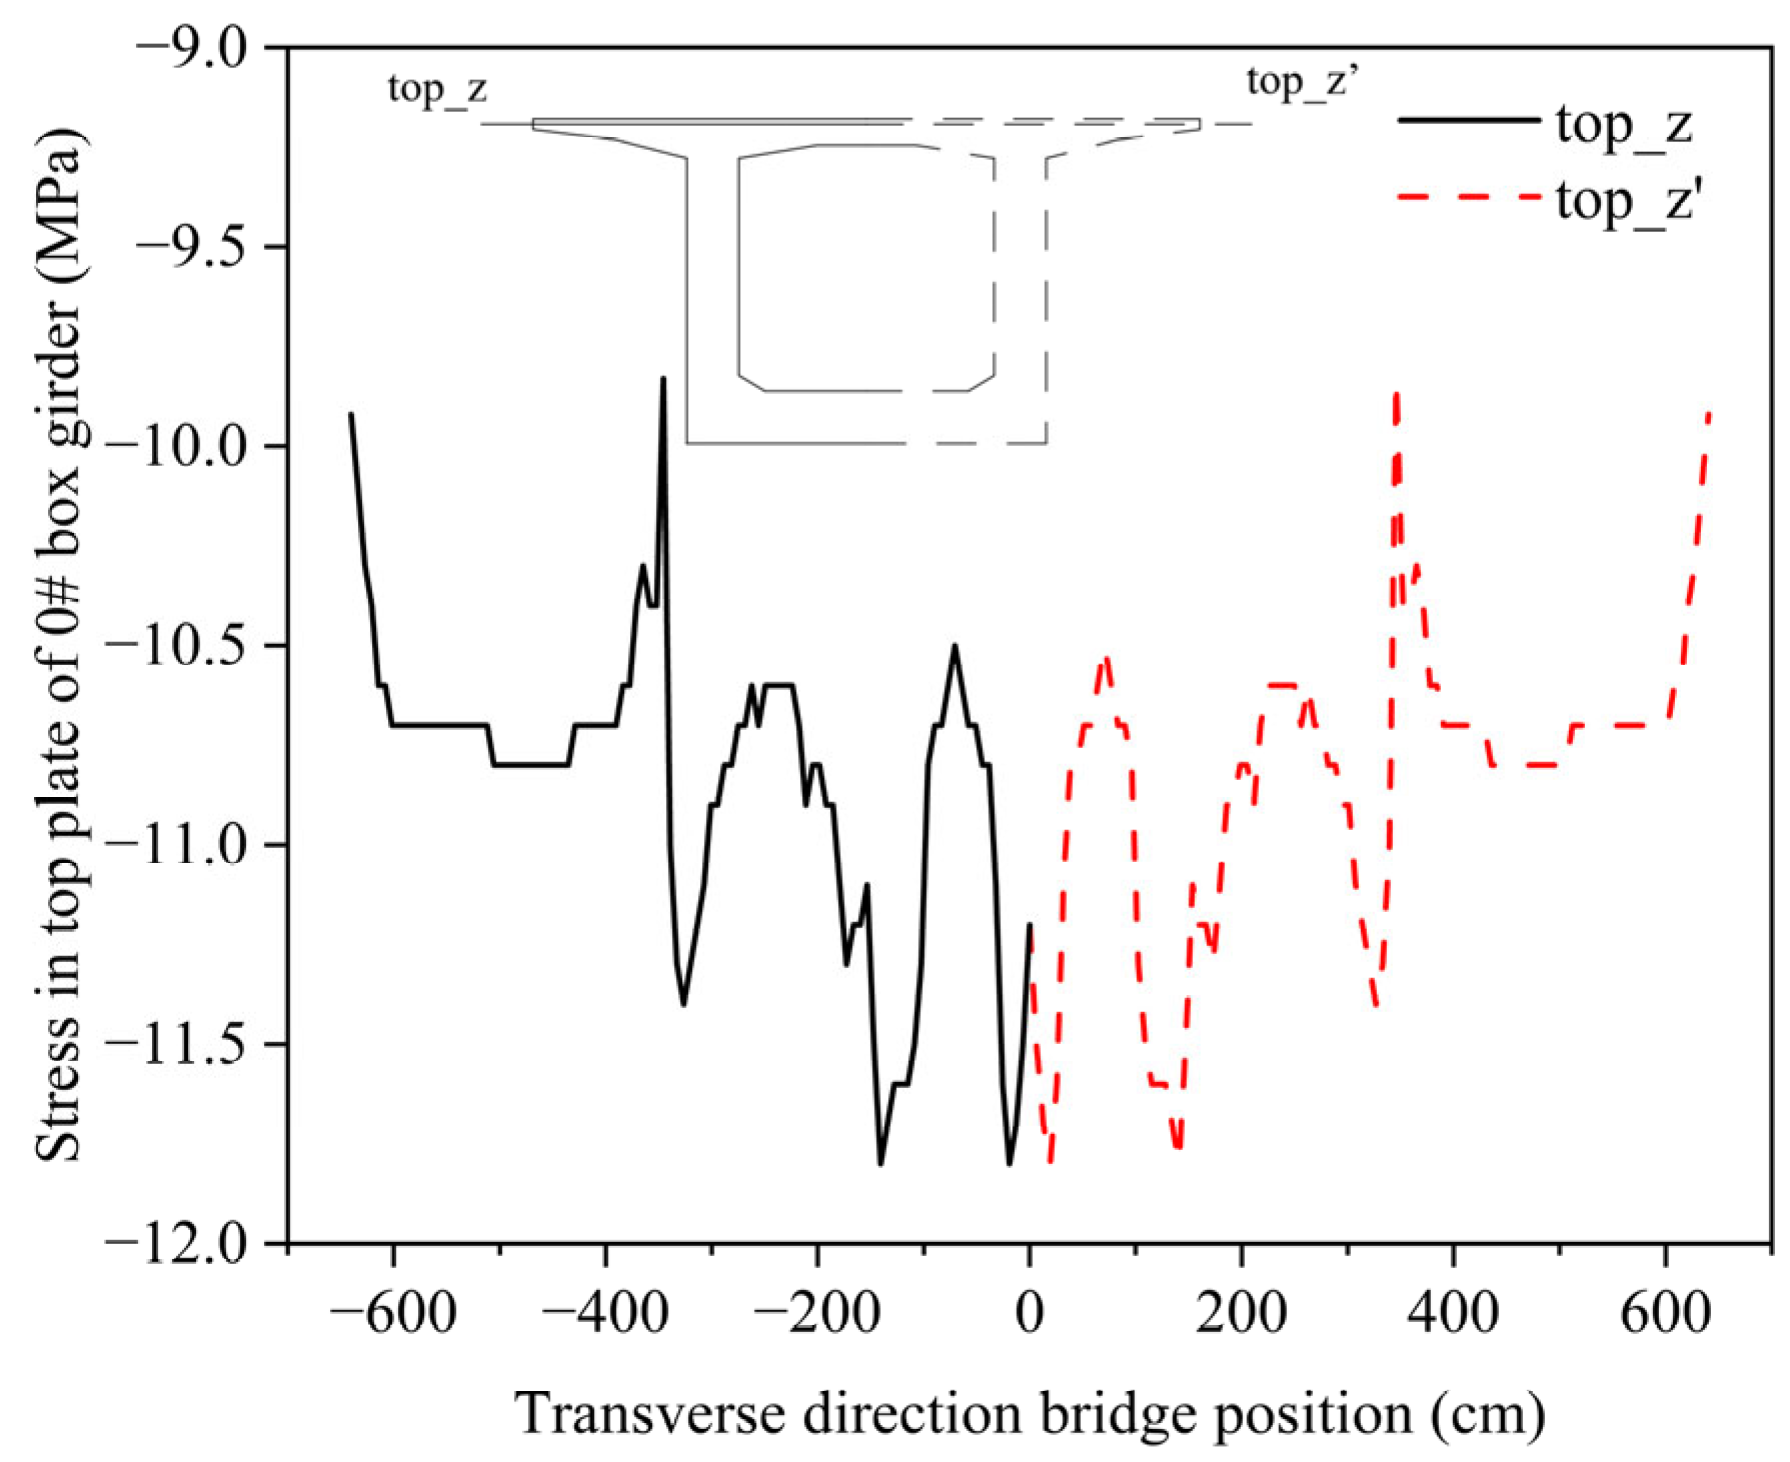
  • The study indicates that when polyester fiber concrete is applied to the 0# block box girders, the top and bottom plates exhibit consistent stress variation patterns along the transverse bridge direction under maximum cantilever and completed bridge states. Additionally, the stress distribution is uniform in both conditions. Stress variation in the top plate remains below 2.5 MPa, and in the bottom plate, it is approximately 1 MPa, effectively meeting spatial force requirements.
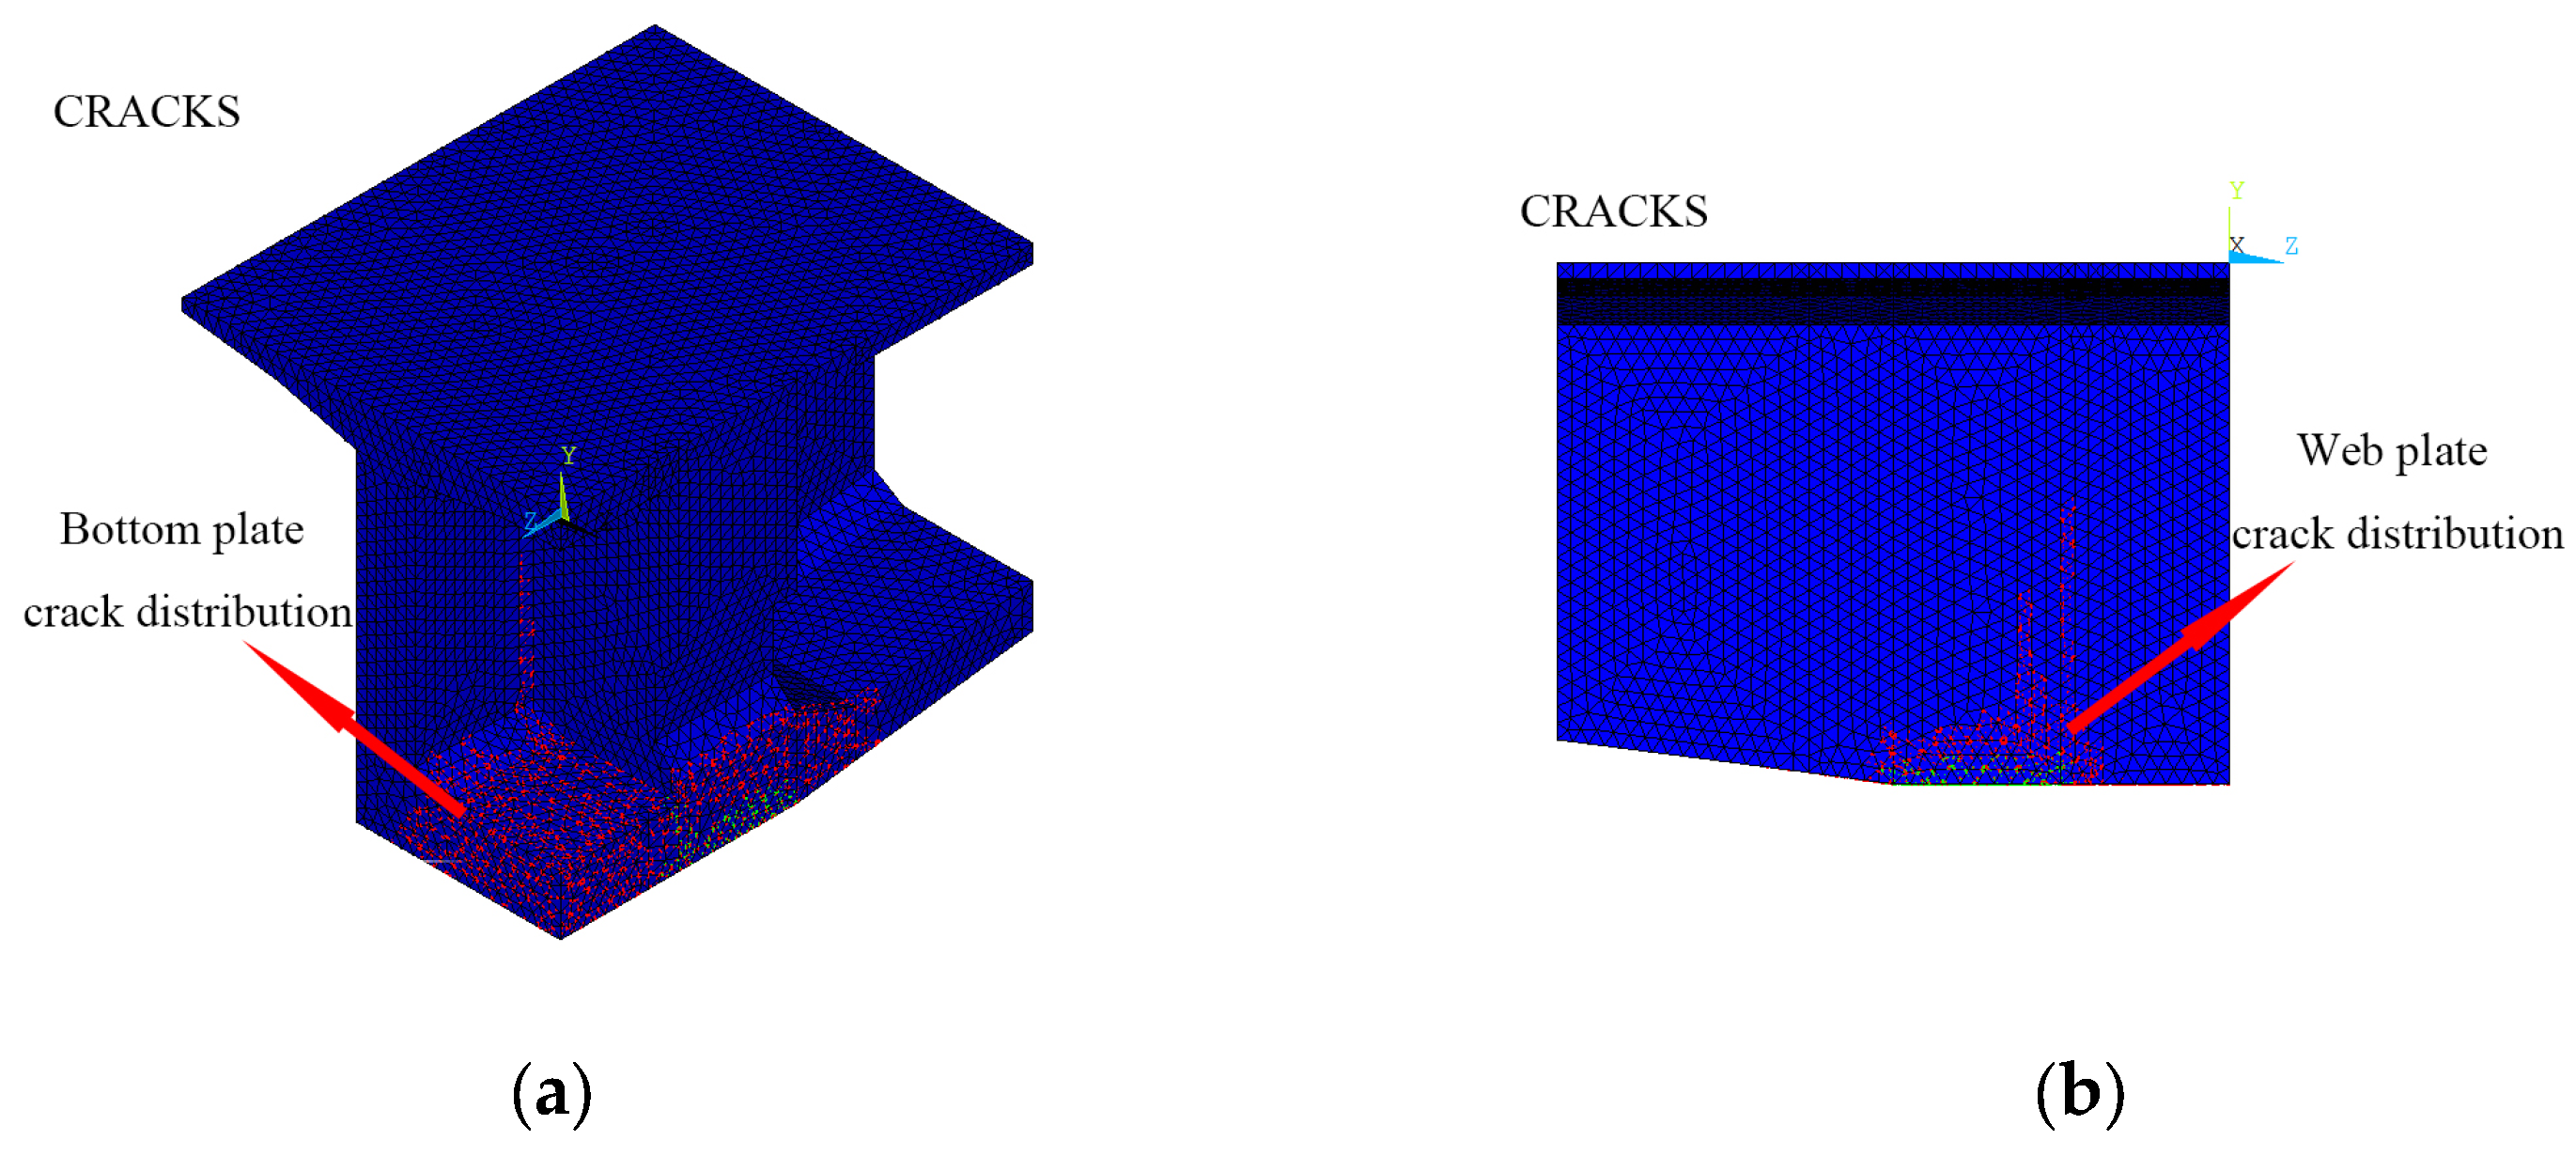
  • The analysis of shrinkage cracks in the 0# block box girders constructed with polyester fiber concrete indicates that these cracks primarily occur in the bottom and web plate areas. Moreover, the inclusion of polyester fibers significantly reduces the occurrence of cracked concrete elements in comparison to conventional concrete. This underscores the effective crack inhibition and enhanced resistance to shrinkage cracks when employing polyester fiber concrete in 0# block box girders.

Author Contributions

Conceptualization, S.M. and L.J.; methodology, S.M. and L.J.; validation, S.M. and L.J.; formal analysis, X.Z. and L.J.; investigation, X.Z. and Y.Y.; data curation, Y.Y. and X.Z.; writing—original draft preparation, S.M.; writing—review and editing, X.Z., Y.Y. and L.J.; visualization, Y.Y.; project administration, L.J. and S.M.; funding acquisition, L.J. All authors have read and agreed to the published version of the manuscript.

Funding

This work was supported by the Department of Transportation of Jiangxi Province (2022H0016).

Data Availability Statement

Some or all data, models, or codes that support the findings of this study are available from the corresponding author upon reasonable request (load-strain data and FE data). The data are not publicly available due to privacy.

Acknowledgments

The authors are greatly indebted to the anonymous reviewers for their valuable comments and suggestions which helped in improving the overall quality of this manuscript greatly.

Conflicts of Interest

Author Shouju Miao was employed by the company Jiangxi Provincial Communications Investment Group Co., Ltd., Project Construction Management Company. The remaining authors declare that the research was conducted in the absence of any commercial or financial relationships that could be construed as a potential conflict of interest.

References

  1. Song, X.; Melhem, H.; Cheng, L.; Xu, Q. Optimization of closure jacking forces in multispan concrete rigid-frame bridges. J. Bridge Eng. 2017, 22, 04016122. [Google Scholar] [CrossRef]
  2. Chen, C.; Wang, X.; Lin, Q.; Wang, Y. A Closure Jacking Force Calculation Algorithm for Curved Prestressed Concrete Continuous Rigid-Frame Bridges with Asymmetric Cantilevers and Piers. Math. Probl. Eng. 2022, 2022, 7408232. [Google Scholar] [CrossRef]
  3. Weng, F.W.; Liu, F.X. Mechanical Analysis of Junction Pier of Fuzhou-Xiamen High-Speed Railway Rigid-Frame Bridge. Adv. Civ. Eng. 2023, 2023, 7563415. [Google Scholar] [CrossRef]
  4. Zhang, F.; Huang, F.; Wang, Y. Analysis on Spatial Stress and Optimal Design of Block No. 0 of Continuous Rigid Frame Bridge with V—Shaped Piers. J. Highw. Transp. Res. Dev. 2019, 36, 59–67. [Google Scholar]
  5. Li, S.W.; Yang, Y.Q.; Pu, Q.H.; Yang, D.; Sun, B.L.; Li, X.B. Three-dimensional nonlinear creep and shrinkage effects of a long-span prestressed concrete box girder bridge. Struct. Concr. 2019, 20, 638–649. [Google Scholar] [CrossRef]
  6. Niu, Y.W.; Tang, Y.Y. Effect of Shear Creep on Long-Term Deformation Analysis of Long-Span Concrete Girder Bridge. Adv. Mater. Sci. Eng. 2019, 2019, 4382904. [Google Scholar] [CrossRef]
  7. Jin, Y.X.; Sun, C.L.; Liu, H.F.; Xu, D. Analysis on the causes of cracking and excessive deflection of long span box girder bridges based on space frame lattice models. Structures 2023, 50, 464–481. [Google Scholar] [CrossRef]
  8. Wang, D.; Wang, L.; Liu, Y.M.; Tan, B.K.; Liu, Y. Failure mechanism investigation of bottom plate in concrete box girder bridges. Eng. Fail. Anal. 2020, 116, 104711. [Google Scholar] [CrossRef]
  9. Huang, J.W. Analysis on dynamic characteristics and wind-induced buffeting response of Hezhang Large-span Bridge. In Proceedings of the 2019 3rd International Workshop on Renewable Energy and Development (IWRED 2019), Guangzhou, China, 8–10 March 2019. [Google Scholar]
  10. Zeng, Y.; He, X.; Li, Y.Q.; Zhou, J.T. Assessment of Modal Characteristics of Steel-Concrete Composite Girder Bridge with V-Shaped Piers. Appl. Sci. 2023, 13, 3421. [Google Scholar] [CrossRef]
  11. Shen, J.Y.; Li, R.; Shi, J.; Zhou, G.C. Modified Multi-Support Response Spectrum Analysis of Structures with Multiple Supports under Incoherent Ground Excitation. Appl. Sci. 2019, 9, 1744. [Google Scholar] [CrossRef]
  12. Liang, Y.; Yan, J.L.; Cheng, Z.Q.; Chen, P.; Ren, C. Time-Varying Seismic Fragility Analysis of Offshore Bridges with Continuous Rigid-Frame Girder under Main Aftershock Sequences. J. Bridge Eng. 2020, 25, 04020055. [Google Scholar] [CrossRef]
  13. Zhao, J.G.; Jia, H.Y.; Zhan, Y.L. Seismic Vulnerability Analysis of Multi-main-span High Pier Continuous Rigid-frame Bridge in Terms of Cloud Method. Ksce J. Civ. Eng. 2023, 27, 2519–2534. [Google Scholar] [CrossRef]
  14. Liang, Y.; Yan, J.L.; Qian, W.X.; Cheng, Z.Q.; Chen, H. Analysis of collapse resistance of offshore rigid frame—Continuous girder bridge based on time-varying fragility. Mar. Struct. 2021, 75, 102844. [Google Scholar] [CrossRef]
  15. Zou, L.L.; Cheng, J.F. Study on Influence of Suspension Interval Length on Construction and Closure of Main Girder of Continuous Rigid Frame Bridge. In Proceedings of the 2019 5th International Conference on Energy Materials and Environment Engineering, Kuala Lumpur, Malaysia, 12–14 April 2019. [Google Scholar]
  16. Guinchard, M.; Angeletti, M.; Boyer, F.; Catinaccio, A.; Gargiulo, C.; Lacny, L.; Laudi, E.; Scislo, L. Experimental modal analysis of lightweight structures used in particle detectors: Optical non-contact method. In Proceedings of the 9th International Particle Accelerator Conference, IPAC18, Vancouver, BC, Canada, 29 April–4 May 2018; pp. 2565–2567. [Google Scholar]
  17. Zhou, X.; Zhang, W.; Gao, Y.; Zhang, G.; Wen, M. An Experimental Study of the Feasibility of Identifying the Impact Damages of Reinforced Concrete Piers Using a Modal Frequency Method. Adv. Civ. Eng. 2020, 2020, 6365354. [Google Scholar] [CrossRef]
  18. Yang, K.; Wang, T.; Zheng, Z. Analysis on Spatial Force of Zero block of long span Hybrid Girder Continuous Rigid Frame bridge. Transp. Sci. Technol. 2021, 1, 48–52. [Google Scholar]
  19. Zhao, X. Monitoring Analysis on the Construction of Long-span Prestressed Concrete Continuous Rigid Frame Bridge. North. Commun. 2022, 2022, 9–13. [Google Scholar] [CrossRef]
  20. Zheng, Y.; Sun, S.; Lei, G. Study on the Construction Control Parameters of the Long Span Continuous Rigid Frame Bridge. J. Gansu Sci. 2019, 31, 68–73+98. [Google Scholar] [CrossRef]
  21. Jiang, D.; Zeng, Y.; Zeng, Y.; Li, Y.; Liu, S. Influence of curing process parameters on the early concrete temperature field of the No.0 section in continuous rigid frame bridge. J. Beijing Jiaotong Univ. 2021, 45, 8–18. [Google Scholar]
  22. Lee, C.; Lee, S.; Nguyen, N. Modeling of Compressive Strength Development of High-Early-Strength-Concrete at Different Curing Temperatures. Int. J. Concr. Struct. Mater. 2016, 10, 205–219. [Google Scholar] [CrossRef]
  23. Yu, W.T. Analysis and Control of Non-Loaded Cracks on the Top of Pier for Pc Continuous Rigid Frame Bridge. Master’s Thesis, Wuhan University of Technology, Wuhan, China, 2010. [Google Scholar]
  24. Yan, L.B.; Chouw, N. A comparative study of steel reinforced concrete and flax fibre reinforced polymer tube confined coconut fibre reinforced concrete beams. J. Reinf. Plast. Compos. 2013, 32, 1155–1164. [Google Scholar] [CrossRef]
  25. Yan, L.B.; Chouw, N. Behavior and analytical modeling of natural flax fibre-reinforced polymer tube confined plain concrete and coir fibre-reinforced concrete. J. Compos. Mater. 2013, 47, 2133–2148. [Google Scholar] [CrossRef]
  26. Wang, T.; Zhang, J.H.; Bai, W.F.; Hao, S.M. Forming process and mechanical properties of fibers-reinforced polymer concrete. J. Reinf. Plast. Compos. 2013, 32, 907–911. [Google Scholar] [CrossRef]
  27. Ruiz, R.; Todisco, L.; Corres, H. Application of high-performance fibre reinforced concrete to precast girders for road bridges: Conceptual considerations and numerical analyses. Struct. Concr. 2023, 24, 4645–4659. [Google Scholar] [CrossRef]
  28. Feng, Y.H.; Kowalsky, M.J.; Nau, J.M. Fiber-Based Modeling of Circular Reinforced Concrete Bridge Columns. J. Earthq. Eng. 2014, 18, 714–734. [Google Scholar] [CrossRef]
  29. Lu, R.; He, X.M. The application of carbon fiber concrete in the intelligent bridge reinforcement. Adv. Mater. Res. 2012, 594, 1539–1542. [Google Scholar] [CrossRef]
  30. Kasu, S.R.; Mitra, N.; Muppireddy, A.R. Influence of polyester microfiber reinforcement on flexural fatigue characteristics of concrete. Road Mater. Pavement Des. 2021, 22, 2866–2882. [Google Scholar] [CrossRef]
  31. Qiao, Y.; Wang, Z.; Sun, C.; Zuo, G. Experimental Study on Axial Compression Behavior of Reinforced Concrete Columns Strengthened with SRF. Ind. Constr. 2016, 46, 175–180. [Google Scholar]
  32. Nirmala, D.B.; Angadi, A. Experimental Study on Concrete vy Adding Polyester Fibres. Slovak J. Civ. Eng. 2023, 31, 43–48. [Google Scholar] [CrossRef]
  33. Koniki, S.; Prasad, D.R. A study on mechanical properties and stress—Strain response of high strength concrete reinforced with polypropylene-polyester hybrid fibres. Cem. Wapno Beton 2018, 23, 67–77. [Google Scholar]
Figure 1. Arrangement of the continuous rigid frame bridge (cm).
Buildings 13 02849 g001
Figure 2. Segmentation of main beam on side span (cm).
Buildings 13 02849 g002
Figure 3. Cross-section of 0# block box girder(cm).
Buildings 13 02849 g003
Figure 4. Mid-span cross-sections of main beam (cm).
Buildings 13 02849 g004
Figure 5. Longitudinal arrangement of monitoring position of the main beam.
Buildings 13 02849 g005
Figure 6. Stress measuring points of box girder top plate and bottom plate.
Buildings 13 02849 g006
Figure 7. Arrangement of deflection control points of box girder top plate and bottom plate.
Buildings 13 02849 g007
Figure 8. FE model of the continuous rigid frame bridge.
Buildings 13 02849 g008
Figure 9. Stresses in 2-2 and 4-4 sections after tensioning of prestressing tendons in each beam segment of the main beam. (a) Comparison of measured and calculated stresses in the top plate of section 2-2 of the main beam. (b) Comparison of measured and calculated stresses in the bottom plate of section 2-2 of the main beam. (c) Comparison of measured and calculated stresses in the top plate of section 4-4 of the main beam. (d) Comparison of measured and calculated stresses in the bottom plate of section 4-4 of the main beam.
Buildings 13 02849 g009
Figure 10. Elevation deviation of each beam segment of main beam before concrete pouring and after prestressing tendon tensioning condition. (a) Elevation deviation of each beam segment at the side-span of left pier. (b) Elevation deviation of each beam segment at the mid-span of left pier. (c) Elevation deviation of each beam segment at the side-span of right pier. (d) Elevation deviation of each beam segment at the mid-span of right pier.
Buildings 13 02849 g010aBuildings 13 02849 g010b
Figure 11. Solid concrete model of box girder.
Buildings 13 02849 g011
Figure 12. Prestressing steel bundle model of box girder.
Buildings 13 02849 g012
Figure 13. Stress distribution in the longitudinal direction of the block 0# under maximum cantilever state.
Buildings 13 02849 g013
Figure 14. Stress distribution in the bottom b of the top plate of the block 0# under the maximum cantilever state.
Buildings 13 02849 g014
Figure 15. Stress distribution in the transverse direction of the bottom plate of the block 0# under the maximum cantilever state.
Buildings 13 02849 g015
Figure 16. Stress distribution in the longitudinal direction of the block 0# under the completed bridge state.
Buildings 13 02849 g016
Figure 17. Stress distribution in the transverse direction in the top plate of the block 0# under the completed bridge state.
Buildings 13 02849 g017
Figure 18. Stress distribution in the transverse direction in the bottom plate of the block 0# under the completed bridge state.
Buildings 13 02849 g018
Figure 19. Shrinkage crack distribution of the 0# block box girder. (a) Bottom plate of conventional concrete. (b) Web plate of conventional concrete. (c) Bottom plate of polyester fiber concrete. (d) Web plate of polyester fiber concrete.
Buildings 13 02849 g019aBuildings 13 02849 g019b
Table 1. Construction conditions.
Construction ConditionContentConstruction ConditionContentConstruction ConditionContent
1Main pier construction7Block 5# pouring13T10/Z1~Z3/ZH1~ZH5 tension
2Block 0# pouring8Block 6# pouring14Block 12# pouring
3Block 1# pouring9Block 7# pouring15Block 13# pouring
4Block 2# pouring10Block 8# pouring16Bundle tensioning for side span merging
5Block 3# pouring11Block 9# pouring17Pouring of mid-span merging section
6Block 4# pouring12Block 10# pouring18Tensioning of steel bundles for mid-span merging
Table 2. Mechanical properties of prestressing tendons.
PartTensile Strength (MPa)Tension Control Stress (MPa)Modulus of Elasticity (GPa)Reinforcement Relaxation CoefficientPore Friction CoefficientPore Deviation Coefficient
Prestressing tendons186013951950.30.170.0015
Table 3. Element types and part meshes in FE model.
PartElement TypeMesh TypeMesh Size (cm)Element Number
Concretesolid65sweep25209685
Prestressing tendonslink10sweep2528620
Table 4. Polyester fiber material parameters.
MaterialModulus of Elasticity
(MPa)
Tensile Strength
(MPa)
Density
(kg/m3)
Elongation at Break (%)Length (mm)Diameter (μm)
Polyester Fiber3000≥2701360≥1515~4010~25
Table 5. Concrete Material Properties.
MaterialModulus of Elasticity
(GPa)
Tensile Strength
(MPa)
Compressive Strength (MPa)Poisson’s RatioThermal Expansion Coefficient (°C−1)
Conventional Concrete34.52.6432.40.21.0 × 10−5
Polyester Fiber Concrete34.52.9435.640.20.8 × 10−5
Table 6. Load boundary conditions.
Working ConditionSide SpanMid Span
FZ
(kN)
FY
(kN)
MY
(kN⋅m)
FZ
(kN)
FY
(kN)
MY
(kN⋅m)
Maximum Cantilever State130,070.63363.938514.059130,070.63363.938514.059
Completed Bridge State128,285.271220.8146,349.364127,197.47244.572,684.617
Note: FZ-Axial force; FY-Shear force; MY-Bending moment.
Disclaimer/Publisher’s Note: The statements, opinions and data contained in all publications are solely those of the individual author(s) and contributor(s) and not of MDPI and/or the editor(s). MDPI and/or the editor(s) disclaim responsibility for any injury to people or property resulting from any ideas, methods, instructions or products referred to in the content.

