Abstract
Passive energy dissipation systems and devices are helpful in mitigating the danger of earthquake damage to structures. Metallic slit dampers (MSDs) are one of the most efficient and cost-effective solutions for decreasing seismic energy intake. The potential importance of MSDs in managing vibrations and limiting structural fatigue continues to grow as research advances and new materials and designs are introduced. This study evaluated the seismic performance of single-plate MSDs (SPMSDs) through a combination of numerical simulation and assessment of experimental results. ABAQUS software was used to create an assembly consisting of endplates, bolts, and SPMSDs. A real-world earthquake scenario was simulated using cyclic loads based on ASCE/SEI standards, and displacement-measuring devices such as strain gauges and LVDT were employed to record the behavior of the SPMSDs. The results of the experiment are used to assess the compliance of the SPMSDs and discuss their behavior as they undergo minimum and maximum displacements due to minimum and maximum applied forces. The energy dissipation capabilities of the dampers are presented by analyzing and comparing the area of their hysteresis loops, equivalent viscous damping, and their damping ratios. Actual failure modes are identified and shown to describe the limitations and potential vulnerability of the dampers. The relative error between the lowest and greatest recorded forces from experimental data and numerical simulation ranges from 4.4% to 5.7% for SPMSD 1 and from 1.6% to 2.1% for SPMSD 2, respectively. These deviation values represent a satisfactory level of precision, demonstrating that the numerical simulation accurately predicts the actual performance and behavior of the dampers when subjected to cyclic stress. The topology optimization performed in this study yielded an improved geometry of the SPMSD suited for a corresponding maximum considered earthquake (MCER) displacement of ±33 mm. This research also suggests practical implementations of the investigated and improved SPMSDs.
1. Introduction
Engineers and architects must remain vigilant in designing buildings that are able to withstand the loads caused by earthquakes. Numerous studies have produced distinct methods to design, manufacture, and evaluate the instrumentation of hysteretic devices in earthquake-resistant structures [1]. One of the most efficient and cost-effective techniques for reducing the intake of seismic energy is the use of metallic-hysteretic dampers, which concentrate on inelastic deformation [2]. The advantageous characteristics of hysteretic energy dissipation devices reduce the risk of earthquake damage to structures due to their familiar material behavior [3] and modifiable design [4]. Foti et al. conclude that energy dissipators are efficient in reducing earthquake-induced forces [5]. They can also be used for retrofitting or upgrading [6] and can serve as protection against structural damage [7]. The damage in an idealized structure subjected to a single historical earthquake record can be quantified via a damage measure (), as studied by Symans et al. [8]. Thus, a large enough number and appropriate design of energy dissipators maintain inter-story drifts between reasonable bounds.
Metallic slit dampers (MSDs) effectively dissipate energy and reduce vibrations in structures [9]. In recent studies, MSDs were investigated and proven to be optimized dynamically [10], numerically [11], and according to the bi-directional evolutionary structural [12] technique. MSDs serve dual functions [13], upgrade seismic performance through the optimal placement methodology [14], have a B/D ratio greater than 2 [15], are capable of yielding in both flexure and shear [16], are used to reinforce braced frames [17], can be integrated into a structure [18], and can be applied to concrete frames [19]. One of the main advantages of MSDs is their ability to operate over a wide range of frequencies, making them effective at reducing both low- and high-frequency vibrations. They are also highly resistant to fatigue [20] and can withstand large displacements, which are highly influenced by earthquakes and other structural parameters that they carry [21], including ductility and cumulative displacement parameters [22], the improved initial stiffness criterion [23], and different aspect ratios [24] without losing their effectiveness. As research progresses and new materials and designs are introduced, the potential significance of MSDs in controlling vibrations and minimizing structural fatigue is expected to increase. It is important to evaluate the seismic performance of MSDs to ensure their effectiveness in reducing the seismic response of structures. Without proper evaluation, the effectiveness of the dampers cannot be ensured, which could potentially result in inadequate seismic protection and structural damage. This paper employs a manufacturing technique using a high-pressure water jet with accuracy to tenths of a digit. Dampers produced through this method lead to improved reliability and predictable response. The bolt-type configuration and compact size of our single-plate MSD (SPMSD) offers adaptability for seamless integrations. As it is made of durable SS275 steel for an extended service life, minimal maintenance requirements and associated costs are expected. This study is specifically aimed at assessing the seismic performance of SPMSD through a combination of numerical and experimental analyses.
2. Assessment of Seismic Performance
This section offers a comprehensive overview of the two widely utilized assessments for evaluating the seismic performance of dampers. We discuss both the experimental approach and the combined experimental and numerical method, drawing insights from previous and ongoing research. These insights form the basis for establishing the procedural steps to assess the seismic performance of our SPMSD.
2.1. Experimental Evaluation Process of MSDs
MSDs are tested experimentally by subjecting them to simulated seismic stresses in a controlled laboratory environment. Their vibration is evaluated through their cumulative dissipated plastic energy induced during hysteretic behavior [25]. MSDs are placed in a ground-connected structure during the experiment and a seismic load is then applied to the structure. Generally, the experiment is performed multiple times under different loading situations to evaluate the dampers’ performance. The experimental data from these tests is then examined to determine the effectiveness of the MSDs in reducing the seismic response of the structure. As an example, through experimental evaluation, Bae et al. were able to conclude that increasing the height-to-width ratio of dampers results in reduced structural deformation [26]. Sensors are usually placed at various locations to measure displacement, acceleration, and other important parameters defined and chosen prior to the execution of the experiment. It is obvious that the analysis of the resulting experimental data is dependent on the sensor instrumentation used. For displacement-related analysis, transducers such as linear variable differential transducers (LVDTs) may be used to assess elongation as tensile loads are applied to the specimen [27], as well as axial deformation [28] and lateral displacement. Meanwhile, strain analysis is achieved by using strain gauges for monitoring [29] and measuring direct strain [30] and axial forces [28]. The evaluation of the seismic performance of dampers and structures may also be performed with the aid of accelerometers to measure horizontal accelerations and derive optimum yield-shear force coefficients [28]. Accelerometers measure the resulting peak accelerations to quantify input energy responses and the elastic spectrum for a comprehensive understanding of a structure’s dynamic behavior under varying loads, aiding in accurate seismic assessment and efficient design improvements.
2.2. Combined Numerical and Experimental Evaluation Process of MSDs
Numerical evaluation of MSDs is all about analyzing the performance of dampers in decreasing a structure’s seismic response using single or multiple computer-based simulation softwares. To assess the accuracy of simulation models, numerical evaluation is frequently used in conjunction with the results of an experimental assessment. The numerical simulation model is developed based on the physical properties and behavior of the MSDs and the structure they are installed in. Advanced finite element programs such as ABAQUS and ANSYS software could be used to model the geometry, material properties, and mechanical behavior of the dampers, as well as the structural properties and boundary conditions of the building or structure they are or will be installed in. The numerical model is then exposed to simulated seismic loads, with and without the MSDs, and the response of the structure is compared. Numerical simulation can be used to forecast the performance of various damper combinations and optimize their design for specific applications. The numerical simulation’s accuracy is evaluated by comparing the results to the experimental data gained from testing the dampers under simulated seismic stresses. This procedure helps to ensure that the simulation accurately reflects the real-world behavior of the dampers and the structure in which they are mounted. Figure 1 depicts a flowchart for the sequential procedure involved in combining numerical and experimental methodologies in the evaluation of MSDs, as collated from several studies. The combination of experimental analysis and numerical modeling allow the creation of a design and fitting process [13]. For instance, Askariani et al. proved that high energy dissipation capacity can be achieved by using slit-link beam in an eccentrically braced frame [31]. The sequential procedure in Figure 1 may be extended to analyzing the design and retrofit of flexible steel on special moment resisting frames [32]. Effectively combining experimental and numerical methodologies can improve the seismic characteristics of dampers [33], enhance their low-cycle fatigue response [34], assess new brace types consisting of two-slit dampers and one H-type brace [35], and utilize a seismic isolation system for elastoplastic behavior analysis [36]. The end phase of the flowchart acts as the starting point from which the extended stages can be undertaken or combined. For example, extending one’s analysis makes it possible to introduce several things. In the case of Li and Li, a new building design with additional structural stiffness and good seismic-dissipation is achieved [37]. A damper comprised of parallel hollow circular plates and an inner shaft was also introduced by Jarrah et al. [38], while a comb-teeth damper was presented by Garivani et al. [39]. Finally, other researchers such as Naimi et al. and Koroglu et al. have employed beam section reduction to improve beam ductility [40] and prevent damage to beam-column joints [41] through combined experimental and numerical techniques. Overall, the numerical phase of MSD evaluation is a crucial tool for evaluating and possibly optimizing their performance. It is especially beneficial when physical testing is limited or impracticable, or when evaluating the performance of novel damper designs or configurations.
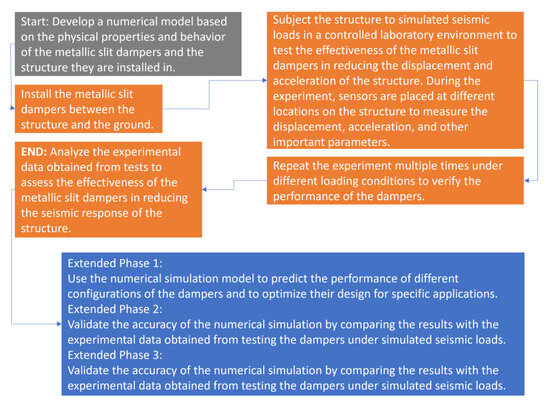
Figure 1.
Numerical and experimental evaluation flowchart of MSD analysis.
3. Methodology
The procedural steps implemented in this study to examine the seismic performance of SPMSDs and better understand their behavior and efficiency in reducing seismic vibrations are shown in Figure 2. A detailed drawing of the specimen for investigation is shown in Figure 3. The geometric variation between SPMSD 1 and SPMSD 2 in Table 1 was based on the suggestion of Keykhosro Kiani et al. regarding the ideal b/h ratio of dampers [34].
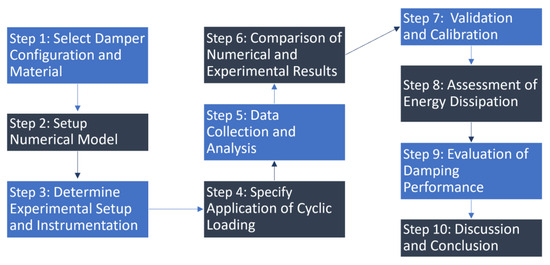
Figure 2.
Procedural steps for experimentally and numerically assessing SPMSDs.
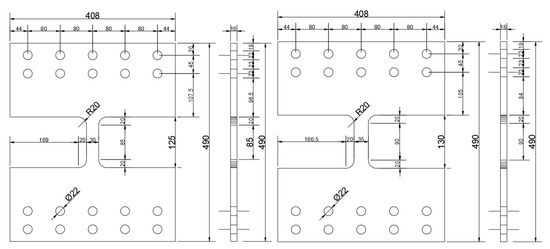
Figure 3.
Geometry of single-plate MSDs: left- single-plate MSD 1(SPMSD 1), right- single-plate MSD 2 (SPMSD 2).

Table 1.
Geometric configuration of dampers.
To complement the experimental analysis, a numerical simulation was performed to replicate the seismic performance of the SPMSDs. The Abaqus software [42] was used to model an assembly shown in Figure 4. Three components make up the model: a damper, a bolt, and the endplate. Using a 3D modelling space, a solid-shape deformable type was created by means of extrusion. In general, plastic deformation increases after the yielding of steel and is accompanied by a hardening phenomenon as stress increases. To simulate the appropriate nonlinear hysteresis in the plastic region beyond the elastic region, combined hardening is applied to the model.
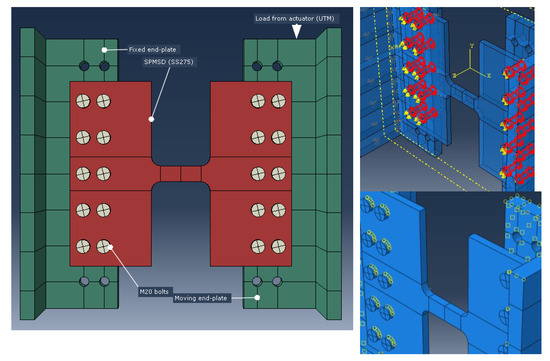
Figure 4.
Abaqus model of a localized slit damper (left: assembly, upper right: bolt pre-tension, bottom right: application of damper, bolt, and end-plate Constraints).
Solid-type homogeneous sections made of SS275 steel were used for the localized SPMSD. An independent instance of the component (localized SPMSD) was created in the “Assembly Module”. A reference point, located in the center of mass in the right-most region of the model, was created that later served as the point where the cyclic loading was applied. The strut was partitioned into two sections and the base (flange) of the damper was partitioned into three. A global mesh size of 2.75 mm was applied in the damper while the partitioned regions were locally seeded with a maximum of nine elements to avoid any failure when meshing using the medial axis or sweep technique. Mesh transitioning was minimized, and the bolt and the endplate used a mesh size of 2.5 mm and 10 mm, respectively. The element type used in all parts is an eight-node linear brick with reduced integration and hourglass control (C3D8R). The surface-to-surface interaction relationship for the end plates and bolt nuts and the SPMSD in the FE models were defined as normal “hard” contact, and the friction coefficient for the tangential behavior of steel-and-steel contact was taken as 0.35. The “Bolt Load” command in the ABAQUS “Load” module was used to apply pre-tension to the middle part of the M20 bolts. The pre-tension was 142 (Figure 4, upper right), rounded to the nearest kN in accordance with AISC 360-22 [43]. The bonding and boundary conditions of the assembly were taken from the actual experimental setup. Six degrees of freedom were considered to simulate the behavior of the localized SPMSDs. In Figure 5, the left side of the endplate is fixed. Hence, this surface of the model is constrained in U1, U2, and U3 (Figure 4, bottom right). In addition, the surface of the damper in U3 is constrained as well to avoid out-of-plane deformation. After encoding the cyclic loading protocol during the experiment in the Load and Step modules, the analysis was executed. The results of the numerical analysis, and its comparison with the experimental data, are expounded in the succeeding sections. All material properties of the SPMSDs adapted in the FE model are summarized in Table 2. These isotropic parameters are taken from a coupon test performed for SS275 steel and the combined hardening parameters were taken from the study of Krolo et al. [44]. Meanwhile, the material behavior of the bolts and end plates were taken as solely isotropic with Y = 210 GPa, , and Fy = 900 MPa, respectively.
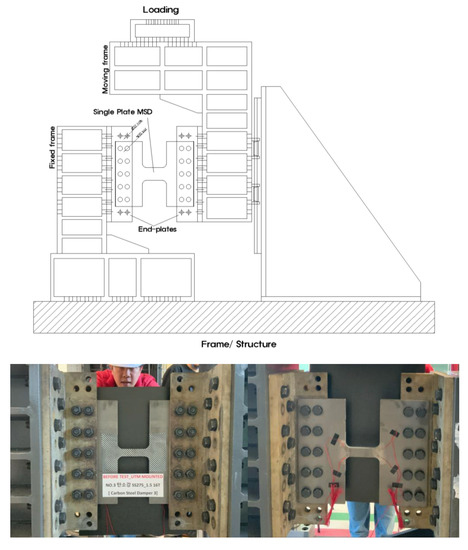
Figure 5.
Experimental setup with jig frame structure (bottom left—photo of the experimental setup from the front and bottom right—photo of the experimental setup from the back).
Table 2.
Summary of parameters during modelling.
To assess their potential for enhancing the structural stability of buildings and structures, the single-slit SPMSDs were subjected to simulated cyclic loading. The experimental setup, accurately illustrated in Figure 5, was comprised of a jig frame structure. Both dampers were precisely installed within the jig frame to replicate real-world structural conditions. The guidelines outlined in KDS 41 17 00:2019 [45] to replicate realistic loading conditions of a cyclic loading protocol were implemented. Particularly, the cyclic loading protocol consisted of three successive steps targeting specific displacements. The first step entailed subjecting the SPMSDs to ±11 mm displacements for a duration of ten cycles. This was followed by ±22 mm displacements for five cycles in the second step. Lastly, the third step involved ±33 mm displacements for three cycles. This incremental method allowed for an in-depth assessment of the SPMSDs’ performance throughout varying displacement levels. The performance of SPMSD 1 and SPMSD 2 may be studied across different displacement levels by examining the strain gauge and LVDT data acquired by the data logger. Strain gauges were strategically positioned at four specific locations on each damper to acquire essential data pertaining to the performance of the SPMSDs. These locations, based on [26], are recognized as critical areas prone to failure or experiencing high stress concentrations. Figure 6 depicts the exact positioning of the strain gauges on the SPMSDs. By monitoring strain at these specific locations, valuable insights into stress distribution and damper behavior were obtained, contributing to a comprehensive analysis of their performance. The experimental setup also incorporated a universal testing machine (UTM) with a 1000 kN capacity to apply simulated seismic forces. The strain gauges, connected to a data logger, captured localized strains and deformations throughout the cyclic loading protocol. Simultaneously, LVDT transducers, also connected to the data logger, recorded the overall displacement and movement patterns of the dampers. The resulting data on strain and displacement facilitated a thorough analysis of the SPMSDs’ behavior under simulated seismic loading conditions. The use of the jig frame structure, UTM, strategically placed strain gauges, LVDT transducers, and data logger ensured an extensive and verifiable assessment of the SPMSDs’ performance under simulated seismic loading conditions.
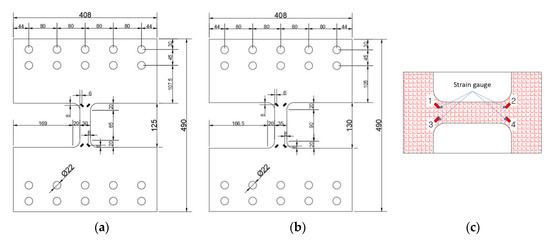
Figure 6.
Experimental setup with jig frame structure ((a). SPMSD 1; (b). SPMSD 2; (c). Strain gauge numbering and orientation during experiment).
4. Results and Analysis
4.1. Experimental Results
Table 3, Table 4 and Table 5 summarize the performance evaluation of the SPMSDs. Equation (1) was used to compute the theoretical ultimate load, (kN), referred from the conventional design of slit dampers by [4], where corresponds to the number of slits, equivalent to one for this study. is the tensile strength of the SPMSDs, which were made of SS275 steel. This value ranges from 410–550 MPa [46]. Accordingly, , , and correspond to the slit thickness, depth, and length, all measured in mm, respectively. The experimental ultimate load, (kN), is defined as the point/s at which the maximum targeted displacement was exceeded and just before exceeding, either in the positive or negative direction. (kN) is the maximum force that was recorded on each cycle. Figure 7 shows the strut-slit details of the specimen used in the experiment. The adequacy of the SPMSDs was further evaluated using Equations (2)–(6), extracted from section 18.6.1.5.1 of ASCE/SEI 7-16 [47]. and are the maximum force and minimum force at zero displacement for any one cycle. At a given rate and temperature, and are the average maximum and minimum forces at zero displacement, as determined from every cycle. and are the maximum force and minimum force at maximum device displacement. At a specific frequency and temperature, and are the average maximum and minimum forces at the maximum device displacement, as calculated from all cycles. is the area of the hysteresis loop of a damping device for any one cycle and is the average area of the hysteresis loop as calculated from all cycles at a specific frequency and temperature.
Table 3.
Comparison of test results and theoretical values.
Table 4.
Compliance with section 18.6.1.5.1 of ASCE/SEI 7-16.
Table 5.
Compliance with section 18.6.1.5.1 and 18.6.1.2 of ASCE/SEI 7-16.
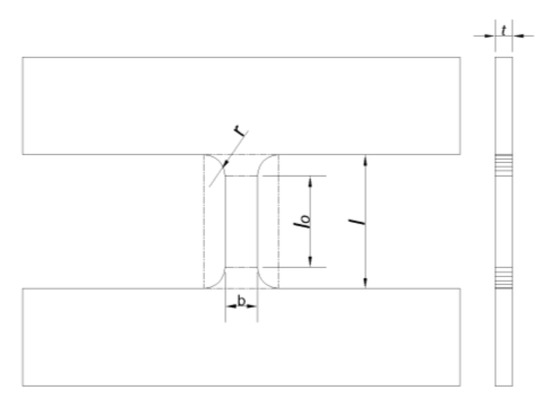
Figure 7.
Strut-slit detail.
SPMSD 1 failed on cycle four of the second step (S2C4), reaching a maximum equivalent to 52.46 kN. This maximum force occurred exactly at the point in the cycle before a damper is considered incapable of dissipating energy. It is also evident that the experimental force recorded during S2C4 was still within the range of the theoretical ultimate load, equivalent to 34.73 ≤ 46.59 kN, which was computed using Equation (1). A trend of exceeding for cycles one through three in step two (S2C1-3) of the loading protocol was observed for SPMSD 1. The recorded for S2C1-3 increased from 11.09% to 11.85% before S2C4. In the case of SPMSD 2, its maximum force, 57.27 kN, was recorded at the beginning of the test. Its did not exceed the threshold in any of the cycles and steps before S2C1, the point where the damper is considered unable to dissipate energy. The last recorded ultimate experimental force for SPMSD 2 was 37.81 kN. This is 16.57% below the theoretical ultimate load, equivalent to 44.64 ≤ 59.89 kN. The same relationship can be extracted from the relationship between and for both dampers (see Table 3). This makes SPMSD 1 more stable than SPMSD 2 when the experimental ultimate load is considered. In the case of (kN), the maximum force recorded in each cycle of SPMSD 1 and SPMSD 2, both dampers exceed their , meaning both dampers exhibited good uniformity in their demand–capacity relationship.
At zero displacement, both dampers were compliant with the ASCE/SEI 7-16 standard. However, during S2C1, the instant where the damper is considered incapable of dissipating energy, SPMSD 2’s was 25.50% beyond the allowable percent difference from the average maximum and the force at zero displacement, as determined from every cycle. A different case was observed at maximum displacement (see Table 4). SPMSD 2 continued to go beyond the allowable percent difference from the average maximum and minimum forces at maximum displacement, as determined from every cycle, by 74.66% and 19.29%, respectively (during S2C1 only). However, SPMSD 1 failed to comply with the ASCE/SEI 7-16 standard for during S2C4 and for during S2C2 and S2C3. SPMSD 2 is more adequate than SPMSD 1 when considering the minimum and maximum recorded forces during zero and maximum displacements since it only failed to comply with the standard on its final cycle of dissipating energy.
4.2. Energy Dissipation and Damping Ratio
The areas of the hysteresis loop of both dampers (see Table 5) for any one cycle were within the 15% allowable percent difference from the average area of the hysteresis loop, as calculated from all cycles at a specific frequency and temperature. During step one of the loading protocol, SPMSD 2 performed better in dissipating energy than SPMSD 1. A total of 18 975.69 kN-mm of energy was sustained by SPMSD 2. This is 30.53% higher than the dissipated energy of SPMSD 1. As the loading protocol continued to be applied in the dampers, SPMSD 1 became more stable and capable of dissipating energy. On the first cycle of step two, the maximum energy dissipated by SPMSD 2 was 3679.10 kN-mm, approximately 6.17% higher than SPMSD 1. Figure 8 illustrates the hysteretic behavior of the dampers in this experiment. SPMSD 2 failed immediately after the first cycle while SPMSD 1 continued to dissipate energy until the fourth cycle of step two. A total of 13,193.98 kN-mm of energy was dissipated by SPMSD 1 in step two. This is approximately 112.78% higher than the dissipated energy of SPMSD 2. The loading protocol did not proceed to step three for either damper, as cracking occurred during the fourth and first cycle on the second loading protocol for SPMSD 1 and SPMSD 2, respectively. Both SPMSDs failed to satisfy section 18.6.1.2 of ASCE/SEI 7-16, which requires that damping devices must not break ten times at 33% target displacement, five times at 67% target displacement, and three times at 100% target displacement when tested. The equivalent viscous damping of both dampers were measured using Equations (7)–(9) by [48]. corresponds to the effective stiffness measured during the experiment. and are the positive and negative largest displacements at the maximum and minimum recorded forces of Equations (4) and (5). is the damping ratio, calculated by equating the energy dissipated in a cycle of the jig frame and the damper. is the strain energy.
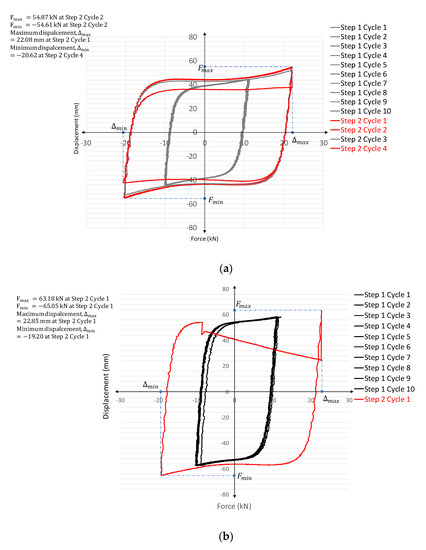
Figure 8.
Hysteretic behavior ((a). SPMSD 1; (b). SPMSD 2).
The equivalent viscous damping of the two dampers is shown in Figure 9 and is organized in Table 5. The effective stiffness of SPMSD 1 immediately decreased as the collective plastic deformation reached the maximum during the first cycle of the first step. The overall damping ratio of the first damper was 41.76% to 50.90%, possessing an opposite trend to that of its effective stiffness. The lowest effective stiffness and maximum damping ratio were recorded during the fourth cycle of the second step, respectively. Meanwhile, the lowest damping ratio was observed during the tenth cycle of the first step in the loading protocol. Failure occurred after two more cycles during the second step of the loading protocol. SPMSD 2 gradually reached its maximum during the tenth cycle of the first step. The inverse relationship between the effective stiffness and damping ratio was evident during the tenth cycle of the first step and the first cycle of the second step, where the maximum and minimum and were recorded. Unlike SPMSD 1, SPMSD 2 reached failure immediately after reaching its maximum effective stiffness and minimum damping ratio. The transition between the tenth cycle and first cycle of steps one and two, respectively, provides substantial insight into the failure to dissipate energy for both dampers. For SPMSD 2, an 88.12% difference in the effective damping value during this transition caused the immediate destruction of the damper. Meanwhile, stable behavior was observed in SPMSD 1, as only a 53.47% difference in the effective damping value was documented, which enabled SPMSD 1 to dissipate a total of 27143.66 kN-mm energy. This is 4488.87 kN-mm higher than SPMSD 2.
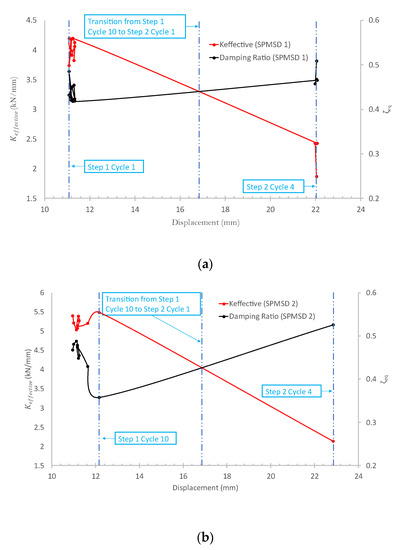
Figure 9.
Equivalent viscous damping ((a). SPMSD 1; (b). SPMSD 2).
4.3. Measure of Strain and Failure Modes
Figure 10 shows that both dampers have similar strain distributions and cumulative displacement trends. Energy dissipation during cyclic straining of both dampers, made of SS275, was rate dependent. Strain at transition, where the loading protocol increases from 33% of the target displacement to 67%, is always less than the value during the succeeding cycle. The maximum strain for SPMSD 1 right after failure in step two, cycle four was 1.37 times higher than the average strain recorded by strain gauge no. 2 (Figure 10a. Strain gauge no. 2).
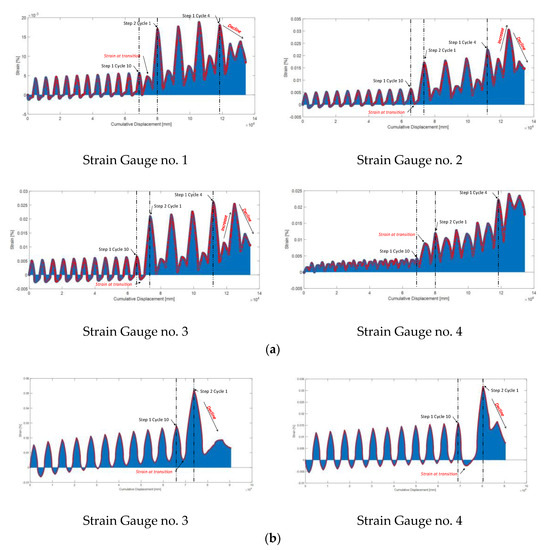
Figure 10.
Strain distribution and cumulative displacement ((a). SPMSD 1; (b). SPMSD 2).
The first and second strain gauge attached to the second damper were detached during the cyclic test. No data was recorded for the regions where these strain gauges were attached in conjunction with Figure 6c. From the recorded data of the strain gauges that remained attached, the maximum strain for SPMSD 2 was recorded by the third strain gauge in step two, cycle one of the loading protocol (Figure 10b. Strain gauge no. 3).
Photos of the damaged dampers are depicted for the comparison of the failure modes between the experimental results and the numerical simulation, as elaborated in Section 4.5. The location of these cracks illustrates that plastic deformation was concentrated in these localities. The rest of the identified critical sections exhibit cracking. Failure was expected whenever the strain value suddenly increased by 1.26 times the average strain for SPMSD 1 and by about 0.8 times the average strain for SPMSD 2. Commonly, it is observed that after failure, recorded strain decreases in value. However, in regions where plastic deformation and the occurrence of cracking was higher, strain increased substantially for SPMSD 1.
4.4. Comparison of Experimental Results and Numerical Analysis
4.4.1. Failure Modes
As illustrated in Figure 11, cracking was prominent on the upper and lower strut of SPMSD 1. For SPMSD2, cracking was prominent in regions two and three only. The yielding of the strut that was observed during the test was accurately simulated in the ABQUS model. The concentration of stresses that appeared in the simulation was concurrent to the critical regions of the dampers, as discovered from the experimental results. This part is the curved connection between the strut (web) and the flange.
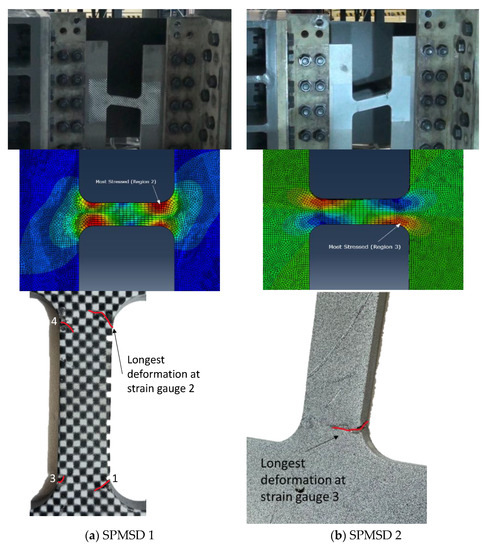
Figure 11.
Failure modes (1st row: experimental, 2nd row: FEM, 3rd row: actual photos).
4.4.2. Hysteretic Responses
The graphic comparison of hysteretic responses between the experimental and numerical evaluations of the dampers showed a strong correlation (Figure 12). The numerical simulations performed in the FE models showed a good level of agreement with the experimental results, demonstrating that the ABAQUS modeling approach accurately predicted the cyclic behavior of the dampers, predominantly during the elastic stage. The magnitude of the standard deviations between the experimental and numerical results reveals the distribution or variability of the data. A similar level of variability between the two sets of data points was indicated by the minor difference between the two standard deviations (37.39000788 for the experimental data and 37.01376983 for the numerical data). The standard deviation difference was less than 1, indicating a negligible difference. For instance, a relative error ranging from 4.4% to 5.7% existed between the minimum and maximum recorded forces from the experimental results and numerical simulations for SPMSD 1. The highest and lowest forces recorded during experiment and in the ABAQUS simulation for SPMSD 1 were 54.612 kN and −55.353 kN and 57.7346 kN and −57.7711 kN, respectively. For SPMSD 2 the relative error between the maximum and minimum experimental results and the numerical values ranged from 1.6% to 2.1%. Consequently, for SPMSD 2, the highest and lowest forces recorded during experiment and in the ABAQUS simulation were 64.234 kN and −65.051 kN and 63.334 kN and −63.669 kN, respectively. The relative error was calculated by finding the absolute difference between the measured experimental value and the numerical value, which was then expressed as a percentage of the true value to quantify how close the measurement was to the expected result. These deviation values indicate a reasonably high level of precision. Thus, the numerical simulation was modelled successfully and replicated the real-world performance and behavior of the dampers when subjected to cyclic loading.

Figure 12.
Comparison of experimental and numerical hysteretic responses ((a). SPMSD 1; (b). SPMSD 2).
4.5. Practical Implementation in Seismic Design of SPMSDs
In this study, the tested localized SPMSDs under cyclic loading were taken to have a corresponding maximum considered earthquake (MCER) displacement equal to ±22 mm. The acceptance thresholds of SPMSD 1 and 2 were based on the sequence and cycles adapted from the ASCE/SEI 7-16 standard, specifically mentioned under Section 18.4. As various types of structures are currently configured using several damping technologies to mitigate dynamic loadings, SPMSD 1 and SPMSD 2 may be implemented in different ways. SPMSDs can be an addition to the conventional bracing for dynamic loads, as depicted in Figure 13. The damper serves its main purpose by absorbing and dissipating energy, which, in effect, reduces the forces and displacements suffered by a structure during seismic events. It can also be treated as an element for the seesaw brace systems shown in Figure 14 or as a beam-to-column connection with a wide opening in the frame bays, as shown in Figure 15.
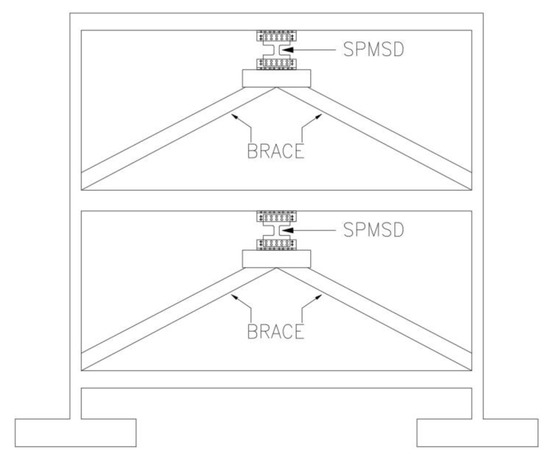
Figure 13.
Detailing of a conventional brace installed with an SPMSD.
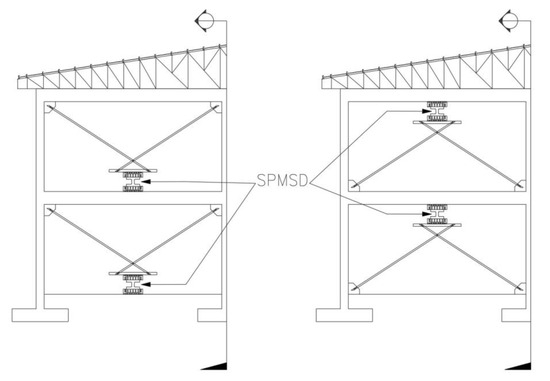
Figure 14.
Detailing of a seesaw connection installed with an SPMSD.
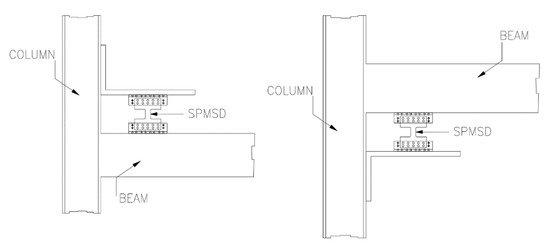
Figure 15.
Detailing of beam (girder)-to-column connection with a wide opening installed with an SPMSD.
The ABAQUS model, created in the numerical investigation, was optimized by creating single-term design responses focused on strain energy and volume. Strain describes the deformation of material under stress and, as damping devices, SPMSDs must sustain high strain energies, resulting in higher ductility. This means that they can withstand larger deformations before breaking, as the prescribed displacement is set to ±33 mm. Volume is defined as the total volume of all of the design-area parts; since strain energy is being minimized, stiffness is maximized, as defined by the objective function manager. As recommended in the ABAQUS documentation [42], either a volume or a weight constraint must be applied in the model. The optimized constraint corresponds to 90% of the original volume. Finally, the bolts and both endplates in the model were geometrically restricted under the geometric restriction manager command and were labeled as “frozen areas” since only the damper was targeted to be augmented using 50 iterations. Figure 16 shows the optimization model, reflecting the optimization task (green rhombus), design response, objective function, and geometric restrictions applied (pink circles). As the optimization was conducted within the ABAQUS model, we would like to highlight that the cost function for structural optimization in terms of strain energy, intended to find the optimal material distribution within a design domain to minimize strain energy, is given by Equation (10), where is the cost function, representing the total strain energy, V is the volume of the design domain (retained at 90%), is the stress tensor, and is the strain tensor. Consequently, as displacement is taken as a critical design requirement, optimization was performed to minimize the displacement at the web section of the damper using the simplified approach described in Equation (11). Here, is the cost function taken as a square to ensure a positive value and that larger displacements contribute more to the cost and represents the displacement (typically in a specific direction, such as X, Y, or Z) at the node of interest.
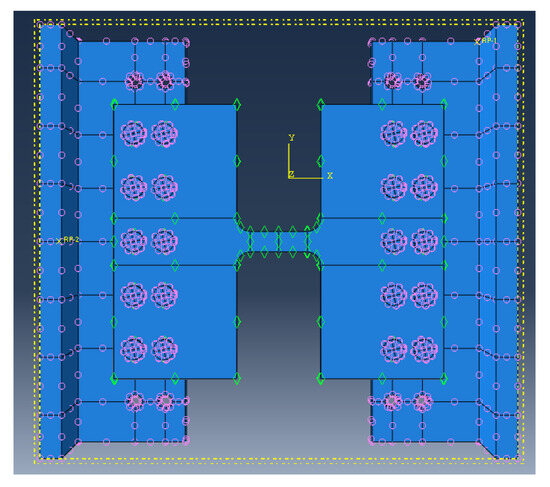
Figure 16.
Optimization model.
The result of the optimization produced an “improved” geometry for the SPMSD that was capable of damping the prescribed displacements up to ±33 mm, adapted from the 1% story drift of a 3000 mm floor-to-floor height. Although there isn’t a universal minimum story drift requirement, the maximum allowable story drift is typically defined by building codes and standards. According to ASCE 7-16 (2016 edition of Minimum Design Loads for Buildings and Other Structures), buildings in seismic design categories A, B, and C have a maximum allowable story drift ratio (story drift divided by story height) of 2.5%. Buildings in seismic design categories D, E, and F have a maximum drift ratio of 1.5%. For this case, we decided to work with 1% only [47]. This was determined to be 1700 mm by 6840 mm by 15 mm. Due to the enormous volume of the improved SPMSD, it may be discretized into multiple struts. The improved SPMSD shall be implemented as:
one 1700 by 6840 by 15 mm damper installed as a single plate.
two 850 by 3440 by 15 mm dampers installed as a double plate.
four 425 by 1740 by 15 mm dampers installed as two double plates or in multiple series.
eight 212.5 by 890 by 15 mm dampers installed in multiple series.
forty 42.5 by 210 by 15 mm dampers installed in multiple series.
If a double plate MSD (DPMSD) is adapted, each plate shall have forty 42.5 mm by 210 mm by 15 mm struts for the imposed displacement, equal to ±33 mm.
As guide, the overall implementation of SPMSDs may be governed but not limited, and may be extended, as shown in the following steps:
- Step 1: Conduct a preliminary structural analysis of the building or structure to decide and understand how it will react to dynamic loads. This investigation identifies the areas and sections that need more dampening.
- Step 2: The best (optimal) places to install single-plate metallic slit dampers should be determined next by considering the distribution of projected seismic forces and structural susceptibility. Performance-based analysis is also an option.
- Step 3: The next phase is to consider the design specifications of the dampers (i.e., maximum displacement capacity, strength, and energy dissipation capabilities). The design must take into consideration both the general structural response and the anticipated seismic loads. In addition, the dampers should be made of an appropriate material, usually high-strength steel or another alloy with good ductility and energy-dissipation properties. The material must have a steady stress–strain response and be able to tolerate cyclic loads.
- Step 4: Installation of the single-plate metallic slit dampers is next. Using the proper fasteners and/or welding procedures, depending on the structural codes implemented and followed, the dampers are attached to the structural components, such as columns, beams, or braces.
- Step 5: The final step is to combine the following:
5. Conclusions
The concluding summary of the research objectives, findings, and contributions to the field of seismic performance evaluation includes:
- Stability and compliance with standards. When the experimental ultimate load is considered, SPMSD 1 is more stable than SPMSD 2. Both dampers meet the ASCE/SEI 7-16 standard at zero displacement. When examining the minimum and maximum recorded forces during minimum and maximum displacements, SPMSD 2 is more appropriate than SPMSD 1 because it only failed to meet the criterion on its final cycle of dissipating energy.
- Energy Dissipation and Damping Ratios. SPMSD 2 outperforms SPMSD 1 in dissipating energy during step one of the loading protocol. During the first step, SPMSD 2 maintained 30.53% more dissipated energy than SPMSD 1. SPMSD 1 became more stable and capable of dispersing energy when the loading protocol continued to be applied in the dampers. During step two, SPMSD 1 dissipated roughly 112.78% more energy than SPMSD 2. When tested, both SPMSDs failed to comply with section 18.6.1.2 of ASCE/SEI 7-16.
- Hysteretic behavior. SPMSD 2 failed promptly after achieving its maximum effective stiffness and minimal damping ratio, as opposed to SPMSD 1. The shift from the tenth cycle to the first cycle of steps one and two, respectively, provides significant insight into the dampers’ failure to dissipate energy. For SPMSD 2, an 88.12% difference in effective damping value during this transition resulted in instantaneous damper disintegration.
- Measure of Strain and Failure Modes. Cracks indicate the presence of plastic deformation in the dampers. Failure is expected whenever the strain value suddenly increases by 1.26 times the average strain for SPMSD 1 and by approximately 0.8 times the average strain for SPMSD 2. It is common to see that the value of recorded strain reduces after failure. However, in locations where plastic deformation is greater, the occurrence of cracking increases significantly for SPMSD 1.
- Numerical Evaluation and Analysis. ABAQUS software was used to successfully model the SPMSDs under cyclic loading. The simulation’s stress concentration corresponds to the critical regions of the dampers, as determined by experimental results. The curved connection between the strut (web) and the flange is represented by this component. The numerical simulations in the FE models agreed well with the experimental results, revealing that the ABAQUS modeling approach accurately anticipated the cyclic behavior of the dampers, particularly during the elastic stage. For SPMSD 1, the relative error ranged from 4.4% to 5.7% between the minimum and highest reported forces from experimental data and numerical simulation, while the relative error ranged from 1.6% to 2.1% for SPMSD 2.
- Practical implementation. If SPMSDs and the modified SPMSD are used either as a component of seesaw brace systems, as an addition to conventional bracing, or as a beam-to-column connection, they can lessen the forces and displacements that the structure experiences during seismic occurrences (Figure 13, Figure 14 and Figure 15). In Section 4.5 of this study, a manual for the general implementation of SPMSDs is provided.
Author Contributions
Conceptualization, J.M.G.P. and D.-K.K.; methodology, J.M.G.P. and D.-K.K.; software, J.M.G.P. and D.-K.K.; validation, J.M.G.P. and D.-K.K.; formal analysis, J.M.G.P. and D.-K.K.; resources, J.M.G.P. and D.-K.K.; writing—original draft preparation, J.M.G.P. and D.-K.K.; writing—review and editing, J.M.G.P. and D.-K.K.; visualization, J.M.G.P. and D.-K.K.; supervision, D.-K.K.; funding acquisition, D.-K.K. All authors have read and agreed to the published version of the manuscript.
Funding
This research was supported by the Basic Science Research Program through the National Research Foundation (NRF) funded by the Korea Ministry of Education (No. 2016R1A6A1A03012812).
Data Availability Statement
The data presented in this study are available on request from the corresponding author. The data is not publicly available due to privacy and security concerns.
Acknowledgments
This work of John Mark G. Payawal, a doctoral student, has been fully supported by the Education and Research Center for ICT Integrated Safe Ocean Smart Cities (I-SOC) at Dong-A University supported by the Korean Ministry of Education (September 2020~August 2027).
Conflicts of Interest
The authors declare no conflict of interest.
References
- Martínez-Rueda, J.E. On the Evolution of Energy Dissipation Devices for Seismic Design. Earthq. Spectra 2002, 18, 309–346. [Google Scholar] [CrossRef]
- Ahn, T.-S.; Kim, Y.-J.; Park, J.-H.; Kim, H.-G.; Jang, D.-W.; Oh, S.-H. Experimental Study on a Cantilever Type Metallic Damper for Seismic Retrofit of Building Structures. J. Korean Soc. Steel Constr. 2012, 24, 149–161. [Google Scholar] [CrossRef]
- Titirla, M.D. A State-of-the-Art Review of Passive Energy Dissipation Systems in Steel Braces. Buildings 2023, 13, 851. [Google Scholar] [CrossRef]
- Chan, R.W.K.; Albermani, F. Experimental Study of Steel Slit Damper for Passive Energy Dissipation. Eng. Struct. 2008, 30, 1058–1066. [Google Scholar] [CrossRef]
- Foti, D.; Bozzo, L.; López-Almansa, F. Numerical Efficiency Assessment of Energy Dissipators for Seismic Protection of Buildings. Earthq. Engng. Struct. Dyn. 1998, 27, 543–556. [Google Scholar] [CrossRef]
- Guerrero Bobadilla, H.; Zamora Romero, E.; Escobar Sánchez, J.A.; Gómez Martínez, R. Experimental behaviour of a low-cost seismic energy dissipation device. RIS 2020, 102, 65–81. [Google Scholar] [CrossRef]
- Mena, Á.; Franco, J.; Miguel, D.; Mínguez, J.; Jiménez, A.C.; González, D.C.; Vicente, M.Á. Experimental Campaign of a Low-Cost and Replaceable System for Passive Energy Dissipation in Precast Concrete Structures. Appl. Sci. 2020, 10, 1213. [Google Scholar] [CrossRef]
- Symans, M.D.; Charney, F.A.; Whittaker, A.S.; Constantinou, M.C.; Kircher, C.A.; Johnson, M.W.; McNamara, R.J. Energy Dissipation Systems for Seismic Applications: Current Practice and Recent Developments. J. Struct. Eng. 2008, 134, 3–21. [Google Scholar] [CrossRef]
- Javanmardi, A.; Ibrahim, Z.; Ghaedi, K.; Benisi Ghadim, H.; Hanif, M.U. State-of-the-Art Review of Metallic Dampers: Testing, Development and Implementation. Arch. Comput. Methods Eng. 2020, 27, 455–478. [Google Scholar] [CrossRef]
- Park, J.W.; Yoon, J.-H.; Yoon, G.-H.; Lim, Y.M. Effect of Dynamic Loading Conditions on Maximizing Energy Dissipation of Metallic Dampers. Appl. Sci. 2022, 12, 3086. [Google Scholar] [CrossRef]
- Moreschi, L.M.; Singh, M.P. Design of Yielding Metallic and Friction Dampers for Optimal Seismic Performance. Earthq. Engng. Struct. Dyn. 2003, 32, 1291–1311. [Google Scholar] [CrossRef]
- Ghabraie, K.; Chan, R.; Huang, X.; Xie, Y.M. Shape Optimization of Metallic Yielding Devices for Passive Mitigation of Seismic Energy. Eng. Struct. 2010, 32, 2258–2267. [Google Scholar] [CrossRef]
- Li, H.-N.; Li, G. Earthquake-Resistant Design of RC Frame with “Dual Functions” Metallic Dampers. In Proceedings of the Volume 8: Seismic Engineering; ASMEDC: San Antonio, TX, USA, 1 January 2007; pp. 43–53. [Google Scholar]
- Li, Z.; Shu, G. Optimal Placement of Metallic Dampers for Seismic Upgrading of Multistory Buildings Based on a Cost-effectiveness Criterion Using Genetic Algorithm. Struct. Des. Tall Spec. Build. 2019, 28, e1595. [Google Scholar] [CrossRef]
- Bagheria, S.; Hadidi, A.; Alilou, A. Heightwise Distribution of Stiffness Ratio for Optimum Seismic Design of Steel Frames with Metallic-Yielding Dampers. Procedia Eng. 2011, 14, 2891–2898. [Google Scholar] [CrossRef][Green Version]
- Sahoo, D.R.; Singhal, T.; Taraithia, S.S.; Saini, A. Cyclic Behavior of Shear-and-Flexural Yielding Metallic Dampers. J. Constr. Steel Res. 2015, 114, 247–257. [Google Scholar] [CrossRef]
- Farsi, A.; Amiri, H.R.; Dehghan Manshadi, S.H. An Innovative C-Shaped Yielding Metallic Dampers for Steel Structures. Structures 2021, 34, 4254–4268. [Google Scholar] [CrossRef]
- Dargush, G.F.; Soong, T.T. Behavior of Metallic Plate Dampers in Seismic Passive Energy Dissipation Systems. Earthq. Spectra 1995, 11, 545–568. [Google Scholar] [CrossRef]
- Abarkane, C.; Ríos-García, G.; Gale-Lamuela, D.; Rescalvo, F.; Gallego, A.; Benavent-Climent, A. Metallic Slit-Plate Dampers: Damage Evaluation with Metal Magnetic Memory Technique and Application to Structures with Rocking Columns. Metals 2019, 9, 953. [Google Scholar] [CrossRef]
- Kim, Y.-C.; Mortazavi, S.; Farzampour, A.; Hu, J.-W.; Mansouri, I.; Awoyera, P. Optimization of the Curved Metal Damper to Improve Structural Energy Dissipation Capacity. Buildings 2022, 12, 67. [Google Scholar] [CrossRef]
- Morillas, L.; Escolano-Margarit, D. Estimation of Cyclic Demand in Metallic Yielding Dampers Installed on Frame Structures. Appl. Sci. 2020, 10, 4364. [Google Scholar] [CrossRef]
- Aghlara, R.; Md Tahir, M.; Adnan, A. Comparative study of eight metallic yielding dampers. J. Teknol. 2015, 77. [Google Scholar] [CrossRef]
- Li, G.; Wang, S.; Li, H. Study and Application of Metallic Yielding Energy Dissipation Devices in Buildings. In Proceedings of the Tenth U.S. National Conference on Earthquake EngineeringFrontiers of Earthquake Engineering, Anchorage, AK, USA, 21–25 July 2014. [Google Scholar] [CrossRef]
- Aljawadi, A.S.; Alih, S.C.; Vafaei, M. Mechanical Behaviour of Metallic Yielding Dampers with Different Aspect Ratios. Lat. Am. J. Solids Struct. 2021, 18, e353. [Google Scholar] [CrossRef]
- Oh, S.-H.; Park, H.-Y. Experimental Study on Seismic Performance of Steel Slit Damper under Additional Tensile Load. J. Build. Eng. 2022, 50, 104110. [Google Scholar] [CrossRef]
- Bae, J.; Lee, C.-H.; Park, M.; Alemayehu, R.W.; Ryu, J.; Kim, Y.; Ju, Y.K. Cyclic Loading Performance of Radius-Cut Double Coke-Shaped Strip Dampers. Materials 2020, 13, 3920. [Google Scholar] [CrossRef] [PubMed]
- Chen, G.; Eads, S.A. Behavior and Fatigue Properties of Metallic Dampers for Seismic Retrofit of Highway Bridges; Missouri Department of Transportation: Jefferson City, MO, USA, 2005; p. 105.
- Donaire-Ávila, J.; Benavent-Climent, A. Optimum Strength Distribution for Structures with Metallic Dampers Subjected to Seismic Loading. Metals 2020, 10, 127. [Google Scholar] [CrossRef]
- Oinam, R.M.; Sahoo, D.R. Using Metallic Dampers to Improve Seismic Performance of Soft-Story RC Frames: Experimental and Numerical Study. J. Perform. Constr. Facil. 2019, 33, 04018108. [Google Scholar] [CrossRef]
- Zheng, J.; Zhang, C.; Li, A. Experimental Investigation on the Mechanical Properties of Curved Metallic Plate Dampers. Appl. Sci. 2019, 10, 269. [Google Scholar] [CrossRef]
- Askariani, S.S.; Garivani, S.; Aghakouchak, A.A. Application of Slit Link Beam in Eccentrically Braced Frames. J. Constr. Steel Res. 2020, 170, 106094. [Google Scholar] [CrossRef]
- Ahmadie Amiri, H.; Pournamazian Najafabadi, E.; Esmailpur Estekanchi, H.; Ozbakkaloglu, T. Performance-Based Seismic Design and Assessment of Low-Rise Steel Special Moment Resisting Frames with Block Slit Dampers Using Endurance Time Method. Eng. Struct. 2020, 224, 110955. [Google Scholar] [CrossRef]
- Houshmand-Sarvestani, A.; Totonchi, A.; Shahmohammadi, M.A.; Salehipour, H. Numerical Assessment of the Effects of ADAS Yielding Metallic Dampers on the Structural Behavior of Steel Shear Walls (SSWs). Mech. Based Des. Struct. Mach. 2023, 51, 1626–1644. [Google Scholar] [CrossRef]
- Keykhosro Kiani, B.; Hosseini Hashemi, B.; Torabian, S. Optimization of Slit Dampers to Improve Energy Dissipation Capacity and Low-Cycle-Fatigue Performance. Eng. Struct. 2020, 214, 110609. [Google Scholar] [CrossRef]
- Zhao, B.; Lu, B.; Zeng, X.; Gu, Q. Experimental and Numerical Study of Hysteretic Performance of New Brace Type Damper. J. Constr. Steel Res. 2021, 183, 106717. [Google Scholar] [CrossRef]
- Kim, D.K.; Dargush, G.F.; Hu, J.W. Cyclic Damage Model for E-Shaped Dampers in the Seismic Isolation System. J. Mech. Sci. Technol 2013, 27, 2275–2281. [Google Scholar] [CrossRef]
- Li, H.-N.; Li, G. Experimental Study of Structure with “Dual Function” Metallic Dampers. Eng. Struct. 2007, 29, 1917–1928. [Google Scholar] [CrossRef]
- Jarrah, M.; Khezrzadeh, H.; Mofid, M.; Jafari, K. Experimental and Numerical Evaluation of Piston Metallic Damper (PMD). J. Constr. Steel Res. 2019, 154, 99–109. [Google Scholar] [CrossRef]
- Garivani, S.; Aghakouchak, A.A.; Shahbeyk, S. Numerical and Experimental Study of Comb-Teeth Metallic Yielding Dampers. Int. J. Steel Struct. 2016, 16, 177–196. [Google Scholar] [CrossRef]
- Naimi, S.; Celikag, M.; Hedayat, A.A. Ductility Enhancement of Post-Northridge Connections by Multilongitudinal Voids in the Beam Web. Sci. World J. 2013, 2013, 515936. [Google Scholar] [CrossRef]
- Koroglu, M.A.; Koken, A. Dere Use of Different Shaped Steel Slit Dampers in Beam to Column Connections of Steel Frames under Cycling Loading; The Hong Kong Institute of Steel Construction: Hong Kong, China, 2018. [Google Scholar]
- Smith, M. ABAQUS/Standard User’s Manual, Version 6.11; Dassault Systemes Simulia Corp: Johnston, RI, USA, 2009. [Google Scholar]
- Galambos, T.V. Specification for Structural Steel Buildings, Supersedes the Specification for Structural Steel Buildings dated June 7, 2016, and all previous versions; American Institute of Steel Construction: Chicago, IL, USA, 2022. [Google Scholar]
- Krolo, P.; Grandić, D.; Smolčić, Ž. Experimental and Numerical Study of Mild Steel Behaviour under Cyclic Loading with Variable Strain Ranges. Adv. Mater. Sci. Eng. 2016, 2016, 7863010. [Google Scholar] [CrossRef]
- KDS 41 17 00; Seismic Building Design Code. Korean Design Standard: Seoul, Republic of Korea, 2019.
- ASTM A36/A36M-19; ASTM Standard Specification for Carbon Structural Steel. ASTM International: West Conshohocken, PA, USA, 2019.
- American Society of Civil Engineers. Minimum Design Loads and Associated Criteria for Buildings and Other Structures, 7th ed.; American Society of Civil Engineers: Reston, VA, USA, 2017; ISBN 978-0-7844-1424-8. [Google Scholar]
- Chopra, A.K. Dynamics of Structures: Theory and Applications to Earthquake Engineering; Prentice-Hall International Series in civil Engineering and Engineering Mechanics; Prentice Hall: Englewood Cliffs, NJ, USA, 1995; ISBN 978-0-13-855214-5. [Google Scholar]


Disclaimer/Publisher’s Note: The statements, opinions and data contained in all publications are solely those of the individual author(s) and contributor(s) and not of MDPI and/or the editor(s). MDPI and/or the editor(s) disclaim responsibility for any injury to people or property resulting from any ideas, methods, instructions or products referred to in the content. |
© 2023 by the authors. Licensee MDPI, Basel, Switzerland. This article is an open access article distributed under the terms and conditions of the Creative Commons Attribution (CC BY) license (https://creativecommons.org/licenses/by/4.0/).