Article

Building Surface Crack Detection Using Deep Learning Technology

1
Faculty of Architecture and Art, Zhejiang College of Construction, Hangzhou 311215, China
2
Faculty of Innovation and Design, City University of Macau, Macau, China
3
School of Information and Electronic Engineering, Zhejiang University of Science and Technology, Hangzhou 310023, China
4
School of Art and Design, Beijing Forestry University, Beijing 100107, China
*
Author to whom correspondence should be addressed.
Buildings 2023, 13(7), 1814; https://doi.org/10.3390/buildings13071814
Submission received: 24 June 2023 / Revised: 10 July 2023 / Accepted: 14 July 2023 / Published: 17 July 2023
(This article belongs to the Special Issue Application of Computer Technology in Buildings)

Abstract

:
Cracks in building facades are inevitable due to the age of the building. Cracks found in the building facade may be further exacerbated if not corrected immediately. Considering the extensive size of some buildings, there is definitely a need to automate the inspection routine to facilitate the inspection process. The incorporation of deep learning technology for the classification of images has proven to be an effective method in many past civil infrastructures like pavements and bridges. There is, however, limited research in the built environment sector. In order to align with the Smart Nation goals of the country, the use of Smart technologies is necessary in the building and construction industry. The focus of the study is to identify the effectiveness of deep learning technology for image classification. Deep learning technology, such as Convolutional Neural Networks (CNN), requires a large amount of data in order to obtain good performance. It is, however, difficult to collect the images manually. This study will cover the transfer learning approach, where image classification can be carried out even with limited data. Using the CNN method achieved an accuracy level of about 89%, while using the transfer learning model achieved an accuracy of 94%. Based on this, it can be concluded that the transfer learning method achieves better performance as compared to the CNN method with the same amount of data input.

1. Introduction

Due to the high population density, the density of high-rise buildings is quite high in China. Since the exterior facades of these high-rise buildings are usually complex, it is necessary to conduct regular quality inspections on the exterior facades of high-rise buildings. According to regulations, periodic inspection and maintenance are required for residential buildings every 10 years to ensure their structural integrity and safety. The inspectors also have to guarantee that the elements inside the facade are intact and pose no threat to residents and pedestrians [1]. Unfortunately, defects in the facade are inevitable, which may attribute to other factors such as the age of the building, material composition, and local environmental climate. Rainwater or corrosive solutions may flow into the interior of the building along defects in the facade, e.g., cracks in the exterior wall, resulting in irreversible corrosion to the steel bars. It is worse that rainfall further increases the risk of fluid seeping into facades, which increases significantly with the age of buildings. Such damage deteriorates the waterproofing of the building, and corrosion of the steel bars can affect the structural integrity of the building [2]. Therefore, it is urgent to timely identify and handle these defects on building surfaces.
Traditionally, an inspection is mainly completed by professional inspectors on the spot, which is time-consuming and labor-intensive. Since the accuracy of the inspection depends on the inspector’s personal experience and technical ability, there exists an enormous difference in the inspection results. Furthermore, manual inspections are usually carried out on large equipment (e.g., boom lifts), posing great safety risks [3]. Over time, the number of buildings in Chinese cities that are more than 30 years old has been growing. Considering the height of the building and the number of buildings to be inspected, such an onerous amount of manual inspection is impossible to complete. Shugar et al. [4] discussed the important applications of deep learning technology in detecting natural disasters. In the early detection phase, deep learning models can analyze satellite images, drone footage, etc., to detect visual patterns related to potential natural disasters. After a natural disaster occurs, deep learning algorithms can analyze images captured during or after the event to assess the extent of damage. By analyzing historical data on avalanches and related environmental factors using deep learning algorithms, risk maps can also be generated. By providing detailed risk maps, decision-makers can better plan infrastructure development, evacuation routes, and disaster management strategies. Currently, deep learning technology has attracted a lot of attention as it is a complex machine learning algorithm with achievements in speech and image recognition that far exceed previous related technologies [5]. Deep learning is able to learn the internal laws and presentation levels of the sample data. The information obtained in the learning process is helpful to the interpretation of data (e.g., text, images, and sounds). Deep learning has made many achievements in search technology, data mining, machine learning, machine translation, natural language processing, multimedia learning, recommendation and personalization technology, and other related fields. It enables machines to imitate human activities, such as audiovisual and thinking, solving many complex pattern recognition problems, which furthers the significant progress made in artificial intelligence-related technologies. Such deep learning technology opens the possibilities for the intelligent detection of building facade defects.
In this paper, we assess the effectiveness of deep learning for building surface crack inspection. This study focuses on the use of deep learning technology for image classification and proposes a Convolutional Neural Network (CNN)-based algorithm in terms of identifying cracks on building surfaces in China [6,7]. The study evaluates the image classification model through the use of performance indicators, e.g., accuracy. The model is not sensitive to the materials of high-rise building exterior walls, including image processing, machine learning, and deep learning methods for building crack detection methods. In fact, the main focus is on the shape and texture features of cracks and is not limited to the effect of exterior wall materials. Golding et al. [8] proposed a method of using a Convolutional Neural Network to detect cracks in building exterior walls. The method focuses more on the segmentation and feature extraction of cracks and does not pay attention to the building materials of exterior walls. After training, the best results are achieved. The performance of the model improves at a greater rate with more training.

2. Related Work

2.1. Current Status of Surface Crack Detection

In order to evaluate current building inspection and crack detection methods, it is critical to understand the current situation of building cracks and the challenges of physical detection.
According to Drukis’s work [9], many inspectors are exposed to certain risks when entering tall buildings, such as falls, slips, collisions, burns, electrocution, and even explosion injuries. In addition, many other risks, such as inappropriate climbing structures, hazards associated with heights, biohazards, heat stress, cold exposure, and noise, are identified. These risks, especially working at high heights, have attracted the attention of construction industry management since high-rise buildings have become common in coastal cities in recent decades. As a result, construction industry researchers have been calling for new methods to be proposed to eliminate these safety risks. Previously, Drukis also [9] argued that current building inspections are usually carried out through manual labor methods, which are laborious, time-consuming, and inefficient.
Worse, the results of manually conducted building surface health inspections are highly subjective [10]. Each inspector has his or her own opinion, leading to differences in the distinction between “adequate” and “inadequate” inspections; the specific building surface cracks are shown in Figure 1. Visual inspection is essential when performing maintenance and operational work on building surfaces. However, there is no unified standard to regulate these inspections, which may vary from one person to another with different skill levels and years of experience [11]. At present, manual detection is difficult to meet the needs of surface damage identification, prompt repair, and prevention of further deterioration.

2.2. Deep Learning Technology Used for Crack Detection

Considering the various problems faced by the current traditional inspection methods, computer vision methods have been extensively studied and are gradually becoming capable of automatically detecting defects on building surfaces. At present, deep learning methods have been adopted by many researchers in the building industry, such as automation design and optimization in building design, automatic control and optimization in intelligent buildings, building safety monitoring and prediction, and automated detection and repair in building maintenance [12]. It has been proven that deep learning performs well on related tasks. For example, the NB-CNN proposed by Chen et al. [13] and the DDLNet proposed by Li et al. [14] used bounding boxes to locate objects for anomaly detection and performance in image detection. Unfortunately, such image detection requires a large amount of labeled data, which in turn pushes up the computational cost and requires a lot of time on labeled data. Kim et al. [15] proposed a model based on a shallow Convolutional Neural Network (CNN) to detect cracks on the surface of concrete. The model does not require high-quality images or advanced computing devices. It can monitor cracks on the concrete surface in real time, and optimizing the model’s hyperparameters more meticulously can lead to higher accuracy. Their research focuses on introducing and evaluating new architectures, aiming to highlight the unique features and strengths of their proposed models. Furthermore, further studies and comparative studies may be required to validate and generalize the results in different scenarios or datasets. Future research can consider exploring the performance of the developed CNN architecture compared to other popular models to provide a more comprehensive assessment of its capabilities and limitations. Katsigiannis et al. [16] proposed a deep learning approach based on transfer learning for crack detection on masonry facades. They specifically optimized the detection model to make it applicable to different types of brick walls. Lee et al. [17] proposed an architectural facade detection method that uses faster regions with a Convolutional Neural Network (Faster R-CNN), which can detect a wider range of building facade defects in the real world. Chen et al. [18] captured images of facade cracks using drones, which were then fed into a Convolutional Neural Network (CNN) for training. Finally, segmentation was performed using the U-Net neural network model. Experimental results demonstrate that this method can improve the reliability and efficiency of crack detection and can be extended to detect other types of exterior wall anomalies. Cha et al. [19] applied CNN to classify images and scanned images using a sliding window strategy for image recognition, which achieves the detection of the entire image through the classification of the individual components of a concrete image. This method is effective in detecting cracks, but it is also limited by the low accuracy of detection based on the fineness of region division and unrealizable pixel-level image detection. Further, deep learning architectures (e.g., Visual Geometry Group 16 (VGG16) [20], ResNet [21], AlexNet [22]) and transfer learning [23] have been proposed to improve learning efficiency.

3. Method

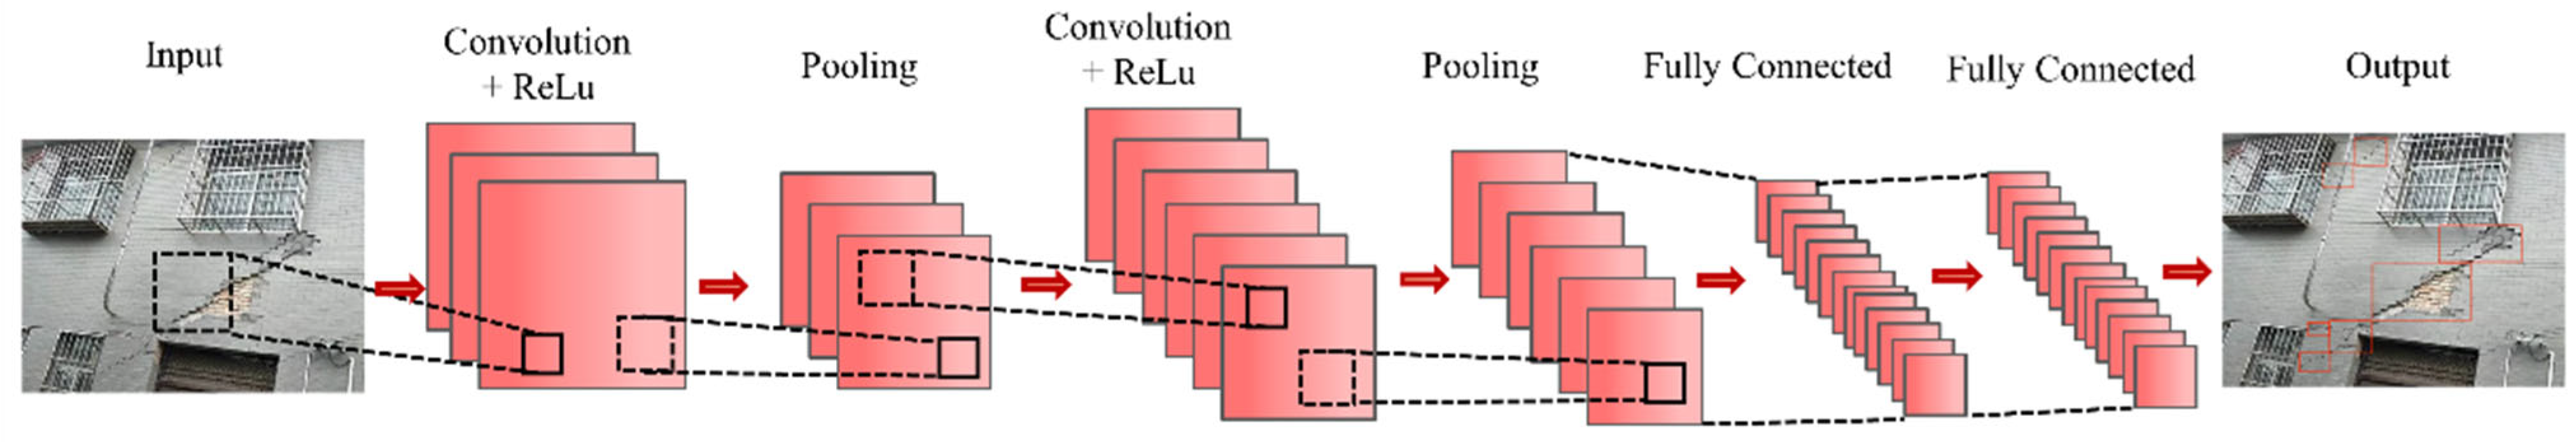
3.1. Overview of CNN-Based Crack Detection Framework

An automatic detection method for cracks on the surface of buildings was designed through the CNN-based model, as shown in Figure 2, which consists of the formation of the input layer, hidden layer, and Rectified Linear Unit (ReLU) layer [23]. The input layer receives image pixels in the form of arrays, and each block of the image is labeled in different arrays. The hidden layer implements feature extraction by performing certain calculations and operations, which can identify parts of the image in various ways until the neural network obtains comprehensible data. A matrix filter is used to perform a convolution operation to detect patterns in the image. Convolution means coiling or twisting, in which the data are twisted and changed to finally obtain a new pattern for detection. Further, there are multiple hidden layers in the model, such as the convolution layer, ReLU layer, and pooling layer, performing feature extraction from the image. The ReLu layer is related to the activation method used while pooling layers use multiple layers to detect edges, corners, etc., which are used to bring information together. Finally, there is a fully connected layer that is used to identify objects in the image. Thus, these different layers pass through the hidden layer and then enter the final region, where we have a node or neural network entity lit up and categorized as a crack.

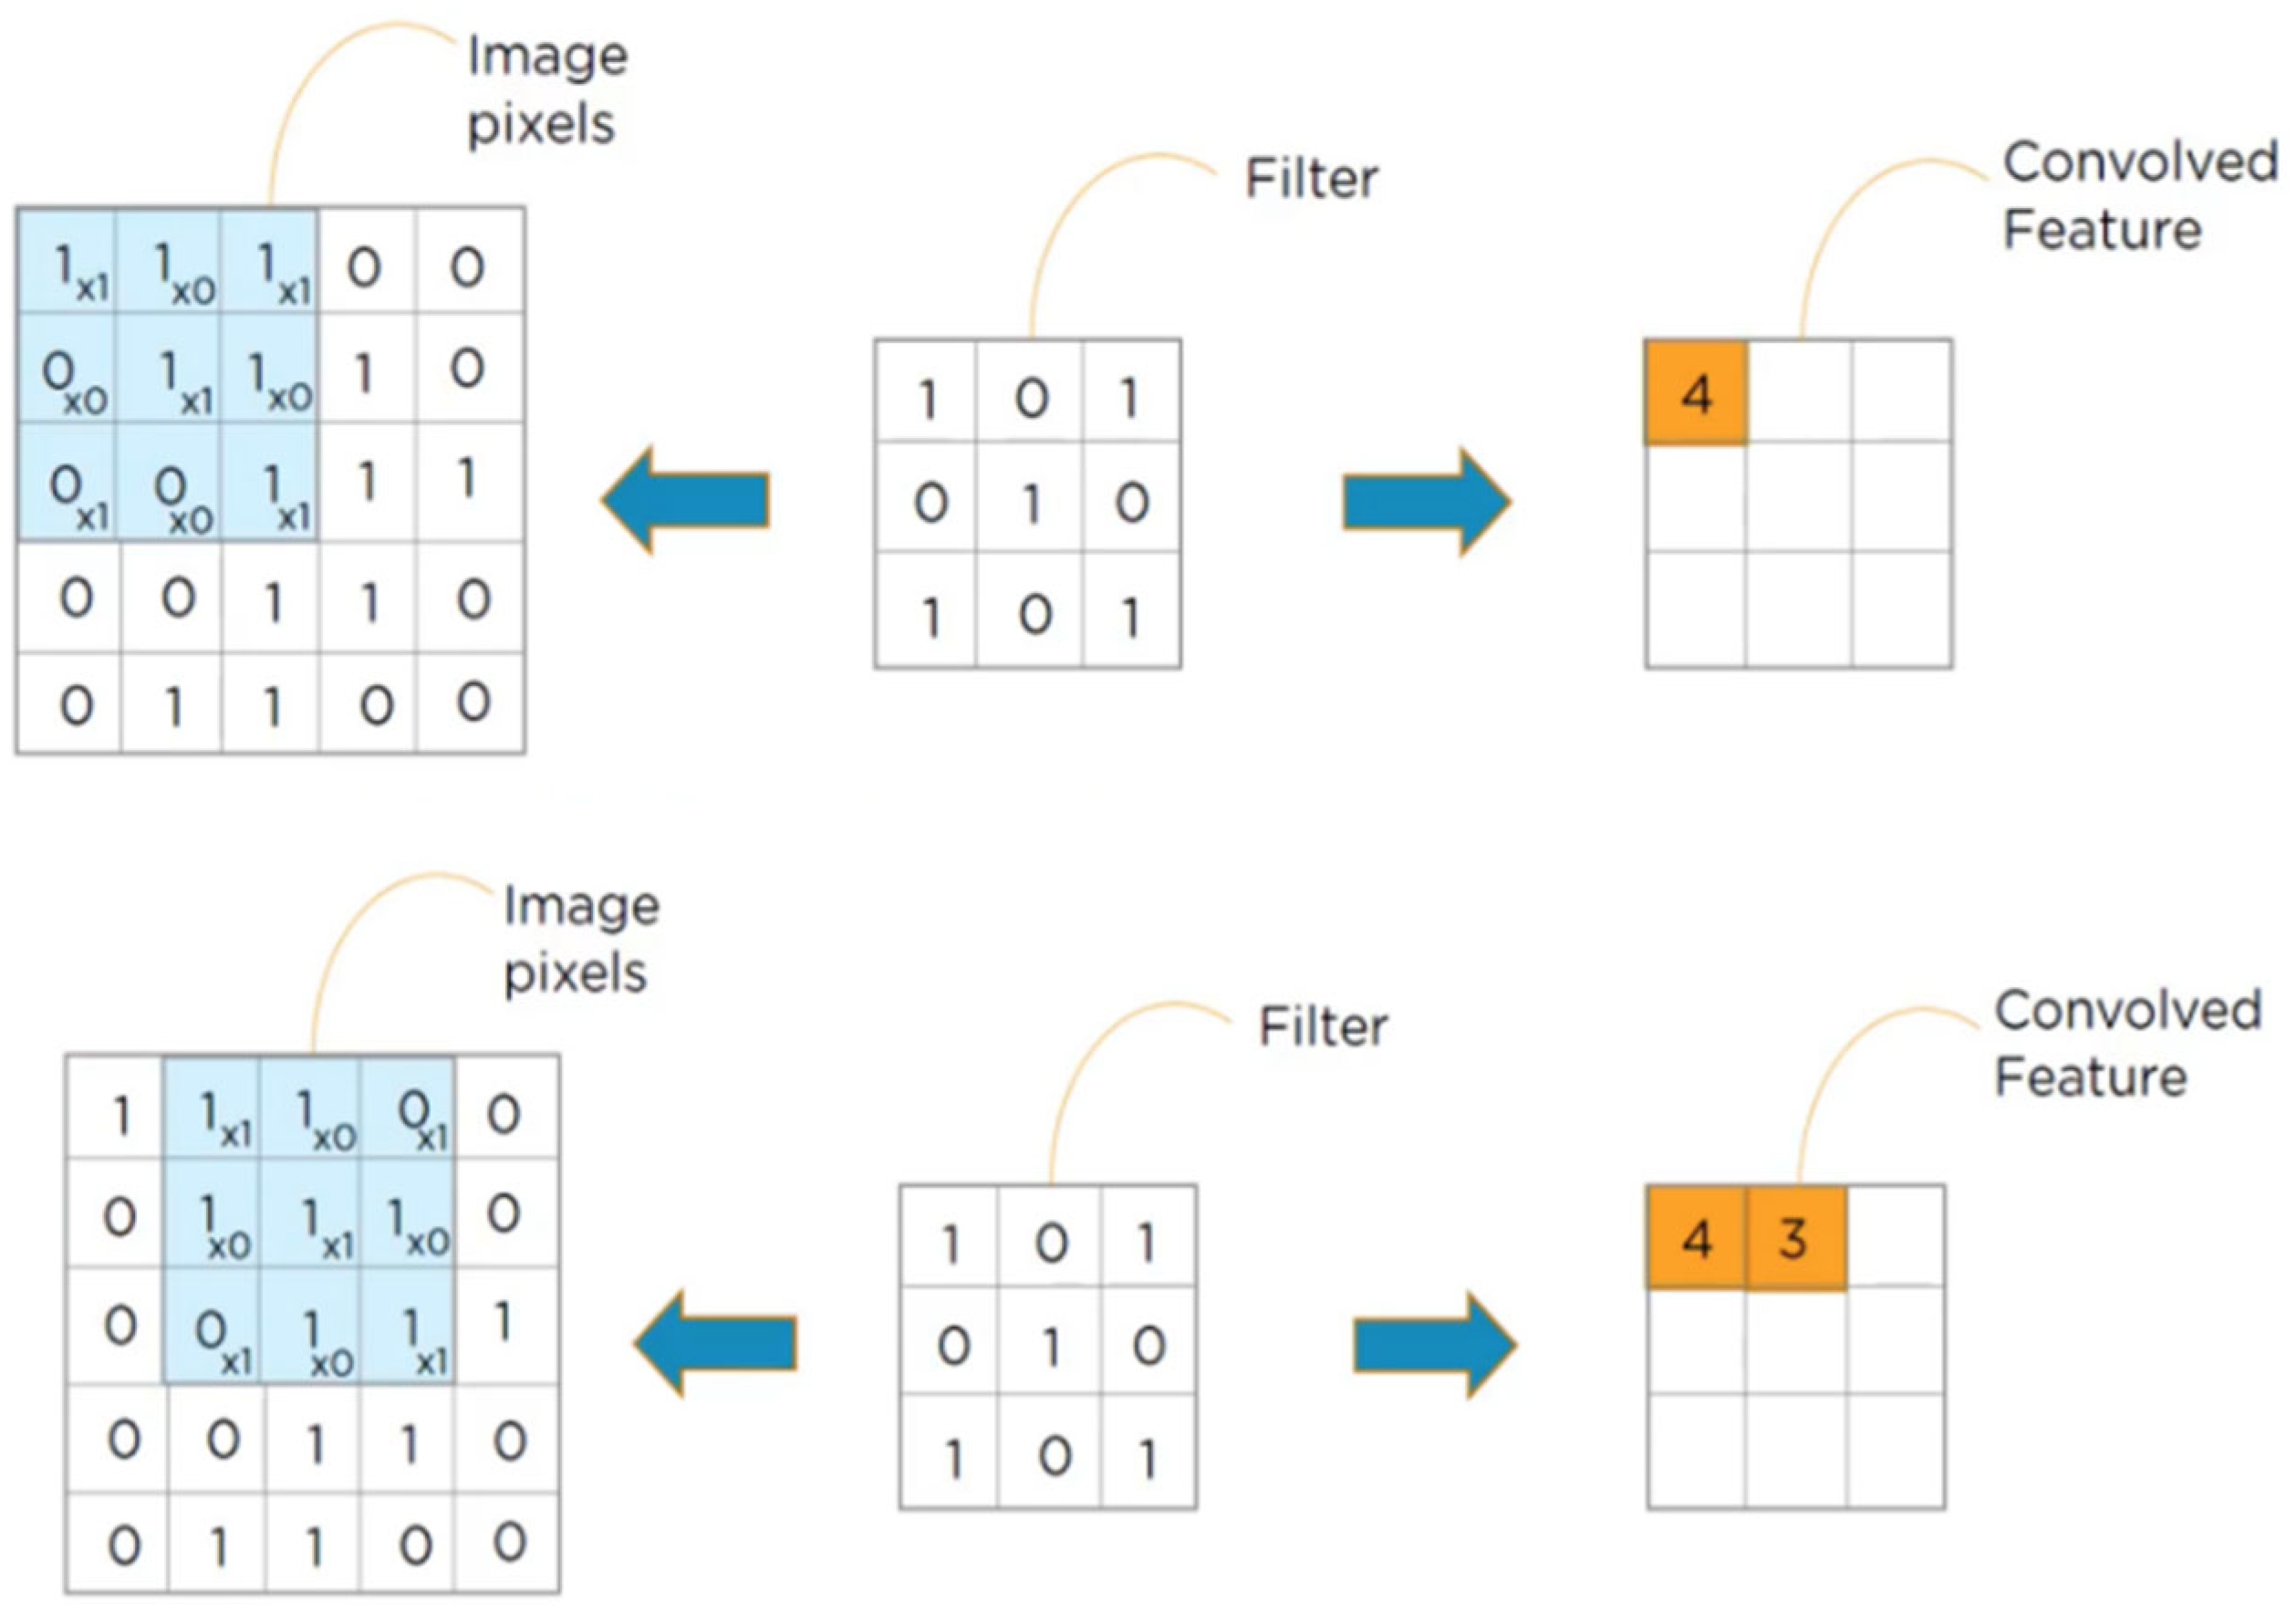
3.2. Convolutional Layer

The convolutional layer consists of a two-dimensional matrix and filter, and the filter will multiply the image matrix in the upper left image. For the 5 × 5 image with a filter size of 3 × 3, the convolved feature of the crack can be identified by multiplying and summing them up [24]. Then, slide the filter matrix over the image and compute the dot product to detect patterns at the stride of 1, specifically as shown in Figure 3. Here, the stride refers to the number of rows and columns (in pixels) by which a filter shifts across the input matrix. Although a large stride may reduce the output size and computational cost, it may lose features of the input data. In order to cope with the shrinking output and the loss of features at the edges of the image, the image (or output) is often padded. “Valid” padding refers to no padding, whereas “same” padding indicates that the output size is padded in equal proportions to the input size. A smaller matrix will be created with the same features by sliding the matrix over 1 stride.

3.3. ReLU Layer

When the feature maps are extracted, the subsequent step involves passing them through the ReLU layer using an element-wise operation. Any negative pixel values are then truncated to 0. This introduces linearity into the network as the resulting feature values can range from 0 up to the output value derived from the matrix. With a value range of −10 to 10, these features can potentially capture edges or other important visual patterns when set to 1. Finally, the output consolidates all these filtered features, leading to the acquisition of a rectified feature map.

3.4. Max Pooling Layer

Pooling is a crucial down-sampling operation employed in neural networks to reduce the dimensionality of the feature map [25]. The rectified feature map, which has undergone activation through a non-linear function, is subsequently processed by a pooling layer. This layer plays a vital role in condensing a vast amount of information into a single response, facilitating manageable data representation. Within the pooling layer, the rectified feature map undergoes a filtering and reduction process, progressively extracting salient features. Max pooling, a commonly used pooling technique, selects the maximum value from each local region of the rectified feature map. By capturing the most dominant features within each region, max pooling effectively prioritizes important information for further analysis. The pooling layer utilizes various filters to identify distinct elements of the input image, such as edges and corners. This enables the network to extract relevant spatial features and abstract representations that contribute to higher-level visual understanding. Through this process, the pooling layer aids in reducing computational complexity while preserving essential information for subsequent layers in the neural network architecture.

3.5. Fully Connected Layer

To process the pooled feature maps, a fully connected layer is employed to reduce their dimensions or flatten them. Flattening refers to converting the resulting two-dimensional arrays from the pooling layer into a single continuous linear vector. This flattened matrix is then passed as input to the fully connected layer for image classification [26]. During forward propagation, each pixel from the flattened matrix serves as input and undergoes weight reduction within the network. This process ultimately determines the type of image being classified.

3.6. Hidden Layers

During the initial stages of training, the weight values are randomly assigned, leading to predicted classes that differ from the actual classes [27]. To address this, a loss function is defined to measure the disparity between the predicted and actual classes. This loss function outputs either a value of one or zero: one if the input image matches the class and zero otherwise. By utilizing backpropagation, the weight adjustments are made iteratively to minimize the deviation. In a study conducted by LeCun, the Stochastic Gradient Descent (SGD) algorithm was proposed as an efficient and simple method to reduce the deviation. It efficiently finds specific weights that minimize a given loss function [28].
Backpropagation is an algorithm that determines how a single training example nudges the weight and biases. In addition, backpropagation can also determine the relative proportion of the increase or decrease. A true gradient descent step would involve tens of thousands of training examples and the average of the desired changes. Since the computation is slow, the data will be subdivided into mini-batches, and each step is computed with respect to a mini-batch [29]. In order to converge a local minimum loss function, all the mini-batches need to be checked repeatedly, and the necessary adjustments need to be made, showing that the network is performing well on the training model.

3.7. Deep Residual Learning

CNN is a deep learning model that can automatically extract useful features from images for tasks such as image classification and object detection. VGG network, on the other hand, is a classic CNN architecture that adopts a deeper network structure. It extracts higher-level image features by stacking multiple convolutional and pooling layers. In order to counter the problem of degradation as the accuracy becomes saturated with deeper networks, a deep residual learning framework is proposed. He suggested that the weight of the multiple nonlinear layers is easier to push to zero (G (x) = 0) than to fit the identity map (x, input = output) if optimal identity mapping is achieved [20]. Since G (x) = 0 is easier to reach than G (x) = x, G (x) is known as a residual function. Residual learning is adopted to every few stacked layers.

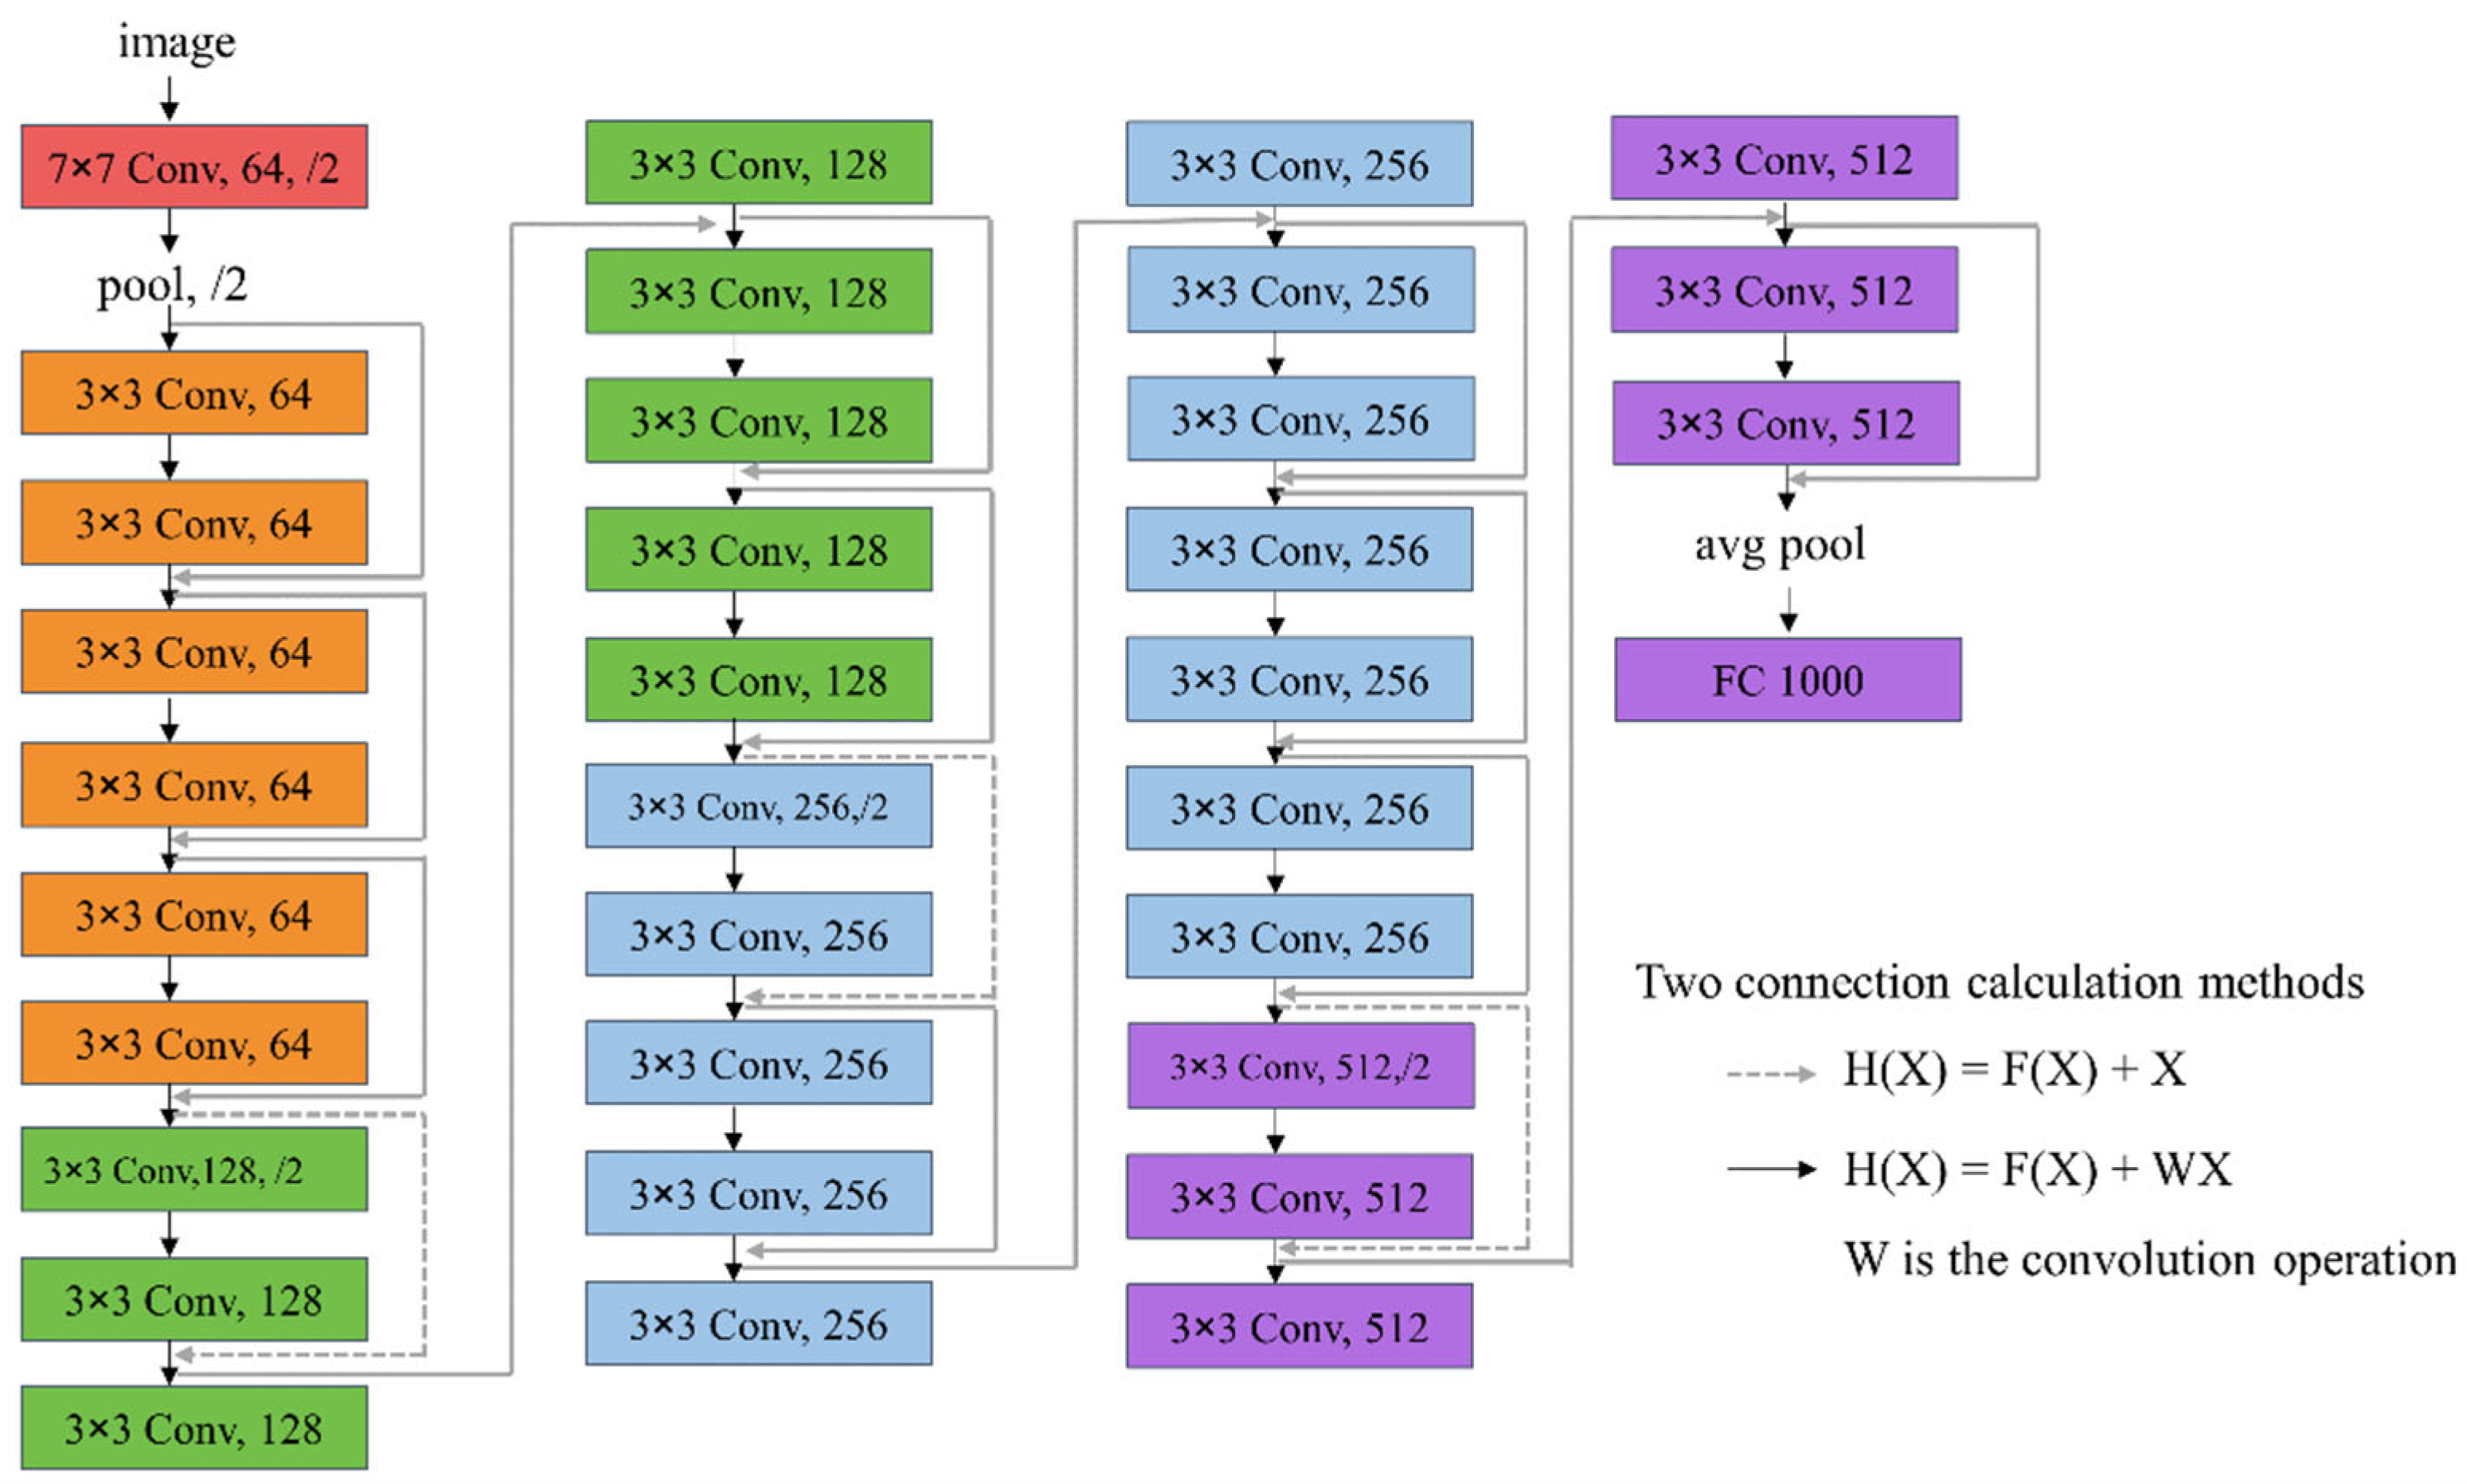
3.8. Network Structure

The VGG net architecture has significantly influenced the development of plain baselines. With a total of 33 filters, the convolutional layers in this network adhere to specific rules aimed at balancing computational efficiency: (1) Each layer maintains the same number of filters for an identical output feature map size. (2) When halving the feature map size, the number of filters is doubled. The down-sampling operation is directly applied by convolutional layers with a stride of 2. Ultimately, the network concludes with a global average pooling layer and a 1000-way fully connected layer with Softmax activation [25]. In Figure 4, the total number of layers is counted as 34.
The baseline architectures closely resemble the plain nets. For each pair of the 33 filters, a shortcut connection is introduced with identity mapping. Zero-padding is utilized for the expanding dimensions (Option A), as illustrated in the first comparison. This means that no additional parameters are required compared to the plain counterparts. Experimental results from He’s study indicate that the 34-layer ResNet outperforms the 18-layer counterpart [20]. Furthermore, the 34-layer ResNet exhibits lower training errors and demonstrates better generalization on validation data. These findings suggest that the problem of degradation is overcome, and increasing the depth leads to higher accuracy. It has been confirmed that residual learning in extremely deep networks is effective, providing faster convergence in the early stages of training and facilitating optimization [30].

4. Experiment

4.1. Experiment Setting

A transfer learning approach with a pre-trained ResNet101 model is adopted to assess the effectiveness of detecting surface cracks from building images. The algorithms are implemented by PyTorch (https://pytorch.org; accessed on 23 June 2023), and these building crack images were taken from coastal cities in China. Firstly, a crack image is cropped and resized to 224 × 224 pixels. The dataset, including 3600 images, is divided into images including cracks (positive samples) and images without cracks (negative samples). As shown in Table 1, there are 2846 images used for the training and 754 images used for testing.
In order to evaluate the accuracy of the crack detection, intersection over union (IoU), sensitivity (SEN), specificity (SPE), and Dice similarity coefficient (DSC) are used. Here, precision represents the probabilities of positive classification, which turns out to be corrected, as shown in Equation (5). SEN (Recall) indicates the probabilities of actual positive classified correctly, as shown in Equation (2). IoU is used to measure the degree of overlap between the predicted results and the real labels, which can provide a quantitative evaluation of the matching degree between the predicted results and the real labels, as shown in Equation (1). DSC (F1) is an overall indicator of a model’s accuracy, which combines both precision and recall, as shown in Equation (4). Specificity (SPE) is a commonly used performance measure to evaluate the ability of binary classification models to recognize negative instances. The SPE value ranges from 0 to 1, with higher values indicating a stronger ability of the model to identify negative cases, as shown in Equation (3). These metrics can be calculated as follows:
IoU   = T P T P + F P + F N
SEN ( Recall ) = T P T P + F N
SPE   = T N T N + F P
DSC ( F 1 ) = 2 T P 2 T P + F P + F N
Precision = T P T P + F P
where TP denotes true positives, TN denotes true negatives, FP denotes false positives, and FN denotes false negatives.

4.2. Experiment Preparation

The experiment was carried out with Intel® Xeno i7 CPU on Ubuntu 20.2 and accelerated using an NVIDIA Titan RTX GPU with 48 GB memory (manufactured by Nvidia, Santa Clara, CA, USA). It was challenging to obtain a sufficient dataset in the real world. Hence, data augmentation (e.g., Keras) was introduced to increase the dataset as well as improve the training performance of the CNN. It was the easiest method to cut down overfitting on the image data. There are two types of augmentation: position augmentation and color augmentation. Position augmentation includes flipping and rotation, while color augmentation includes brightness, contrast, saturation, hue, and grayscale.
The ResNet is trained with a learning rate of 0.001 and a mini-batch size of 50. The momentum is set to 0.9, and the decay learning rate is set by a factor of 0.1/5 epoch. There are two classification models: (1) CNN model without transfer learning and (2) CNN model with transfer learning.

4.3. Experiment Result

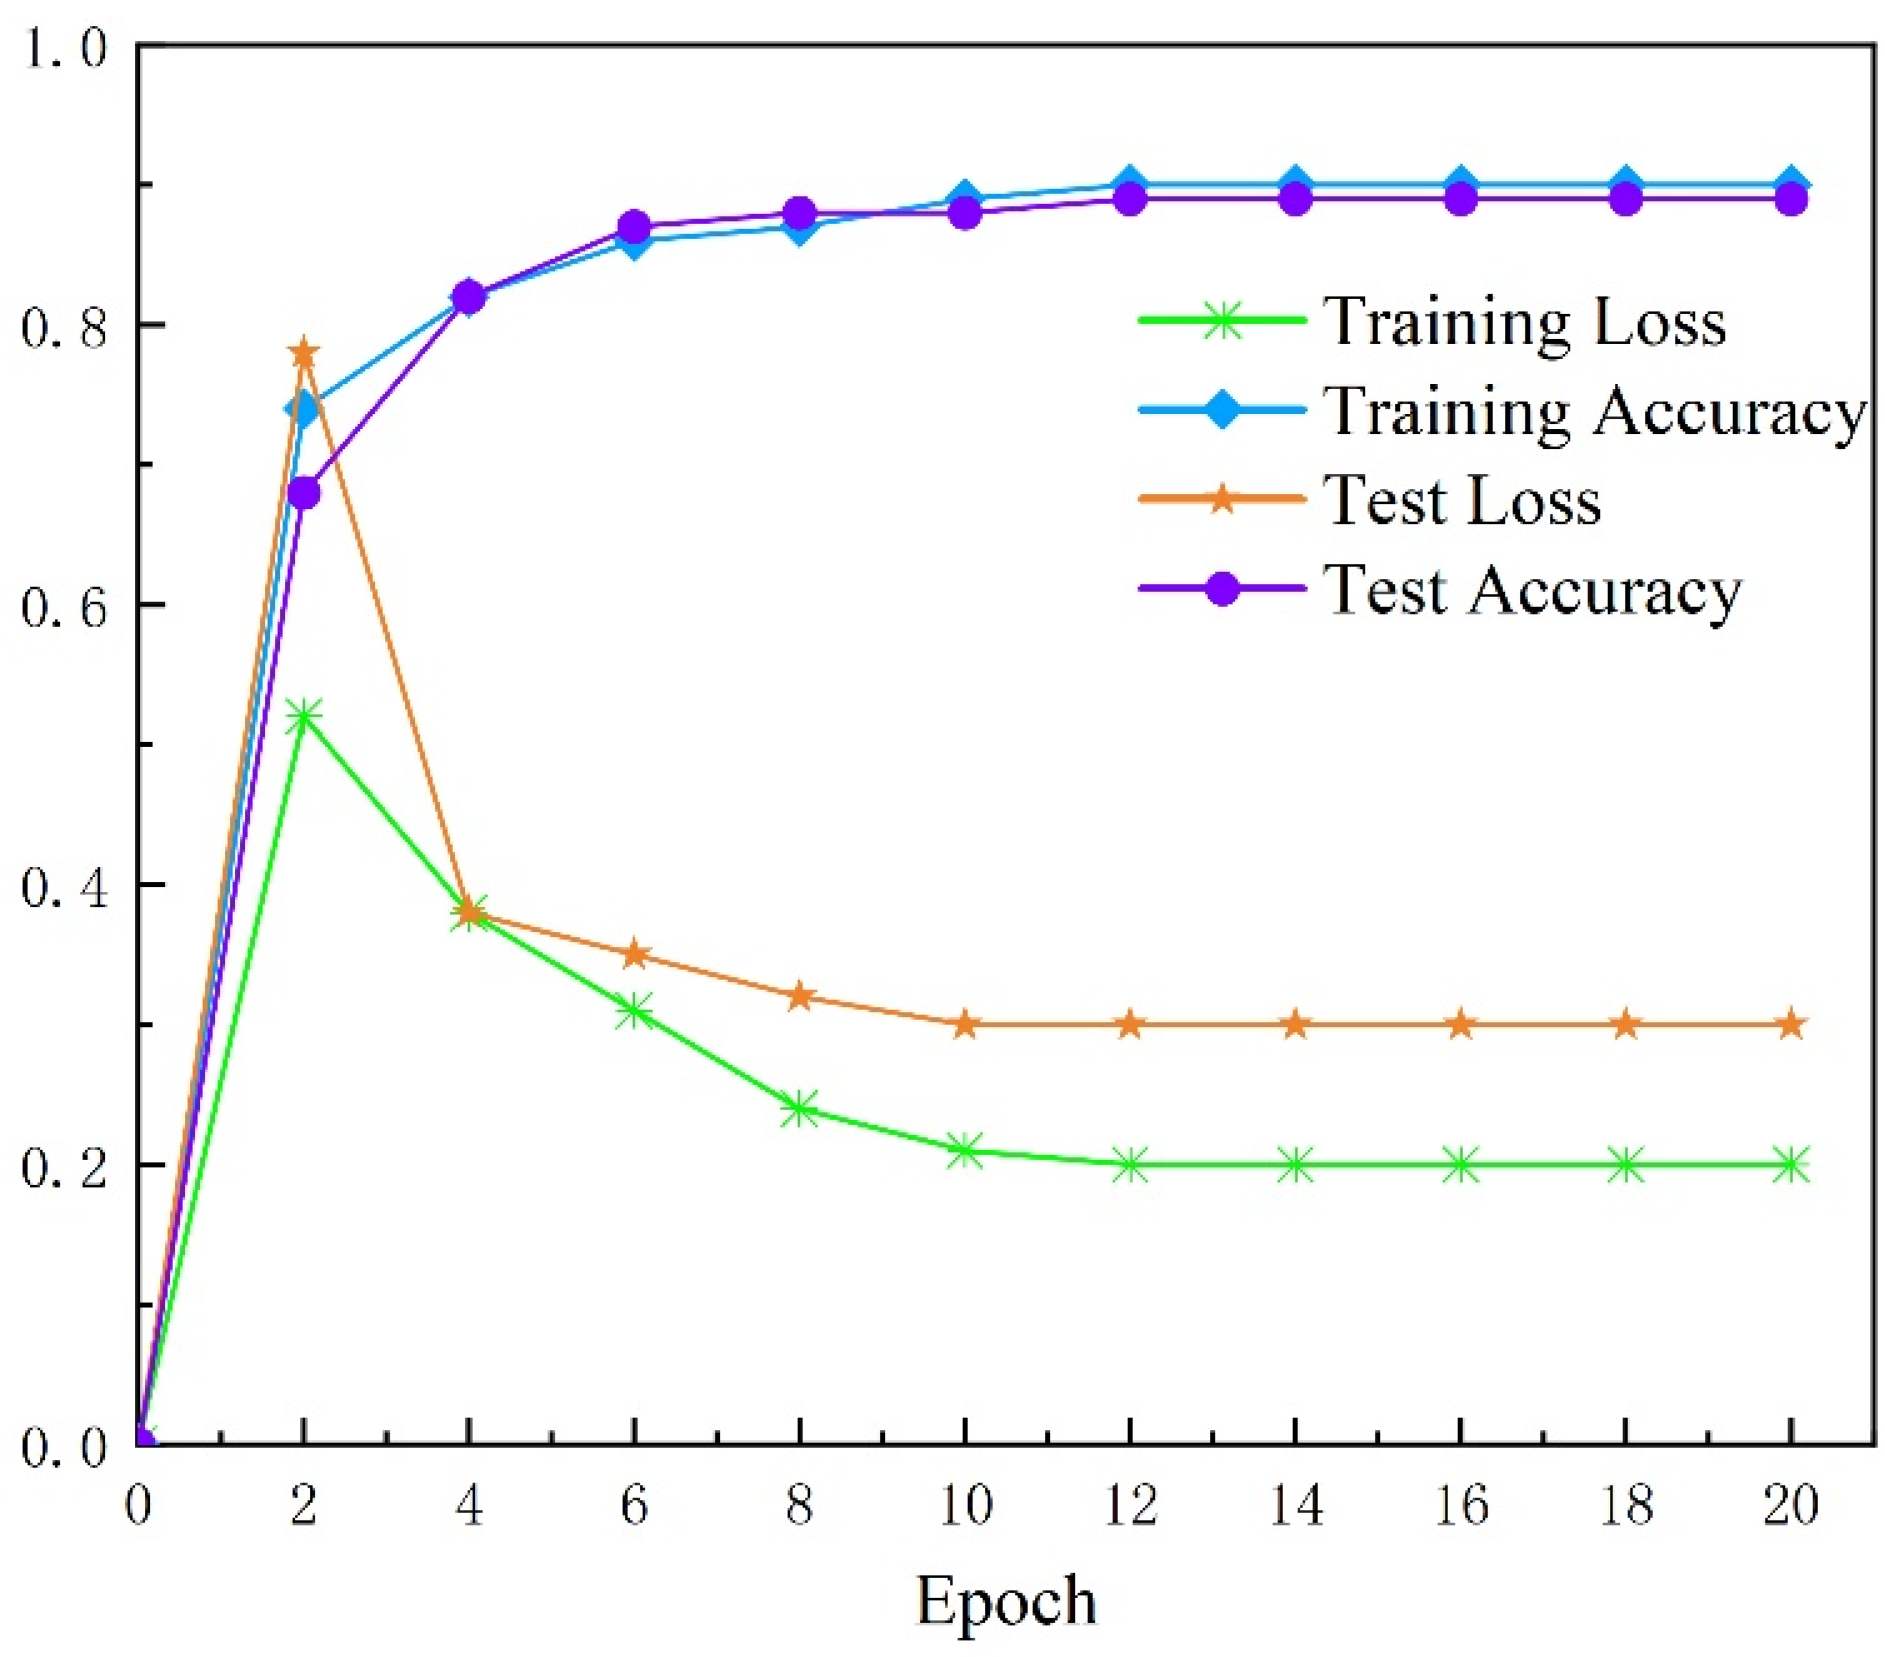
4.3.1. Evaluation of the Result with Basic CNN with Image Augmentation

The accuracy and loss during the training using the basic CNN model with image augmentation per epoch are illustrated in Figure 5. An epoch represents a singular forward pass, as well as a singular backward pass, through all training data. For the comparison, it was first carried out and trained up to 20 epochs with a mini-batch size of 50. It is noted that, from the first epoch to the fifth epoch, the loss and accuracy are not stable. However, the accuracy starts to stabilize after the fifth epoch, and the loss is minimized after the fifth epoch as well. The highest accuracy of this model is 0.9, which is considered a good performance model. The minimum loss value is around 0.2, showing that there is a higher probability that the predicted label will be different from the actual label.
The accuracy and loss during the test show that the accuracy starts to stabilize after the fifth epoch, and the loss is minimized after the sixth epoch. The highest accuracy of this model is 0.8892 at the 16th epoch, which is considered a good performance model. The minimum loss value is higher than that of during training, suggesting that the model is slightly overfitting. Slight overfitting may have a minor effect on the results and usually does not have a significant negative impact on the results. In our study, we conducted some experiments to choose an appropriate stopping condition and avoid overfitting. We monitor the training process of the model according to the performance indicators (such as accuracy rate, loss function, etc.) on the validation set and stop the training early when needed. We also performed some hyperparameter tuning to ensure the model performed at the best level on the validation set.
For the best precision, the recall and F1 values are 0.89, 0.93, and 0.89, respectively. A precision value of 0.89 means that 89% of the predictions of cracks are correct. The model also achieved a high recall value of 0.93, indicating that the model has 93% reliability in classifying real cracks correctly. It is considered a relatively good model as it shows low false negative and false positive detection. A normalized confusion matrix is shown in Figure 6, which interprets how the label is predicted. The value of diagonal elements represents the high degree of correctly predicted classes. However, the false negative rate is also higher for cracks than non-cracks, which means that it is easier to wrongly classify a crack image as a no-crack image. Such a result is dangerous during the crack classification. On the other hand, the true positive rate is higher for non-crack than crack, demonstrating that the model predicts non-crack more accurately than crack.
As shown in Figure 7, it indicates that the classifier correctly separates the crack and non-crack correctly 80% of the time. However, since the AUC is not 1, the model has type 1 and type 2 errors, where a crack is judged as a non-crack. The curve leans towards the top left corner, indicating the classifier is still good at identifying a crack.

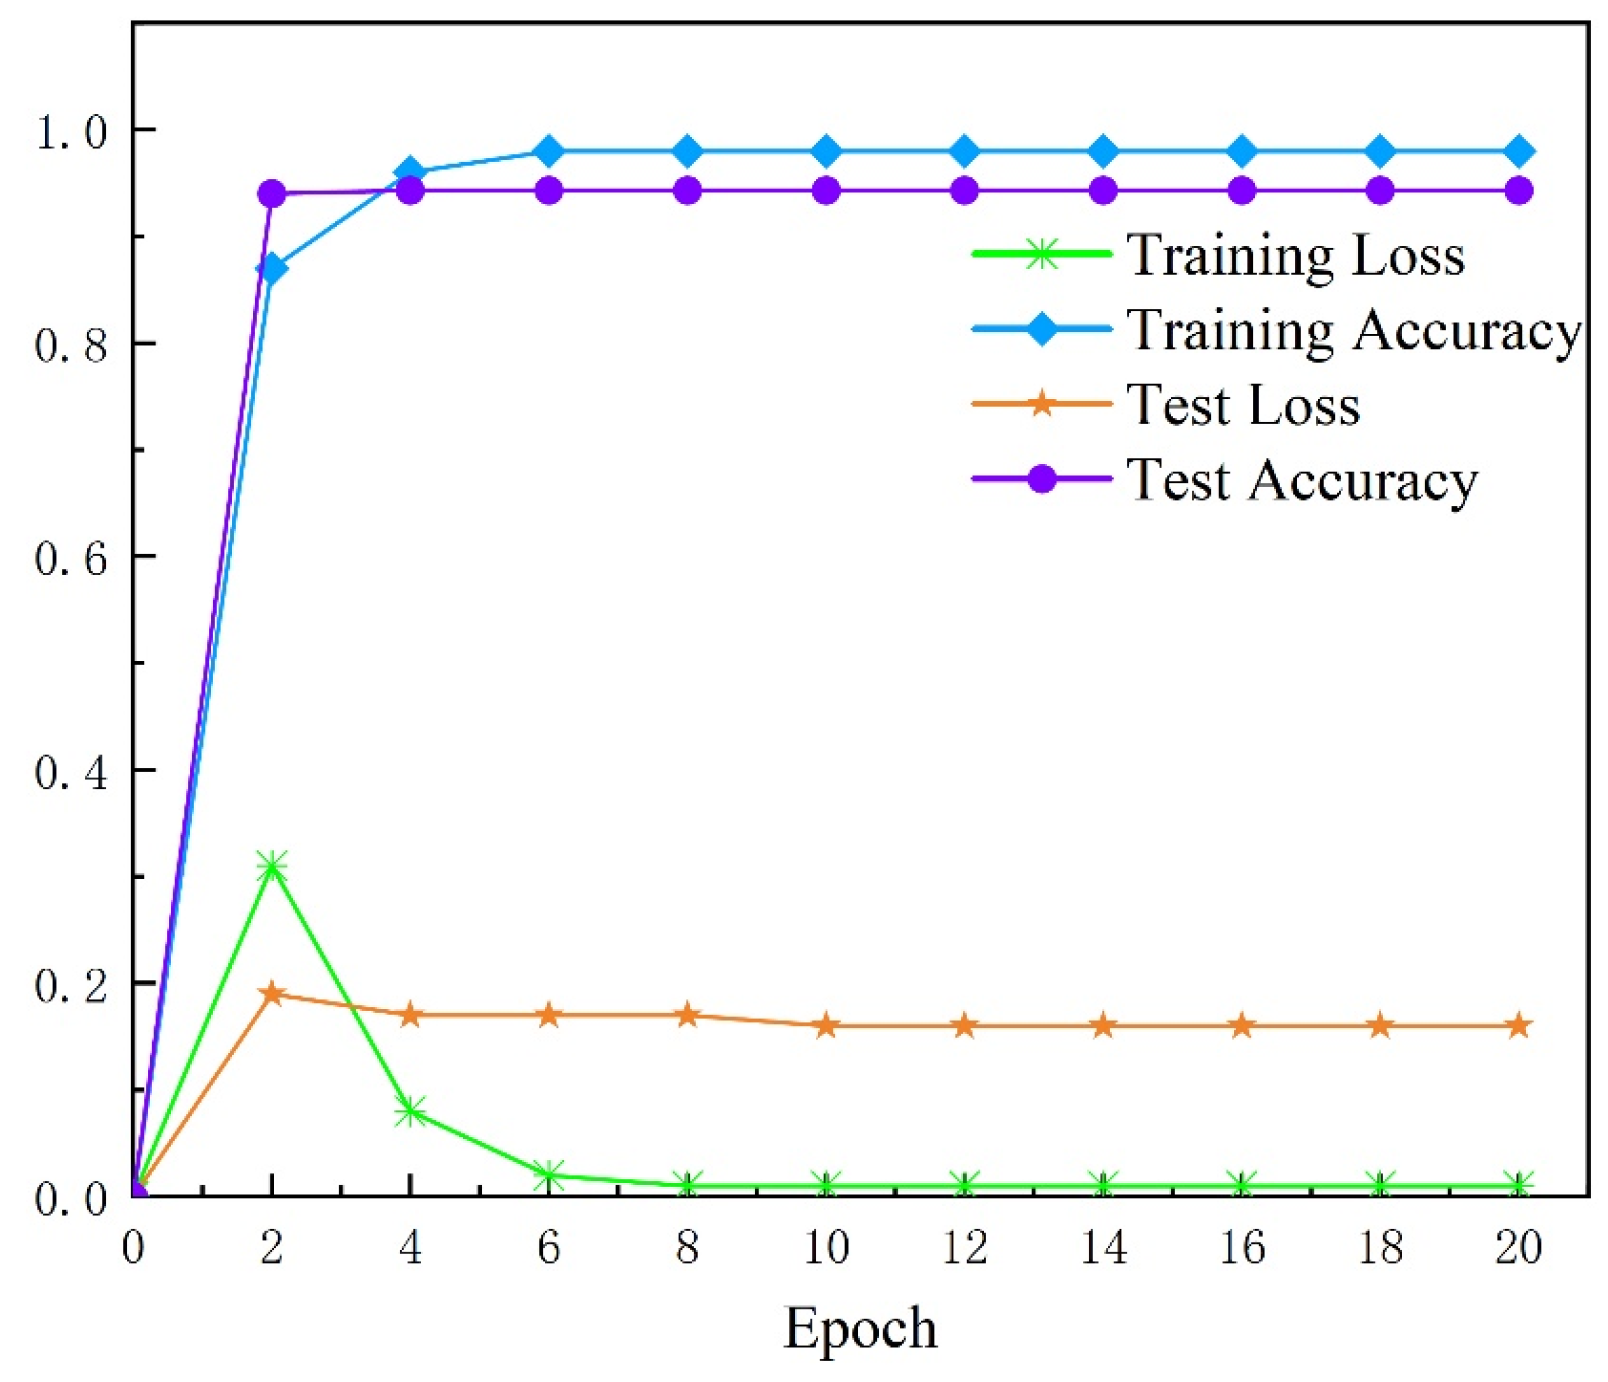
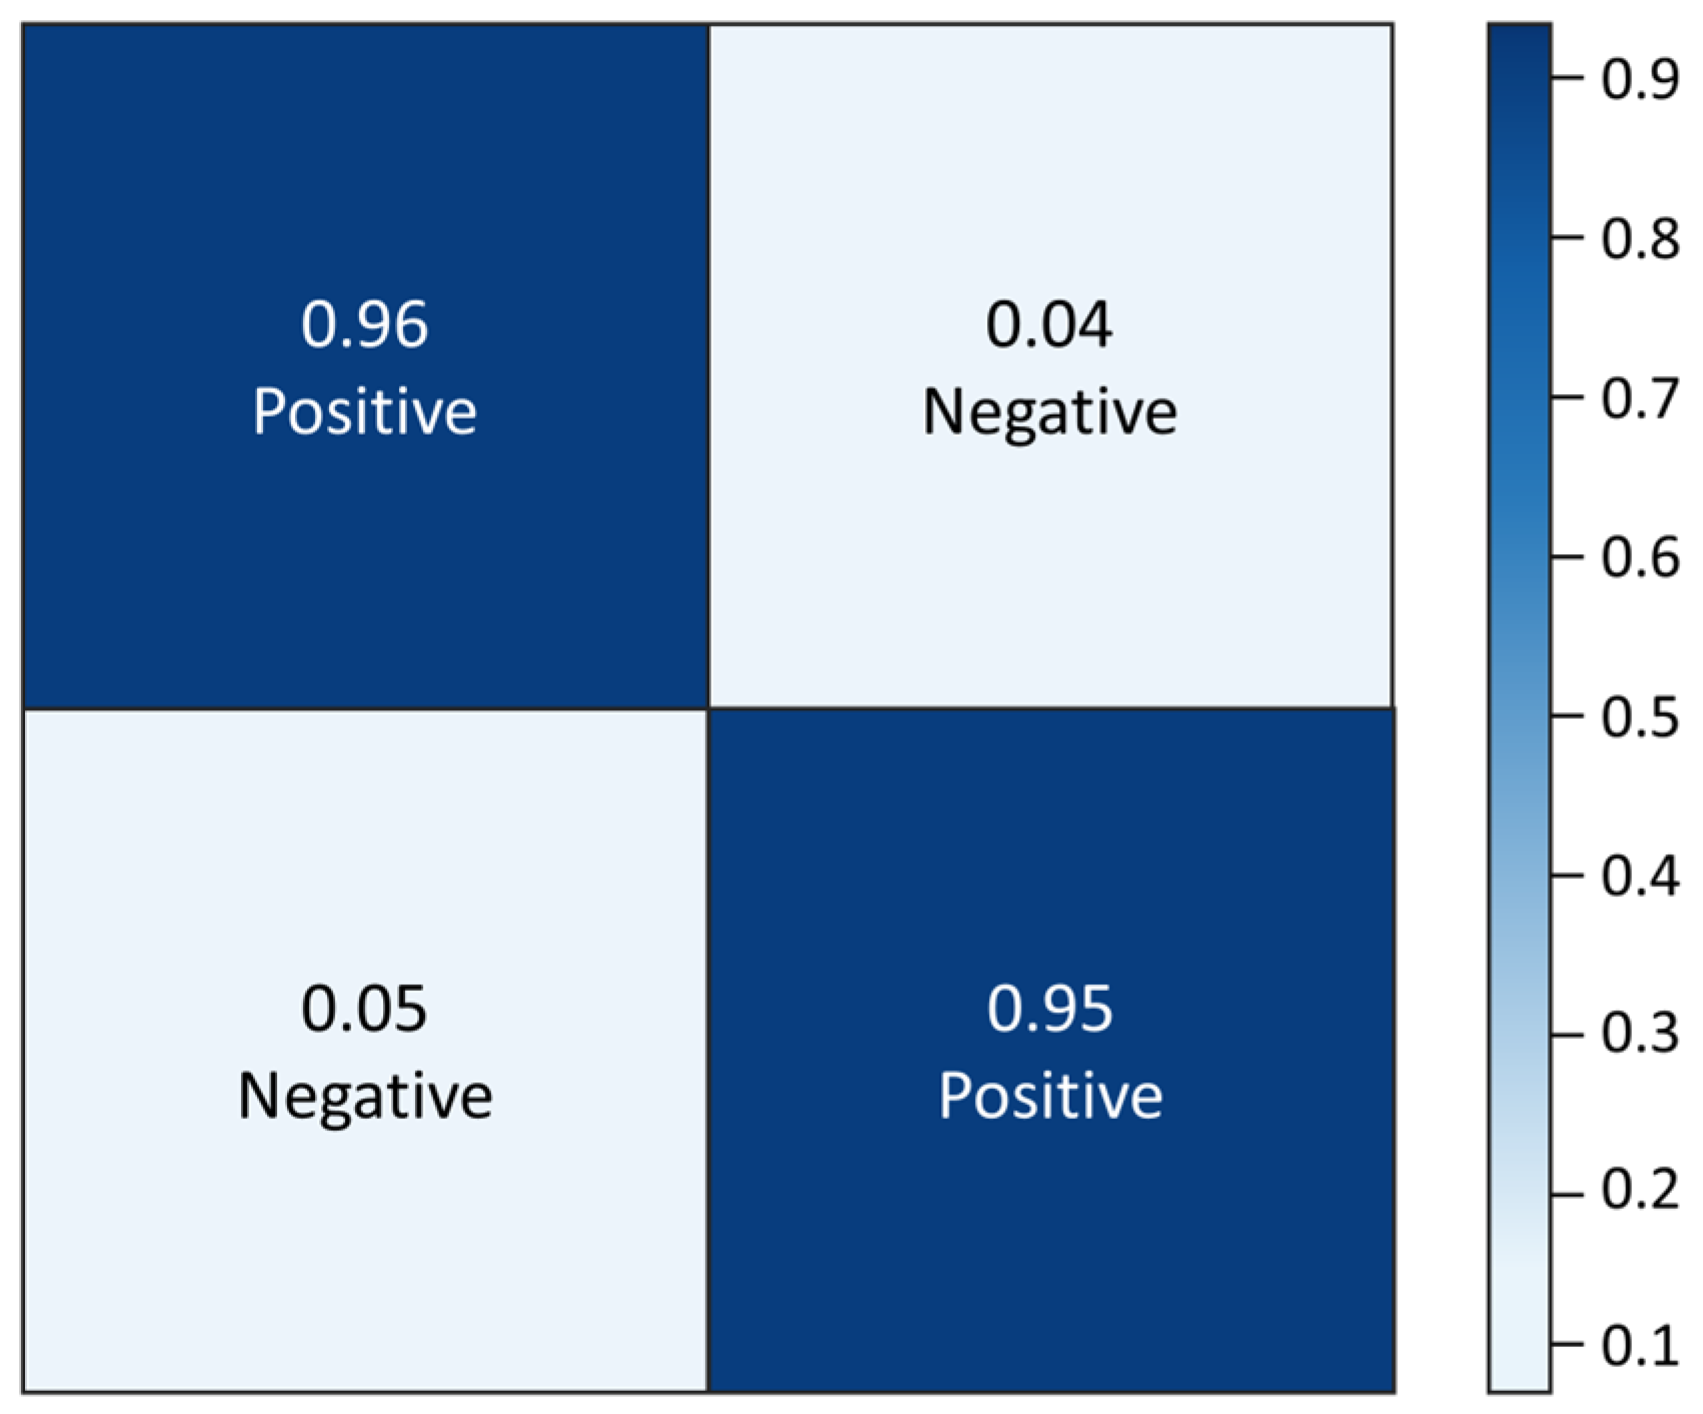
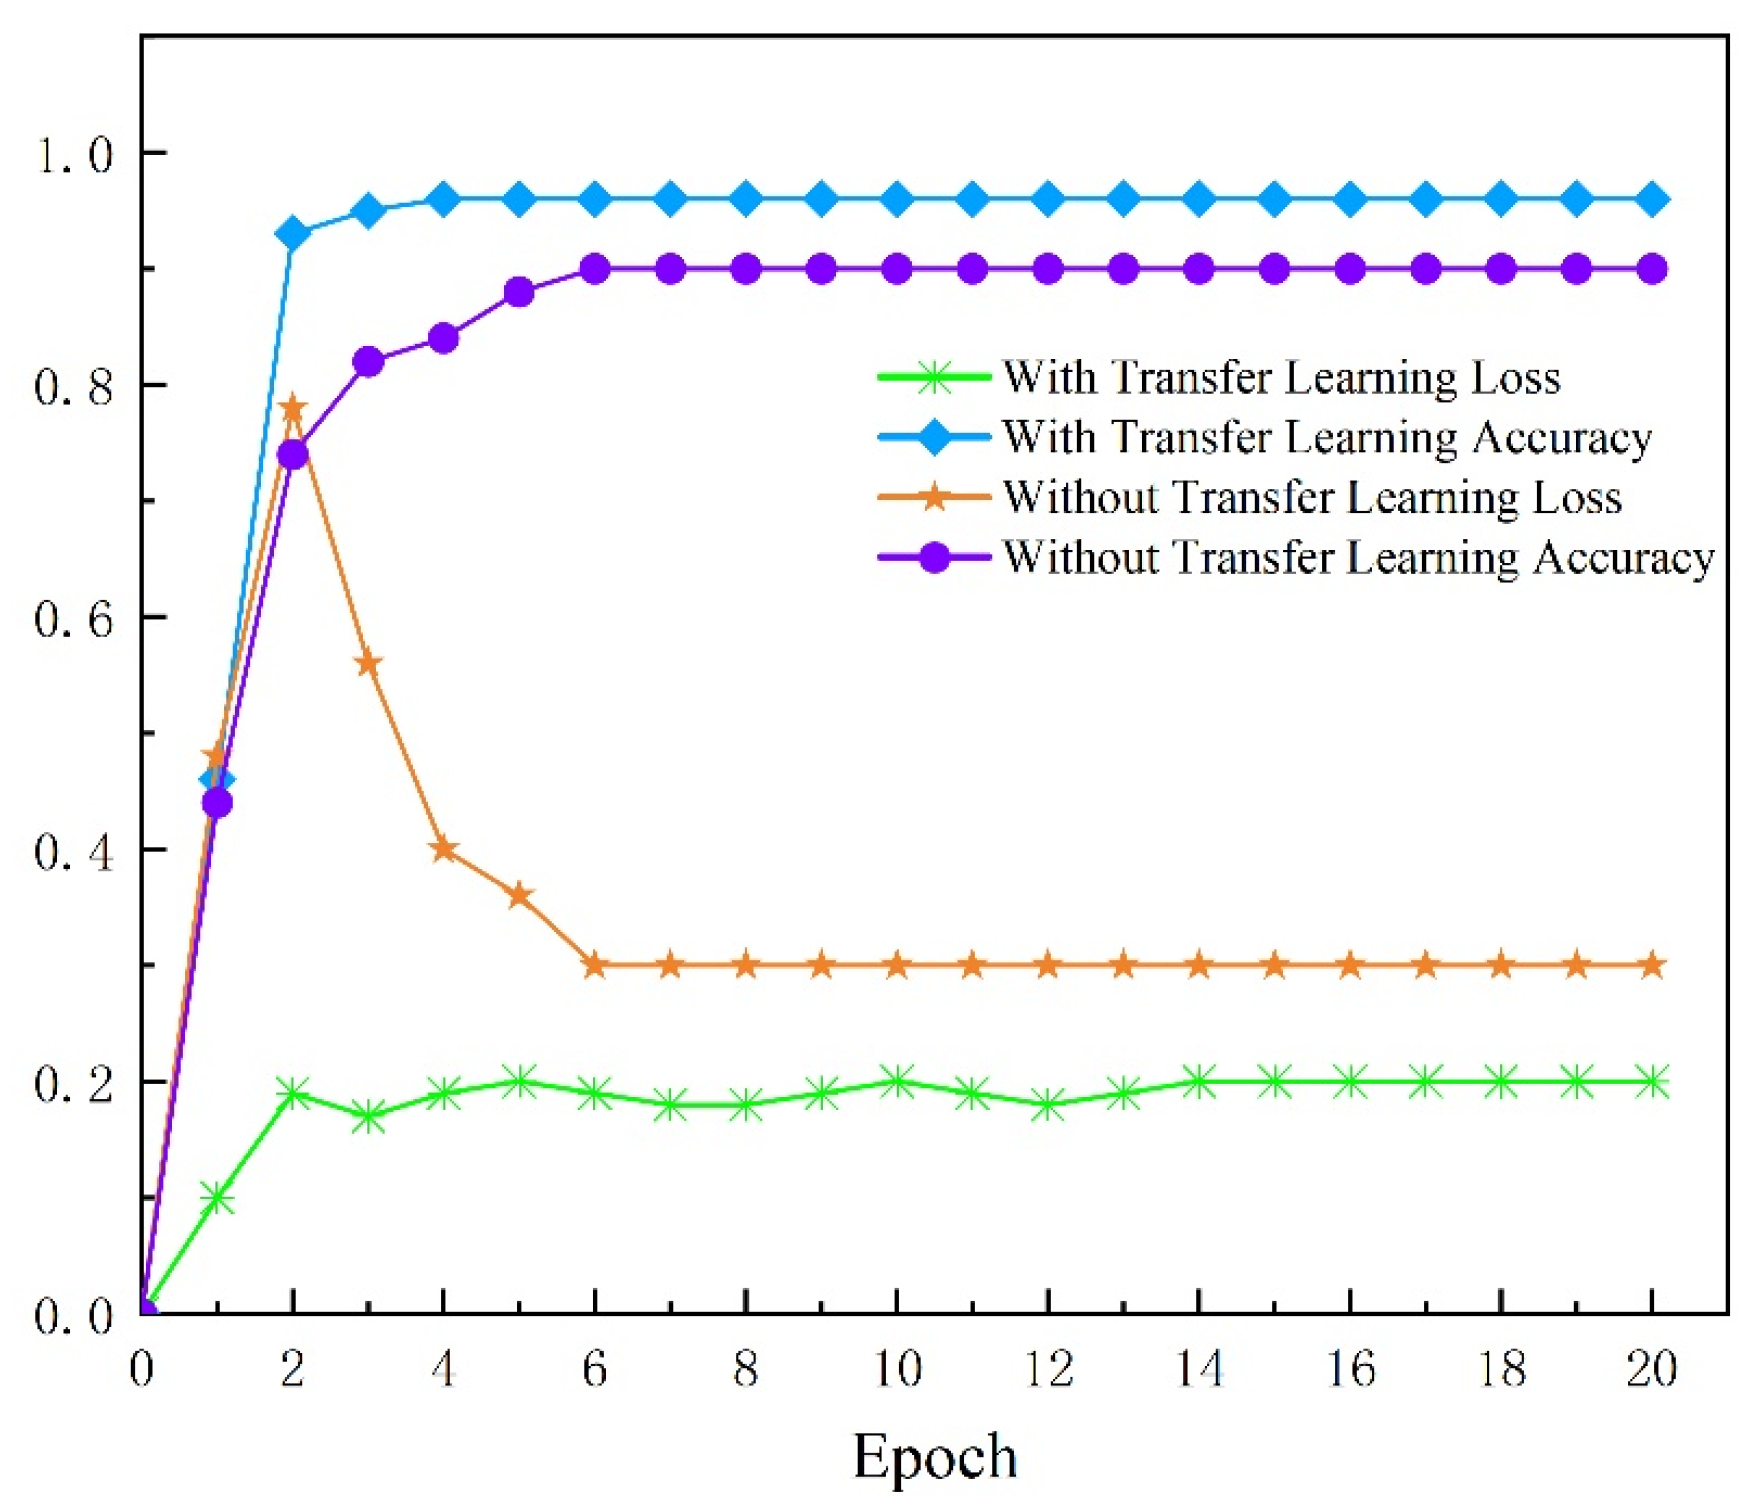
4.3.2. Evaluation of the Result with Transfer Learning

The level of accuracy and loss through the implementation of transfer learning can be seen in the accuracy, and loss starts to stabilize after the first epoch. The accuracy seems to hit the maximum value of 1, and the loss reaches a minimum value of 0 after the sixth epoch, as shown in Figure 8. This shows the model has high accuracy in classifying the image correctly. With such a low value of loss, the predicted label is most similar to the label image by applying the loss function formula listed in Equations (1)–(3).
The accuracy and loss of the model with transfer learning per epoch during testing are presented in the accuracy and loss stabilized after the first epoch. The highest accuracy achieved was 0.9434, while the minimum loss occurred at the 10th epoch. The loss observed during testing was higher than the loss observed during training. This may be due to the fact that weight can be adjusted during training. However, the new test set may not have such a feature during training and would therefore result in the loss being higher in the test set.
The best precision, recall, and F1 values are 0.9684, 0.9631, and 0.9661, respectively. With a precision value of 0.9474, this means that when the model predicts there is a crack, it is correct 95% of the time. The model also achieved a high recall value of 0.9449; this indicates that the model has 94% accuracy in classifying cracks from the crack images correctly. Lastly, the model with transfer learning shows F1 has achieved a score of 0.9462, which is considered excellent for a model because it presents low false negative and false positive values.
The confusion matrix presented in Figure 9 further indicates that the false negative and false positive values are low. A normalized confusion matrix below represents the high degree of correctly predicted classes with high diagonal element values. The value of off-diagonal is pretty low, which means that there is a low probability that a crack will be misclassified as a non-crack while a non-crack is misclassified as a crack. The false negative rate is the same for a crack and non-crack in the transfer learning method. The true positive rate for a crack and non-crack. This indicates that there is a lower probability that the classifier will predict a crack as a non-crack.

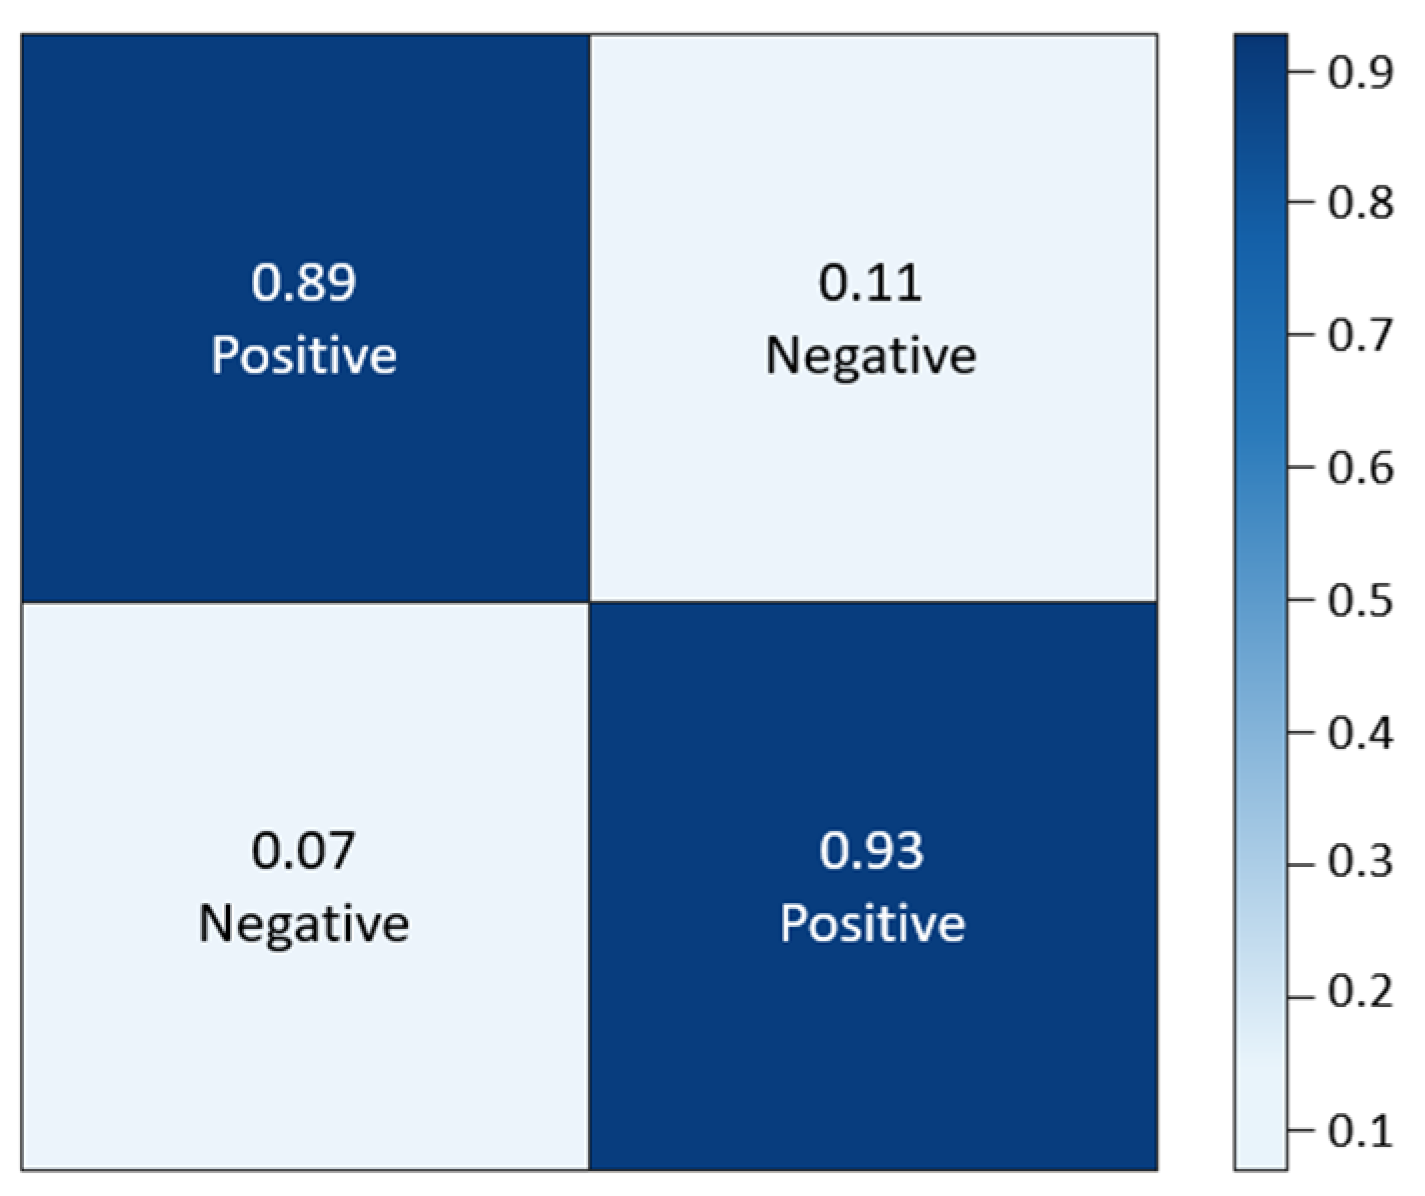
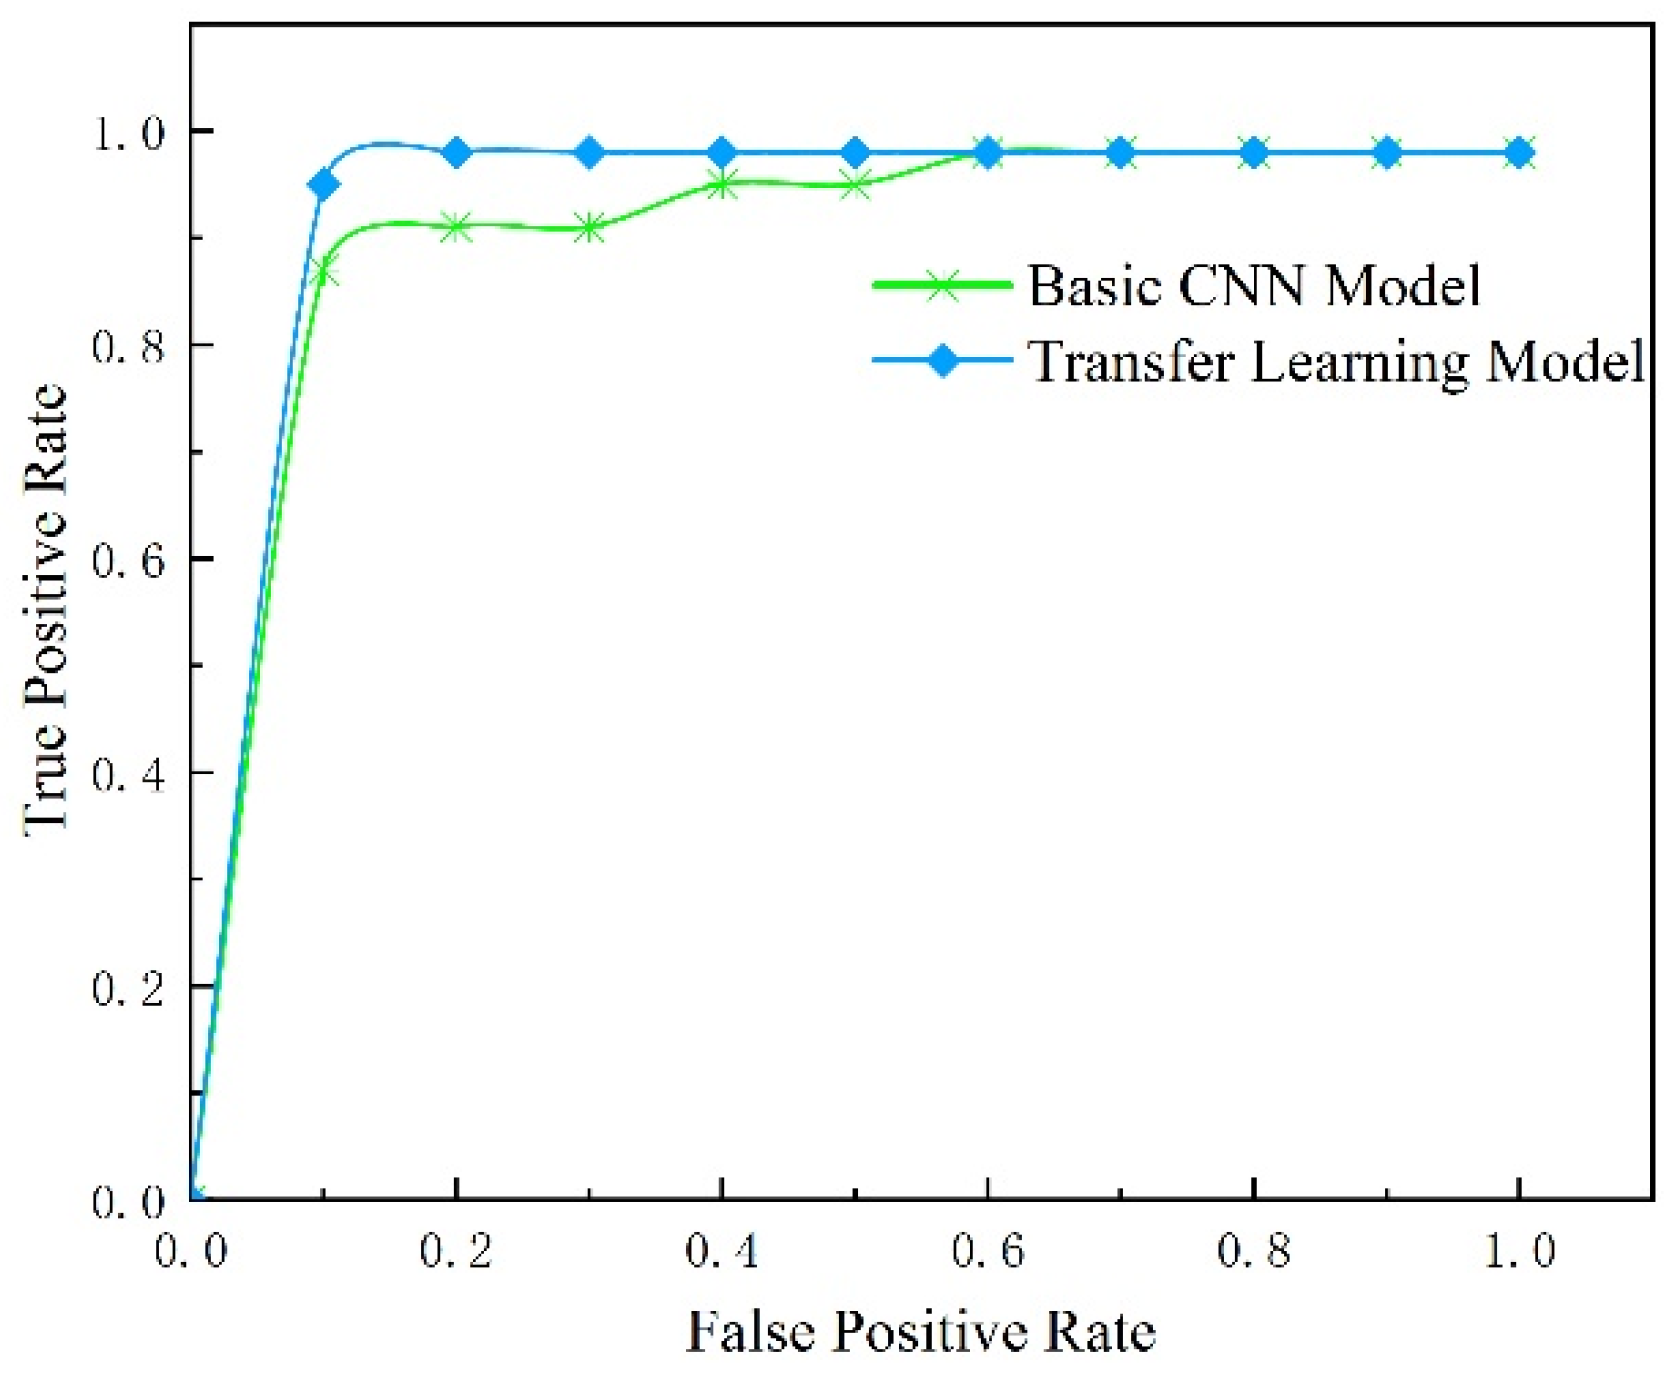
4.3.3. Comparison of Experimental Results

The test results derived in Figure 10 have proven to be quite similar to the training results, where the performance of the transfer learning was better than the basic CNN model. The accuracy and loss of the model with transfer learning stabilized after the first epoch. However, the basic CNN model only achieved stable accuracy and loss after the fifth epoch. The highest accuracy achieved for a model with transfer learning is at 10th epoch, while a model without transfer learning achieves the highest accuracy at a later epoch, which is at the 16th epoch. As a result, transfer learning is better than basic CNN, which has to learn from scratch, as it has higher accuracy and lower loss. The transfer learning model requires a lesser epoch to achieve stable accuracy as compared to the model without transfer learning.
Table 2 compares crack detection performance using original labels and refined hierarchical labels. It is clear that crack detection with UNet works efficiently, with DSC up to 96%. Moreover, IoU, SEN, and SPE all surpass 90%.
From the table, we can observe that the MDS-UNet algorithm achieved the highest scores in terms of IoU (99.13%), DSC (99.99%), SEN (99.99%), and SPE (100.00%). These scores indicate that the MDS-UNet algorithm performed exceptionally well in accurately detecting building surface cracks. With such high scores, it suggests that the MDS-UNet algorithm has the potential to be highly effective in real-world applications for crack detection on building facades. Among the other algorithms, Attention-UNet and DeepLabV3+ also demonstrated strong performance. Attention-UNet achieved the highest IoU score (70.38%) among these algorithms, indicating its effectiveness in accurately delineating the extent of the cracks. DeepLabV3+ showed competitive scores across all metrics, suggesting its ability to capture detailed crack information. Both UNet and SegNet algorithms achieved lower scores compared to the others. However, they still displayed reasonable performance, with UNet surpassing SegNet in most metrics. These algorithms can still be considered viable options for building surface crack detection, especially in scenarios where computational resources are limited. It is worth noting that the performance of these algorithms may vary depending on the specific dataset used for evaluation. The quality and diversity of the dataset can greatly impact the algorithms’ performance. Therefore, further evaluation using a larger and more diverse dataset would be beneficial for a more comprehensive comparison.
In conclusion, the MDS-UNet algorithm exhibited outstanding performance, followed closely by Attention-UNet and DeepLabV3+. UNet and SegNet also demonstrated reasonable performance. The choice of the best algorithm for building surface crack detection ultimately depends on various factors such as specific requirements, computational resources, and dataset characteristics.
By comparing the performance indicators of the two models, the result shows that the model with transfer learning has better performance, given its higher accuracy, precision, recall, and F1. When transfer learning is adopted, the model predicts the label more accurately. For precision, when the model with transfer learning predicts there is a crack, it is around 10% more accurate at identifying a crack compared to the basic CNN model. The same goes for recall, which is 3% more accurate with transfer learning, and finally, it is marginally more accurate in terms of the F1 score, indicating that transfer learning has lower false positive and false negative values.
The normalized confusion matrices of both models are depicted in Figure 6 and Figure 9. The matrix on the right has a higher diagonal value than the matrix on the left. The off-diagonal value on the right is much lower than that on the left. This indicates that the model with transfer learning predicts the classes more accurately than the basic CNN model. The transfer learning model has a lower chance of wrongly classifying the crack as a non-crack.
The curve of both models represented shows that the transfer learning model is higher than the model without transfer learning. It indicates that the transfer learning model is 10% more accurate at separating crack and non-crack classes than the model without transfer learning. Furthermore, it also indicates that transfer learning has lower type 1 and type 2 errors, i.e., where a crack is predicated as a non-crack and vice versa. The curve of the transfer learning model leans more towards the upper left corner of the plot than the model without transfer learning, indicating that the transfer learning separating the crack and non-cracks is more accurate than the basic CNN model.
After analysing the performance of the classification model through various metrics, it can be concluded the classification model with the transfer learning model is able to classify cracks more accurately as it has higher accuracy, precision, recall, as well as F1 values. The transfer learning model’s normalized confusion matrix has a higher value on the diagonal as compared to the model without transfer learning. This indicates the model with transfer learning has a lower probability of classifying crack as non-crack and vice versa. The AUC of the transfer learning model is larger than the model without transfer learning. In conclusion, the classifier with transfer learning performs better than the classifier without transfer learning using the same amount of the dataset.

5. Conclusions

Cracks in building facades are a common issue that arises due to the natural aging of structures. If left unaddressed, these cracks can worsen over time, potentially leading to safety hazards. The incorporation of deep learning technology, specifically for image classification, has shown promising results in various civil infrastructure domains such as pavements and bridges. However, limited research has explored its applications in the built environment sector. This study focuses on evaluating the effectiveness of deep learning technology, particularly Convolutional Neural Networks (CNN), for image classification. Although CNN typically demands substantial amounts of data to achieve optimal performance, manually collecting such images proves challenging.
This study addresses this predicament by employing a transfer learning approach, allowing for successful image classification even when data are limited. The CNN method yielded an accuracy level of approximately 89%. In contrast, the transfer learning model significantly improved performance, offering an accuracy rate of 94% with the same amount of input data. The model proposed in this study is insensitive to high-rise building exterior materials such as glass, concrete, and steel and can accurately and efficiently identify cracks in building walls. Consequently, it can be inferred that transfer learning outperforms the CNN method in terms of classification performance. Moreover, to streamline the inspection process and make it safer and more cost-effective, unmanned aerial vehicles (UAVs) and robots can be employed to collect images, eliminating the need for manual collection efforts.
The main contributions of this paper are summarized in three points. First, this paper reviews the existing practice of defect detection in the construction industry and the challenges faced by traditional methods and investigates the applicability of deep learning techniques in crack detection in the construction industry. Second, a CNN-based method for crack detection on building surfaces is proposed, and the implementation of these components is described in detail. Finally, the transfer learning performance of CNNs in constructing crack classification is evaluated, and the performance of basic CNN models and CNN models based on transfer learning is compared.
In summary, this study showcases the potential of deep learning technology, particularly through transfer learning, in automating the classification of building facade images. It highlights the superiority of transfer learning over traditional CNN methods, even when confronted with limited data availability.

Author Contributions

Conceptualization and methodology, Y.C. and Y.Z.; formal analysis, Z.Z. and Z.L.; writing—original draft preparation, Y.C.; writing—review and editing, Y.C. and Y.Z. All authors have read and agreed to the published version of the manuscript.

Funding

This research received no external funding.

Data Availability Statement

Data are available upon request to the corresponding author.

Conflicts of Interest

The authors declare no conflict of interest.

References

  1. Tan, Y.; Li, G.; Cai, R.; Ma, J.; Wang, M. Mapping and modelling defect data from UAV captured images to BIM for building external wall inspection. Autom. Constr. 2022, 139, 104284. [Google Scholar] [CrossRef]
  2. Xie, X.; Liu, C.H.; Leung, D.Y. Impact of building facades and ground heating on wind flow and pollutant transport in street canyons. Atmos. Environ. 2007, 41, 9030–9049. [Google Scholar] [CrossRef]
  3. Moghtadernejad, S.; Chouinard, L.E.; Mirza, M.S. Design strategies using multi-criteria decision-making tools to enhance the performance of building façades. J. Build. Eng. 2020, 30, 101274. [Google Scholar] [CrossRef]
  4. Shugar, D.H.; Jacquemart, M.; Shean, D.; Bhushan, S.; Upadhyay, K.; Sattar, A.; Schwanghart, W.; McBride, S.; De Vries, M.V.W.; Mergili, M.; et al. A massive rock and ice avalanche caused the 2021 disaster at Chamoli, Indian Himalaya. Science 2021, 373, 300–306. [Google Scholar] [CrossRef] [PubMed]
  5. Dang, L.M.; Wang, H.; Li, Y.; Nguyen, L.Q.; Nguyen, T.N.; Song, H.K.; Moon, H. Deep learning-based masonry crack segmentation and real-life crack length measurement. Constr. Build. Mater. 2022, 359, 129438. [Google Scholar] [CrossRef]
  6. Li, S.; Song, W.; Fang, L.; Chen, Y.; Ghamisi, P.; Benediktsson, J.A. Deep learning for hyperspectral image classification: An overview. IEEE Trans. Geosci. Remote Sens. 2019, 57, 6690–6709. [Google Scholar] [CrossRef] [Green Version]
  7. Yang, C.; Chen, J.; Li, Z.; Huang, Y. Structural Crack Detection and Recognition Based on Deep Learning. Appl. Sci. 2021, 11, 2868. [Google Scholar] [CrossRef]
  8. Golding, V.P.; Gharineiat, Z.; Munawar, H.S.; Ullah, F. Crack Detection in Concrete Structures Using Deep Learning. Sustainability 2022, 14, 8117. [Google Scholar] [CrossRef]
  9. Druķis, P.; Gaile, L.; Pakrastiņš, L. Inspection of Public Buildings Based on Risk Assessment. Procedia Eng. 2017, 172, 247–255. [Google Scholar] [CrossRef]
  10. Yang, Y.; Chaoyue, W.; Xiaoyu, G.; Jianchun, L. A novel deep learning-based method for damage identification of smart building structures. Struct. Health Monit. 2019, 18, 143–163. [Google Scholar]
  11. He, Y.; Chen, H.; Liu, D.; Zhang, L. A framework of structural damage detection for civil structures using fast fourier transform and deep convolutional neural networks. Appl. Sci. 2021, 11, 9345. [Google Scholar] [CrossRef]
  12. Chen, F.; Jahanshahi, M.R. NB-CNN: Deep Learning-Based Crack Detection Using Convolutional Neural Network and Naive Bayes Data Fusion. IEEE Trans. Ind. Electron. 2018, 65, 4392–4400. [Google Scholar] [CrossRef]
  13. Li, R.; Yuan, Y.; Zhang, W.; Yuan, Y. Unified vision-based methodology for simultaneous concrete defect detection and geolocalization. Comput. Aided Civ. Infrastruct. Eng. 2018, 33, 527–544. [Google Scholar] [CrossRef]
  14. Cha, Y.J.; Choi, W.; Büyüköztürk, O. Deep Learning-Based Crack Damage Detection Using Convolutional Neural Networks. Comput. Aided Civ. Infrastruct. Eng. 2017, 32, 361–378. [Google Scholar] [CrossRef]
  15. Kim, B.; Yuvaraj, N.; Sri Preethaa, K.R.; Arun Pandian, R. Surface crack detection using deep learning with shallow CNN architecture for enhanced computation. Neural Comput. Appl. 2021, 33, 9289–9305. [Google Scholar] [CrossRef]
  16. Katsigiannis, S.; Seyedzadeh, S.; Agapiou, A.; Ramzan, N. Deep learning for crack detection on masonry façades using limited data and transfer learning. J. Build. Eng. 2023, 76, 107105. [Google Scholar] [CrossRef]
  17. Lee, K.; Hong, G.; Sael, L.; Lee, S.; Kim, H.Y. MultiDefectNet: Multi-class defect detection of building façade based on deep convolutional neural network. Sustainability 2020, 12, 9785. [Google Scholar] [CrossRef]
  18. Chen, K.; Reichard, G.; Xu, X.; Akanmu, A. Automated crack segmentation in close-range building façade inspection images using deep learning techniques. J. Build. Eng. 2021, 43, 102913. [Google Scholar] [CrossRef]
  19. Karen, S.; Andrew, Z. Very Deep Convolutional Networks for Large-Scale Image Recognition. arXiv 2014, arXiv:1409.1556. [Google Scholar]
  20. Kaiming, H.; Xiangyu, Z.; Shaoqing, R.; Jian, S. Deep Residual Learning for Image Recognition. arXiv 2015, arXiv:1512.03385. [Google Scholar]
  21. Cao, V.D.; Anh, L.D. Autonomous concrete crack detection using deep fully convolutional neural network. Autom. Constr. 2019, 99, 52–58. [Google Scholar]
  22. Alex, K.; Ilya, S.; Geoffrey, E.H. ImageNet classification with deep convolutional neural networks. Commun. ACM 2017, 60, 84–90. [Google Scholar]
  23. He, J.; Li, L.; Xu, J. ReLU deep neural networks from the hierarchical basis perspective. Comput. Math. Appl. 2022, 120, 105–114. [Google Scholar] [CrossRef]
  24. Christian, S.; Vincent, V.; Sergey, I.; Jonathon, S.; Zbigniew, W. Rethinking the Inception Architecture for Computer Vision. arXiv 2015, arXiv:1512.00567. [Google Scholar]
  25. LeCun, Y.; Bottou, L.; Bengio, Y.; Haffner, P. Gradient-based learning applied to document recognition. Proc. IEEE 1998, 86, 2278–2324. [Google Scholar] [CrossRef]
  26. Christian, S.; Wei, L.; Yangqing, J.; Pierre, S.; Scott, E.R.; Dragomir, A.; Dumitru, E.; Vincent, V.; Andrew, R. Going Deeper with Convolutions. arXiv 2014, arXiv:1409.4842. [Google Scholar]
  27. Hinton, G.E.; Osindero, S.; Teh, Y. A fast learning algorithm for deep belief nets. Neural Comput. 2006, 18, 1527–1554. [Google Scholar] [CrossRef]
  28. Tarkhan, A.; Simon, N. An online framework for survival analysis: Reframing Cox proportional hazards model for large data sets and neural networks. Biostatistics 2022, kxac039. [Google Scholar] [CrossRef]
  29. Pedro, D. A few useful things to know about machine learning. Commun. ACM 2012, 55, 78–87. [Google Scholar]
  30. Kaiming, H.; Xiangyu, Z.; Shaoqing, R.; Jian, S. Identity Mappings in Deep Residual Networks. arXiv 2016, arXiv:1603.05027. [Google Scholar]
Figure 1. Example of building surface crack (the colorful rectangles contain cracked detected).
Buildings 13 01814 g001
Figure 2. LeNet-5 architecture.
Buildings 13 01814 g002
Figure 3. Convolutional example of image (5 × 5) with filter (3 × 3).
Buildings 13 01814 g003
Figure 4. VGG with residual block.
Buildings 13 01814 g004
Figure 5. Training and test results of basic CNN with image augmentation.
Buildings 13 01814 g005
Figure 6. Normalized confusion matrix of basic CNN model.
Buildings 13 01814 g006
Figure 7. Result of model with basic CNN and model with transfer learning.
Buildings 13 01814 g007
Figure 8. Training and test results of transfer learning with image augmentation.
Buildings 13 01814 g008
Figure 9. Normalized confusion matrix of model with transfer learning.
Buildings 13 01814 g009
Figure 10. Comparison of test results of two models.
Buildings 13 01814 g010
Table 1. Dataset for training and testing.
PositiveNegativeTotal
Training150513412846
Testing385369754
Total189017103600
Table 2. Comparison of crack detection performance using original labels and refined hierarchical labels.
NetworkLabelsIoU (%)DSC (%)SEN (%)SPE (%)
OriginalRefined
SegNet 67.2379.1382.3199.74
Attention-UNet 70.3882.1385.5199.78
UNet 68.9879.5783.3899.74
DeepLabV3+ 72.4382.9485.0899.79
MDS-UNet 99.1399.9999.99100.00
Disclaimer/Publisher’s Note: The statements, opinions and data contained in all publications are solely those of the individual author(s) and contributor(s) and not of MDPI and/or the editor(s). MDPI and/or the editor(s) disclaim responsibility for any injury to people or property resulting from any ideas, methods, instructions or products referred to in the content.

