Abstract
This empirical study in this paper focuses on the application of evolutionary computation in parametric urban block design to solve the problem of how to effectively find the optimal design solution set among a large number of schemes obtained through parametric urban block design. Through the application of evolutionary computation, a set of parameterized intelligent generation methods of urban blocks under the guidance of multi-conflict objective optimization can be established. The empirical study presented is based on a typical Russian block redevelopment design along the Chinese Eastern Railway. The design aims to transform and redevelop the original block on the basis of protecting its historical buildings and street pattern, taking into account environmental and economic considerations. The final results show that under the premise of reasonable overall evolution, a large number of block design schemes with complex design objectives can be obtained. Furthermore, according to the index data analysis of Pareto’s overall optimal, mean value, median value, extreme value, etc., it provides designers with methods to select a series of optimal schemes quickly and efficiently based on different factors such as comprehensive balance, average and middle ranking, and individual best.
1. Introduction
1.1. Research Background
Since the 1970s, researchers have explored the design of parametric intelligent generation systems in the field of architecture and urban design. The high computing power of intelligent generation design in urban design enables designers to generate and assess a large number of design alternatives quickly but also presents the challenge of quickly identifying the optimal or near-optimal design. The process of conventional intelligent generation in urban design involves three steps: scheme generation, performance analysis, and scheme assessment. Scheme generation involves the use of shape rules that conform to the design generation process to generate schemes []. The performance analysis involves determining the final result of scheme generation on the basis of performance indicators. Scheme assessment involves evaluating the suitability of parametric automatic generation schemes on the basis of performance indicators. Recently, researchers have begun to study parametric intelligent generation methods based on multiobjective optimization, which enhances the design process through the addition of multiple optimization objectives [,]. Scheme generation evolves toward optimization to identify a scheme that satisfies multiple optimization objectives and yields indicators of high performance [,,]. This method can reduce debugging time and increase the applicability of conventional urban design parametric intelligent generation systems. However, few experimental studies on this topic have been conducted, and practical applications are limited.
Transforming and utilizing historic city blocks while preserving local historical traditions and ethnic characteristics are crucial tasks for scholars. Urban design is an effective method of exploring the preservation, renewal, and reuse of historic city blocks. In the early stage of urban design, fundamental problems related to the conservation, renewal, and reuse of historic city blocks can be solved by controlling key performance indicators and through in-depth research on the morphological elements of sites and architectural layouts on historic city blocks. At present, the traditional intelligent generation method of urban blocks also faces the issue of finding the optimal schemes.
1.2. Research Progress
At present, the core methods of generative technology, which originated from computers that imitate natural creation, are generally Cellular automatons, L-systems, and shape gramma. Cellular automatons are limited to unit cells of a predetermined mesh shape and regular evolution between unit cells during the generation process []. L-systems are based on fractal theory and involve repeatedly replacing parts of a basic shape to form a complex shape []. Shape grammar is not limited to specific mesh shapes and local interactions, and a set of shape rules that guide the design generation process can be adopted []. Shape grammar involves defining and applying various rules for objects of different shapes at each stage of the design process, which enables the creation of numerous schemes suitable for complex shapes and urban design requirements (BuHamdan, Alwisy, and Bouferguene, 2020; Lienhard et al., 2017; Mandow et al., 2020)
Typical evolutionary algorithms with multiobjective optimization are the particle swarm optimization algorithm, ant colony optimization algorithm, and genetic algorithm. These algorithms are based on the principles of biological evolution and genetics, but they differ in terms of the exchange of genetic codes, the focus of mutation, and the method of calculation [,]. The particle swarm optimization algorithm involves using only schemes generated through iterative operations to identify the global optimum, whereas the ant colony optimization algorithm involves the use of a probabilistic algorithm to identify optimal paths in graphs. A genetic algorithm is used to identify the optimal scheme by simulating natural evolution processes, in which crossover and mutation are crucial; it has improved global optimization capabilities. In the development process of genetic algorithms, it has successively developed multiple objective genetic algorithms, non-dominant sorting genetic algorithms, and group decisive genetic algorithms. Non-dominant sorting genetic algorithm can obtain uniformly distributed and multiple different optimal or non-inferior solutions according to the dominant and non-dominant relationship between individuals in the population, and it has also been proved that the algorithm has more advantages []. Furthermore, in 2000, Indian scholars Pratab A, Deb K, and others improved the non-dominant sorting genetic algorithm [,], which greatly accelerated the speed of the algorithm by further accelerating the sorting of non-dominated solution sets based on the non-dominant sorting genetic algorithm, and proposed the improved non-dominated sorting genetic algorithm II (NSGA-II) with elite strategy.
Therefore, the integration of genetic algorithm into shape grammar would represent a more suitable multiobjective intelligent optimization method for generative urban blocks under the guidance of multiobjective []. On the basis of a literature review, this study developed a complete set of multiobjective intelligent optimization methods for urban blocks based on NSGA-II and shape grammar. The method comprises scheme generation, performance analysis, and evolutionary assessment. It also changes the traditional automatic generation method into an automatic generation method oriented to optimization objectives to meet the challenge of effectively finding the optimal design in a large number of schemes.
A commonly used operating software for shape grammar, Rhino, has strong model-processing capabilities, and its corresponding Grasshopper visual programming language is user-friendly for general designers. Its Wallacei platform is based on NSGA-II, namely a multiobjective optimization platform of the NSGA-II. This study adopted Rhino and its parametric intelligent plug-in (Grasshopper and the Wallacei platform) as the software platform for generative urban design schemes and multiobjective optimization selection.
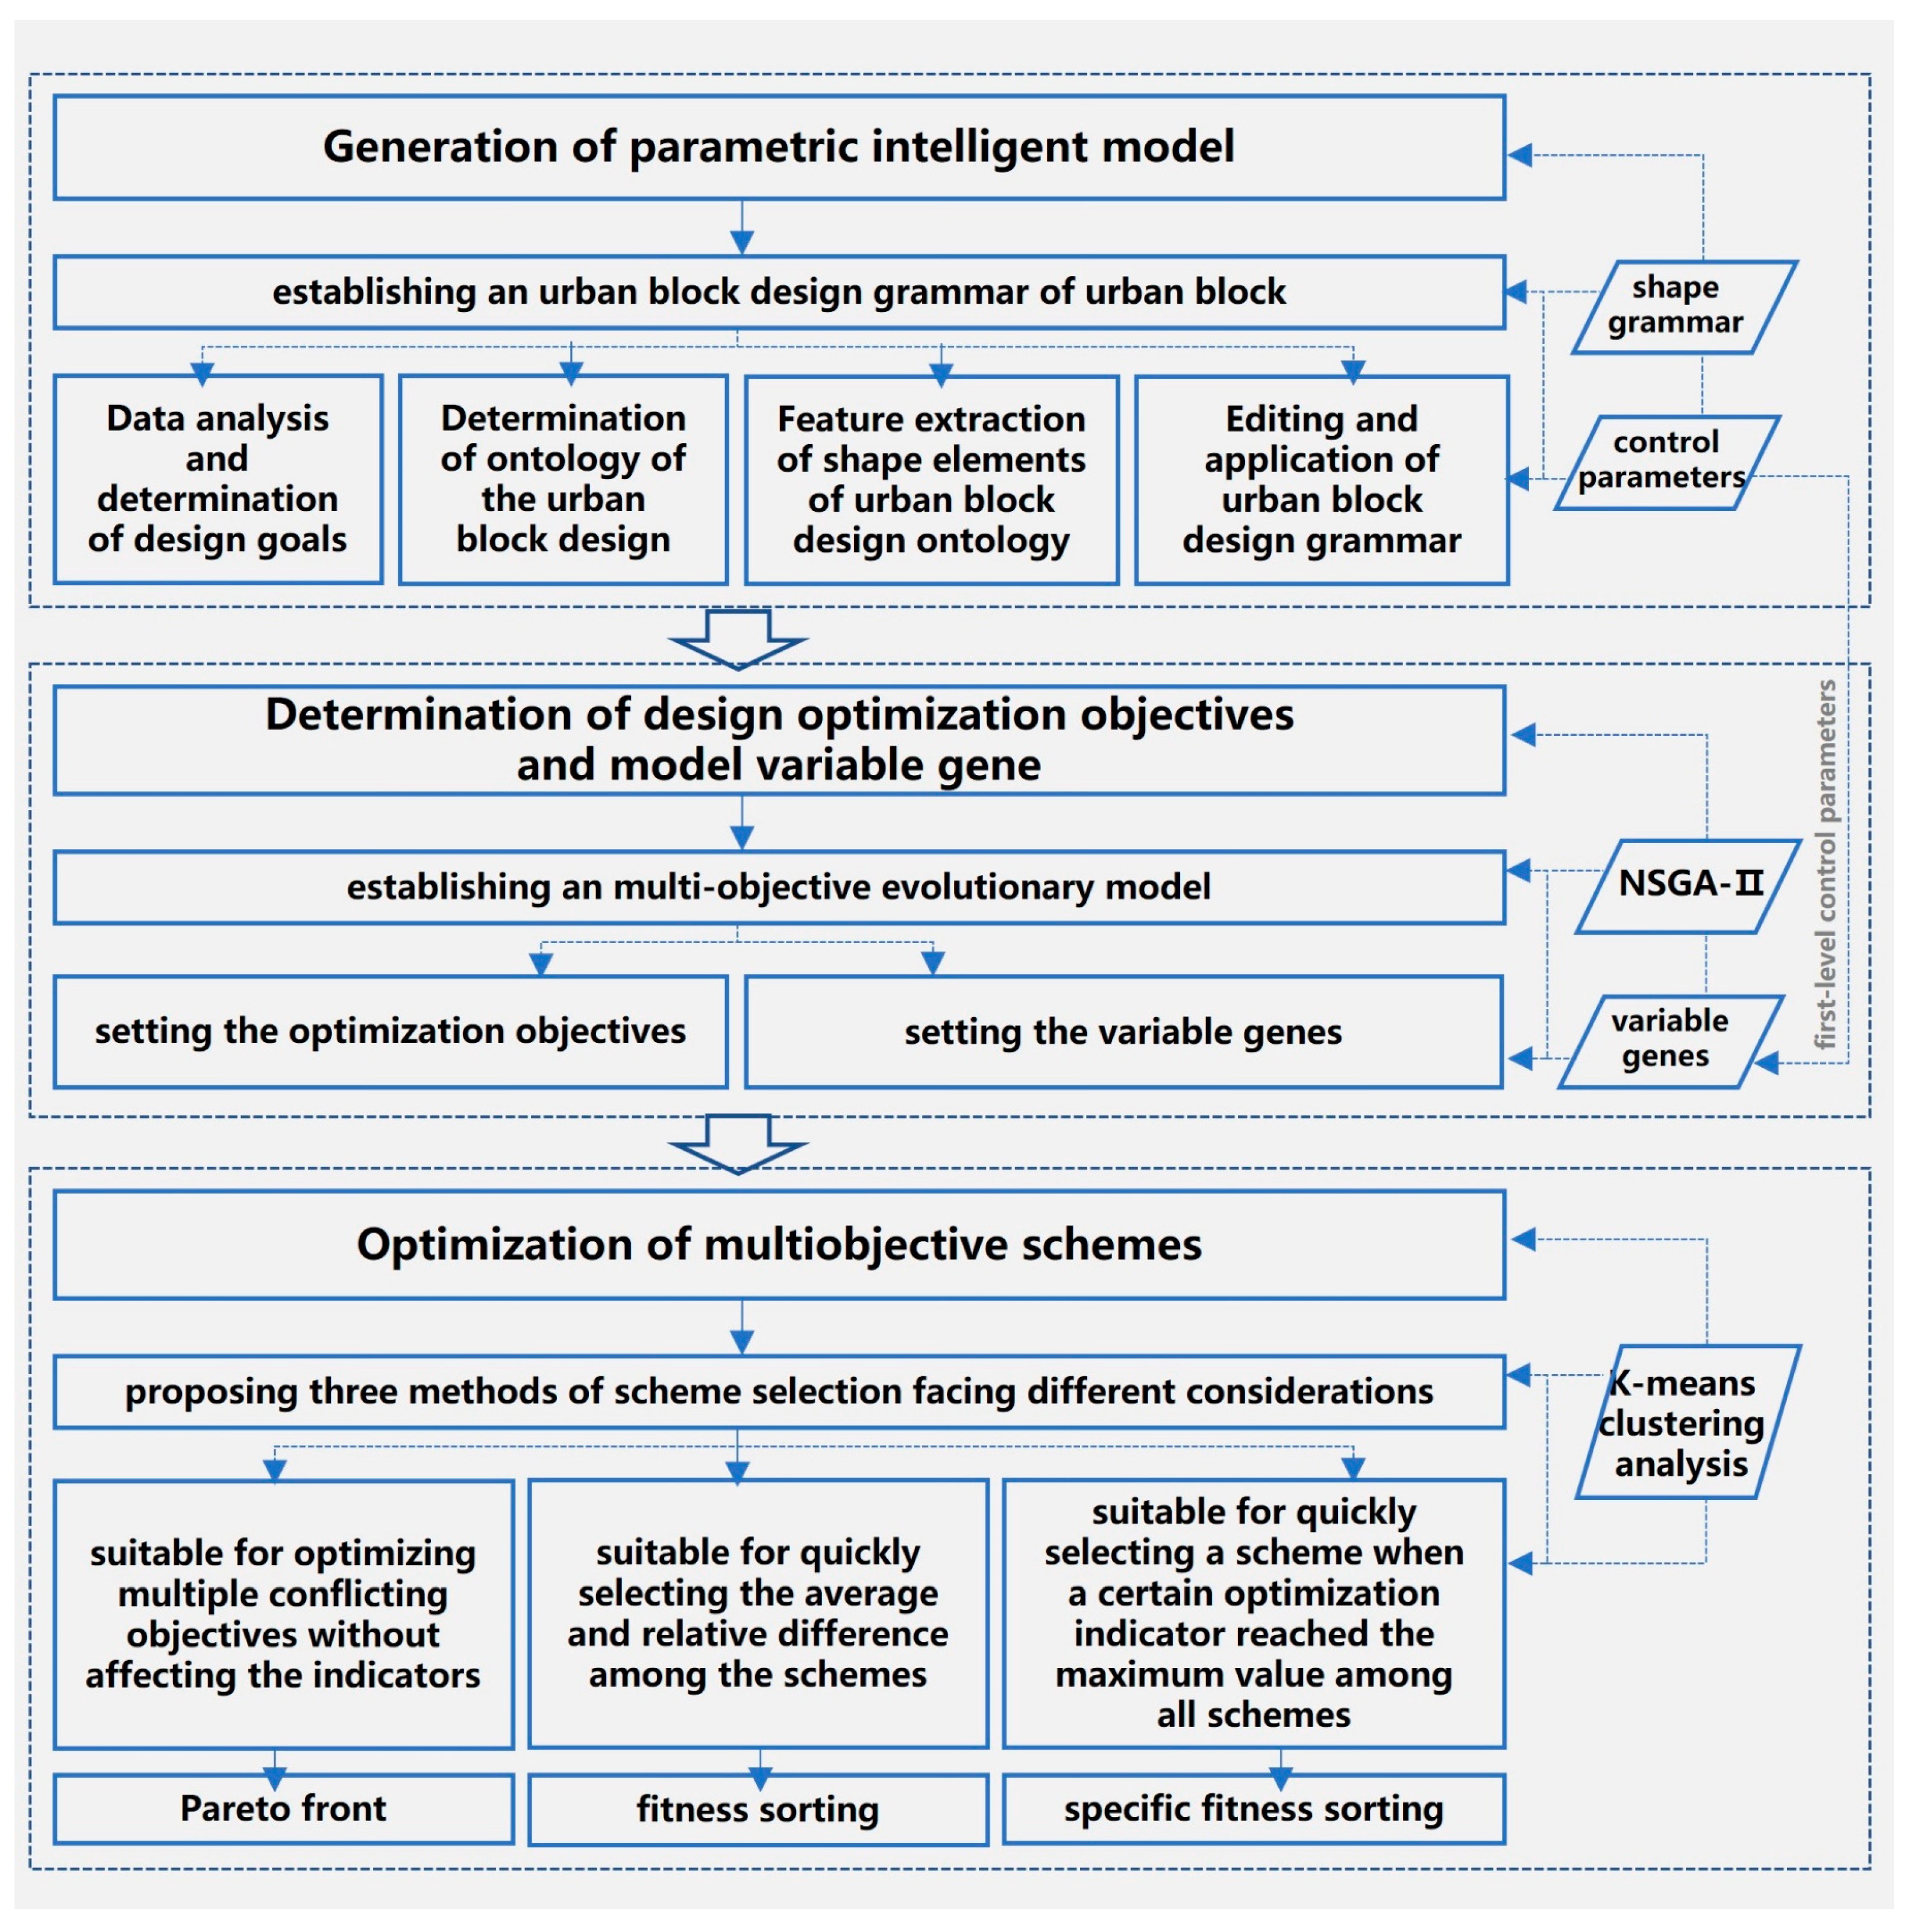
2. Materials and Methods
2.1. Procedure
This study was conducted in three sections (Figure 1).
Figure 1.
Workflow diagram of multiobjective intelligent optimization method for urban block design based on NSGA-II.
First, an intelligent parametric model based on shape grammar and control parameters was generated. Under the control of the performance indicators, the initial scheme model was generated. Establishing an urban block design grammar of urban block based on shape grammar and pattern language thus constitutes a complete generative urban space design method involving morphological analysis, rule-making, and scheme generation. This includes 5 main steps: (1) data analysis and determination of design goals; (2) determination of ontology of the urban block design; (3) feature extraction of shape elements of urban block design ontology; (4) editing and application of urban block design grammar.
Second, the design optimization objectives and model variable genes were determined. On the basis of the design goals, the optimization objectives were developed to guide the evolutionary algorithm. By applying the evolutionary computing technology of the NSGA-Ⅱ algorithm in the genetic algorithm, variables controlling model form were analyzed to create a variable gene library for the optimization of the evolutionary algorithm, including 3 main steps: (1) setting the optimization objectives. In addition to the main performance parameters generated by the scheme in the previous stage, other indicators such as environment and economy can be added as optimization objectives. (2) setting the variable genes. The first-level control parameter is selected as the variable gene of multiobjective optimization, and the specific value of the control parameter variable gene is taken at fixed intervals within the original range to optimize the evolution process.
Third, the multiobjective schemes were comprehensively optimized. On the basis of the optimization objectives and conditions, comprehensive evolutionary multiobjective optimization was performed to determine the optimal scheme. This section mainly proposed three methods of scheme selection: (1) based on the Pareto front, which is suitable for optimizing multiple conflicting objectives without affecting the indicators; (2) based on fitness sorting, which is suitable for quickly selecting the average and relative difference among the schemes in the evolutionary optimization process; (3) based on specific fitness sorting, which is suitable for quickly selecting a scheme when a certain optimization indicator reached the maximum value among all schemes in the evolutionary optimization process.
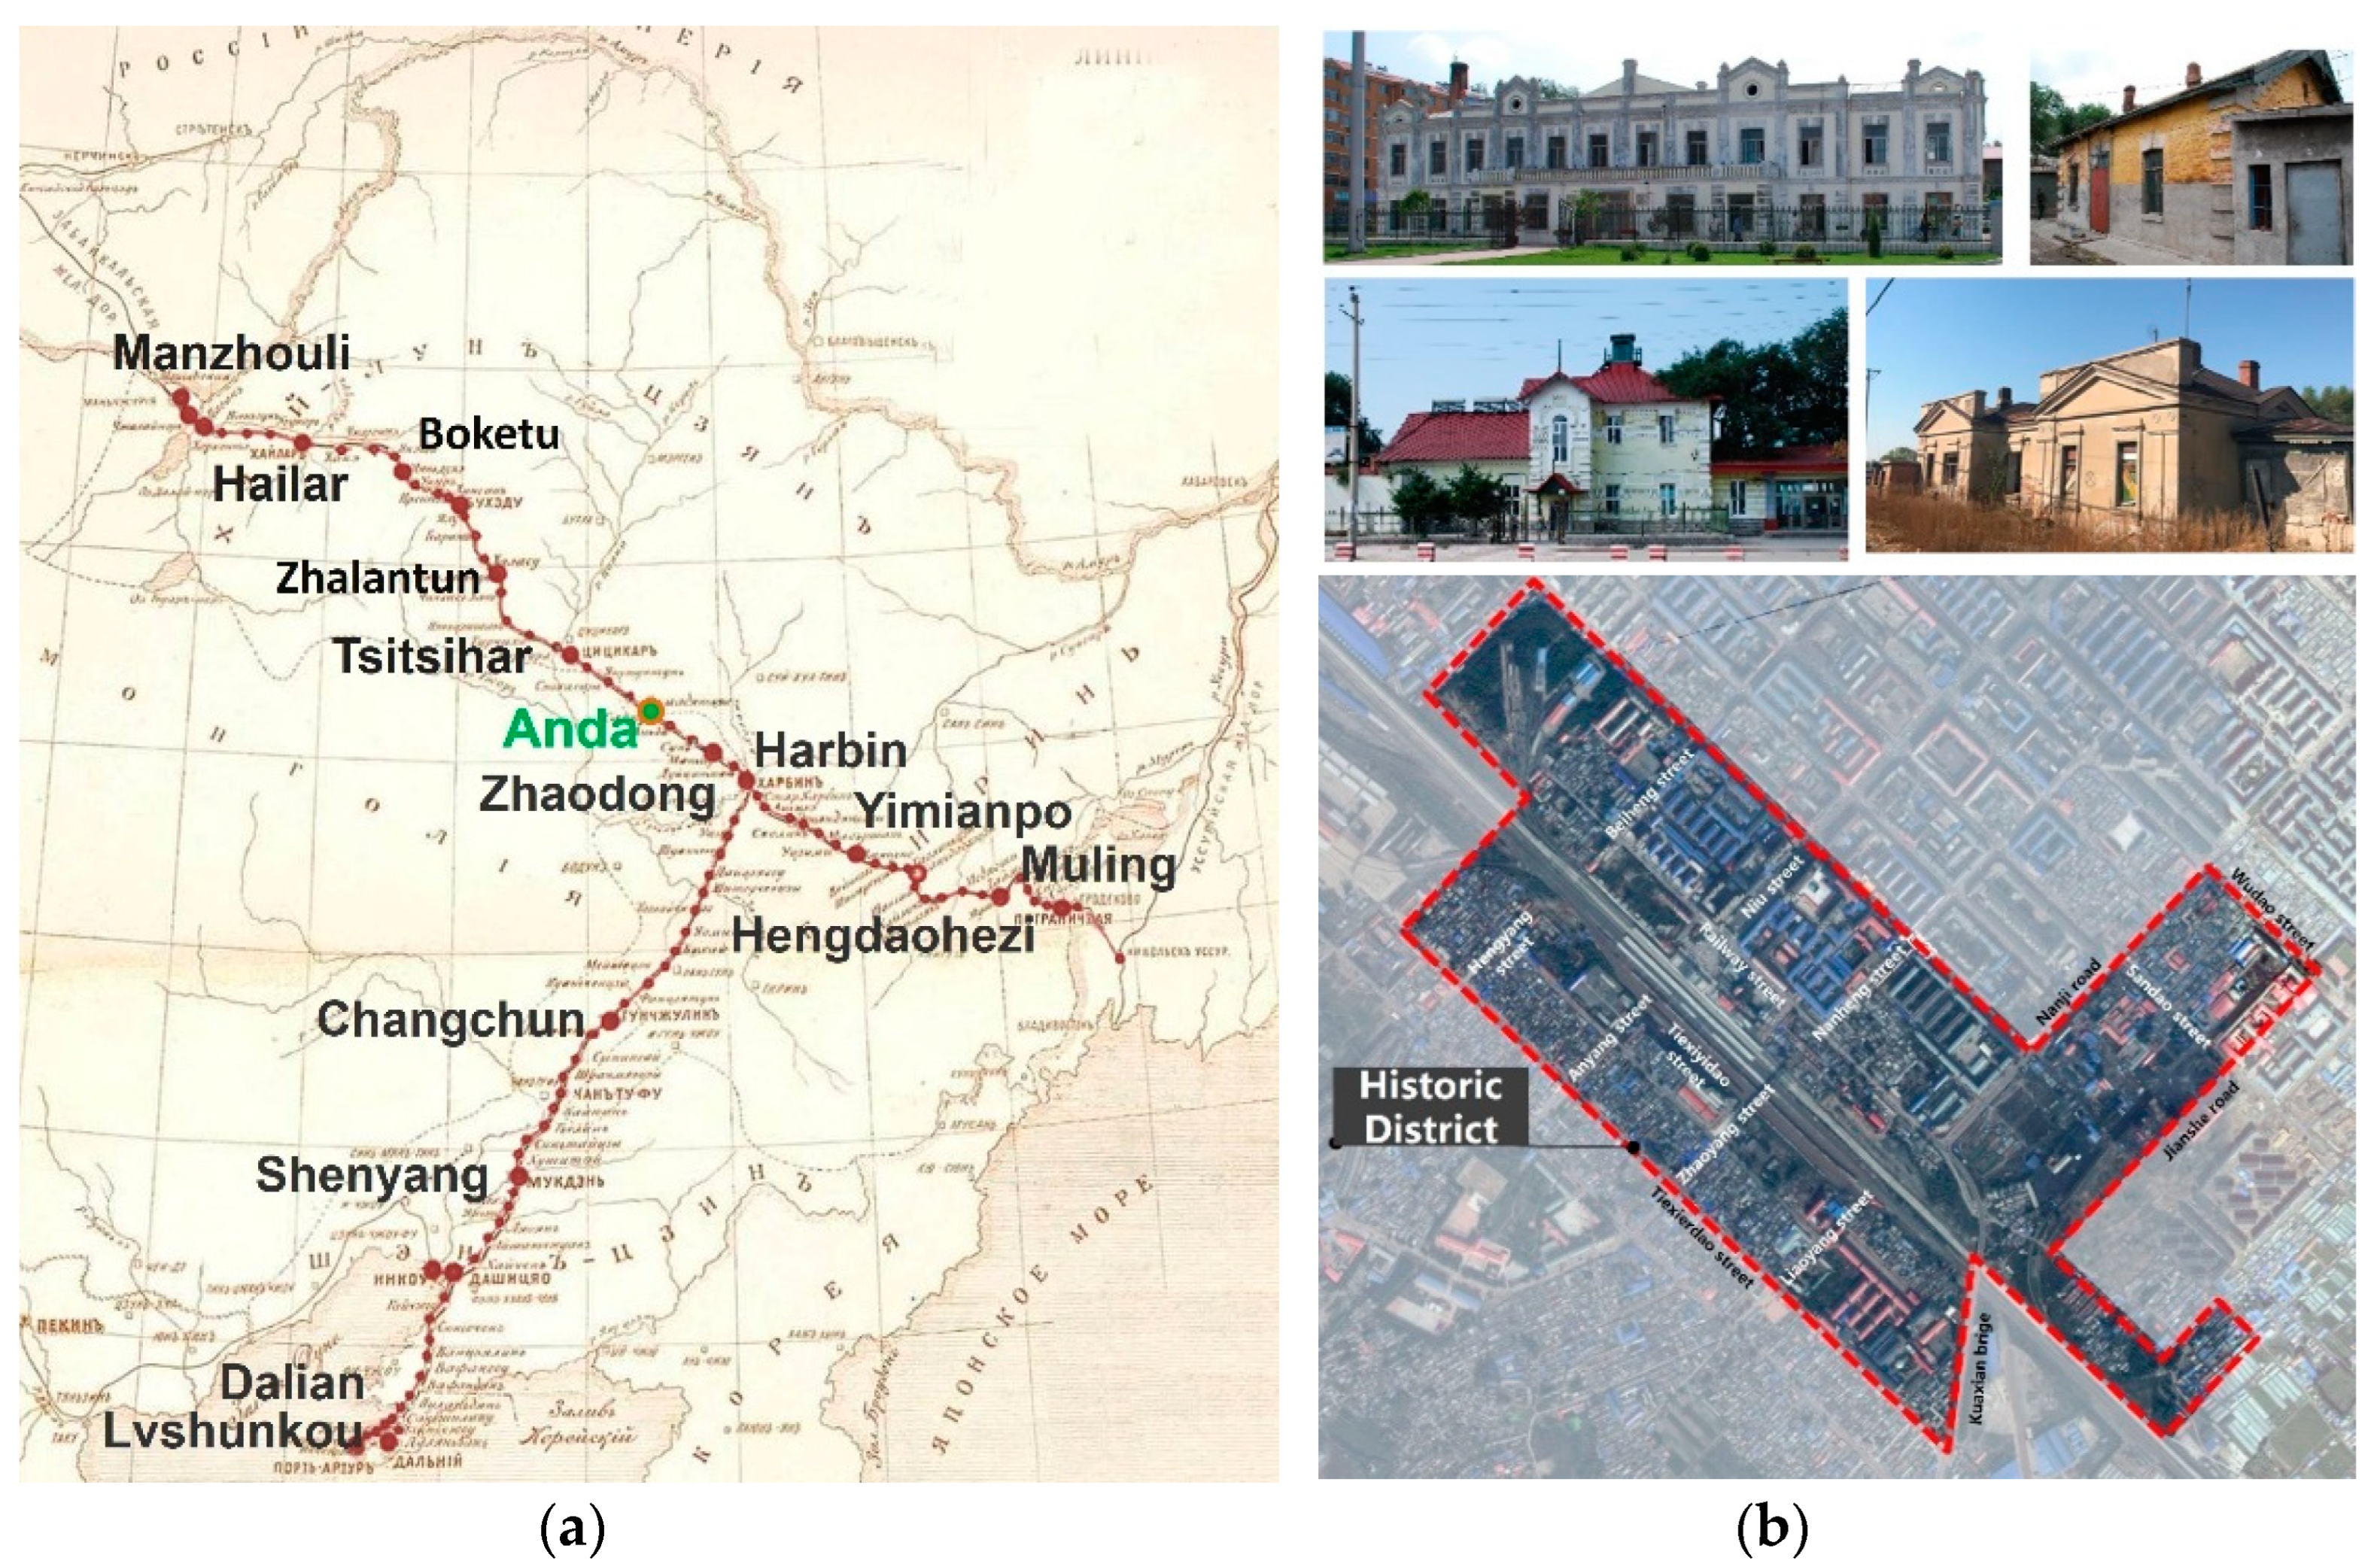
2.2. Case Introduction
The Chinese Eastern Railway is a part of the Trans-Siberian Railway, built by the Russian government in 1896. It spans Heilongjiang, Jilin, and Liaoning provinces and the Inner Mongolia Autonomous Region, forming a T-shaped railway line. It is also China’s first railway that meets international standards. The construction of the railway prompted the development of the surrounding cities and towns, leading to the creation of a Chinese Eastern Railway building complex consisting of various European-style and Chinese–Western buildings (structures), most of which maintain the original patterns and architectural styles of the cities and towns. The area in front of Anda Railway Station is a historic city block. The station was one of the first eight third-class stations built by the Chinese Eastern Railway, which consists of 2 provincial-level and 62 city-level cultural preservation buildings in the Russian style (Figure 2). With the effort of the Anda Municipal People’s Government, shanty towns in the historic city block have been relocated, and the block has been redeveloped and utilized. This study attempted to preserve the cultural buildings and street patterns of the historic city block in front of the railway station and to renovate it into a Russian-themed block providing food and beverages, shopping areas, entertainment, and accommodations.
Figure 2.
(a) The location map of main stations of Chinese Eastern Railway (China section); (b) satellite picture and current photos of the historical city block in front of the railway station in Anda City, Heilongjiang Province, China.
3. Practical Case Application
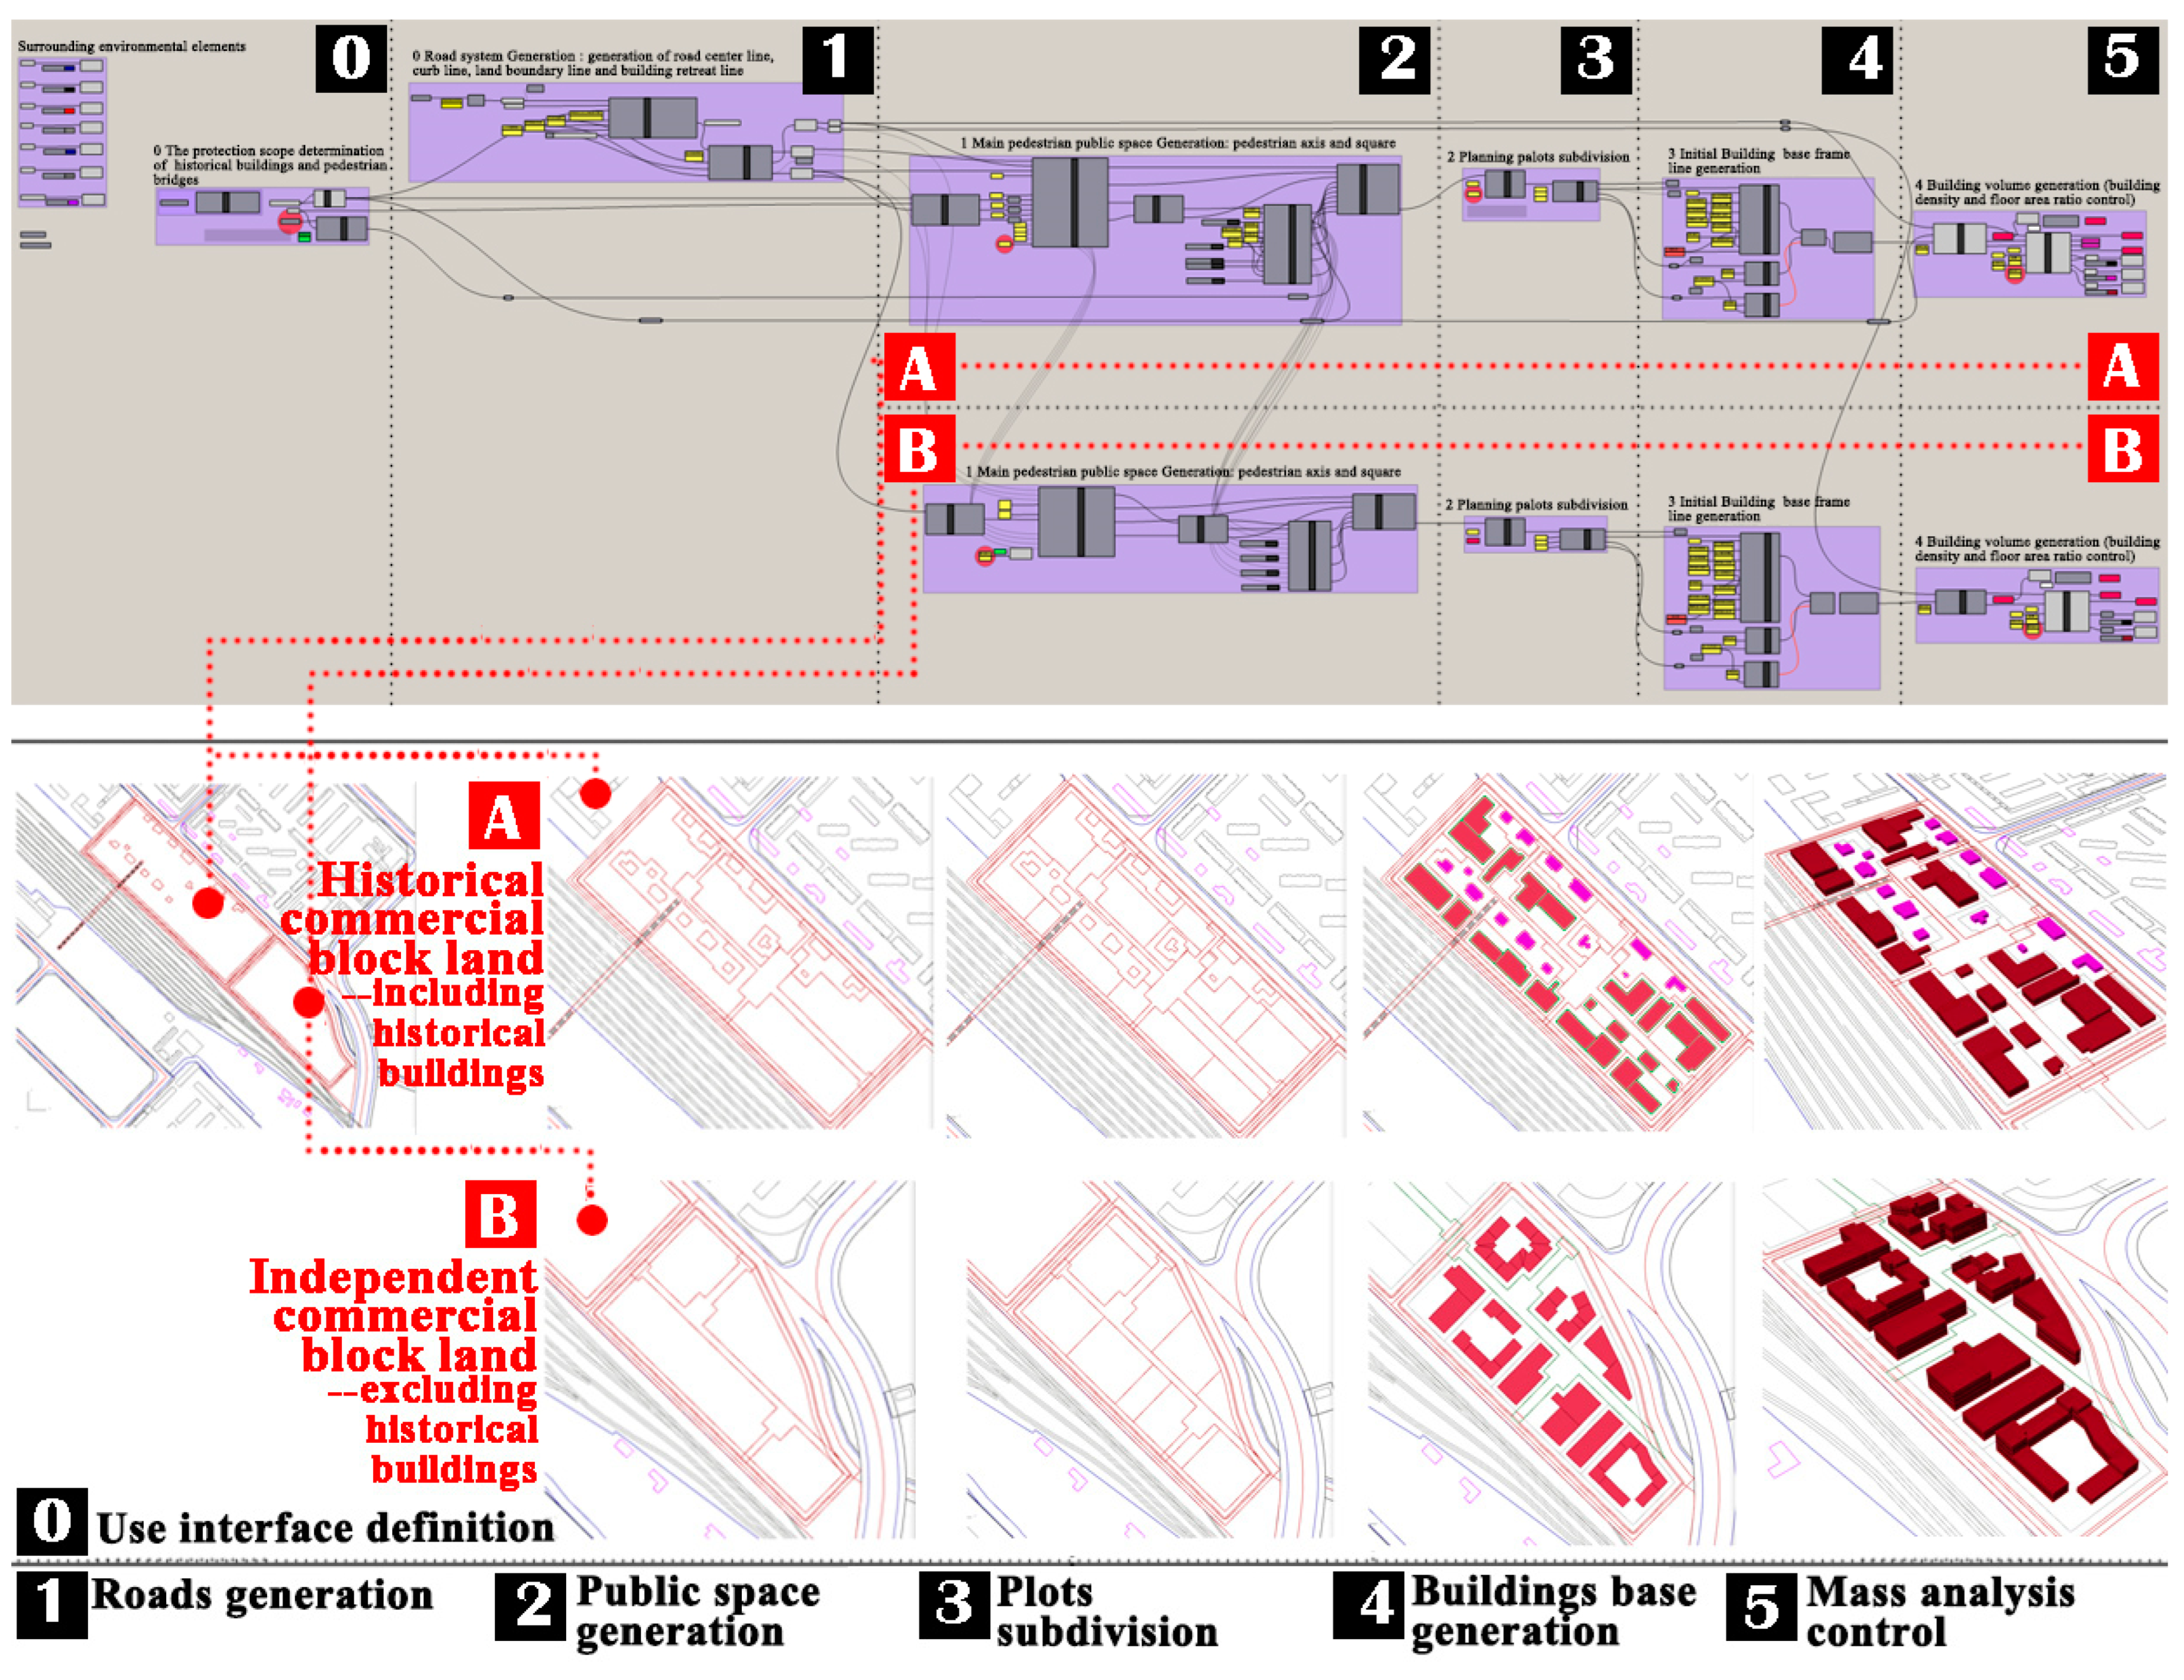
3.1. Generation of Parametric Intelligent Scheme Model
On the basis of the land requirements of the upper-level planning and of development potential assessment of the land, the core site of the historic city block was selected as the experimental plot, with an area of approximately 13 hectares. By combining the spatial layout planning features of the historical city block in front of the railway station in Anda City, such as square block, garden style, and symmetrical linear layout of historical buildings, this planning continues its original “top-down” design idea, and carries out the auxiliary design of parametric intelligent scheme model through the urban block design grammar based on shape grammar, which is mainly divided into four steps:
- (1)
- Data analysis and determination of design goals: Sorting and analyzing the original data of the block for organizing the thought before determining the design scheme and determining the design goals of the case in combination with the master planning and case reference.
- (2)
- Determination of ontology of the urban block design: Structurally defining the objects, types, parts, and relationships in the field of block-level urban design. By referring to the definition of urban design ontology proposed by Beirão [], the eight main systems developed in the urban design field of the case block, including the street system, built system, property system, natural system, reference system, public space system, activity system, and charisma system, and the object class of each system, are determined.
- (3)
- Feature extraction of shape elements of urban block design ontology: Extracting morphological and topological relationships of each object and between objects according to the definition of urban design block ontology as the basic consideration of the urban design rules.
- (4)
- Editing and application of urban block design grammar: Determining new shape design rules as the generation elements in combination with the characteristics of ontology shape elements and design principles for completing the grammar-assisted intelligent generation of the development scheme based on grammatical structure sequence conforming to the design idea of “top-down”, combination of multiple urban inductive pattern languages based on shape grammar, and setting of control parameters that meet the requirements of urban design and specifications.
Through the above research steps, according to the specific design objectives of different plots, historical commercial theme street plots (including historical buildings) and independent commercial theme street plots (excluding historical buildings); three main performance indicators of specific building density, floor area ratio, and green area ratio; and the parametric scheme models of different plots of the core site of the historical city block in front of the railway station in Anda City are finally generated (Figure 3).
Figure 3.
Schematic diagram of generation process of parametric scheme model of the historical city block in front of the railway station in Anda City, Heilongjiang Province, China.
3.2. Determination of Optimization Objectives and Variable Genes
First, the optimization objectives were set. The theoretical research and practical aspects of the preservation, renewal, and reuse of the historic city block were not large-scale demolition and reconstruction but a gradual and comprehensive process of renewal that incorporated humanism and material and spiritual relics []. Thus, a multiobjective reconstruction method that benefits the environment was developed []. However, no unified standard is available to assess indicators of historic city block preservation and reuse. These indicators generally include physical space, traffic, commercial facilities, culture, and the residents’ lives. According to the above situation, based on the three performance indicators generated by the parametric intelligent scheme evaluation, the environmental and economic considerations are added to determine the following optimization objectives (indicators): the building density, the floor area ratio, the green area ratio, total selling price, and the site’s solar irradiance during the winter solstice.
Second, the variable genes were set. In the process of parametric intelligent scheme generation, the parameter level of control scheme model generation is set according to the principle of operability, and the concise and specific parameters can be selected as the primary parameters for facilitating other designers or non-professionals to control and observe the schemes. Other parameters can be set as secondary or tertiary parameters according to the requirements of programming. The first-level control parameter is selected as the variable gene of multiobjective optimization, including:
- ■
- Width of the principal walking axis (5–10 m)’;
- ■
- The relative position of the center line of the principal walking axis (0–1);
- ■
- Subdivision ratio of plot edge line (0.3–0.7);
- ■
- Segmentation ratio of the combined building (0.3–0.7);
- ■
- Length of planned historic building façade (13–26 m);
- ■
- The lateral spacing of planned historic buildings (15–25 m);
- ■
- Number of planned floors (1–3) for buildings on historical commercial theme street (including historic buildings);
- •
- Courtyard-style segmentation to generate building depth (10–13 m);
- •
- Courtyard-style segmentation to generate lateral spacing between buildings (2–4 m);
- •
- Number of courtyard-style buildings to be removed (0–2);
- •
- The number of planned floors (1–4) in buildings on a detached commercial theme street (excluding historic buildings).
■ denotes the design variables of the historical commercial theme street (including historic buildings), and • denotes the design variables of the detached commercial theme street (excluding historic buildings). In order to reduce the amount of program calculation and accelerate the speed of evolution, the specific value of the control parameter variable gene is taken at fixed intervals within the original range. Possible values for these variables in the grammar design are as follows:
Width of principal walking axis ∈ [5, 6, 7, 8, 9, 10] m;
The relative position of the center line of the principal walking axis ∈ [0.1, 0.2, 0.3, 0.4, 0.5, 0.6, 0.7, 0.8, 0.9, 1];
Subdivision ratio of land edge line ∈ [0.3, 0.4, 0.5, 0.6, 0.7];
Segmentation ratio of combined building ∈ [0.3, 0.4, 0.5, 0.6, 0.7];
Length of planned historic building façade ∈ [13, 14, 15, 16, 17, 18, 19, 20, 21, 22, 23, 24, 25, 26] m;
The lateral spacing of planned historic buildings ∈ [15, 16, 17, 18, 19, 20, 21, 22, 23, 24, 25] m;
Courtyard-style segmentation to generate building depth ∈ [10, 11, 12, 13] m;
Courtyard-style segmentation to generate lateral spacing between buildings ∈ [2, 3, 4] m;
Number of courtyard-style buildings to be removed ∈ [2, 3, 4];
Number of planned floors in buildings on detached commercial theme street (excluding historic buildings) ∈ [1, 2, 3, 4];
The number of planned floors in buildings on a historical commercial theme street (including historic buildings) ∈ [1, 2, 3].
Design space was defined by variable range, that is, the number k of changes (V) in n elements that can be repeated, Vn,k = nk. If the number of building plots is 5, the number of combined buildings generated through segmentation is 15, the number of historic buildings generated through sequential segmentation is 10, the number of other buildings is 5, and the number of possible changes in the urban design scheme for the detached commercial theme street (excluding historic buildings) is as follows:
(105)(55)(155)(1025)(303) = 6.41 × 1043
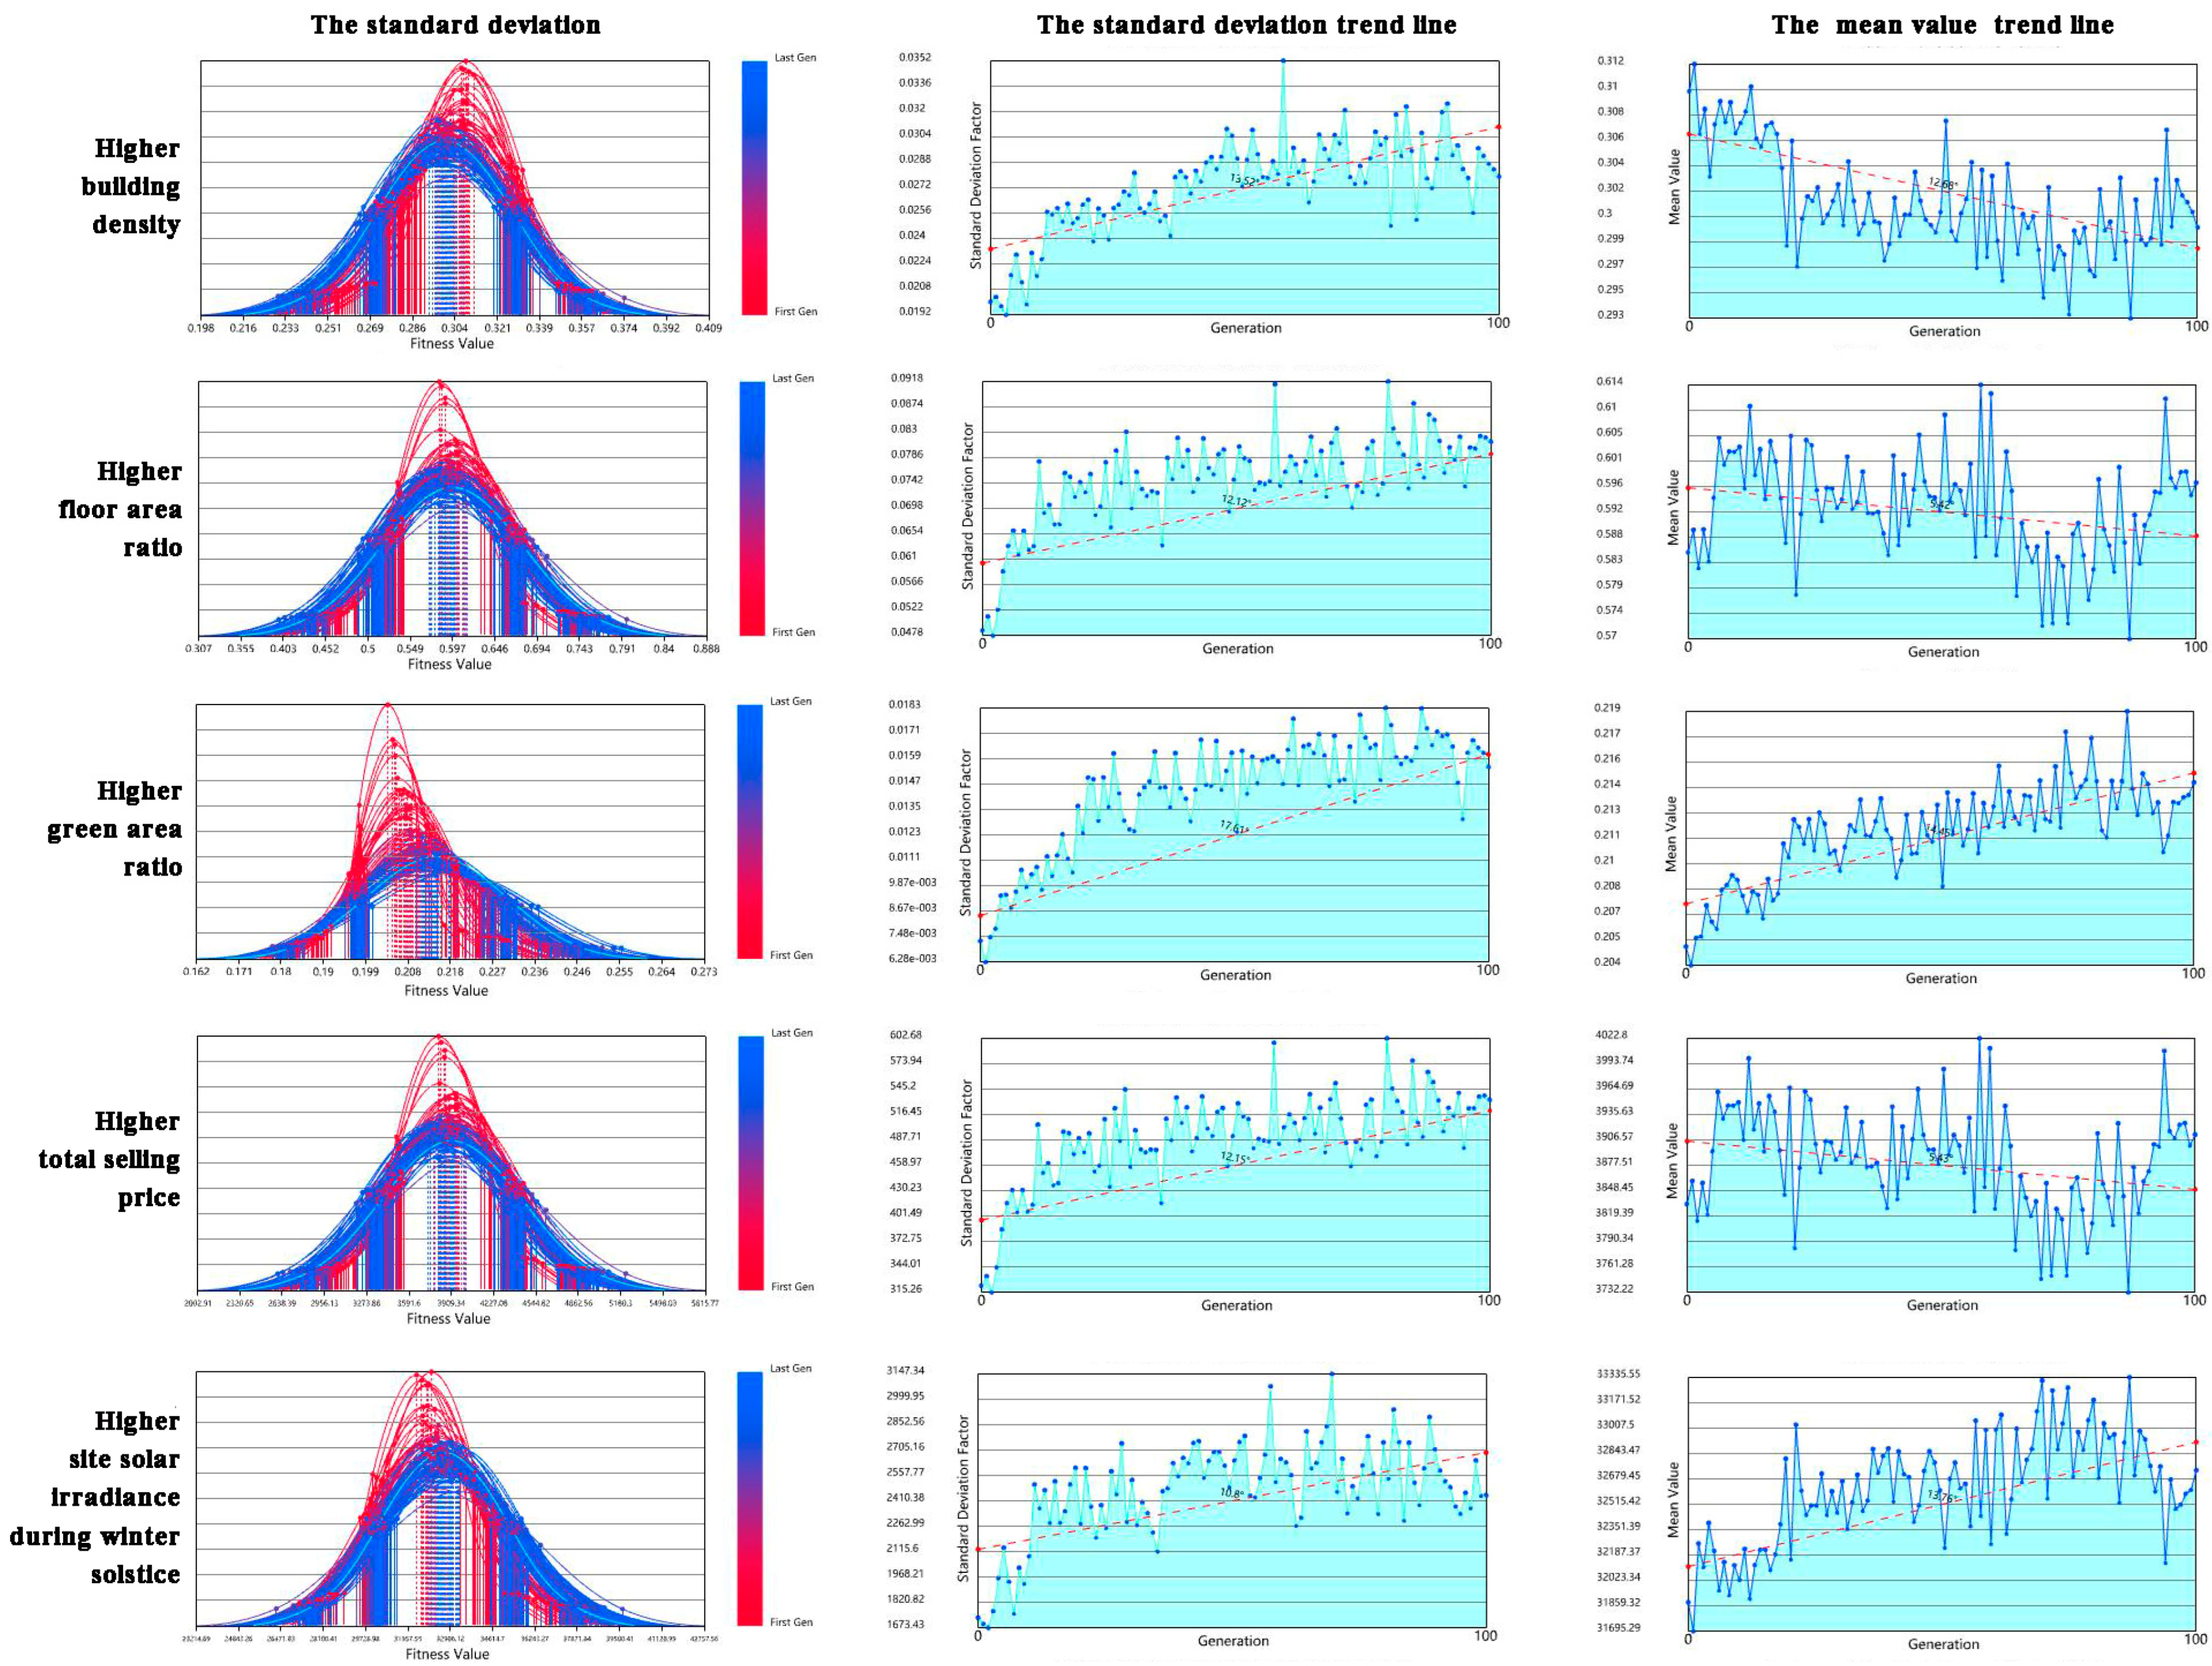
3.3. Comprehensive Optimization of Multiobjective Schemes
Because each site has a different design goal, comprehensive multiobjective optimization was conducted separately for each site. First, initial generation was performed, which consisted of models randomly generated by variable genes that control the shape of the initial scheme model.
Second, optimization objectives fitness was an analysis. The five optimization indicators identified above, namely the optimization objective function, are optimized for an urban patch. For urban block development, more light and green space are always positive features, so all optimization objectives must be achieved to the maximum extent:
- ■
- Higher building density;
- ■
- Higher floor area ratio;
- ■
- Higher green area ratio;
- ■
- Higher total selling price;
- ■
- Higher site solar irradiance during the winter solstice.
The upper limit of building density was 45%, the upper limit of the floor area ratio for the historical commercial theme street (including historic buildings) was 0.8, the upper limit of the floor area ratio for the detached commercial theme street (excluding historic buildings) was 1, the lower limit of the green area ratio was 20%, and the upper limit of the green area ratio of courtyard land on the site was 50%. The total selling price (general selling price obtained by the author by determining the selling prices of the accommodation, dining, shopping, and cultural and entertainment buildings in Anda City) of the historical commercial theme street (including historic buildings) was determined using three mixed functions for dining, shopping, and entertainment. For the historical commercial theme street, the proportion of restaurant buildings was 30% of the total building area (except for historic buildings that retain residential function), and the unit price was CNY 1500/m2. The proportion of shopping buildings was 25% of the total building area (except for historic buildings that retain residential function), and the unit price was also CNY 1500/m2. The proportion of cultural and entertainment buildings was 45% of the total building area (except for historic buildings that retain residential functions), and the unit price was CNY 1200/m2. The selling price of the detached commercial theme street (excluding historic buildings) was determined using three mixed functions for accommodation, dining, and shopping. The proportion of accommodation buildings was 60% of the total building area, and the unit price was CNY 1800/m2. The proportion of restaurant buildings was 25% of the total building area, and the unit price was CNY 1500/m2. The proportion of shopping buildings was 15% of the total building area, and the unit price was CNY 1500/m2. The site solar irradiance during the winter solstice was the total solar irradiance on the ground from 6:00 a.m. to 8:00 p.m. on 21 December (the winter solstice).
Third, the optimization conditions were set. The simulation conditions were set by adopting a strategy of balancing exploration, development, selection, and mutation, and the algorithm was directed to the optimal scheme within a feasible number. The following settings were used:
- Generation size: 100;
- Generation count: 100;
- Mutation probability: 30% (default value = one-point crossover);
- Mutation rate: 60% (default value = 20%);
- Crossover probability: 80% (default value = 90%);
- Crossover rate: 50% (default value = 20%);
- Number of genes: 5;
- Gene value: 190;
- Optimization objectives: 5.
The default optimization parameters were modified, and the following actions were taken after trial and error: (1) The probability and rate of mutation were increased to 0.3 and 0.6, respectively, to compensate for the small initial generation due to the small generation size (100), thereby producing additional genes. (2) The number of genes was reduced, and the genes with minor effects on the overall module of the urban design were eliminated to reduce the number of calculations and permutations.
4. Results
The analysis of the method results was divided into two steps: overall interpretation and scheme selection. Although the method was used for two sites, the principles, and procedure were identical. In the following subsection, the analysis of the historical commercial theme street site (including historic buildings) is used as an example.
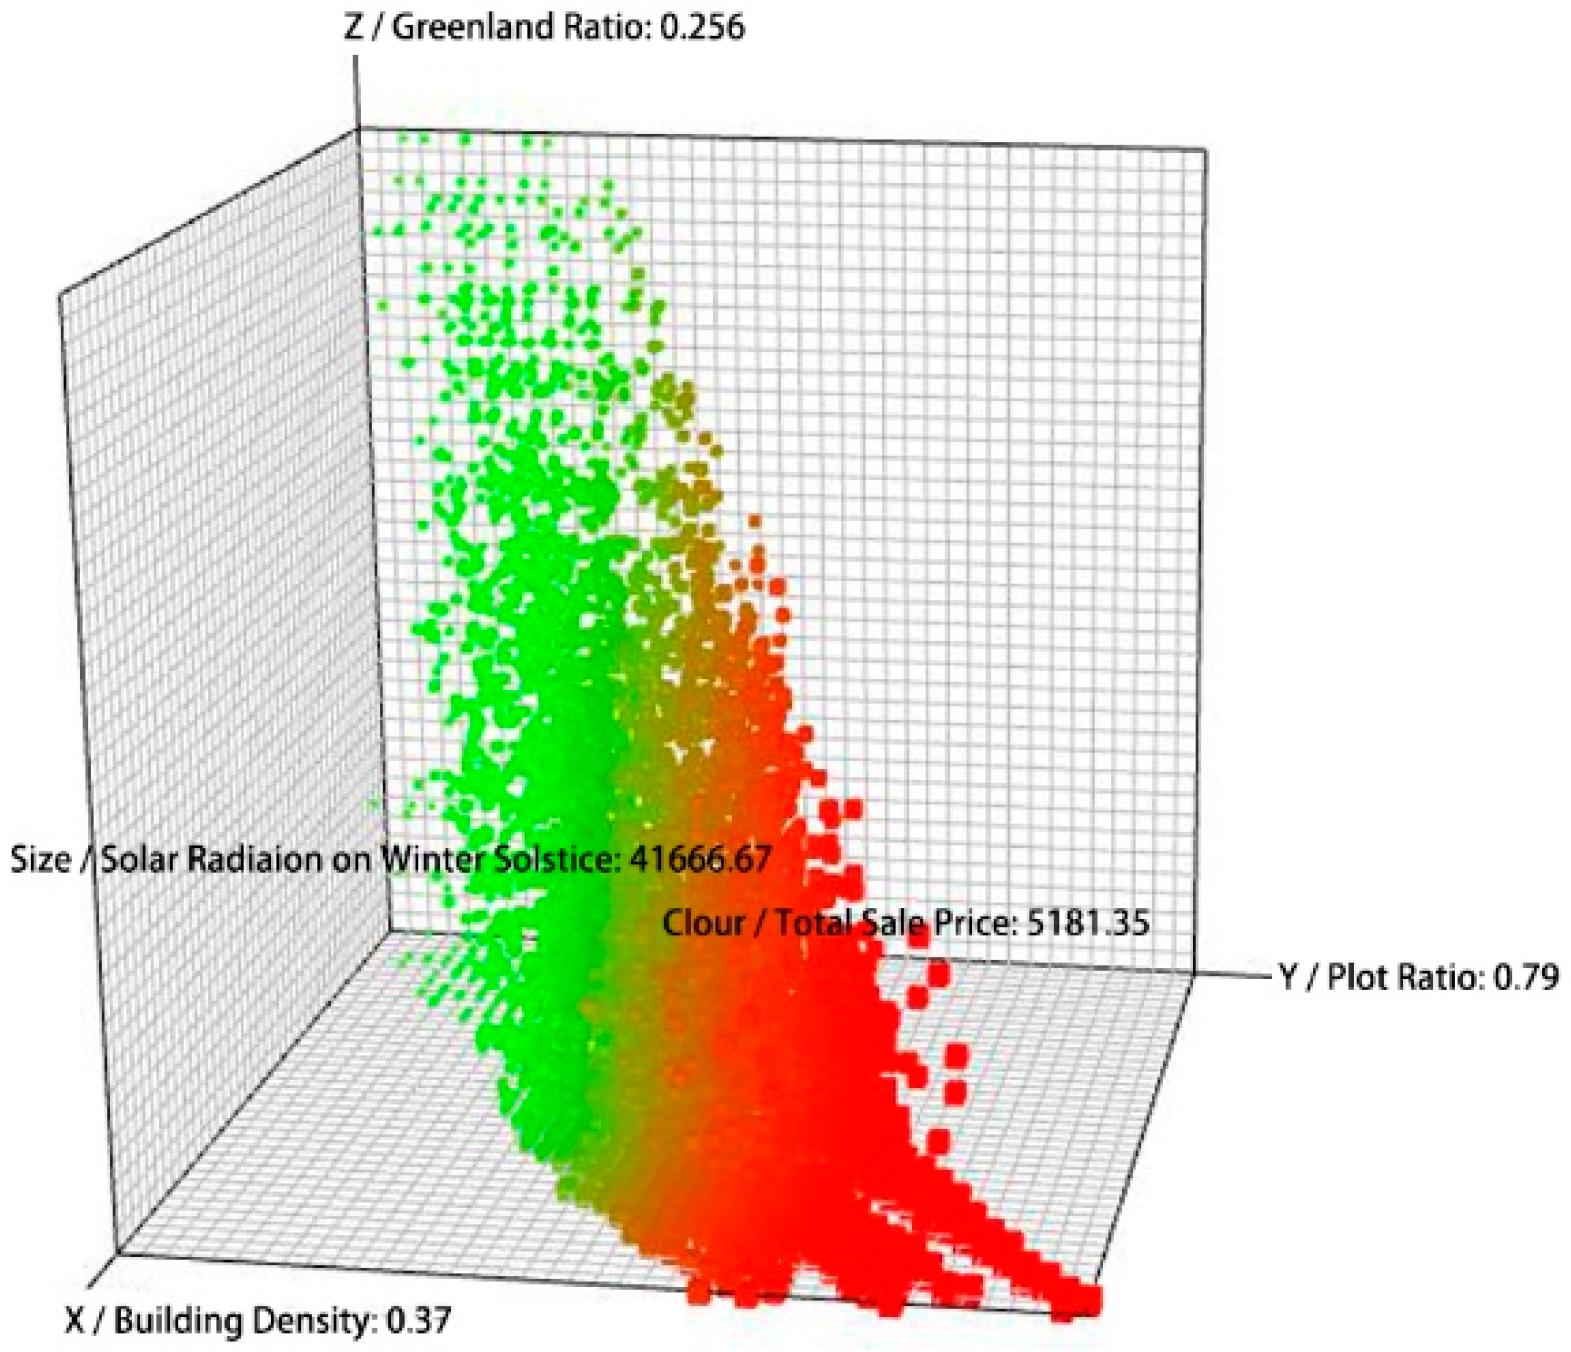
4.1. Overall Interpretation
The comprehensive optimization can be evaluated in terms of the fitness of the standard deviation graph, the standard deviation trend line, and the mean value trend line of the optimization results. In the standard deviation graph for optimization objective 1 (higher building density), the overall curve shifted to the left, and the mean increased. Then, it moved downward and widened, indicating that the standard deviation range increased. The standard deviation trend line exhibited an increase from 0.0192 to 0.0352. The mean line decreased from 0.312 to 0.293, indicating that it was optimized and evolved during the process (Figure 4).
Figure 4.
Standard deviations, standard deviation trend lines, and mean value trend lines of all fitness for comprehensive optimization of historical commercial theme street schemes (including historical buildings).
In the overall evolutionary simulation, increasing the generation diversity and fitness led to successful evolution. The fitness of the five optimization objectives reflected a high standard deviation, and the fitness of the standard deviation trend line of each generation increased. In addition, the fitness of building density, floor area ratio, and green area ratio was consistent with the control values of the initial design goal. The mean value trend line indicated that the increase in the mean fitness of each generation was caused by the green area ratio and site solar irradiance during the winter solstice.
4.2. Scheme Selection
On the basis that the comprehensive optimization and evolution process is reasonable, this study proposed three methods of scheme selection based on the Pareto front, fitness sorting, and specific fitness sorting.
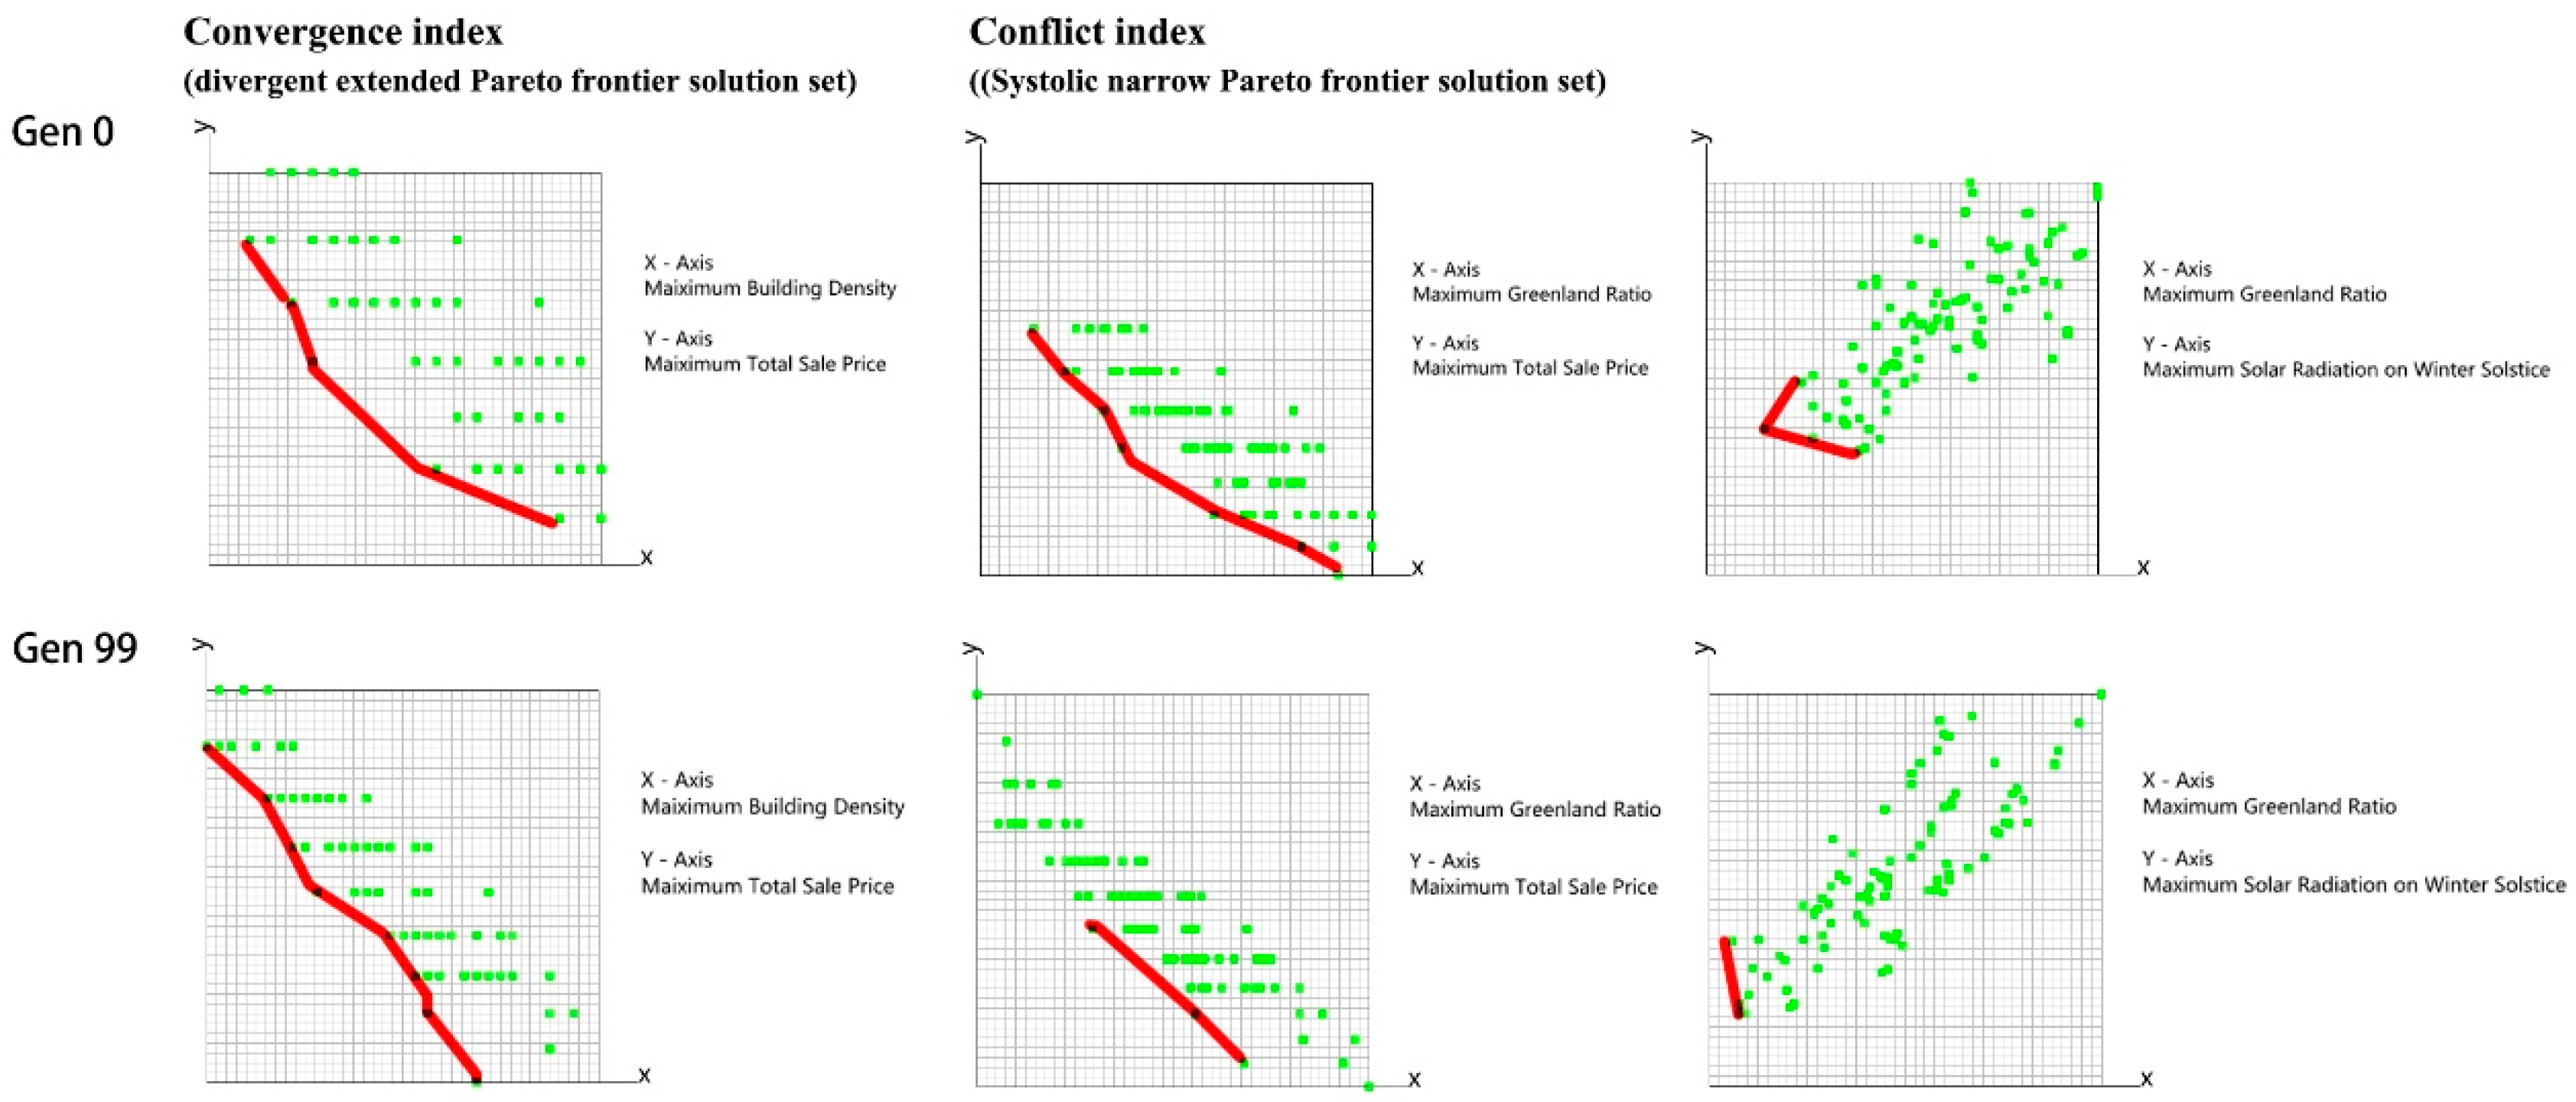
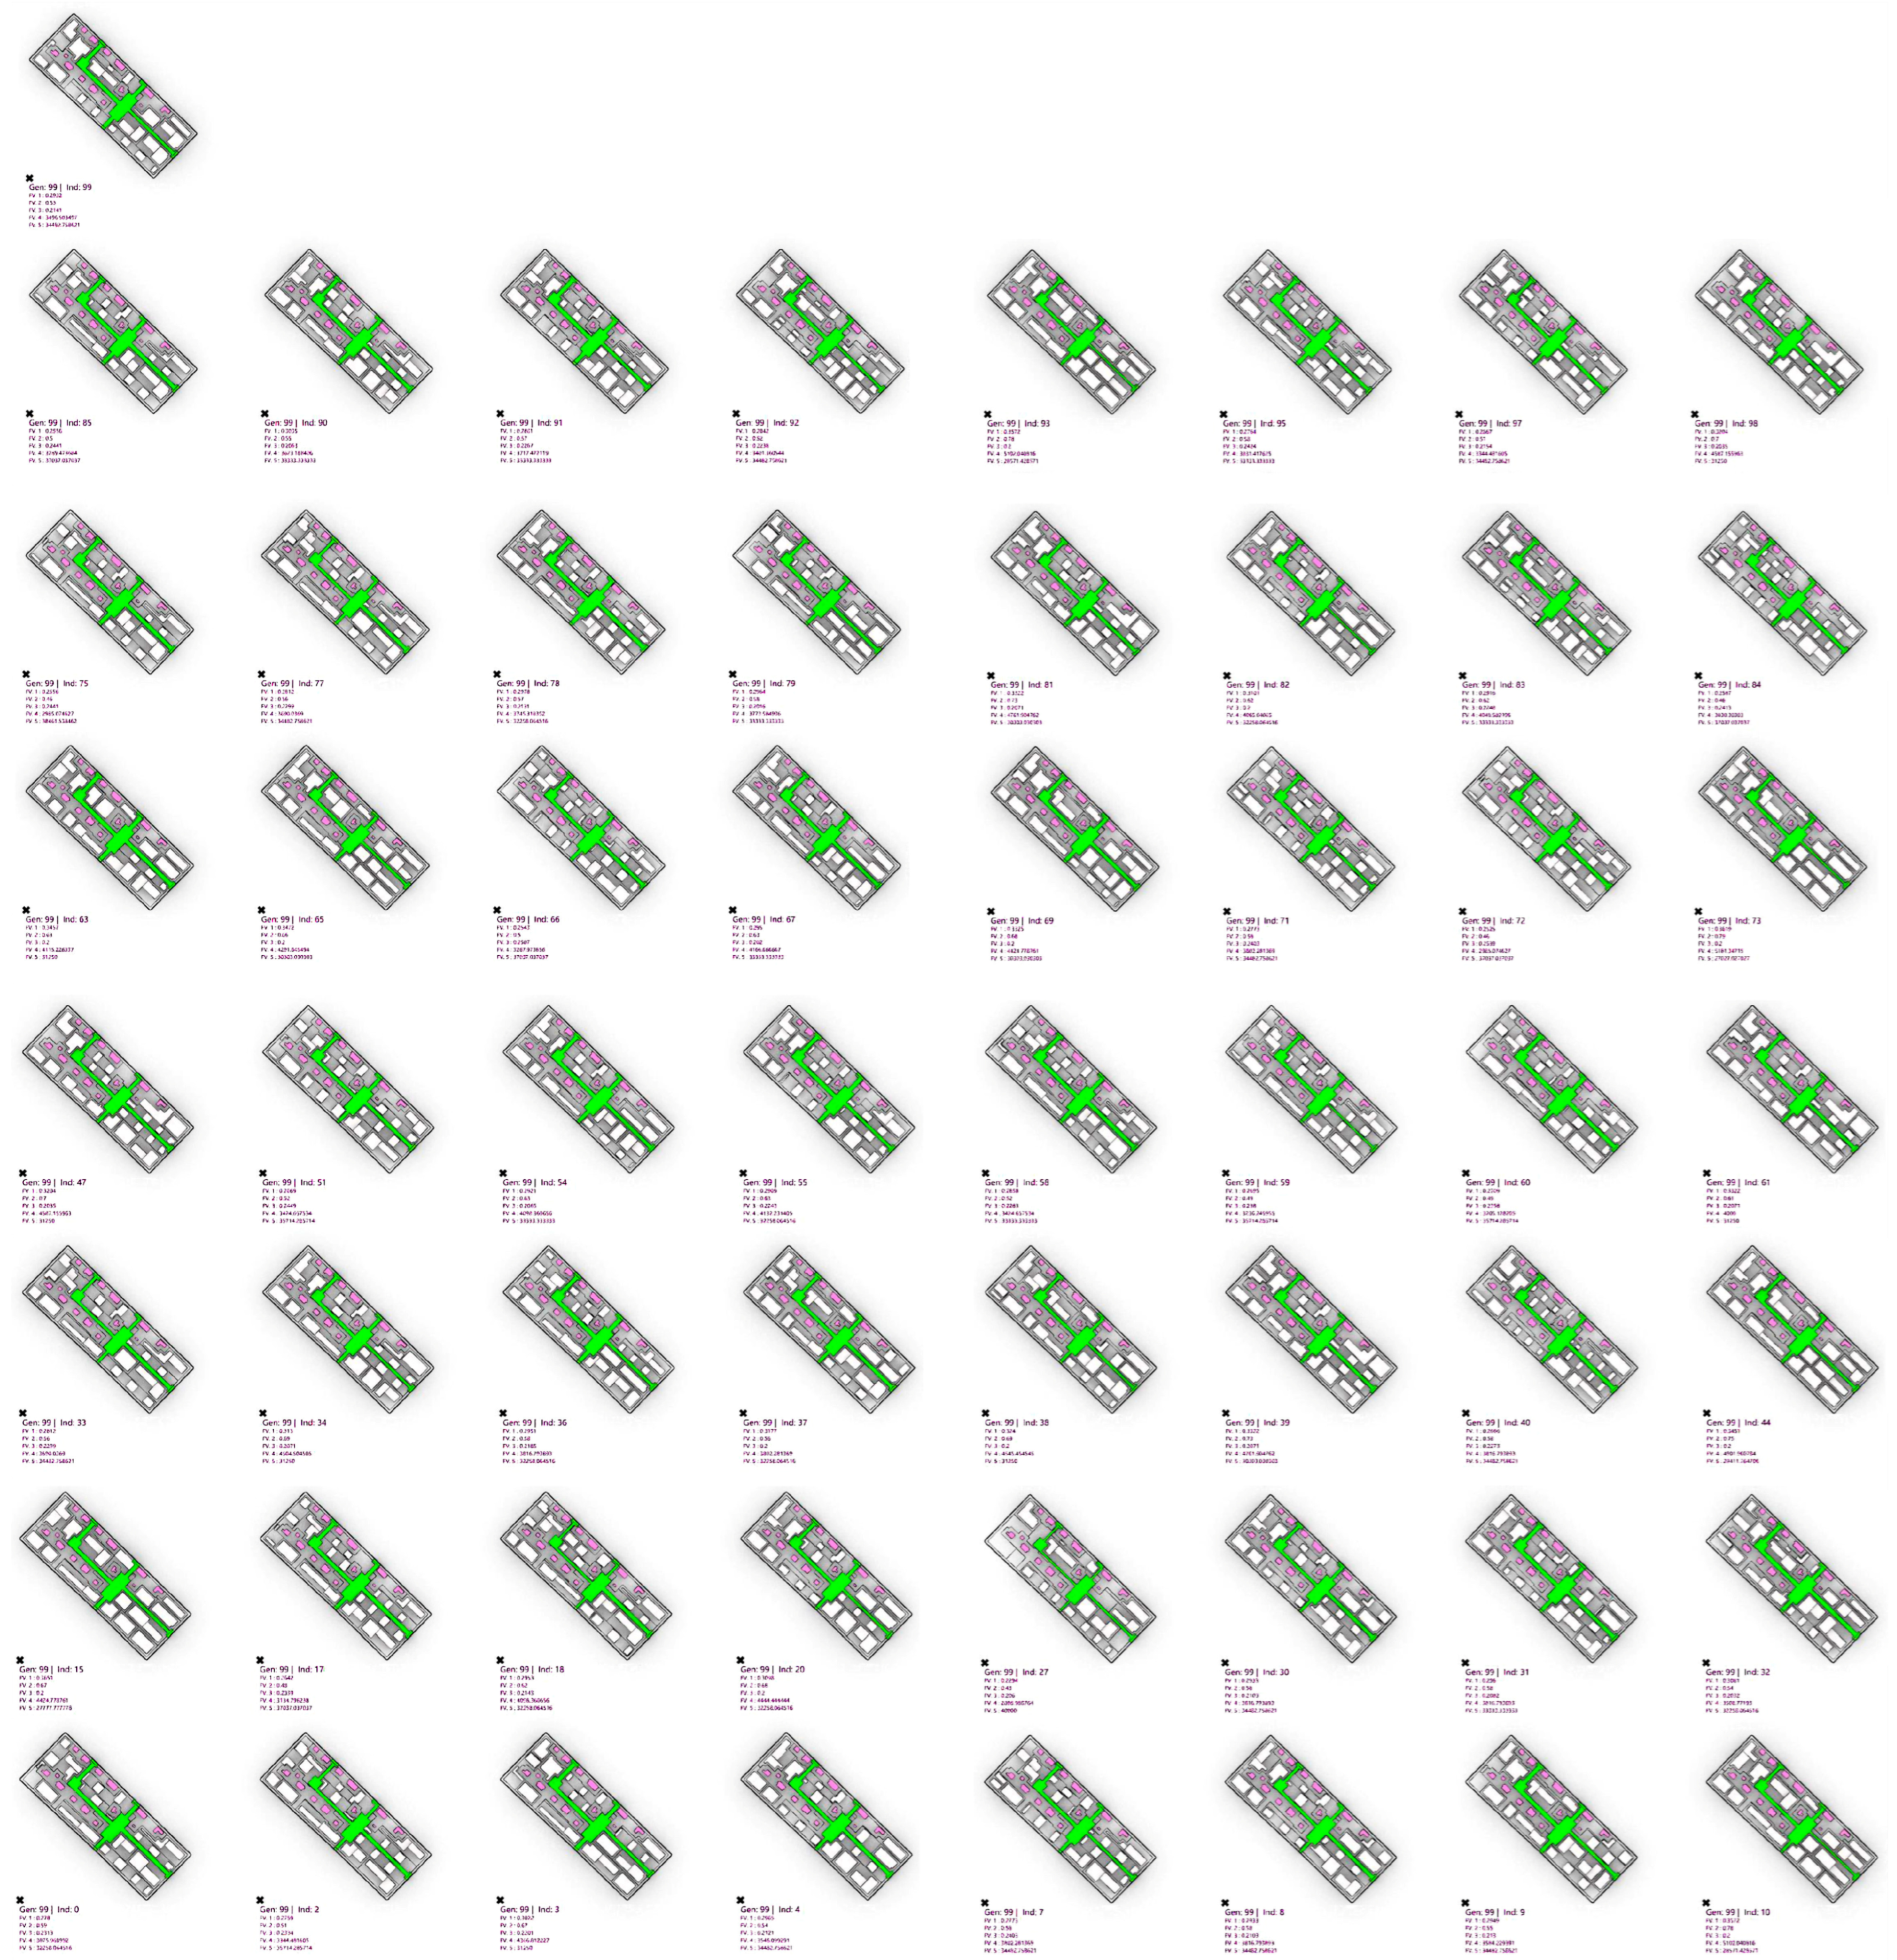
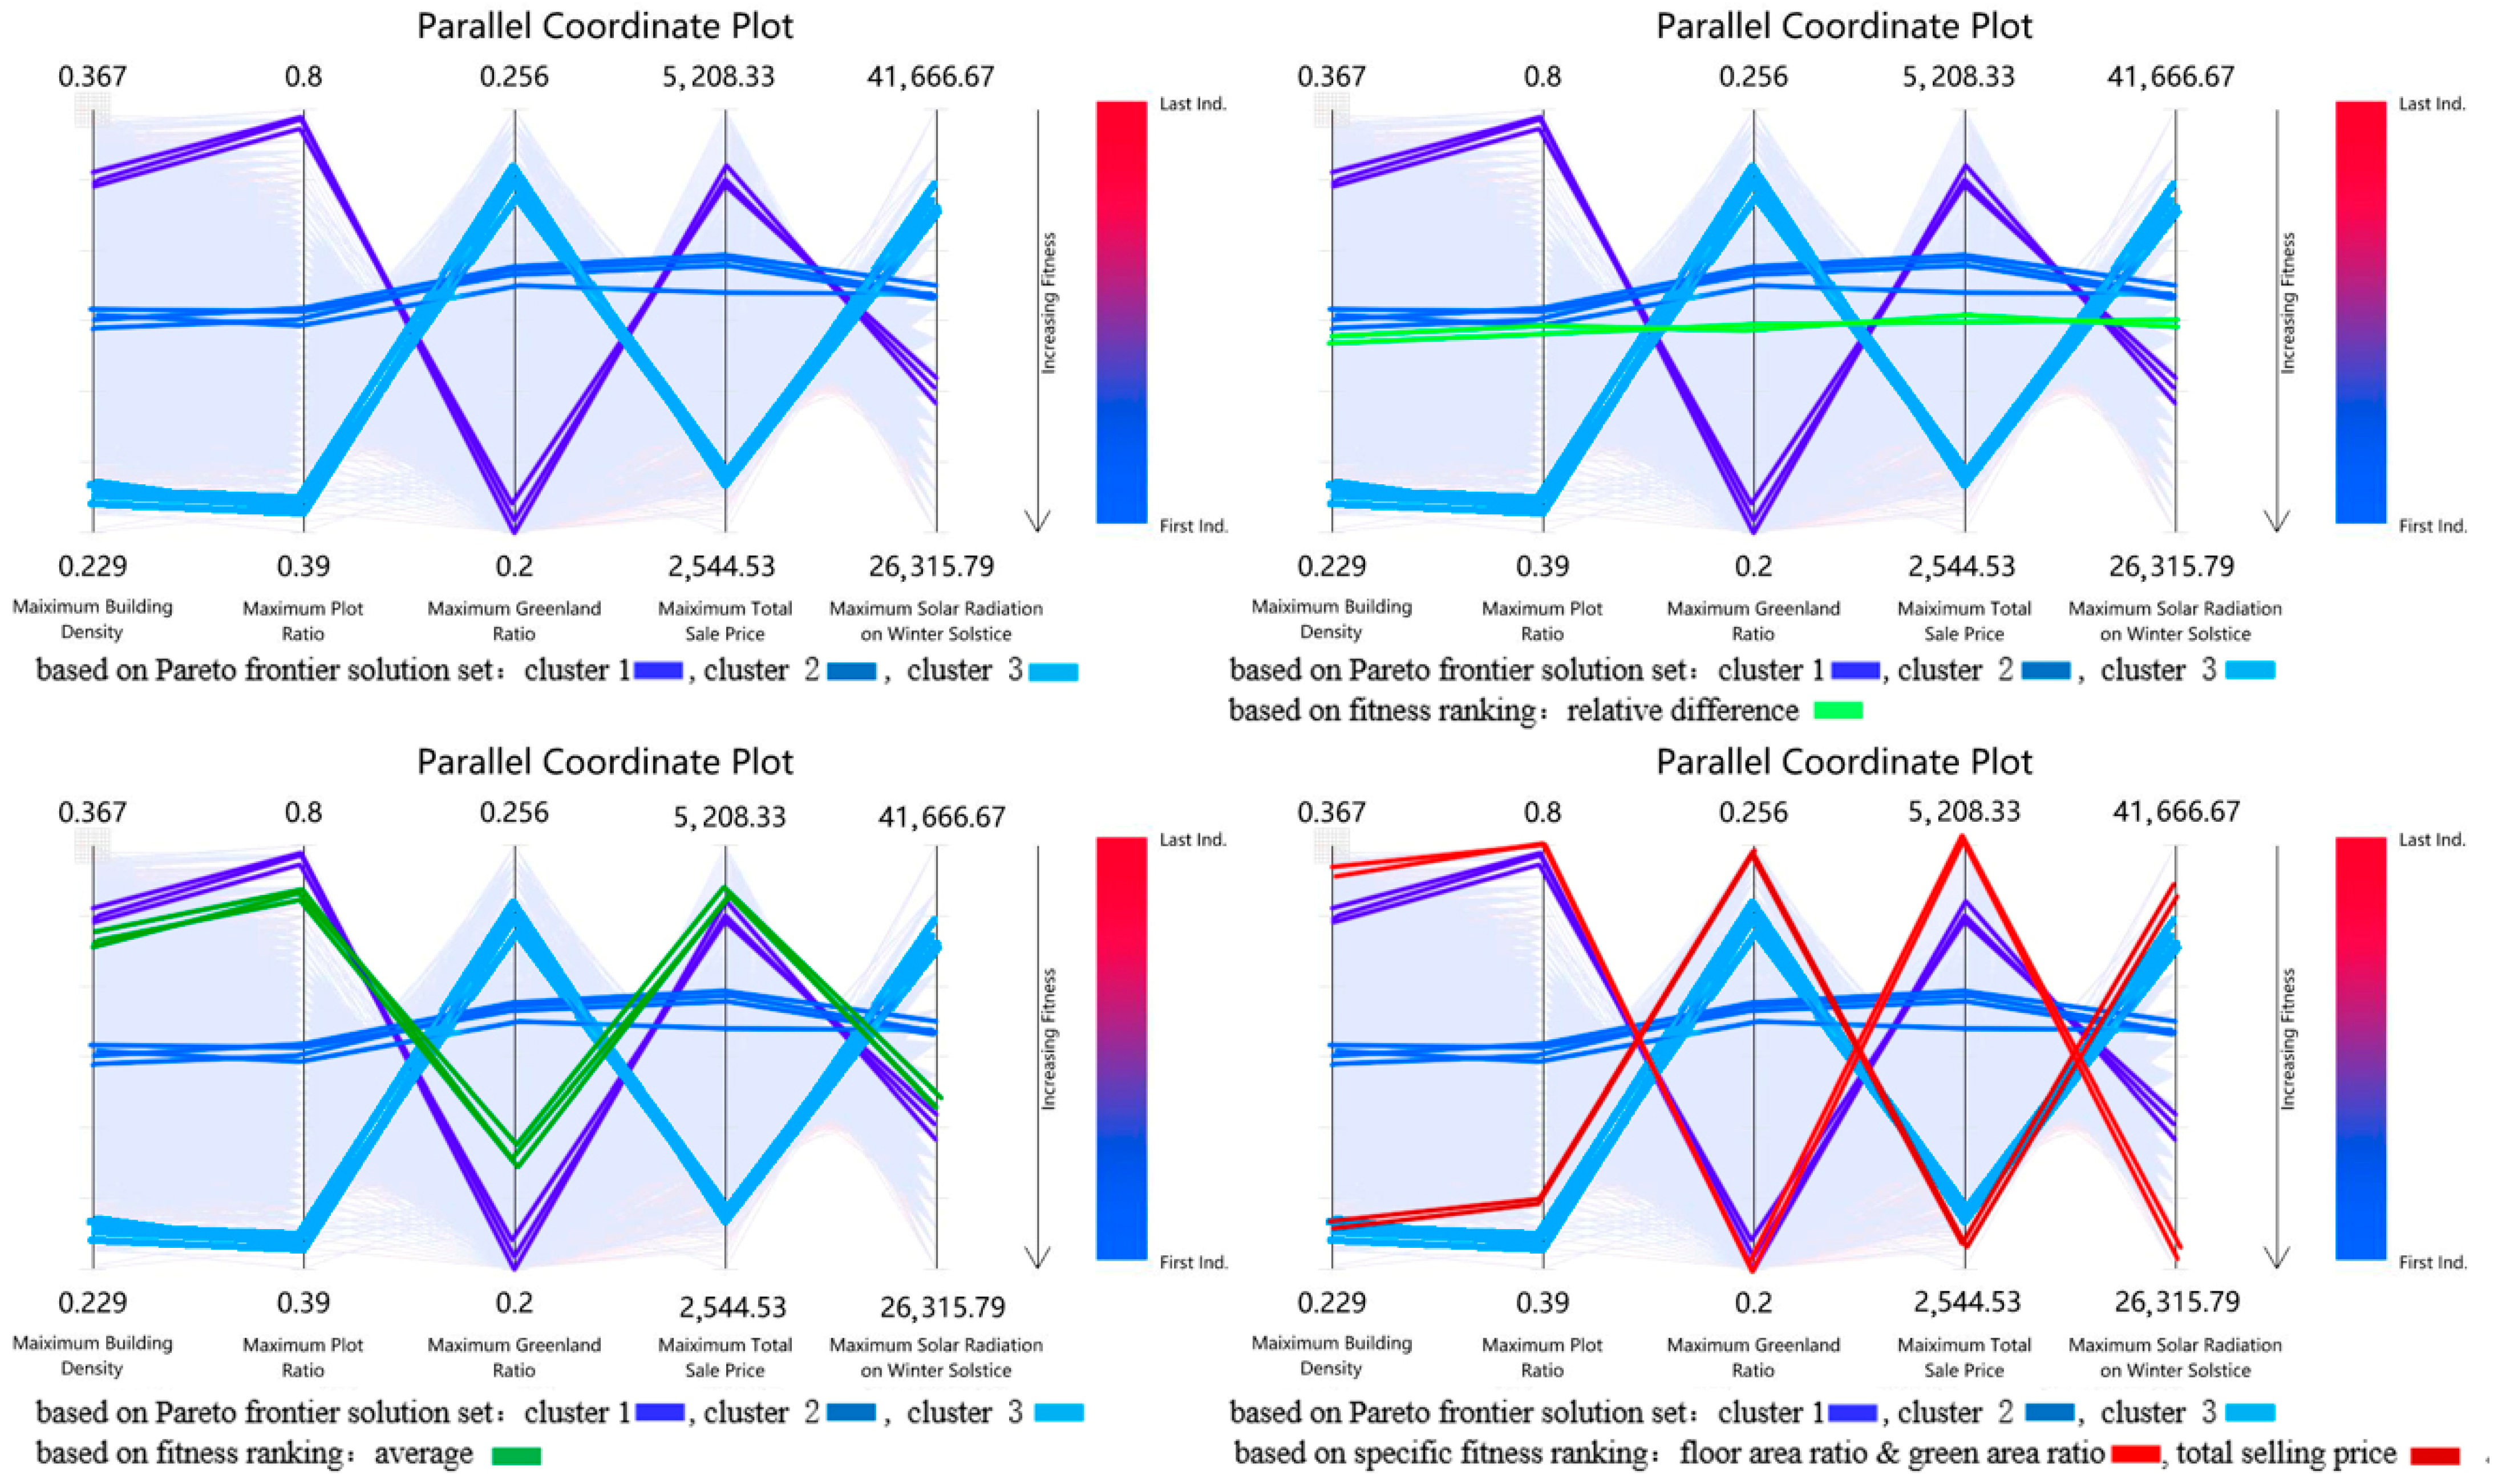
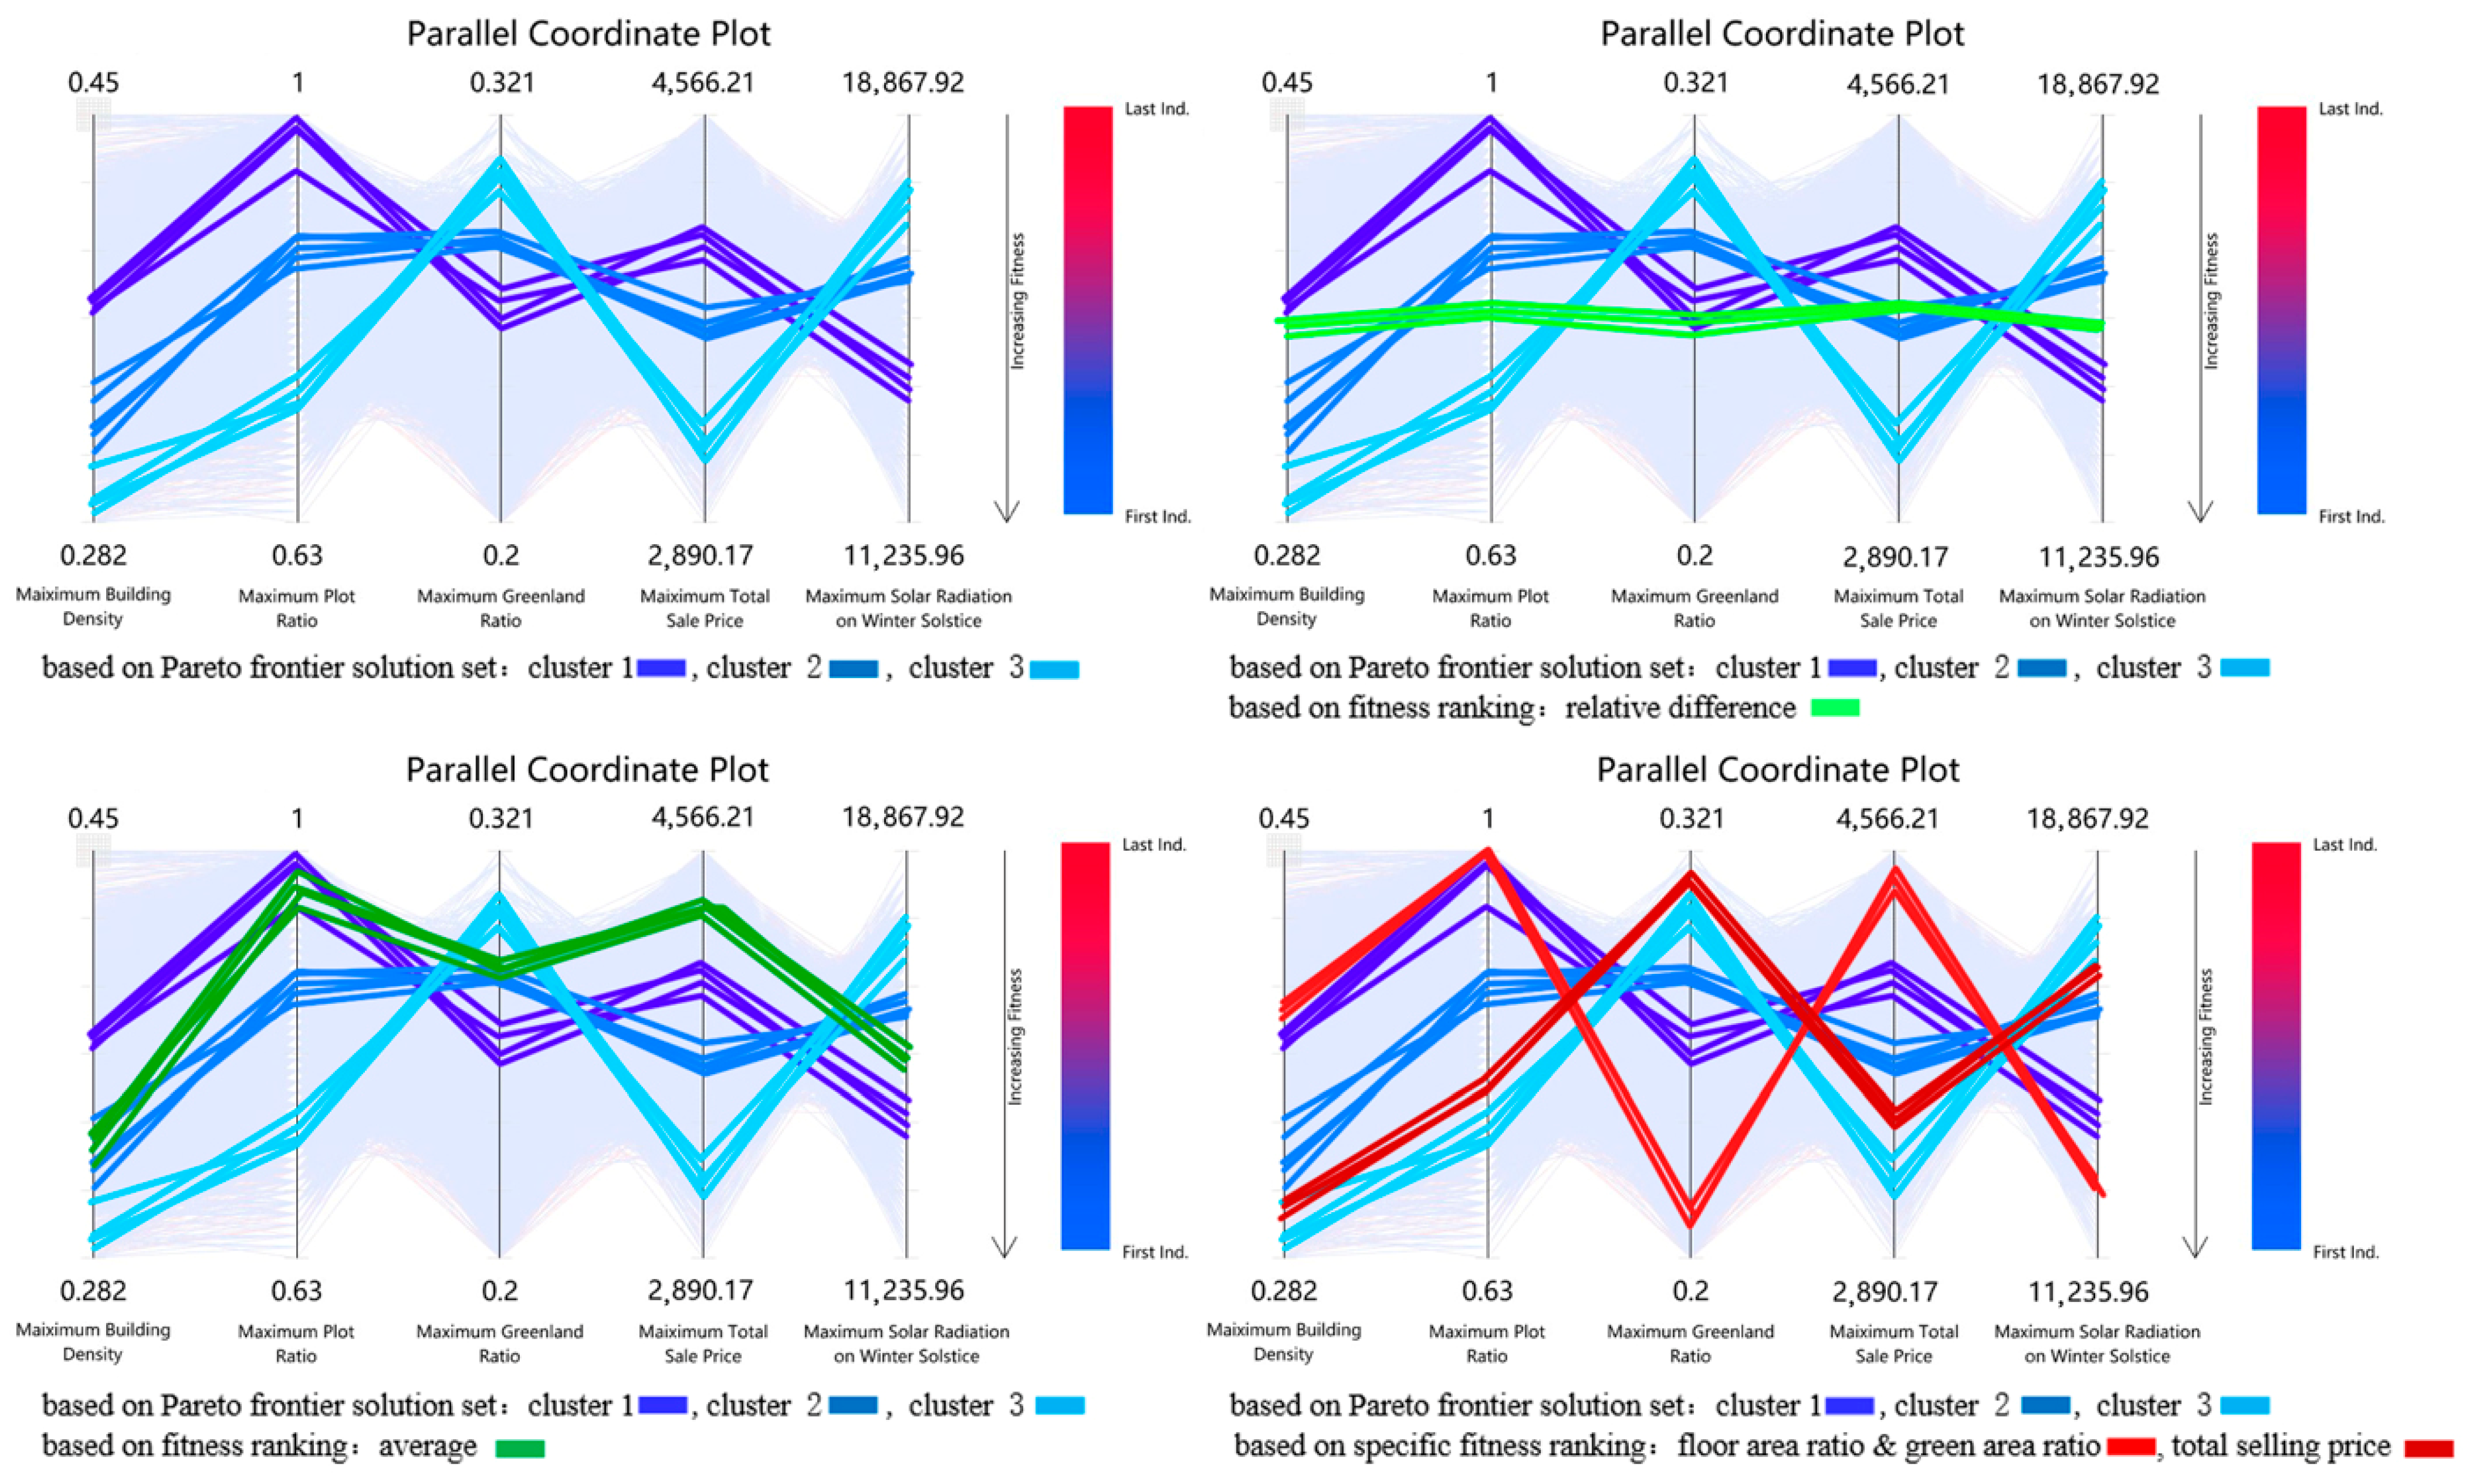
4.2.1. Analysis and Selection Based on Pareto Front
The scheme selection method based on the Pareto front was suitable for handling multiple conflicting indicators (optimization objectives) and optimizing each indicator without affecting the others. A final screening was conducted through a k-means clustering analysis of the Pareto front and architectural features of the schemes.
- (1)
- Overall evaluation of Pareto optimization results.
Pareto Optimality, also known as Pareto efficiency, is a concept in resource allocation. It means that resource allocation reaches an optimal and most reasonable state. The value of the objective function corresponding to the Pareto optimal solution is the Pareto optimal frontier. None of the Pareto fronts were perfect, but the multiple objectives were successfully balanced. Figure 5 depicts the Pareto front of the five optimization objectives of the urban design of the detached commercial theme street (excluding historic buildings) through a four-dimensional geometric illustration. The Pareto front is represented on three spatial axes (X-axis: building density, Y-axis: floor area ratio, Z-axis: green area ratio), and a fourth axis (total selling price) exhibits a gradient from red to green. The fifth axis (site solar irradiance during winter solstice) represents a scale from large to small.
Figure 5.
Pareto solution set spatial distribution map for multiobjective optimization of urban design schemes of historical commercial theme street schemes (including historical buildings).
This study examined the relationships among the fitness of the various optimization objectives. Figure 6 presents the Pareto front of the converging and conflicting criteria. The optimization objectives of the converging criteria produced a widely distributed Pareto front, whereas the optimization objectives of the conflicting criteria generated a narrow Pareto front distribution.
Figure 6.
Pareto frontier comparison of two optimization objectives for multiobjective optimization of urban design schemes of historical commercial theme street schemes (including historical buildings).
- (2)
- Clustering analysis of Pareto front.
This study selected the 99th-generation Pareto front, with a total of 57 individual observations, as the initial optimal scheme (Figure 7). K-means clustering analysis was performed to classify the scheme into three clusters. The analysis of variance results of the k-means clustering of the Pareto front (Table 1) indicated that the F-statistics of each optimization indicator were large, suggesting that these three clusters had large intercluster differences and small intracluster differences. Therefore, adding the Pareto front to the three clusters was reasonable.
Figure 7.
The scheme plane models of the 99th Generation Pareto frontier solution set for multiobjective urban design optimization of historical commercial theme streets (including historical buildings).
Table 1.
The results of K-means cluster analysis of Pareto frontier solution set of urban design schemes for historical commercial theme street (including historical buildings) (I): ANOVA test.
The results of the analysis of the final cluster center of the k-means clustering of the Pareto front (Table 2) and the number of clusters (Table 3) revealed the following: Cluster 1 had the highest building density, floor area ratio, and total selling price, and it had the lowest green area ratio and site solar irradiance during the winter solstice. Cluster 2 had moderate building density, floor area ratio, total selling price, green area ratio, and site solar irradiance during the winter solstice. Cluster 3 had the lowest building density, floor area ratio, and total selling price and the highest green area ratio and site solar irradiance during the winter solstice.
Table 2.
The results of K-means cluster analysis of Pareto frontier solution set of urban design schemes for historical commercial theme street (including historical buildings) (Ⅱ): final clustering center.
Table 3.
The results of K-means cluster analysis of Pareto frontier solution set of urban design schemes for historical commercial theme street (including historical buildings) (Ⅲ): number of clusters.
- (3)
- Comprehensive comparison of clusters, individual observation clustering level, and architectural features of Pareto front.
This study subdivided each cluster in the Pareto front on the basis of architectural features (historical detached buildings, planned combined buildings, and both) and individual observation clustering levels (distance between individual observations and cluster center) and performed screening based on the design requirements (Table 4). First, eight individual observations with unreasonable local architectural features were removed. Second, 11 individual observations with similar architectural features at low clustering levels were removed. Third, 21 individual observations with a high clustering level (top five) in each cluster and each architectural feature were selected as the final schemes.
Table 4.
Comprehensive comparison and screening of cluster, individual cluster degree, and architectural morphological characteristics of Pareto front solution set of urban design schemes for historical commercial theme street (including historical buildings).
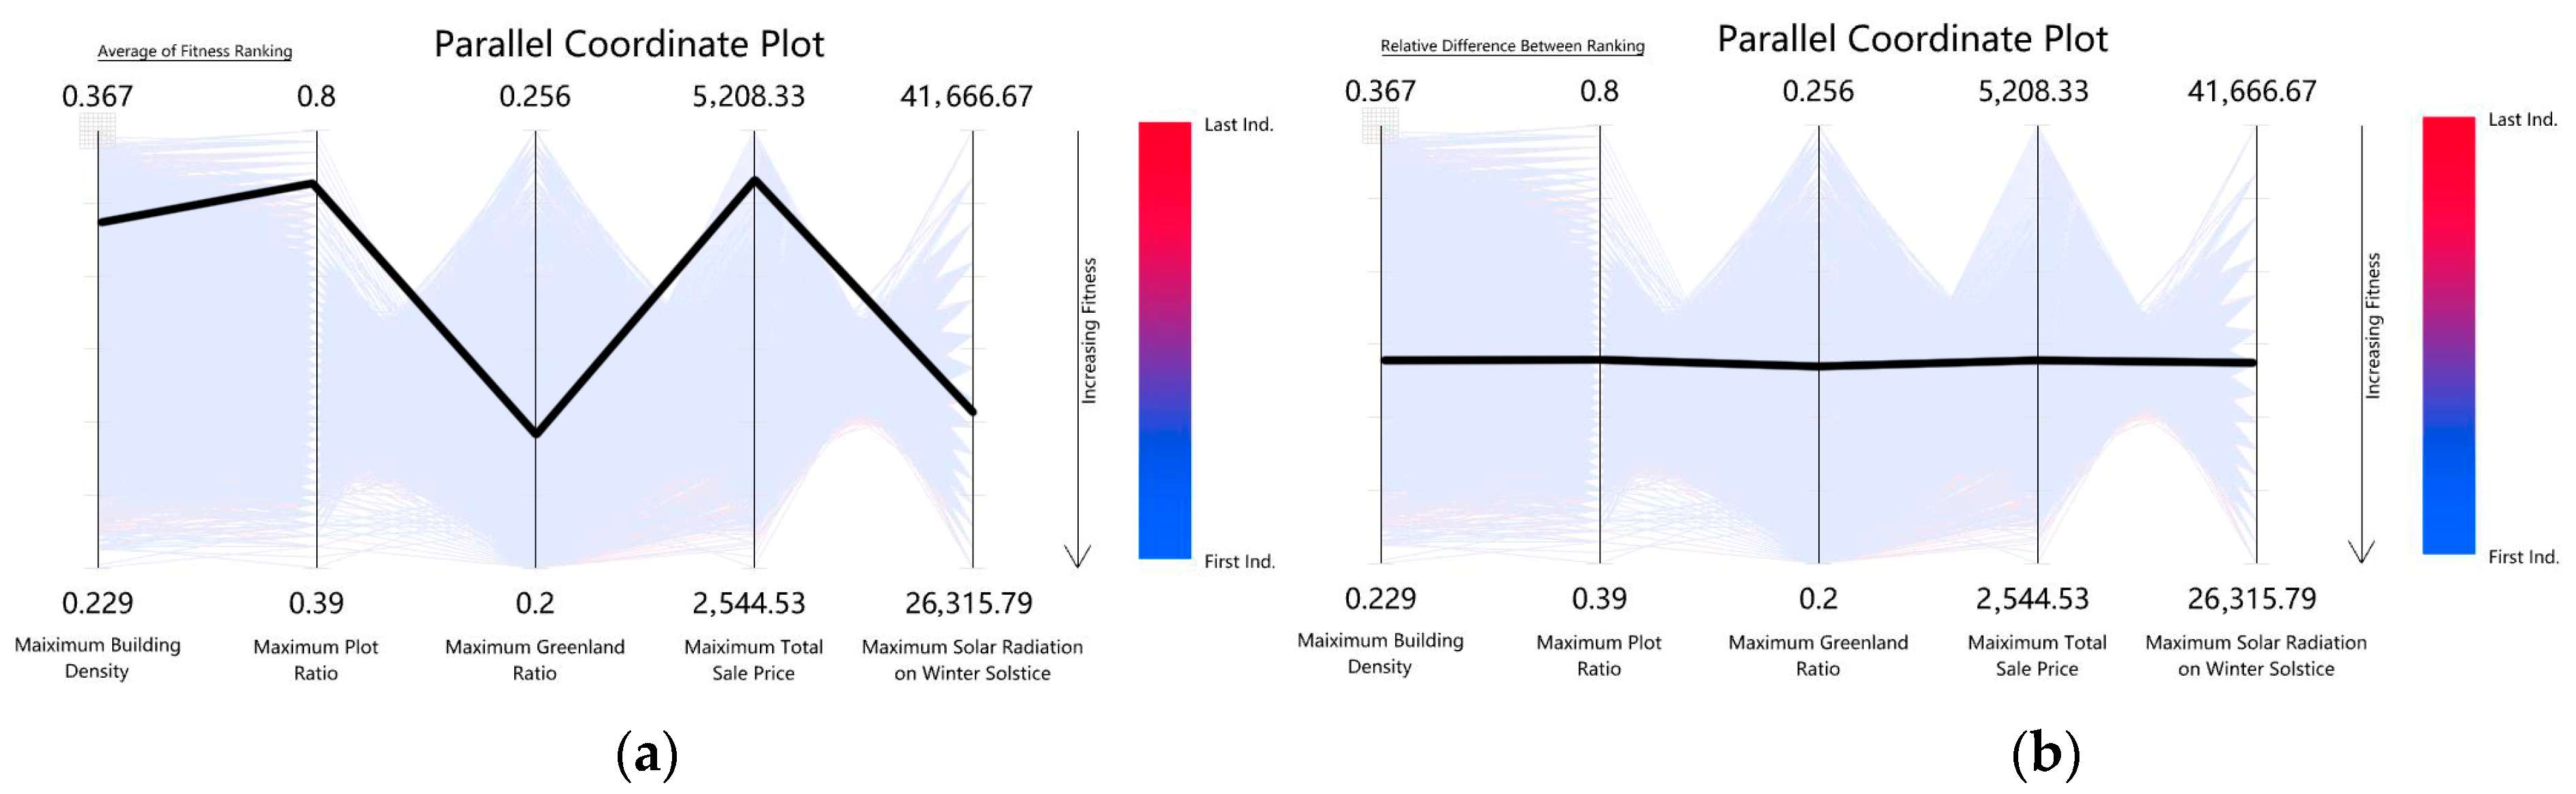
4.2.2. Analysis and Selection Based on Fitness Sorting
Scheme selection based on fitness sorting was suitable to quickly identify the most frequent indicator (mean) and median indicator (relative difference) among the schemes in the evolutionary optimization process.
- (1)
- Initial schemes selection based on fitness sorting of average and relative differences.
This study used fitness sorting based on the average and relative differences of the fitness parallel coordinate plot to sort each observation in the scheme and select schemes. The results in Figure 8 show great differences between them. The average value, that is, the arithmetic mean of all fitness data, can represent the overall average level. The average fitness sorting may have introduced extreme values for certain optimization indicators. These extreme values were obtained by lowering other optimization indicators (particularly those of conflicting objectives) to obtain a higher ranking. The relative deviation can better explain the degree of all fitness data dispersion, the relative-difference fitness sorting was used to balance the fitness optimization indicators, and the top 10 observations in the ranking were selected as the initial selection schemes.
Figure 8.
Initial schemes index of fitness average: (a) relative difference fitness; (b) ranking of multiobjective urban design scheme optimization for historic commercial theme street land (including historical buildings).
- (2)
- Comprehensive comparison of architectural features, mean fitness sorting, and relative difference fitness sorting of initial schemes.
The initial schemes for the fitness sorting of means and relative differences were compared with the architectural features of the almost historical detached buildings. This study performed an additional screening based on ranking and design requirements (Table 5). First, three individual observations with unreasonable local architectural features were removed. Second, five individual observations with similar architectural features were removed. Third, seven individual observations were selected from the top five observations in each cluster as the final schemes.
Table 5.
Comprehensive comparison and screening of architectural morphological characteristics of fitness average and fitness relative difference ranking of urban design schemes for historical commercial theme street (including historical buildings).
4.2.3. Analysis and Selection Based on Specific Fitness Sorting
The scheme selection based on specific fitness sorting was suitable for quickly selecting a scheme when a certain optimization objective reached the maximum value in the scheme in the evolutionary optimization process.
- (1)
- Initial schemes selection for specific fitness sorting.
Each design requirement involves different preferences for the optimization objectives. The scheme screening based on specific fitness sorting can be conducted for objectives of particular importance. The floor area ratio, green area ratio, and total selling price were used as the optimization objectives for the specific fitness sorting, and the top 10 observations were selected for the initial selection schemes.
- (2)
- A comprehensive comparison between specific fitness sorting of initial schemes and architectural features.
Each cluster of the initial schemes sorted on the basis of specific fitness was screened on the basis of architectural features, ranking, and design requirements (Table 6). First, one individual observation with unreasonable local architectural features was removed. Second, 26 individual observations with similar architectural features were removed. Third, 10 observations were selected from the top 5 observations in each cluster for the final schemes.
Table 6.
Comprehensive comparison and screening of architectural morphological characteristics of specific fitness ranking of urban design schemes for historical commercial theme streets (including historical buildings).
4.2.4. Summary of Schemes and Comparison of Indicators
All selected schemes for the historical commercial theme street (including historic buildings) were sorted and compared with the optimization indicators (Table 7). The results revealed that the selected schemes conformed to the clustering results and characteristics in terms of the indicators (Figure 9). (1) The selection scheme based on the Pareto front formed three clusters in the indicator distribution. (Cluster 1: the highest building density/BD, floor area ratio/FAR, and total selling price/TSP and the lowest green area ratio/GAR and site solar irradiance during the winter solstice/SSI. Cluster 2: moderate BD, FAR, TSP, GAR, and SSI. Cluster 3: the lowest BD, FAR, TSP, and the highest GAR and SSI.) (2) The selection scheme based on fitness sorting indicated that the relative difference sorting tended toward the median of each indicator and was similar to the Cluster 2 indicators based on the Pareto front selection scheme. Under suitable conditions, it can be considered to combine with Cluster 2 as a class of scheme set. The average sorting was similar to the Cluster 1 indicators based on the Pareto front selection scheme. Under suitable conditions, it can be considered to combine with Cluster 1 as a class of scheme set. (3) The selection scheme based on the specific fitness sorting also met the extreme value requirements of the indicators. It can provide a directly perceived shape of the partial indicators extremum scheme set and compare with the scheme set based on the Pareto front.
Table 7.
Summary of final optimization schemes based on Pareto frontier solution set, fitness ranking, and specific fitness for urban design schemes for historical commercial theme street (including historical buildings) (part).
Figure 9.
Comparison of final selection scheme indicators for multiobjective scheme optimization of urban design for historical commercial theme street (including historical buildings).
Similarly, all selected schemes for the detached commercial theme street (excluding historic buildings) were sorted and compared with the optimization indicators (Table 8). The results also revealed that the selected schemes conformed to the clustering results and characteristics in terms of indicators (Figure 10).
Table 8.
Summary of final optimization schemes based on Pareto frontier solution set, fitness ranking, and specific fitness for urban design schemes for detached commercial theme streets (excluding historic buildings) (part).
Figure 10.
Comparison of final selection scheme indicators for multiobjective scheme optimization of urban design for detached commercial theme streets (excluding historic buildings).
Overall, the selection methods of the optimal schemes for urban design of the historical commercial theme street (including historic buildings) and the detached commercial theme street (excluding historic buildings) in the historic city block in front of the Anda Railway Station can provide designers with reference to select schemes by considering multiple factors.
5. Discussion and Conclusions
This paper applies the evolutionary computing technology of NSGA-Ⅱ algorithm in genetic algorithm, combined with the parameterized intelligent generation technology of urban block scheme, to establish a number of conflicting design goal-oriented optimization methods so as to quickly and efficiently obtain more optimal schemes that meet multiple optimization objectives, and carries out empirical verification with the historic city block in front of the railway station in Anda city, Heilongjiang Province, China. The main contributions of this study are as follows: (1) establishing a parametric intelligent generation method for case historic city blocks guided by conflict-based multiobjective optimization; (2) providing an evolutionary multiobjective scheme optimization and selection method for case historic city blocks based on various factors; and (3) practically proposing specific schemes to renew, reuse, and preserve the regional characteristics of case historic city block.
The whole study consists of three parts: First, the parametric intelligent scheme model is generated. Mainly according to the SG rules and control parameters, under the control of performance indicators, through the shape grammar-based urban block design grammar, the initial scheme model was generated. Secondly, determine the design optimization objectives and model variable genes. Based on the performance indicators of the parameterized intelligent scheme, the building density, the floor area ratio, the green area ratio, the total selling price, and the site’s solar irradiance during the winter solstice are selected as the specific optimization indicators to guide the direction of the entire evolutionary calculus. At the same time, the primary control parameters of the control model form are summarized and sorted to form a variable gene pool for later optimization of evolutionary computation. Third, comprehensive optimization of multiobjective schemes is conducted. The parameters of the optimization conditions are reasonably modified to obtain more scheme types, the multiobjective comprehensive evolutionary optimization is performed according to the optimization objectives and optimization conditions, and the optimal model solution set is obtained.
The research focus is on further analysis and scheme selection of the optimization evolution results, combined with the indicators and architectural shape characteristics. On the basis of overall optimization and rational evolution, three methods of scheme selection were proposed. The first scheme selection based on the Pareto front was suitable for multiple conflicting objectives and optimizing each objective without affecting the indicators. This study also integrated the individual observation levels in each K-means cluster into the architectural features for final screening, which is a refinement and improvement of the previous similar scheme selection method []. The second scheme selection based on fitness sorting was suitable for quickly selecting the average and relative difference among the schemes in the evolutionary optimization process. The third scheme selection based on specific fitness sorting was suitable for quickly selecting a scheme when a certain optimization indicator reached the maximum value among all schemes in the evolutionary optimization process. At the same time, the results of these three methods can be combined, supplemented, and compared.
Overall, the urban design optimization results for the historical commercial theme street (including historic buildings) and the detached commercial theme street (excluding historic buildings) in the historic city block in front of the railway station of Anda, Heilongjiang Province, China, provide a reference for designers to quickly and efficiently select parametric urban design schemes on the basis of various factors such as Pareto, mean, median, extreme, etc.
Author Contributions
Conceptualization, L.Y. and H.-T.C.; methodology, L.Y.; software, L.Y.; validation, L.Y., J.X., and J.C.; formal analysis, L.Y. and T.W.; investigation, H.M.; resources, H.M.; writing—original draft preparation, L.Y.; writing—review and editing, H.-T.C.; funding acquisition, T.W. All authors have read and agreed to the published version of the manuscript.
Funding
The research is supported by the Ministry of Education humanities social sciences research project (20YJC760101), Zhejiang Provincial Natural Science Foundation of China (LQ20E080021), Major humanities and social sciences research program of colleges and universities in Zhejiang (2021QN053), Zhejiang cultural relics protection science and technology project (2021017), Scientific research project of Zhejiang Provincial Department of Education (Y202147553) and China youth fund of national natural science foundation projects (52208057).
Data Availability Statement
Data are unavailable due to privacy.
Conflicts of Interest
The authors declare no conflict of interest.
References
- BuHamdan, S.; Alwisy, A.; Bouferguene, A. Generative systems in the architecture, engineering and construction industry: A systematic review and analysis. Int. J. Archit. Comput. 2021, 19, 226–249. [Google Scholar] [CrossRef]
- Baba, F.M.; Ge, H.; Zmeureanu, R.; Wang, L.L. Calibration of building model based on indoor temperature for overheating assessment using genetic algorithm: Methodology, evaluation criteria, and case study. Build. Environ. 2022, 207, 108518. [Google Scholar] [CrossRef]
- Vukadinović, A.; Radosavljević, J.; Đorđević, A.; Protić, M.; Petrović, N. Multi-objective optimization of energy performance for a detached residential building with a sunspace using the NSGA-II genetic algorithm. Sol. Energy 2021, 224, 1426–1444. [Google Scholar] [CrossRef]
- Van Ameijde, J.; Song, Y. Data-Driven Urban Porosity: Incorporating Parameters of Public Space into a Generative Urban Design Process. In Proceedings of the 23rd International Conference on Computer Aided Architectural Design Research in Asia, Beijing, China, 17–19 May 2018. [Google Scholar]
- Nagy, D.; Villaggi, L.; Benjamin, D. Generative urban design: Integrating financial and energy goals for automated neighborhood layout. In Proceedings of the Symposium for Architecture and Urban Design Design, Delft, The Netherlands, 4–7 June 2018; pp. 265–274. [Google Scholar]
- Xiong, W.; Ye, H.; Jie, W.; Li, Q.; Ou, H. Parametric generation and multi-objective optimization of stilted building in Zhuang residence. IOP Conf. Ser. Earth Environ. Sci. 2019, 238, 012085. [Google Scholar] [CrossRef]
- Herr, C.M.; Ford, R.C. Cellular automata in architectural design: From generic systems to specific design tools. Autom. Constr. 2016, 72, 39–45. [Google Scholar] [CrossRef]
- Suryowinoto, A. Pemodelan Tanaman Virtual Menggunakan Lindenmayer System. Inf. J. Ilm. Bid. Teknol. Inf. Komun. 2017, 2, 1–6. [Google Scholar] [CrossRef]
- Verniz, D.; Duarte, J.P. Santa Marta Urban Grammar: Unraveling the spontaneous occupation of Brazilian informal settlements. Environ. Plan. B Urban Anal. City Sci. 2020, 48, 810–827. [Google Scholar] [CrossRef]
- Bäck, T.; Hammel, U.; Schwefel, H.-P. Evolutionary computation: Comments on the history and current state. IEEE Trans. Evol. Comput. 1997, 1, 3–17. [Google Scholar] [CrossRef]
- Zitzler, E. Evolutionary Algorithms for Multiobjective Optimization: Methods and Applications, Citeseer. Ph.D. Thesis, Swiss Federal Institute of Technology Zurich, Zurich, Switzerland, 1999. [Google Scholar]
- Zitzler, E.; Thiele, L. Multiobjective optimization using evolutionary algorithms—A comparative case study. In Proceedings of the International Conference on Parallel Problem Solving from Nature, Amsterdam, The Netherlands, 27–30 September 1998; Springer: Berlin/Heidelberg, Germany, 1998; pp. 292–301. [Google Scholar]
- Deb, K.; Agrawal, S.; Pratap, A.; Meyarivan, T. A fast elitist non-dominated sorting genetic algorithm for multi-objective optimization: NSGA-II. In Proceedings of the International Conference on Parallel Problem Solving from Nature, Paris, France, 18–20 September 2000; Springer: Berlin/Heidelberg, Germany, 2000; pp. 849–858. [Google Scholar]
- Deb, K.; Pratap, A.; Agarwal, S.; Meyarivan, T. A fast and elitist multiobjective genetic algorithm: NSGA-II. IEEE Trans. Evol. Comput. 2002, 6, 182–197. [Google Scholar] [CrossRef]
- Miao, Y.; Koenig, R.; Knecht, K.; Konieva, K.; Buš, P.; Chang, M.-C. Computational urban design prototyping: Interactive planning synthesis methods—A case study in Cape Town. Int. J. Archit. Comput. 2018, 16, 212–226. [Google Scholar] [CrossRef]
- Beirão, J.; Duarte, J. Generic grammars for design domains, Artificial Intelligence for Engineering Design. Anal. Manuf. AI EDAM 2018, 32, 225–239. [Google Scholar]
- Jacobs, J. The Death and Life of Great American Cities; Vintage: London, UK, 2016. [Google Scholar]
- Heath, T.; Oc, T.; Tiesdell, S. Revitalising Historic Urban Quarters; Routledge: London, UK, 2013. [Google Scholar]
Disclaimer/Publisher’s Note: The statements, opinions and data contained in all publications are solely those of the individual author(s) and contributor(s) and not of MDPI and/or the editor(s). MDPI and/or the editor(s) disclaim responsibility for any injury to people or property resulting from any ideas, methods, instructions or products referred to in the content. |
© 2023 by the authors. Licensee MDPI, Basel, Switzerland. This article is an open access article distributed under the terms and conditions of the Creative Commons Attribution (CC BY) license (https://creativecommons.org/licenses/by/4.0/).


