Article

Development of a BIM-Enabled Automated Cost Segregation System

1
Civil & Architectural Engineering & Construction Management, University of Wyoming, Laramie, WY 82071, USA
2
Department of Construction Engineering and Management, North China University of Water Resources and Electric Power, Zhengzhou 450046, China
3
National Cost Segregation Service, Mesa, AZ 85203, USA
4
School of Business, Hohai University, Nanjing 211100, China
*
Author to whom correspondence should be addressed.
Buildings 2023, 13(7), 1805; https://doi.org/10.3390/buildings13071805
Submission received: 13 June 2023 / Revised: 1 July 2023 / Accepted: 13 July 2023 / Published: 15 July 2023
(This article belongs to the Special Issue Advances in Project Management in Construction)

Abstract

:
The cost segregation study is a tax planning strategy employed to optimize cash flow by redefining real estate assets as personal property and land improvement, enabling accelerated tax depreciation. However, conventional cost segregation practices suffer from limitations, such as time-consuming procedures and high associated costs, which hinder their effectiveness. To overcome these challenges, this paper presents an innovative strategy that integrates Building Information Modelling (BIM) to develop an automated cost segregation system. The research aims to optimize the workflow by developing a BIM model and using 5D BIM to perform a cost segregation study by categorizing building elements under a Modified Accelerated Cost Recovery System (MACRS). This workflow aims at minimizing the time and financial resources expended with traditional methodologies. The proposed workflow enables precise identification and separate depreciation of building components, resulting in significant tax deductions that would otherwise be unattainable. The results indicate that performing cost segregation with BIM leads to a significant increase in depreciation amounts, particularly during the initial six years, while also raising the net present value of depreciation by 45%. The integration of BIM technology facilitates effective management and sharing of cost segregation data among stakeholders, enhancing collaboration and decision-making throughout the project lifecycle. Owners can optimize cost management and financial planning, identifying tax-saving opportunities and improving cash flow. General Contractors (GCs) can leverage the system during the bidding process, enhancing their competitiveness and project acquisition potential. Future research can explore the integration of cost segregation modules from BIM with asset management tools, enabling improved facility and fiscal management of building components. Such integration holds promise for enhancing the construction and real estate industry’s overall efficiency and performance.

1. Introduction

Cost segregation is a tax savings tool utilized by companies and individuals involved in real estate construction, purchase, expansion, or remodeling [1,2]. Its objective is to identify and assess the value of tangible personal property, other tangible property, and land improvements, while assigning the remaining costs to real property classifications [3]. It enables the acceleration of depreciation deductions by classifying various building components and property as becoming depreciated over shorter periods, such as 5, 7, or 15 years, as opposed to the standard 27.5 or 39 years [4,5]. This approach offers several advantages over straight-line depreciation, including (i) an immediate increase in cash flow through accelerated depreciation deductions; (ii) an opportunity to claim ’catch up’ depreciation on previously misclassified assets; (iii) provision of an independent third-party analysis that withstands IRS review [5,6,7].
For instance, a $10 million office building subject to straight-line depreciation would result in approximately $256,400 in annual depreciation. However, using accelerated depreciation through cost segregation, the deduction in the first year of ownership would be around $382,900, representing a nearly 50% increase in cash flow for the building owner [5,6,7]. The timing for conducting a cost segregation study can vary based on individual client circumstances [8]. For investors engaged in planning construction or remodeling, the ideal time for considering a cost segregation study is before the building’s infrastructure is established [5,6]. Pre-construction consulting allows accurate tracking of items eligible for accelerated depreciation, resulting in time and cost savings [3].
New owners benefit from conducting a study during the year of construction, purchase, or remodeling, enabling immediate tax optimization and accurate asset classification from the building’s inception [8]. The advent of modern tools and processes in the field of construction and management of buildings and real estate properties is revolutionizing the industry. Performing a cost segregation study requires a comprehensive understanding of IRS guidelines and case law and expertise in engineering, construction, and tax matters [6]. Compliance with the IRS Audit Techniques Guide and familiarity with prior court cases and rulings pertaining to individual assets are also crucial [4]. Therefore, it is recommended that cost segregation studies be conducted by cost engineering professionals who possess knowledge of construction methods.
Cost segregation reports are offered at a fee, which varies depending on the type and size of the building [6]. The researchers conducted a case study and determined that the value of cost segregation services is generally estimated to be $10,000 or higher, offering a prompt return on investment [5]. Additionally, offering the cost segregation report as the added value during bid proposals could be a modest investment in business development, especially for securing multimillion-dollar projects. While it is feasible for General Contractors (GCs) to provide cost segregation reports, the challenge lies in educating project owners about this service [6]. The potential benefits for owners significantly outweigh the costs for GCs, making the provision of cost segregation services an appealing proposition for both parties involved in the construction project.
However, few GCs are currently capitalizing on the opportunity to provide cost segregation studies. Engineers collaborate with the project owner’s accountant to develop the cost segregation report, which involves breaking down project components and their costs into depreciable lives (5, 7, 10, 15, 31.5 or 39 years). The accountant then makes decisions regarding tax filing based on the information provided [6]. Typically, the engineering report of a cost segregation study is put together after the building has been handed over to the owner. This report is based on an analysis of available building plans, contract documents, and a physical inspection of the property. One significant advancement in this regard is the integration of BIM technology, due to its numerous benefits and resource savings during the design, planning, and construction phases of new buildings [9,10]. The integration of BIM technology allows for data sharing on a common platform among various stakeholders, making construction project management more convenient and effective [11,12]. These advancements in the use of technology will improve and optimize the way in which cost segregation is carried out.
The feasibility of GCs offering cost segregation studies depends on the specific project, as each project has unique characteristics. GCs who are averse to risk can partner with cost segregation professionals, whereby the GC provides project data and clientele, while the cost segregation professional prepares the report. This approach may reduce the potential profit for the GC but also shifts the associated risk away from them. It can be particularly advantageous for contractors focusing on smaller projects [6]. Additionally, cost segregation studies offer GCs an avenue for additional revenue generation and competitive differentiation. By partnering with cost segregation professionals or training internal employees, GCs can provide this valuable service to project owners. The feasibility and implementation approach may vary depending on the specific project and the risk appetite of the GC. Nonetheless, seizing the opportunity to offer cost segregation studies can be a strategic move for GCs in the construction industry [6,13].
The utilization of cost segregation services in the construction industry is currently limited, resulting in missed opportunities for property owners to maximize their tax benefits. This limitation stems from a lack of comprehensive understanding of IRS guidelines, insufficient expertise in cost segregation practices, and the absence of automated workflows that leverage technologies [13]. Manual cost segregation processes are characterized by extensive time requirements and high costs [13]. Additionally, there is a lack of widespread collaboration between engineers and accountants in the development of cost segregation reports, and GCs encounter challenges when attempting to offer these services and to educate their clients [14].
To address these limitations, this research aims to propose an automated BIM-enabled workflow for conducting cost segregation studies within the construction industry. This automated approach will be particularly advantageous for property owners and GCs who already employ BIM methodologies in their projects. This automated approach will be particularly beneficial for property owners and GCs who utilize BIM in their projects or aim to use BIM in the future. The study will also highlight the benefits of performing cost segregation studies, which include the potential for additional tax deductions and increased cash flow for owners. By providing insights into the optimization of tax benefits and financial planning through the application of cost segregation analysis, this research seeks to foster the effective implementation of cost segregation studies across the construction and real estate industry.

2. Literature Review

2.1. Building Information Modelling

The advent of modern information technology has transformed construction project management into the management of project information [15]. The construction industry has witnessed a growing inclination towards the adoption of BIM in recent decades. This trend can be attributed to the multitude of advantages and resource efficiencies that BIM offers throughout various stages of building development, including design, planning, and construction [9,10]. BIM is categorized into different dimensions, including 1D, 2D, 3D, 4D, and 5D. These dimensions represent the progressive incorporation of data and functionalities in BIM. BIM based on advanced 3D digital design solutions provides “visual” digital architectural models for designers, architects, and engineers [16,17]. The utilization of BIM in the construction industry encompasses various critical aspects, such as scheduling (4D BIM), cost management (5D BIM), and quality and safety control. For example, the authors in [18] developed the web-based ConBIM-SM system for GCs to enhance the visual sharing of as-built schedule information and improve efficiency in tracking construction progress. A BIM-enabled budget control method for port construction projects was proposed in [19], which aims to alleviate economic pressure and establish effective cost control environments.
Furthermore, a framework for the development of a productivity and safety monitoring system was explored in [20], wherein BIM was utilized to integrate buildable design, hazard prevention and control, and safety assessment to mitigate risks and address design defects. A detailed review conducted in [21] shows that BIM and its interoperability with various cost estimation tools can provide accurate cost estimates, improve the process of construction cost management, and provide significant benefits throughout the lifecycle of the project. BIM has also emerged as a valuable tool in optimizing facility management operations by efficiently retrieving, processing, and analyzing building data through its interoperability and plug-in integration capabilities. This enables the seamless integration of various systems and enhances the effectiveness of data-driven decision-making and operational management in property facilities [22]. The interoperability function of BIM offers notable advantages to corporate real estate management, particularly in terms of potential cost savings throughout the lifecycle of a project [23]. These findings support the idea that employing BIM for cost segregation purposes can serve as a viable strategy for businesses to achieve additional cost reductions.

2.2. Cost Segregation & BIM

Cost segregation holds significant importance across various domains, including taxation, construction, real estate investment, and financial planning. From a tax perspective, cost segregation offers property owners the opportunity to expedite the depreciation process by reclassifying specific components of a property as assets with shorter useful lives. This reclassification leads to substantial tax savings and an augmented cash flow [3,4]. Construction professionals greatly benefit from cost segregation through the implementation of comprehensive engineering analyses, which facilitate accurate cost allocation and proper reporting for financing, insurance, and accounting purposes [13].
In the context of real estate investment, cost segregation plays a pivotal role in maximizing investment returns. By accelerating depreciation deductions, investors can enhance their cash flow, boost after-tax profits, and improve the net present value of their properties. Moreover, cost segregation enables property owners to optimize their financial planning strategies by aligning tax deductions with their overall financial goals. The increased cash flow resulting from cost segregation can be effectively utilized for reinvestment purposes or other strategic financial endeavors [5].
Given the characteristics of BIM technology, its application has the potential to enhance the intelligence and automation of cost segregation processes. However, current research on information system theory primarily focuses on the overall system architecture of cost segregation, with no to limited exploration of practical applications using BIM. BIM can provide a robust platform for capturing and organizing detailed information about building components, enabling more accurate and efficient cost segregation analyses [21]. BIM’s ability to store and integrate data from various sources facilitates the identification and classification of depreciable assets, enhancing the accuracy and reliability of cost segregation studies [20,22]. The use of BIM in cost segregation can streamline the process by automating data extraction, analysis, and reporting [24,25]. BIM’s visualization capabilities allow stakeholders to visually assess and validate the identification and classification of assets, enhancing transparency and reducing errors [26,27]. The adoption of 5D BIM in this study allows for the inclusion of cost-related information in the modeling process, providing a comprehensive approach to cost segregation analysis.
The integration of cost segregation within the BIM workflow can contribute to improved project cost control, financial planning, and tax optimization. It presents an opportunity for construction professionals to leverage advanced technologies and optimize tax benefits for property owners. By leveraging the information-rich environment of BIM, cost segregation can be conducted more efficiently, accurately, and seamlessly, providing enhanced financial advantages to stakeholders in the construction and real estate industry. Therefore, this study aims to analyze the feasibility of developing an automatic cost segregation system using BIM, exploring the potential benefits and challenges associated with its implementation.

2.3. MACRS Cost Segregation System

MACRS (Modified Accelerated Cost Recovery System) is a tax depreciation method used in the United States for recovering the costs of tangible property placed in service. Under MACRS, buildings are classified into different property classes based on their useful life for depreciation purposes. These property classes are identified by numbers, such as 27.5 for residential rental property and 39 for nonresidential real property [28].
The numbers associated with the Property Class indicate the number of years over which the property can be depreciated for tax purposes. For example, a property in the 27.5 class can be depreciated over a period of 27.5 years. The significance of these numbers lies in their impact on tax deductions and cash flow. By assigning building elements to their respective property classes, property owners can determine the appropriate depreciation schedule and take advantage of accelerated depreciation deductions [29].
In cost segregation studies, the concept of Unit of Property plays a crucial role. The Unit of Property refers to the distinct components or systems within a building that can be separately identified and depreciated. It allows for the allocation of costs to different property classes based on the specific characteristics and useful lives of each unit. This approach enables property owners to maximize depreciation deductions by classifying elements, such as HVAC systems, electrical wiring, or interior finishes, as shorter-lived assets, which can result in significant tax savings [29].

2.4. Contractor and Owner Benefits in BIM-Enabled Cost Segregation

The integration of BIM with cost segregation in construction projects offers a range of benefits for both contractors and owners. Some studies have addressed the advantages and opportunities of cost segregation for GCs in strengthening client relationships and gaining a competitive edge in bidding [28,29]. While the adoption of BIM has experienced significant growth in the United States, with a significant increase in its utilization among GCs, its practical implementation in cost segregation has received limited attention in the literature.
Recent research findings indicate that the BIM adoption among GCs has risen from 50% to over 74% [30]. Furthermore, the study revealed that 91% of larger companies have adopted BIM in their operations. The widespread implementation of BIM among GCs underscores its growing importance and recognition as a valuable tool in the construction industry. The rise in BIM adoption signifies its potential to enhance project management, collaboration, and efficiency throughout the construction process [31,32]. However, the specific application of BIM in the context of cost segregation remains relatively unexplored, providing an avenue for further investigation and potential opportunities for improved cost management and optimization in construction projects. Contractors can leverage BIM for cost segregation purposes, considering the recognition by the Internal Revenue Service (IRS) of the importance of accurate cost segregation studies. The IRS acknowledges the significance of employing a systematic engineering approach in conducting such studies, excluding the use of non-contemporaneous records, reconstructed data, and unsupported estimates or assumptions provided by the taxpayer [29]. This acknowledgment reinforces the legitimacy and criticality of precise cost estimates and quantity take-offs, thereby highlighting the essential role undertaken by the contractor in upholding the integrity of the cost segregation study. By utilizing BIM, contractors can effectively contribute to the accurate and comprehensive analysis of building components, supporting the generation of reliable data for cost segregation assessments in compliance with IRS guidelines.
Cost segregation offers substantial advantages in terms of cash flows for property owners, allowing them to allocate the saved funds towards other investment opportunities. The 2002 Tax Act brought about a significant enhancement in the impact of cost segregation studies by granting project owners a substantial “bonus deduction” in the initial year, equivalent to 30% of the cost of assets with depreciable lives shorter than 20 years [28]. When coupled with BIM, owners can benefit from a digital model that provides precise estimates of building elements. This digital model enables owners to conveniently update and adjust the depreciable lives of specific elements as they are replaced or modified, thus allowing for accurate recalculations of depreciation deductions over different periods. By leveraging BIM, owners can effectively optimize their cost segregation analyses, enhancing the accuracy and flexibility of their financial planning and decision-making processes.
Apart from cost segregation, BIM can also be a valuable tool in acquiring tax deductions under section 179D of the Internal Revenue Code for energy-efficient commercial buildings that fulfill specific criteria. These deductions, applicable to buildings placed in service after 31 December 2005, encompass improvements concerning lighting systems, HVAC systems, and the building envelope [33]. By enabling detailed modeling and simulation of components, BIM facilitates the design and evaluation of energy-efficient building systems, empowering professionals to optimize energy performance and assess various design scenarios [16]. Recent amendments introduced through the Inflation Reduction Act (IRA) have simplified the process of claiming tax deductions under section 179D [34]. The changes include a reduction in the minimum required energy savings threshold from 50% to 25% and the elimination of partial deductions. The calculation of the base deduction has also transitioned to a sliding scale approach, ranging from 50 cents to $1 per square foot based on the achieved energy savings. Furthermore, projects meeting prevailing wage and apprenticeship requirements qualify for bonus deductions ranging from $2.50 to $5 per square foot [34]. These developments highlight how BIM can be an effective tool for enhancing the accessibility and utilization of tax deductions for energy-efficient commercial buildings and more research could be done in this regard to provide an efficient BIM workflow for claiming tax deductions under IRA.
Despite the extensive literature on the numerous advantages of BIM and its wide-ranging applications in the construction and real estate industries, a noticeable gap exists in the research concerning the implementation of BIM for cost segregation purposes. To address this research gap, the subsequent sections of this paper present an efficient methodology and workflow specifically designed for conducting cost segregation on commercial buildings. By bridging this knowledge void, the authors contribute to the existing body of knowledge and provide valuable insights into the potential of utilizing BIM for cost segregation analysis.
Interventional studies involving animals or humans, and other studies that require ethical approval, must list the authority that provided approval and the corresponding ethical approval code.

3. Methodology

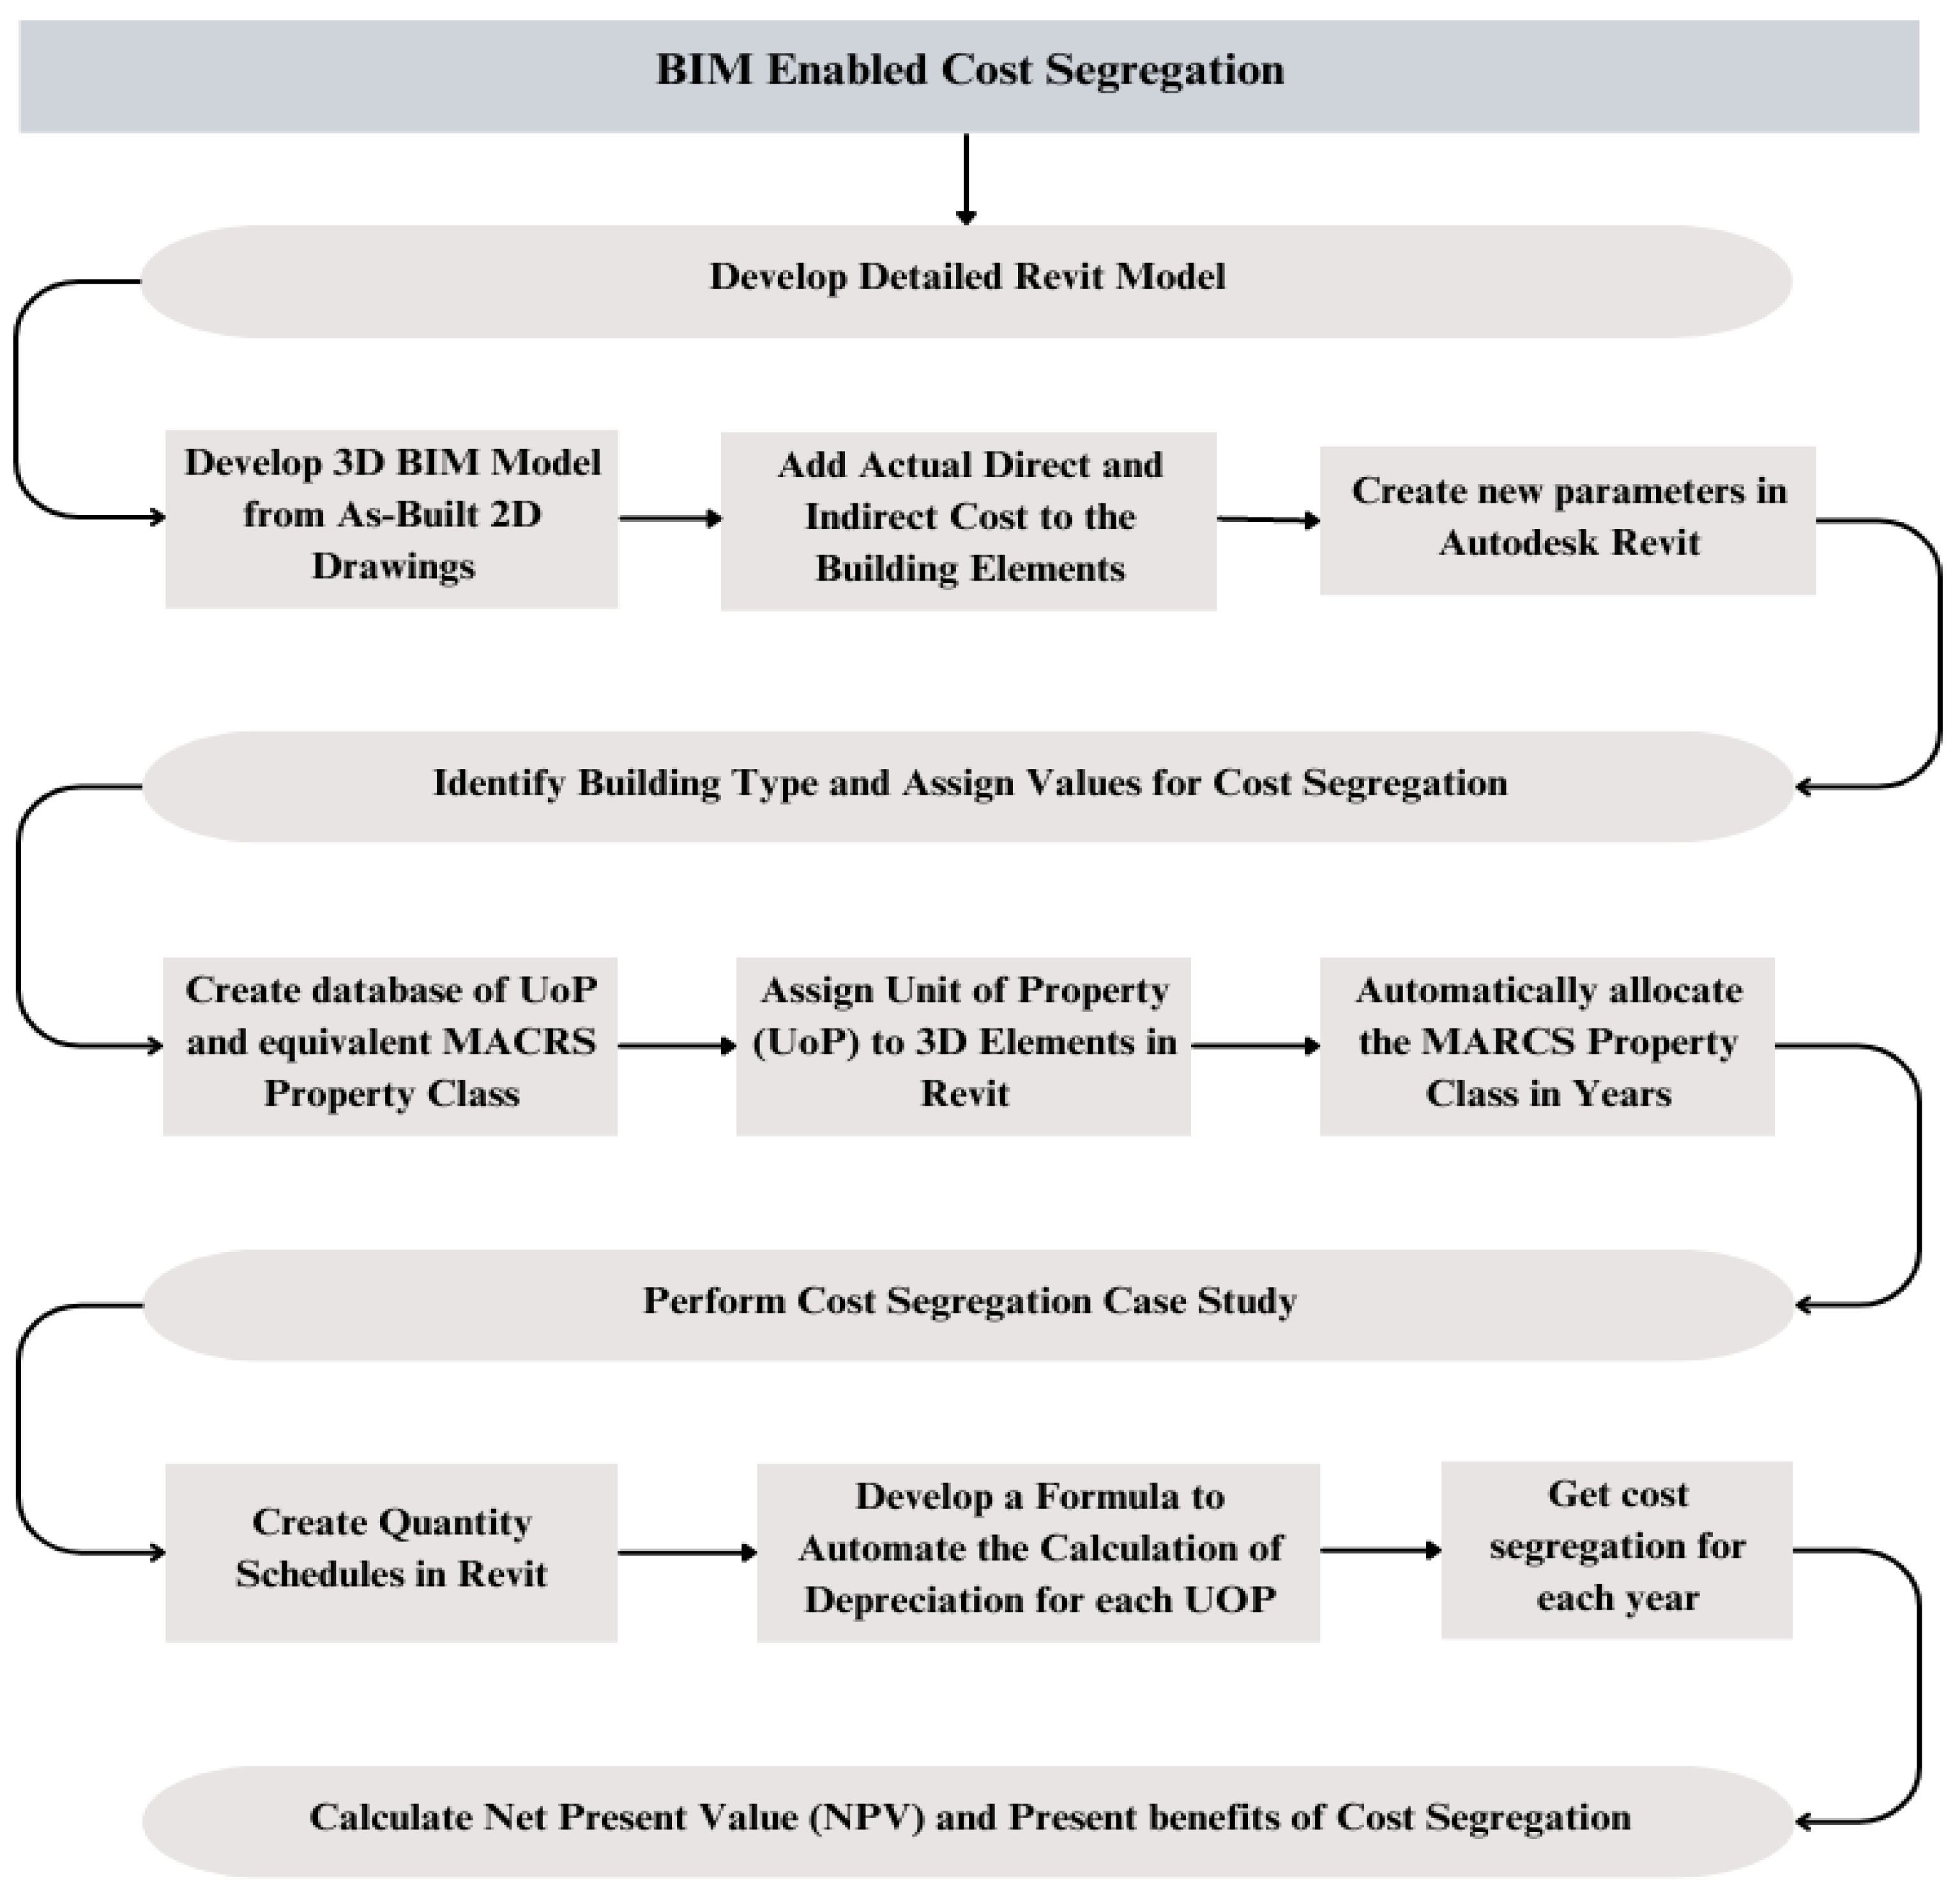
The research methodology employed in this study adopts a systematic case study approach to perform cost segregation by harnessing the capabilities of BIM. The selection of the case study method in this research was based on its capacity to offer comprehensive and in-depth insights into the specific context and intricacies of cost segregation practices. Alternative methods, such as qualitative or quantitative surveys, were deemed unsuitable as they would have limited the ability to thoroughly explore and analyze real-world scenarios related to cost segregation. By employing the case study approach, this research was able to provide a thorough examination of the complexities and dynamics associated with cost segregation.
Initially, a detailed BIM model is developed, with a focus on enhancing the level of detail to facilitate accurate cost estimation and subsequent cost segregation analysis. The cost segregation process is conducted based on the MACRS Property Class and Unit of Property as defined by the IRS. Building elements are categorized according to the MARCS system, and the cost segregation procedure is automated within Autodesk Revit, taking advantage of the information-rich model. Figure 1 provides a summary of the research methodology employed in this study. Subsequent sections will provide a comprehensive explanation of each phase and its corresponding steps, offering an in-depth understanding of the research process.

3.1. BIM Model Development Workflow

The initial phase of the research methodology involves the utilization of Autodesk Revit software, 2023 version, a widely recognized industry tool [35], to develop a detailed BIM model. This model serves as a comprehensive representation of the building, capturing all relevant elements and components. To ensure precise visualization and depiction of the building’s physical attributes, the model is developed based on the as-built 2D drawings, facilitating the creation of an accurate 3D BIM model. Furthermore, actual direct and indirect costs are assigned to the elements within the BIM model, thereby enhancing the level of detail and enabling accurate cost estimation.
The assignment of actual costs to the building elements within the BIM model holds paramount importance in the research methodology, driven by the necessity to conduct a comprehensive cost segregation study and ensure the validity of tax deductions based on the actual expenses incurred. This practice aligns with the requirement that tax deductions can only be claimed based on real expenses. By associating actual costs with the model’s elements, the research methodology establishes a robust and reliable foundation for performing the cost segregation study. This integration of actual cost data allows for a more precise assessment of depreciation and facilitates the identification of eligible tax deductions. The development of the BIM model plays a critical role in capturing the necessary information for conducting the cost segregation analysis. By leveraging the capabilities of the BIM model and incorporating actual cost data, this research methodology aims to establish a solid framework for conducting the cost segregation analysis on commercial buildings. Building upon the established BIM model, the next step is to identify the specific building type and assign appropriate values of Unit of Property (UoP) and MACRS Property Class for cost segregation.

3.2. Workflow for Cost Segregation Study

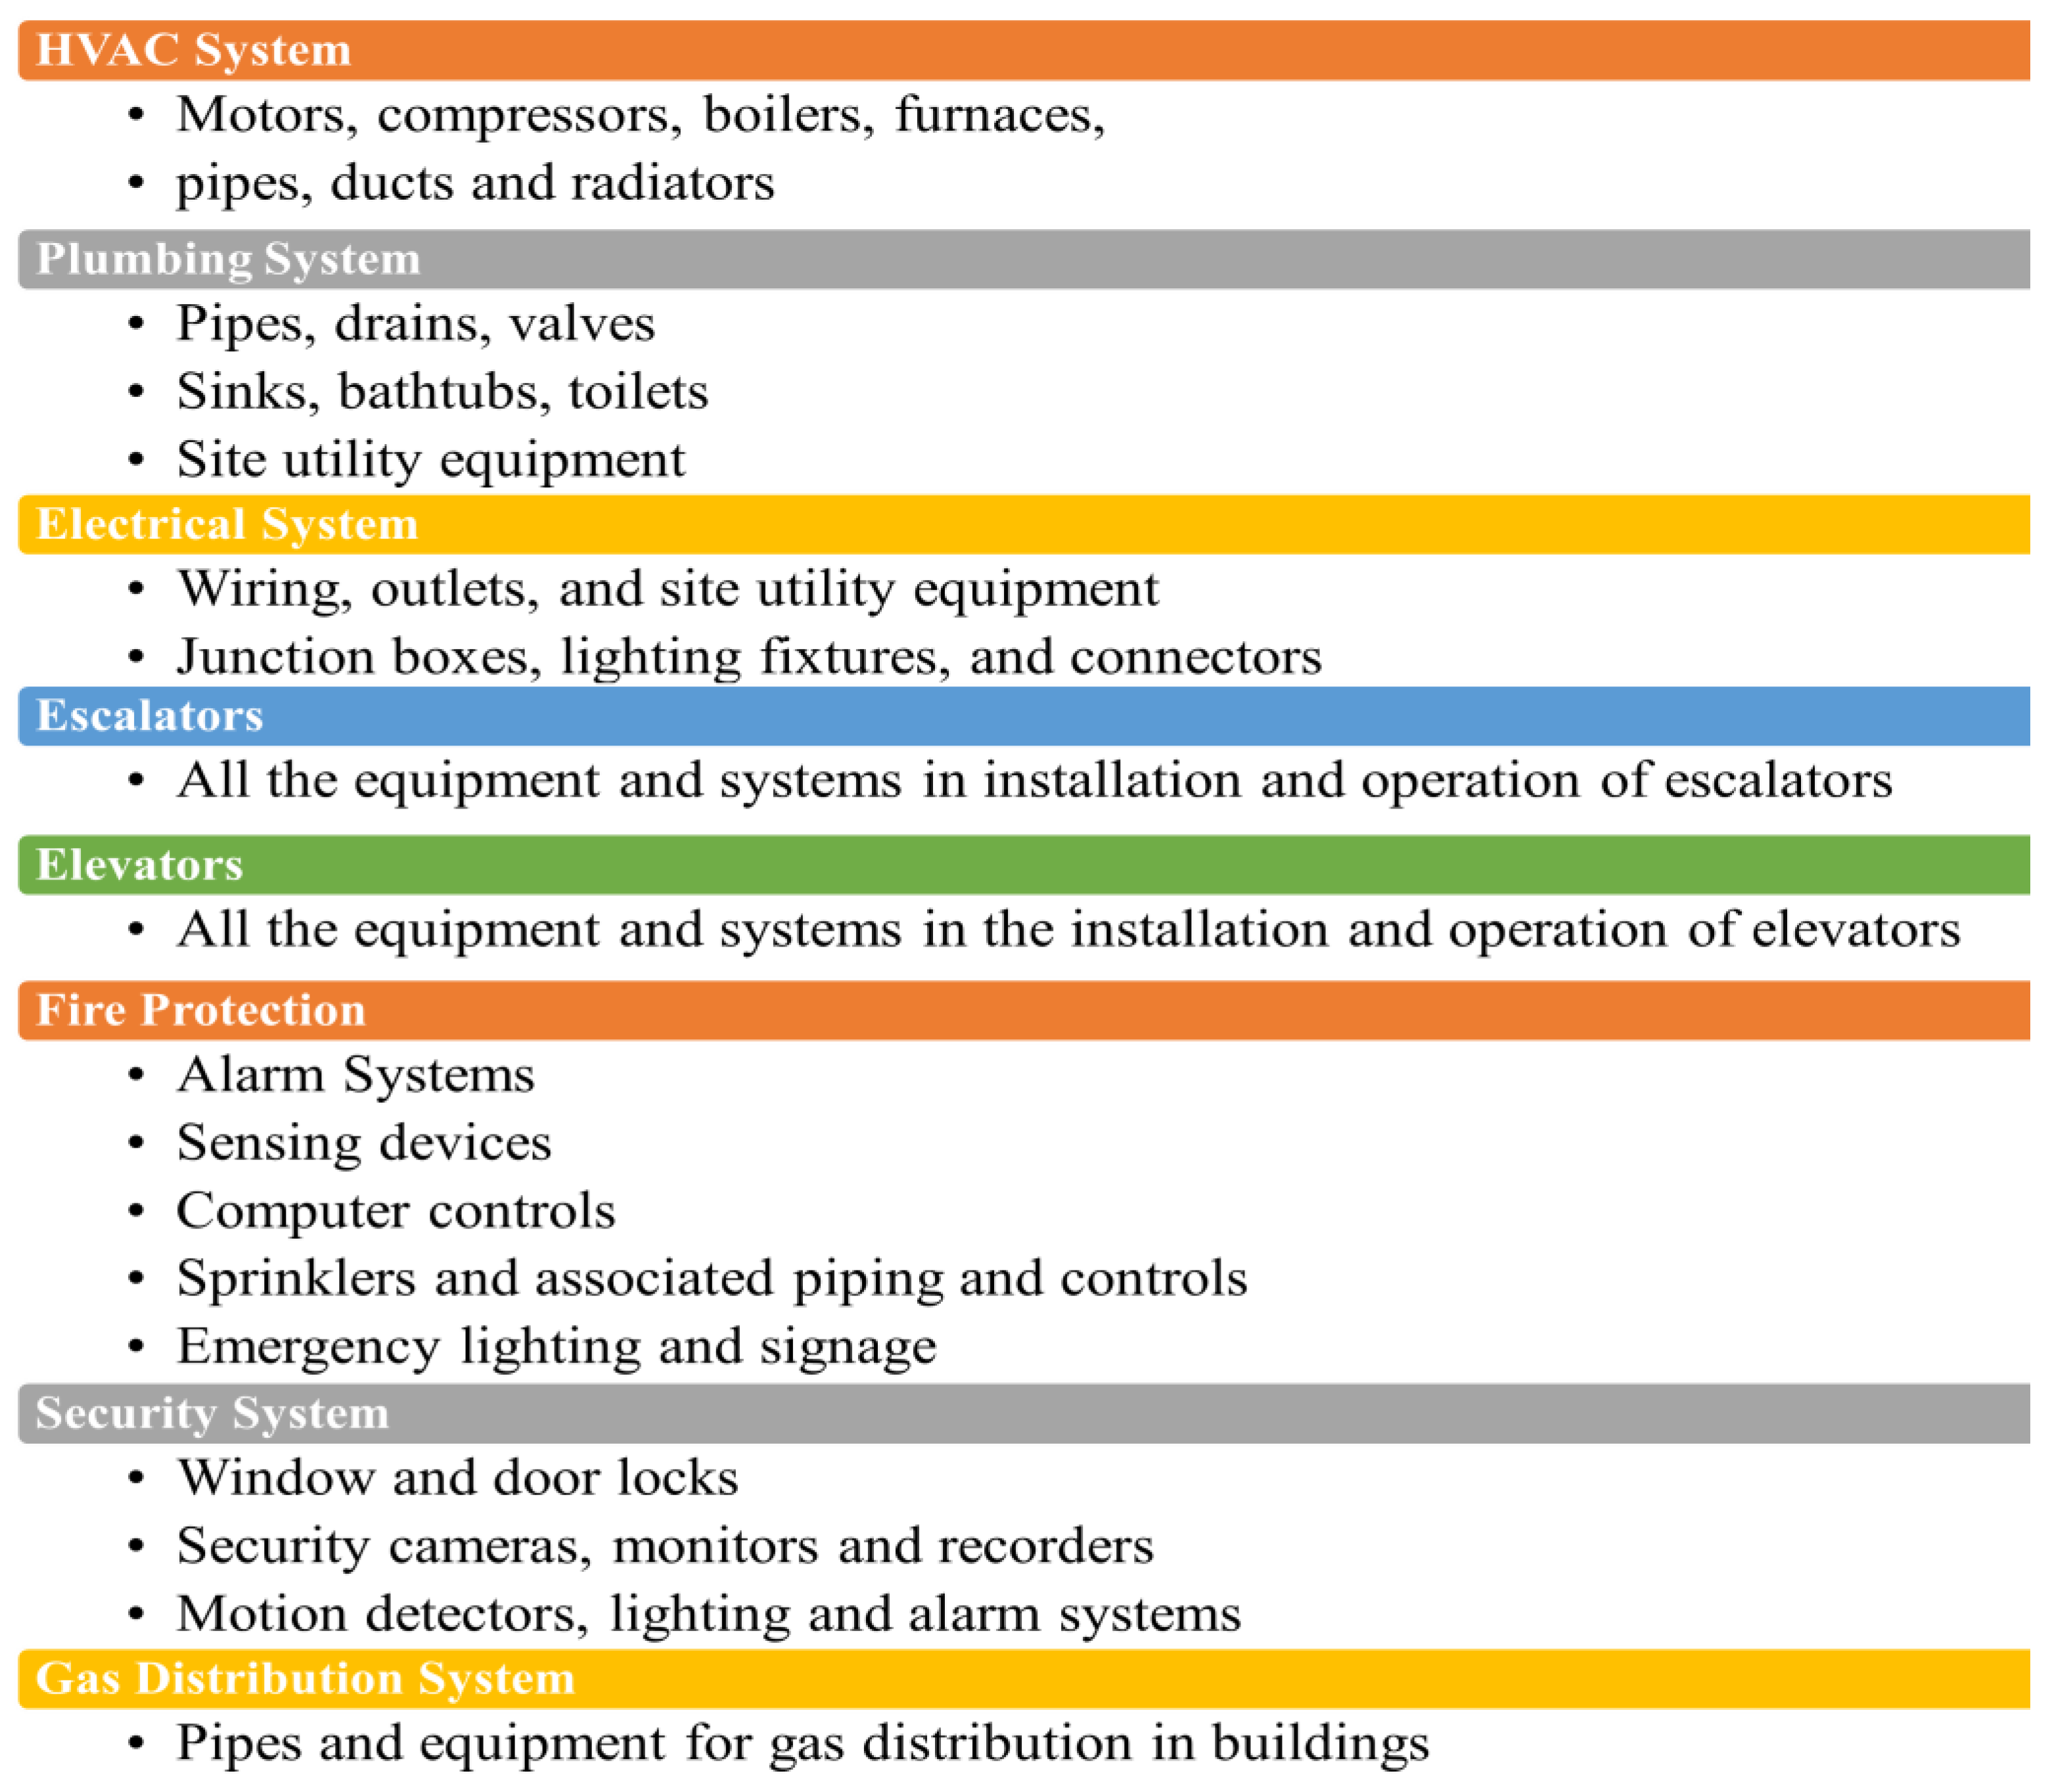
To conduct an effective cost segregation analysis, accurate identification of the property’s type and function is crucial. The case study in this paper focuses on commercial construction, encompassing various categories such as restaurants, banks, hospitals, schools, office buildings, department stores, and others. Each property type possesses distinct characteristics that influence the classification and allocation of depreciable components. Thus, determining the precise type and function of the property is essential in assigning the appropriate UoP and property class to facilitate the analysis process. The Internal Revenue Service (IRS) provides definitions for building costs, distinguishing between the cost of the overall building structure and each individually defined building system. The entire building, along with its structural components, constitutes a single property class. Additionally, eight specific building systems are considered separate UoPs having varying property classes. Any improvements made to these systems must be depreciated accordingly. The specific building systems are shown in Figure 2.
Notably, the naming of depreciable property is primarily determined by the provisions of Sections 1245 and 1250. Section 1245 property refers to depreciable property that is either (1) personal property (tangible and intangible) or (2) other tangible property (excluding buildings and their structural components) used as an integral part of manufacturing, production, extraction, or the provision of transportation, communications, electrical energy, gas, water, or sewage disposal services. MACRS is used for the most tangible depreciable property placed in service after 31 December 1986. Under MACRS, the eligible property’s cost is recovered over a specified period of 3, 5, 7, 10, 15, 20, 27.5, 31.5, or 39.0 years. The classes of depreciable property are defined in accordance with Internal Revenue Code Sections 1245 and 1250, as well as the Asset Depreciation Range (ADR) class life as of 1 January 1986.

3.3. Cost Segregation Workflow in Autodesk Revit

The building type used to perform cost segregation comes under the category of office buildings. To facilitate this process, a comprehensive database is developed, comprising the UoP and its corresponding MACRS Property Class under the standardized data tool for Revit. Through this tool, UoP and its equivalent property are assigned to building components in Revit. The database used is presented in Table 1. These classifications play a pivotal role in accurately allocating the MARCS Property Class to the relevant building elements while considering the associated depreciation timeline.
To perform cost segregation on the BIM model in Revit, the research methodology involves the generation of quantity schedules by incorporating parameters from the database shown in Table 1. The parameters of property class and unit of property as per MARCS classification are assigned to building elements. This process provides a comprehensive overview of the quantities associated with each building element. Additionally, a formula is devised to automate the calculation of depreciation for each UoP, enabling the determination of cost segregation for each year. Furthermore, the research methodology encompasses the calculation of the Net Present Value (NPV), which facilitates an assessment of the present benefits derived from cost segregation. These systematic steps aim to rigorously evaluate the feasibility and advantages of implementing BIM-enabled cost segregation within the context of construction projects. To validate the research methodology, a case study of a commercial bank building project is conducted in the subsequent section.

4. Case Study

Case studies serve as a valuable research methodology for validating the idea of BIM-enabled cost segregation, primarily due to their capacity to offer comprehensive and detailed insights within a specific context [36]. It has been recognized that case studies are the predominant method of data collection in various research domains [
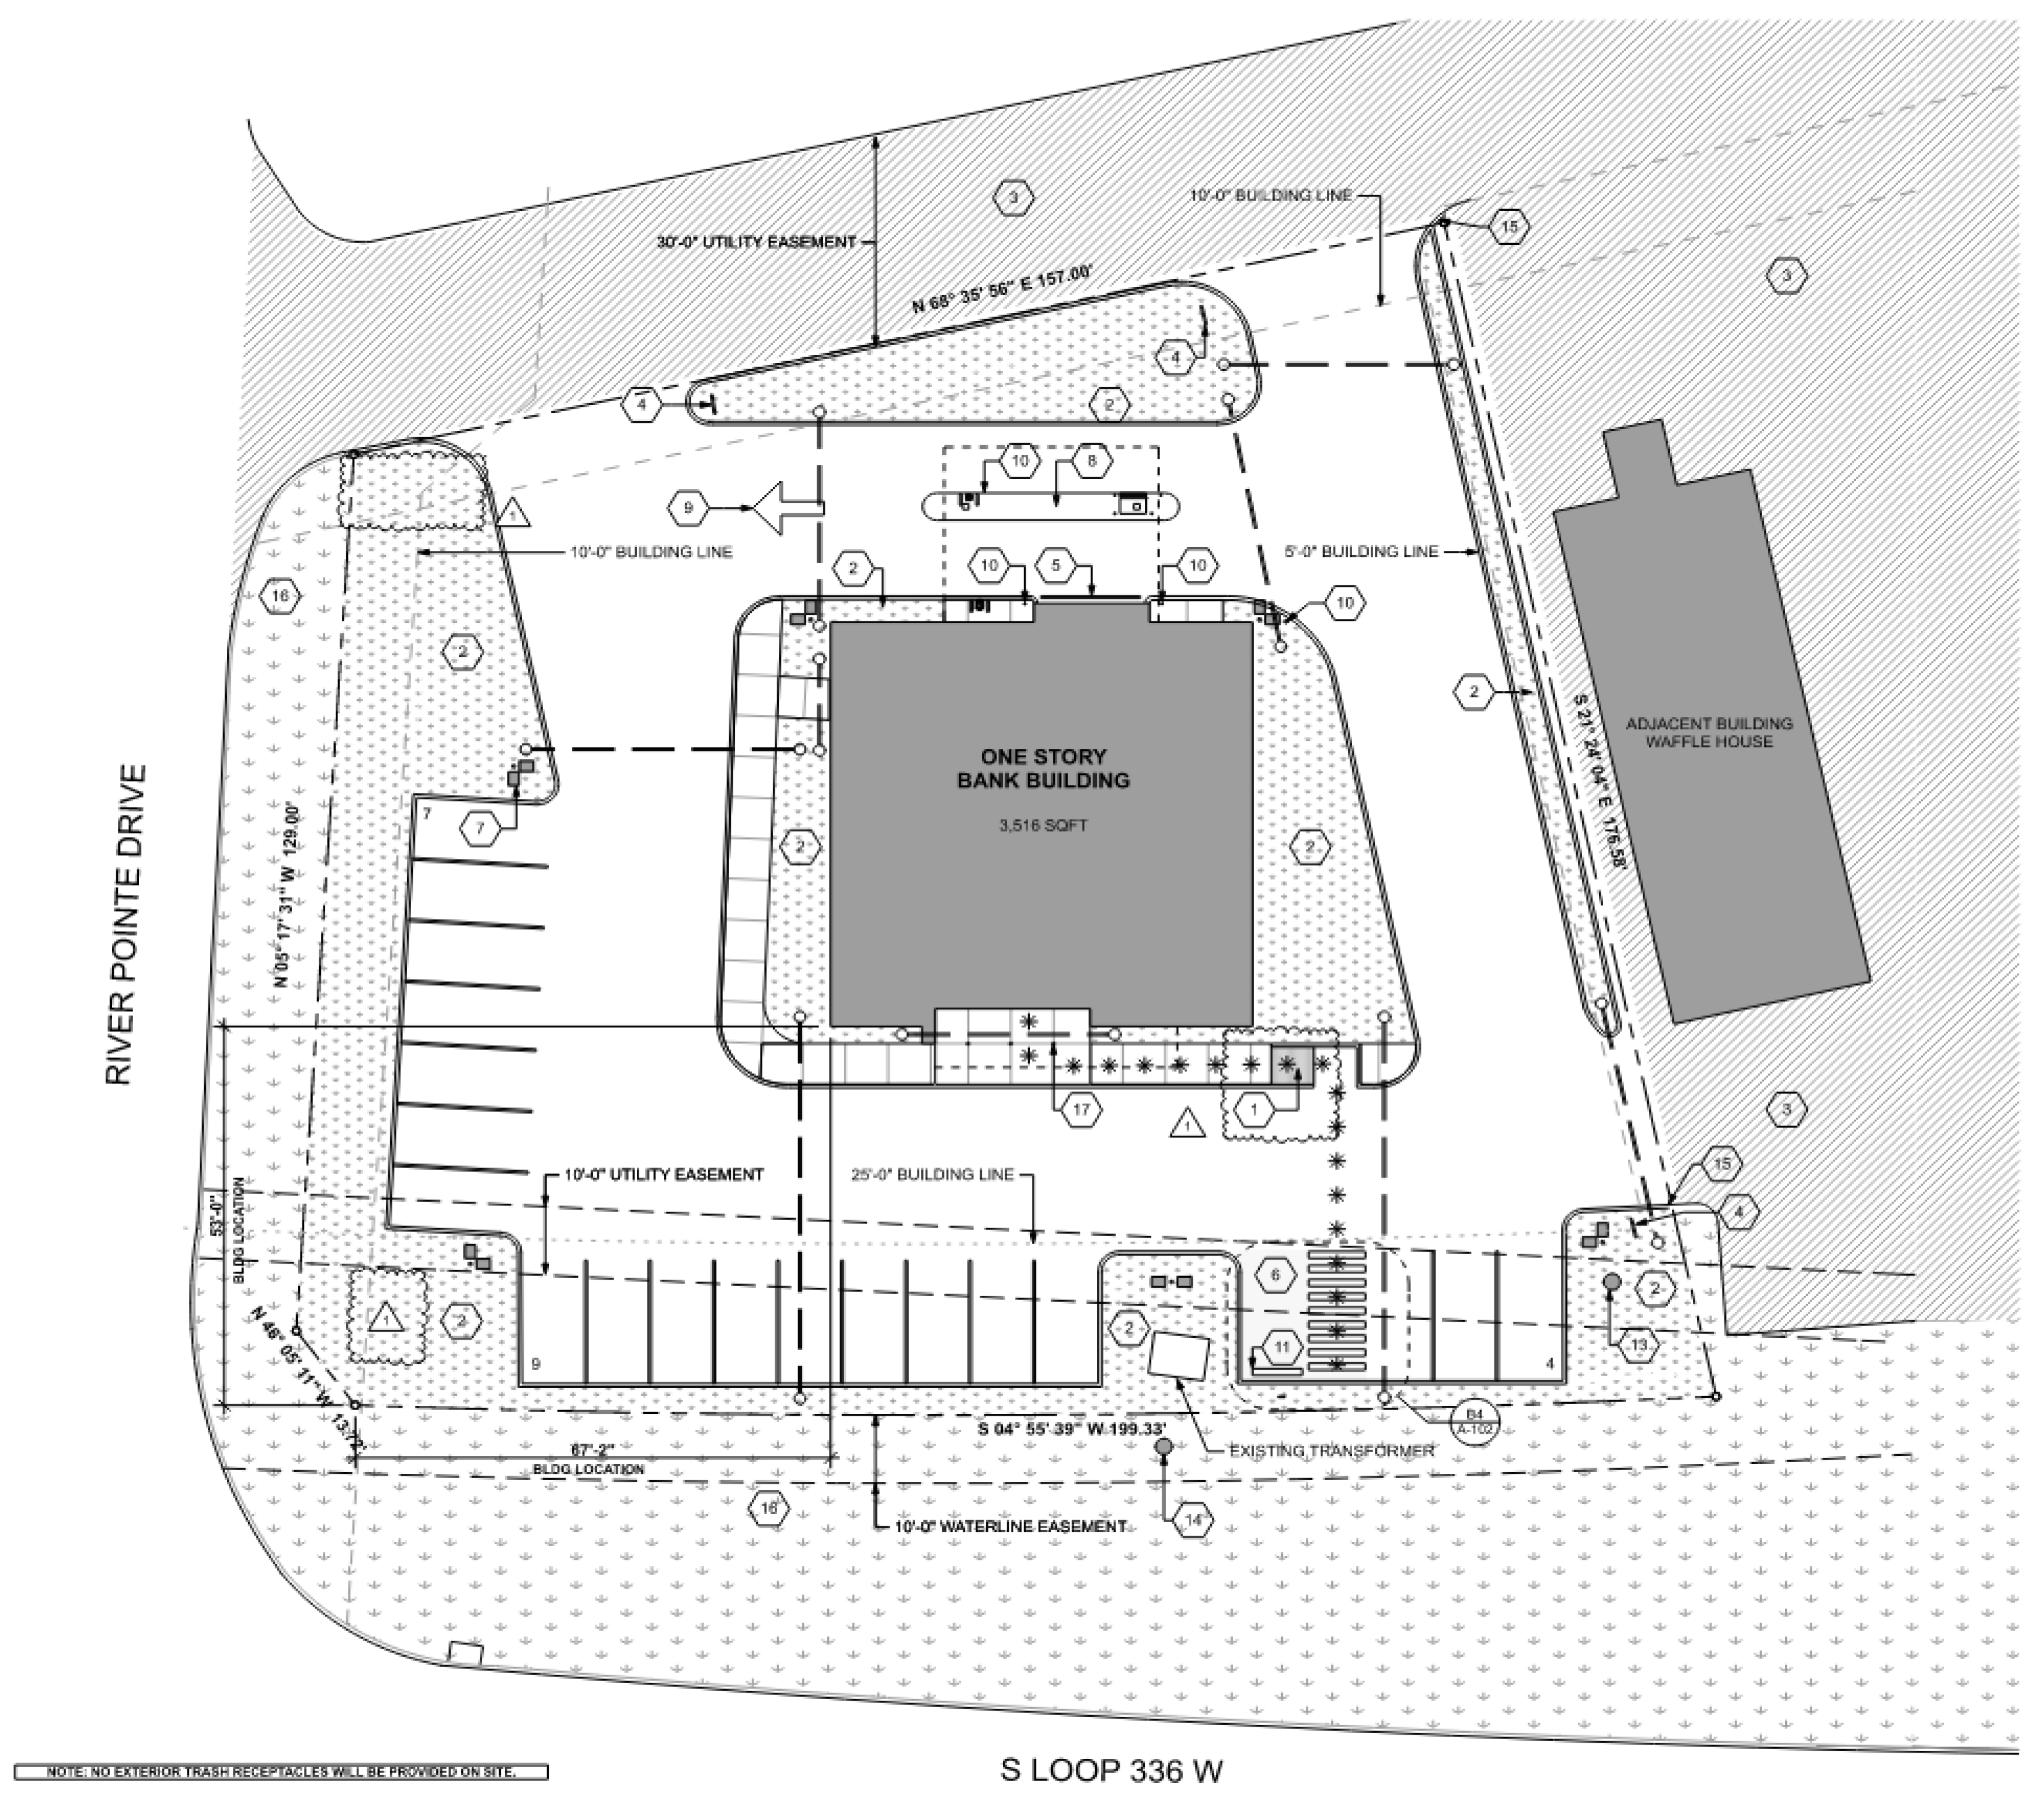
37]. By selecting a particular construction project as the case study, researchers are able to thoroughly examine and explore the feasibility and benefits associated with implementing BIM-enabled cost segregation in practical applications. This approach facilitates a deep understanding of the intricacies and complexities involved in utilizing BIM for cost segregation, considering factors such as the unique characteristics of the building, the specific types of properties involved, and the corresponding depreciation classes. Through a meticulous analysis of these factors within the chosen case study, researchers can generate empirical evidence that supports and refines the underlying theory of BIM-enabled cost segregation. Ultimately, this contextualized examination enhances comprehension of the advantages, challenges, and practical implications of employing BIM in cost segregation processes within the construction industry. This research study demonstrates the applicability of the proposed cost segregation process by employing a new construction project as a case study. The site plan of the building is shown in Figure 3.
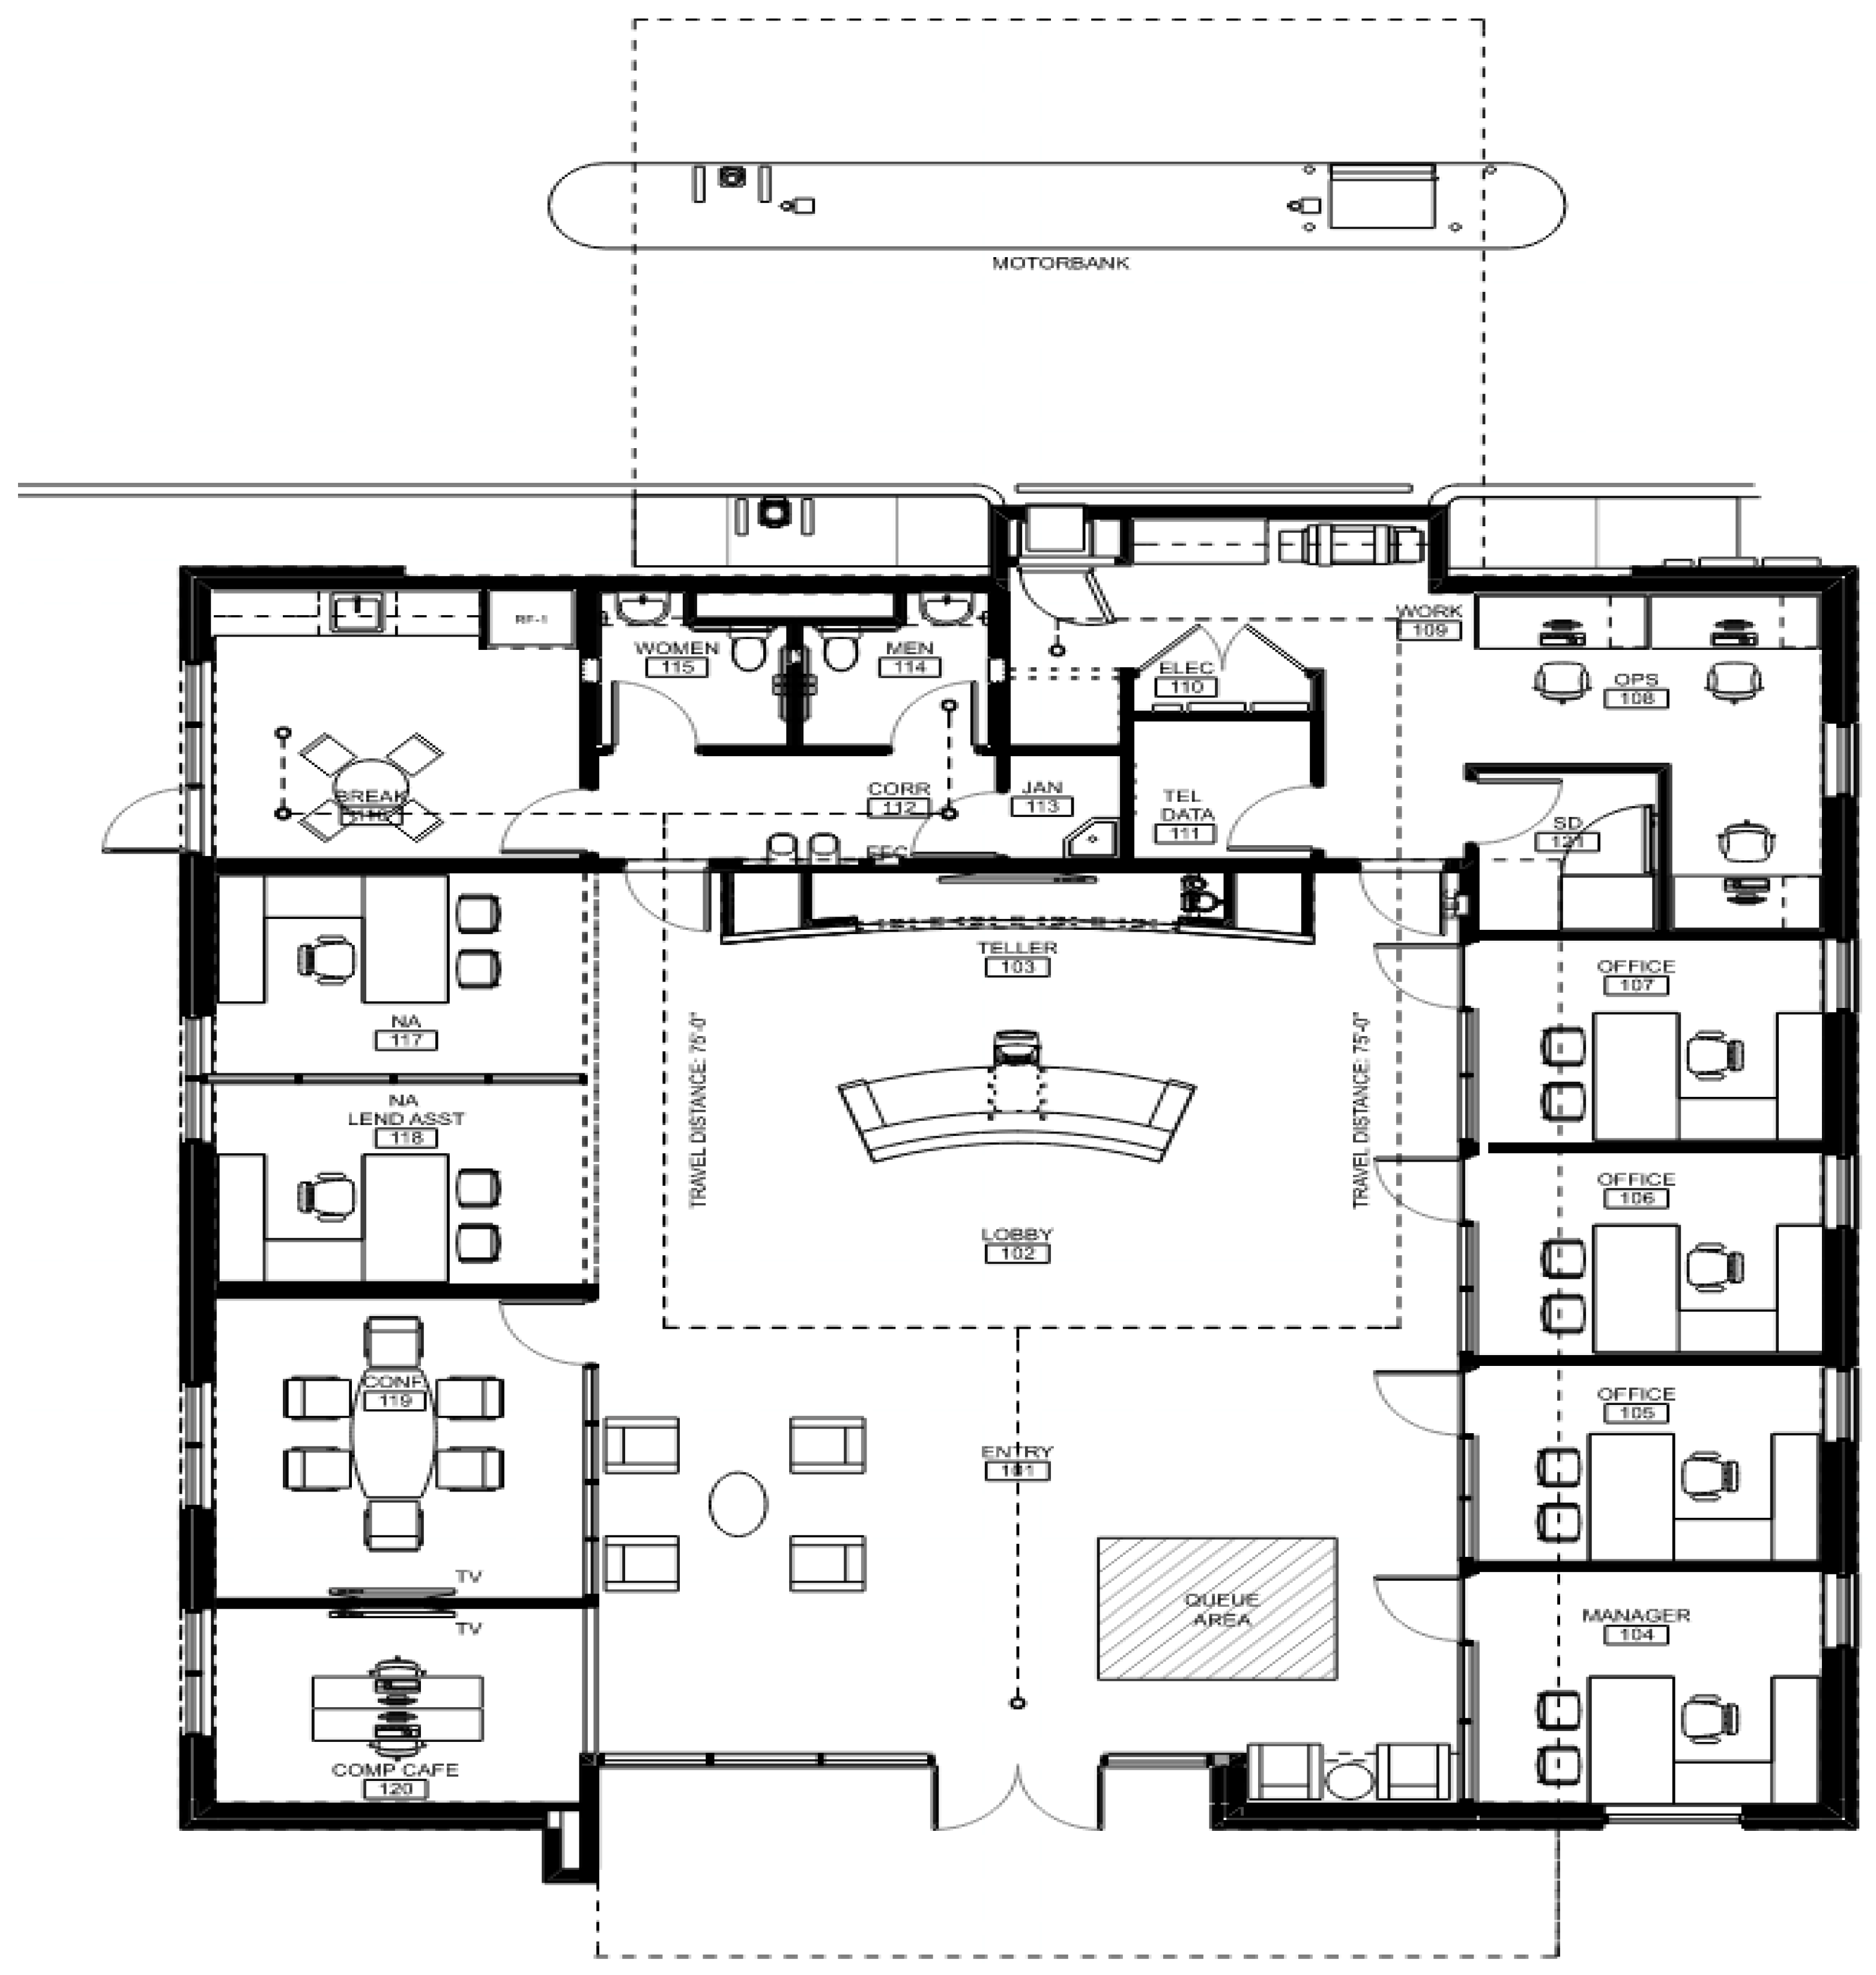
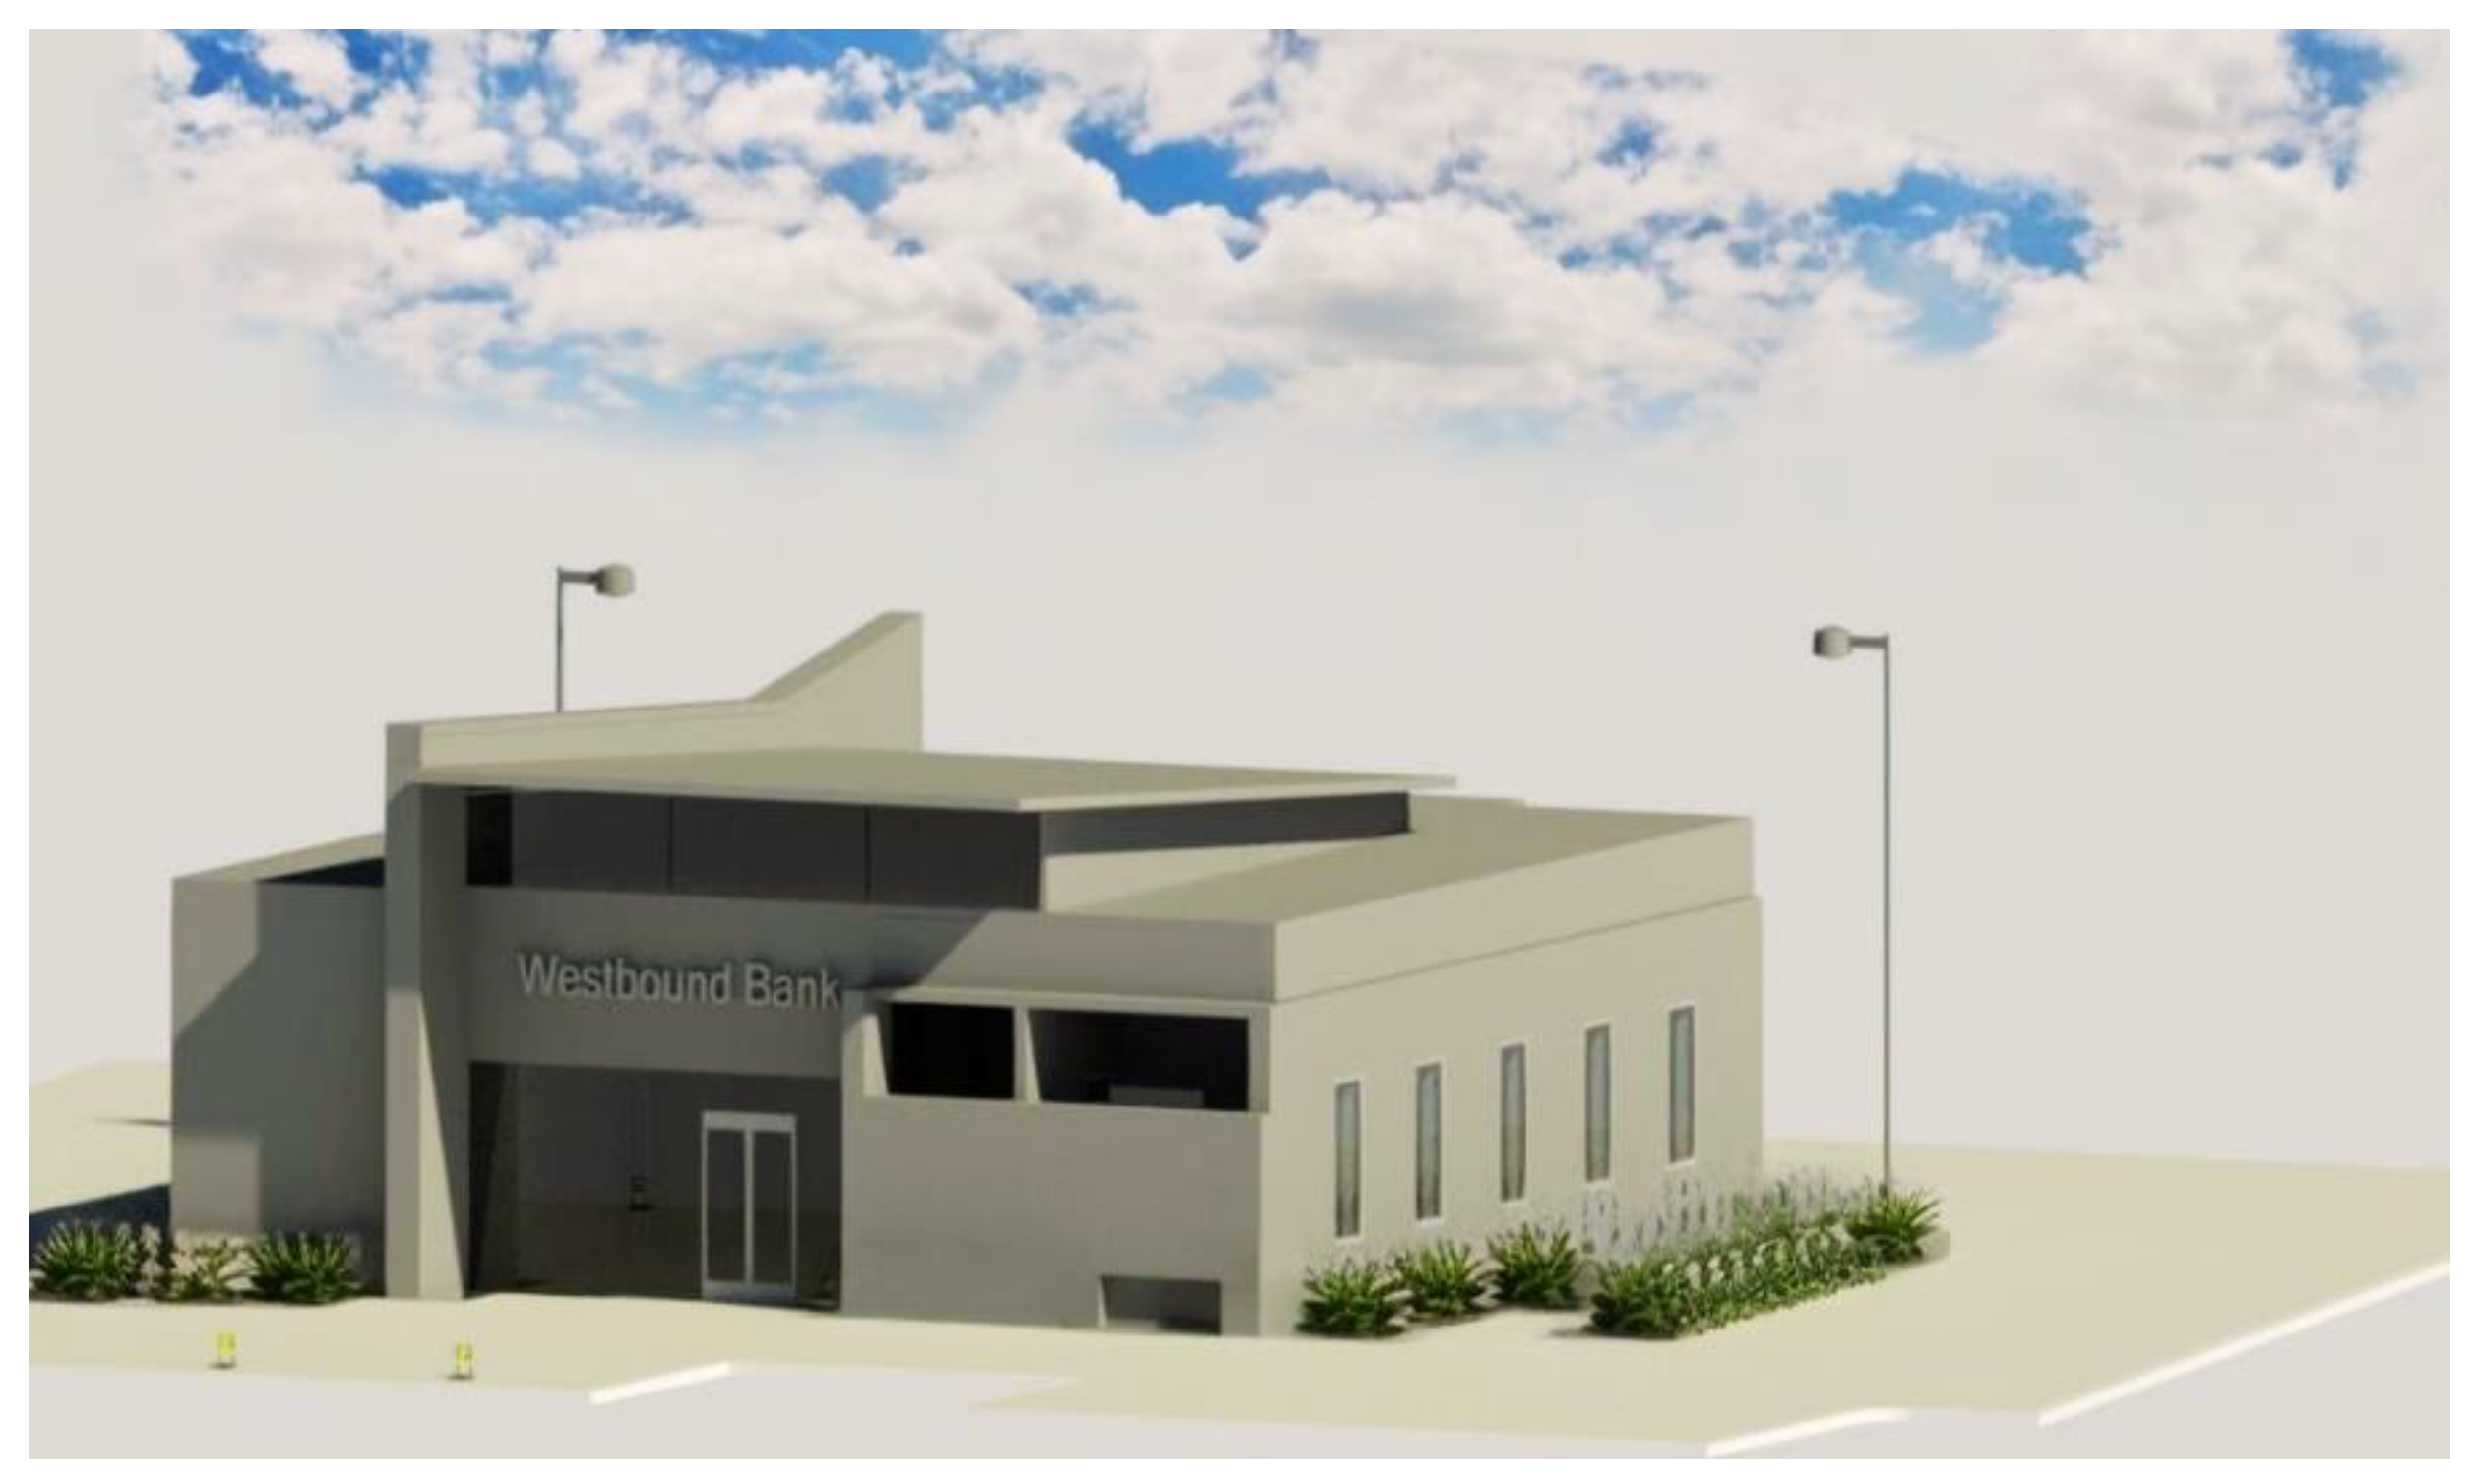
This project entails the construction of a single-story bank branch, encompassing a substantial floor area spanning 3516 square feet. The architectural design of the bank building incorporates various functional spaces, including offices, conference rooms, a welcoming area lobby, and a dedicated break room. The spatial layout of the building, illustrating the distribution and arrangement of these internal spaces, is shown in Figure 4.
The bank property falls under a 39-year depreciation schedule, although certain specific items qualify for accelerated depreciation periods of 5, 7, and 15 years. The BIM model of the bank was developed using the as-built drawings in Revit as shown in Figure 5. Subsequently, the property units within the model are identified and defined based on their functional use, physical characteristics, and other relevant criteria. During the model development phase, information from contract documents such as drawings, specifications, and cost-related data was utilized to increase the level of detail of the BIM model. The capitalized cost summary of direct and indirect expenses is shown in Table 2 and Table 3.
During the development of the BIM model, a comprehensive analysis of the building components is carried out to generate detailed quantity take-offs. This process involves utilizing the information within the BIM model to accurately assess the quantities associated with each element. As a result of this analysis, a total of 34 UoPs have been critically identified. Furthermore, a schedule has been formulated for each UoP, facilitating a systematic approach to cost segregation.
The classification of the building components has led to the identification of property classes spanning 5 years, 7 years, 15 years, and 39 years. This classification enables the identification of components that qualify for different depreciation periods. Upon conducting the analysis, the assets of the bank building were carefully assessed, leading to the identification of specific assets categorized under Section 1245 as personal property, land improvements, and real property. 
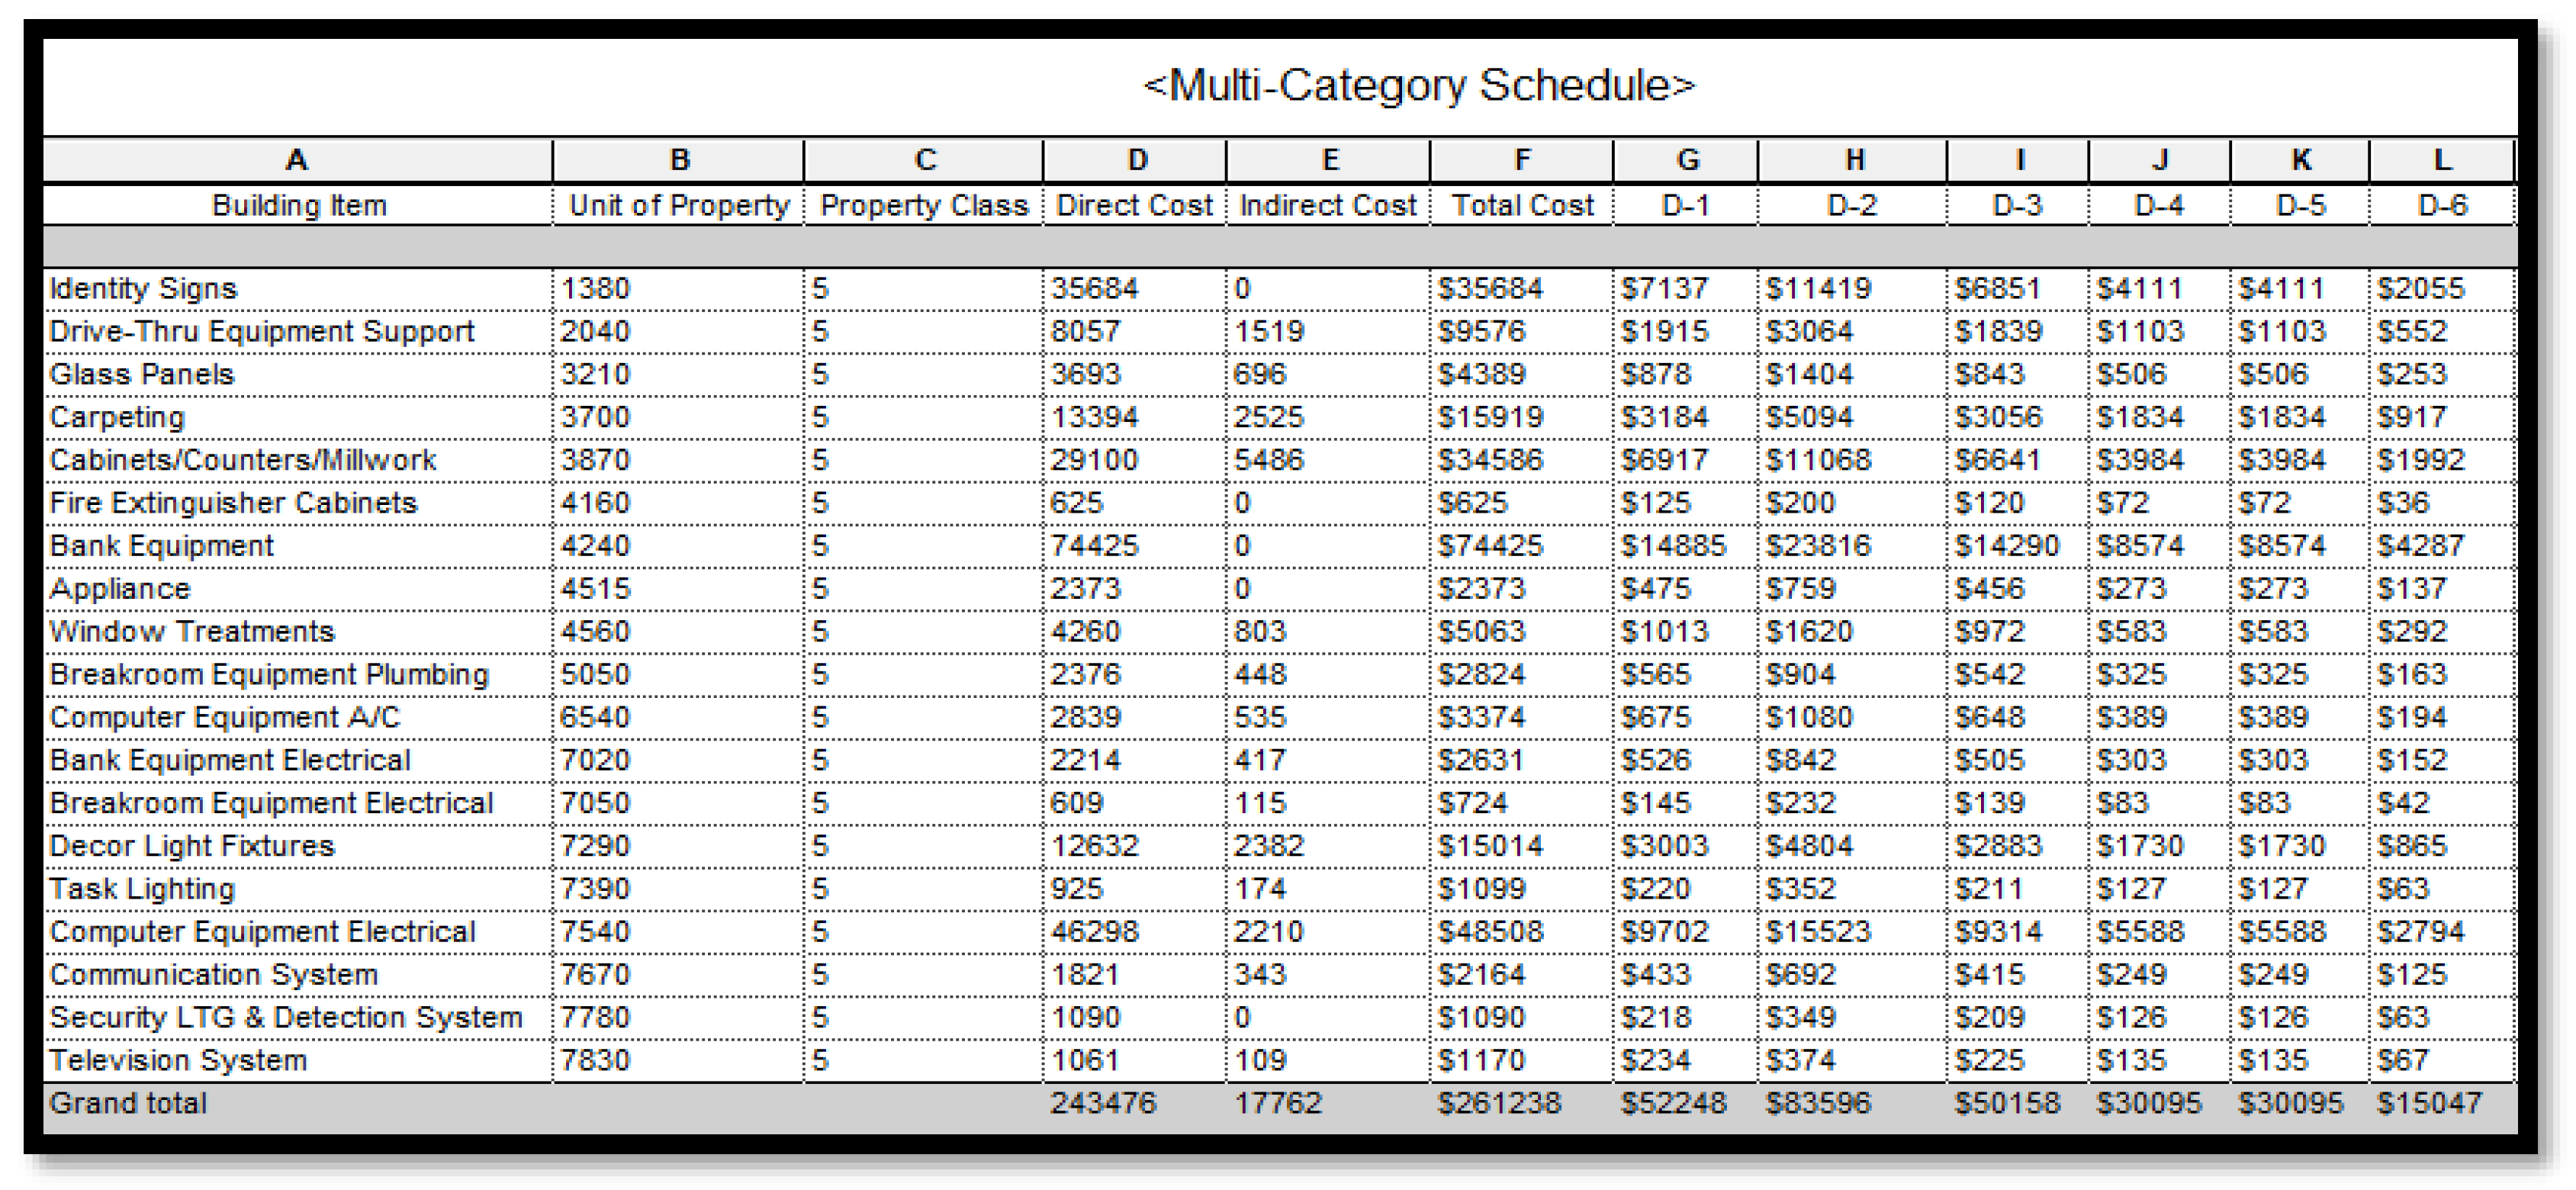
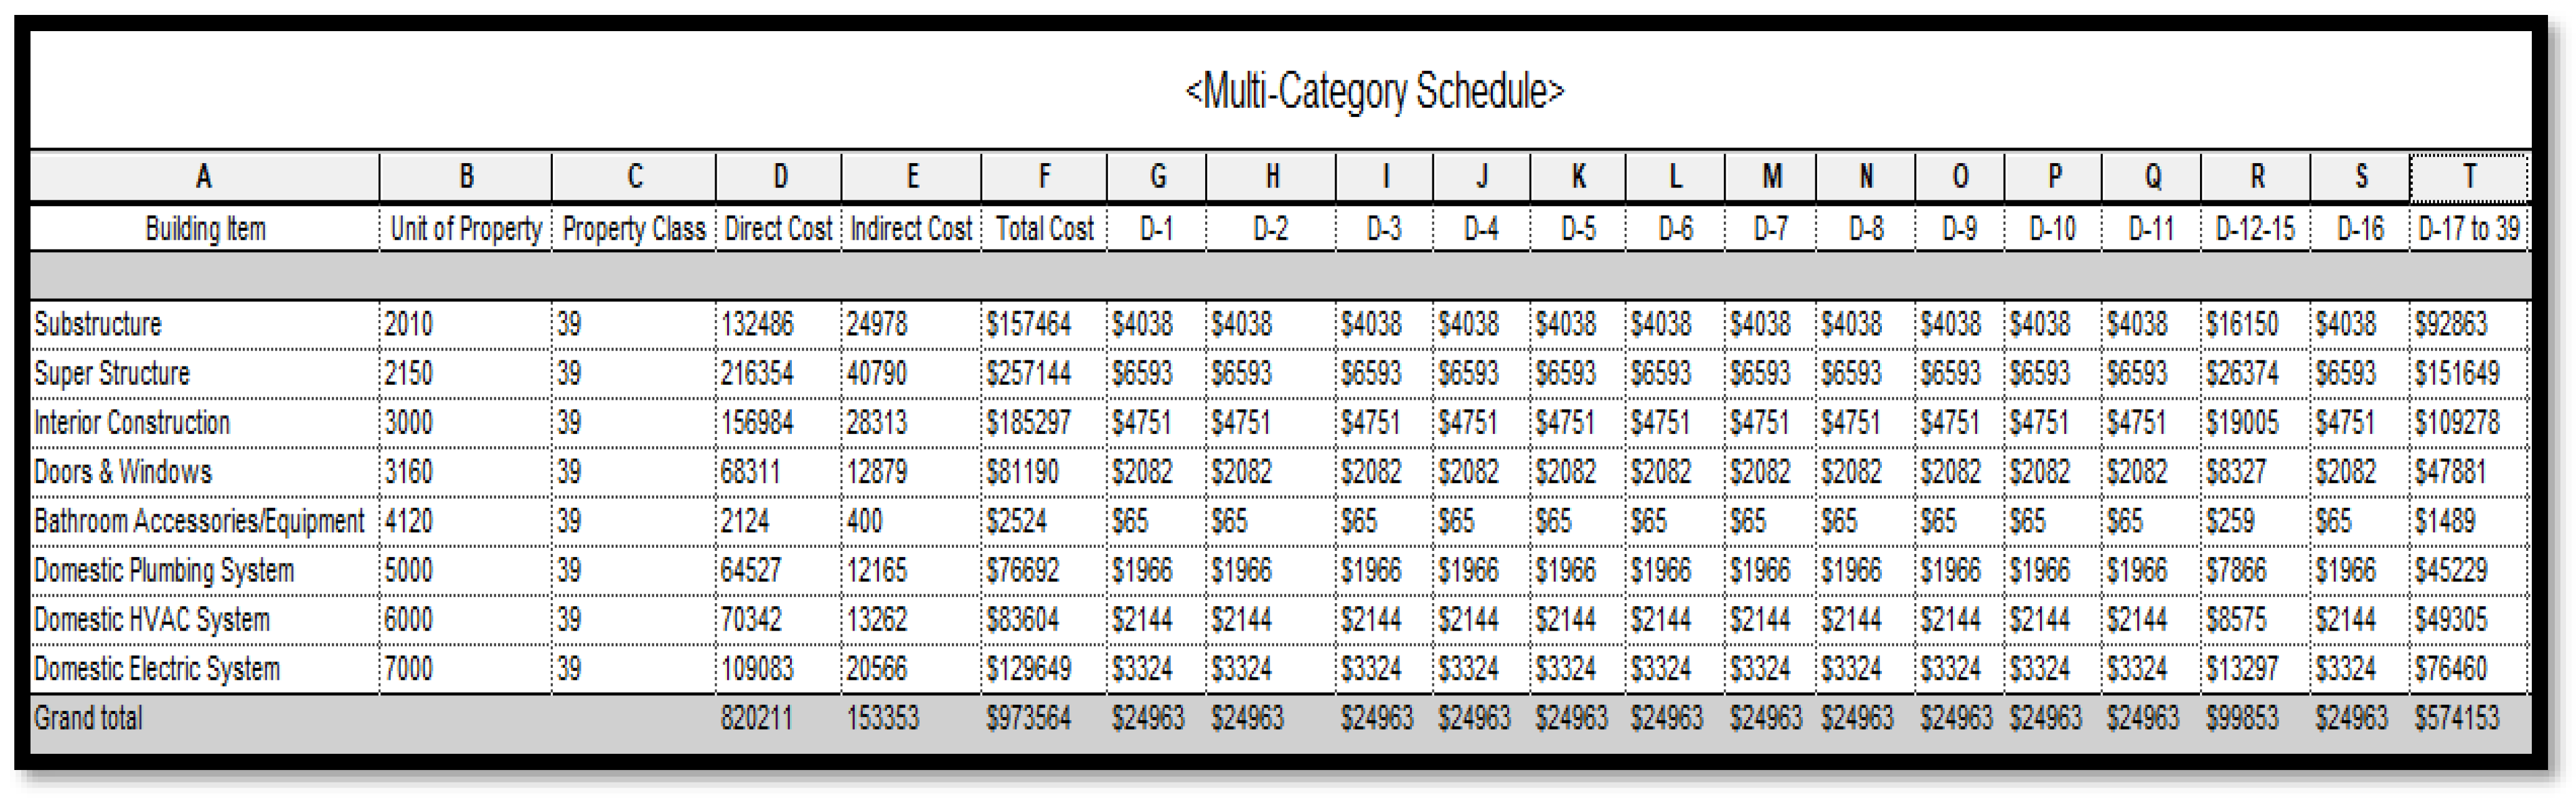
Figure 6 illustrates the depreciation of building items belonging to the 5-year property class. According to the MACRS, these components are depreciated over a period of 6 years. Notably, the building consists of 19 distinct elements falling within the 5-year property class. To streamline the cost segregation process for these elements, a multi-category schedule has been created in Revit, consolidating the various building items. In Revit, Equation (1) is utilized to calculate the depreciation of each building component based on its assigned property class.
Depreciation = if(Property Class = 5, Total Cost × 0.2, if(Property Class = 7, Total Cost × 0.1429, if(Property Class = 15, Total Cost × 0.05, if(Property Class = 39, Total Cost × (1/39), 0))))
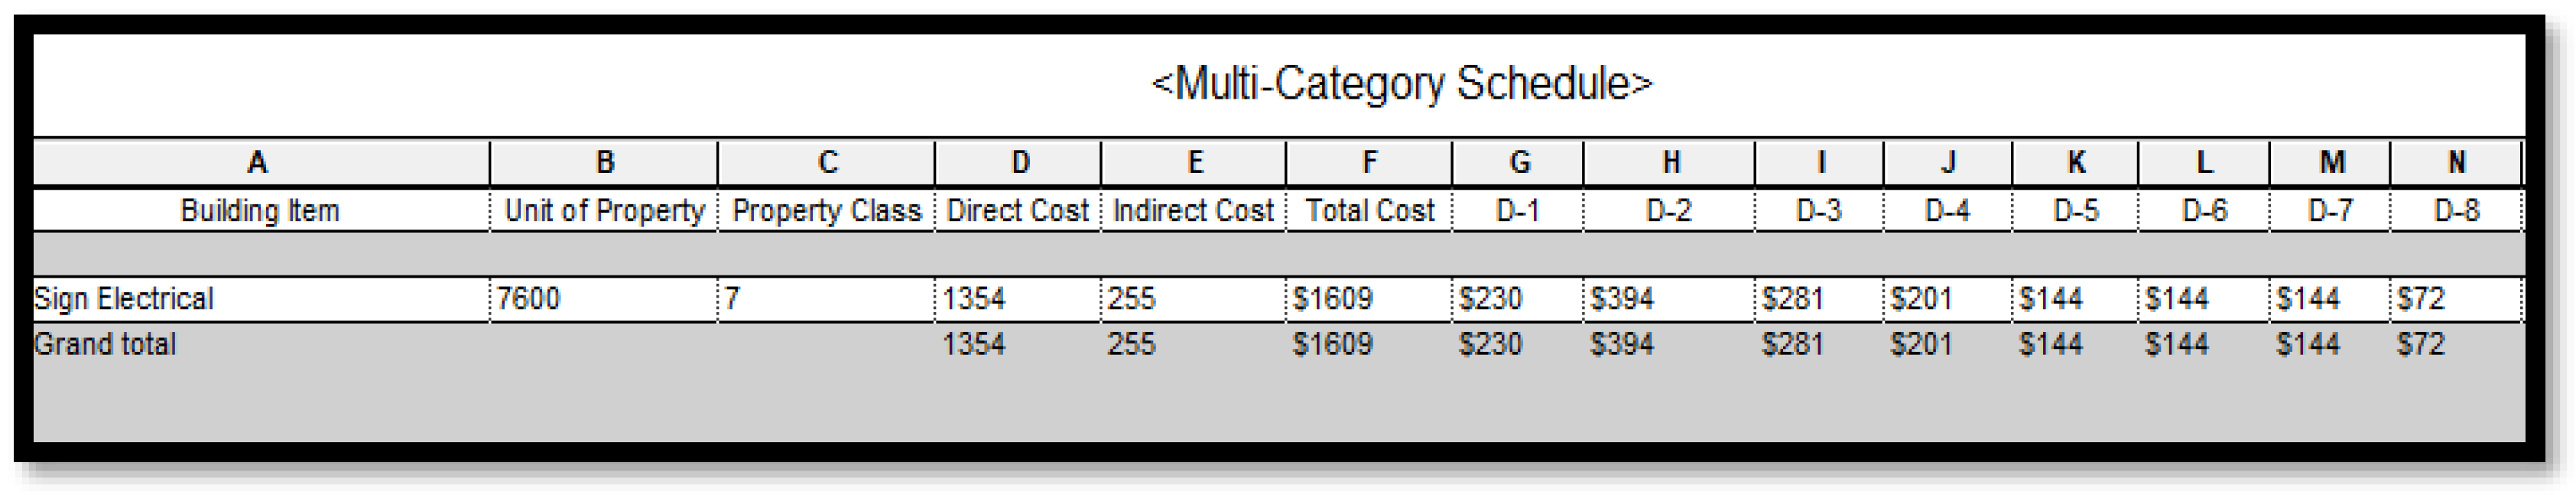
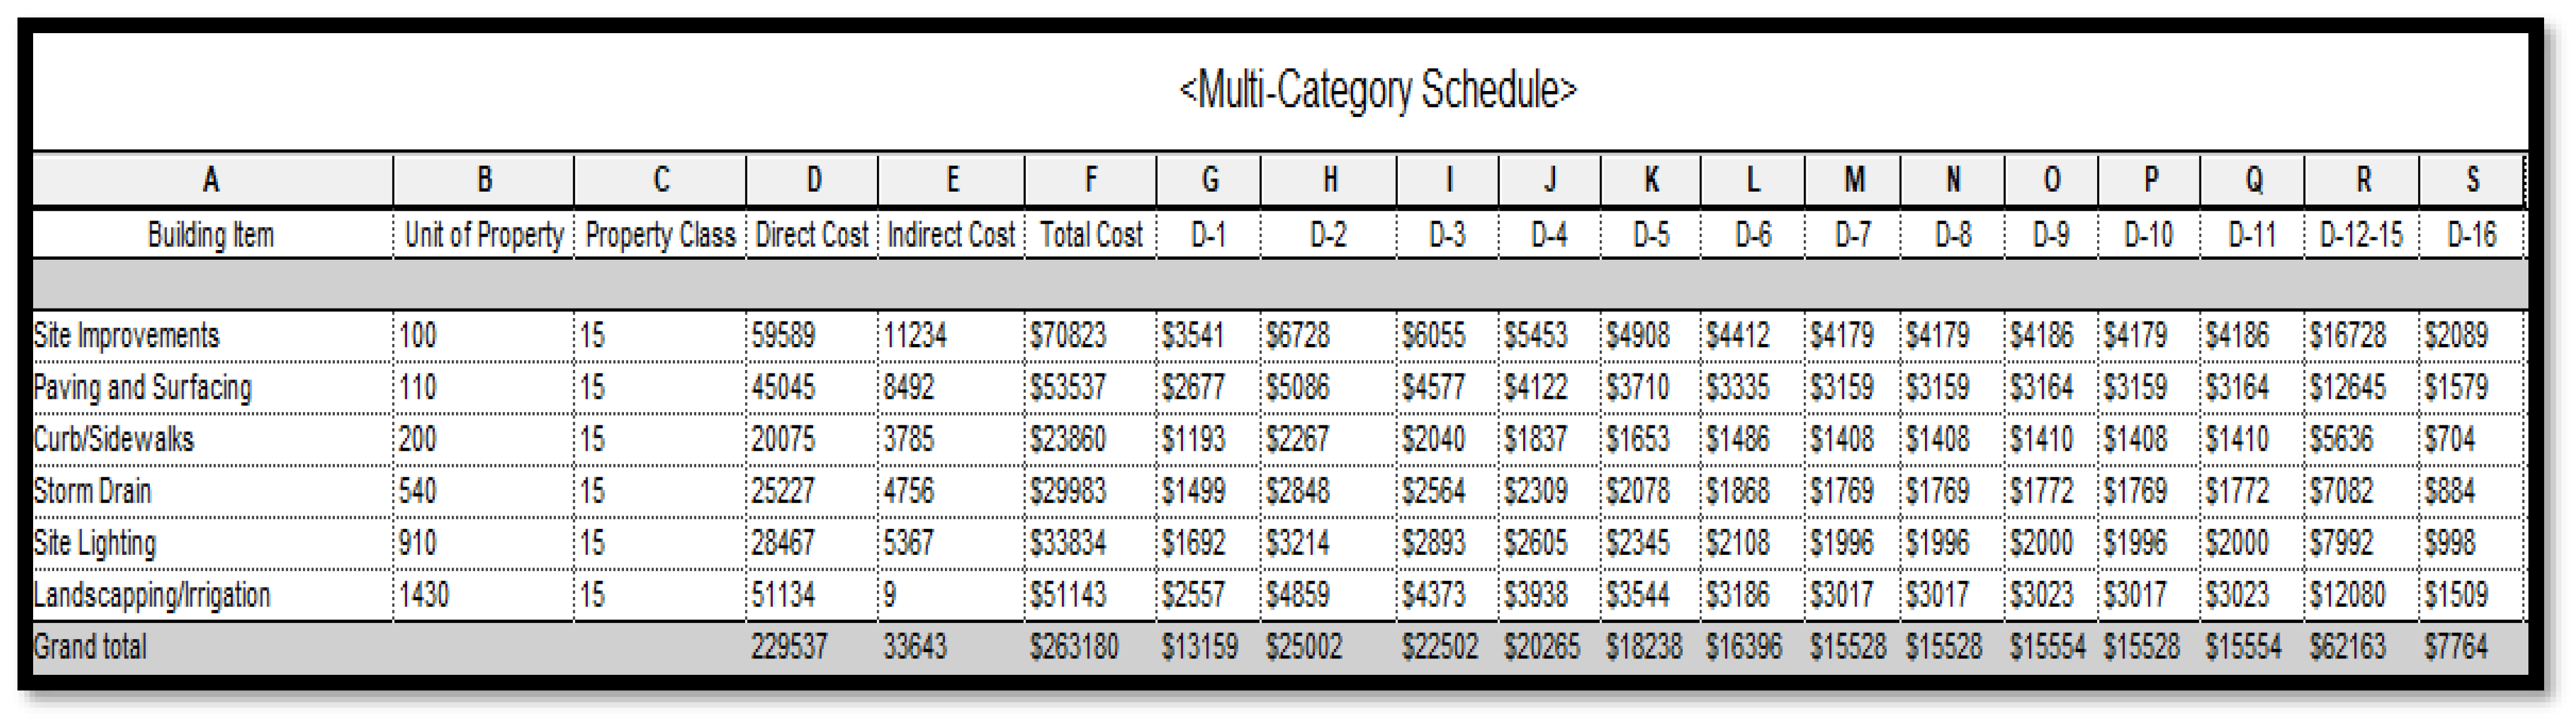
Figure 7 illustrates the cost segregation analysis conducted on building elements with a property class of 7 years and only one item falls under this specific property class. According to the MARCS classification, building items with property classes of 5 and 7 years are categorized as personal property. On the other hand, building items with a property class of 15 years as shown in Figure 8 are identified as land improvement. The building elements with a property class of 39 years are shown in Figure 9, which includes all the structural components of the building.
This research methodology adopts a meticulous approach by utilizing the BIM model and relevant equations to assess depreciation for each building component systematically and accurately. By integrating property classes and leveraging the capabilities of Revit, this methodology establishes a robust framework for conducting cost segregation analysis on commercial buildings. The cost segregation outcomes for each property class are summarized in Table 4.
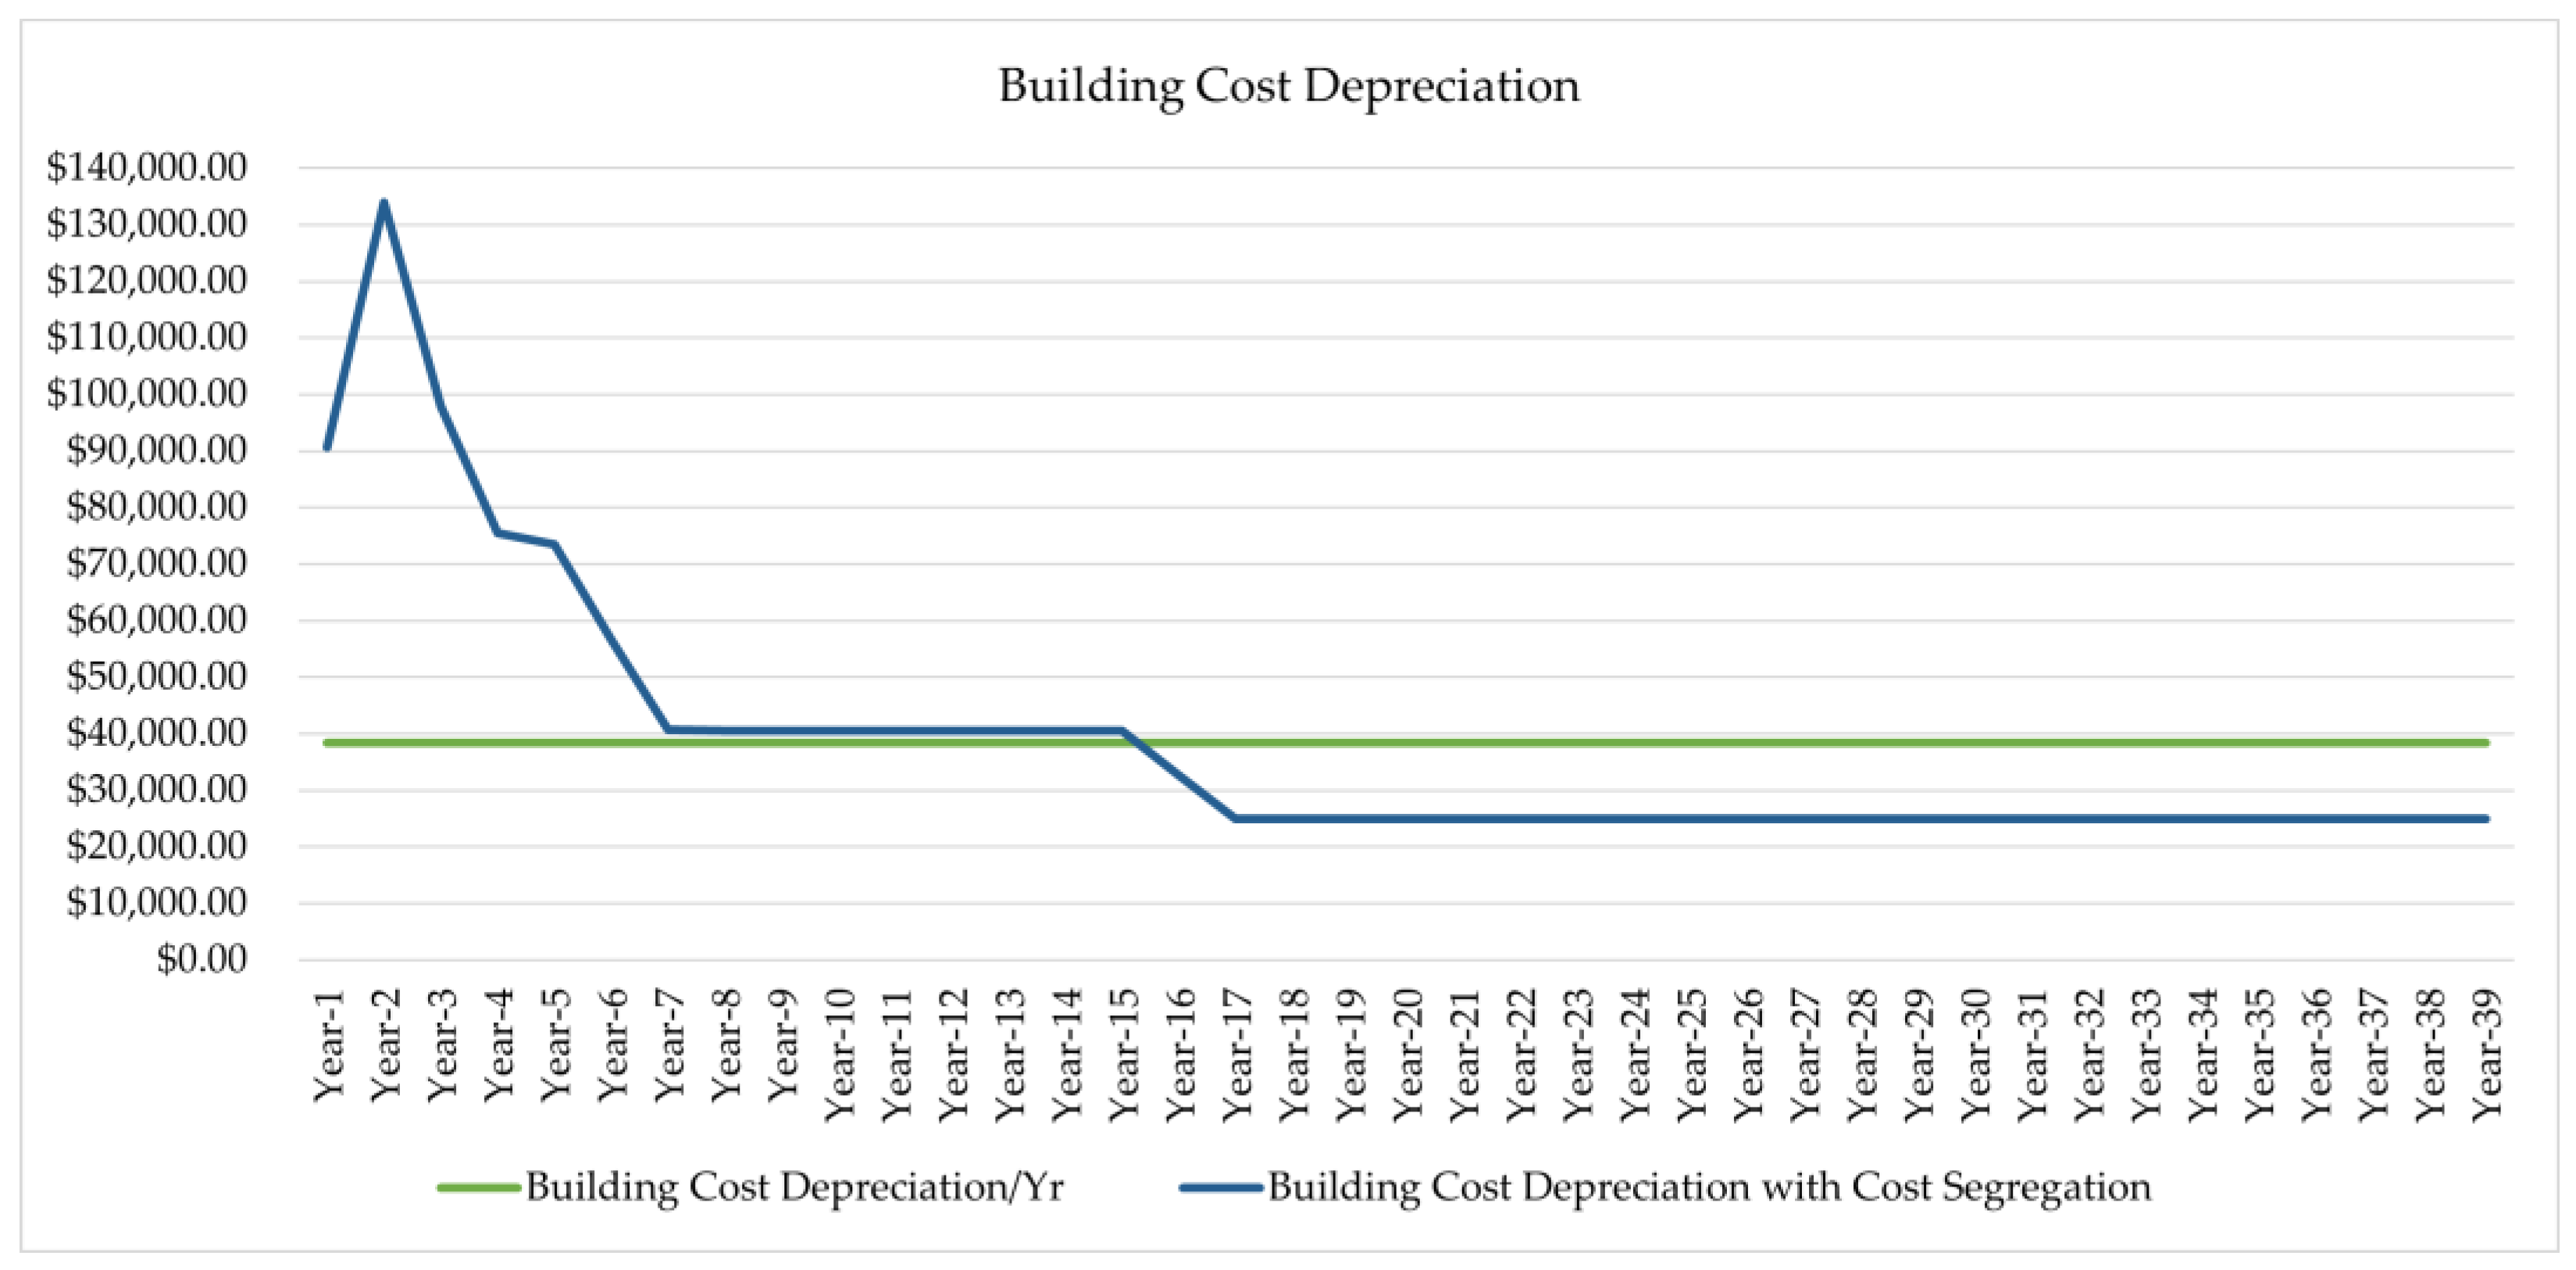
A visual representation of the distribution of cost depreciation over each year is shown in 
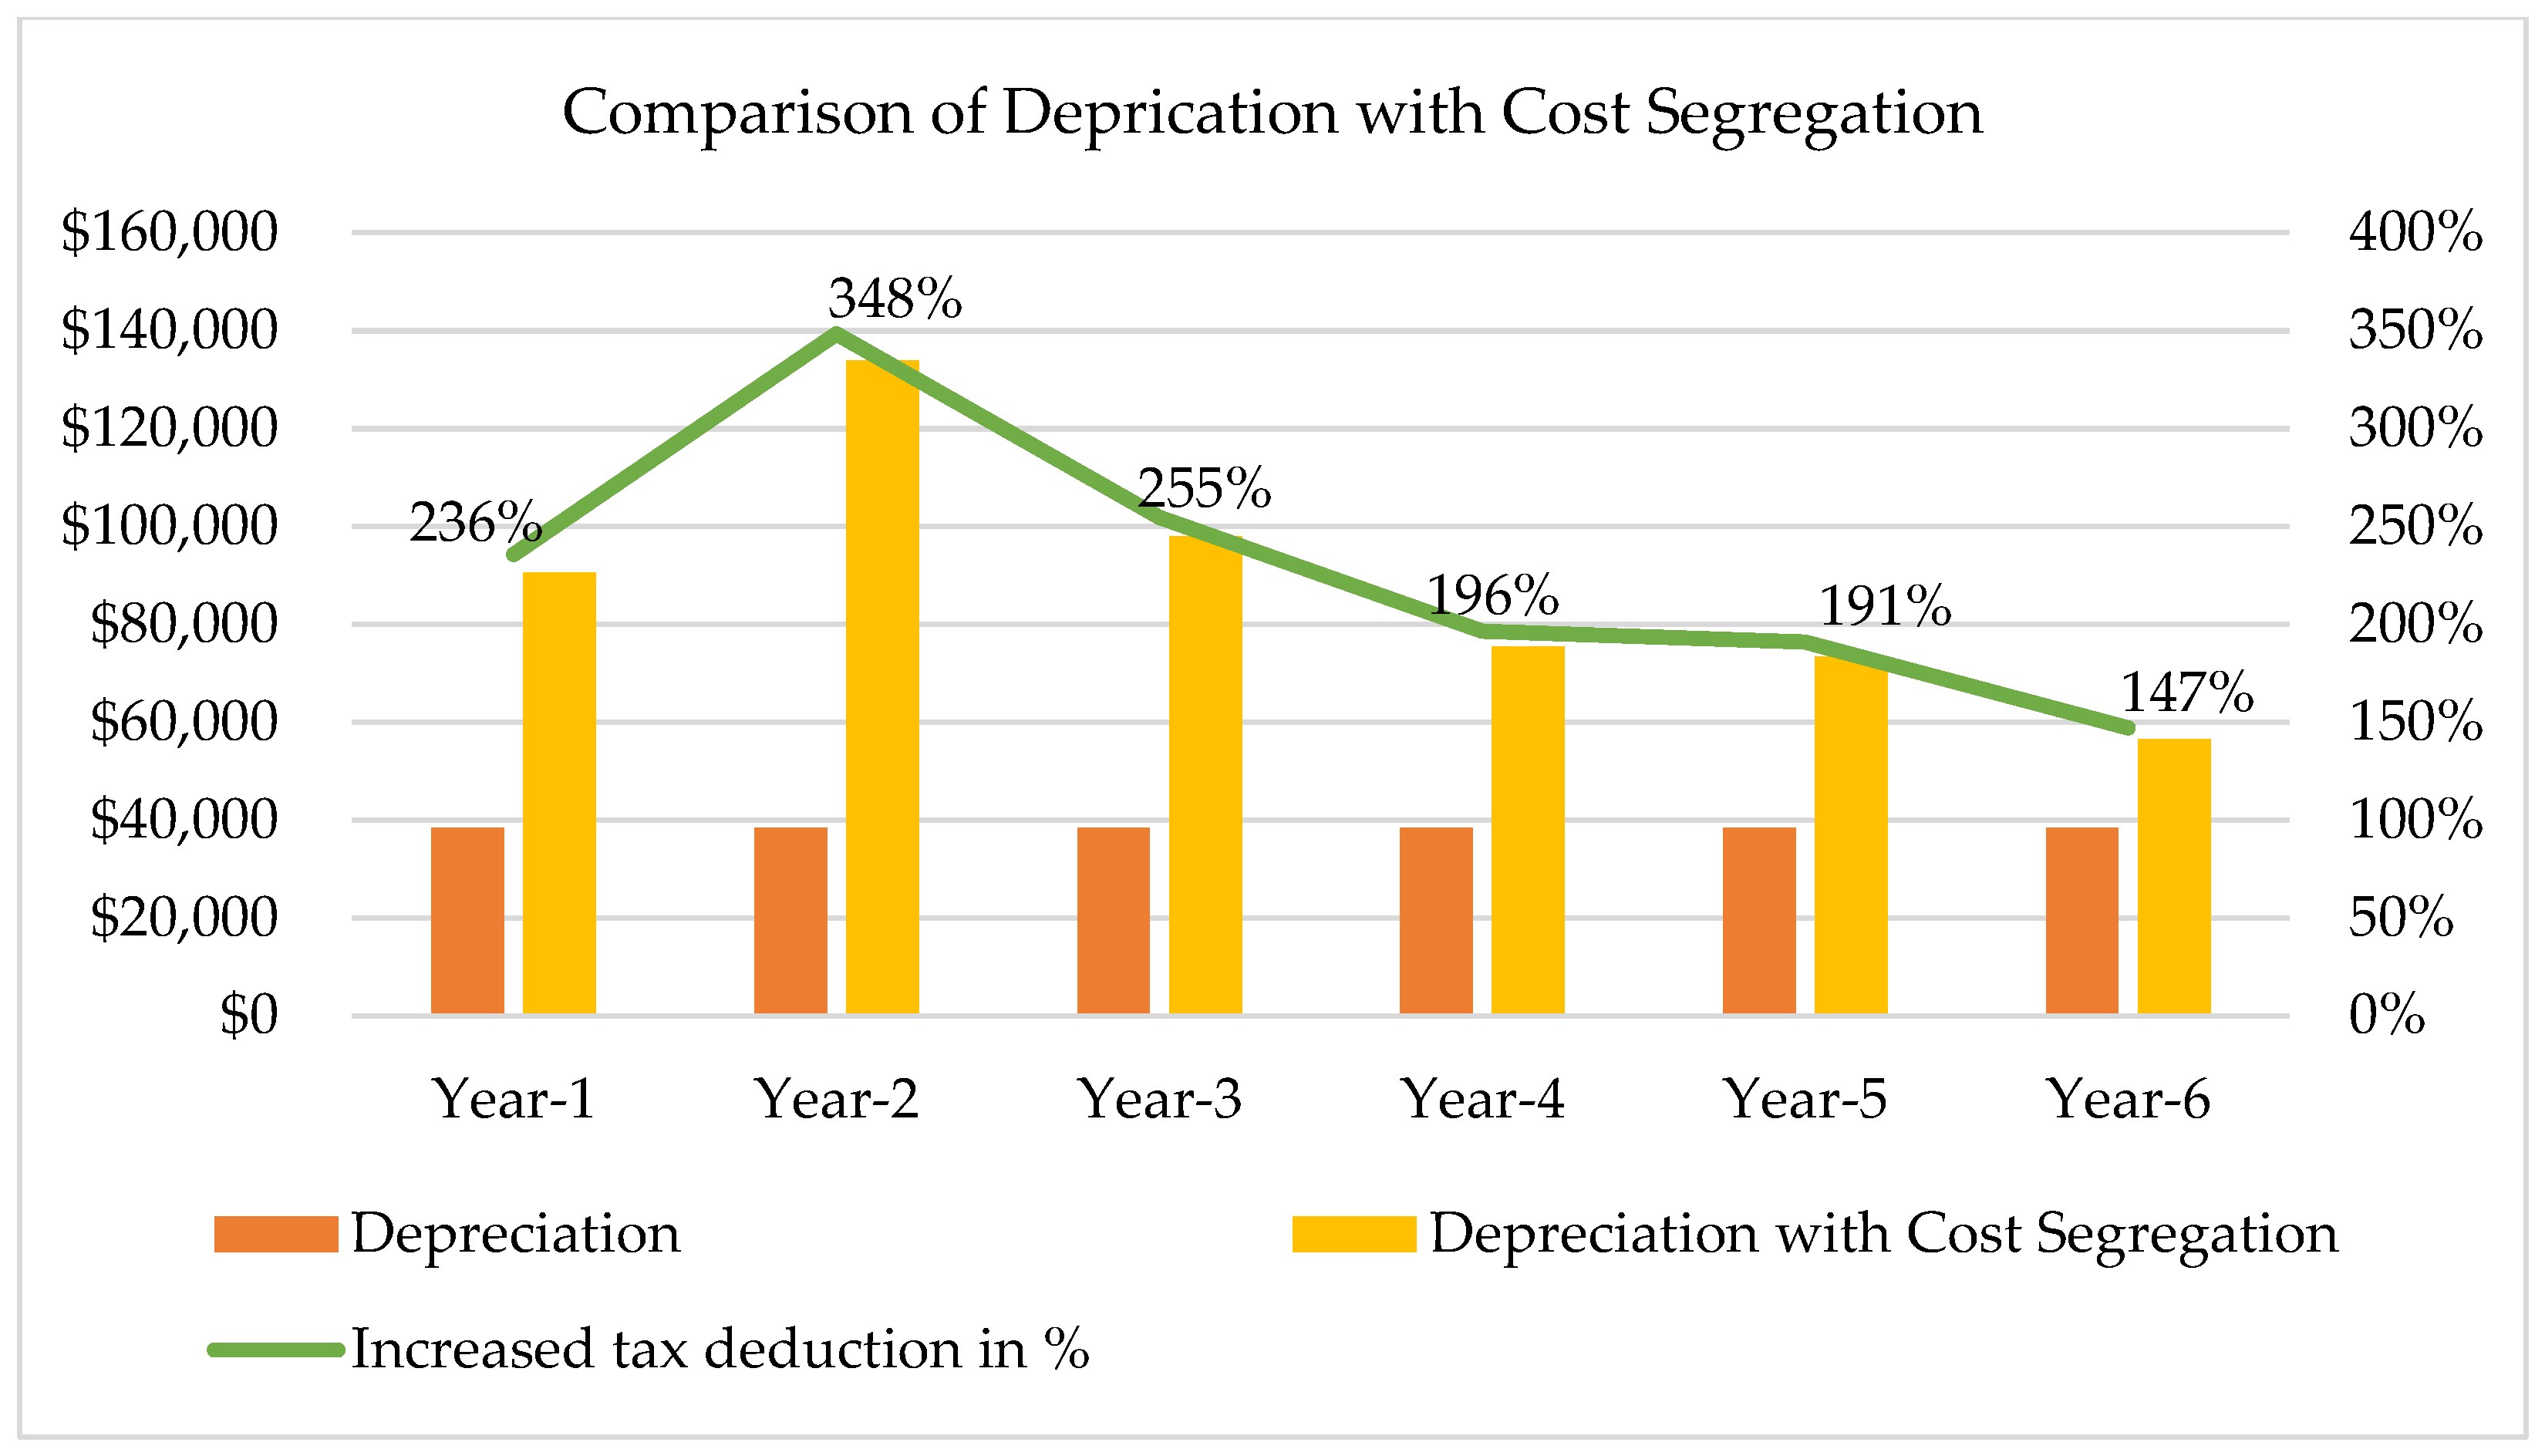
Figure 10, highlighting the substantial tax deduction opportunities that arise from the depreciation of personal property, especially in the initial six years, as shown in Figure 11. In the absence of cost segregation, the annual depreciation remains constant at $38,451. However, the implementation of cost segregation significantly increases the depreciation amounts, particularly during the first six years, resulting in higher tax deductions. The authors in [5,6,7] have also reported similar results while performing cost segregation analysis on a commercial property.
The analysis focuses on these initial six years as they demonstrate substantial financial gains that can be realized through tax deductions. Additionally, there is a noteworthy percentage increase in tax deductions compared to regular depreciation, with figures of 236%, 348%, 255%, 196%, 191%, and 147% for years 1 to 6, respectively. This data underscores the significant impact of cost segregation in maximizing tax benefits and optimizing financial planning for property owners. The benefits derived from cost segregation are made possible through a comprehensive assessment that enables the identification and separate depreciation of specific building components, which would not be attainable without this analysis.
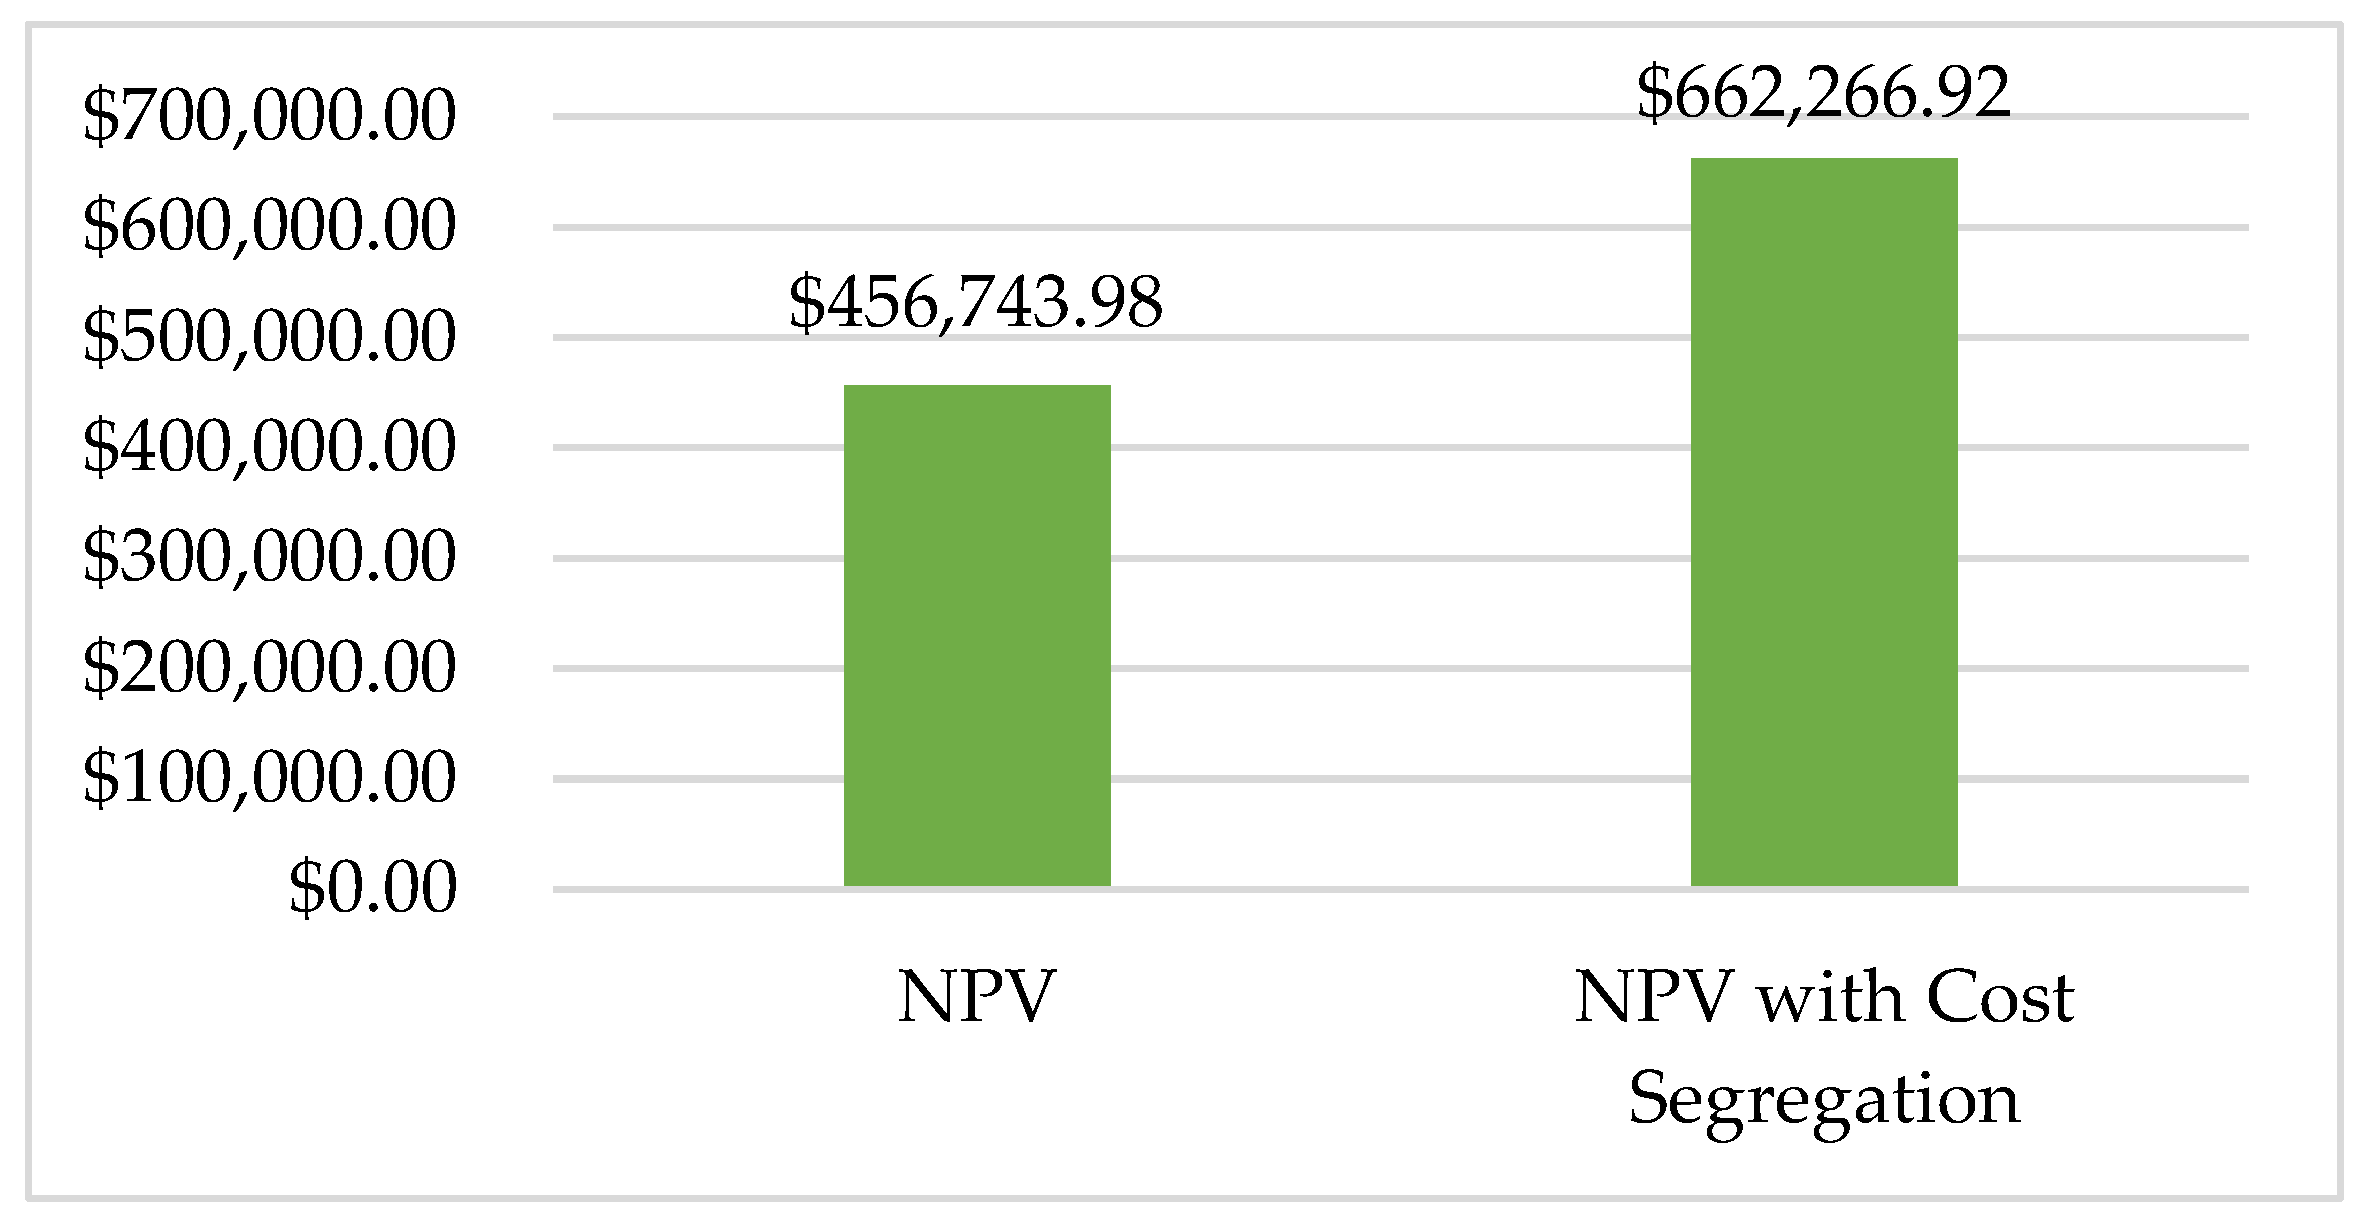
The benefits of cost segregation analysis through BIM are exemplified in Figure 12, which calculates the Net Present Value (NPV) based on annual depreciation, considering an interest rate of 8%. The analysis reveals a notable difference in NPV amounting to $205,523. This surplus in financial resources presents real estate developers and investors with valuable opportunities for additional investments, ultimately yielding greater benefits. Consequently, these findings emphasize the significance and effectiveness of cost segregation in maximizing tax advantages for commercial buildings.
The utilization of BIM for cost segregation offers significant advantages by streamlining the process and conserving time and resources. By leveraging the comprehensive data and accurate visualization capabilities of BIM, the identification and allocation of depreciable components can be efficiently performed. This not only ensures a detailed assessment of assets for cost segregation analysis but also eliminates the need for labor-intensive manual evaluation and calculations. The integration of BIM-enabled cost segregation thus presents a valuable opportunity for property owners, construction professionals, tax advisors, and financial planners to enhance financial outcomes and maximize returns on their real estate investments.

5. Conclusions

The cost segregation system is a strategic approach employed to reduce tax liabilities by reclassifying real property as personal property and land improvement, thereby accelerating the tax depreciation of assets. Traditional cost segregation methods have their limitations of time and cost, prompting the introduction of an automated cost segregation process in this study, which harnesses the capabilities of BIM. The primary objective of this novel approach is to optimize and automate the cost segregation of commercial building projects. This automated BIM-enabled cost segregation process empowers owners of diverse commercial properties and assets by facilitating additional cash flow. By effectively integrating and leveraging cost segregation data from various construction assets, owners can optimize their financial resources and enhance their overall profitability. This approach offers a strategic advantage in terms of maximizing tax benefits and increasing the available funds for investment and operational purposes. This integration offers the potential to generate increased cash flow for owners with diverse portfolios of commercial properties and assets. Through the utilization of BIM, owners can enhance cost optimization and contractors can leverage it as an additional value proposition during the bidding process. Consequently, this innovative BIM-enabled cost segregation process shows promising potential in maximizing financial benefits and streamlining operations within the construction and real estate industry.
Future research endeavors may center on the integration of cost segregation modules within BIM systems, complemented by asset management tools, to enhance facility and fiscal management of building components. This integration holds immense potential for delivering substantial benefits to the construction and real estate industry. By seamlessly combining cost segregation analysis with robust asset management functionalities, stakeholders can gain comprehensive insights into the financial aspects of building components throughout their lifecycle. Moreover, the integration of cost segregation modules with asset management tools foster efficient tracking, monitoring, and maintenance of assets, resulting in enhanced facility management practices.

Author Contributions

Conceptualization, C.Z., H.L. and R.Z.; methodology, C.Z. and D.K; software, D.K.; validation, R.Z., H.L. and C.Z.; formal analysis, D.K.; investigation, L.L.; resources, J.T.; data curation, D.K.; writing—original draft preparation, D.K.; writing—review and editing, C.Z.; visualization, D.K.; supervision, C.Z. and H.L.; project administration, R.Z.; All authors have read and agreed to the published version of the manuscript.

Funding

This research received no external funding.

Data Availability Statement

Not Applicable.

Conflicts of Interest

The authors declare no conflict of interest.

References

  1. Larry, M.; Robert, D.H. Side Effects of Cost Segregation. J. Account. 2012, 213, 49. [Google Scholar]
  2. Placid, R.; Weeks, H.S. Point of View: Distressed Commercial Real Estate: Cost Segregation a “Pandora’s Box”. J. Portf. Manag. 2011, 17, 271–280. [Google Scholar] [CrossRef]
  3. Lassar, S.S.; Duncan, W.A.; Everett, J.O. Evaluating Cost Segregation Opportunities before, during, and after the Usage of Qualifying Realty. ATA J. Leg. Tax Res. 2006, 4, 76–100. [Google Scholar] [CrossRef]
  4. White, P.L. Cost segregation; Recovering costs to maximize income tax savings. J. Prop. Manag. 2008, 73, 20–21. [Google Scholar]
  5. Gonzalez, J.P. Real Estate Investors Can Benefit from Cost Segregation Studies. CPA J. 2006, 76, 44. [Google Scholar]
  6. Bigelow, B.F.; Robinson, J. General Contractors and Cost Segregation Studies. In Construction Research Congress 2016; American Society of Civil Engineers: Reston, VA, USA, 2016; pp. 371–379. [Google Scholar] [CrossRef]
  7. Grant, D.A. Cost Segregation of Assets Offers Tax Benefits. Healthc. Financ. Manag. 2001, 55, 64. [Google Scholar]
  8. Soled, J.A.; Falk, C.E. Cost Segregation Applied. J. Account. 2004, 198, 28–35. [Google Scholar]
  9. Lin, Y.-C.; Lee, H.-Y.; Yang, I.-T. Developing as-built BIM model process management system for general contractors: A case study. J. Civ. Eng. Manag. 2016, 22, 608–621. [Google Scholar] [CrossRef] [Green Version]
  10. Ivson, P.; Moreira, A.; Queiroz, F.; Santos, W.; Celes, W. A Systematic Review of Visualization in Building Information Modeling. IEEE Trans. Vis. Comput. Graph. 2020, 26, 3109–3127. [Google Scholar] [CrossRef] [Green Version]
  11. Kim, K.; Cho, Y.K. Construction-specific spatial information reasoning in Building Information Models. Adv. Eng. Inform. 2015, 29, 1013–1027. [Google Scholar] [CrossRef]
  12. Bryde, D.; Broquetas, M.; Volm, J.M. The project benefits of Building Information Modelling (BIM). Int. J. Proj. Manag. 2013, 31, 971–980. [Google Scholar] [CrossRef] [Green Version]
  13. Ben, F.B.; Jeremy, R.; John, K. Contractor Feasibility in Providing Cost Segregation Studies from Detailed Estimates: A Case Study. Am. Inst. Constr. 2016, 40, 29–36. [Google Scholar]
  14. Zenk, J.D. Cost Segregation—Bridging the Gap Between Engineering, Construction and Property Tax. In Proceedings of the 2005 AACE International Transactions: 49th AACE International Annual Meeting, New Orleans, LA, USA, 26–29 June 2005. [Google Scholar]
  15. Wen, Y. Research on Cost Control of Construction Project Based on the Theory of Lean Construction and BIM: Case Study. Open Constr. Build. Technol. J. 2014, 8, 382–388. [Google Scholar] [CrossRef] [Green Version]
  16. Khahro, S.H.; Kumar, D.; Siddiqui, F.H.; Ali, T.H.; Raza, M.S.; Khoso, A.R. Optimizing Energy Use, Cost and Carbon Emission through Building Information Modelling and a Sustainability Approach: A Case-Study of a Hospital Building. Sustainability 2021, 13, 3675. [Google Scholar] [CrossRef]
  17. Wang, Y.; Liu, J. Research on the Project Management of BIM Project from the Perspective of Enterprise Strategy; Atlantis Press: Amsterdam, The Netherlands, 2016; pp. 1915–1918. [Google Scholar] [CrossRef] [Green Version]
  18. Tserng, H.-P.; Ho, S.-P.; Jan, S.-H. Developing BIM-assisted as-built schedule management system for general contractors. J. Civ. Eng. Manag. 2014, 20, 47–58. [Google Scholar] [CrossRef] [Green Version]
  19. Li, Y.; Li, Q. The Application of BIM Technology in Budget Control of Port Construction Cost. J. Coast. Res. 2020, 103, 644–648. [Google Scholar] [CrossRef]
  20. Teo Ai Lin, E.; Ofori, G.; Tjandra, I.; Kim, H. Framework for productivity and safety enhancement system using BIM in Singapore. Eng. Constr. Archit. Manag. 2017, 24, 1350–1371. [Google Scholar] [CrossRef]
  21. Sepasgozar, S.M.E.; Costin, A.M.; Karimi, R.; Shirowzhan, S.; Abbasian, E.; Li, J. BIM and Digital Tools for State-of-the-Art Construction Cost Management. Buildings 2022, 12, 396. [Google Scholar] [CrossRef]
  22. Moreno, J.V.; Machete, R.; Falcão, A.P.; Gonçalves, A.B.; Bento, R. Dynamic Data Feeding into BIM for Facility Management: A Prototype Application to a University Building. Buildings 2022, 12, 645. [Google Scholar] [CrossRef]
  23. Benn, M.; Stoy, C. BIM for CREM: Exploring the Benefit of Building Information Modelling for Facility Management in Corporate Real Estate Management. Buildings 2022, 12, 400. [Google Scholar] [CrossRef]
  24. Thabet, W.; Lucas, J.; Srinivasan, S. Linking life cycle BIM data to a facility management system using Revit Dynamo. Organ. Technol. Manag. Constr. Int. J. 2022, 14, 2539–2558. [Google Scholar] [CrossRef]
  25. Shi, A.; Shirowzhan, S.; Sepasgozar, S.M.E.; Kaboli, A. 5D BIM Applications in Quantity Surveying: Dynamo and 3D Printing Technologies. In Smart Cities and Construction Technologies; Shirowzhan, S., Zhang, K., Eds.; IntechOpen: London, UK, 2020; ISBN 978-1-83880-199-1. [Google Scholar] [CrossRef]
  26. Harode, A.; Ensafi, M.; Thabet, W. Linking BIM to Power BI and HoloLens 2 to Support Facility Management: A Case Study Approach. Buildings 2022, 12, 852. [Google Scholar] [CrossRef]
  27. Jia, M.; Xu, Y.; He, P.; Zhao, L. Identifying critical factors that affect the application of information technology in construction management: A case study of China. Front. Eng. Manag. 2022, 9, 281–296. [Google Scholar] [CrossRef]
  28. Kendal, R.N. Can Cost Segregation be an Effective Marketing Tool for a General Contractor? J. Constr. Account. Tax. 2003, 13, 31. [Google Scholar]
  29. Mascarinas, D.M.A. Cost segregation and the role of the contractor. Constr. Account. Tax. 2005, 15, 13. [Google Scholar]
  30. Fountain, J.; Langar, S. Building Information Modeling (BIM) outsourcing among general contractors. Autom. Constr. 2018, 95, 107–117. [Google Scholar] [CrossRef]
  31. Ullah, K.; Lill, I.; Witt, E. An Overview of BIM Adoption in the Construction Industry: Benefits and Barriers. In 10th Nordic Conference on Construction Economics and Organization; Lill, I., Witt, E., Eds.; Emerald Reach Proceedings Series; Emerald Publishing Limited: Bingley, UK, 2019; Volume 2, pp. 297–303. ISBN 978-1-83867-051-1. [Google Scholar] [CrossRef]
  32. Song, S.; Zhang, C.; Marks, E. Effectiveness and Practicability Analysis of BIM Adoption in the AEC Industry. In Proceedings of the Computing in Civil Engineering 2021; American Society of Civil Engineers: Orlando, FL, USA, 2022; pp. 530–537. [Google Scholar]
  33. Deru, M. Energy Savings Modeling and Inspection Guidelines for Commercial Building Federal Tax Deductions, 2nd ed.; National Renewable Energy Lab. (NREL): Golden, CO, USA, 2007. [Google Scholar] [CrossRef] [Green Version]
  34. H.R. 5376–117th Congress (2021–2022). Inflation Reduction Act; 2022; pp. 131–136. Available online: </monospace>https://www.congress.gov/bill/117th-congress/house-bill/5376 (accessed on 15 May 2023).
  35. Reddy, E.R.; Kailashkumar, S.K. Design and Modelling of G+5 Commercial Building by Autodesk Revit Architecture. Int. J. Eng. Adv. Technol. 2019, 9, 4732–4736. [Google Scholar] [CrossRef]
  36. Robert, K.Y. Case Study Research: Design and Methods; SAGE Publications, Inc.: Thousand Oaks, CA, USA, 2013. [Google Scholar]
  37. He, P.; Bui, T.T.P.; Shahzad, W.; Wilkinson, S.; Domingo, N. Towards Effective Implementation of Carbon Reduction Strategies in Construction Procurement: A Case Study of New Zealand. Buildings 2022, 12, 1570. [Google Scholar] [CrossRef]
Figure 1. BIM-enabled cost segregation study workflow.
Buildings 13 01805 g001
Figure 2. Building Systems with separate UoP.
Buildings 13 01805 g002
Figure 3. Site Plan of the Bank Building.
Buildings 13 01805 g003
Figure 4. Floor plan of the bank building.
Buildings 13 01805 g004
Figure 5. BIM model of the building.
Buildings 13 01805 g005
Figure 6. Cost segregation with 5-year property class.
Buildings 13 01805 g006
Figure 7. Cost segregation with 7-year property class.
Buildings 13 01805 g007
Figure 8. Cost segregation with 15-year property class.
Buildings 13 01805 g008
Figure 9. Cost segregation with 39-year property class.
Buildings 13 01805 g009
Figure 10. Building cost depreciation each year.
Buildings 13 01805 g010
Figure 11. Comparison of Depreciation with Cost Segregation.
Buildings 13 01805 g011
Figure 12. Net Present Value (NPV) based on annual depreciation.
Buildings 13 01805 g012
Table 1. Database used to perform cost segregation in Revit.
Unit of PropertyDescriptionProperty Class/Asset Life
100Site Improvements15
110Paving & Surfacing15
200Curb/Sidewalks15
540Storm Sewer System15
544Site Fire Protection System39
550Site Gas Distribution System39
910Site Lighting15
1240Gate/Fences/Enclosures15
1350Fountain5
1360Flagpoles15
1380Identity Signs5
1430Landscaping/Irrigation15
1470Retaining Walls15
2010Substructure39
2040Equipment Support7
2150Superstructure/Building Enclosure39
3000Interior Construction39
3160Doors & Windows39
3210Sliding Service Windows5
3490Removable Wall Coverings5
3610Removable Wall Panels5
3695Vinyl Composite Tile5
3700Carpeting5
3870Cabinets/Counters/Millwork5
4040Int. Protective Specialties7
4060Signs/Directories/Graphics5
4120Bathroom Accessories/Equipment39
4160Fire Extinguishers/Cabinets5
4240Equipment5
4510Office Furniture & Fixtures7
4515Appliances5
4560Window Treatments5
5000Domestic Plumbing System39
5020Service Equipment Plumbing7
5030Break Room Equipment Plumbing5
5050Kitchen Equipment Plumbing5
5440Sprinkler System39
6000Domestic HVAC System39
6020Service Equipment System7
6050Kitchen Equipment Exhaust5
6540Computer Equipment A/C5
7000Domestic Electrical System39
7020Service Equipment Electrical7
7030Break Room Equip Electrical5
7040Emergency Generator5
7050Kitchen Equipment Electrical5
7260Domestic Lighting System39
7290Accent Light Fixtures5
7330Emergency Battery Pack Lighting7
7350Dock Lighting/Electrical5
7291Accent Light Fixtures - B5
7390Task Lighting5
7540Computer Equipment Electrical5
7560Office Equipment Electrical7
7600Sign Electrical5
7670Communication System7
7710Audio/Visual System7
7760Fire Alarm System39
7780Security & Detection System7
7830Television System5
Table 2. Capitalized cost summary of the project.
Task PerformedDirect Contract (USD)Indirect Contract (USD)Final Contract (USD)
Site Work118,18317,801135,984
Concrete165,361---165,361
Masonry39,452---39,452
Metals69,198---69,198
Wood & Plastics56,887---56,887
Thermal & Moisture94,469---94,469
Doors & Windows71,35664872,004
Finishes163,568---163,568
Specialties7009---7009
Appliance2373---2373
Plumbing51,986---51,986
Electrical121,93840,646162,584
HVAC90,181---90,181
Change Orders(13,826)---(13,826)
Additional Costs197,349---197,349
Direct Cost Subtotal:1,235,48459,0951,294,579
Project Indirect Cost Subtotal: 205,015
Total Project Costs 1,499,594
Table 3. Summary of indirect project cost.
Task PerformedIndirect Cost (USD)
Contract CostProject Cost
Supervision & Project Management 33,510
Temporary Controls 9323
Dumpster 7280
Testing Lab 5500
Surveying 3235
Cleaning 2854
Insurance 11,670
Permit 2966
Performance & Payment Bonds 15,350
Demolition 2104
SWPPP 24651---
Pest Control 755
Architect 84,178
Legal Fees 14,486
Geotechnical Survey 3954
Civil Engineering13,150---
Title Insurance 7581
Survey 271
Conduit & Wire40,646---
Branch Re-Key648---
Total Indirect Costs59,095205,017
Table 4. Cost Segregation Summary.
Property TypeAmount (USD)
5-Year Personal Property260,686
7-Year Personal Property2164
15-Year Land Improvements263,180
39-Year Real Property973,562
Total Project Cost Reviewed$1,499,592
Disclaimer/Publisher’s Note: The statements, opinions and data contained in all publications are solely those of the individual author(s) and contributor(s) and not of MDPI and/or the editor(s). MDPI and/or the editor(s) disclaim responsibility for any injury to people or property resulting from any ideas, methods, instructions or products referred to in the content.

