1. Introduction
To provide a clear representation of a given design plan, comprehensive drawings of the walls, doors, windows, and furniture are required. Designers tend to manually depict their furnishing work using Computer-Aided Design (CAD) software based on their knowledge and experience and in line with their clients’ requests [
1]. Optimally integrating furniture items within floor plans plays a pivotal role in various stages of the design process. Not only do furniture arrangements serve to unveil and communicate the quality of a given space, but they also accentuate the space’s functionality and performance. As such, when incorporating furniture items into floor plans, interior designers meticulously consider a wide array of factors in order to create a space that is both aesthetically pleasing and functional.
To assist with this process, architectural automation has been rapidly improving via the utilization of techniques such as
parametric design and
generative design within CAD software. The recent emergence of Machine-Learning (ML) and Artificial Intelligence (AI) techniques has introduced processes that impact a wide range of fields [
2]. As these advances become more widely incorporated in architectural designs, it is critical to establish effective assessment methods for measuring their impact on design quality. In turn, it is essential to investigate how these technologies might be utilized to improve design processes while examining their possible challenges and limitations.
The primary aim of this study was to develop an ML-based method for conducting automated room furnishing with practical applications that can be implemented throughout the design process. The secondary aim of this research was to develop comprehensive evaluation and analysis metrics as a means for effectively assessing the performance of the proposed method. The use of image generative models, notably image-to-image ML models such as conditional generative adversarial neural networks (CGANs), which assist the translation and transference of visual representations from one domain to another, may be instrumental in achieving the research goals. Such models are relevant to the field of interior design, as they can learn to translate from the domain of “unfurnished” designs to that of “furnished” ones. In this study, three CGAN models (pix2pix, BicycleGAN, and SPADE) were trained to generate interior design layouts from unfurnished plans. The models were trained using 1290 image pairs of furnished and unfurnished bathrooms. The models were then tested using 258 images with a focus on the generation of three primary and functional objects in this room: sink, toilet, and shower.
This paper addresses the following five aspects that, when combined, describe a proposed workflow and demonstrate its effectiveness: (1) a method for creating room datasets, including the specifically generated bathroom dataset; (2) the ML model training processes; (3) post-processing methods for improving the generated results; (4) a set of evaluation metrics; (5) a comparison of the results, generated via the different models. Ultimately, the findings of this study describe effective ML training models and evaluation methods that can be used to improve the overall quality of architectural and interior space planning.
2. Background and Prior Work
2.1. Machine Learning in Architectural Design Processes
The rapidly expanding field of ML is frequently employed in applications such as online browsing, information filtering, and credit card fraud detection. One key strength of ML models is their ability to learn complex rules without being explicitly programmed, thereby achieving human-like performance [
2]. Most modern ML models are based on artificial neural networks, which require large training datasets in order to achieve good results [
3].
In architecture, ML techniques are used for a range of tasks. For example, in legacy 2D floor plan analyses, vision-based detection models are used to identify architectural objects, such as windows, doors, and furniture in the design [
4]. In similar drawings, segmentation models are used for identifying room boundaries and tracing walls [
5,
6]. Optical Character Recognition (OCR) models help identify function types by reading texts on scanned floor plan images [
7]. Owners and real estate agents could use such methods to reduce the need to create 3D models, which require greater time and effort. Additionally, semantic and graph-based analyses of Building Information Models (BIM) offer the ability to recognize a room type based on the objects within its boundaries and on the space features [
8,
9].
Chaillou [
10] demonstrates the potential of CGAN-type ML models for generating space and furniture layouts of the apartment’s footprint. DPrix et al. [
11] use similar models for generating new exterior designs based on an existing archive of images in their architecture firm. State-of-the-art advances in image synthesis models, such as Midjourney (Midjourney, n.d.) [
12], Stable Diffusion [
13], and DALL-E2 [
14], have also been used to generate architectural images. However, these methods tend to rely on text prompts rather than on image input and are beyond the scope of this paper.
The novel method presented in this research study employs the CGAN-based generation method, as proposed by [
10], who provided the foundation of this line of research and demonstrated its feasibility. The researchers also presented several ways in which CGANs can be used in interior design, such as room allocation, function assignment, and furnishing. This current study focuses on the interior furnishing of a single functional room, i.e., the bathroom, and provides a dataset and comprehensive workflow that outlines the necessary steps for achieving the research aims. Finally, a set of developed evaluation criteria is presented to enable the measuring of the performance of the suggested method.
2.2. Interior Residential Design Furnishing
Throughout history, scientists and researchers have studied human body movements, with behaviors and patterns being collected as a basis for designing spaces that enhance levels of human comfort [
15]. Indeed, object scales and sizes are often defined when positioned next to a human body [
16]. Although definitions of terms such as “comfortable” or “qualified” spaces may be subjective, unified guidelines and standards are usually followed when designing spaces for humans.
To reduce the manual work entailed in creating and designing interior spaces, studies suggest employing interactive tools for positioning objects of furniture while responding to the users’ real-time selection of furniture pieces. Doing so could provide users with access to an editable library of furniture pieces [
17]. Geman and Geman [
18] address the concept of
simulated annealing, which can be used to create indoor scenes for optimizing ergonomic factors. In a study conducted by [
19], the researchers utilize the hierarchy between furniture objects to enable the generation of indoor furniture arrangements. Generating furniture layouts has also been achieved via geometrical analyses of objects, using algorithmic hyper-relations between and within groups of items to assign the positioning and orientation of each group. For example, the relationship between a group of objects, comprising a sofa, table, and television, could change based on the layout of the room [
20]. Alternatively, Kim and Lee [
21] generated furniture layouts based on a design-style perspective, whereby different types of rooms were created according to the desired style (casual, modern, classic, or natural). Their model’s dataset comprised perspective images of interior spaces in which each architectural style had distinct features, such as materials, forms, patterns, and colors.
2.3. Interior Residential Design Applications
Several online websites offer a range of services relating to interior space planning and, as such, could be referred to as precedents for the method that is suggested in this study. PlanFinder, for instance, is a software plugin for CAD and BIM software that enables designers to furnish spaces with greater ease and speed simply by entering a door point and clicking on the
furnish button [
22]. Finch 3D, an additional online service, leverages AI and graph-based algorithms to optimize building designs and even provides performance feedback, error detection, and optimal solution identification [
23]. Finally, the web-based Rayon Design service offers an intuitive online interface that allows users to make changes to their floor plans, delete walls, and add furniture from a suggested set of furniture objects. Users must, however, have a drawn floor plan prior to uploading the design [
24].
2.4. Conditional Generative Adversarial Neural Networks Models
Deep neural networks and other recent ML advancements have significantly expanded the scope and accuracy of generative modeling across domains to reflect the diverse and complex nature of real-world data. These highly varied models exhibit a wide range of capabilities and characteristics that depend on the applied algorithms and parameters. These include Generative Adversarial Networks (GANs), which offer a range of solutions based on their ability to learn to generate novel data from a given set of examples [
25]. Its architecture consists of two neural networks that are trained in a competing manner: the
generator strives to create fake yet realistic data samples, while the
discriminator attempts to distinguish between the real and fake samples. Moreover, the
generator continuously improves its ability to generate increasingly realistic data through this adversarial process, while the
discriminator continuously improves its ability to detect real versus fake data [
26]. GANs have been used in a wide range of applications, including image generation [
27], text-to-image synthesis [
28], and video synthesis [
29]. Conditional GANs (CGANs) improve GAN models by consuming a given condition as input, such as the category or class label desired for generation. The CGAN generator is trained to generate images according to the condition injected into it. The CGAN discriminator is trained not only to distinguish between real and fake data but also to consider added conditioning information. CGANs have been found to be useful in image-to-image translation tasks, where they translate an input image from one domain into a corresponding output image from a different domain; they do so by maintaining some elements of the original image as the basis of the newly generated one. This process strives to learn the mapping between input and output pictures so that the generated output image resembles the desired target image as precisely as possible [
30].
The CGAN family includes many different models. For example, based on label mappings, the pix2pix model learns to map between pairs of input–output images and then produces a single synthesized image. This model involves training a generator network based on the input image using two losses. The first is a regression loss that helps the generator produce an output image that is similar to a paired ground-truth image. The second is a learned discriminator loss that encourages the generator to produce realistic images [
31]. This model has been tested on various architectural datasets, such as labels-to-street and labels-to-facades scenes [
30]. An additional CGAN model is SPADE, which is based on a more advanced mechanism for turning a semantic label map into a photorealistic image. The model converts the labels and combines them with the style to generate the desired realistic content [
32]. Finally, the BicycleGAN model offers a multimodal image-to-image translation, generating multiple potential images for the same input. This model proposes a latent mapping vector between the generator and the discriminator, encouraging a bijection between the output and the latent space, thereby leading to less ambiguous or diverse results [
31].
2.5. CGAN Models in Architecture
Huang and Zheng [
33] utilized a variant of pix2pix to segment room boundaries and detect doors and windows. In an additional study, Yang et al. [
34] applied certain modifications to the standard CGAN model to create functional floor divisions. Next, they deployed a fully connected, three-tier neural network for each type of functional area to place each piece of furniture within each space. Yet, the researchers do not measure or quantify the quality of such placings. Chaillou [
10] introduced the capabilities of CGAN models in generating interior design, floor plan layout, and urban footprint. His groundbreaking work demonstrates the potential of ML to generate architectural designs by filling in “empty” black-and-white architectural drawings. Chaillou [
10] proposes using this framework to address the style and organization of different scale floor plans. Yet, the researcher does not provide comprehensive descriptions or details of the employed training processes, GAN models, or the employed settings. In this study, CGAN models such as pix2pix, SPADE, and BicycleGAN were trained to generate furnishing layouts in empty floor plans using the room data that were created in this study. This work presents the training process of the models together with the generated results and proposes various metrics for quantifying the quality of the generated results.
2.6. Available Architectural Datasets
Most Internet databases provide photographed perspective images of rooms that can be gathered by anyone, anywhere, via their mobile devices. Examples of such datasets include the 3D-FRONT Benchmark of synthetic indoor scenes and a large number of rooms [
35]. Kaggle, an online community of data scientists and ML professionals, exposes images of homes that are taken on mobile telephones and that appear on the Renthop website, which helps people find home rentals (RentHop|Kaggle) [
36,
37]. The walls, doors, windows, and room boundaries in the dataset are presented via three online sources: (1) Rent3D (R3D) [
36], which displays 222 images of round-shaped layouts, as well as straight ones with nonuniform wall thickness; (2) Raster-to-Vector (R2V), which includes 815 images of rectangular shapes with uniform wall thickness [
6,
38]; (3) CVC-FP, which includes 500 images in two versions, i.e., original floor plans in black-and-white and color-mapped images [
39,
40]. The international Ikea furniture chain has an online furniture dataset that uses furniture objects from their product lists and 298 room scene photos to convey the context in which these objects can be used or placed [
41]. Each of these available public datasets was created for a specific research topic and does not meet the requirements of this research since this case study requires a flexible dataset, one that includes top-view room layouts that can be modified to include or exclude furnishings as a means for training the models to achieve the defined aims. A customized database, therefore, was created, as well as a tool that can generate various types of architectural datasets.
2.7. Machine Learning Dataset Formats and Available Annotation Tools
Comma-separated values (CSV) are a popular format for conducting text-data loading; a text can contain numbers or strings organized in a tabular format [
42]. JavaScript Object Notation (JSON) is another well-known format that is easy to read for humans and can easily be parsed via machines. This format is interchangeable between several computer languages and may hold a variety of data [
43]. The Common Objects in Context (COCO) format is a specific JavaScript Object Notation (JSON) structure format. COCO JSON files are commonly used for object detection and segmentation purposes, with files being able to store entire data, and with translators into numerous formats [
44]. Some online image annotation platforms provide segmentation polygons and bounding box detection, with a reference label to imported images. One example of such a platform is the CVAT website [
45]. Image labeling necessitates a significant amount of time and resources since it is performed manually via annotators. As such, online dataset annotation platforms may hinder the efficiency with which custom data is created. Designers do not typically use these online platforms in their work, and, to the best of the authors’ knowledge, no online tagging tool exists that is compatible with architectural CAD programs. Thus, those who best understand and have the most to gain from ML design-automation methods, i.e., designers, are not included in the development processes. To enable multiple types of architectural datasets to be easily tagged and processed in commonly used CAD tools, this paper presents a relevant and applicable method and tool for doing so.
2.8. Evaluation Metrics for CGAN Models
2.8.1. GANs Evaluation Metrics
When dealing with image-to-image models, the following two evaluation metrics are commonly used to measure similarities and differences between two sets of images and to evaluate the quality of the generated images in CGANs models: Fréchet Inception Distance (FID) and Kernel Inception Distance (KID) [
46].
FID is a metric for measuring the distance between two multivariate Gaussian distributions, which are calculated from the real and generated image features that are extracted using a pre-trained Inception-v3 network. The FID score is calculated by first computing the mean and covariance of the feature representations for real and generated images discretely. Next, the distance between the two sets of images is calculated based on the statistics of their feature representations in the pre-trained neural network. Lower FID scores mean smaller distances, indicating higher similarities between the real and generated image distributions. However, FID requires a large dataset and can be overly sensitive to the choice of the pre-trained network used to extract the image features. As such, it may fail to capture certain aspects of image quality, such as diversity or coherence [
47,
48]. KID is also based on feature representations of the images extracted using a pre-trained Inception-v3 network, a statistical method that is used to measure the similarity between two sets of data, such as real and generated images. Both FID and KID measure distances between the distributions of deep features of real and fake images. They differ in how they measure these differences. However, KID can provide accurate results with less data since its predicted value is independent of the sample size [
46,
49].
2.8.2. Object Detection Metrics
Precision, recall, and intersection over union (IOU) metrics are commonly used for evaluating computer vision tasks, such as object detection, tracking, and segmentation [
50,
51]. These metrics compare the generated image against its respective ground truth.
Precision is the metric that measures the proportion of true positive predictions out of the total number of predictions and can be seen as a measure of quality.
Recall, on the other hand, is the metric that measures the proportion of true positive results out of the total number of actual positive instances and can be seen as a measure of quantity [
50]. Finally, the
IOU calculates the intersection of the predicted and ground-truth bounding boxes divided by the union of the two boxes.
CGAN models are expected to generate new and optimally synthesized images while considering the overall features of the dataset. Although these three detection metrics cannot be used to compare the generated images to overall ground-truth ones, it is important to find an alternative that will enable the evaluation of each generated image against its respective ground truth to evaluate similarities and diversities of the output. The Results section of this paper describes how each evaluation metric was used in assessing the generated results and explains how they provide insight into design quality.
3. Methods
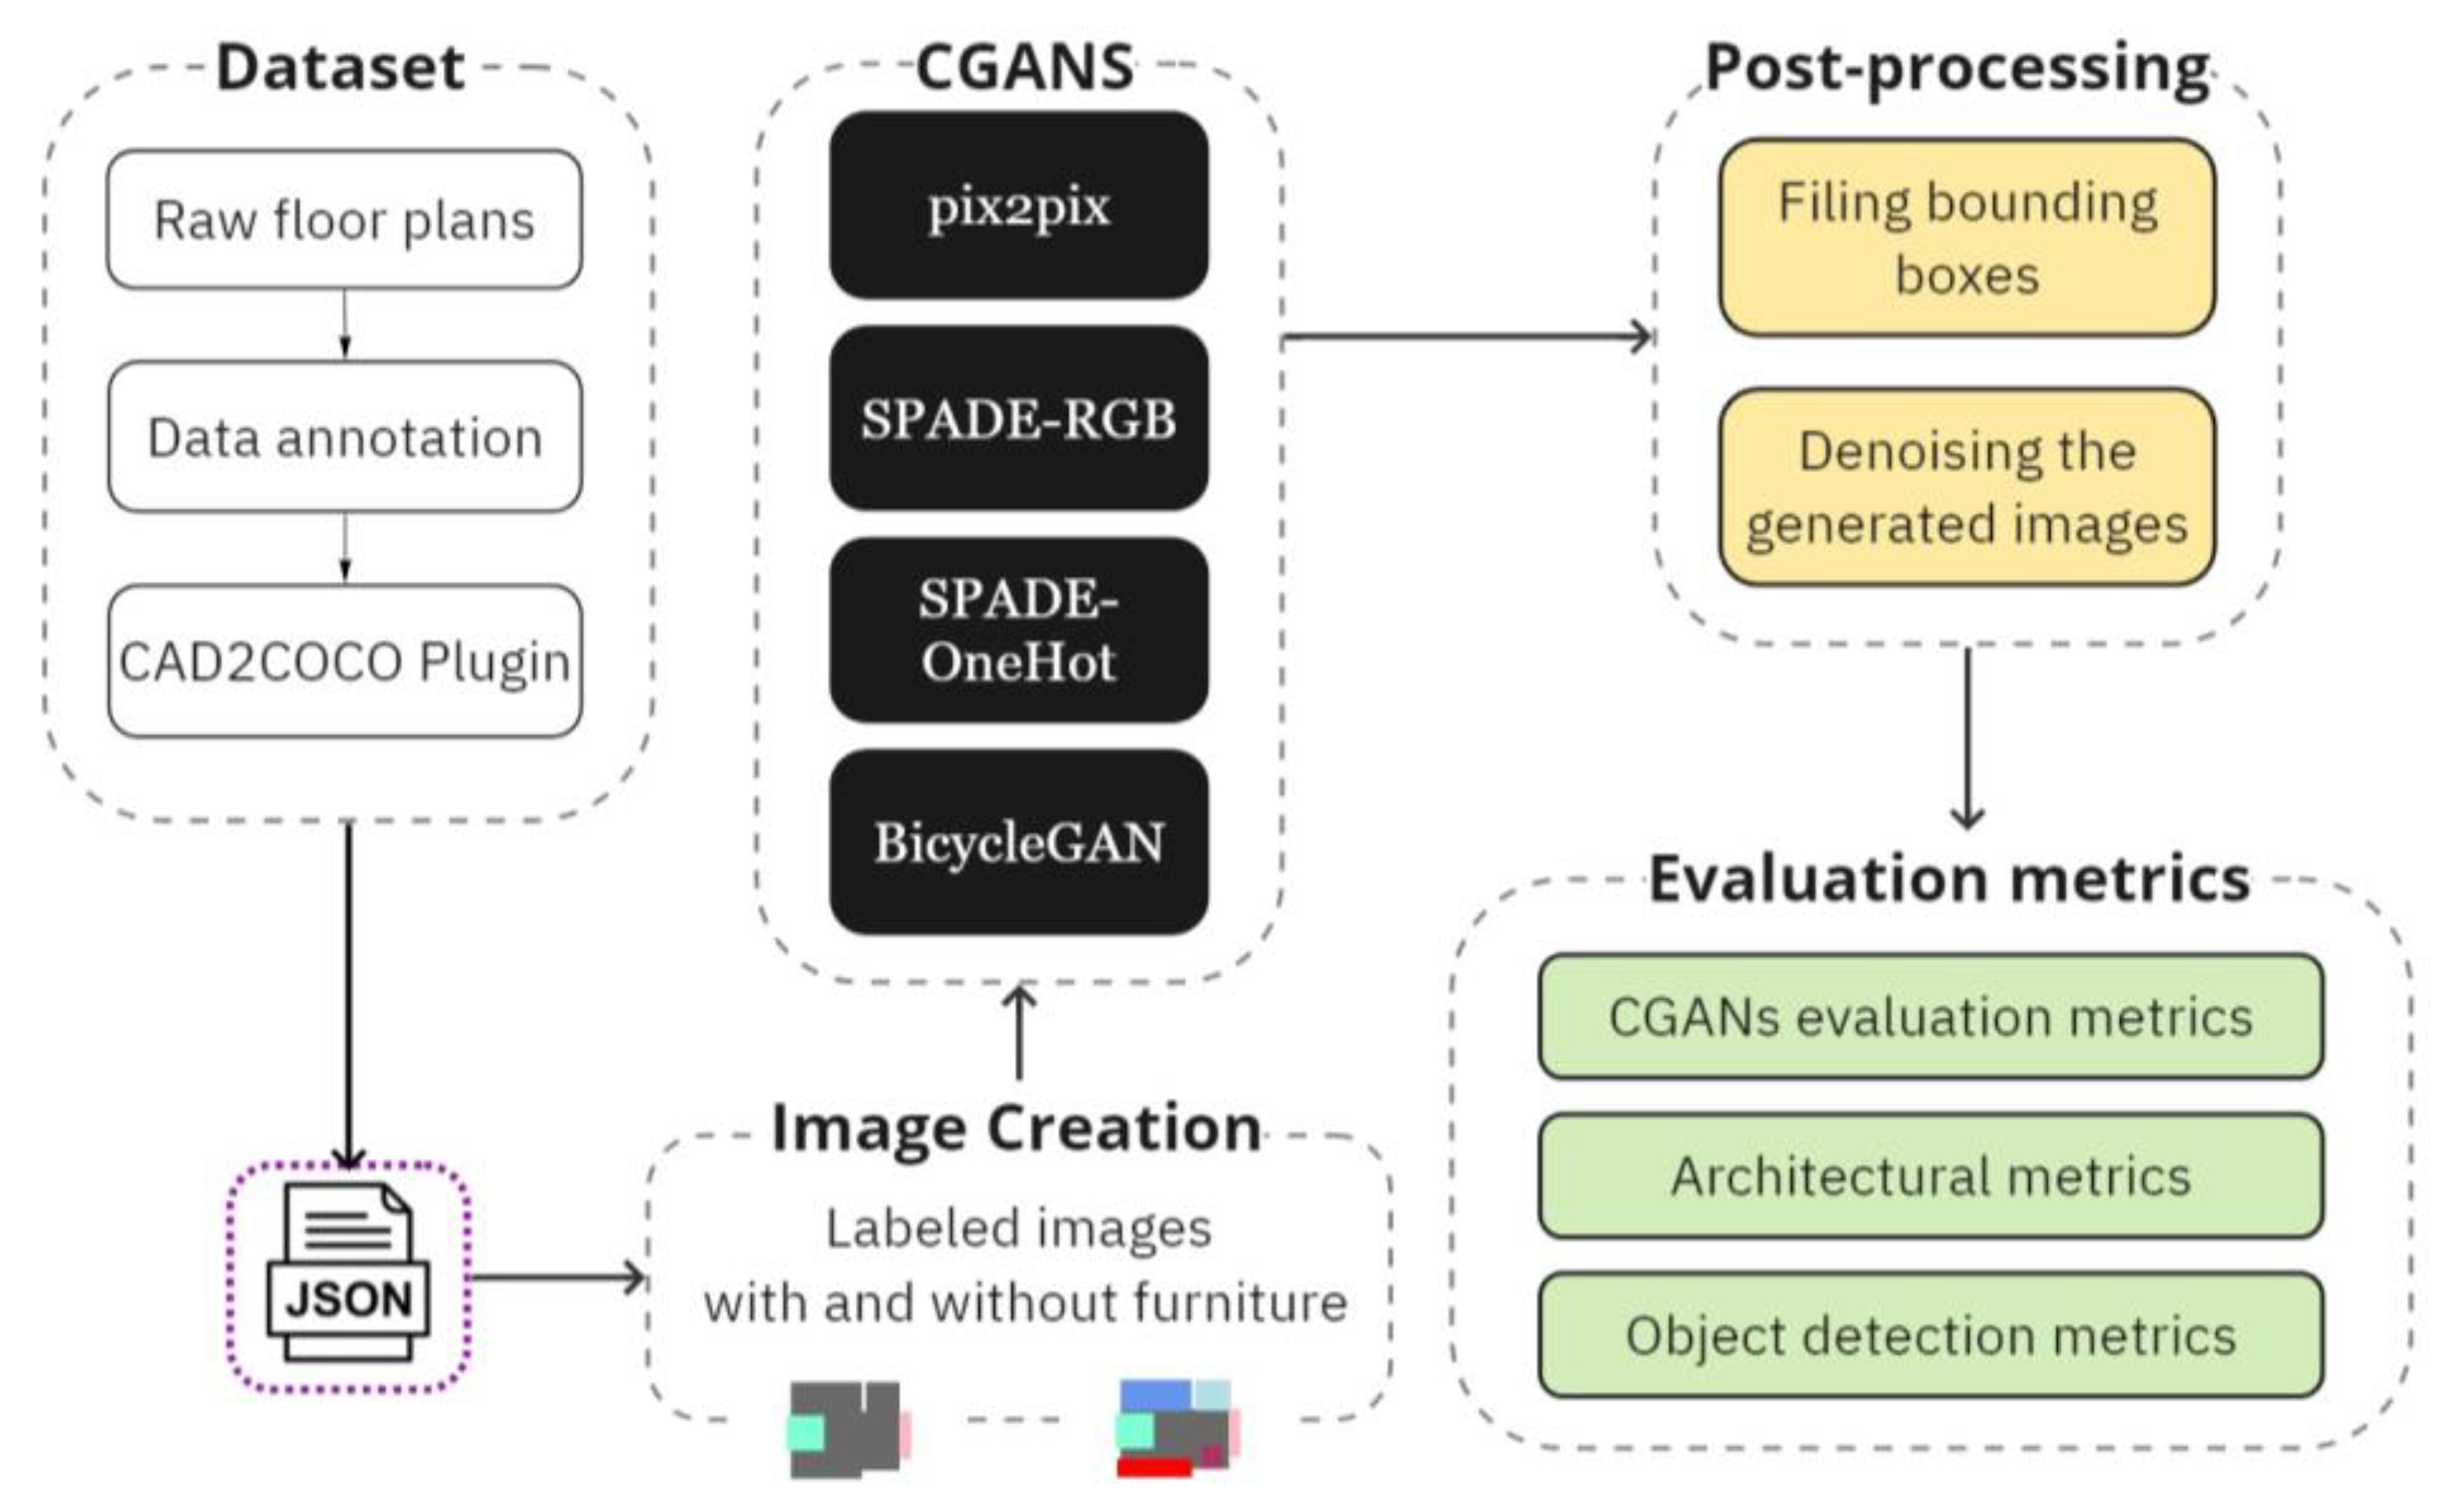
The primary research aim of this study was to develop an ML-based method for automating the interior space planning process. The secondary aim was to develop methods for effectively assessing the performance of the design method. To accomplish this, this study developed a workflow comprising the following stages, as seen in
Figure 1: (1) building the dataset, including annotating floor plans and creating color field images for each room; (2) training the CGANs with specific parameters and generating images; (3) developing a post-processing method to improve the generated results; (4) evaluating the generated images using various metrics. This approach allowed us to train and evaluate the effectiveness of CGANs in the floor plan design.
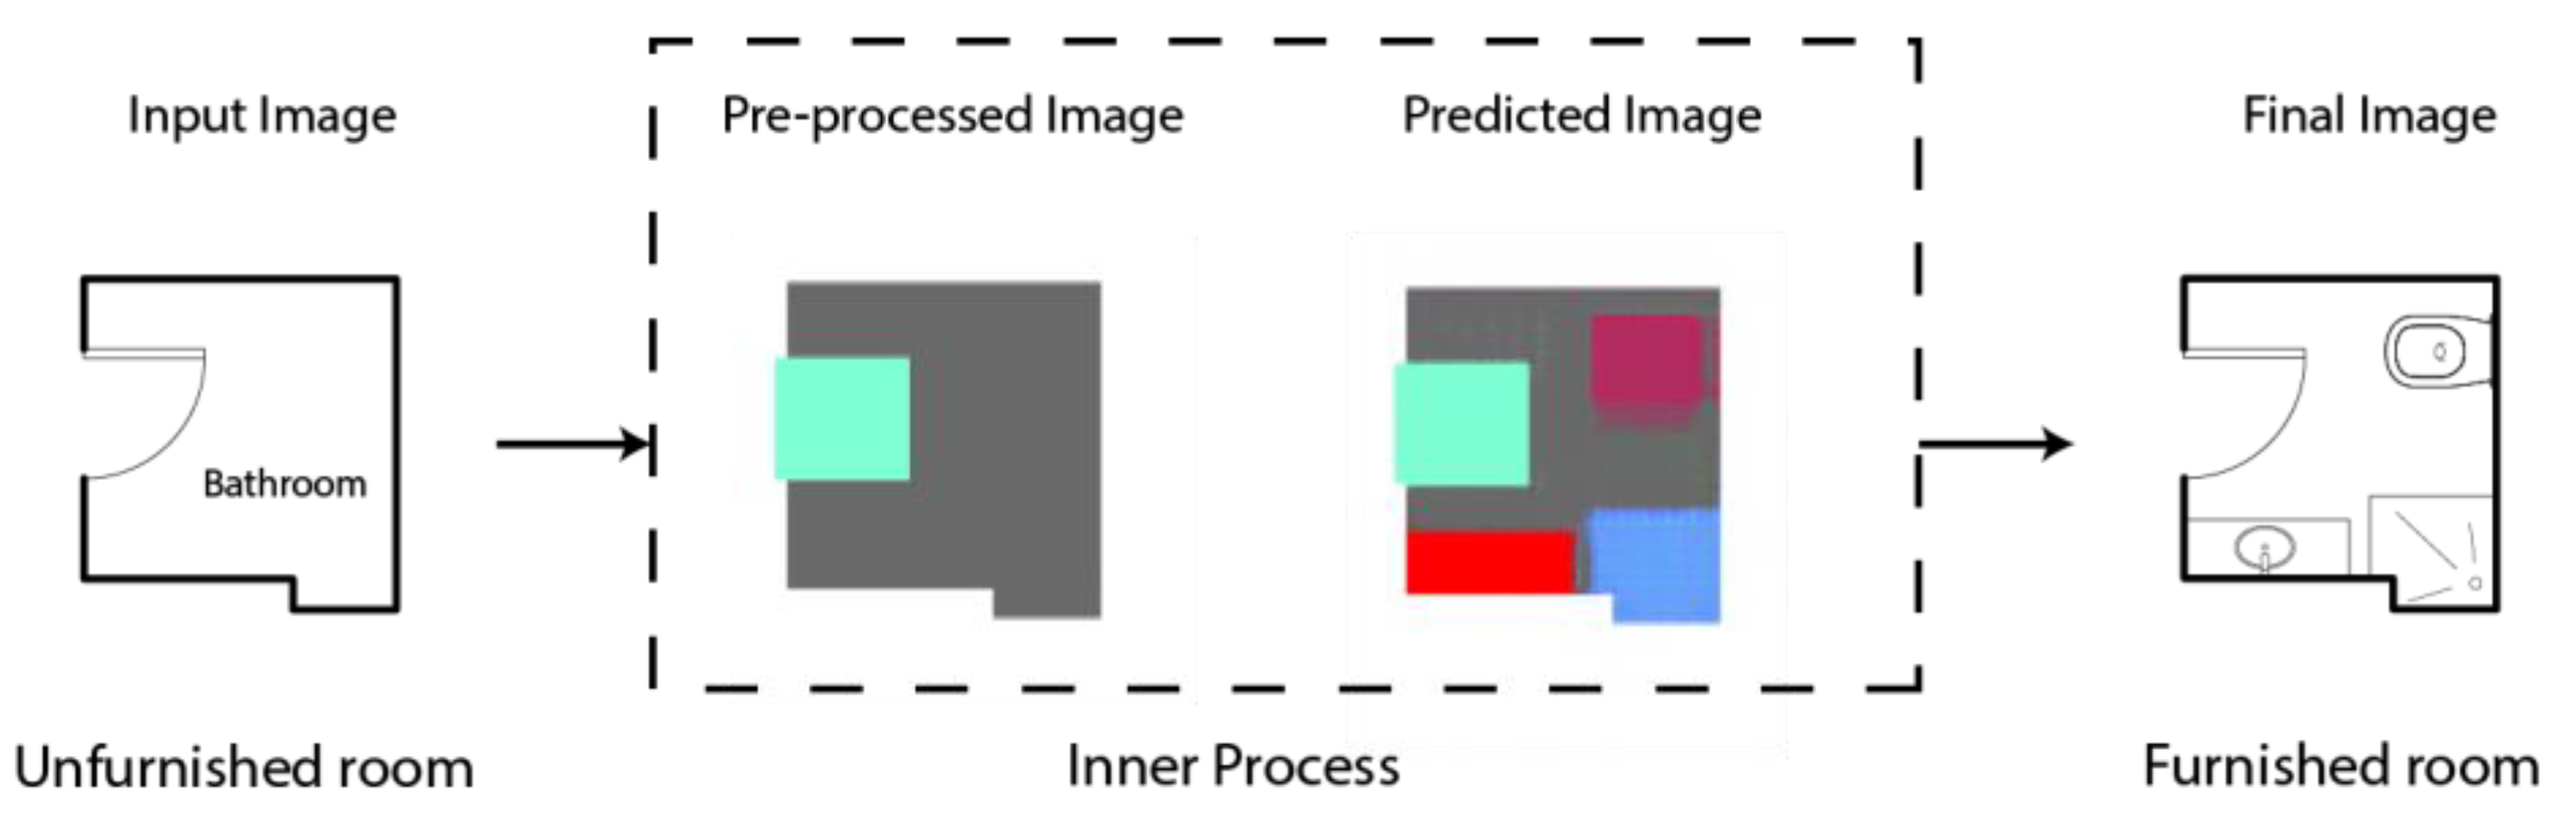
As seen in
Figure 2, the main method connects the empty room (with a door and label) and the model’s results. In this model, the output transitions through the final post-processing step to emphasize the placement of furniture objects in the room; next, the designers can receive the output with an actual drawing. (At present, the process of converting colors into their corresponding objects must be conducted manually.)
3.1. “CAD2COCO” Pipeline
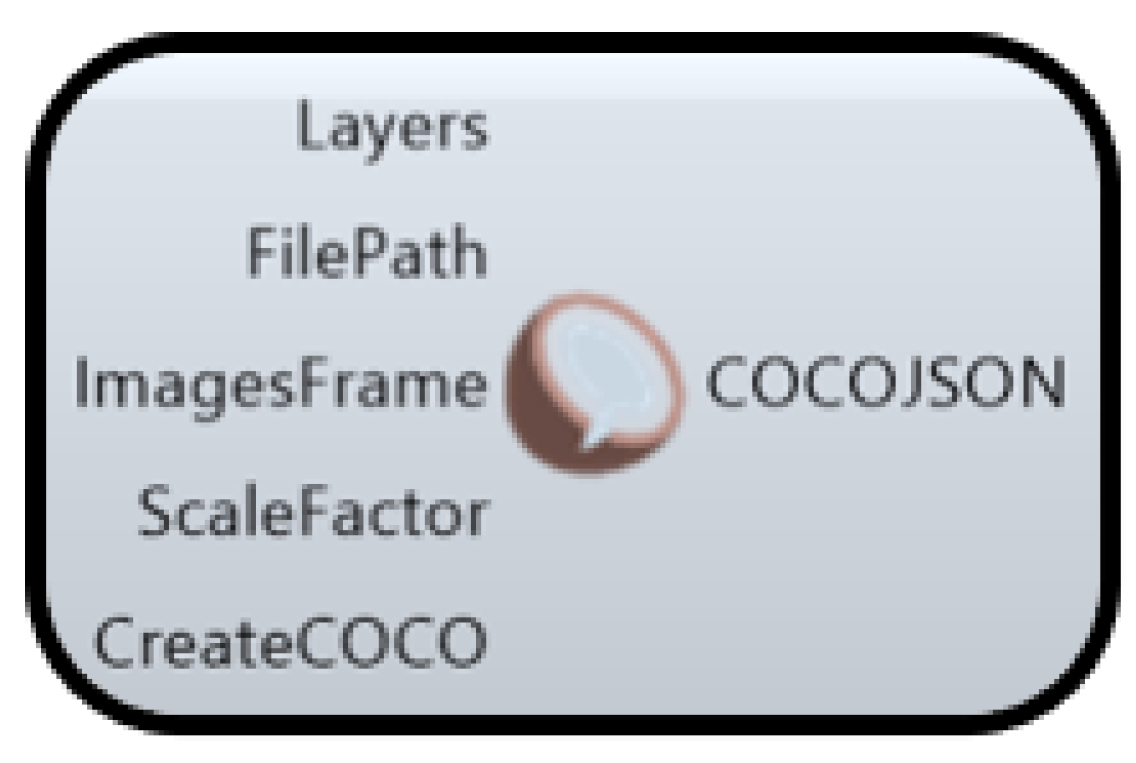
The developed annotation method was coded into CAD2COCO, an upcoming tool for Rhino and Grasshopper users, which will be accessible as a Grasshopper plugin. The plugin’s aim is to allow designers to work in their typical environment while collecting their annotated data in a well-known ML format: COCO JSON (as explained in
Section 2.7). The tool provides one component with the following five
input parameters: Layers, ImageFrame, FilePath, ScaleFactor, and CreateCOCO. Additionally, it provides the
output as a COCO JSON file, as depicted in
Figure 3. It is through this pipeline that the published bathroom dataset for this study was created.
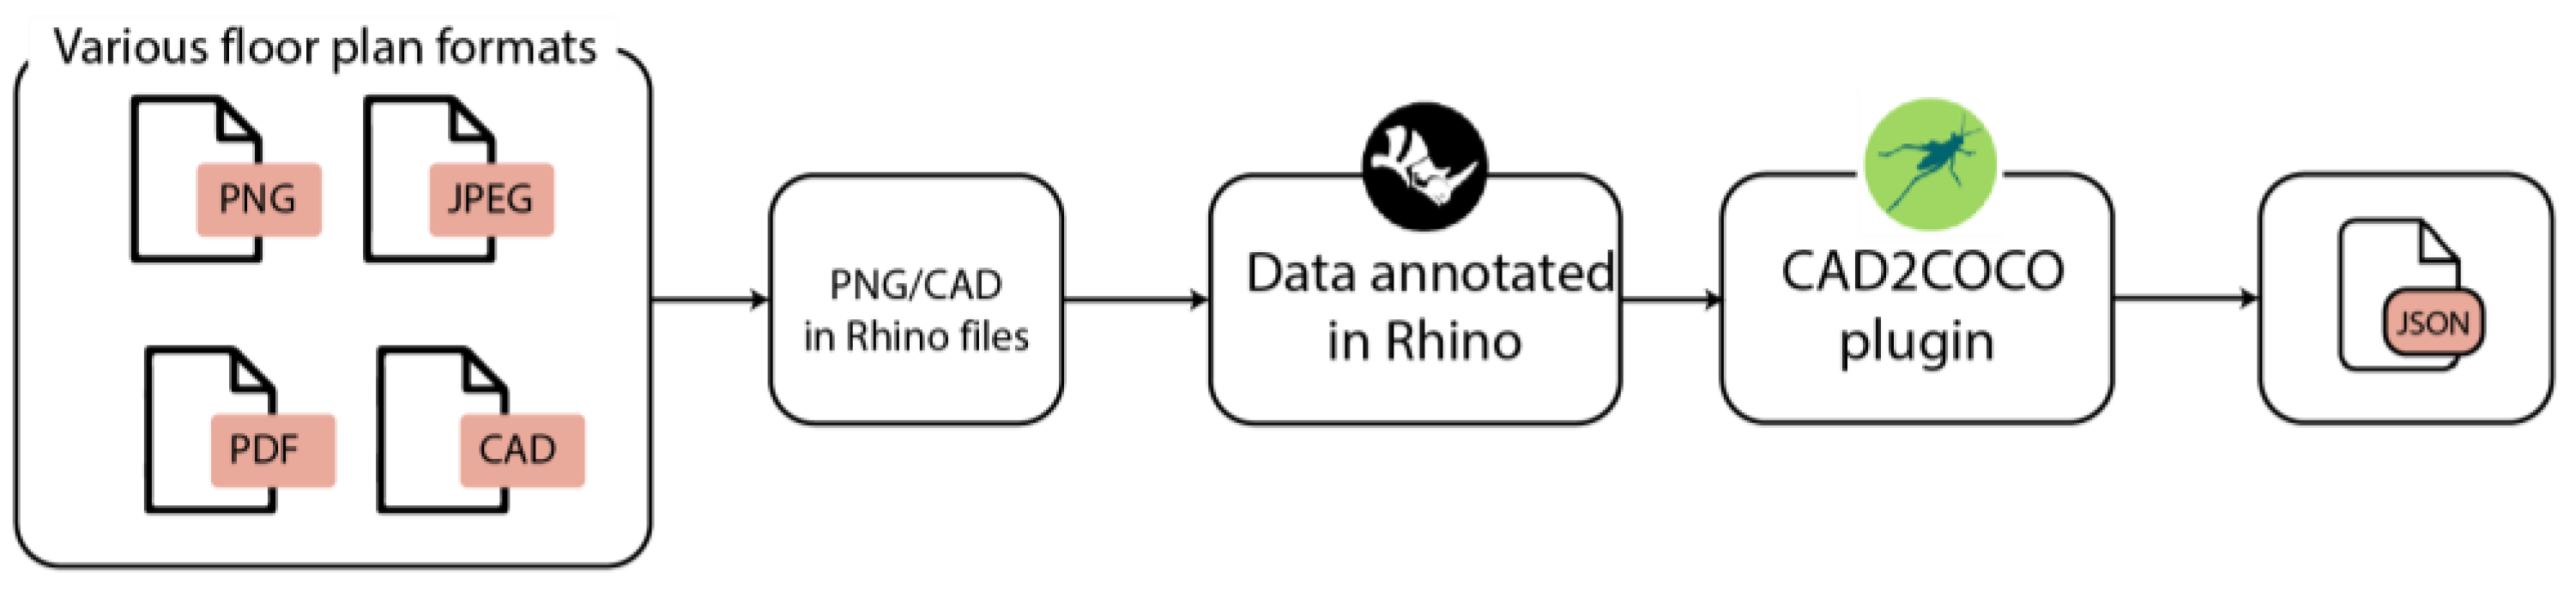
Designers can use the suggested method and tool to build bespoke ML datasets from readily available designs. Native CAD, PDF, JPEG, or PNG files can all be directly imported into Rhino for annotation. The advantages of using a CAD environment are multiple, including the ease of learning for designers; the capacity for handling large-scale architectural drawings; the ability to correctly manipulate scales; and the utilization of CAD tools like snaps, arrays, and guides within the tagging workflow. Using this Grasshopper tool, users may produce COCO JSON files directly from the Rhino file, as shown in
Figure 4.
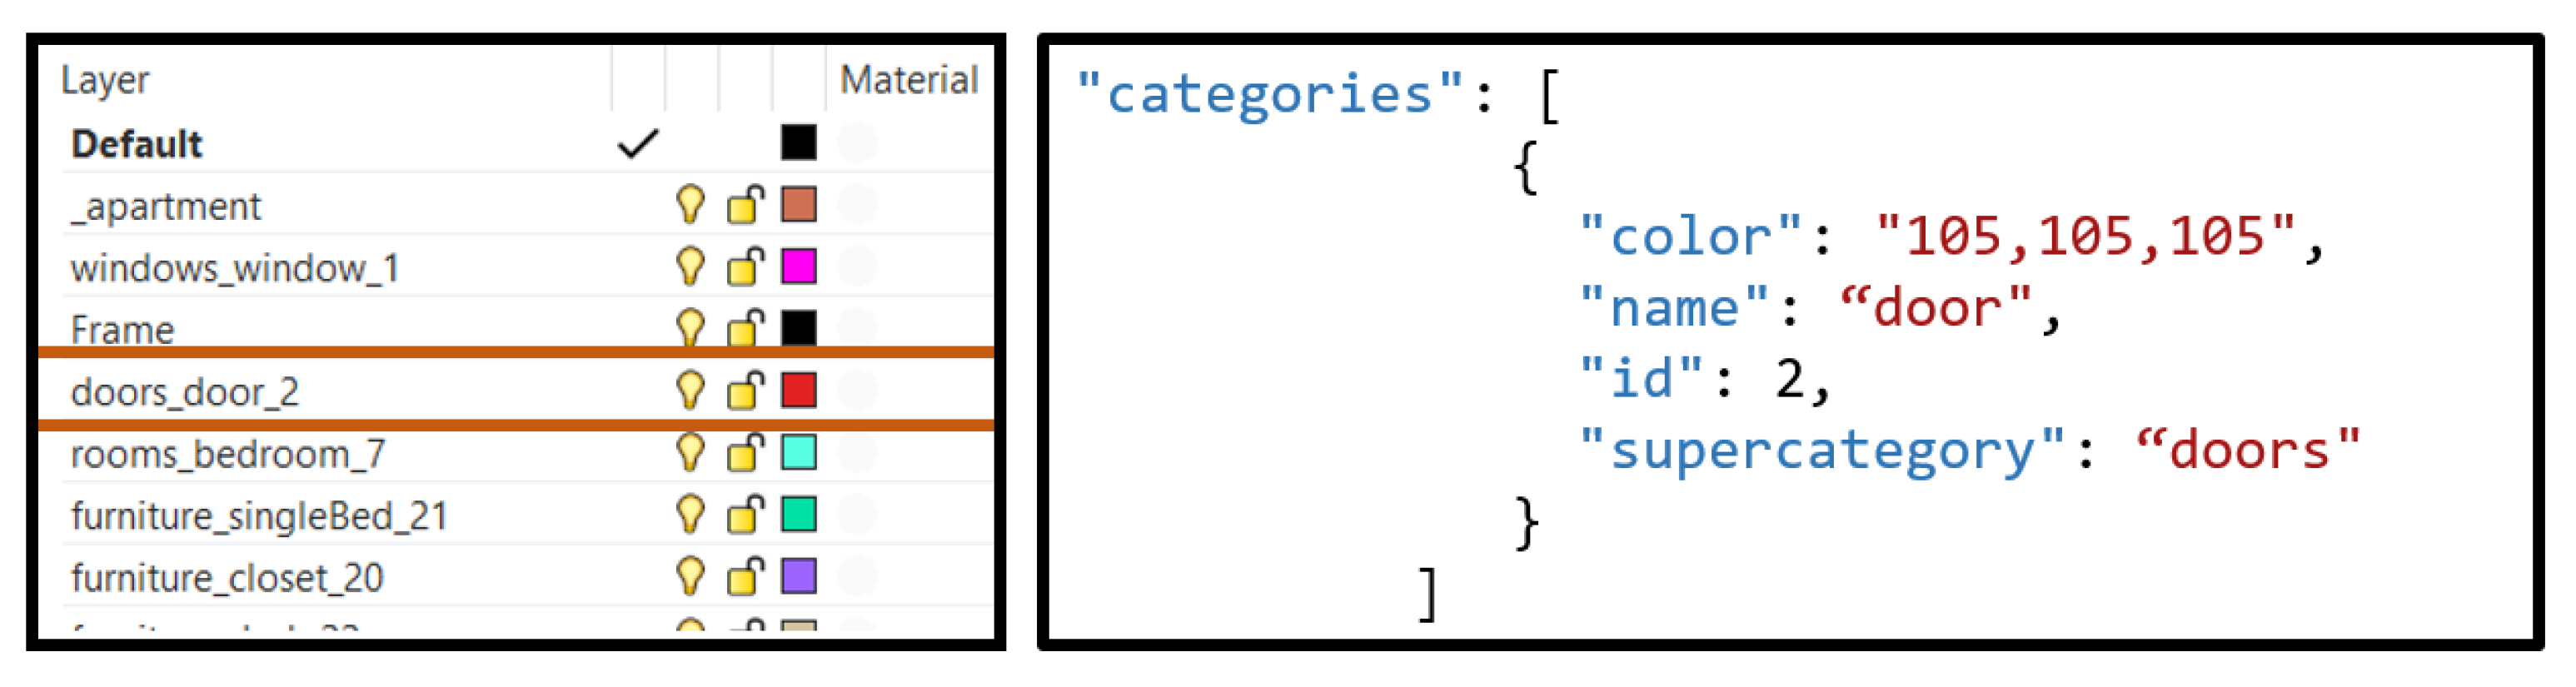
The “categories” section in the COCO JSON format comprises “color”, “name”, “id”, and “supercategory”; the developed workflow utilizes Rhino layers to store information for each annotated category. The following are the plugin input parameters:
“Layers”. This parameter accepts a list of layer names and fills the categories section with it. Using the name and color of each layer minimizes the number of input parameters; hence, the layer’s name must follow the stated naming syntax, “superCategory_category_categoryId”.
Figure 5 presents an example of a door annotation.
The suggested approach makes it easier for designers to stay organized when labeling the custom data. The plugin contains an error-handling mechanism that notifies if there is duplicated info, wrong format, or a nonexistent layer. COCO JSON files include the metadata of all images, the dataset creator needs to determine the size of the image frame.
“imageFrame”. This parameter enables designers to insert the relevant frames as a list of curves. The plugin workflow aligns the frames and their internal annotations, allowing the annotator to position the drawing freely, anywhere in the Rhino program. The COCO JSON format maps the annotation point to the image frame’s XY dimensions.
“ScaleFactor”. This parameter enables users to define the desired scale for the dataset.
“filePath”. This parameter accepts a text file path, presenting where the user wants to save the exported COCOJSON file.
“CreateCOCO”. Clicking on this button enables users to receive all tagged data organized in a COCO JSON file, all saved in the file path that they entered.
Figure 5.
Layers in Rhino used to fill categories of detected objects.
Figure 5.
Layers in Rhino used to fill categories of detected objects.
The developed tool allows for the creation of data for various design disciplines, such as urban design, industrial design, and interior design. Data may be produced using the plugin instructions, providing the necessary naming syntax is preserved.
3.2. Room Dataset Annotation
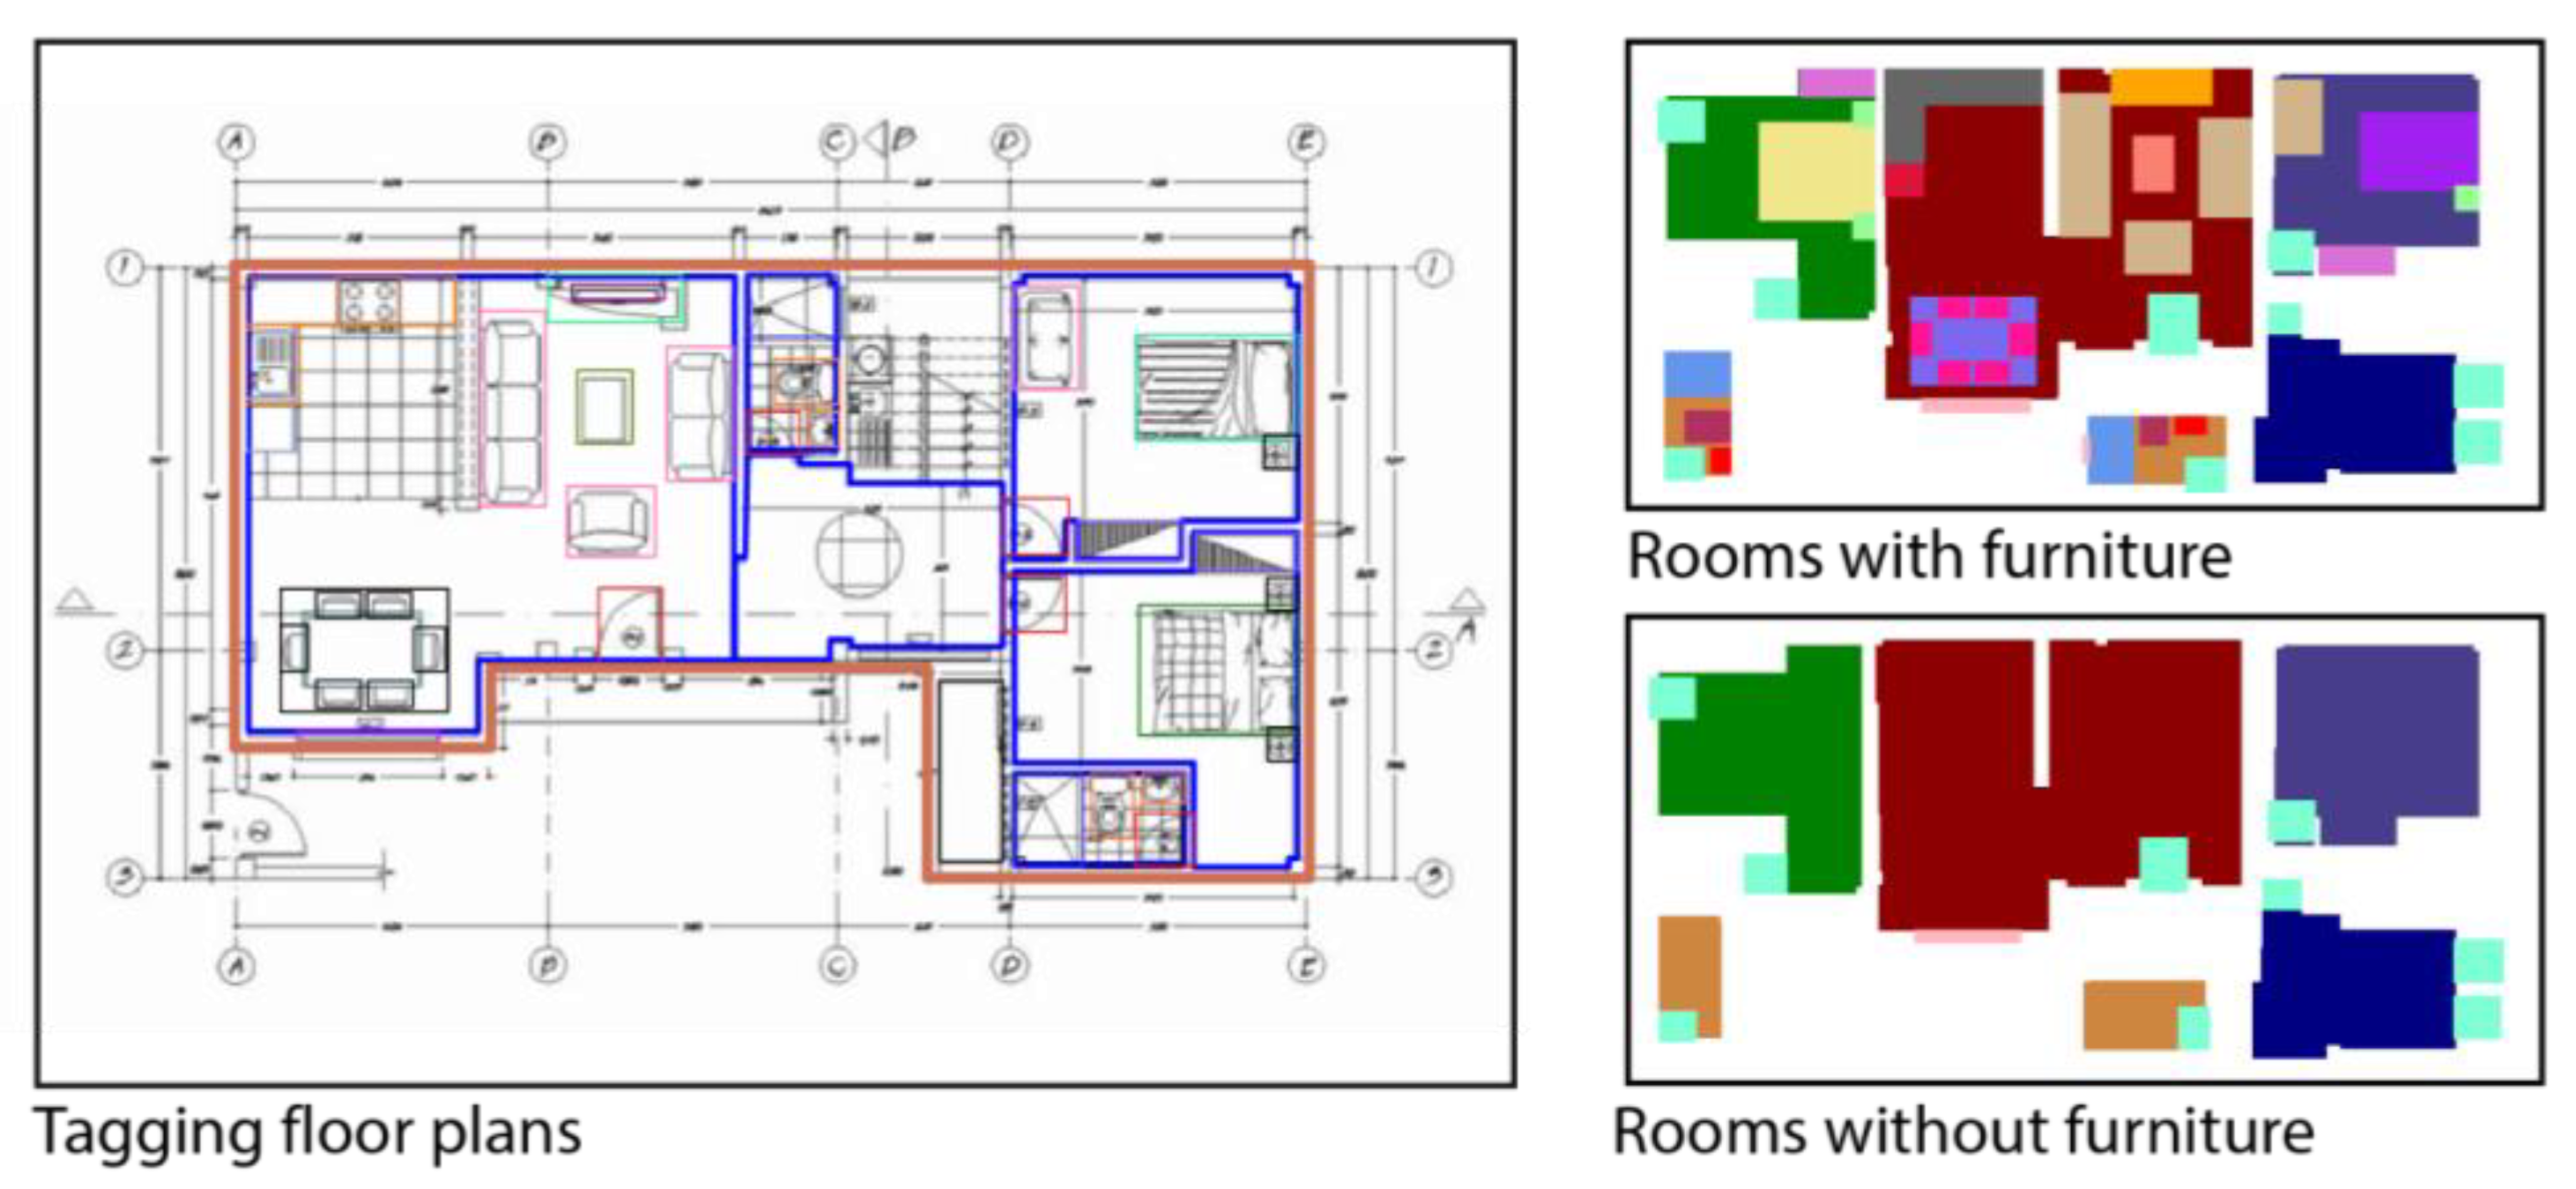
In light of the lack of a detailed residential room dataset, the authors of this study created one that can be used to train image-based ML models for the specific task of furnishing. For this purpose, floor plans were collected from various online real estate websites, mainly of local buildings in Israel. The collected and tagged floor plans were then automatically split up into rooms by the plugin, whereby a single apartment file led to 5–7 images of different rooms. For tagging the floor plans, each design image was imported into Rhino and scaled to its original size, guided by given measurements that appeared on the drawing. Next, bounding boxes were drawn in the appropriate layer names. Finally, the plugin automatically extracted and stored the data in COCO JSON format. At this stage, the code detected the room boundaries and the furniture objects inside it and correlated between the room’s IDs, names, and categories.
3.3. COCO JSON Conversion to Room Images
When the annotation stage is completed, and the COCO JSON file is formed, the images for each apartment’s room can then be generated. A method was developed for transforming the drawings into dataset images, where objects in the floor plan are represented using representative colors. Instead of using the original black-and-white room furniture, the annotation bounding boxes in the COCO JSON files can be converted into images with color masks. The final dataset is composed of pairs of colored images in two primary variants: the first with furnished rooms to represent the ground-truth images that the ML models are expected to learn; the second with empty rooms that only have doors and windows to represent the user’s input, as shown in
Figure 6. The generated dataset is available to the public on GitHub (Tanasra, n.d.) [
52].
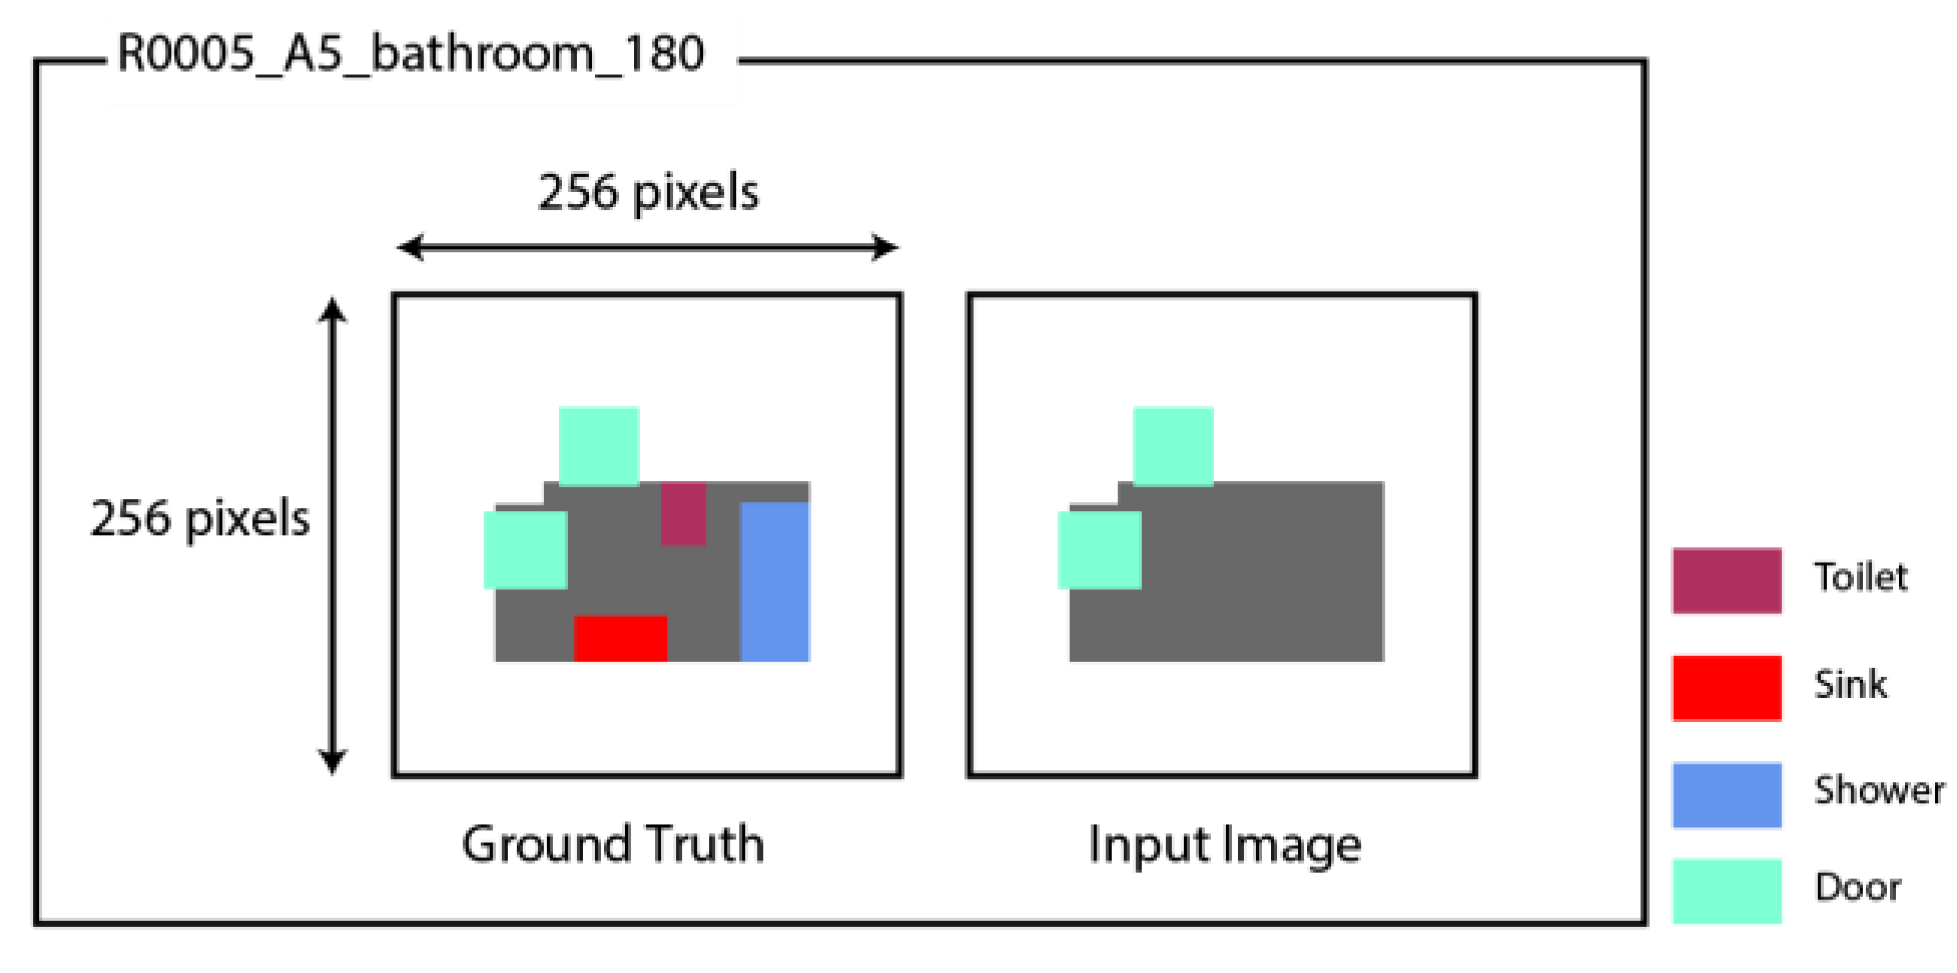
To effectively utilize CGAN models, training them on images of equal size is crucial. The chosen size should strike a balance between capturing essential details and remaining computationally feasible for model training. Architectural room sizes vary depending on their design and function. While a standard bathroom is smaller than a living room, it is imperative that both images adhere to a consistent scale factor to ensure the generation of suitable architectural spaces. The color boxes of each room, therefore, are automatically centered on a separate 256 × 256 canvas to maintain the same scale factor in all images, as shown in
Figure 7.
To diversify the room dataset, two image-augmentation techniques were leveraged: rotation and flipping. This effectively expanded the dataset, multiplying each image by six. To differentiate between the augmented data and the original sources, the image names were coded to incorporate information such as the source site, file name, room category, category ID, and count, as well as the augmentation status.
3.4. Training CGANs on the Data
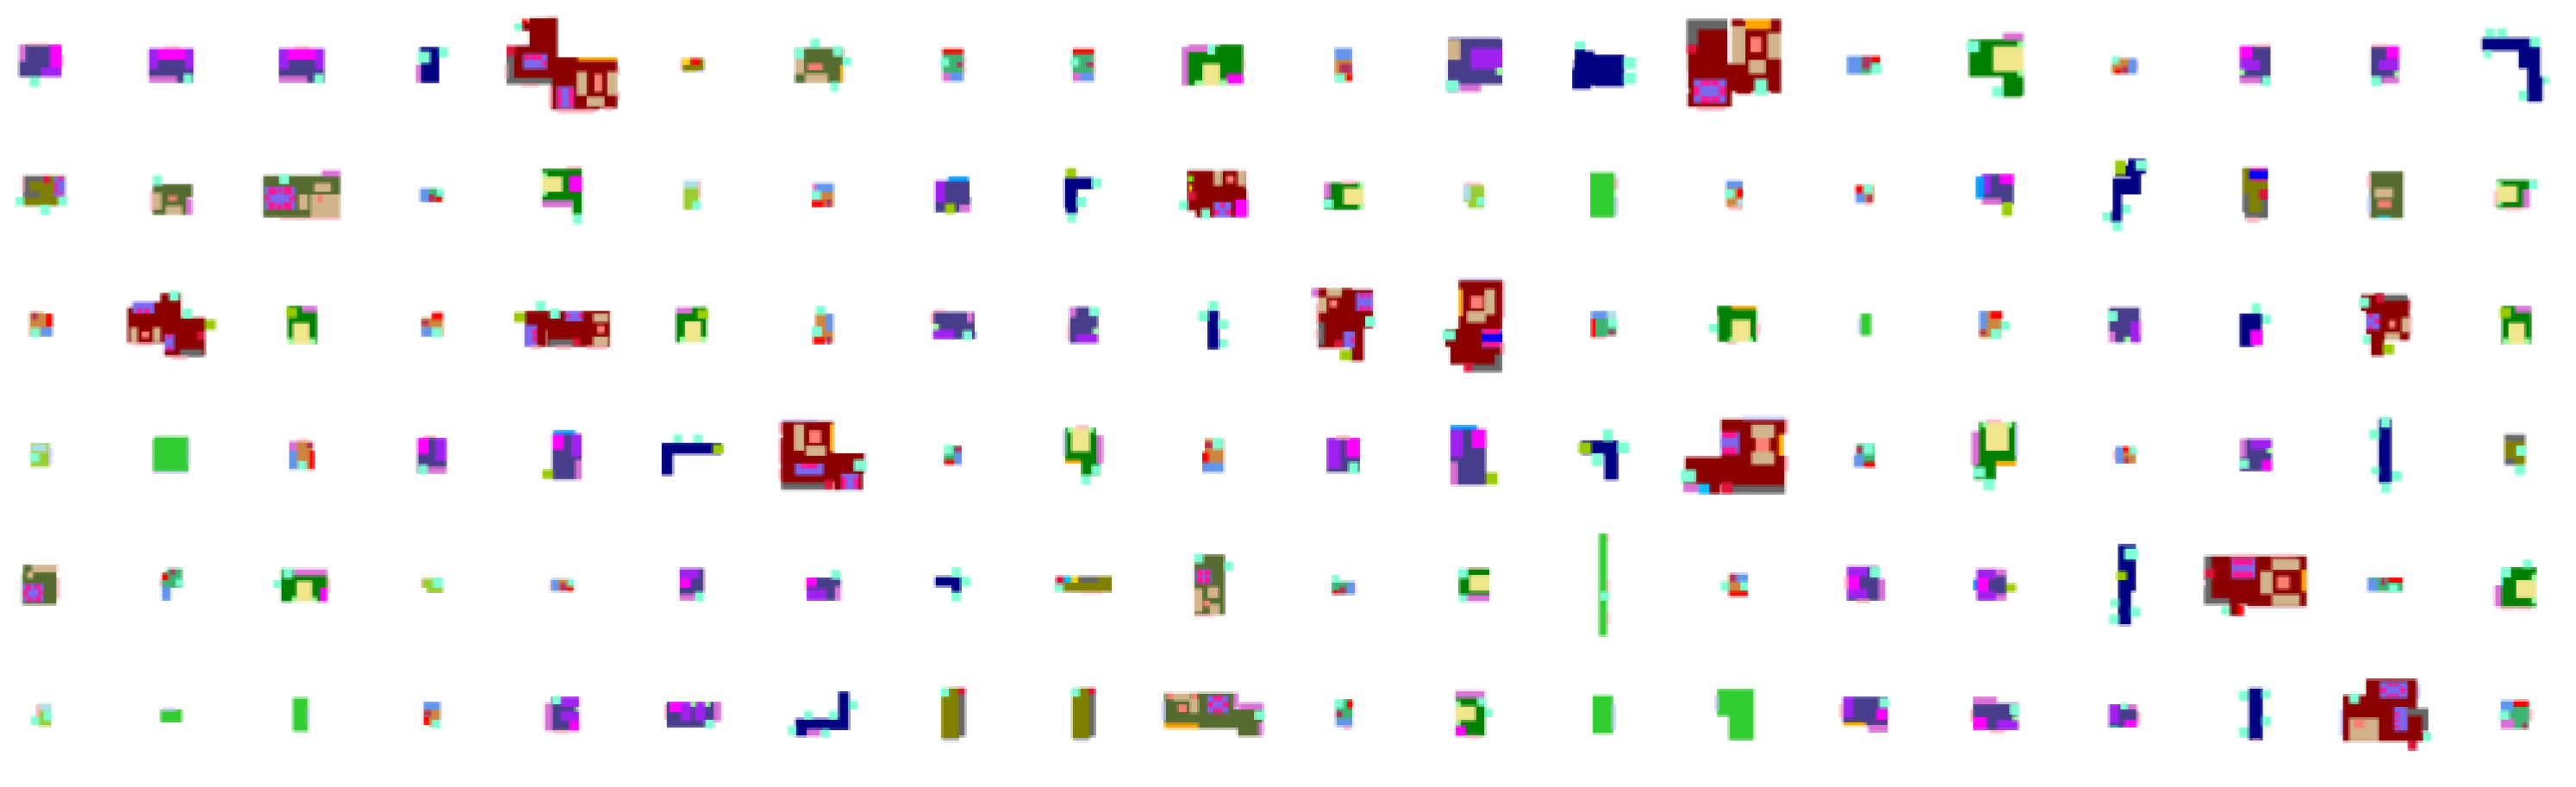
Using the described workflow, the authors of this study were able to annotate over 80 floor plans, creating 660 original room images and 3340 augmented images (
Figure 8).
The three CGAN models employed in this study were initially trained on all room categories combined. However, during this process, the models were inaccurately mixing room categories and furniture sets, for example, placing a bed in a living room. To apply the models more efficiently, the training was altered to be conducted in phases across the various room categories. As explained in the Methods section below, the model was trained with one room (i.e., bathroom) and with a fixed set of three pieces of furniture (i.e., toilet, sink, shower). All models were trained on a dataset of 1032 training pairs of input image/ground-truth image bathrooms, including 172 original images and 860 augmented ones. The models were then tested on 258 new, previously unseen input images.
3.4.1. Pix2pix and BicycleGAN
The entire scheme was implemented using Tensorflow version 2.5. and in line with [
30,
31]. The training parameters of these two models were altered numerous times to match the dataset size and improve the results. According to [
30], the batch size set to 1 is found to be effective and recommended for tasks like those presented in this study. To train the pix2pix model, we conducted tests to ensure that the model achieves the optimal prediction after being trained for 80–90 epochs. The training duration lasted 7–10 h, using a laptop with a medium-range dedicated graphics card. Using the same dataset, BicycleGAN was trained with 700 epochs. The training duration for this model lasted 25 h.
3.4.2. SPADE Versions
The SPADE model was trained in two different versions, using 1275 training images and 15 test ones. First, using the model network as is, the model was trained in 300 steps, in line with guidelines by [
32]. Second, since the data in this study were categorical, an encoded output was explored rather than a numeric RGB image one, especially as the dataset comprised four distinct input color labels (corresponding to room, windows, and two types of doors), and the target images comprised three additional colors (corresponding to toilet, sink, shower). These colors can be represented using the standard one-hot binary representation via a 3D tensor with the image spatial dimensions multiplied by the number of categories (e.g., 256 × 256 × 7 for the output), where the first two dimensions represent the image coordinates, while the third one represents the number of categories. As such, if the n
th category is placed at the x,y pixel, then the value of the one-hot representation tensor at the place (x,y,n) equals 1; otherwise, it equals 0. In this version, there were four input labels and seven output labels, which led to changing the model’s output, disabling the VGG loss layer, and yielding inferior results.
3.5. Post-Processing
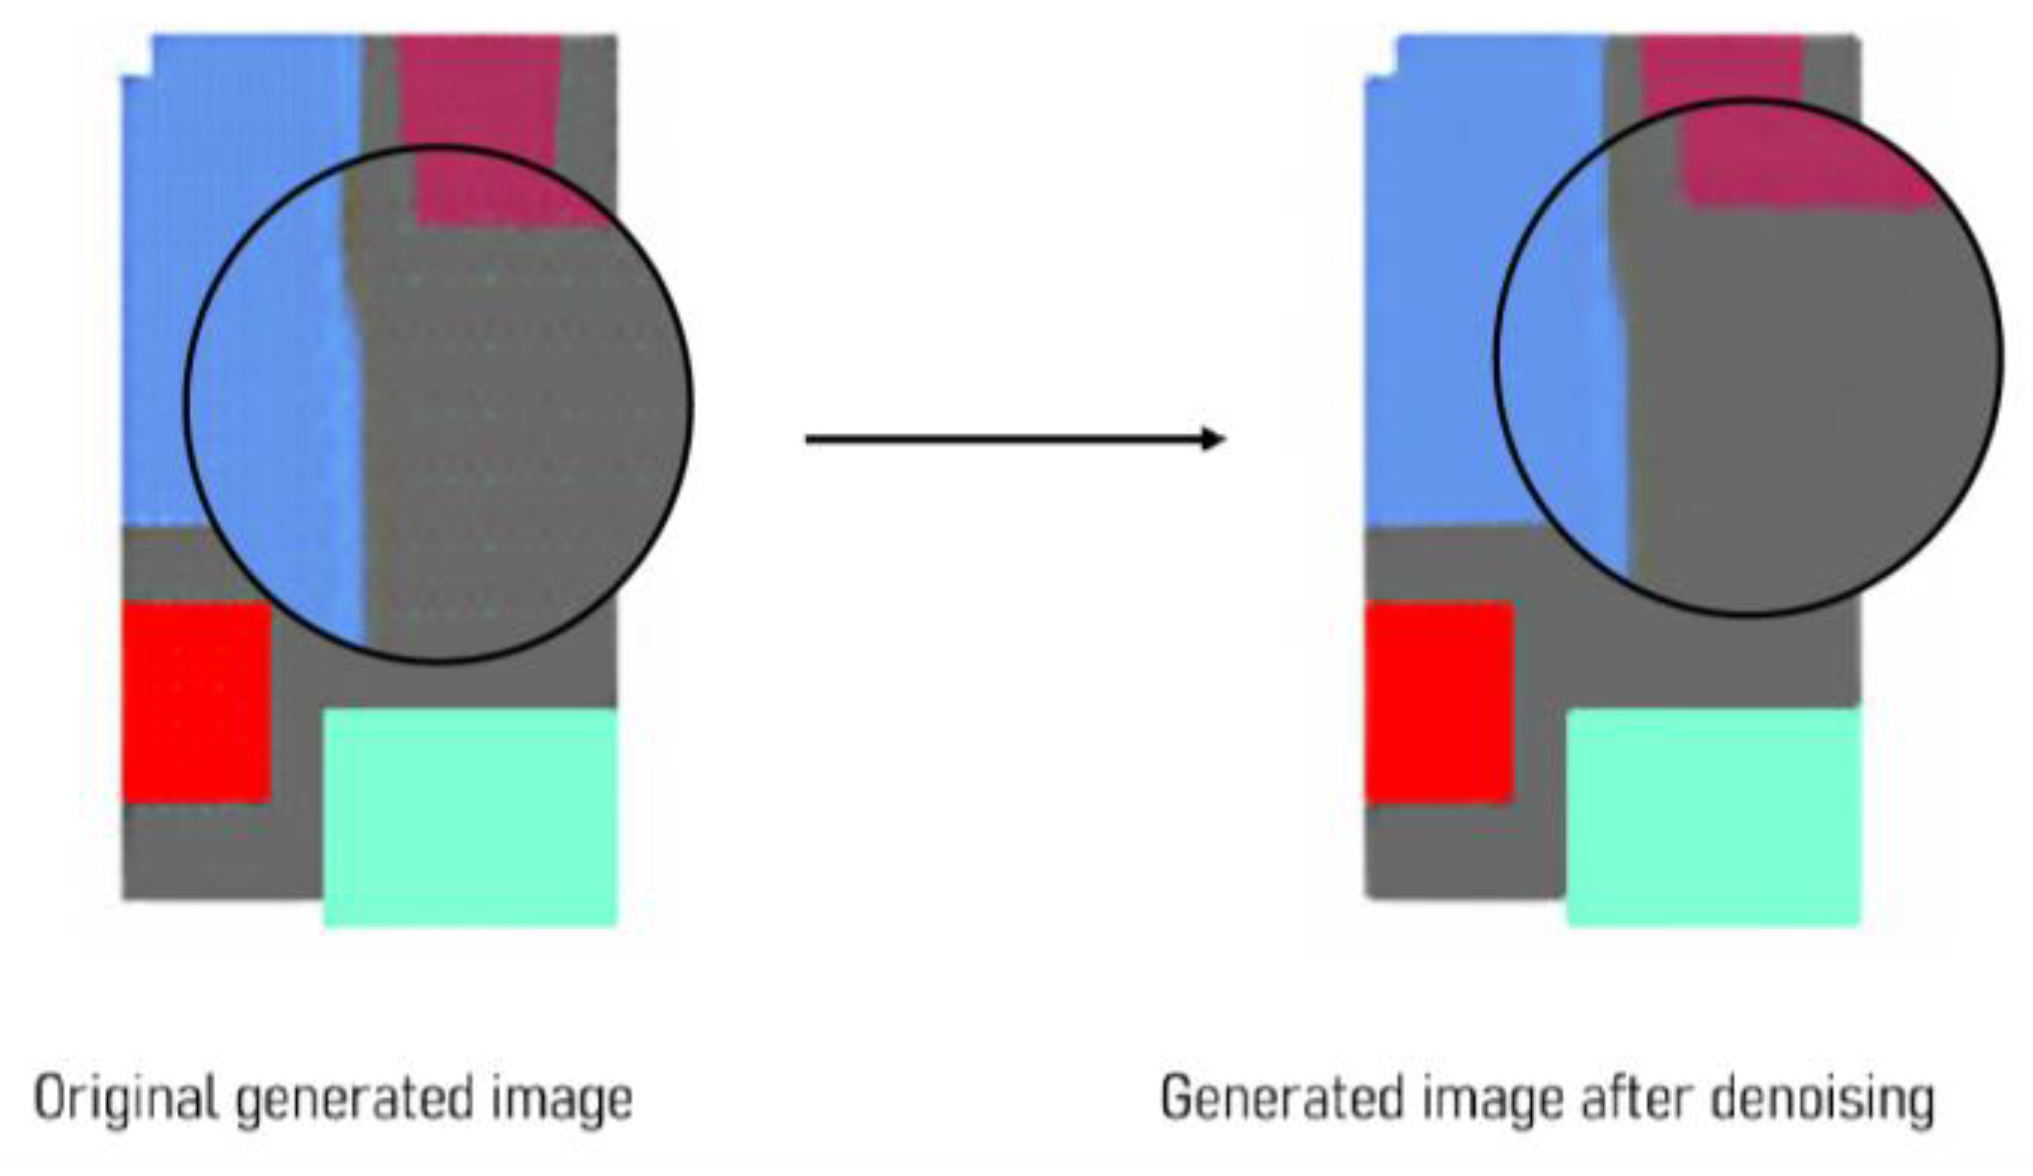
3.5.1. Denoising Generated Images
Images generated via ML models frequently contain noise or artifacts that decrease their quality. Such noise may appear as grainy or speckled patterns and could cause distortions and artifacts that reduce the visual quality of the image, interfering with image-analysis tasks. Image denoising is, therefore, an important step in the post-processing stage (Buades et al., 2005) [
53]. In addition to decreasing such artifacts, denoising filters help obtain more precise results when identifying bounding boxes for various objects in an image. The commonly used median filter (Flores, 2020) [
54] was applied to the generated image, a method that replaces each pixel in the image with the median value of its neighboring pixels, which effectively removes isolated outliers yet preserves edges and other important image features (
Figure 9).
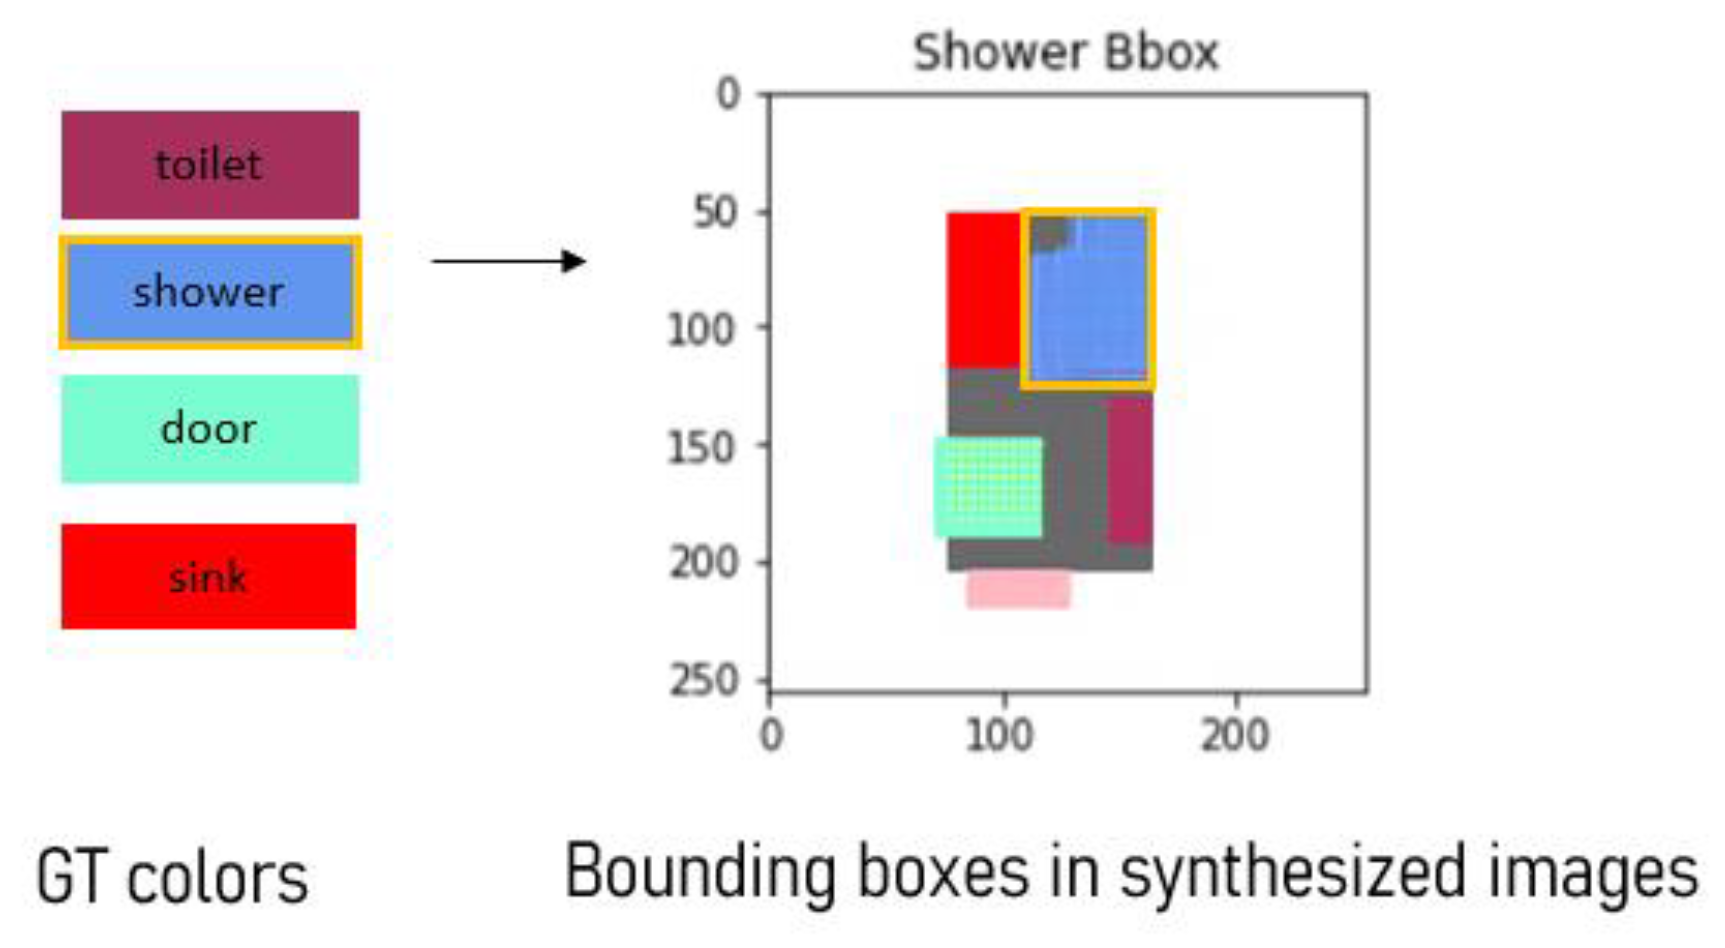
3.5.2. Detecting Label Bounding Boxes
For the final stage of the generative process, a series of post-processing manipulations was developed with the aim of improving the generated image results. Since the generated images are composed only of color patches, a post-processing approach was applied to detect objects by finding the extent of the color range of each label color, locating it in the image, and then demarcating it using a bounding box. For instance, when searching for the shower in each image, the algorithm sought pixels that fell within the brighter and darker variations of the original label color while using the expanded range to locate the corresponding color blob, as shown in
Figure 10. The bounding box of each furniture object is then computed by identifying the minimum and maximum x and y coordinates of the located object’s pixels. At this stage, the bounding box information is used to define its location and size within the image boundaries.
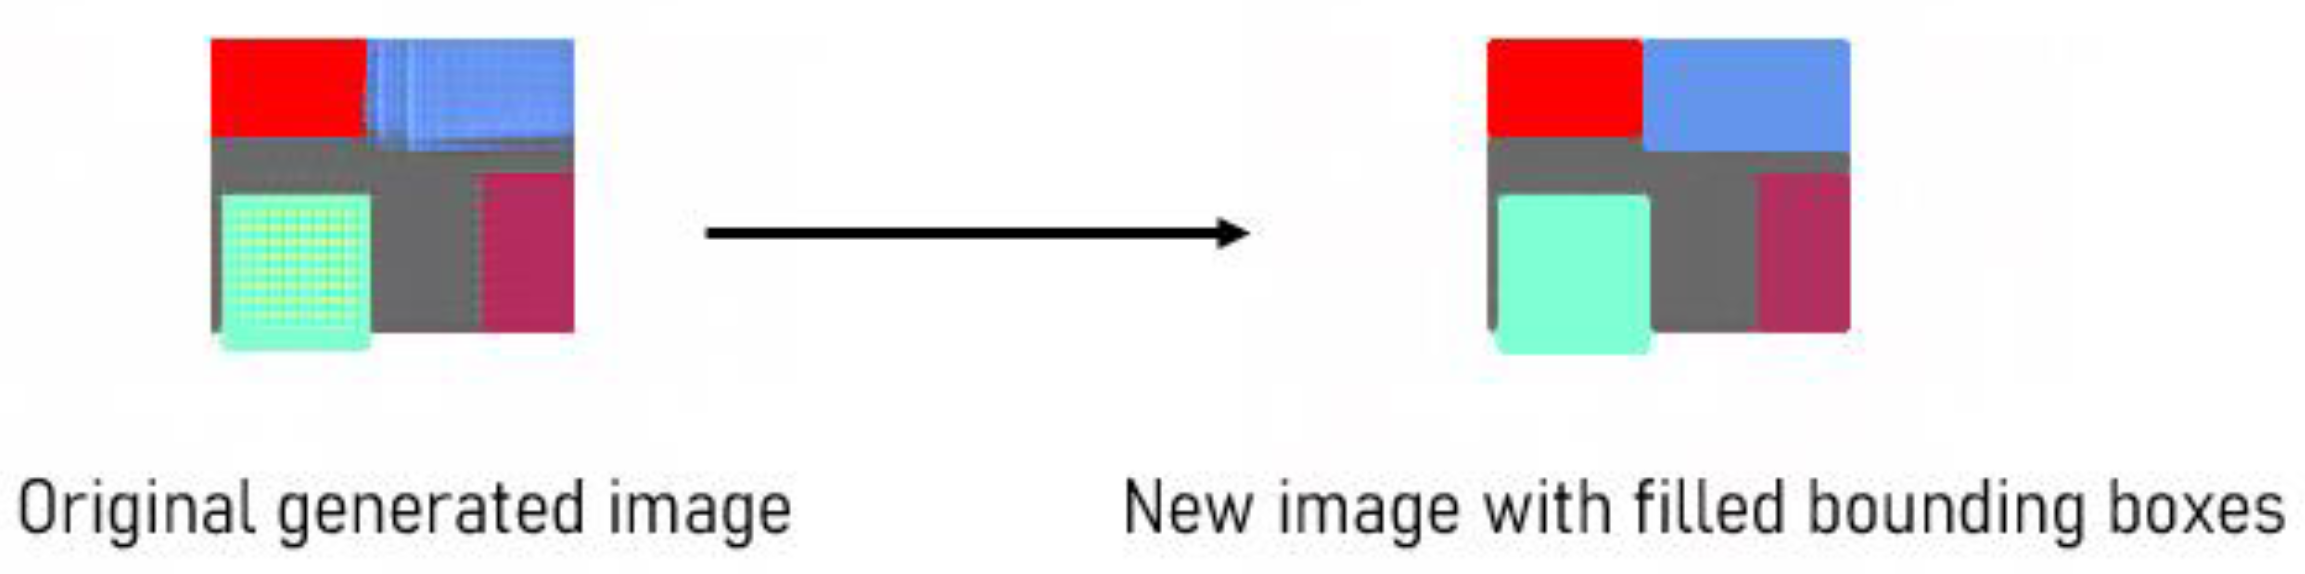
3.5.3. Filing Bounding Boxes
After detecting the furniture label color from the generated image, a new bounding box for the object was created and filled with the furniture label color. This method can produce clear new images, where the relevant objects are accurately identified and labeled, as shown in
Figure 11.
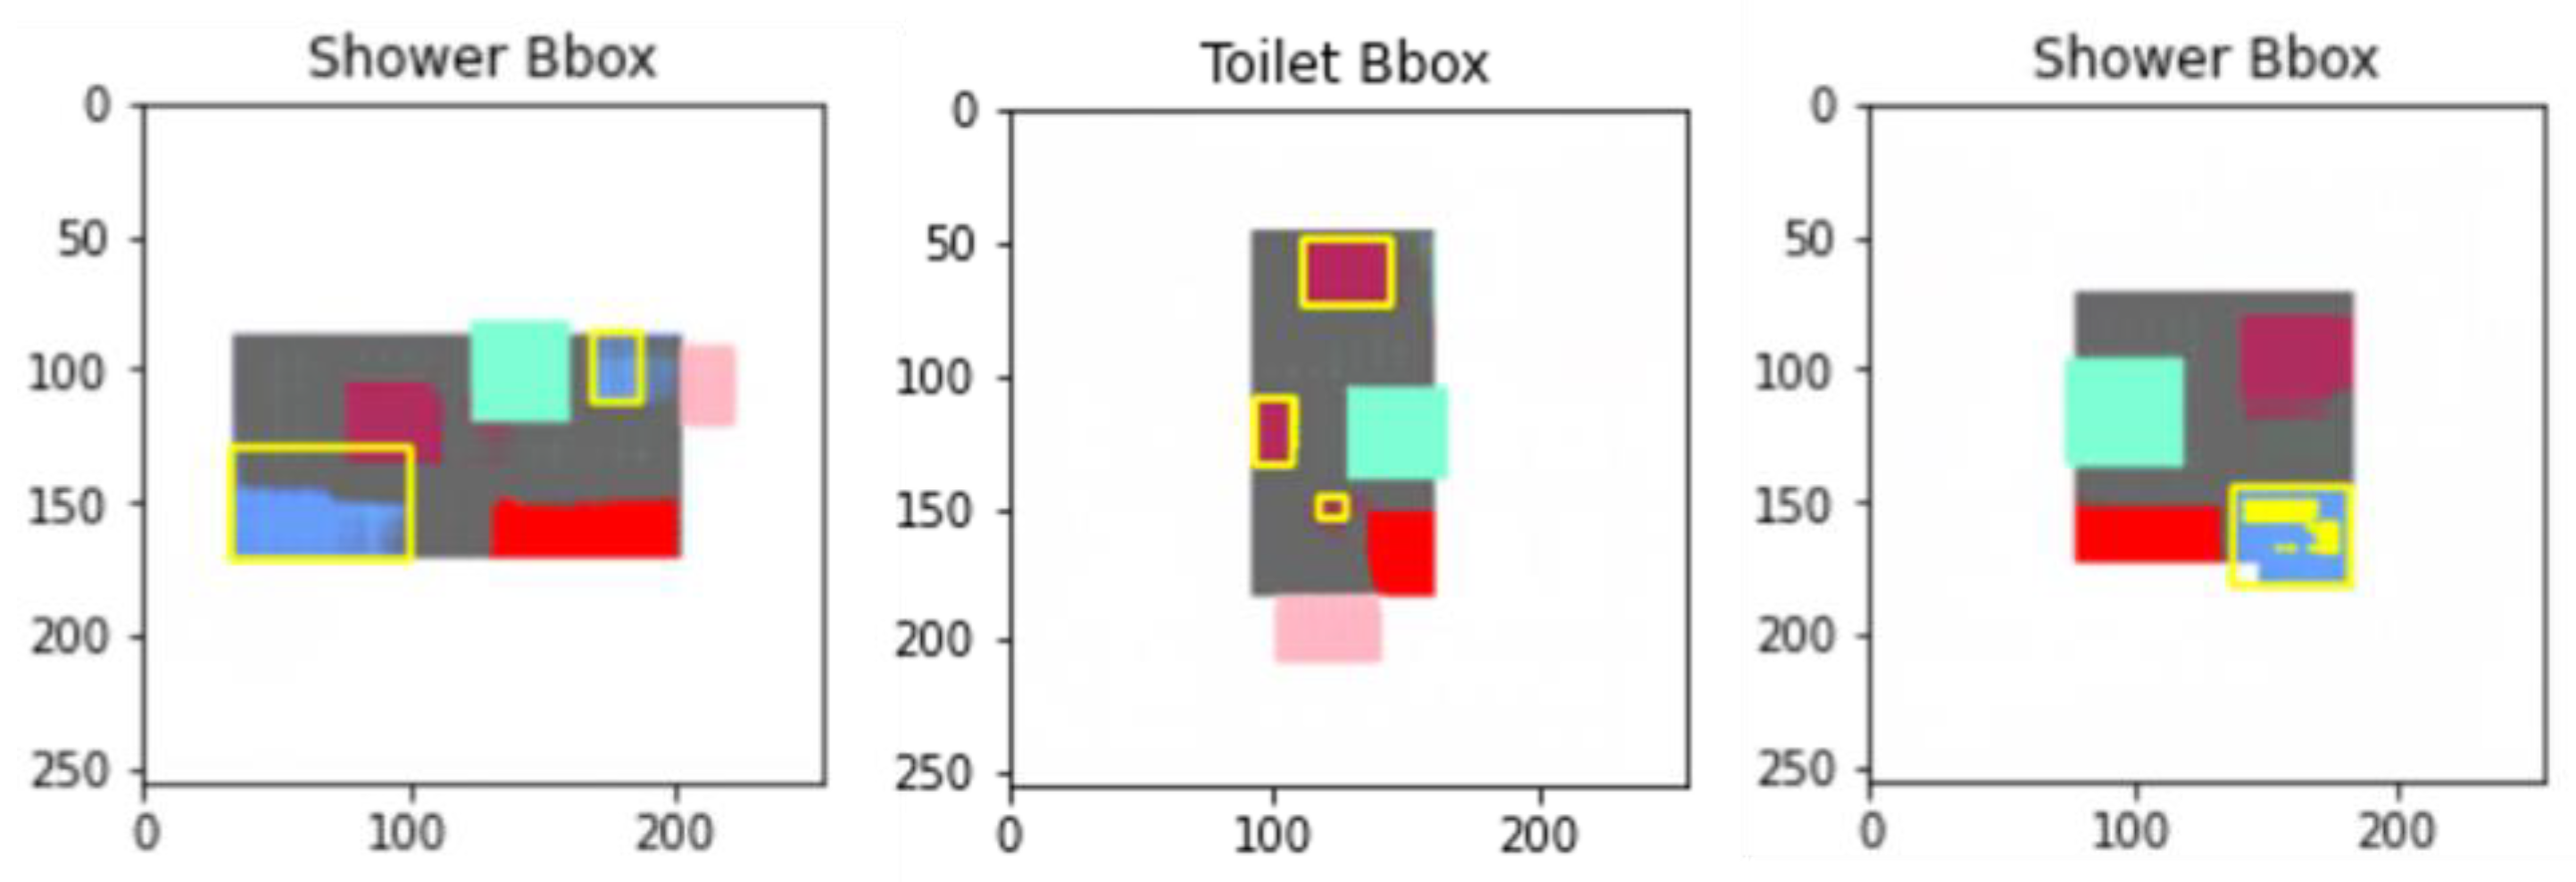
3.5.4. Filtering Bounding Boxes
One challenge encountered in this research was that both the pix2pix and the BicycleGAN generated multiple bounding boxes, as shown in
Figure 12.
To eliminate multiple boxes, a filtering system was designed to discard boxes that were significantly smaller than the threshold values, which were determined according to area, short length, and long length. To set these threshold values, the minimum–maximum range of values for each parameter from the ground-truth images was defined. These values are expressed in their 256 × 256 pixels ground-truth images, as shown in
Table 1.
Two filters were then devised: (1) the strict filter, which discards elements from the dataset that are below the minimum value, with a small tolerance for error; (2) the more lenient soft filter, which only discards elements smaller than 1/5 of the minimum values found in the dataset.
3.6. Evaluating the Generated Images
The previously mentioned evaluation methods, the CGAN evaluation metrics (FID and KID) and the object detection metrics for comparing the generated images with the ground truth (i.e., precision, recall, and IOU), are generalized methods often used in Computer Vision. As such, they provide only very generic results and are not specifically adapted to the task at hand: furniture layout generation. The following section proposes two novel architectural evaluation parameters that address this issue. In the Results section, all the above-mentioned metrics were used to test the performance of the model.
3.6.1. Architectural Metrics between the Generated Image and the Ground Truth Image
While the metrics described in the previous section are widely accepted for comparing objects between two images, they have little, if any, architectural meaning and might be too general for this case.
Chaillou [
10] proposes six metrics for quantifying different aspects of floor plan designs: (1) footprint; (2) program; (3) orientation; (4) thickness and texture; (5) connectivity; (6) circulation. After receiving the evaluation results, users can then choose the design option that best matches their needs and preferences. However, these metrics are related to the building’s layout, wall thickness and orientation, and room inter-connectivity, not to the furniture layout. In addition, the researcher does not elaborate on the outcomes or effectiveness of the proposed evaluation set.
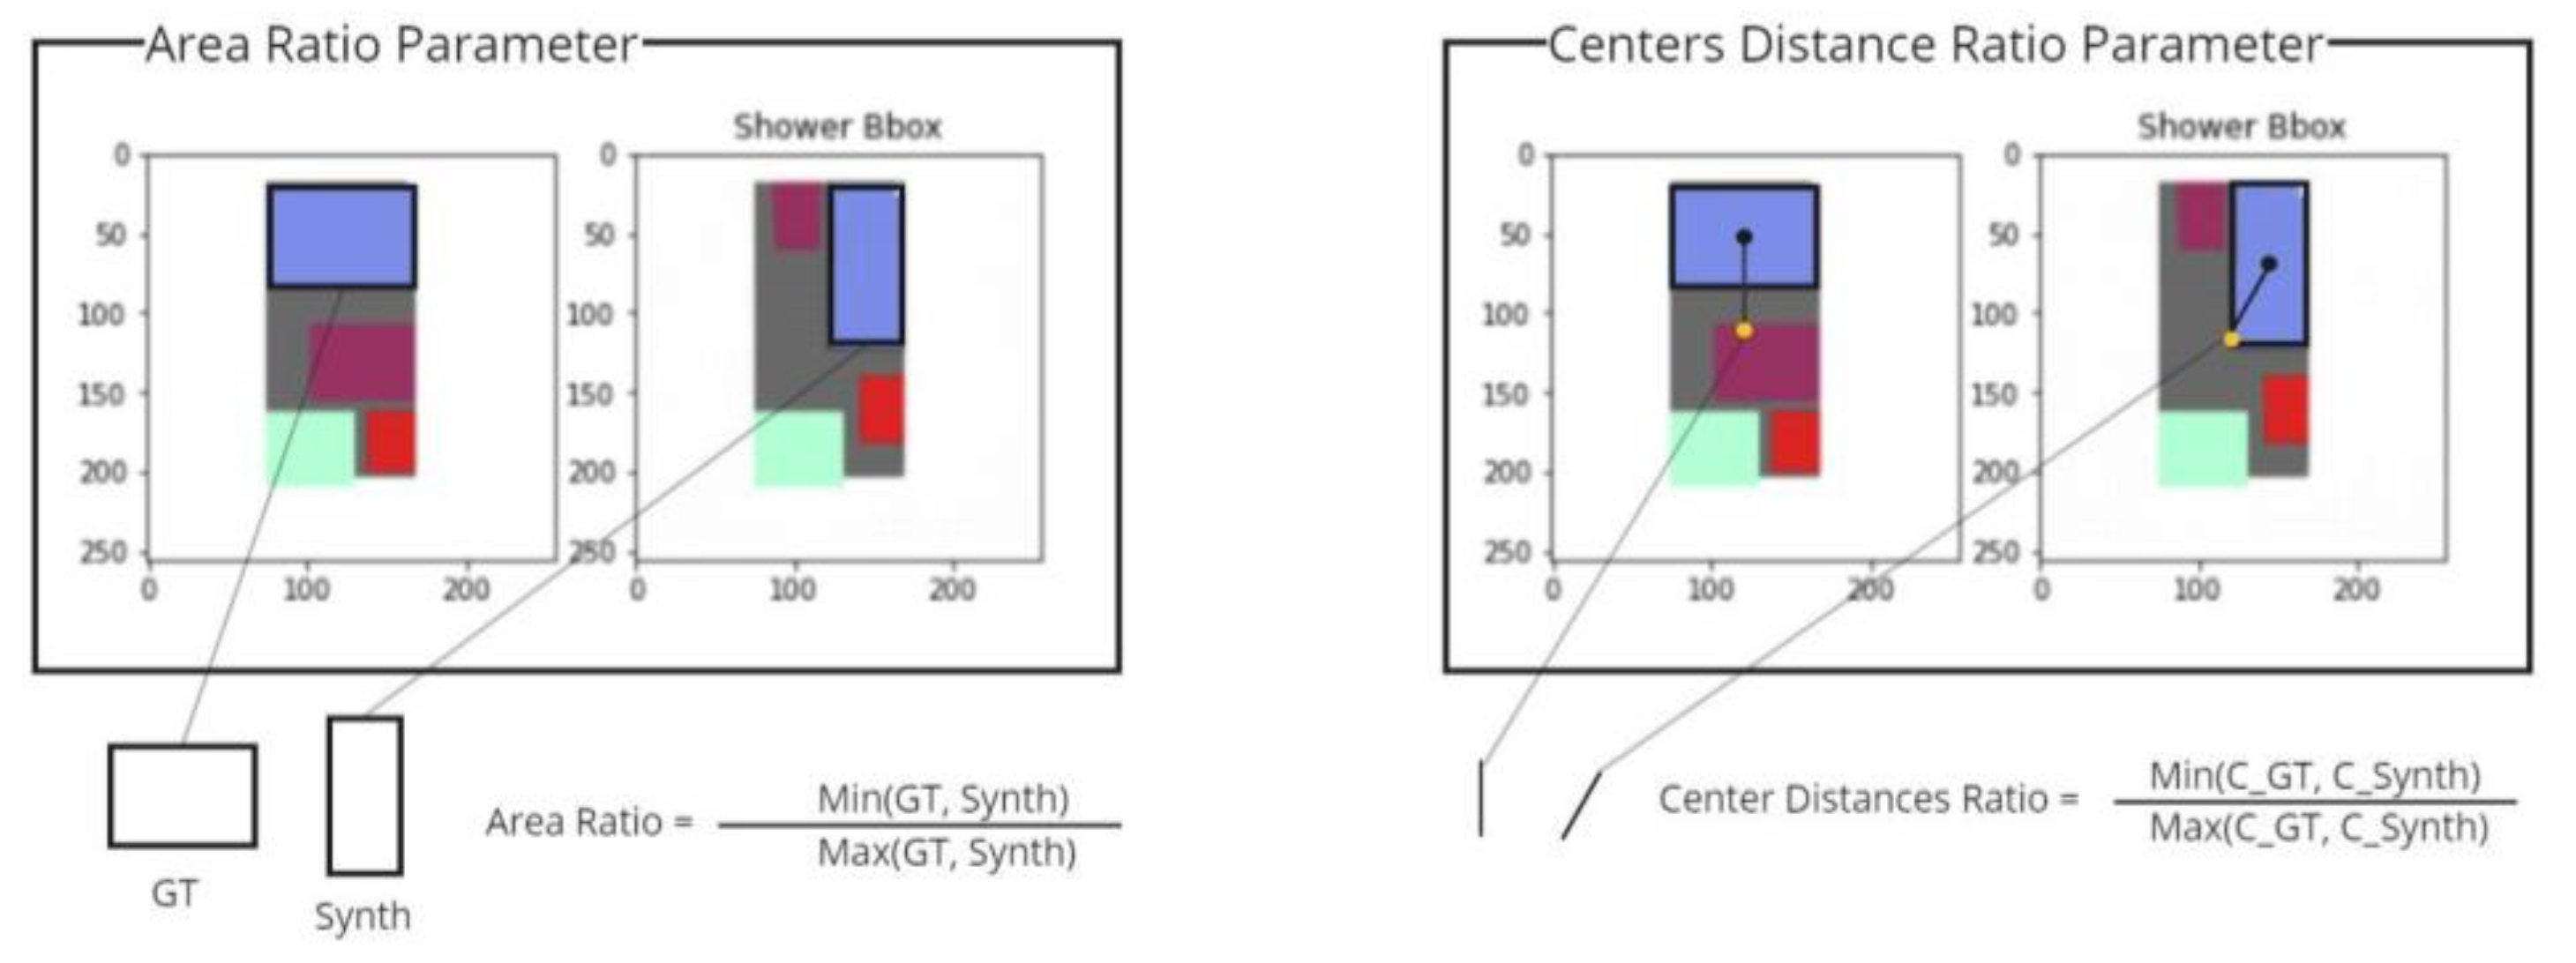
We, therefore, developed two additional architectural metrics that are more specific to interior design (
Figure 13):
Area ratio: This parameter compares the size of the generated bounding box to that of the ground-truth bounding box and calculates the ratio between the two values. In terms of architecture, this expresses an understanding of the relationship between the function and size of the architectural elements.
Center distance: This parameter compares the distance between the center point of the furniture bounding box to that of the room and calculates the ratio between the generated image and the ground-truth bounding box in the generated image. The minimal term is always the numerator of the equation in order to maintain a value of <1. In terms of architecture, the higher the score of this metric, the greater the model’s understanding of the positioning of the furniture in relation to the geometry of the room.
Figure 13.
Architectural parameters. Left: area ratio parameter; Right: center distance parameter.
Figure 13.
Architectural parameters. Left: area ratio parameter; Right: center distance parameter.
As both metrics can only be measured in relation to a single, well-defined bounding box, they are only measured after applying the filters.
3.6.2. Metrics between Generated Image and Entire Dataset–Furniture Object Properties
Unlike the comparison to the furnished version of the same design in the ground truth, this evaluation method did not involve a direct comparison to specific images, instead evaluating the overall accuracy of the model in capturing the properties of the furniture objects. The comparison was achieved by scoring the properties of each furniture object according to the range of predefined values detailed above. Each property received a score of 1 if it fell in the range of the properties measured in the dataset and 0 if it fell outside the range. The resulting score is the average of the three properties of the bounding box (area, short length, and long length).
4. Results
This section describes the performance of the different ML models. On all the models, three versions of generated images were evaluated: (1) the original image; (2) a post-processed image consisting of denoised images; (3) a post-processed image consisting of new images with filled bounding boxes.
4.1. Pix2pix Model Results
The pix2pix model managed to produce results that resemble architectural designs. However, the results show significant variability and inconsistency between samples, ranging from good-quality images to unsatisfactory results. This inconsistency made it difficult to confidently assess the overall quality of the model. Selected examples of the generated images are presented in
Figure 14.
4.2. BicycleGAN Model Results
As mentioned, the bicyleGAN model generates multiple potential images for the same input. In these results, most images were almost identical, indicating that the model mostly generated the same output, as shown in
Figure 15. Hence, the encoded result was applied for the evaluation process. As will be demonstrated later, these images are generally closer to the ground truth than the ones generated via pix2pix.
4.3. SPADE Model Results
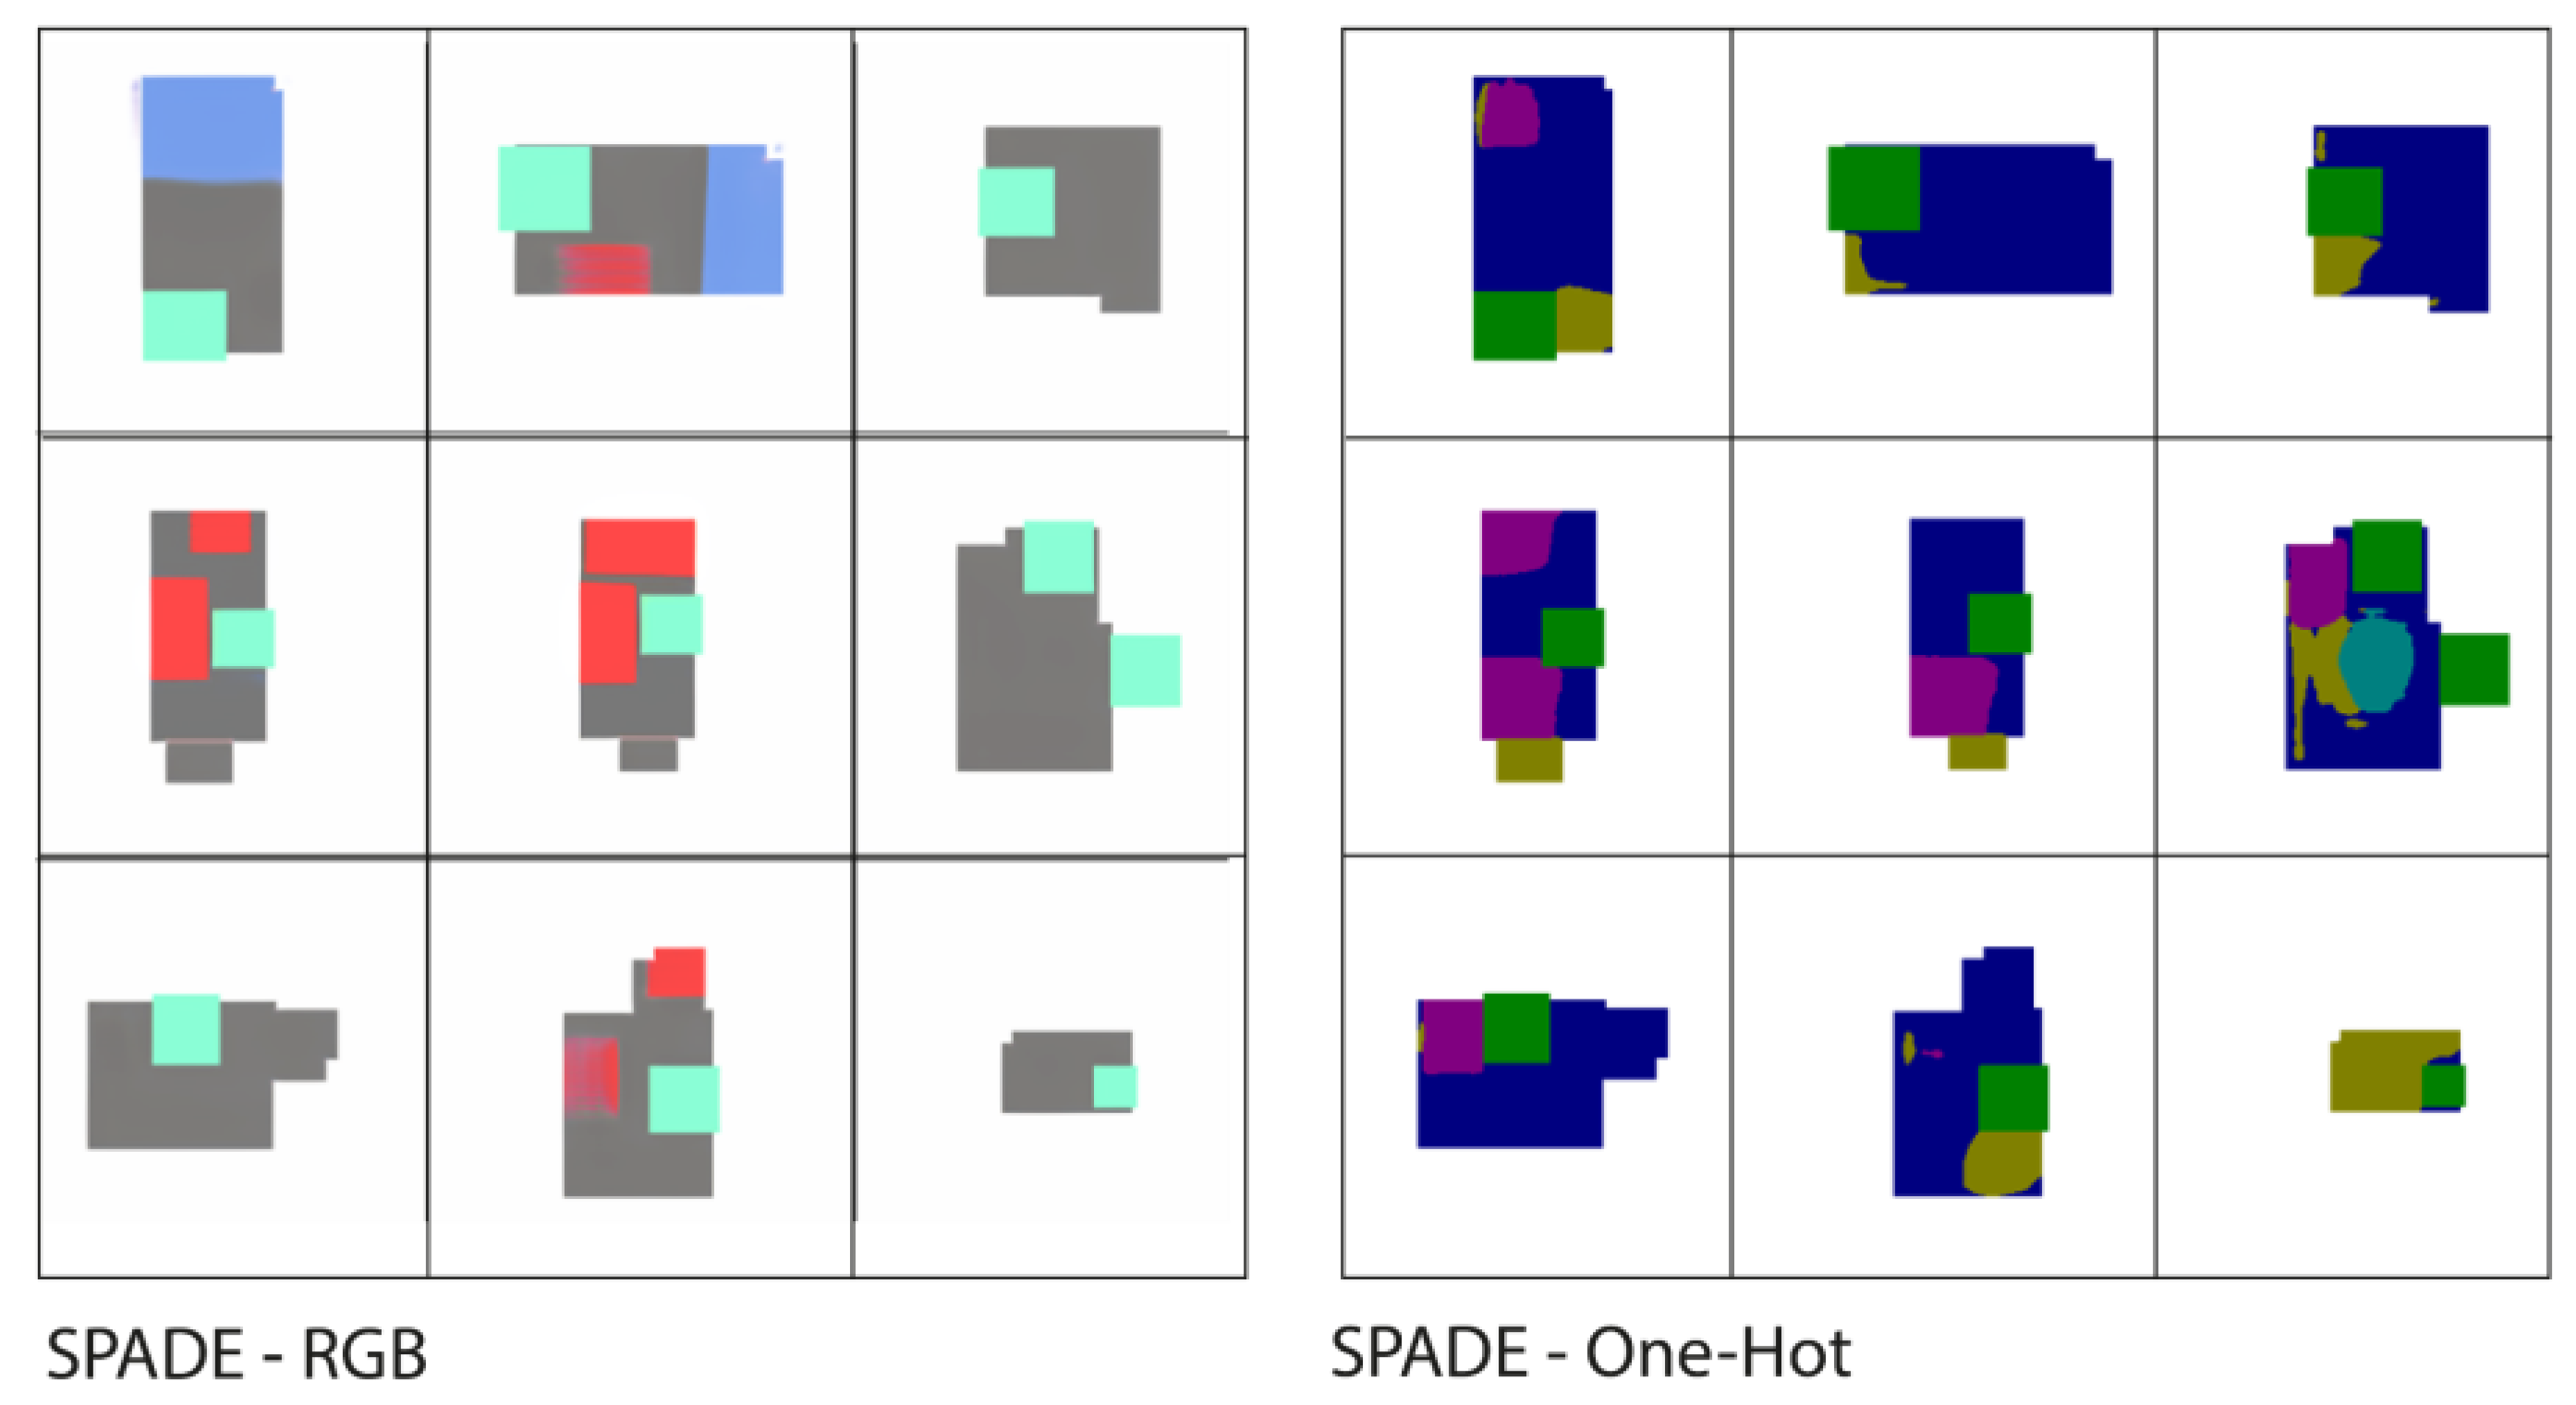
Although the training parameters of the two versions of the SPADE model were modified multiple times, it appears that the SPADE-RGB version mainly generated sinks or empty rooms, while the SPADE-OneHot version did not manage to create bounding boxes, merely creating patches of colors instead, as shown in
Figure 16. As visual examination found these results to be insufficient, this model was discarded from the comparison; as such, it is not addressed in the detailed evaluation provided in the following sections.
4.4. Object Detection Metrics
In general, the BicycleGAN model outperformed the P2P model in all measures (
Table 2), demonstrating the superiority of the multimodal model. Surprisingly, although the model did not fully utilize its ability to generate a variety of images, the latent layer improved the quality of the generated images.
On a different vector of comparison, the results of both models prior to filtering were higher than the post-filtered results (
Table 3) since some of the filtered bounding boxes were actually found within the bounding boxes of the ground truth, yet their dimensions did not meet the standards. This could mean that instead of filtering, bounding boxes below certain values may somehow be adjusted. Such heuristics will need to be developed in future work.
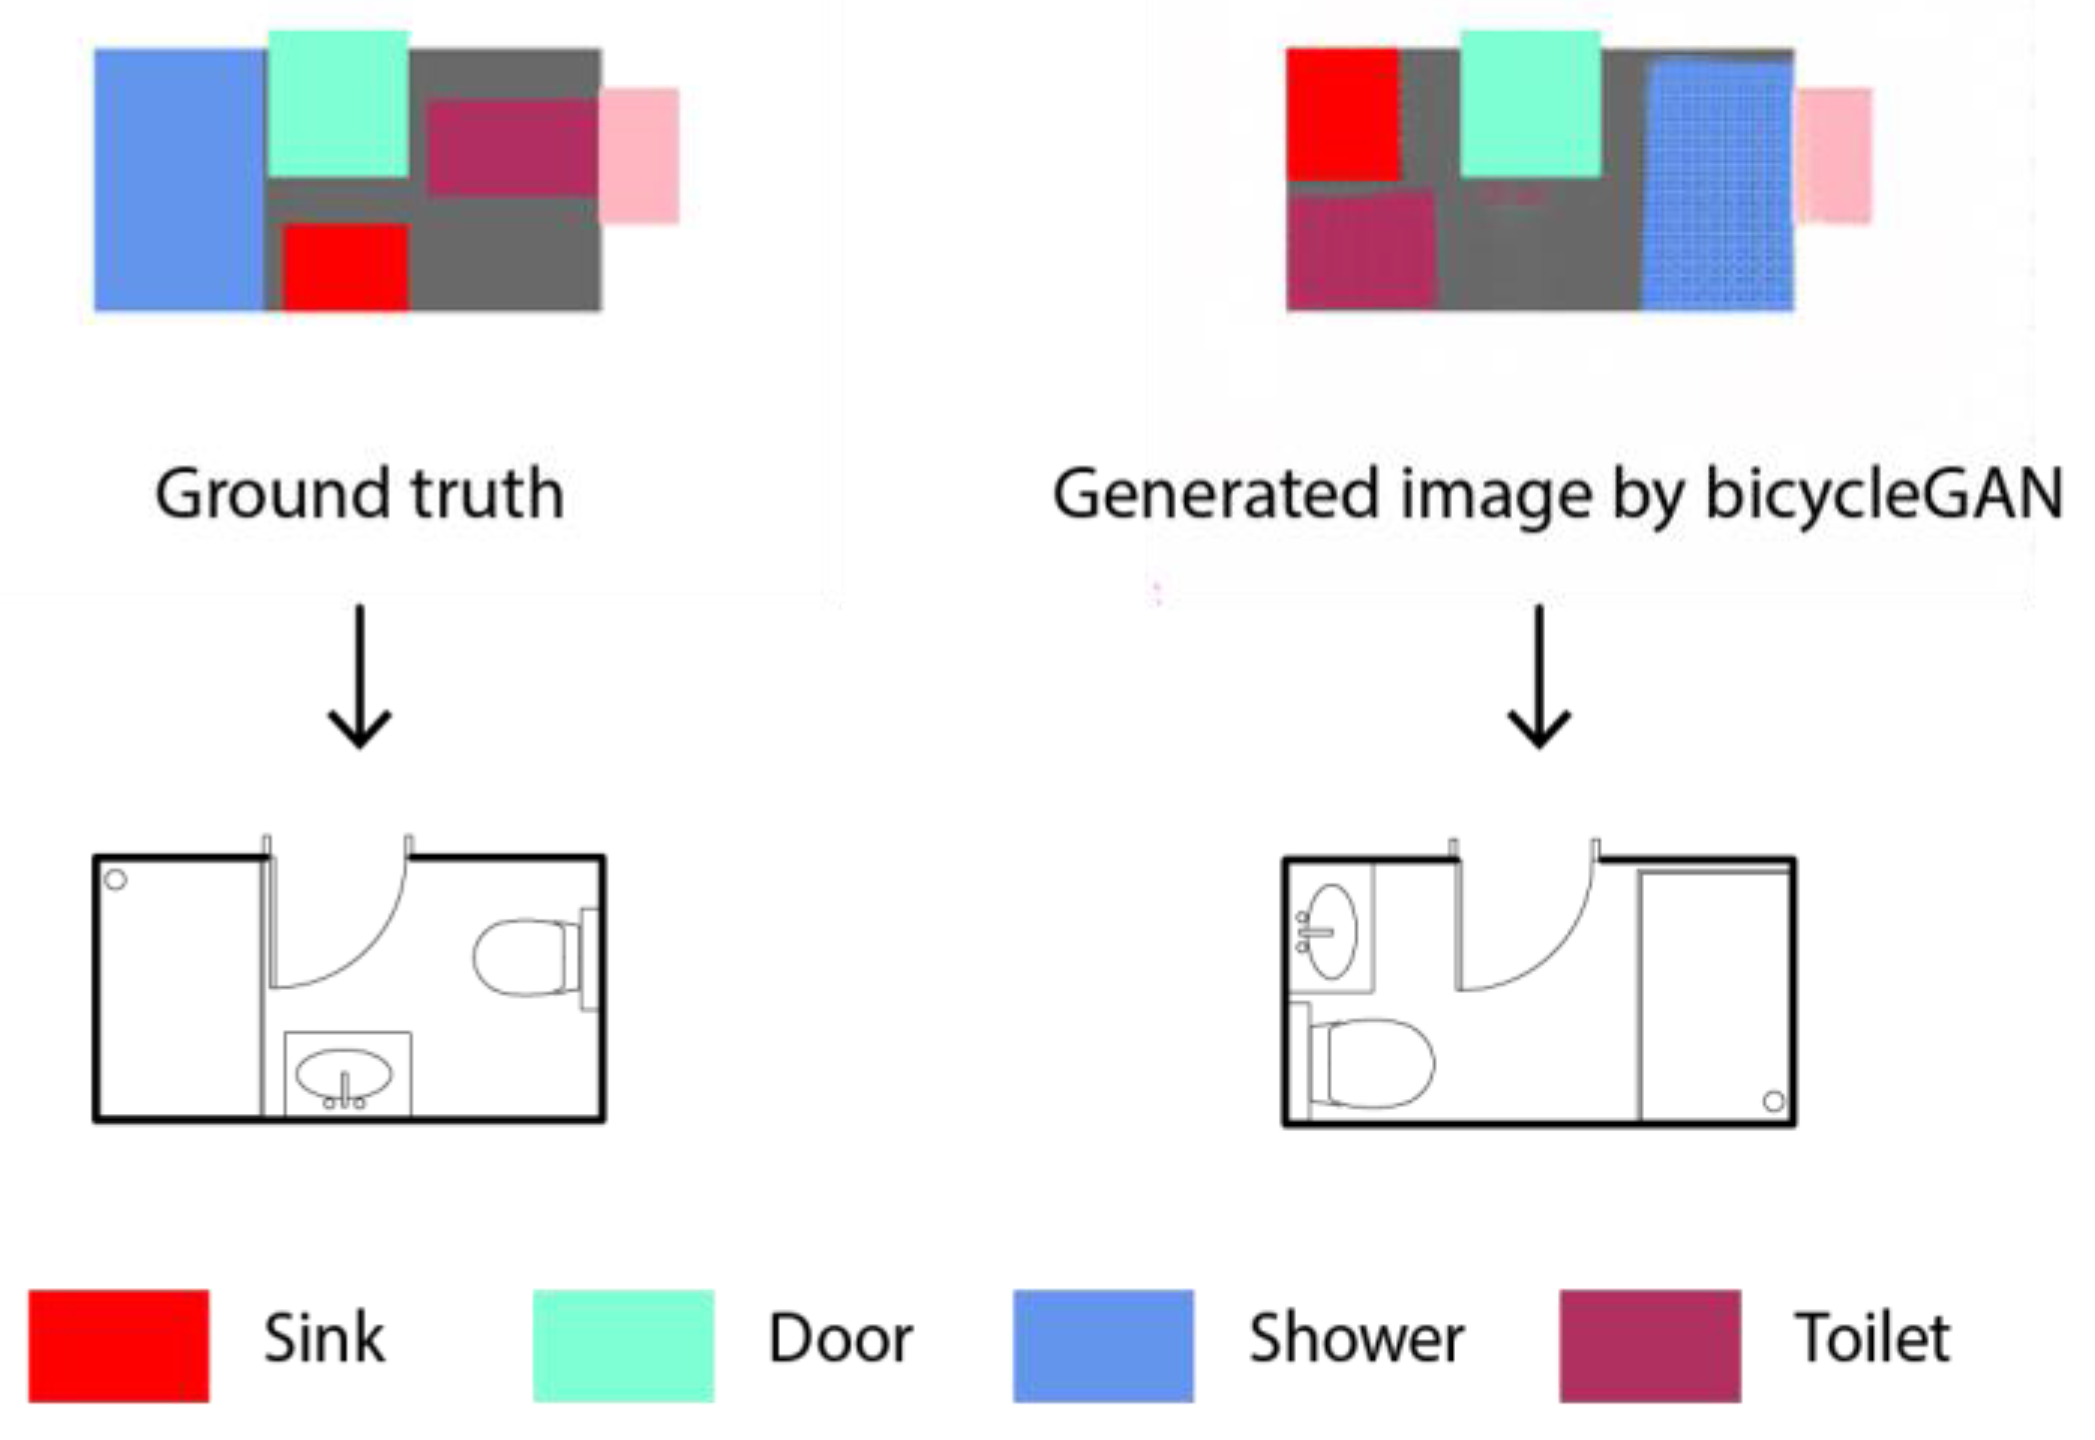
Figure 17 demonstrates that even if precision, recall, and IOU scores are low, the design may not necessarily be bad. In the generated image, the toilet, shower, and sink were juxtaposed in the generated image, leading to 0 in the precision, recall, and IOU scores of the objects. However, architecturally speaking, the generated design is acceptable, despite certain design faults. For example, the sink would have been better situated in front of the door to improve access, yet the generated design could still be acceptable.
4.5. CGAN Evaluation Metrics
To conduct the KID and FID metrics on the generated images, we tested three versions of each image: the original generated image, the denoised images (see
Section 3.5.1), and new images with filled bounding boxes (see
Section 3.5.2).
As explained, both KID and FID metrics evaluate the quality of generated images, with higher scores suggesting poorer quality and vice versa. In this study, although the results of the FID parameter were high in the original images generated via the two models, these outcomes greatly improved (i.e., the scores decreased) once the images were filtered and filled using the developed bounding-box method. These results present our overall finding, whereby the BicycleGAN model outperformed the pix2pix model (
Table 4). Moreover, unlike the object detection metrics, the CGAN evaluation metrics support the filtering process, which can be verified via visual evidence of improvement in quality.
4.6. Architectural Metrics
When comparing the architectural metrics (as seen in
Table 5), once again, BicycleGAN outperforms pix2pix in all measures. Regarding the specific measures, the higher center distance score indicates that both models learned to place objects in the correct location to a greater degree than their ability to correctly size them. The Furniture Object Properties metric is more general than the area ratio and center distance since it is trained against the entire dataset, not a specific ground-truth image. The fact that this metric is considerably higher in both models indicates that they both managed to generalize about the size of the different furniture types to a greater degree than their ability to fit them into a specific room. Improvement in the metrics of area ratio and center distance would indicate that the models have learned to place the correct size of furniture in the same place the human designer did.
5. Discussion
The aim of this study was twofold, as it strove to develop an applicable ML-based method for automated room furnishing, as well as comprehensive evaluation metrics for assessing the performance of the proposed method.
5.1. Open Access Method and Dataset
As mentioned in
Section 2.3, there are various existing online platforms available that automate a multitude of design tasks. Yet, despite their benefits and advantages, these platforms also have significant drawbacks, such as the required subscription fees in order to access their full range of features. Additionally, these software companies withhold their intellectual property (IP) and accumulated knowledge, thereby hindering scientific discourse. This study addresses these limitations by describing the model training and post-processing method in detail. This foundation serves as a resource for both research and practice in the field of architecture and interior design. The proposed dataset creation method provides an open-access platform for generating and developing customized architectural datasets. The dataset is accessible online (
https://github.com/hanantanasra/buildings, accessed on 29 May 2023). The CAD2COCO plugin is intended to be a simple-to-use tool that can be implemented within the architectural workflow. Researchers can also utilize this tool for generating different types of data in relation to buildings, apartments, rooms, and even furnishing details. In the current dataset, the apartment data were divided into rooms, giving additional opportunities for training multiple ML models. Currently, the plugin only collects the positional data from the floor plan, yet additional information, such as contextual, topological, numerical, and textual data, may be added to the COCO representation to increase the usefulness of the dataset for different types of research.
5.2. Representation of Architecture
Using the described method, the graphic architectural objects were simplified into machine-readable, clear data information using labels, bounding boxes, and colors. The results show that clearing the graphic “noise” from the images and training directly on the colored areas enables us to efficiently train image-to-image models on a relatively small dataset. Automating bathroom interior space furnishing via models such as CGANs proved their ability to “understand” architectural design standards from the colored bounding box dataset. The bounding box representation also helped us to develop evaluation metrics for the design, which are specific to the field of architecture rather than to generic image processing. The colored representations can be used as internal representations for the generative software and automatically interpreted into traditional graphics for the human designer.
At this stage of the research, focusing on a specific category of rooms (i.e., the bathroom) reduced various complexities. It is important to note that furnishing a room based solely on its boundaries represents just one approach to addressing the challenge of automating space furnishing. Alternative approaches include furnishing processes that are based on room-style room description and other similar factors. The advantages of ML stem from its ability to acquire intricate details from images. The model can potentially learn the concept of distances, item relationships, and even human behaviors without algorithmic guidance. An expanded dataset could enable the model to comprehend the arrangement of loose furniture or fixtures within a room while deepening its understanding as it encounters more diverse data.
5.3. Evaluation Metrics
Visual observation indicated that the models could generate designs adhering to the architectural standards learned from the overall dataset. However, it was also clear that the designs were not perfect and needed to be improved. While standard architectural design processes rely only on human, “eye-based” design evaluation, one cannot train ML models using these mechanisms. Therefore, several numerical metrics were developed to measure the quality of the design. The metrics came from different worlds, such as object detection, CGANs, and architectural standards. These metrics helped us evaluate the performance of different models and of post-processing methods. They clearly demonstrated that the bicycleGAN model arrives at better results. We suggest that further work should be directed towards developing architectural evaluation metrics, which somehow capture amorphous terms such as design functionality and aesthetics. These measures can then be the base for any further work in ML-based layout generation.
5.4. Limitations and Future Improvements
Ultimately, the FID and KID evaluation scores of the models were not high in comparison to CGANs from non-architectural fields. One recurring issue that seems to have caused this was the generation of multiple bounding boxes for the same furniture category, especially in the pix2pix model. We believe that the CGAN models can be improved in several ways. As with all ML models, the size of the dataset generated directly impacts the quality of the results. The larger the dataset, the better the results are likely to be. The models described in this work were trained using 172 original and 860 augmented images and generated results on 258 images. This is considered a relatively low number in the field of ML and can surely be increased. The COCOTOJSON plugin can be instrumental in expanding the dataset. The dataset generated for this study included standard straight walls without diagonal rooms or curved walls; this type of data can be added in the future. As another avenue of inquiry, additional ML models should also be tested, such as transformers, attentionGANs, and styleTransferGAN. Finally, the post-processing method suggested could be expanded and made to further modify the CGAN results to make them better fit well-known design standards.
6. Conclusions
This study set out to create an automated method for furnishing interior space planning, using a simple design process. A new plugin within a standard design software was used to source a room-based interior design dataset based on real architectural plans. The plugin was used to translate the black-and-white architectural drawings in the dataset into color masks representing functions and furniture. These colored images were then used to train various types of CGAN models to generate a range of suitable interior design alternatives. An innovative post-processing method was also developed to evaluate and improve the generated results. Due to the inadequacy of existing CGAN evaluation methods for capturing the intricacies of design information, a series of evaluation criteria for examining the performance of these models was also developed and applied in this study.
The workflow was tested on a series of unfurnished bathroom images, where it showed a strong ability to generate viable interior designs. Several evaluation metrics demonstrated that the BicycleGAN model outperformed the two other alternative CGANs that were tested in this study (pix2pix and SPADE). A visual inspection of the generated images supports these findings while demonstrating that the proposed model is capable of generating architecturally valid designs. The post-processing method suggested was also shown to improve generated results by 30–50% in both CGAN and architectural metrics.
These findings offer a novel perspective on how ML models can be effectively leveraged to enhance informed decision making in the field of interior space planning. They also demonstrate the need for customized evaluation methods tailored to the interior design problem. The simplicity and performance of the process suggests that in the future, it could empower professional and lay designers to effectively harness ML capabilities in their design processes. Utilizing the findings of this study, diverse users can leverage the upcoming plugin for extracting floor plan data. Additionally, our online dataset, test parameters, and evaluation metrics can serve as valuable resources for others encountering similar floor plan challenges.
Author Contributions
Conceptualization, H.T., S.B., G.A. and T.M.; Methodology, H.T., S.B. and G.A.; Software, H.T. and T.R.S.; Validation, H.T., S.B. and G.A.; Investigation, H.T.; Resources, H.T., S.B. and G.A.; Data Curation, H.T.; Writing—Original Draft Preparation, H.T.; Writing—Review and Editing, H.T., G.A., T.R.S., T.M. and S.B.; Visualization, H.T.; Supervision, G.A. and S.B. All authors have read and agreed to the published version of the manuscript.
Funding
This research received no external funding.
Data Availability Statement
The bathroom dataset images, as well as the results images of the three models used, will be made available through the GitHub repository (
https://github.com/hanantanasra/buildings accessed on 29 May 2023), allowing interested researchers and readers to access and explore the images associated with this research.
Acknowledgments
We would like to thank Foad Abu Dahood for his support in the technical aspect of working with the models. We would also like to thank the annotating team, including Chen Daie, Shahar Kariv, and Avraham Shkolnik, for their assistance in collecting, tagging, and organizing the data. Finally, we would like to thank Beverley Yohanan for her constructive editing of this article.
Conflicts of Interest
The authors declare no conflict of interest.
References
- Sönmez, N.O. A review of the use of examples for automating architectural design tasks. CAD Comput.-Aided Des. 2018, 96, 13–30. [Google Scholar] [CrossRef]
- Reddy Edla, D.; Lingras, P.; Venkatanareshbabu, K. Advances in Machine Learning and Data Science: Recent Achievements and Research Directives; Springer: Singapore, 2018; Volume 705. [Google Scholar]
- Goodfellow, I.; Yoshua, B.; Aaron, C. Deep-learning. In Deep; MIT Press: Cambridge, MA, USA, 2016; Volume 12, Available online: http://www.deeplearningbook.org (accessed on 28 May 2023).
- Ziran, Z.; Marinai, S. Object Detection in Floor Plan Images. 2021. Available online: https://link.springer.com/book/10.1007/978-3-319-99978-4 (accessed on 28 May 2023).
- Dodge, S.; Xu, J.; Stenger, B. Parsing floor plan images. In Proceedings of the 15th IAPR International Conference on Machine Vision Applications, MVA 2017, Nagoya, Japan, 8–12 May 2017; pp. 358–361. [Google Scholar] [CrossRef]
- Zeng, Z.; Li, X.; Yu, Y.K.; Fu, C.W. Deep floor plan recognition using a multi-task network with room-boundary-guided attention. In Proceedings of the IEEE International Conference on Computer Vision, Seoul, Republic of Korea, 27 October–2 November 2019; pp. 9095–9103. [Google Scholar] [CrossRef]
- Ahmed, S.; Liwicki, M.; Weber, M.; Dengel, A. Automatic room detection and room labeling from architectural floor plans. In Proceedings of the 10th IAPR International Workshop on Document Analysis Systems, Gold Coast, QLD, Australia, 27–29 March 2012; pp. 339–343. [Google Scholar] [CrossRef]
- Bloch, T.; Sacks, R. Comparing machine learning and rule-based inferencing for semantic enrichment of BIM models. Autom. Constr. 2018, 91, 256–272. [Google Scholar] [CrossRef]
- Buruzs, A.; Šipetić, M.; Blank-Landeshammer, B.; Zucker, G. IFC BIM Model Enrichment with Space Function Information Using Graph Neural Networks. Energies 2022, 15, 2937. [Google Scholar] [CrossRef]
- Chaillou, S. Space Layouts & GANs. Artificial Intelligence and Architecture. 2020. Available online: https://www.academia.edu/42289131/Space_Layouts_and_GANs_GAN_enabled_Floor_Plan_Generation (accessed on 28 May 2023).
- DPrix, W.; Schmidbaur, K.; Bolojan, D.; Baseta, E. The Legacy Sketch Machine: From Artificial to Architectural Intelligence. Archit. Des. 2022, 94, 14–21. [Google Scholar] [CrossRef]
- Midjourney. (n.d.). Available online: https://www.midjourney.com/home/?callbackUrl=%2Fapp%2F (accessed on 18 June 2023).
- Rombach, R.; Blattmann, A.; Lorenz, D.; Esser, P.; Ommer, B. High-Resolution Image Synthesis with Latent Diffusion Models. In Proceedings of the IEEE Computer Society Conference on Computer Vision and Pattern Recognition, New Orleans, LA, USA, 18–24 June 2022; pp. 10674–10685. [Google Scholar] [CrossRef]
- Ramesh, A.; Dhariwal, P.; Nichol, A.; Chu, C.; Chen, M. Hierarchical Text-Conditional Image Generation with CLIP Latents. 2022. Available online: http://arxiv.org/abs/2204.06125 (accessed on 28 May 2023).
- Panero, J.; Zelnik, M. Human Dimesion & Interior Space; Watson-Guptill: New York, NY, USA, 1979; Available online: www.crownpublishing.com%0Awww.watsonguptill.com (accessed on 28 May 2023).
- Peter, N.; Ernst, N. Architect’s Data, 3rd ed.; Wiley-Blackwell: Hoboken, NJ, USA, 2002; pp. 1–2. [Google Scholar]
- Merrell, P.; Schkufza, E.; Li, Z.; Koltun, V.; Agrawala, M. Interactive Furniture Layout Using Interior Design Guidelines. ACM Trans. Graph. 2011, 30, 1–10. [Google Scholar] [CrossRef]
- Geman, S.; Geman, D. Stochastic Relaxation, Gibbs Distributions, and the Bayesian Restoration of Images. IEEE Trans. Pattern Anal. Mach. Intell. 1984, PAMI-6, 721–741. [Google Scholar] [CrossRef] [PubMed]
- Yu, L.F.; Yeung, S.K.; Tang, C.K.; Terzopoulos, D.; Chan, T.F.; Osher, S.J. Make it home: Automatic optimization of furniture arrangement. ACM Trans. Graph. 2011, 30, 1–11. [Google Scholar] [CrossRef]
- Zhang, S.K.; Xie, W.Y.; Zhang, S.H. Geometry-Based Layout Generation with Hyper-Relations AMONG Objects. Graph. Model. 2021, 116, 101104. [Google Scholar] [CrossRef]
- Kim, J.; Lee, J.K. Stochastic detection of interior design styles using a deep-learning model for reference images. Appl. Sci. 2020, 10, 7299. [Google Scholar] [CrossRef]
- PlanFinder. Available online: https://www.planfinder.xyz/ (accessed on 15 May 2023).
- Finch—Optimizing Architecture. Available online: https://www.finch3d.com/ (accessed on 15 May 2023).
- Rayon. Collaborative Space Design. Available online: https://www.rayon.design/ (accessed on 15 May 2023).
- Goodfellow, I.; Pouget-Abadie, J.; Mirza, M.; Xu, B.; Warde-Farley, D.; Ozair, S.; Courville, A.; Bengio, Y. Generative adversarial networks. Commun. ACM 2014, 63, 139–144. [Google Scholar] [CrossRef]
- GAN Deep Learning: A Practical Guide. Available online: https://datagen.tech/guides/computer-vision/gan-deep-learning/ (accessed on 15 May 2023).
- Brock, A.; Donahue, J.; Simonyan, K. Large scale GaN training for high fidelity natural image synthesis. In Proceedings of the 7th International Conference on Learning Representations, ICLR 2019, New Orleans, LA, USA, 6–9 May 2019; pp. 1–35. [Google Scholar]
- Sauer, A.; Karras, T.; Laine, S.; Geiger, A.; Aila, T. StyleGAN-T: Unlocking the Power of GANs for Fast Large-Scale Text-to-Image Synthesis. arXiv 2023, arXiv:arXiv:2301.09515. [Google Scholar]
- Skorokhodov, I.; Tulyakov, S.; Elhoseiny, M. StyleGAN-V: A Continuous Video Generator with the Price, Image Quality and Perks of StyleGAN2. In Proceedings of the IEEE Computer Society Conference on Computer Vision and Pattern Recognition, New Orleans, LA, USA, 18–24 June 2022; pp. 3616–3626. [Google Scholar] [CrossRef]
- Isola, P.; Zhu, J.Y.; Zhou, T.; Efros, A.A. Image-to-image translation with conditional adversarial networks. In Proceedings of the 30th IEEE Conference on Computer Vision and Pattern Recognition, CVPR 2017, Honolulu, HI, USA, 21–26 July 2017; pp. 5967–5976. [Google Scholar] [CrossRef]
- Zhu, J.Y.; Zhang, R.; Pathak, D.; Darrell, T.; Efros, A.A.; Wang, O.; Shechtman, E. Toward multimodal image-to-image translation. Adv. Neural Inf. Process. Syst. 2017, 30, 466–477. [Google Scholar]
- Park, T.; Liu, M.Y.; Wang, T.C.; Zhu, J.Y. Semantic image synthesis with spatially-adaptive normalization. In Proceedings of the IEEE Computer Society Conference on Computer Vision and Pattern Recognition, Long Beach, CA, USA, 15–20 June 2019; pp. 2332–2341. [Google Scholar] [CrossRef]
- Huang, W.; Zheng, H. Architectural drawings recognition and generation through machine learning. In Proceedings of the 38th Annual Conference of the Association for Computer Aided Design in Architecture, ACADIA 2018, Mexico City, Mexico, 18–20 October 2018; Recalibration on Imprecision and Infidelity. pp. 156–165. [Google Scholar] [CrossRef]
- Yang, B.; Li, L.; Song, C.; Jiang, Z.; Ling, Y. Automatic furniture layout based on functional area division. In Proceedings of the 2019 International Conference on Cyberworlds, CW 2019, Kyoto, Japan, 2–4 October 2019; pp. 109–116. [Google Scholar] [CrossRef]
- Fu, H.; Cai, B.; Gao, L.; Zhang, L.X.; Wang, J.; Li, C.; Zeng, Q.; Sun, C.; Jia, R.; Zhao, B.; et al. 3D-FRONT: 3D Furnished Rooms with layOuts and semaNTics. In Proceedings of the IEEE International Conference on Computer Vision, Montreal, QC, Canada, 10–17 October 2021; pp. 10913–10922. [Google Scholar] [CrossRef]
- Liu, C.; Schwing, A.; Kundu, K.; Urtasun, R.; Fidler, S. Rent3D: Floor-Plan Priors for Monocular Layout Estimation. Available online: https://www.cs.toronto.edu/~fidler/projects/rent3D.html (accessed on 15 May 2023).
- Mwiza. RentHop|Kaggle. 2017. Available online: https://www.kaggle.com/code/mwizasimbeye11/renthop/data (accessed on 28 May 2023).
- Zeng, Z.; Li, X.; Yu, Y.K.; Fu, C. GitHub—Zlzeng/DeepFloorplan. 2019. Available online: https://github.com/zlzeng/DeepFloorplan (accessed on 28 May 2023).
- de las Heras, L.P.; Ahmed, S.; Liwicki, M.; Valveny, E.; Sánchez, G. Statistical segmentation and structural recognition for floor plan interpretation: Notation invariant structural element recognition. Int. J. Doc. Anal. Recognit. 2014, 17, 221–237. [Google Scholar] [CrossRef]
- Projects, H.; Datasets, P.P. CVC-FP: Database for structural floor plan analysis Images: International Journal on Document Analysis and Recognition. 2015. Available online: http://dag.cvc.uab.es/resources/floorplans/ (accessed on 28 May 2023).
- IKEA. IKEA Furniture. 2014. Available online: https://www.kaggle.com/datasets/ahmedkallam/ikea-sa-furniture-web-scraping (accessed on 20 April 2020).
- Voisey, B.S. Data Loading for CE8. 2019. Available online: https://www.tutorialspoint.com/machine_learning_with_python/machine_learning_with_python_data_loading_for_ml_projects.htm# (accessed on 28 May 2023).
- Python JSON—Guide—Machine Learning Plus. 2020. Available online: https://www.machinelearningplus.com/python-json-guide/ (accessed on 28 May 2023).
- Colleges, G.T.U.A.; Academy, O.; Academy, O.; Academy, O.; Science, A.C.; Technology, I.; Science, A.C. Microsoft COCO. In Proceedings of the ECCV 2014: European Conference on Computer Vision, Zurich, Switzerland, 5–12 September 2014; pp. 740–755. [Google Scholar]
- CVAT. Available online: https://www.cvat.ai/ (accessed on 19 September 2022).
- Betzalel, E.; Penso, C.; Navon, A.; Fetaya, E. A Study on the Evaluation of Generative Models. arXiv 2022, arXiv:arXiv:2206.10935. [Google Scholar]
- Brownlee, J. How to Implement the Frechet Inception Distance (FID) for Evaluating GANs. Available online: https://machinelearningmastery.com/how-to-implement-the-frechet-inception-distance-fid-from-scratch/ (accessed on 15 May 2023).
- Heusel, M.; Ramsauer, H.; Unterthiner, T.; Nessler, B.; Hochreiter, S. GANs trained by a two time-scale update rule converge to a local Nash equilibrium. Adv. Neural Inf. Process. Syst. 2017, 30, 6627–6638. [Google Scholar]
- Binkowski, M.; Sutherland, D.J.; Arbel, M.; Gretton, A. Demystifying MMD GANs. In Proceedings of the 6th International Conference on Learning Representations, ICLR 2018—Conference Track Proceedings, Vancouver, BC, Canada, 30 April–3 May 2018; pp. 1–36. [Google Scholar]
- Padilla, R.; Netto, S.L.; Da Silva, E.A.B. A Survey on Performance Metrics for Object-Detection Algorithms. In Proceedings of the 2020 International Conference on Systems, Signals and Image Processing (IWSSIP), Niteroi, Brazil, 1–3 July 2020; pp. 237–242. [Google Scholar] [CrossRef]
- Rezatofighi, H.; Tsoi, N.; Gwak, J.; Sadeghian, A.; Reid, I.; Savarese, S. Generalized intersection over union: A metric and a loss for bounding box regression. In Proceedings of the IEEE Computer Society Conference on Computer Vision and Pattern Recognition, Long Beach, CA, USA, 15–20 June 2019; pp. 658–666. [Google Scholar] [CrossRef]
- Tanasra, H. (n.d.). Hanantanasra/Buildings: Dataset and Results. Available online: https://github.com/hanantanasra/buildings (accessed on 29 May 2023).
- Buades, A.; Coll, B.; Morel, J.M. A review of image denoising algorithms, with a new one. Multiscale Model. Simul. 2005, 4, 490–530. [Google Scholar] [CrossRef]
- Median Filtering with Python and OpenCV|by Tony Flores|Medium. (n.d.). 2019. Available online: https://medium.com/@florestony5454/median-filtering-with-python-and-opencv-2bce390be0d1 (accessed on 13 July 2023).
Figure 1.
Research technique stages.
Figure 1.
Research technique stages.
Figure 2.
Proposed workflow, from raw data to furnished room.
Figure 2.
Proposed workflow, from raw data to furnished room.
Figure 3.
Main components of the plugin.
Figure 3.
Main components of the plugin.
Figure 4.
Pipeline: The importing of multiple types of drawings for generating COCO JSON.
Figure 4.
Pipeline: The importing of multiple types of drawings for generating COCO JSON.
Figure 6.
Detected residential categories, introduced with label colors.
Figure 6.
Detected residential categories, introduced with label colors.
Figure 7.
Ground-truth images centered on 256 × 256 canvas. Left: with furniture; Right: with doors or windows, if found.
Figure 7.
Ground-truth images centered on 256 × 256 canvas. Left: with furniture; Right: with doors or windows, if found.
Figure 8.
Sample of the created residential label-mapped dataset.
Figure 8.
Sample of the created residential label-mapped dataset.
Figure 9.
Results after applying the denoising filter. Left: prior to denoising; Right: after denoising.
Figure 9.
Results after applying the denoising filter. Left: prior to denoising; Right: after denoising.
Figure 10.
Detecting bounding boxes based on category color range. Left: color label; Right: example of shower with blue-range color-detection bounding box.
Figure 10.
Detecting bounding boxes based on category color range. Left: color label; Right: example of shower with blue-range color-detection bounding box.
Figure 11.
Creating new images with filled bounding boxes. Left: generated image via the models; Right: image after creating new bounding boxes.
Figure 11.
Creating new images with filled bounding boxes. Left: generated image via the models; Right: image after creating new bounding boxes.
Figure 12.
Samples of problematic results due to detection of multiple bounding boxes (in yellow).
Figure 12.
Samples of problematic results due to detection of multiple bounding boxes (in yellow).
Figure 14.
Samples of pix2pix models with diverse results.
Figure 14.
Samples of pix2pix models with diverse results.
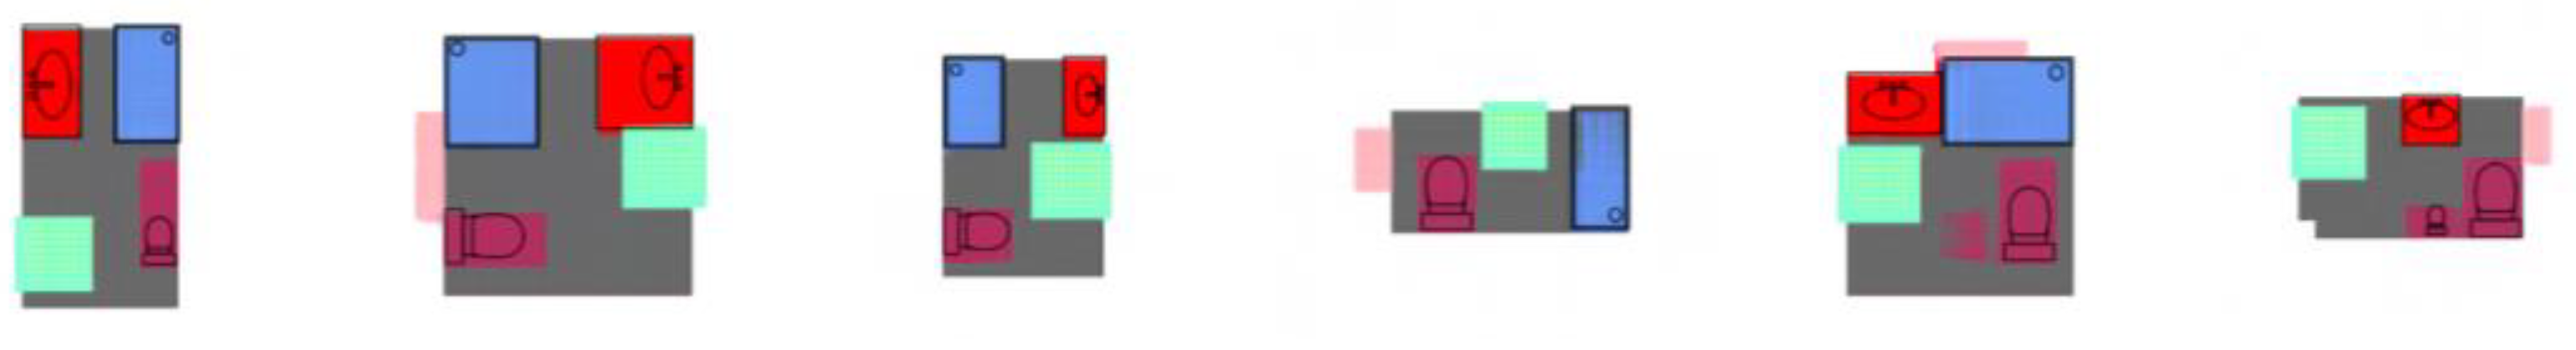
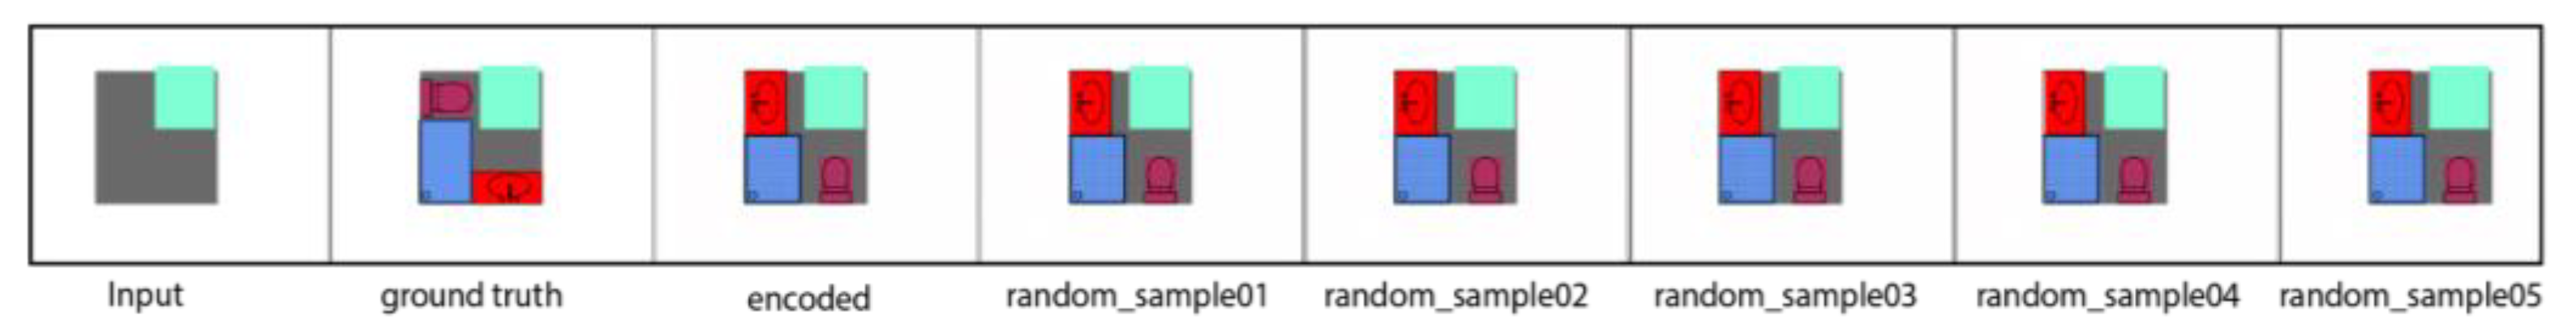
Figure 15.
Multiple results of bicycleGAN for one input.
Figure 15.
Multiple results of bicycleGAN for one input.
Figure 16.
The results of SPADE versions. Left: examples of SPADE-RGB results. Right: examples of SPADE-OneHot results.
Figure 16.
The results of SPADE versions. Left: examples of SPADE-RGB results. Right: examples of SPADE-OneHot results.
Figure 17.
Example of generated image vs. ground truth.
Figure 17.
Example of generated image vs. ground truth.
Table 1.
Threshold range of values in pixels for the sink, toilet, and shower.
Table 1.
Threshold range of values in pixels for the sink, toilet, and shower.
| Parameter | Toilet (pix) | Sink (pix) | Shower (pix) |
|---|
| Min area | 200 | 250 | 1000 |
| Max area | 2800 | 2600 | 7000 |
| Min short length | 10 | 10 | 15 |
| Max short length | 50 | 40 | 75 |
| Min long length | 15 | 15 | 45 |
| Max long length | 70 | 120 | 110 |
Table 2.
Object detection results of pix2pix and BicycleGAN models.
Table 2.
Object detection results of pix2pix and BicycleGAN models.
| Model | Test | Toilet IOU | Toilet
Precision | Toilet Recall | Sink IOU | Sink
Precision | Sink
Recall | Shower IOU | Shower
Precision | Shower Recall |
|---|
| | no-filter | 0.09 | 0.143 | 0.147 | 0.091 | 0.165 | 0.167 | 0.047 | 0.196 | 0.267 |
| Pix2pix | strict filter | 0.037 | 0.06 | 0.062 | 0.081 | 0.145 | 0.147 | 0.006 | 0.012 | 0.023 |
| | soft filter | 0.037 | 0.06 | 0.062 | 0.081 | 0.145 | 0.147 | 0.01 | 0.019 | 0.039 |
| | no-filter | 0.169 | 0.31 | 0.304 | 0.178 | 0.295 | 0.295 | 0.091 | 0.325 | 0.497 |
| BicycleGAN | strict filter | 0.113 | 0.202 | 0.217 | 0.178 | 0.291 | 0.291 | 0.009 | 0.012 | 0.023 |
| | soft filter | 0.113 | 0.202 | 0.217 | 0.178 | 0.291 | 0.291 | 0.009 | 0.014 | 0.027 |
Table 3.
Comparison between mean scores of the two models in object detection metrics.
Table 3.
Comparison between mean scores of the two models in object detection metrics.
| Test | IOU
(P2P) | IOU
(BicycleGAN) | Precision
(P2P) | Precision
(BicycleGAN) | Recall
(P2P) | Recall
(BicycleGAN) |
|---|
| No-filter | 0.075 | 0.146 | 0.167 | 0.31 | 0.193 | 0.365 |
| Strict filter | 0.041 | 0.1 | 0.072 | 0.168 | 0.078 | 0.177 |
| Soft filter | 0.042 | 0.1 | 0.075 | 0.169 | 0.083 | 0.178 |
Table 4.
KID and FID results on BicycleGAN and pix2pix models.
Table 4.
KID and FID results on BicycleGAN and pix2pix models.
| Test | FID
(P2P) | FID
(BicycleGAN) | KID
(P2P) | KID
(BicycleGAN) |
|---|
| Original generated images | 184.091 | 167.385 | 0.1454 | 0.1296 |
| denoised images | 193.348 | 162.594 | 0.1713 | 0.1308 |
| Images with filled bounding boxes | 140.740 | 108.868 | 0.0860 | 0.0613 |
Table 5.
Parameter testing after applying Filter 1 (the strict filter).
Table 5.
Parameter testing after applying Filter 1 (the strict filter).
| Test | Pix2pix | BicycleGAN |
|---|
| Area ratio | 0.209 | 0.339 |
| Center distance | 0.258 | 0.389 |
| Furniture object properties | 0.47 | 0.48 |
| Disclaimer/Publisher’s Note: The statements, opinions and data contained in all publications are solely those of the individual author(s) and contributor(s) and not of MDPI and/or the editor(s). MDPI and/or the editor(s) disclaim responsibility for any injury to people or property resulting from any ideas, methods, instructions or products referred to in the content. |
© 2023 by the authors. Licensee MDPI, Basel, Switzerland. This article is an open access article distributed under the terms and conditions of the Creative Commons Attribution (CC BY) license (https://creativecommons.org/licenses/by/4.0/).


