Abstract
During the installation process of prefabricated components, deviations in dimensions and installation positions can occur due to construction quality issues, and the accumulation of these deviations can impact the reliability of component installation. However, the current approach to addressing accumulated deviations in the component installation process primarily relies on the trial-and-error method, lacking a solid theoretical foundation. This paper introduces the dimensional chain theory derived from mechanical engineering and presents a method to evaluate the installation reliability of prefabricated components in concrete structures. First, based on extensive measurements of installation deviations, it was found that the installation deviations of components followed a log-normal distribution. By analyzing the relationship between installation deviations and the acceptance rate, it was determined that for a 90% acceptance rate, the installation position deviation should be 8.6 mm for prefabricated wall panel components and 7.3 mm for prefabricated column components. Subsequently, the concept of dimensional chain theory from mechanical engineering was introduced to establish a limit state equation for quantifying the installation reliability of prefabricated components in concrete structures. By applying this theory, appropriate component fabrication dimensions could be determined to achieve a 95% level of installation reliability. Finally, by using the Monte Carlo method to solve the installation limit state equation for an actual engineering project, recommended fabrication dimensions for the components were obtained. The results indicate that within the horizontal axis, the length deviation of prefabricated beams, and the width fabrication dimension of columns needed to be reduced by 2.3 mm to 2.9 mm. Within the vertical axis, the length dimension of columns and the height dimension of beams had to be reduced by 0.9 mm to 2.2 mm to achieve a 95% level of installation reliability.
1. Introduction
The development of prefabricated buildings has gained significant momentum in the construction industry, offering numerous advantages and driving the advancement of building industrialization [1]. Prefabricated buildings involve the off-site manufacturing of primary structural components, followed by their transportation and assembly at the construction site [2]. This construction approach offers notable benefits, including reduced construction time, enhanced architectural design possibilities, and improved construction quality [3,4]. Consequently, prefabricated buildings have witnessed widespread adoption and acceptance worldwide.
Prefabricated construction involves the premanufacturing of components in factory settings, followed by individual dimensional inspections. Previous research conducted by Burgess [5] has demonstrated the inherent presence of dimensional deviations in these components, highlighting their inevitable nature. However, the phenomenon of accumulated errors in component assembly is often not taken into account [6]. Even if the dimensions of each component meet the prescribed requirements, issues such as excessive accumulation of joints and deviations in component installation positions can still arise during the actual assembly process. If these dimensions exceed the allowable tolerance range, it can adversely affect the installation’s effectiveness and quality [7]. Oversized or undersized installation dimensions can result in excessive or insufficient gaps between components, leading to loose installations or compromised stability, thereby impacting the overall strength and stability of the building structure. Moreover, uneven or excessive gaps between components can also affect the aesthetic appearance of the building, as shown in Figure 1.
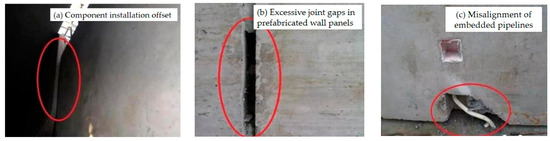
Figure 1.
The impact of installation deviations in prefabricated components.
The on-site component assembly process becomes a crucial step for adjusting installation tolerances [8]. Traditional methods for addressing the impact of cumulative deviations in conventional construction processes include stick-built construction [9] and trial-and-error methods [10]. Stick-built construction refers to on-site trimming of components to fit the installation, but it is less suitable for concrete structures. Trial-and-error methods involve time-consuming adjustments of component positions, without fundamentally resolving the issue of cumulative deviations [11], and there is still a risk of rework [12]. Some scholars [13,14] have addressed the impact of accumulated deviations by exchanging the sequencing of interchangeable components. By altering the installation sequence and utilizing surface-adjacency relationships, they have achieved assembly sequence planning for prefabricated buildings. However, these methods require the presence of adjacent surfaces between two components and are not suitable for installations that involve components requiring joints. Therefore, it is necessary to research solutions for addressing cumulative deviations during the installation phase.
In this study, a comprehensive statistical analysis was conducted on the installation-axis deviations of a large number of prefabricated components. The primary objective was to investigate and understand the distribution characteristics of axis-size deviations across various components. Subsequently, the tolerance values for axis-size deviations were optimized to achieve a desired target with a 90% probability. To enhance the precision and accuracy of assembly in the field of prefabricated constructions, the dimensional chain theory was introduced. During the detailed design phase of prefabricated components, this theory was applied to the tolerance analysis process of prefabricated buildings. By considering the distribution of dimensional deviations that occur during the manufacturing process, an effective installation process was established. By incorporating the dimensional chain theory and addressing the manufacturing-related deviations, the research contributes to improving the overall reliability and quality of prefabricated construction, providing practical guidance for assembly reliability in the field.
2. Dimensional Tolerance Control of Components during Construction and Installation Stage
The prefabricated building standard limits the allowable tolerance of dimensions during construction and installation. The allowable tolerance standards for the installation dimensions of the more classic prefabricated building components abroad are MNL-135-00 [15] and ACI 117-2010 [16]. Table 1 shows the allowable tolerances for the installation dimensions of prefabricated components.

Table 1.
Specification of permissible tolerances (unit: mm) for installation dimensions of prefabricated components.
From Table 1, it can be seen that there are similarities and differences in the allowable tolerance requirements for the installation dimensions of prefabricated components between the two. The allowable deviation tolerance for various types of prefabricated components from the axis is equal (±13 mm). However, the allowable tolerance values and tolerance allocation forms for installation dimensions, such as component elevation, verticality, joint width, and shelving length, are different. Compared with MNL-135-00, the elevation of components in ACI 117-2010 adopts a tolerance distribution form with varying positive and negative allowable values, and the tolerance range is required to be moderate. The verticality allows for an increase in the tolerance range, but the shelving length allows for a smaller tolerance value.
Compared with MNL-135-00 and ACI 117-2010, DIN18202-1997 [17] adopts the principles of rough classification of component types and attention to component dimensions. Table 2 shows the allowable tolerances for the installation dimensions of corresponding components. According to Table 2, DIN 18202-1997 focuses on analyzing the influence of component size on allowable installation tolerances and divides the installation size allowable tolerances into six grades, possibly considering the cost-effectiveness of accuracy control and manufacturing processes. This standard does not provide detailed classification of component types but simply categorizes them into two types: linear components (beams and columns) and planar components (walls and slabs).
Table 2.
Allowable Installation Tolerances in DIN18202-1997 (unit: mm).
The current national standards, industry regulations, and local specifications in China emphasize the classification of component types and categories when it comes to the requirements for allowable tolerances of component installation sizes. They also take into consideration the size of the components. Examples of such standards include GB/T 50204-2015 [18], GB/T 51231-2016 [19], and JGJ 1-2014 [20]. Table 3 presents the corresponding allowable tolerances for installation sizes of prefabricated components.
Table 3.
Allowable Installation Tolerances for Prefabricated Components in Chinese Standards and Specifications (unit: mm).
From Table 3, it can be observed that there are differences in the requirements for allowable installation dimensional deviations among the standards, mainly in terms of component type classification, tolerance allocation format, allowable tolerance values, and ranges. GB/T 51231-2016 and GB/T 50204-2015 have similar requirements for allowable installation dimension tolerances, with the difference lying in the inclusion of different types of components. JGJ 1-2014 has relatively looser requirements for allowable installation dimension tolerances, particularly in terms of axis position and verticality. Some of the allowable installation dimensional deviations for certain components are the same as the national standards, such as elevation, resting length, and joint width.
Currently, research on the production, construction, and installation tolerances of prefabricated concrete structures is insufficient both domestically and internationally. There is a lack of comprehensive theoretical frameworks that integrate the production of prefabricated components with installation construction, and tolerance thresholds in prefabricated construction standards generally rely on empirical experience rather than theoretical foundations [21].
3. The Measurement of Fabrication and Installation Deviations of Prefabricated Components
3.1. The Measurement of Dimensional Deviations in Prefabricated Components
In recent years, three-dimensional (3D) photogrammetry has gained popularity due to its ability to rapidly and precisely acquire range-measurement data [22,23]. Due to these benefits, three-dimensional photogrammetry has been applied in the evaluation of the quality of civil structures. The 3D laser photogrammetry technology represents a novel measurement technique, considering its vision and reverse engineering characteristics [24].
Our research team utilized 3D photogrammetry techniques to measure the three-dimensional dimensional deviations of over 1800 assembled concrete components, as shown in Figure 2. By analyzing the variations in component dimensional deviations among different regions and factories, we established a dimensional deviation database and conducted fitting tests for distribution analysis. The geometric parameter distribution characteristics of typical assembled concrete components were obtained, and a mathematical distribution model along with its parameters for component dimensional deviations was proposed [21,25]. This serves as the foundation of the present study.
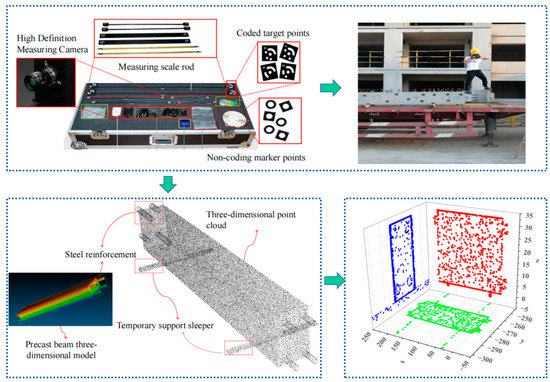
Figure 2.
The process of obtaining dimensions of prefabricated components through 3D photogrammetry.
3.2. The Measurement of Installation Deviations in Prefabricated Components
Currently, the standard method for measuring the axial deviation of prefabricated component installation is to first use a total station or theodolite to set up reference lines (20 lines or 30 lines) at a distance of 20 mm or 30 mm from the edge of the wall on site [26]. Subsequently, a tape measure is used to measure the distance from the wall edge to the reference lines multiple times. However, this method has major drawbacks, as it relies on the readings of a less accurate tape measure, resulting in less precise measurement results. Additionally, during the setting up of reference lines with a total station or theodolite, there can be errors introduced due to the manual popping of the reference lines, leading to cumulative inaccuracies in the measurements. Consequently, the traditional method of measuring the axial deviation of prefabricated wall panels further accumulates human errors, resulting in less accurate data with larger deviations. This can have a significant impact on the layout of prefabricated components and the installation accuracy of prefabricated buildings. In this study, we employed a measurement method for the axial deviation (as shown in Figure 3 and Figure 4) of prefabricated component installation based on a total station [25], as proposed by our research team. The measurement of the installation deviations of prefabricated components was conducted on site, as shown in Figure 5.
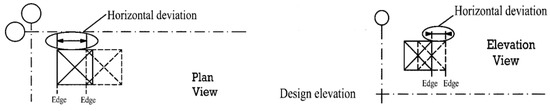
Figure 3.
The horizontal deviation.
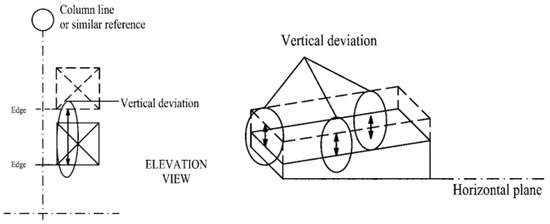
Figure 4.
The vertical deviation.
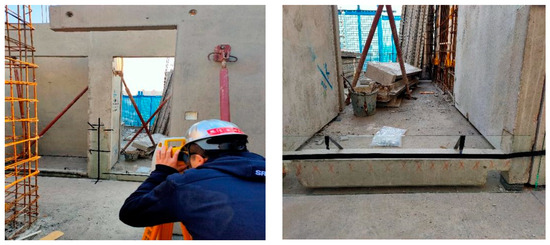
Figure 5.
The three-dimensional photographic measuring instrument.
4. Mathematical Distribution Characteristics of Installation Deviations in Prefabricated Concrete Components
4.1. Distribution Characteristics of Component Installation Position Deviations
A total of 166 samples of wall panel installation axis deviations were divided into 20 groups. A histogram was plotted with the deviation values on the horizontal axis and the observed frequencies on the vertical axis (Figure 6). The installation deviations of prefabricated wall panels were mainly distributed between 0 mm and 10 mm, with the highest frequency observed around 1.8 mm to 2.3 mm. The maximum installation deviation was 18.45 mm, and the minimum installation deviation was −1.31 mm. The histogram displayed a unimodal shape, indicating the presence of a single peak. The peak corresponded to the maximum value of the probability density function, with the frequency of deviations increasing rapidly as the deviation values increased, reaching the peak and then decreasing rapidly towards zero. The fitted curve closely followed the probability density function of the log-normal distribution. By taking the logarithm of the axis position deviations and plotting a histogram (Figure 7), it was observed that the variables at the ends had fewer occurrences, while the variables in the middle had a higher frequency of distribution, exhibiting a bell-shaped distribution. This preliminary analysis suggests that the axis installation deviations of wall panels follow a log-normal distribution.
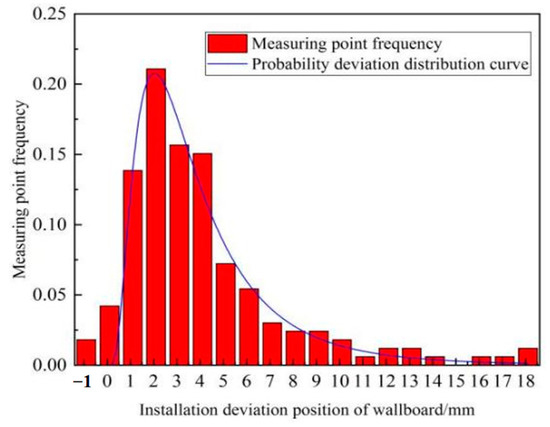
Figure 6.
Fitted curve for the axis position deviations of wall panels.
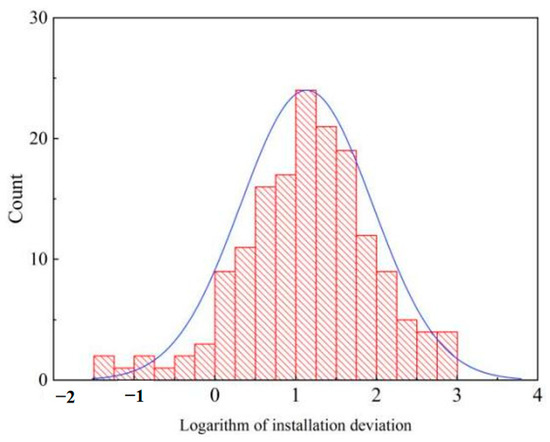
Figure 7.
Logarithmic frequency distribution of axis deviations of wall panels.
Logarithmic frequency distribution of axis deviation values of columns is obtained from a sample of 205. The data are divided into 20 groups, with axis deviation values on the x-axis and observed frequency on the y-axis. The histogram, shown in Figure 8, illustrates that the observed axis deviations of prefabricated columns are predominantly distributed between 0 and 12 mm. The highest frequency of measurement points for column axis deviations is found around 3.0–3.2 mm. The maximum measured installation deviation for column components is 11.61 mm, while the minimum is 0.18 mm. The histogram exhibits a unimodal shape, indicating a prominent peak at the maximum of the probability density function. As the deviation values increase, the frequency of deviations rapidly increases until reaching the peak, and subsequently decreases rapidly towards zero. The fitted curve generally follows the probability density function of a log-normal distribution. Taking the logarithm of the column axis deviation values and plotting the histogram, as shown in Figure 9, reveals a distribution pattern similar to a bell curve. Variable values closer to the ends have fewer occurrences, while those in the middle have a higher frequency. This preliminary analysis suggests that the axis deviations of columns conform to a log-normal distribution.
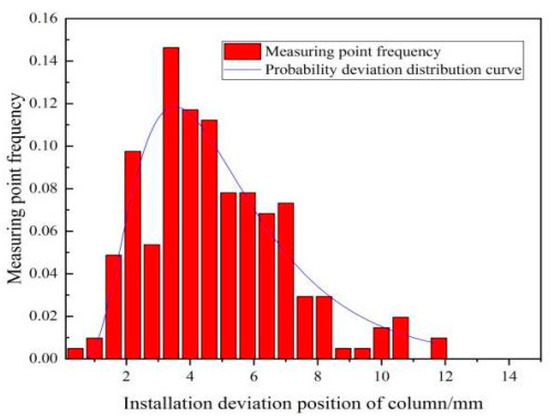
Figure 8.
Fitted curve for the axis deviation of columns.
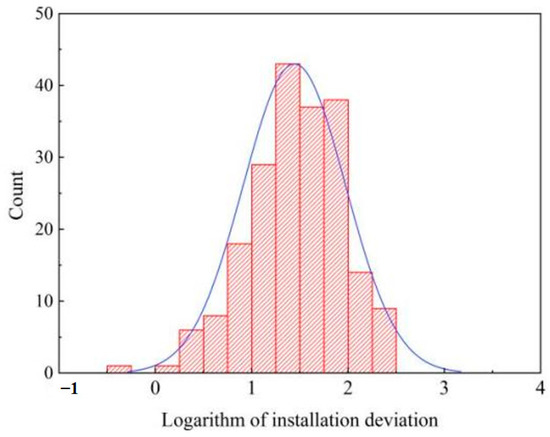
Figure 9.
Logarithmic frequency distribution of axis deviation for columns.
4.2. Testing the Distribution of Component Installation Deviations
The Q–Q plot test is a method used to assess whether sample data follow a normal distribution [27]. It involves plotting the quantiles of the sample data against the corresponding quantiles of a normal distribution and analyzing the scatter plot. If the studied random variable follows a normal distribution, the scatter plot should roughly exhibit a linear trend around the first-quadrant diagonal line. By observing the distribution patterns of the scatter plots in Figure 10 and Figure 11, it can be concluded that the installation deviations of wall panels and column components generally form a line around the first-quadrant diagonal line, indicating a logarithmic normal distribution of the deviations.
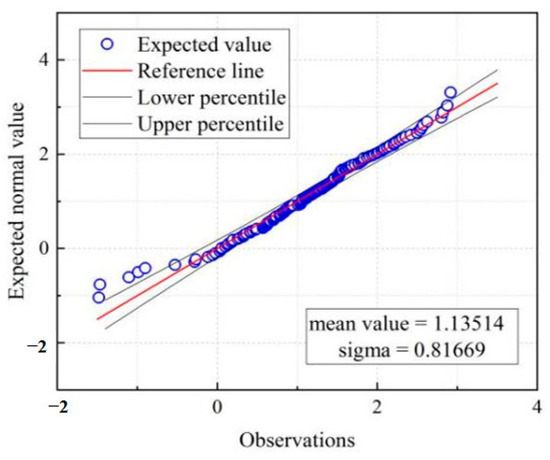
Figure 10.
A Q–Q plot of the logarithm of the wall panels centerline deviation.
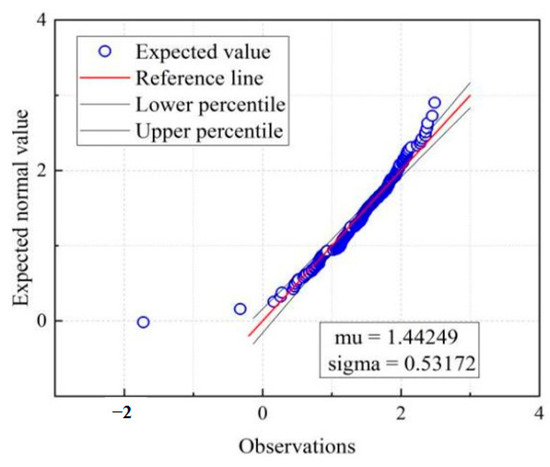
Figure 11.
A Q–Q plot of logarithm of column centerline deviation.
According to the principles of probability theory and mathematical statistics, if the logarithm of a random variable follows a normal distribution, then the random variable itself follows a log-normal distribution [28]. Table 4 presents the results of the log-normal model test for the installation deviations of wall panels and columns. The model for wall panel installation axis deviation was tested using statistical analysis, and if the ratio of the regression mean square to the residual mean square (F-value) is greater than 1, it indicates that the differences between group means are statistically significant [29]. The calculated F-value for wall panel installation axis deviation is 92.331, with a goodness of fit (R-squared) of 0.968. For column installation axis deviation, the F-value is 80.122, with a goodness of fit of 0.891. The high goodness of fit values indicate that the established log-normal models are reasonable for describing the distribution of component installation axis deviations.
Table 4.
The Log-normal Model Test for the Distribution of Installation Deviation.
For x > 0, the probability distribution function of the log-normal distribution is Equation (1) [30]. Table 5 presents the parameter estimation and validation of the log-normal model for the distribution of component installation position deviation. It provides the basic parameter values of the log-normal distribution function for the installation deviations:
Table 5.
Parameter Estimation and Validation of Log-normal Model for Installation Deviation Distribution.
4.3. Installation Position Tolerance Based on Qualification Rate
According to the “Technical Specification for Prefabricated Concrete Structures” (JGJ1-2014), the tolerance limit for installation position deviation of prefabricated wall panels is 8 mm. There were a total of 19 measurement points where the deviation exceeded the tolerance limit specified in the “Technical Specification”. The qualification rate for installation position deviation of prefabricated wall panels was 88.6%. For prefabricated columns, the tolerance limit for installation position deviation is also 8 mm. There were a total of 16 measurement points where the deviation exceeded the tolerance limit specified in the “Technical Specification”. The qualification rate for installation position deviation of prefabricated columns was 92.2%. The statistics for installation position deviation are shown in Table 6.
Table 6.
Installation position deviation statistics.
Table 7 presents the qualification rates for the installation position of prefabricated wall panels and columns under different allowable deviations. Based on the data, the qualification rates for axial position deviation of prefabricated walls and columns can be obtained. When the axial position deviation of wall panels is set at 6 mm, the measured qualification rate approaches 80%. Similarly, when the axial position deviation is set at 9 mm, the measured qualification rate approaches 90%. For columns, when the axial position deviation is set at 7 mm, the measured qualification rate approaches 85%. Additionally, when the axial position deviation is set at 9 mm, the measured qualification rate approaches 95%.
Table 7.
Qualification rates of axial position deviation for prefabricated wall panels and columns under different allowable deviations.
The relationship between the allowable deviation and qualification rate can be fitted for the axial position deviation of wall panels using Equation (2), and for the axial position deviation of columns using Equation (3), where x represents the allowable deviation value and y represents the corresponding qualification rate. The fitted curves are shown in Figure 12 for wall panels and Figure 13 for columns. By solving Equations (2) and (3), the corresponding allowable deviations for a qualification rate of 80% and 90% for wall panels are found to be 5.8 mm and 8.6 mm, respectively. Similarly, for columns, the corresponding allowable deviations for a qualification rate of 80% and 90% are found to be 6.6 mm and 7.3 mm, respectively:
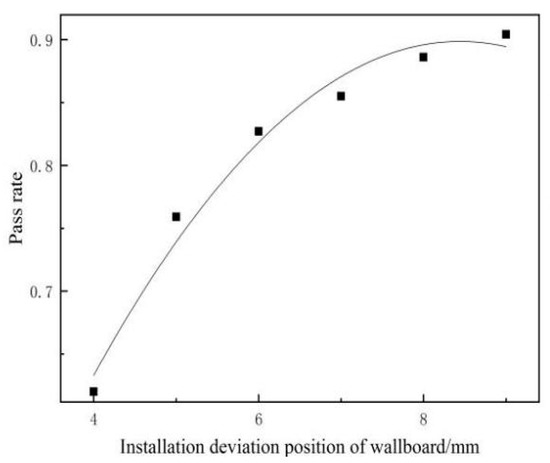
Figure 12.
The fitted curve for qualification rate of axial position deviation—wall panels.
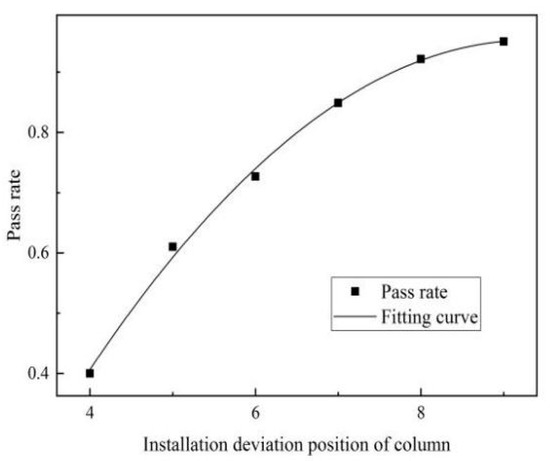
Figure 13.
The fitted curve for qualification rate of axial position deviation—columns.
5. The Tolerance Analysis Method for Dimensional Chain of Prefabricated Component Installation
5.1. The Dimensional Chain Theory
The dimensional chain theory was originally widely applied in the field of mechanical engineering [31]. In the process of mechanical manufacturing, assembly accuracy is regarded as one of the important indicators for assessing product quality. Determining the dimension range or basic dimensions of components requires considering requirements from aspects such as process, inspection, and performance. A dimensional chain is a closed combination of related dimensions formed by a series of interconnected dimensions in a specific sequence. These dimensions directly impact the dimensional range or basic dimensions of the components. If the closed loop and constituent loop are represented as functions, with the closed loop as the dependent variable and the constituent loop as the independent variable, the functional expression of the dimensional chain is given by Equation (4) [32]:
In the context of the present study, the term ‘incremental loop’ is used to describe a situation in which the closed loop in the dimensional chain exhibits consistent changes in the same direction when any constituent loop undergoes a variation. Conversely, the term ‘decremental loop’ refers to a scenario in which the closed loop in the dimensional chain exhibits inverse changes when any constituent loop undergoes a variation. The transfer coefficient, denoted as , serves as a measure of the degree to which variations in the constituent loop affect the closed loop in the dimensional chain and is commonly referred to as the transfer ratio. The expression for the transfer coefficient can be derived through the total differential operation applied to the functional expression of the dimensional chain, as illustrated in Equation (5) [33]:
The partial derivatives , , and in Equation (5) denote the ratio between the infinitesimal increment resulting from the variation of the constituent loop and the infinitesimal increment of the constituent loop itself. These derivatives represent the extent to which the constituent loop variation affects the closed loop in the dimensional chain. Consequently, the transfer ratio can be expressed using Equation (6):
In the case of incremental loops, the coefficient takes on a positive value, while for decremental loops, the coefficient assumes a negative value.
5.2. The Efficient Assembly Dimensional Chain Theory for Prefabricated Components
During the installation of prefabricated components, the issue of the dimensional chain can be understood as the closed loop formed by the cumulative dimensional deviations within the component axis, while the component’s own dimensional deviations form the constituent loops within the dimensional chain. Each component’s dimensional deviation affects the installation error of the subsequent component, thereby leading to installation errors in the following components. The dimensional chain relationship can be seen as the comprehensive integration and accumulation of errors from each constituent loop. Hence, it is feasible to determine appropriate component fabrication dimensions by establishing a dimensional chain in the installation process of prefabricated components.
Assuming there are n components to be assembled within the axis, with a closed loop, A0, representing the assembly joint, the n components form the constituent loops and are numbered according to the assembly sequence. Let the dimensions of the n constituent loops be A1, A2, A3, …, An. As there exists a certain functional relationship between the closed loop and the constituent loops:
In Equation (7), each variable is mutually independent and generates small increments within specific intervals. The cumulative sum of these small increments represents the tolerance of the closed loop. Let represent the small increments of each constituent loop and represent the cumulative increment of the closed loop. Thus, Equation (7) can be rewritten as:
After multiple differentiations of the above equation and expanding it using a Taylor series, the higher-order terms tend to become infinitesimal and can be neglected. Therefore, the first-order differential equation is represented by Equation (9):
Substituting Equation (8) into Equation (9) and eliminating A0 can obtain a simplified expression:
represents the transmission ratio of the assembly forming the loop, and Equation (10) is the general formula for calculating the dimensional tolerance of prefabricated components.
In practical engineering, due to the non-normal distribution of positional deviations in the installation axis, direct calculation of the cumulative distribution function for the component assembly forming the loop using the formula is not feasible. Instead, the dimensional chain theory can be employed to analyze and compute the cumulative probability function of the characteristic dimensions of all components within the installation axis of prefabricated concrete structures. This function represents the composition loop, with the size probability density function between the axes forming a closed loop. The dimensional chain equation is thus solved accordingly. If the difference between the axis size and the characteristic dimension of the component is negative, the installation is deemed unreliable. Conversely, if the difference is positive, the installation is considered reliable. Taking into account the reasonable range of joint width between components, an appropriate installation width can be allocated during component assembly to ensure that the cumulative tolerance of the component installation remains within the specified limits, given the current level of reliability. The reliability of prefabricated component assembly refers to its capacity to meet the predetermined installation requirements under specified dimensional conditions. Ultimately, the reliability of component installation serves as a measure of the degree of fit in the assembly. When it decreases or exceeds the threshold of joint width, the installation of the component can be deemed to have failed.
5.3. The Monte Carlo-Based Solution for Determining the Dimensional Chain of Component Installation
In architectural modular coordination, the characteristic dimension of prefabricated components refers to the dimensions that conform to the modular sequence and are used to indicate the distances between building reference lines or datum planes. The fabrication dimension of prefabricated components is determined considering the influence of node interfaces (joints) on the characteristic dimensions [34]. It is related to the characteristic dimension of the prefabricated component. The actual dimension of the prefabricated component refers to the measured dimensions obtained after fabrication, including unavoidable fabrication deviations during the production process. The dimensions of the node interfaces should be coordinated with the fabrication tolerances of the prefabricated components to achieve dimensional fit and coordination among the components. In architectural design drawings, the selection, control, and annotation of component dimensions should use the characteristic dimensions, which involve the selection and combination of components. In detailed drawings for the production and assembly of prefabricated components, the fabrication dimensions should be used. The relationship between the fabrication dimensions and the characteristic dimensions of prefabricated components is shown in Figure 14.
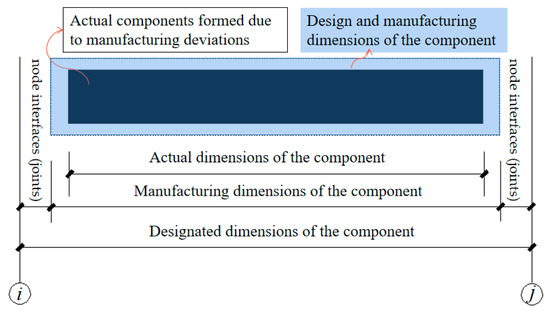
Figure 14.
The manufacturing dimensions and designated dimensions of prefabricated components.
The dimensions of prefabricated components are random variables obtained during the factory production process, based on the basic dimensions within the tolerance range and following a certain distribution pattern. Therefore, the determination of the dimensional chain of component installation is also a random variable. The Monte Carlo simulation method is suitable for nonlinear expressions of assembly functions. By using the Monte Carlo method, the dimensions and tolerances of the closed loop of the dimensional chain can be solved. Combined with the principles of probability theory and mathematical statistics, the results obtained under certain conditions will better align with the actual situation.
Let represent the joint probability density function of the composite loops R and S, as derived from principles of probability theory [35]:
The probability of structural installation failure can be expressed by Equation (12):
In Equation (12), represents the joint probability density function of n basic random variables.
The solution of Equation (12) requires intricate mathematical computations, particularly when the distribution of the random variable, , is complex or when there is a high number of random variables involved. Performing precise calculations in such scenarios becomes exceedingly challenging. The relationship between the reliability of the structural installation, denoted as , and the corresponding failure probability, denoted as , can be expressed as follows:
In function , assuming that random variables and are mutually independent, the installation dimensional chain equation is denoted as . Based on probability theory, it follows that:
By converting the normal distribution, Z, in function to the t-distribution following the standard normal distribution [36]:
where represents the standard normal distribution function; we introduce the symbol and define it as:
is defined as the installation reliability index, and its relationship with the installation reliability is given by:
The installation failure probability of the structure is expressed as:
In the equation, represents a vector of random variables with dimensionality n, and is the joint probability density function of the basic random variables. When X is a set of mutually independent random variables, have . is a set of limit state functions for the structure, and when is satisfied, it indicates structural failure. Therefore, the Monte Carlo method can be expressed as:
In Equation (19), N denotes the total number of random sampling simulations, and when is satisfied, the indicator function g represents structural failure.
By using the measured dimensions of assembled components and joint dimensions as the composition loop, and the designated dimensions (dimensions between axes) as the closed loop, the tolerance of the component joints can be obtained by solving the dimensional chain equation. This enables the provision of suitable installation width during component assembly, ensuring the cumulative tolerance of the component installation meets the acceptance criteria under the current conditions.
5.4. Principles of Optimal Solution for Dimensional Chain Optimization
Due to the stochastic nature of geometric parameters during the construction process, the dimensions of assembly components in prefabricated construction also exhibit randomness. As a result, the dimensions of joints in the assembly process of prefabricated components are also stochastic. Taking the dimensional chain of wall panel installation within a certain axis as an example, as shown in Figure 15.
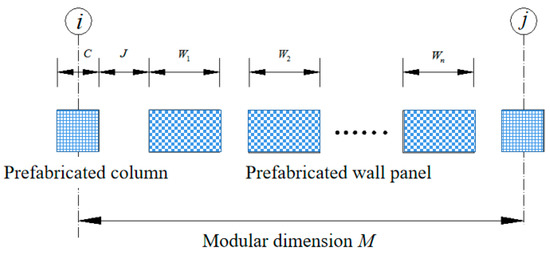
Figure 15.
The assembly component installation dimensional chain system.
The dimensional tolerances of components along the axis can be absorbed at the joints, where modular dimensions serve as additive loops in the dimensional chain, while the remaining dimensions serve as subtractive loops in the dimensional chain. According to the dimensional chain theory, the installation equilibrium equation for wall panel components can be expressed as Equation (20):
Due to the fixed value of the modular dimension, as indicated by Equation (20), the optimization of the dimensional chain can be determined through extremum values at the joints. When the joint is minimized, the dimensions of the components are maximized, and conversely, when the joint is maximized, the dimensions of the components are minimized.
According to the provisions of European standard Fib 74, the joint width of external wall components under normal conditions should be between 8 mm and 30 mm. Additionally, for different widths of components, Table 8 provides the corresponding sealing materials and recommended thickness values. Moreover, in the Japanese standard JASS8, the maximum and minimum values of joint width are specified based on the type of sealing material used. For instance, when using acrylic-based sealant, the minimum joint width requirement is 10 mm and the maximum joint width is 20 mm, with a tolerance of 10 mm. For other types of joints, the minimum joint width is 10 mm and the maximum joint width is 40 mm, with a tolerance of 30 mm.
Table 8.
The Recommended Joint Width and Thickness according to the Fib 74 Standard.
According to the “Technical Specification for Prefabricated Concrete Structures” (JGJ 1-2014) and the “Technical Standard for Prefabricated Concrete Buildings” (GB/T 51231-2016), the determination of joint width should take into account factors such as inter-story displacement of the main structure, deformability of sealing materials, construction errors, and deformations caused by temperature differentials. Specifically, according to JGJ 1-2014, the joint width should not be less than 15 mm, while according to GB/T 51231-2016, the width of panel joints should be determined based on the calculation results, but it should not be less than 10 mm.
In this paper, when selecting the joint dimensions, it is necessary to consider that the joints between prefabricated concrete components must be wide enough to accommodate the thermal expansion of sealing materials and meet the installation requirements of appropriate sealants. When the joint is too narrow, the joint sealant may experience bonding or tensile failure, and adjacent prefabricated components may come into contact and be subjected to unexpected loads, deformation, cracking, and local crushing (spalling). Therefore, selecting a joint width of 10 mm to 20 mm as the optimization principle for the dimensional chain is recommended.
6. Example of Dimensional Tolerance Calculation in Prefabricated Structures Based on Dimensional Chain Theory
6.1. Engineering Overview
Prefabricated frame structures offer advantages such as a large effective floor area and shorter construction duration, making them widely applied in public buildings such as residential, dormitory, and office buildings. Taking a kindergarten in Yiyang, Hunan Province as an example, as shown in Figure 16, the structure of this kindergarten adopts a prefabricated frame structure, with components manufactured by the Yunda Building Industry Co., Ltd (Yiyang, China). in a precast concrete component factory. The architectural plan has a rectangular shape, with a total height of 13.5 m, a span of 37.45 m, a depth of 27 m, and three floors with a height of 3500 mm each. The three-dimensional BIM model of the building is illustrated in Figure 17.
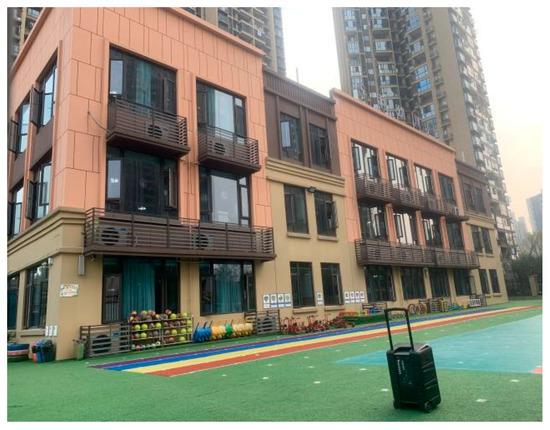
Figure 16.
A Three-Story Prefabricated Kindergarten Teaching Building.
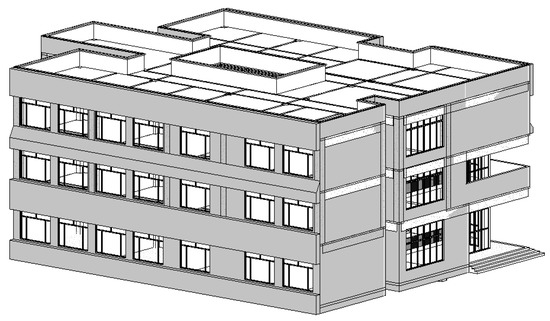
Figure 17.
BIM 3D Model.
6.2. Reliability of Component Installation within the Horizontal Axis
The installation of components along the horizontal axis of the third floor is chosen as the research focus. The schematic diagram of the dimensional chain for the installation of prefabricated beams and columns within the horizontal axis is shown in Figure 18. The project is an assembly-based integral frame structure, where the frame nodes are cast-in-place, and the prefabricated components are connected at the beam–column nodes through cast-in-place concrete. The total length of the dimensional chain between the two positioning axes during the assembly of beams and columns is denoted as . This dimensional chain consists of prefabricated columns with widths , and prefabricated beams with lengths ; the width of the joints is denoted as . The prefabricated beams and columns are connected at the junctions using reinforcement or anchoring, and then connected as a whole-frame structure through cast-in-place concrete. The dimensional chain for the horizontal dimensions of beams and columns is represented by Equation (21), where the length of the beams, the width of the columns, and the joints between the components form the composition rings of the dimensional chain, while the distances between the axes represent the closed loops in the dimensional chain. The sizes and probability distributions of each ring in the assembly dimensional chain are shown in Table 9:
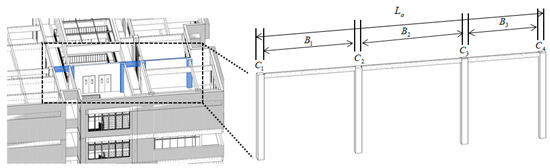
Figure 18.
A schematic diagram of the dimensions of prefabricated beams and columns.
Table 9.
The construction dimensions and probability distributions of each component ring (unit: mm).
When the joint seam width is set to its maximum value of 20 mm, the variability of the component dimensions becomes larger. By employing the Monte Carlo method, the distribution function of the axis dimensions can be obtained, considering the cumulative summation of the component production dimensions at the minimum joint seam width. This distribution is illustrated in Figure 19. When the cumulative dimensions are smaller than the axis dimensions, the installation is reliable. Conversely, when the cumulative dimensions are larger than the axis dimensions, the installation is unreliable, where the green portion represents the probability density function when the installation is reliable, and the red portion represents the probability density function when the installation is unreliable. If the cumulative dimensions of the components are smaller than the target design dimensions of the axis, it can be concluded that the component installation is reliable. Consequently, when the assembly is performed based on the design dimensions of the components, the assembly reliability is determined to be 83.6%.
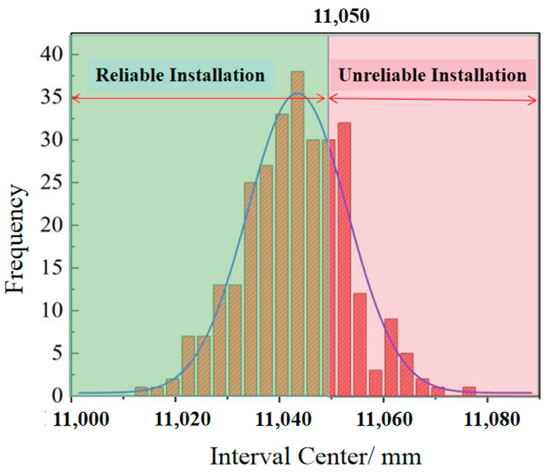
Figure 19.
A Histogram of Cumulative Sizes of Component Assemblies at Minimum Joint Width.
When the joint seam width is set to its minimum value of 10 mm, the variability of the corresponding component dimensions decreases. Utilizing the Monte Carlo method, the distribution function of the axis dimensions can be obtained by considering the cumulative summation of the component production dimensions at the minimum joint seam width. This distribution is illustrated in Figure 20. If the cumulative dimensions of the components are smaller than the target design dimensions of the axis, it can be concluded that the component installation is reliable. However, in this scenario, when the assembly is conducted based on the design dimensions of the components, the assembly reliability is determined to be 43.6%, indicating a relatively low level of assembly reliability.
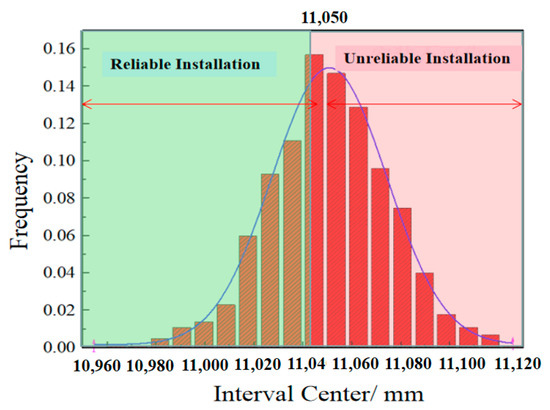
Figure 20.
A Histogram of Cumulative Sizes of Component Assemblies at Maximum Joint Width.
6.3. The Optimization of Prefabricated Component Manufacturing Sizes within the Horizontal Axis
Based on the installation dimension chain of prefabricated structures, to enhance the installation reliability, it is advisable to reduce the manufacturing sizes of prefabricated components within the horizontal axis. Figure 21 depicts a contour plot showing the installation reliability obtained by decreasing the sizes of beam and column components under different seam widths. As the component sizes decrease, the installation reliability increases. Under the same seam width condition, the slopes of beam length and column width deviations are approximately equal, indicating that they contribute almost equally to the installation reliability of components within the axis. When the seam width is set at 20 mm and the manufacturing sizes are reduced by 6 mm, the installation reliability reaches 100%. Similarly, with a seam width of 10 mm, a reduction of 7 mm in sizes results in a 100% installation reliability. Within the allowable range of seam widths, the manufacturing sizes of components should be reduced by 4.6 mm to 5.8 mm to achieve a 95% confidence level (as indicated by the shaded green region in the graph). In Figure 22, the contributions of beam length deviation and column width deviation to the installation reliability are approximately equal. Therefore, an even distribution of manufacturing size deviations is recommended, with a reduction of 2.3 mm to 2.9 mm in beam length deviation and column width deviation, respectively, to achieve a 95% installation reliability within the horizontal axis.
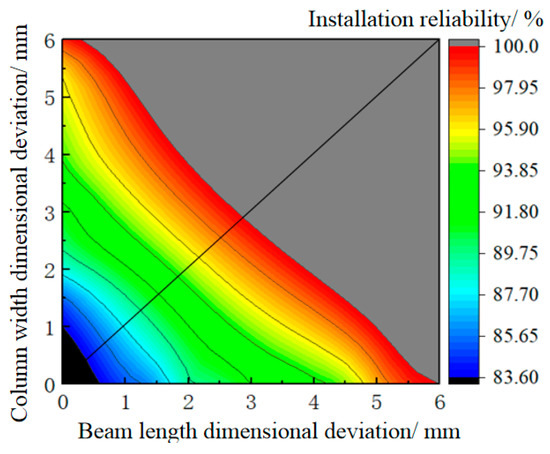
Figure 21.
Size deviations for different reliability levels at the minimum joint width.
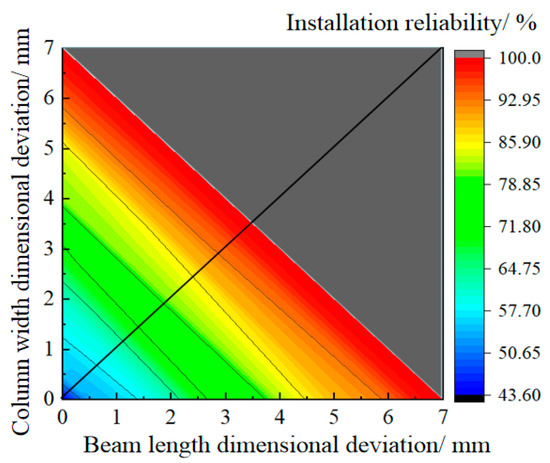
Figure 22.
Size deviations for different reliability levels at the maximum joint width.
Within the allowable range of joint width, the size deviations of the components should be reduced by 4.6 mm to 5.8 mm to achieve a reliability level of 95% (as indicated by the green shaded area in Figure 23). Both the size deviation of the beam length and the size deviation of the column width contribute, approximately equally, to the installation reliability. Therefore, the size deviations should be evenly distributed, with the beam length size deviation reduced by 2.3 mm to 2.9 mm and the column width size deviation reduced by 2.3 mm to 2.9 mm, in order to achieve a 95% installation reliability for the horizontal axis.
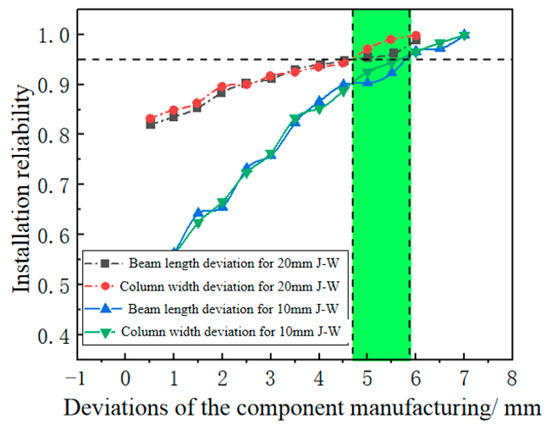
Figure 23.
The installation reliability for different manufacturing dimensional deviations.
6.4. Reliability of Component Installation within the Vertical Axis
The vertical axis component installation on the second floor is chosen as the research object. The schematic diagram of the beam–column vertical axis dimensions is shown in Figure 24. The dimensions between the positioning axis lines are denoted as . This dimensional chain consists of a prefabricated column with a length of and a prefabricated beam with a height of . The prefabricated beam and column are connected by reinforcement or anchoring at the joint, and they are further connected by cast-in-place concrete to form an integral framework. There are three joints between the components, and the length of the joints is denoted as . The vertical dimensions chain of the beam–column is described by Equation (22), where the beam height, column length, and the joints between the components form the constituent loops of the dimensional chain, and the distances between the axes represent the closed loops within the dimensional chain. The statistical distribution characteristics of the dimensional deviations of the components reveal the sizes and probability distributions of each loop in the assembly dimensional chain, as shown in Table 10.
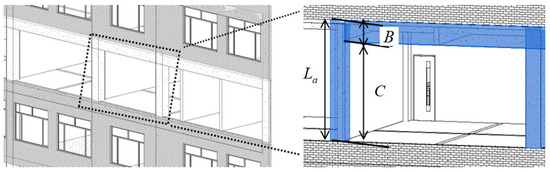
Figure 24.
The vertical axis component installation dimensional schematic.
Table 10.
The construction dimensions and probability distributions of each component ring (unit: mm).
When the maximum joint width is 20 mm, the larger the variable size of the components, the Monte Carlo method can be used to obtain the distribution function of the axis size when the joint width is at its minimum value, as shown in Figure 25. If the cumulative size of each component is smaller than the target size of the axis, the installation of the components can be considered reliable. When assembled according to the designed dimensions of the components, the assembly reliability is 88.4%.
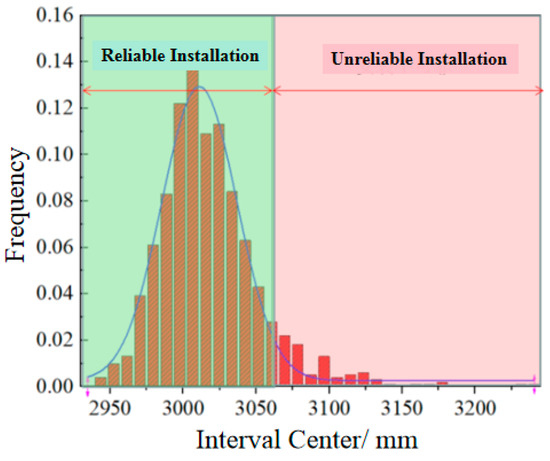
Figure 25.
Size deviations for different reliability levels at the minimum joint width.
When the minimum joint width is 10 mm, the corresponding variable size of the components is smaller. Using the Monte Carlo method, the distribution function of the axis size after superimposing the component production dimensions is obtained when the joint width is at its maximum value, as shown in Figure 26. If the cumulative size of each component is smaller than the target size of the axis, the installation of the components can be considered reliable. In this case, when assembled according to the designed dimensions of the components, the assembly reliability is 63.6%.
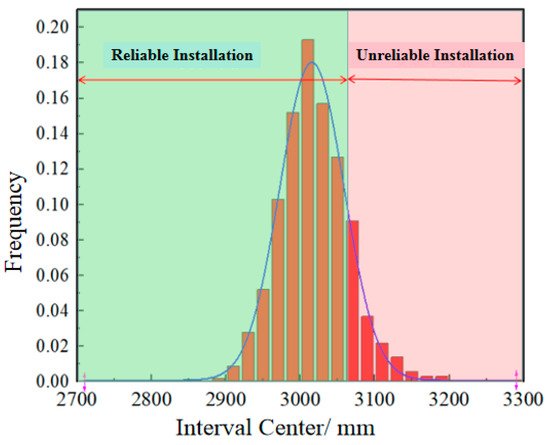
Figure 26.
Size deviations for different reliability levels at the maximum joint width.
6.5. The Optimization of Prefabricated Component Manufacturing Sizes within Vertical Axis
Figure 27 and Figure 28 depict contour plots of the installation reliability obtained by reducing the dimensions of beam and column components under different joint widths. As the dimensions of the components decrease, the installation reliability increases. Under the same joint width conditions, the slopes of the beam height and column length deviations are approximately equal, indicating that they contribute nearly equally to the installation reliability of the components along the axis. When the joint width is 20 mm and the dimensions are reduced by 2.5 mm, the installation reliability reaches 100%. Similarly, when the joint width is 10 mm, a reduction of 6.2 mm in dimensions results in a 100% installation reliability.
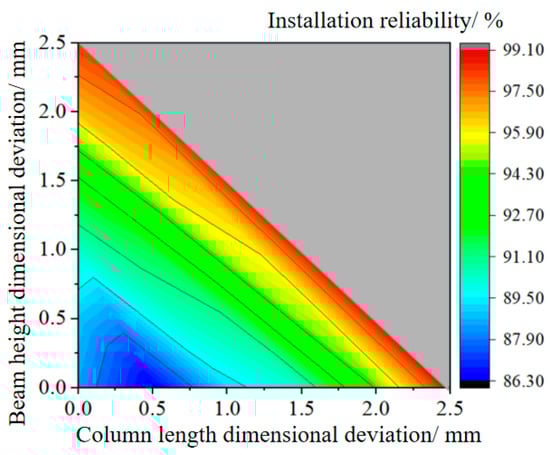
Figure 27.
Size deviations for different reliability levels at the minimum joint width.
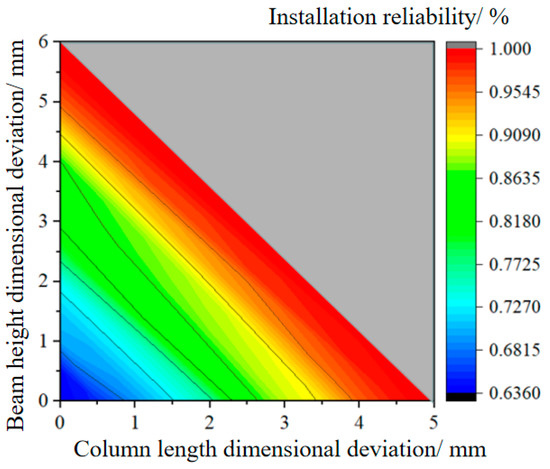
Figure 28.
Size deviations for different reliability levels at the maximum joint width.
Within the allowable range of seam widths, the manufacturing dimensions of components that ensure a 95% confidence level (as indicated by the green shaded region in Figure 29) should be reduced by 1.8 mm to 4.4 mm. The contribution of column length deviation and beam height deviation to the installation reliability is approximately equal. By evenly distributing the manufacturing dimensional deviations, based on the reference dimensions, the column length should be reduced by 0.9 mm to 2.2 mm, and the beam height should be reduced by 0.9 mm to 2.2 mm, in order to achieve a 95% installation reliability for the vertical axis-line.
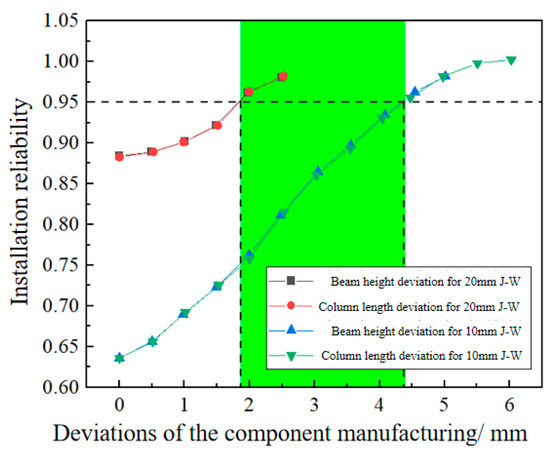
Figure 29.
The installation reliability for different manufacturing dimensional deviations.
7. Conclusions
This study established the limit state equation for the installation process of prefabricated components in assembly construction, based on the dimensional chain relationship of component installation. Moreover, a design methodology is proposed to enhance the installation reliability by adjusting the fabrication dimensions of prefabricated components. A number of conclusions can be drawn:
- Based on the measured data of installation deviations of prefabricated components, these deviations followed a log-normal distribution. The parameters of the log-normal distribution were fitted to the data, and a functional relationship between the deviation in component installation position and the qualification rate was established by analyzing the qualification rates corresponding to different installation position deviation values;
- Within the allowable deviation values specified in the standards, the qualification rate for the installation position of prefabricated wall panels was found to be 88.6%, while the qualification rate for column axial positions was 92.2%. Based on qualification rates of 80% and 90%, the allowable deviation for wall axial positions can be set at 5.8 mm and 8.6 mm, respectively, while the allowable deviation for column axial positions can be set at 6.6 mm and 7.3 mm;
- Based on the relationship between installation reliability and component dimensions, the manufacturing dimensions of components were determined by optimizing the interface conditions. When the interface size was minimized, the component dimensions were maximized, while the component dimensions were minimized when the interface size was maximized. In the installation size chain of prefabricated components, if the difference between the axis size and the cumulative component size was negative, it was considered unreliable for installation. Conversely, if the difference was positive, it was considered reliable for installation;
- The manufacturing dimensions were adjusted to improve the installation reliability of prefabricated buildings. The installation reliability of components within the horizontal axis was relatively low, at 83.6%, when assembled based on the design dimensions. However, by reducing the fabrication dimensions of beam length and column width, the installation reliability could be improved. A reduction of 2.3 mm to 2.9 mm in the manufacturing sizes of components within the horizontal axis achieved a 95% installation reliability. Within the vertical axis, when assembled based on the design dimensions, the installation reliability of components was 88.4%. By reducing the fabrication dimensions of column length by 0.9 mm to 2.2 mm and reducing the beam height by 0.9 mm to 2.2 mm, a 95% installation reliability can be achieved.
This study takes into account the deviations arising from the fabrication and installation processes of prefabricated components. It proposes improving the installation reliability of components within the axis by designing appropriate fabrication dimensions for the prefabricated components during the detailed design stage, thereby avoiding the risk of rework. However, there are certain limitations to this study that need to be addressed in future research to advance the field. Firstly, for nodes with cast-in-place concrete connections, adjusting the component deviations can be achieved through post-pouring of concrete. Secondly, different connection types of prefabricated components require different joint seam widths, and adjusting the tolerance threshold for joint seam widths can be explored. To overcome these limitations, future research can focus on expanding the range of connection types for prefabricated components to obtain recommended fabrication dimension values for different connection types.
Author Contributions
Conceptualization, H.L. and X.L.; methodology, H.L.; software, J.L.; validation, H.L., X.L. and J.L.; formal analysis, H.L.; investigation, X.L.; resources, S.D.; data curation, S.D.; writing—original draft preparation, H.L.; writing—review and editing, X.L.; visualization, J.L.; supervision, X.L.; project administration, X.L.; funding acquisition, H.L. All authors have read and agreed to the published version of the manuscript.
Funding
This research was funded by the National Natural Science Foundation (52178179), the National 13th Five-Year Plan Key R&D Project (2016YFC0701705-1), the Yiyang City Science and Technology Special Funds Project (2022108), and the Yiyang City Social Science Project (2023YS172).
Data Availability Statement
The data reported in this article are available from the corresponding author upon request.
Conflicts of Interest
The authors declare no conflict of interest.
Nomenclature
| standard normal distribution function | |
| average value | |
| standard deviation | |
| log-normal distribution parameter | |
| transfer coefficient | |
| design dimension of wall panel components | |
| deviation in wall panel component dimensions | |
| deviation in column component dimensions | |
| dimension of joints | |
| installation deviation of wall panels | |
| modular dimension (axis size) | |
| installation reliability index | |
| cumulative increment of the closed loop | |
| n | number of joints within the axis |
| C | column length |
| B | beam height |
| W | joint width |
| La | axis dimension |
| Cn | column width |
| Bn | beam length |
References
- Hong, J.; Shen, G.Q.; Li, Z.; Zhang, B.; Zhang, W. Barriers to promoting prefabricated construction in China: A cost–benefit analysis. J. Clean. Prod. 2018, 172, 649–660. [Google Scholar] [CrossRef]
- Gunawardena, T.; Mendis, P. Prefabricated building systems—Design and construction. Encyclopedia 2022, 2, 70–95. [Google Scholar] [CrossRef]
- Xiao, Y.; Bhola, J. Design and optimization of prefabricated building system based on BIM technology. Int. J. Syst. Assur. Eng. Manag. 2022, 13, 111–120. [Google Scholar] [CrossRef]
- Navaratnam, S.; Satheeskumar, A.; Zhang, G.; Nguyen, K.; Venkatesan, S.; Poologanathan, K. The challenges confronting the growth of sustainable prefabricated building construction in Australia: Construction industry views. J. Build. Eng. 2022, 48, 103935. [Google Scholar] [CrossRef]
- Burgess, R.A. Aspects of dimensional control in the production of large precast concrete units. Int. J. Prod. Res. 1972, 10, 113–127. [Google Scholar] [CrossRef]
- Ballast, D.K. Handbook of Construction Tolerances; John Wiley & Sons: Hoboken, NJ, USA, 2007; ISBN 0471931519. [Google Scholar]
- Liu, P.; Chen, Y.; Luo, X.; Yu, Z.; Long, H. Dimensional tolerance control for prefabricated building components. ACI Struct. J. 2019, 116, 101–114. [Google Scholar] [CrossRef]
- Talebi, S.; Koskela, L.; Shelbourn, M.; Tzortzopoulos, P. Critical review of tolerance management in construction. In Proceedings of the 24th Annual Conference of the International Group for Lean Construction, Boston, MA, USA, 18–24 July 2016. [Google Scholar]
- Friedman, A.; Cammalleri, V. Prefabricated wall systems and the North American home-building industry: North American survey of prefabricated panel systems conducted to examine the characteristics of the products and to determine their weakness in acquiring acceptance by the average builder. Build. Res. Inf. 1993, 21, 209–215. [Google Scholar]
- Thai, H.; Ngo, T.; Uy, B. A review on modular construction for high-rise buildings. Structures 2020, 28, 1265–1290. [Google Scholar] [CrossRef]
- Rausch, C.; Nahangi, M.; Perreault, M.; Haas, C.T.; West, J. Optimum assembly planning for modular construction components. J. Comput. Civil Eng. 2017, 31, 4016039. [Google Scholar] [CrossRef]
- Shahtaheri, Y.; Rausch, C.; West, J.; Haas, C.; Nahangi, M. Managing risk in modular construction using dimensional and geometric tolerance strategies. Automat. Constr. 2017, 83, 303–315. [Google Scholar] [CrossRef]
- Kim, K.; Cho, Y.K. Construction-specific spatial information reasoning in building information models. Adv. Eng. Inform. 2015, 29, 1013–1027. [Google Scholar] [CrossRef]
- Wang, Y.; Yuan, Z.; Sun, C. Research on assembly sequence planning and optimization of precast concrete buildings. J. Civ. Eng. Manag. 2018, 24, 106–115. [Google Scholar] [CrossRef]
- MNL-135-00; Tolerance Manual for Precast and Prestressed Concrete Construction. PCI Committee on Tolerances: Chicago, IL, USA, 2000.
- ACI 117-2010; Specification for Tolerances for Concrete Construction and Materials (ACI 117-10) and Commentary. American Concrete Institute: Farmington Hills, MI, USA, 2010.
- DIN 18202-1997; Standardization, I.O.F. Tolerances for Building Structures. Deutsches Institut für Normung: Berlin, Germany, 1997.
- GB/T 50204-2015; Code for Quality Acceptance of Concrete Structure Construction. China Architecture & Building Press: Beijing, China, 2015.
- GB/T 51231-2016; Technical Standard for Assembled Buildings with Concrete Structure. China Architecture & Building Press: Beijing, China, 2016.
- JGJ1-2014; Technical Specification for Precast Concrete Structures. China Architecture & Building Press: Beijing, China, 2014.
- Long, H.; Luo, X.; Liu, J.; Xiang, H. Distribution Features of Deviation and Determination of a Tolerance Method for Prefabricated Concrete Components. Buildings 2023, 13, 1142. [Google Scholar] [CrossRef]
- Galantucci, R.A.; Fatiguso, F. Advanced damage detection techniques in historical buildings using digital photogrammetry and 3D surface anlysis. J. Cult. Herit. 2019, 36, 51–62. [Google Scholar] [CrossRef]
- Tan, Y.; Shi, Y.; Li, Y.; Xu, B. Automatic Registration Method of Multi-Source Point Clouds Based on Building Facades Matching in Urban Scenes. Photogramm. Eng. Remote Sens. 2022, 88, 767–782. [Google Scholar] [CrossRef]
- Xu, Z.; Kang, R.; Lu, R. 3D reconstruction and measurement of surface defects in prefabricated elements using point clouds. J. Comput. Civil Eng. 2020, 34, 4020033. [Google Scholar] [CrossRef]
- Luo, X.; Long, H.; Dong, S.; Wu, J. Prefabricated Concrete Component Geometry Deviation Statistical Analysis. Math. Probl. Eng. 2021, 23, 325. [Google Scholar] [CrossRef]
- Wang, M.; Wang, C.C.; Zlatanova, S.; Sepasgozar, S.; Aleksandrov, M. Onsite Quality Check for Installation of Prefabricated Wall Panels Using Laser Scanning. Buildings 2021, 11, 412. [Google Scholar] [CrossRef]
- Das, K.R.; Imon, A. A brief review of tests for normality. Am. J. Theor. Appl. Stat. 2016, 5, 5–12. [Google Scholar]
- Koch, A.L. The logarithm in biology 1. Mechanisms generating the log-normal distribution exactly. J. Theor. Biol. 1966, 12, 276–290. [Google Scholar] [CrossRef]
- Tripathi, P.; Srivastava, V.C.; Kumar, A. Optimization of an azo dye batch adsorption parameters using Box–Behnken design. Desalination 2009, 249, 1273–1279. [Google Scholar] [CrossRef]
- Swamee, P.K. Near lognormal distribution. J. Hydrol. Eng. 2002, 7, 441–444. [Google Scholar] [CrossRef]
- Bertsche, B. Reliability in Automotive and Mechanical Engineering: Determination of Component and System Reliability; Springer Science & Business Media: Berlin/Heidelberg, Germany, 2008; ISBN 3540342826. [Google Scholar]
- Liu, C. Tolerance redistributing of the reassembly dimensional chain on measure of uncertainty. Entropy 2016, 18, 348. [Google Scholar] [CrossRef]
- Zhang, Y.; Zhang, L. Graph Theory Solution Method to Solve the Complex Assembly Dimension Chain. In Proceedings of the 2017 7th International Conference on Mechatronics, Computer and Education Informationization (MCEI 2017), Shenyang, China, 3–5 November 2017; pp. 661–664. [Google Scholar]
- Singh, M.M.; Sawhney, A.; Borrmann, A. Integrating rules of modular coordination to improve model authoring in BIM. Int. J. Constr. Manag. 2019, 19, 15–31. [Google Scholar] [CrossRef]
- Huang, J.C. Cumulative Distribution Networks: Inference, Estimation and Applications of Graphical Models for Cumulative Distribution Functions; University of Toronto: Toronto, ON, Canada, 2009; ISBN 0494609796. [Google Scholar]
- Wu, S.; Ye, Q.; Chen, C.; Gu, X. Research on data reconciliation based on generalized T distribution with historical data. Neurocomputing 2016, 175, 808–815. [Google Scholar] [CrossRef]


Disclaimer/Publisher’s Note: The statements, opinions and data contained in all publications are solely those of the individual author(s) and contributor(s) and not of MDPI and/or the editor(s). MDPI and/or the editor(s) disclaim responsibility for any injury to people or property resulting from any ideas, methods, instructions or products referred to in the content. |
© 2023 by the authors. Licensee MDPI, Basel, Switzerland. This article is an open access article distributed under the terms and conditions of the Creative Commons Attribution (CC BY) license (https://creativecommons.org/licenses/by/4.0/).