Essay

Earthquake Economic Loss Assessment of Reinforced Concrete Structures Using Multiple Response Variables

1
School of Civil Engineering and Architecture, Xi’an University of Technology, Xi’an 710048, China
2
China Northwest Architectural Design and Research Institute Co., Ltd., Xi’an 710018, China
3
Guangzhou Metro Design & Research Institute Co., Ltd., Guangzhou 510010, China
4
School of Mechanics, Civil Engineering and Architecture, Northwestern Polytechnical University, Xi’an 710072, China
*
Authors to whom correspondence should be addressed.
Buildings 2023, 13(7), 1719; https://doi.org/10.3390/buildings13071719
Submission received: 7 April 2023 / Revised: 11 May 2023 / Accepted: 21 May 2023 / Published: 5 July 2023
(This article belongs to the Special Issue Rehabilitation and Reconstruction of Buildings)

Abstract

:
For buildings that meet the requirements of current seismic design codes, damage to nonstructural components and the internal objects of buildings often become the main source of the seismic economic losses of these buildings. However, the current specifications only consider the safety of ‘no collapse under strong earthquake’ and do not consider ‘functional recoverability’. In this paper, a six-story frame building was taken as an example. Four joint performance limit states were proposed, as per FEMA 273, to establish a two-dimensional probabilistic seismic demand model that considers parameter correlations. The limit state function was established, and the two-dimensional seismic vulnerability curve was calculated. The seismic intensity–economic loss curve and the annual average economic loss established by one-dimensional and two-dimensional seismic vulnerability curves were compared. The results showed that the seismic performance of the structure was lower than expected when using only a one-dimensional seismic vulnerability curve. However, the situation was more serious under high-intensity earthquake and high-performance levels.

1. Introduction

The current design standards attach great importance to the safety performance of the structure itself, which can effectively prevent the collapse of the system and the loss of people’s lives. On this basis, the economic losses from earthquakes will mainly come from the damage to nonstructural components and to the contents inside buildings, including—but not limited to—doors and windows, suspended ceilings, filler walls, various pipelines, and the various equipment placed in facilities. As people’s demands for building functions grow and the equipment erected in buildings becomes more expensive, the repair and replacement price of decorations, nonstructural components, and information technology equipment in buildings that are damaged as a result of earthquakes often exceeds the cost of the structure itself. Statistics show that investment in nonstructural parts and interior building items in general public buildings accounts for 80–90% of the cost [1].
The mainstream design concept ignores the seismic design of the nonstructural components and the interior items of the building. The possible damage to building structures that are designed in accordance with the current seismic standards for buildings, for moderate and small earthquakes, is relatively limited. The nonstructural components may suffer severe damage when encountering medium and minor earthquakes. In the 2013 Lushan earthquake in China, which had a magnitude of 7.0, the nonstructural components, such as filler walls and ceilings, were seriously damaged, but the main structures of many of the public buildings remained intact [2]. Computers and storage racks, along with other contents inside the building, were more likely to fall or turn over, thus suffering damage due to falling onto the floor.
Therefore, a method is needed to estimate the economic loss of a structure at a specific stage in its life cycle; one that can effectively help stakeholders undertake investment decisions and purchase adequate earthquake insurance. The United States of America and Japan have launched studies on this topic in previous years. In 1979, Scholl conducted a component-based damage assessment. Kutsu et al. [3] considered the probability characteristics of component losses on the basis of Scholl [4]. Vision 2000 defined the performance level and multiplicity targets, but its application of the worst component performance to represent the overall performance of the structure caused the loss assessment results to be conservative [5]. Singhal and Kiremidjian [6] considered an uncertainty of loss estimation regarding damage caused by ground motion. Porter and Kiremdjian [7] proposed a probability method based on the assembly-based vulnerability of concrete buildings, and also used a Monte Carlo simulation to estimate the probability parameters of the damage function.
Aslani and Miranda presented a component-based direct economic loss estimation method under the framework of performance-based seismic engineering. Zareian et al. [8] and Ramirez [9] simplified their models and refined them to combine each layer of damage and each component into the fundamental component. Goulet [10] proposed a new seismic evaluation method to quantify the structural performance of the economic loss and the collapse-resistant capacity of the structure. They used an office building as the research object to reach the conclusion that the average annual loss of the building was approximately 0.6–1.1% of the total cost. Gentile and Galasso [11] used multiple criteria to assess the economic loss caused by earthquakes. Wang et al. [12] advised that China’s current standards did not attach importance to damage to the nonstructural members of buildings caused by seismic acceleration. Kassem et al. [13] improved the empirical vulnerability index of seismic vulnerability. Di et al. [14] corrected the relationship between the availability level and economic loss by analyzing the empirical data of the L’Aquila earthquake (2009). You et al. [15] proposed a new method to quickly determine the damage to the structural members of a building after an earthquake. Laguardia et al. [16] summarized the relationship between the proposed vulnerability, framework, and loss curves by studying the damage to buildings in the L’Aquila earthquake (2009). Kang et al. [17] proposed a method based on IDA to quantify the uncertainty and correlation of engineering demand parameters (EDPs). Sousa et al. [18] considered the importance of indirect losses in the loss assessment of industrial buildings. Perez et al. [19] proposed to estimate performance displays by accessing massive geospatial data. Bianchi et al. [20] considered the impact of modeling uncertainty on earthquake economic loss assessments. You et al. [21] found that spatial correlations affected the degree of earthquake loss. Foraboschi [22,23] considered the damage that occurred due to concentrated forces (e.g., the force produced by partitions at corners). Aloisio [24] improved the seismic performance and seismic loss assessment method and applied it to timber structures. Gioiella [25], on using an Italian school building as an example, showed the progress of seismic loss assessment methods.
In China, Zeng et al. [26] gained the annual average exceedance probability of the structural response by applying incremental dynamic analysis to obtain the seismic response of the maximum relative displacement of the bearing, and then defined two performance levels. Ma et al. [27] regarded the structural performance as continuous and adopted an improved capacity spectrum method. Yang et al. [28] used the component-based direct economic loss evaluation method in the context of a performance-based seismic engineering framework, to determine the financial loss of reinforced concrete frame structures in high-earthquake-risk areas. Bi and Chen [29] introduced the entropy weight method and similarity theory in fuzzy mathematics to group vulnerability. Zhou [30] applied different structural dynamics methods to complete earthquake loss assessments on the basis of earthquake risk analysis. Liu and Lu [31] used earthquake loss estimates to devise risk measures, such as annual exceedance probability and cumulative exceedance probability. These measures were used in financial engineering and catastrophe insurance to construct a more thorough risk assessment of earthquake-related losses.
However, the majority of the above studies began with a single dimension, which inevitably results in a disconnect between the constructed model and the actual issues, thus making it challenging to consider the accuracy and effectiveness of earthquake loss assessments. This paper introduces a multidimensional seismic vulnerability model based on 2D performance indicators, that considers the correlation between two performance indicators, as well as constructs a combined performance level based on previous studies. A six-story RC frame building is the research object used to develop the earthquake economic loss curve, and it is compared with a 1D earthquake loss curve in order to examine the influencing aspects that help assist stakeholders in making decisions.

2. Multidimensional Seismic Vulnerability Curve

2.1. Vulnerability Definition Based on Multidimensional Performance

The probabilistic seismic demand model represents the probability distribution of engineering demand parameters under a given seismic intensity, which is the main result of probabilistic seismic demand analysis (PSDA). In 2002, Cornell [32] proposed what is now the most widely used logarithmic regression linear probabilistic seismic demand model. The formula is as follows:
ln D = ln a + b ln S a
where D is the median value of the engineering demand parameters; S a is the spectral acceleration; and, a and b are the regression coefficients.
In this paper, by considering the correlation between different engineering demand parameters, a probabilistic seismic demand model (i.e., multidimensional probabilistic seismic demand model) that obeys multivariate lognormal distribution is proposed. The model includes the independence of different engineering demand parameters and considers the correlations between them. This approach is widely used, and the results of the earthquake disaster assessment are more in line with the actual situation. When considering n kinds of engineering demand parameters for a building structure, the response of the structure is n -dimensional random vector R = R 1 , R 2 , , R n T under a given seismic intensity. Assuming that the response R obeys the multivariate lognormal distribution, then Y = ln R 1 , ln R 2 , , ln R n T obeys the multivariate normal distribution, and the probability density function of the n-dimensional random vector R = R 1 , R 2 , , R n T is:
f ( r 1 , r 2 , , r n ) = 1 ( 2 π ) n / 2 Σ 1 / 2 r 1 r 2 r n exp 1 2 ln r μ T Σ 1 ln r μ
where ln r = ln r 1 , ln r 2 , , ln r n T ; μ is the mean vector of Y = ln R 1 , ln R 2 , , ln R n T ; and Σ is the covariance matrix of Y = ln R 1 , ln R 2 , , ln R n T . The covariance matrix Σ represents the correlation between the different response parameters in the n-dimensional random response R = R 1 , R 2 , , R n T .

2.2. Generalized Equation of Multidimensional Performance Limit State

The vulnerability of a structure is defined as the conditional failure probability that the structural response parameters exceed their ultimate failure state under specific external actions. The definition of vulnerability is extended to multiple performance indicators (afterwards indicated as N ), i.e., the conditional probability of multiple structures’ responses exceeding the ultimate failure state. The vulnerability defined by multidimensional performance indicators can be expressed as follows [2,33,34]:
F = P { i = 1 N R i r lim , i I }
where R i is the structural response parameters (deformation, stress, velocity, etc.); r lim , i is the structural response parameter threshold (corresponding to performance level); and I is the disaster intensity level. When the maximum inter-story displacement response and the maximum acceleration response are used as performance measures, Equation (3) can be rewritten as [2,33,34]:
F = P { Δ D lim A A lim I } ,
where Δ denotes a random variable of the displacement response and A denotes a random variable of the acceleration response. D lim is the interlayer displacement response threshold and A lim is the acceleration response threshold.
To refine the quantitative performance indicators, this paper adopts four joint performance limit states: normal operation (NO, performance level threshold LS1), immediate occupancy (IO, performance level threshold LS2), life safety (LS, performance level threshold LS3), and collapse prevention (CP, performance level threshold LS4). The overall performance level of the structure (i.e., the structural performance limit state) is divided into four groups, as is shown in Table 1.
A multidimensional performance limit state refers to the joint limit failure state of structures with multiple indexes at different performance levels. The equation for this contains several performance quantitative indexes to describe the standard limit failure state of the systems, as shown in Equation (5) [2,33,34]:
L ( R 1 R n ) = i = 1 n ( R i / r lim , i ) N i 1 .
When only considering the seismic peak acceleration and the interlayer displacement, their correlation is considered, and N 1 = 1 , N 2 = N . At this time, the generalized equation can be simplified as Equation (6) [2,33,34]:
A L S A L S O + D L S D L S O N 1 = 0
where A L S is the acceleration threshold variable; D L S is the interlayer displacement threshold variable; A L S O is the acceleration fixed threshold; and D L S O is the interlayer displacement fixed threshold.

2.3. Vulnerability Curve in Two Dimensions

The structural seismic vulnerability refers to the probability that the structural engineering demand parameters exceed the corresponding performance limit states under a given seismic intensity. According to the definition of seismic vulnerability, when considering the multidimensional case, the mathematical expression is as follows:
P f = P ( R 1 r 1 , lim R 2 r 2 , lim R n r n , lim I M ) = P { i = 1 n ( R i r i , lim ) | I M }
The maximum inter-story drift angle (IDR) and peak acceleration (PFA) are selected as the performance quantitative indexes of structural members and nonstructural members, respectively. Equation (7) can be simplified as follows:
P f = P { θ θ lim A A lim | I M }
where θ and A are the random variables of the maximum interlayer displacement angle and the peak layer acceleration, respectively; and, θ lim and A lim are the maximum interlayer displacement angle and the peak layer acceleration threshold under a certain performance limit state, respectively.
Vulnerability analysis generally includes three parameters: seismic intensity, structural engineering demand parameters, and the probability that the structure exceeds the specified performance limit state. To define the two-dimensional vulnerability shown in Equation (8), the calculation formula is as follows:
F ( I M ) = P f = P { θ θ lim A A lim | I M } = A lim + θ lim + f ( θ , A I M ) d θ d A
where F ( I M ) is the seismic fragility of the structure; P f is the structural failure probability; and, θ and A are the random variables of the maximum interlayer displacement angle and the peak layer acceleration, respectively. I M is the seismic intensity, such as the peak ground acceleration (PGA), spectral acceleration (Sa), etc.; and, θ lim and A lim are the maximum inter-layer displacement angle and the peak layer acceleration threshold under a certain performance limit state (LS), respectively. Moreover, f ( θ , A I M ) is the joint probability density function of the maximum interlayer displacement angle and the peak layer acceleration under a given seismic intensity I M .

3. Seismic Risk Loss Curve

3.1. Floor Response Loss Function

The theoretical framework for seismic engineering based on performance [2,34] is divided into four stages: seismic intensity (IM), EDP, damage state (DM), and the decision variable (DV). Links between the EDP and DM stages and the DM and DV stages need to be established to complete the earthquake damage assessment. The floor response loss function expresses the economic loss of a floor given the floor’s EDP (i.e., the floor response). This function is established on the basis of component-based financial loss assessment theory. It can be obtained by integrating empirical data (component response vulnerability function and component loss function) in advance, and its application can save the tedious calculation of DM in earthquake loss assessments. This function can significantly simplify the calculation process by using floors rather than components as the calculation units.
The establishment of the floor response loss function is mainly divided into two steps. The first step is to convert the economic loss cost of the component in Equation (10) into a standardized loss, as is shown in Equation (11):
E [ L j E D P j ] = i = 1 m E [ L j D S i ] P ( D S = d s i E D P j ) ,
a j E [ L j E D P j ] = a j i = 1 m E [ L j D S i ] P ( D S = d s i E D P j ) E [ L j E D P j ] = i = 1 m E [ L j D S i ] P ( D S = d s i E D P j ) ,
where m is the number of damage states of a given component; E [ L j D S i ] is the economic loss of the component under the given damage state; a j is the component replacement cost; E [ L j E D P j ] is the standardized loss of the component under the given EDP level, i.e., the component response loss function; and E [ L j D S i ] is the standardized loss of the component under the given damage state. Specifically, the component loss function can be determined by referring to the relevant specifications and literature. P ( D S = d s i E D P j ) is the probability that the component damage state reaches a given damage level under a given EDP level, which can be obtained from Equation (12) in accordance with the component response fragility function:
P ( D S = d s i E D P j ) = 1 P ( D S d s i + 1 E D P j ) P ( D S d s i E D P j ) P ( D S d s i + 1 E D P j ) P ( D S d s i E D P j ) i = 0 1 i < m , i = m
where P ( D S d s i E D P j ) is the component response vulnerability function, which represents the probability that the component damage state exceeds the given damage level under the given component engineering requirement parameter (component response) level. The second step is to integrate the normalized losses of various components into the normalized losses of a floor. The components bearing the same damage state are divided into one component type. In a certain floor, the weighted sum of the response loss functions of various components is the floor response loss function.
E [ L S T O R Y E D P k ] = j = 1 s b j E [ L j E D P j ] ,
where E [ L S T O R Y E D P k ] is the normalized loss of the floor under the given floor EDP (i.e., floor response) level, i.e., the floor response loss function; s is the number of component types in a given floor; and b j is the replacement cost of a certain type of component. The ratio of the replacement cost of the floor where it is located can be obtained by referring to the relevant specifications [36].

3.2. Multidimensional Establishment of Earthquake Intensity–Economic Loss Curve

In accordance with the seismic vulnerability curve established above, the probability of each damaged state of the structure under the action of a given seismic intensity can be deduced. Equations (14) and (15) are derived from 1D seismic vulnerability functions (the engineering requirement parameter is the maximum inter-story displacement angle) and 2D seismic vulnerability functions (the engineering requirement parameter is the maximum inter-story displacement angle and peak story acceleration) to obtain the occurrence probability of each damage state of the structure under a given earthquake intensity:
P ( D S = d s i I M ) = 1 P ( θ θ lim , i | I M ) P ( θ θ lim , i 1 | I M ) P ( θ θ lim , i | I M ) P ( θ θ lim , i 1 | I M ) i = 1 i = 2 , 3 , 4 , i = 5
P ( D S = d s i I M ) = 1 P ( θ θ lim , i A A lim , i | I M ) P ( θ θ lim , i 1 A A lim , i 1 | I M ) - P ( θ θ lim , i A A lim , i | I M ) P ( θ θ lim , i 1 A A lim , i 1 | I M ) i = 1 i = 2 , 3 , 4 i = 5 ,
where P ( D S = d s i I M ) is the probability, specifically a two-dimensional damage probability, of a given damage state of a structure under the action of a given earthquake intensity; and P ( θ θ lim , i A A lim , i | I M ) and P ( θ θ lim , i | I M ) are the 2D and 1D seismic fragility functions, respectively. θ lim , 1 , θ lim , 2 , θ lim , 3 , θ lim , 4 are the maximum interlayer displacement angle thresholds corresponding to the performance limit states of NO, IO, LS, and CP, respectively. A lim , 1 , A lim , 2 , A lim , 3 , A lim , 4 are the peak layer acceleration thresholds corresponding to the performance limit states of NO, IO, LS, and CP, respectively (which can be obtained by referring to Table 2).
We can estimate the standardized loss for each floor of the structure under different levels of damage. The average value of the standardized loss of floors in this range is taken as the standardized loss value of floors in this damage state because the standardized loss of each floor changes in a particular damage state. Considering the probability of structural damage under a given earthquake, we can obtain the standardized loss of floors under a given earthquake intensity, as shown in Equation (16):
E [ L k I M ] = i = 1 5 E [ L k d s i ] P ( D S = d s i I M ) ,
where E [ L k I M ] is the normalized loss of the floor under the action of a given earthquake intensity, and which—in actuality—is a two-dimensional loss assessment that considers multiple damage components; k is the floor number; d s i is the damage state of the floor, and d s 1 , d s 2 , d s 3 , d s 4 , d s 5 correspond to the basically intact, slightly damaged, moderately damaged, severely damaged, and collapsed damage states, respectively; E [ L k d s i ] is the normalized loss of the floor under the given damage state; and P ( D S = d s i I M ) represents the probability of a floor with a certain damage state under the action of a given earthquake intensity.
The seismic intensity–economic loss curve is obtained by adding up the losses of all floors, as is shown in Equation (17):
E [ L I M ] = k = 1 6 E [ L k I M ] c k ,
where E [ L I M ] is the normalized loss of the building under the action of a given earthquake intensity, and which—in actuality—is a two-dimensional global loss assessment that considers multiple damage components; and k is the floor number.

4. Example Analysis

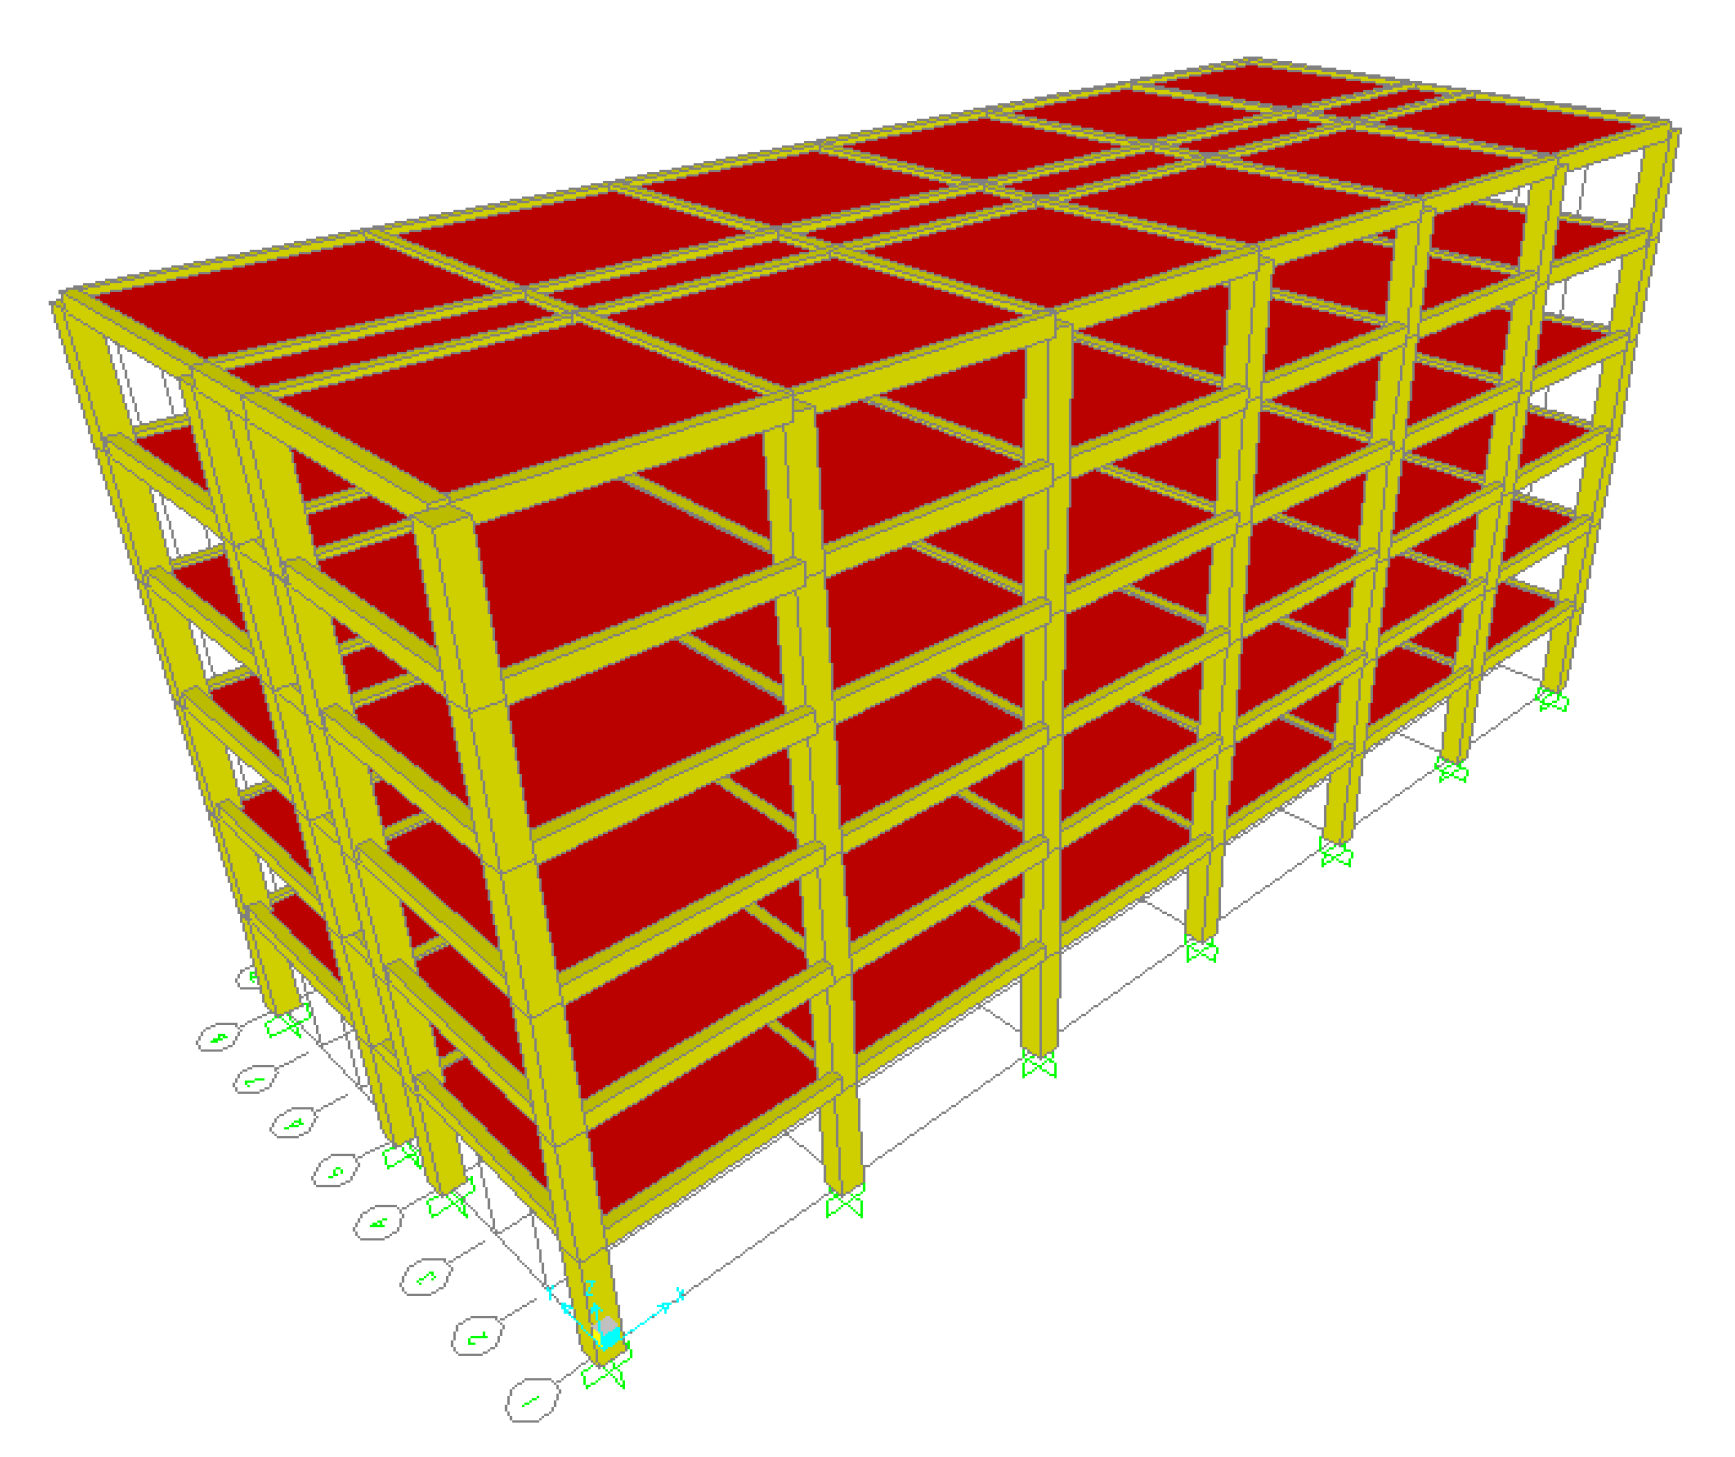
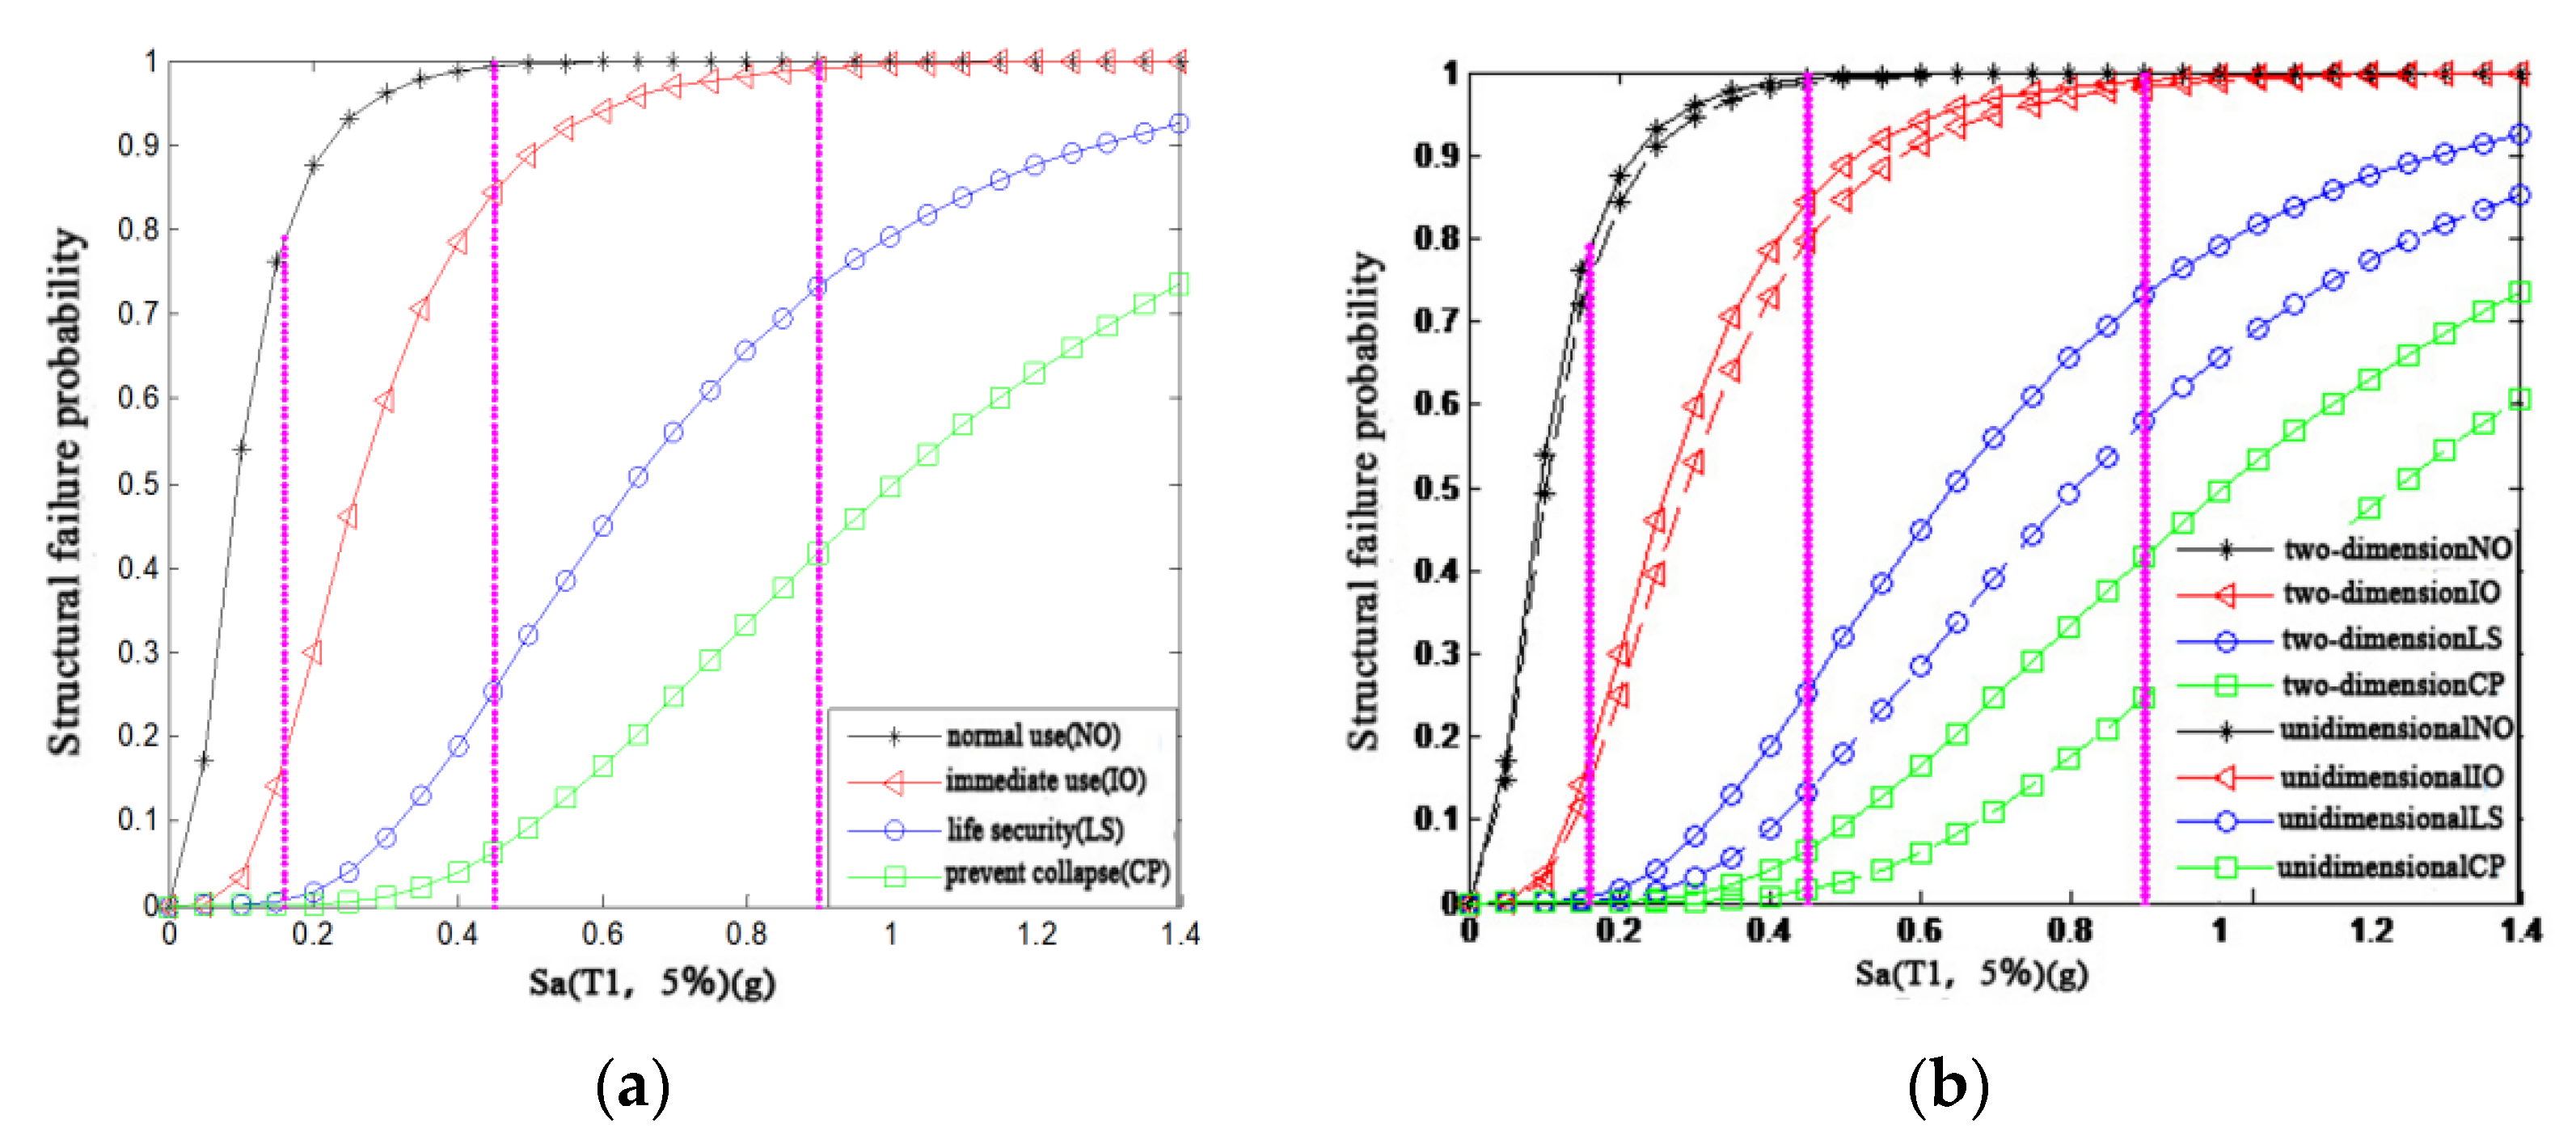
A finite element model can be established by taking a six-story steel–concrete frame structure as the research object, which can be found in Figure 1. The model parameters are described as follows: six spans in length are 36 m, three spans in width are 14 m, the height is 19.8 m, the beam section area is 500 mm × 300 mm, the column section area is 600 mm × 600 mm, and the slab thickness is 100 mm. The reinforcement is conducted in accordance with the corresponding specifications: The elastic moduli of the concrete and steel bars are E c = 30   GPa , E s = 200   GPa , and the Poisson’s ratio is c = 0.2 , and s = 0.3 . In addition, the density of the reinforced concrete is ρ = 2500   kg / m 3 . Twenty groups of seismic inputs were selected and amplitude-modulated to six PGAs (0.05, 0.25, 0.55, 0.75, 0.90, and 0.05 g), thus representing seismic excitation. We used SAP2000 to establish the model and selected 20 seismic waves as the excitation input model for the elastic–plastic time history analysis. In this example, M3 hinges were specified at both ends of all beams and PMM hinges were specified at both ends of all columns. The hinge properties were based on the default hinge properties provided by SAP2000 in accordance with the FEMA356 specification. The bottom constraint type was to limit all translation and rotation. The structural response calculated by SAP2000 (i.e., the displacement response and acceleration response that are selected in this paper) was used as an index to analyze the vulnerability of the structure. The peak distribution of responses was estimated by the maximum likelihood, and the exceedance probability was calculated in accordance with the analytical expression of vulnerability to fit vulnerability, as is shown in Equations (1)–(9). The results obtained are shown in Figure 2.
To simplify the calculation, this paper makes the following assumptions:
  • The whole building is used as office space rather than in a mixed-use capacity;
  • The main entrance, layout, facade, and polished surface of the first floor are different from those of other floors. Therefore, the replacement cost of the first floor is different from other floors;
  • As most of the building’s equipment is on the top floor, the replacement cost of the top floor is distinct from other floors;
  • The remaining middle floors are all used for office purposes, and these floors have the exact replacement cost.
In accordance with the above assumptions, the office building is divided into three floors: the first floor, the standard floor, and the top floor. The replacement cost of each floor is different. On the basis of the two-stage formation process of the floor response loss function described above, the response loss function of each floor is set up in the following two steps.

4.1. Creating a Floor Response Loss Function

In accordance with the related literature and previous engineering practices detailed in [2,35,38,39], we divided the building components into eight categories as follows:
  • Beam–column structure components;
  • Slab–column structure components;
  • Partition wall components;
  • DS3 partition wall components;
  • Window components;
  • General drift components;
  • Ceiling components;
  • Available acceleration components.
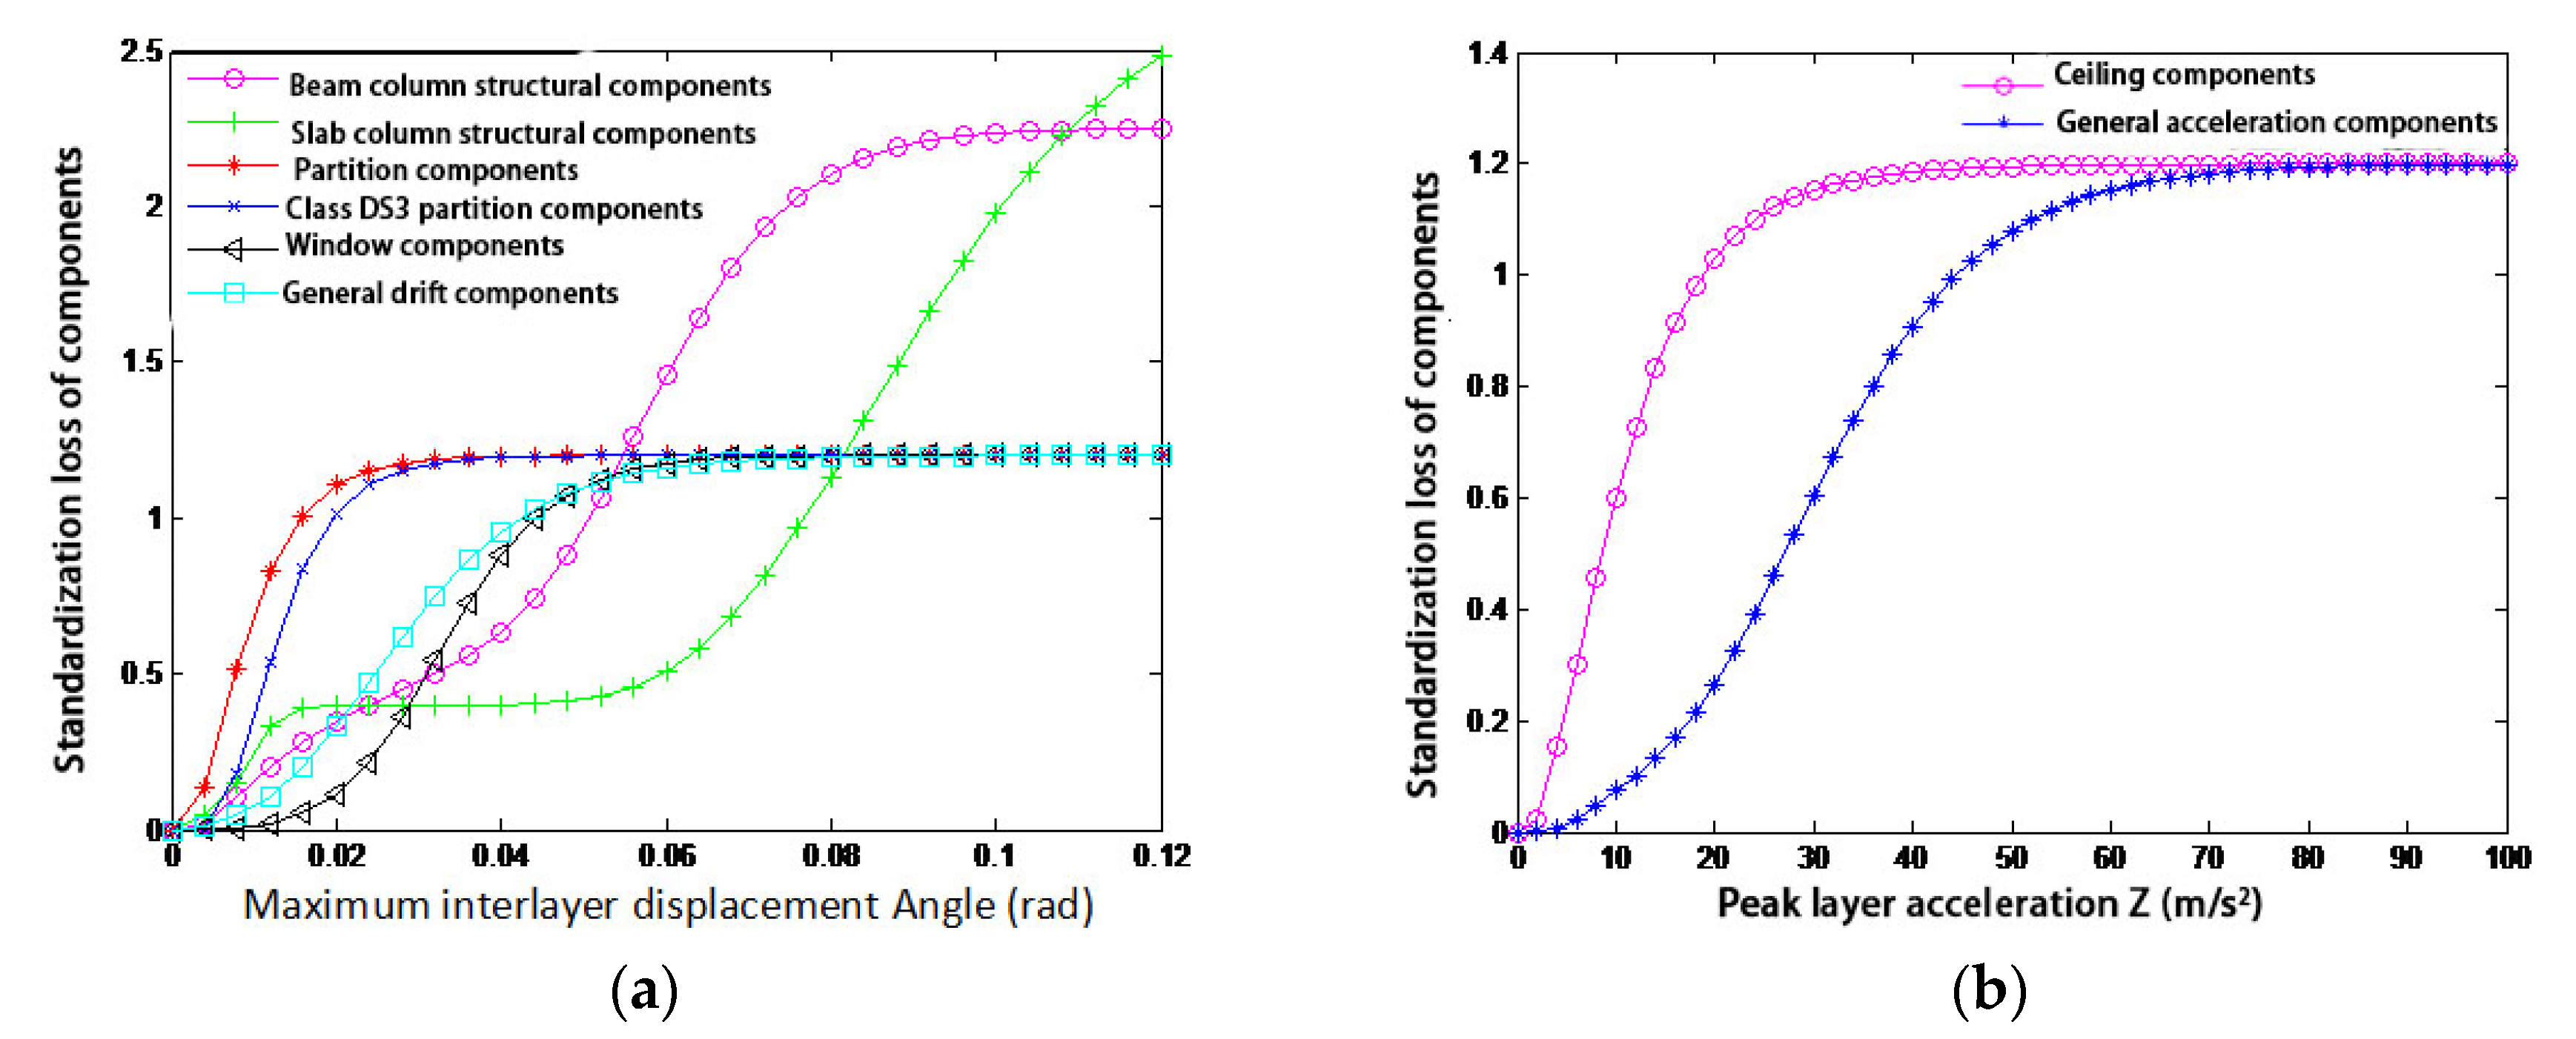
In accordance with Table 3, the response vulnerability function P ( D S d s i E D P j ) of various components can be established by using the log-normal cumulative distribution function. Combined with Equation (9), the component response vulnerability function P ( D S d s i E D P j ) can obtain m component response vulnerability curves (the threshold value is d s 1 , , d s m ), and the m + 1 types of damage states ( d s 0 , d s 1 , , d s m ) can be divided. The probability P ( D S d s i E D P j ) that the damage state of the component reaches the given damage level under the given EDP level is derived from the component response vulnerability function P ( D S = d s i E D P j ) . The response vulnerability of various components can be established by substituting the loss function E [ L j D S i ] of various components that were obtained previously and the probability P ( D S = d s i E D P j ) of various components reaching a given damage state under the given engineering requirement parameter level in Equation (8). The sixth function E [ L j E D P j ] is shown in Figure 3.
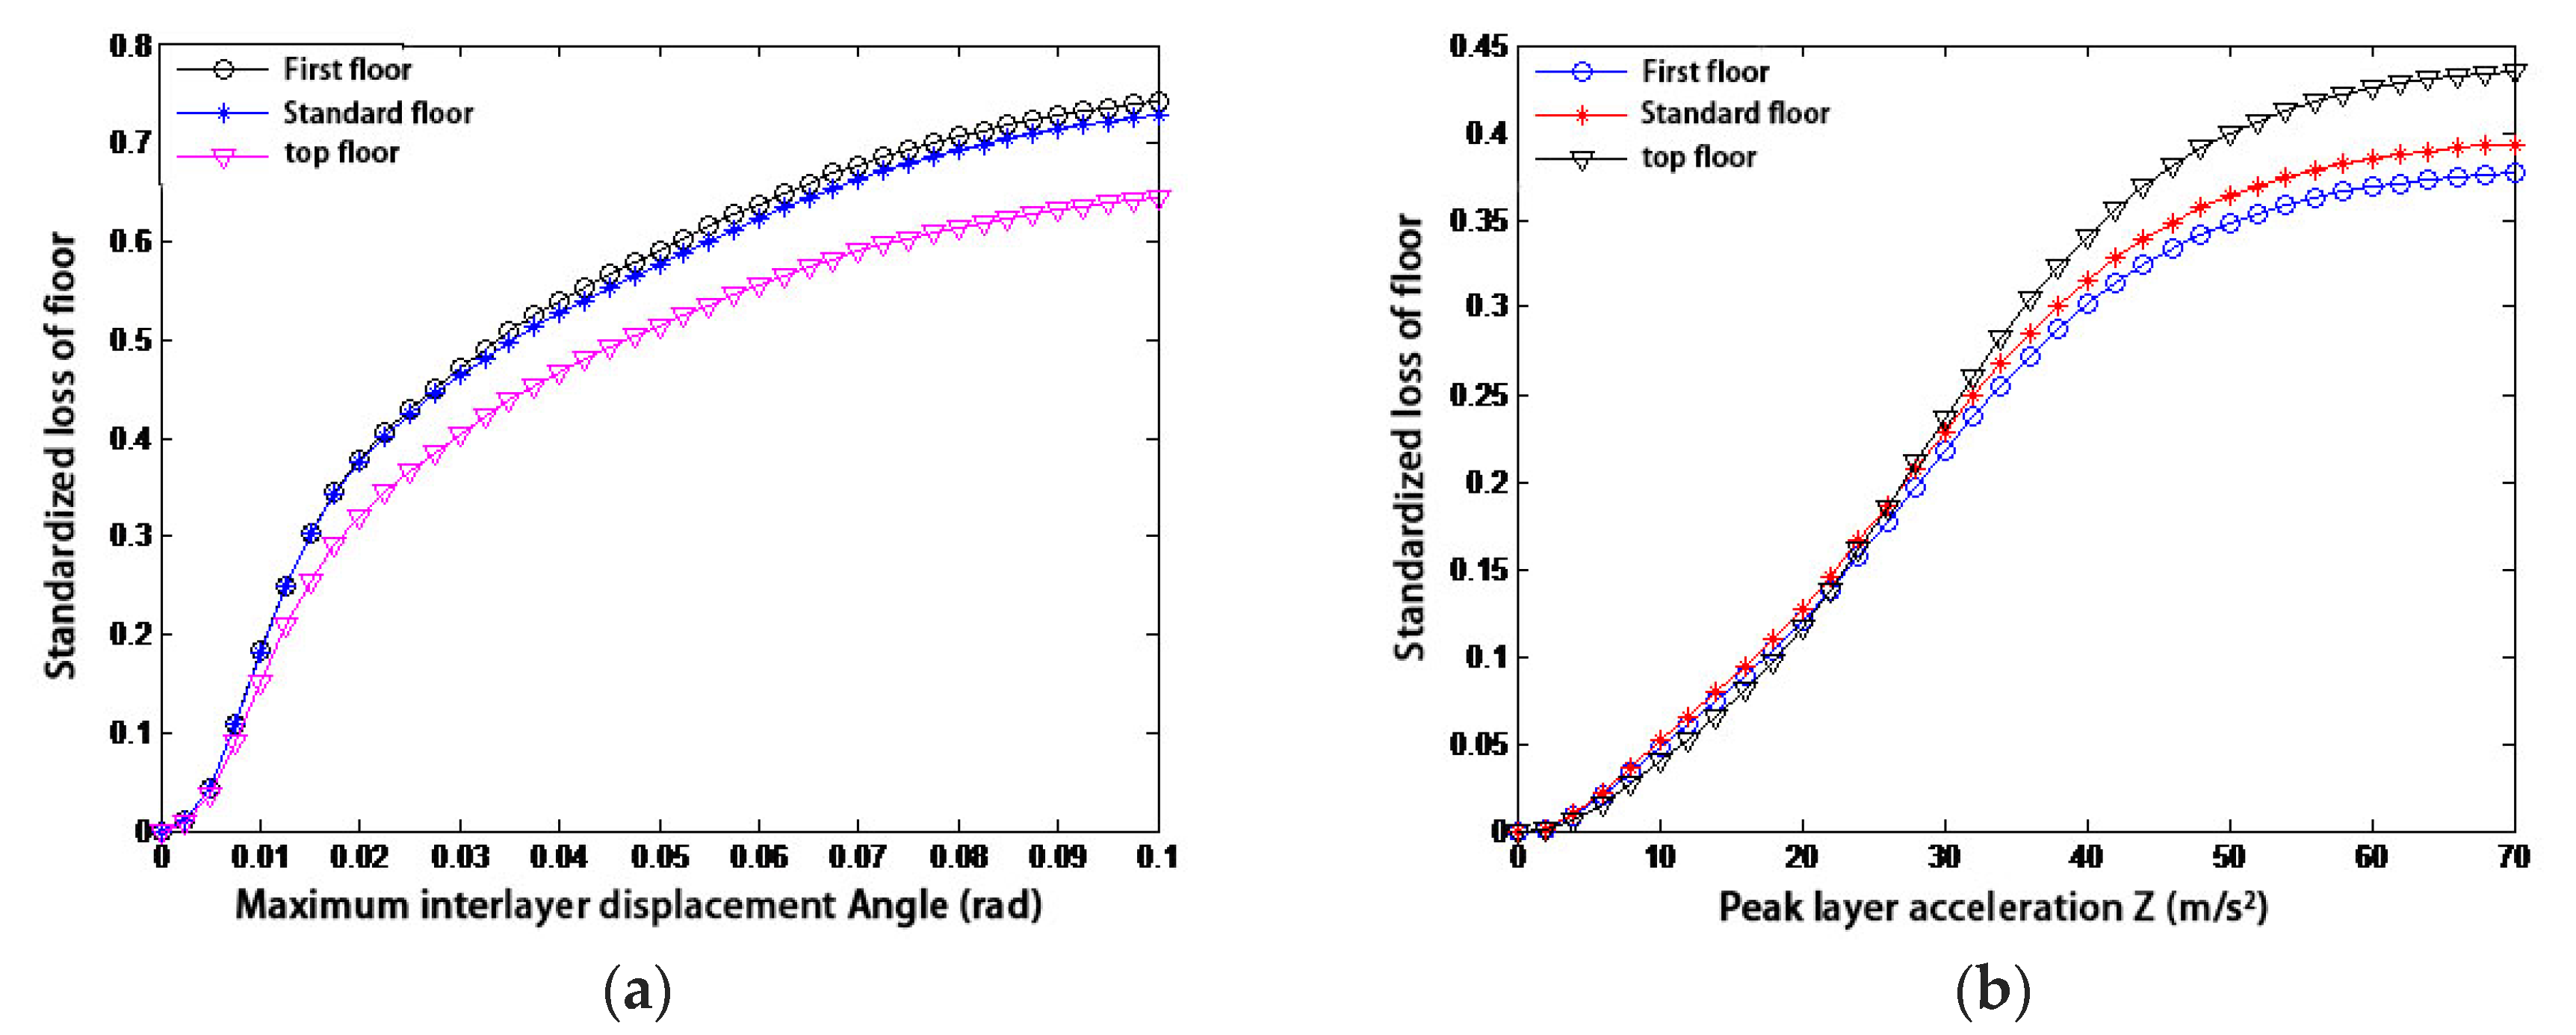
To establish the response loss function of each floor, we needed the response loss function of various components and the ratio for the replacement cost of multiple parts to the replacement cost of the floor on a particular floor. On the basis of previous descriptions, the floor cost of the building in the calculation example was divided into three types: the first floor, the standard floor, and the top floor. After consulting the relevant specifications and literature, the replacement cost of a certain type of component in the calculation example and the floor replacement of the element were calculated as ratio b j . Table 4 lists the ratio of the replacement cost of the various components mentioned above for the first floor, standard floor, and top floor, with the replacement cost of the floor where such features are located [39,40]. As is shown in Table 2, the sum of the component replacement cost to the floor replacement cost was less than 1. This condition was mainly because each floor contains particular components, such as slabs and roof openings. Damage only occurs when it collapses, so economic losses caused by such components are not included. The response loss functions of various elements in Figure 3 and the ratio of the replacement cost of multiple parts to the replacement cost of the floor in Table 2 were substituted into Equation (11). This was performed to establish the floor response loss functions of the first floor, the standard floor, and the top floor, as shown in Figure 4.

4.2. Establish the Earthquake Intensity-Economic Loss Curve

In accordance with the 1D and 2D seismic vulnerability curves, the probability of an earthquake occurrence resulting in the damaged state of a structure under a given earthquake condition was deduced. The calculation methods of the seismic intensity–economic curves of other floors are similar, so this paper will not address them here. To establish the angle of the earthquake intensity–economic loss relation, we needed to standardize the loss of each damaged floor. The method adopted in this paper was to take the average value of the multiple simulations of the standardized loss of floors. The results are shown in Table 5, Table 6 and Table 7.
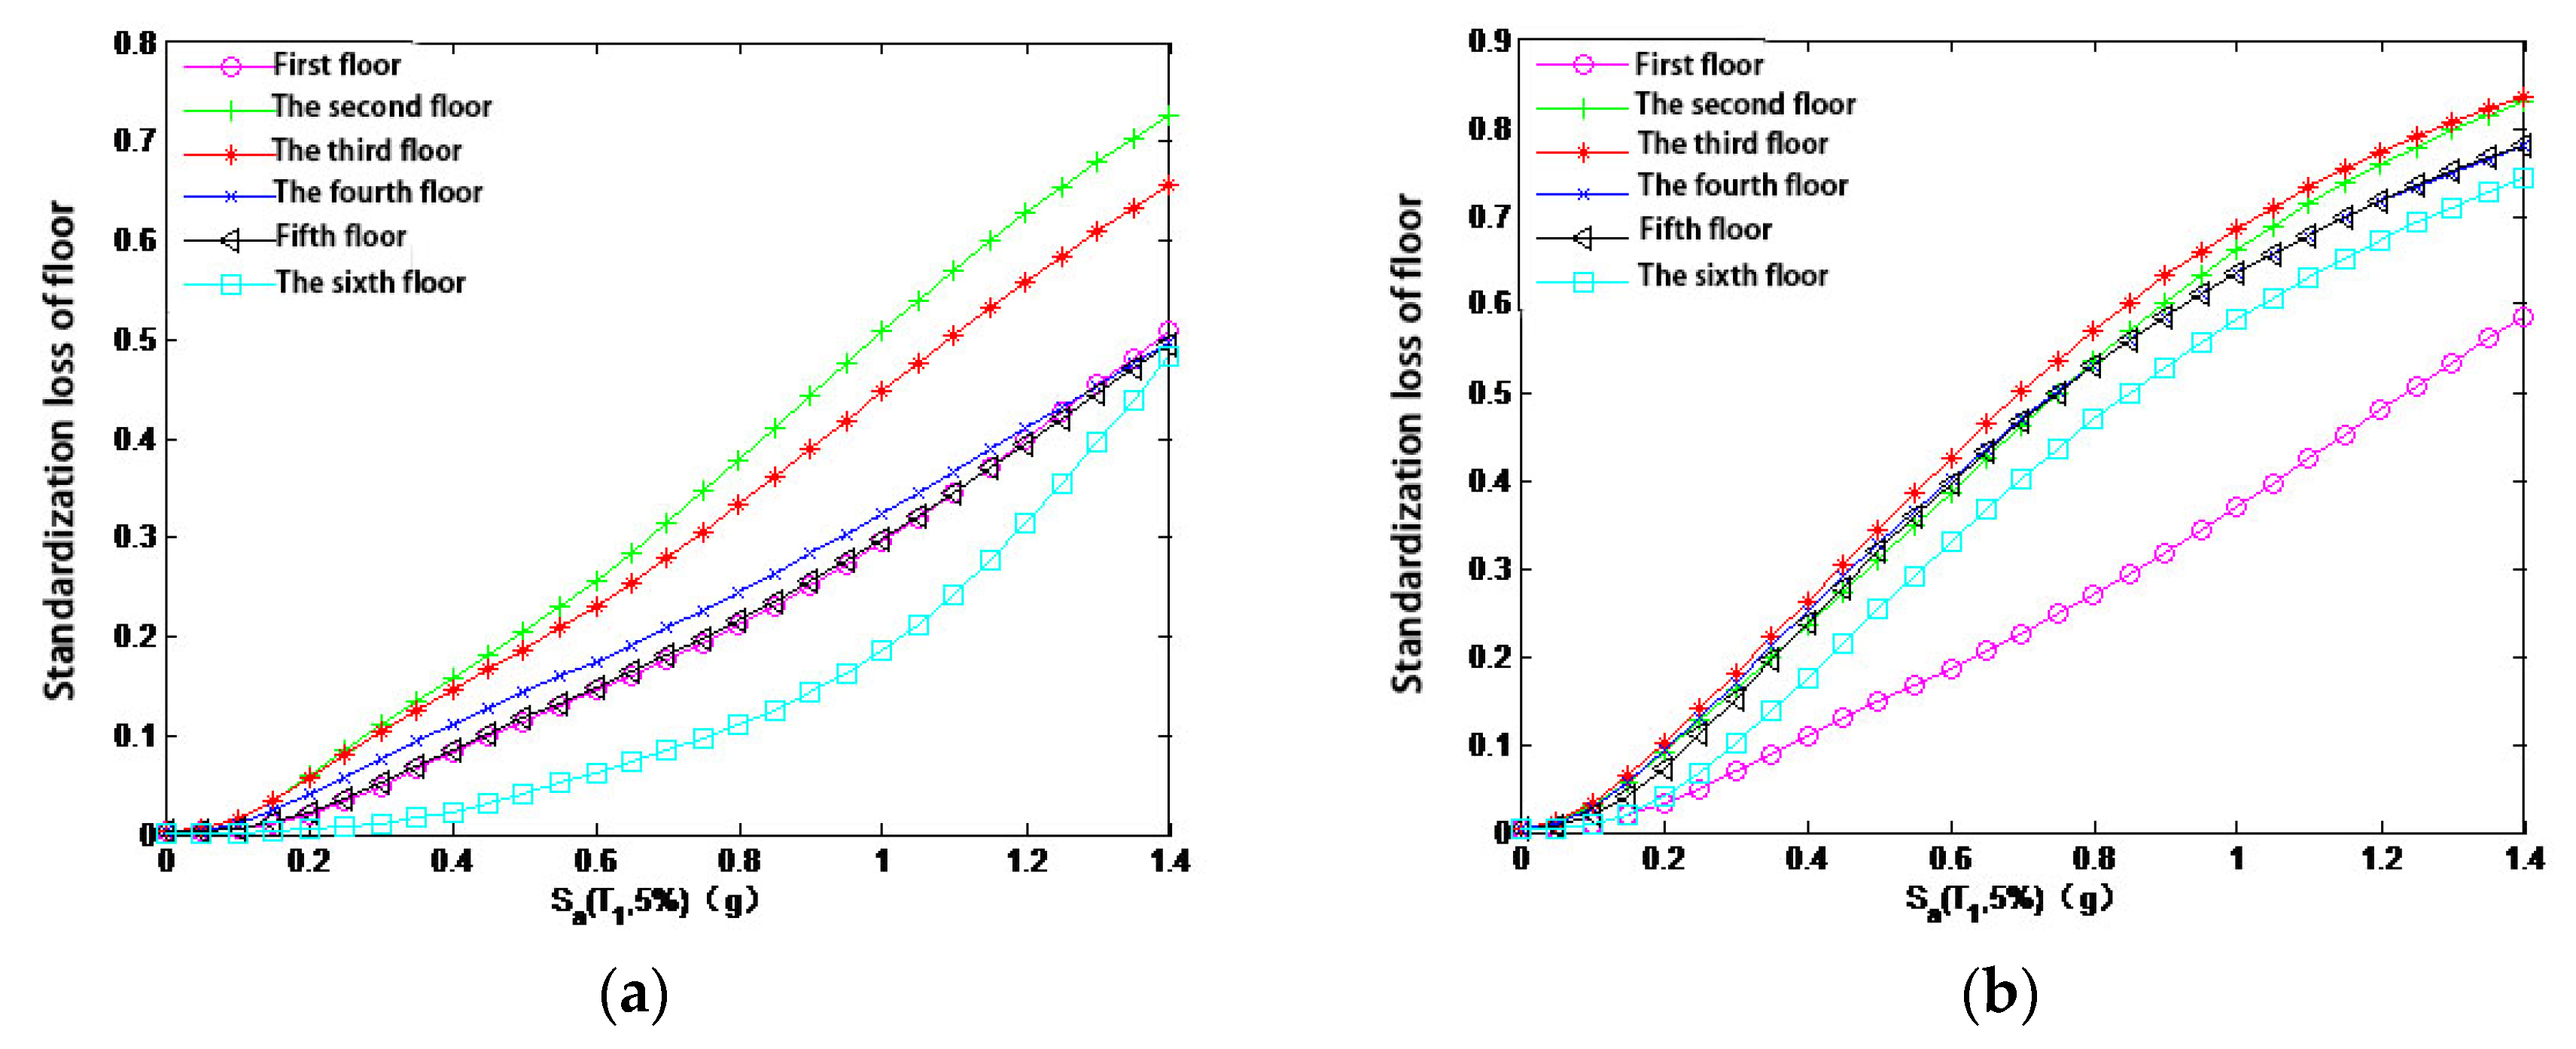
In accordance with Equation (13), we obtained the standardized loss of the floor by multiplying the standardized loss of the floor under a given damage state with the probability of the structure under a given earthquake intensity, as shown in Figure 5.
Figure 5a shows the earthquake intensity–economic loss curve of the floors under the 1D performance indicator. The economic losses of the other floors increased approximately linearly with the increase in earthquake intensity. This applied except for the top floor, which resulted in the second floor suffering the largest financial loss, and the sixth floor suffering the least. Figure 5b shows the earthquake intensity–economic loss curve (by taking the correlation coefficient of the performance limit state N = 2 ) of the floor under the 2D performance indicator. The economic loss of this floor considered the impact of nonstructural components. The financial failure of each floor did not increase approximately linearly with the increase in earthquake intensity, which resulted in the third floor suffering the largest economic loss, and the sixth floor the least.
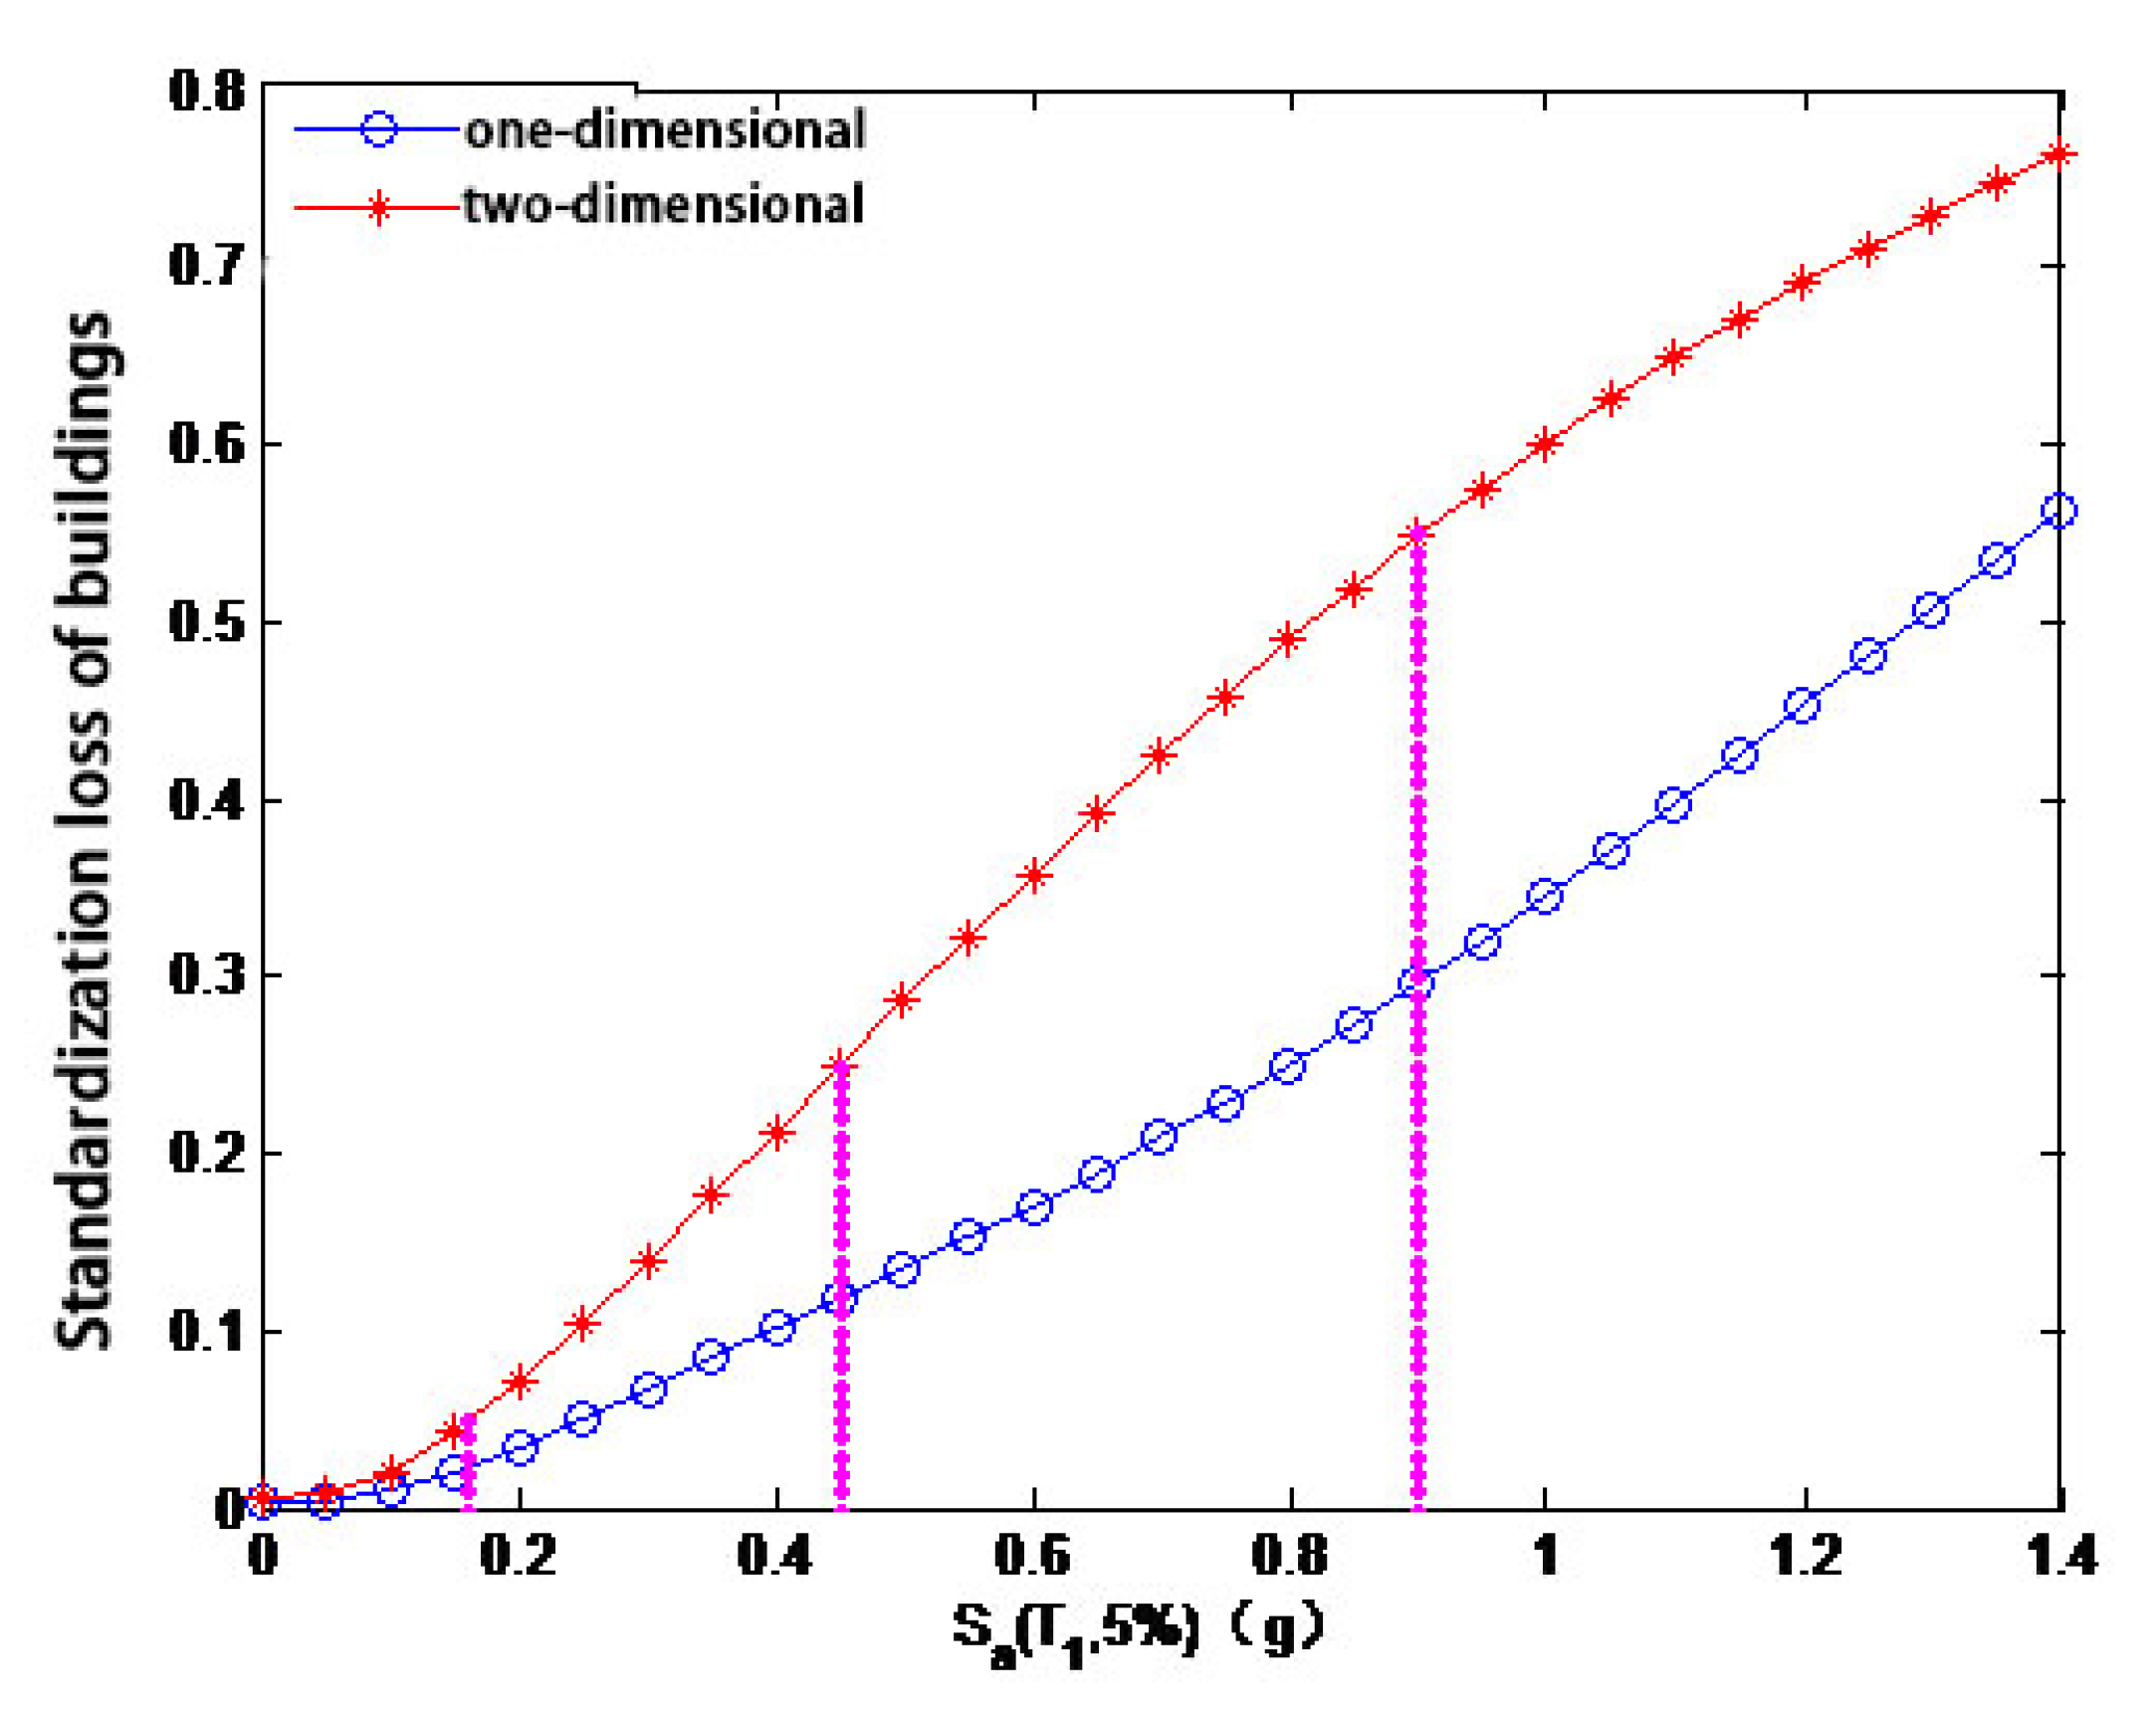
The unit price of various components was determined by referring to the “National Unified Construction Engineering Fundamental Quotas” [36]. The number of elements on each floor of the building was determined in accordance with the actual structure, and the replacement cost of each floor and the building could be calculated as the ratio of c k . With this calculation, the cost distribution of the building was divided into three types: the first floor, the standard floor, and the top floor. In addition, the c k ratios of the second floor to the fifth floor were the same. The specific situation is shown in Figure 6.
The two curves in Figure 6 are the seismic intensity–economic loss curves of the buildings when considering 1D and 2D performance indicators. Under the action of small earthquakes, a minimal difference was observed between the two curves. However, the gap between the two curves continuously increased with the increase in earthquake intensity. Under moderate and large earthquakes, the standardized loss difference of the buildings under 2D and 1D indexes exceeded 0.13 and 0.25, respectively. With the increase in earthquake intensity, when considering various influencing factors and the economic loss discrimination method of nonstructural components, the financial loss caused by an earthquake will be accurately estimated by comparing the two curves.
The economic losses caused by earthquakes can be divided into two groups: those caused by buildings collapsing, and those caused by buildings not collapsing. The formula for determining these losses is shown in Equation (18):
E [ L I M ] = E C [ L I M ] + E N C [ L I M ]
where E [ L I M ] is the normalized loss of the building under the action of a given earthquake intensity; E C [ L I M ] and E N C [ L I M ] are the normalized loss of the building under the action of a given earthquake intensity, as well as the collapse and noncollapse factors, respectively. Their calculation formulas are expressed by Equation (19):
E C [ L I M ] = E [ L C ] P ( C I M ) = P ( C I M ) E N C [ L I M ] = E [ L N C ] P ( N C I M ) = E [ L I M ] E C [ L I M ] ,
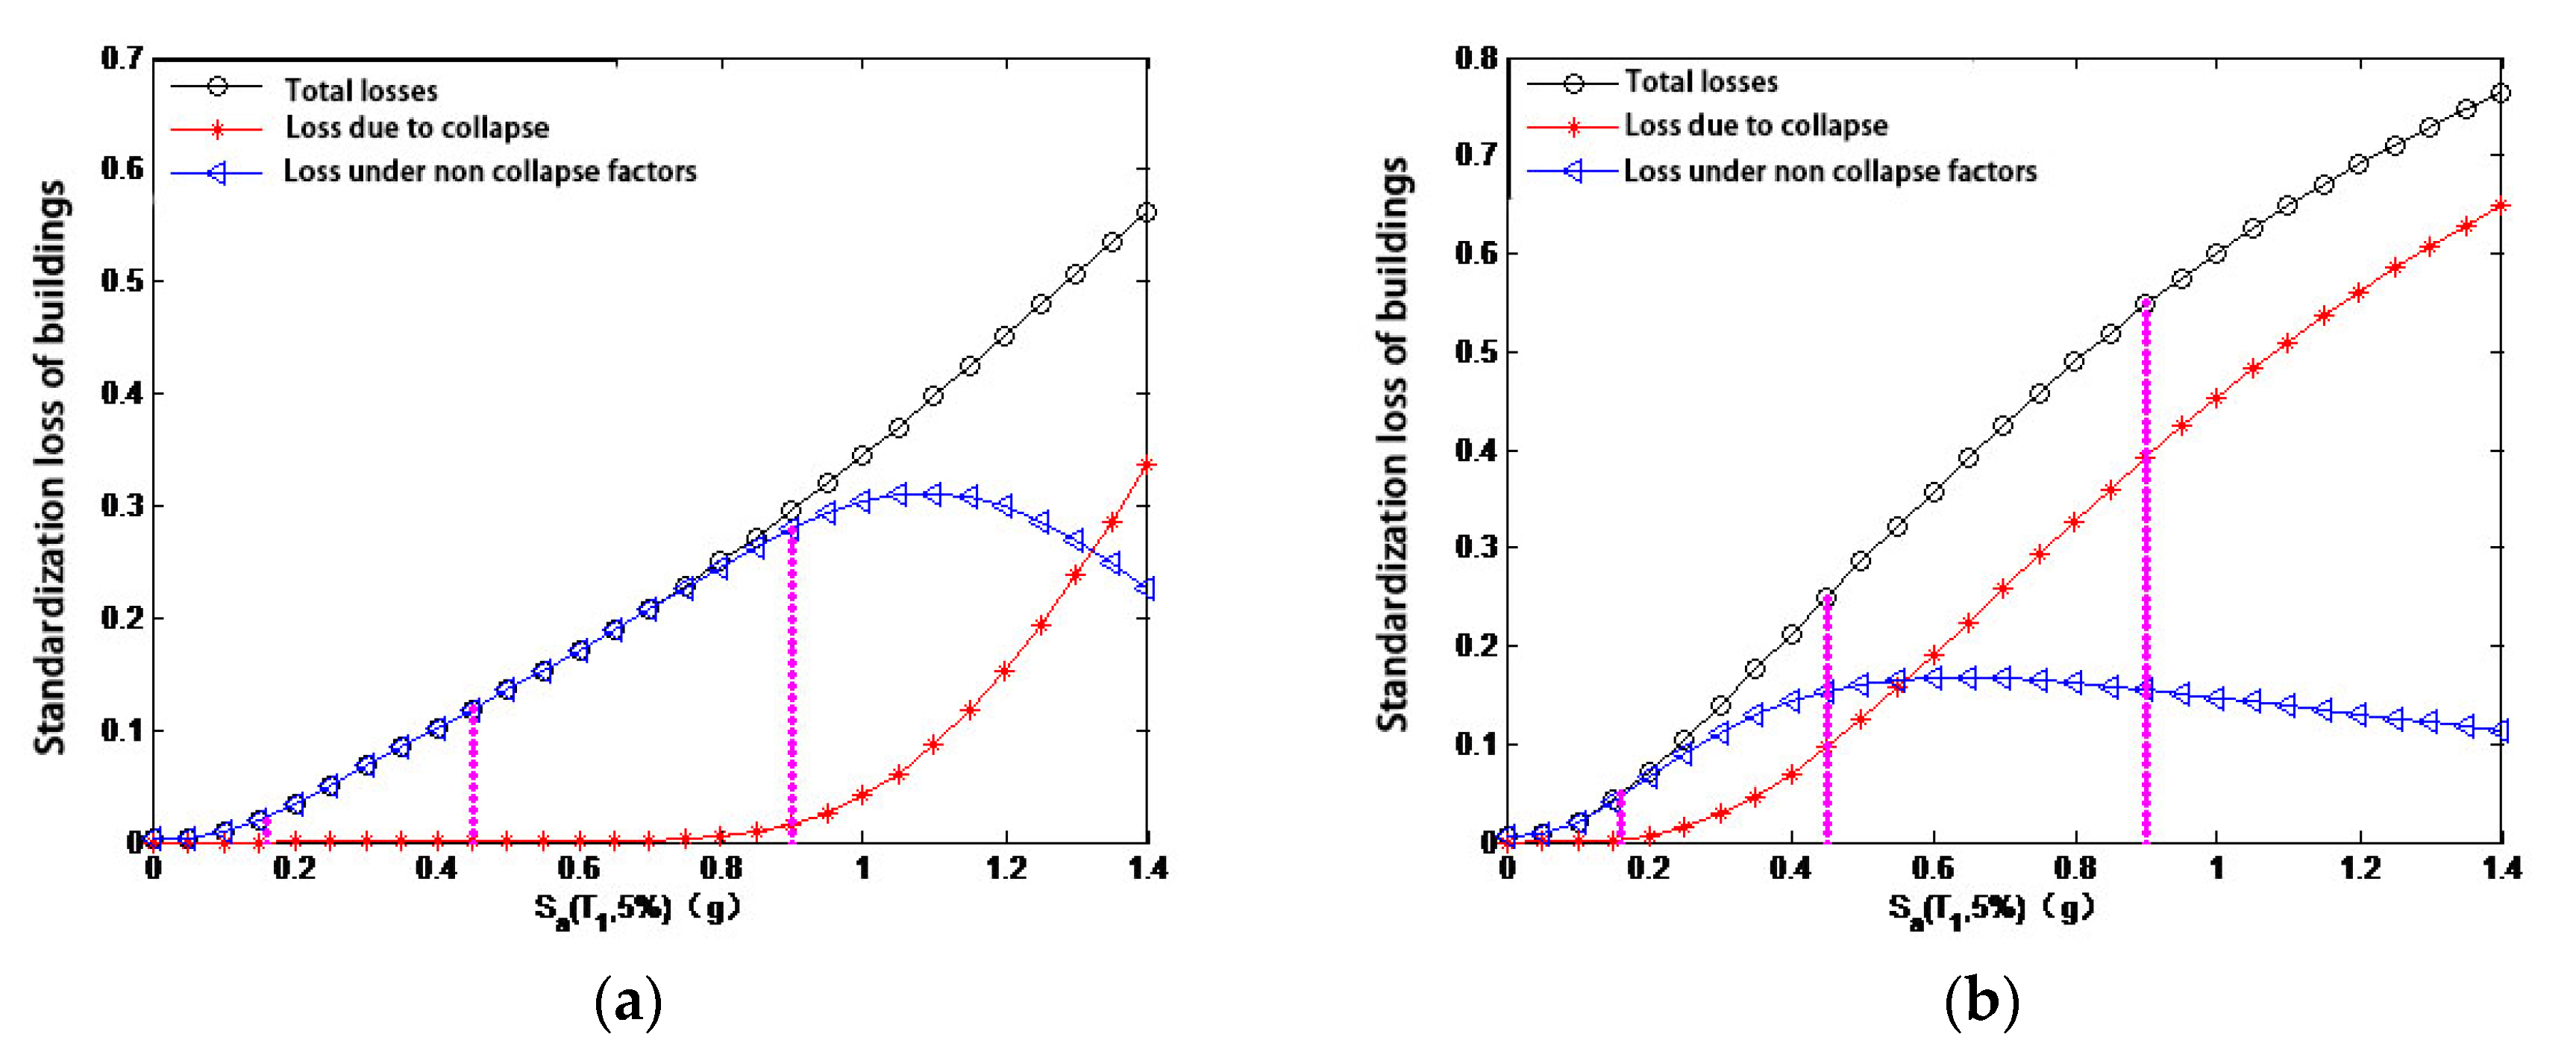
where E [ L C ] is the normalized loss when the building collapses (which is the replacement cost of the building values 1); P ( C I M ) is the collapse probability of the building under the action of a given earthquake intensity. The direct solution formula of E N C [ L I M ] is cumbersome, so Equation (18) is transformed and obtained by subtracting the loss under the collapse factor from the total loss of the building. Figure 7 is obtained by reviewing the content of Figure 5 with Equation (17).
The analysis of Figure 7a,b shows a remarkable difference between the 1D and 2D performance indexes of the building’s seismic intensity–economic loss curve decomposition diagram. Figure 7a shows that the economic losses of buildings caused by small, medium, and large earthquakes are all incurred from the results of construction damage. Figure 7b shows that the financial failure of buildings caused by moderate and small earthquakes is primarily driven by the noncollapse of structures and from component damage. By contrast, structural collapse is caused mainly by large earthquakes. This condition greatly defines the loss control direction of buildings under different earthquake intensities.

5. Estimation of Annual Average Economic Loss

At present, no accurate early warning system for earthquakes is available in the world; as such, we can assume that earthquakes are random events for the time being. Therefore, it is worth evaluating an earthquake’s economic loss in years. The annual average financial loss is related to the seismic risk of the site where the building structure is located and to the seismic performance of the system itself. The annual average economic loss of the building at a specific location is estimated. The seismic loss curve of the system can express the seismic performance of the structure itself, so seismic risk analysis based on the site is needed.

5.1. Seismic Risk Assessment

The most widely used method for seismic risk assessment is the probability analysis method [41]. The final analysis results from this method include the annual average exceeding the probability of ground motion parameters, i.e., the seismic hazard curve. This method was first proposed by Cornell [42]. The assumptions to simplify the model to be close to reality were as follows:
(1) The seismic activity is nonuniform, which indicates that an earthquake only occurs in some specific areas; furthermore, these particular areas are called potential hypocenter areas. Within the likely epicenter, the likelihood of an earthquake is the same everywhere;
(2) During the study period, the possibility of earthquake occurrence in each potential source region does not change with time;
(3) In each potential source area, the earthquake events are independent of each other, and the time course of earthquake occurrence obeys a Poisson distribution, i.e., the occurrence probability of k earthquakes in period T is:
P ( k ) = λ k e λ k !
where λ is the average occurrence rate of earthquake events in time period T ;
(4) In a potential epicenter area, the magnitude distribution of earthquake events is exponential, and the relationship between the number n ( M ) of the magnitude is greater than M and the magnitude M is:
ln [ n ( M ) ] = a b M
(5) In a specific site, the events that cause ground motions that exceed a given threshold by an earthquake event in a potential epicenter area obey the Poisson distribution. Specifically, the probability of the occurrence k of the event that the ground motion of a specific site exceeds the given threshold value is caused by the earthquake event in the ith potential source area during the time period T is:
P i ( k ) = λ i k e λ k ! .
(6) In a specific site, the ground motion parameters are functions of epicentral distance and magnitude, which can be expressed as:
Y = f ( M , R )
where Y is the ground motion parameter; M is the magnitude; and R is the epicentral distance.
Considering the above assumptions, Cornell uses Equation (23) to represent the seismic hazard probability model of the design site [32]:
H ( s a ) = P [ S a s a ] = k 0 s a k
where H ( s a ) is the earthquake hazard probability model of the site (represented in the form of an earthquake hazard curve), which represents the annual average exceedance probability of the earthquake intensity and is the main result of the earthquake hazard analysis; and, k 0 and k are the values of the earthquake hazard curve. The shape parameters are determined by using Equations (23) and (24), according to the theory of Wu and Zhu [43]:
k = ln ( H ( S a , 10 % ) H ( S a , 2 % ) ) / ln ( S a , 2 % S a , 10 % ) ,
ln ( k 0 ) = [ ln ( S a , 10 % ) · ln ( H ( S a , 2 % ) ) ln ( S a , 2 % ) · ln ( H ( S a , 10 % ) ) ] / ln ( S a , 10 % S a , 2 % ) ,
where S a , 2 % and S a , 10 % are the seismic spectral accelerations that have a probability of exceeding 2% and 10%, respectively, during the 50-year design reference period of the structure (and which are the large earthquakes and fortification intensity earthquakes specified in the Code for Seismic Design of Buildings [44]) (this also represents medium earthquakes); and H ( S a , 2 % ) H ( S a , 10 % ) are the annual average exceedance probabilities when the seismic spectral acceleration is S a , 2 % and S a , 10 % , respectively, during the 50-year design reference period of the structure.
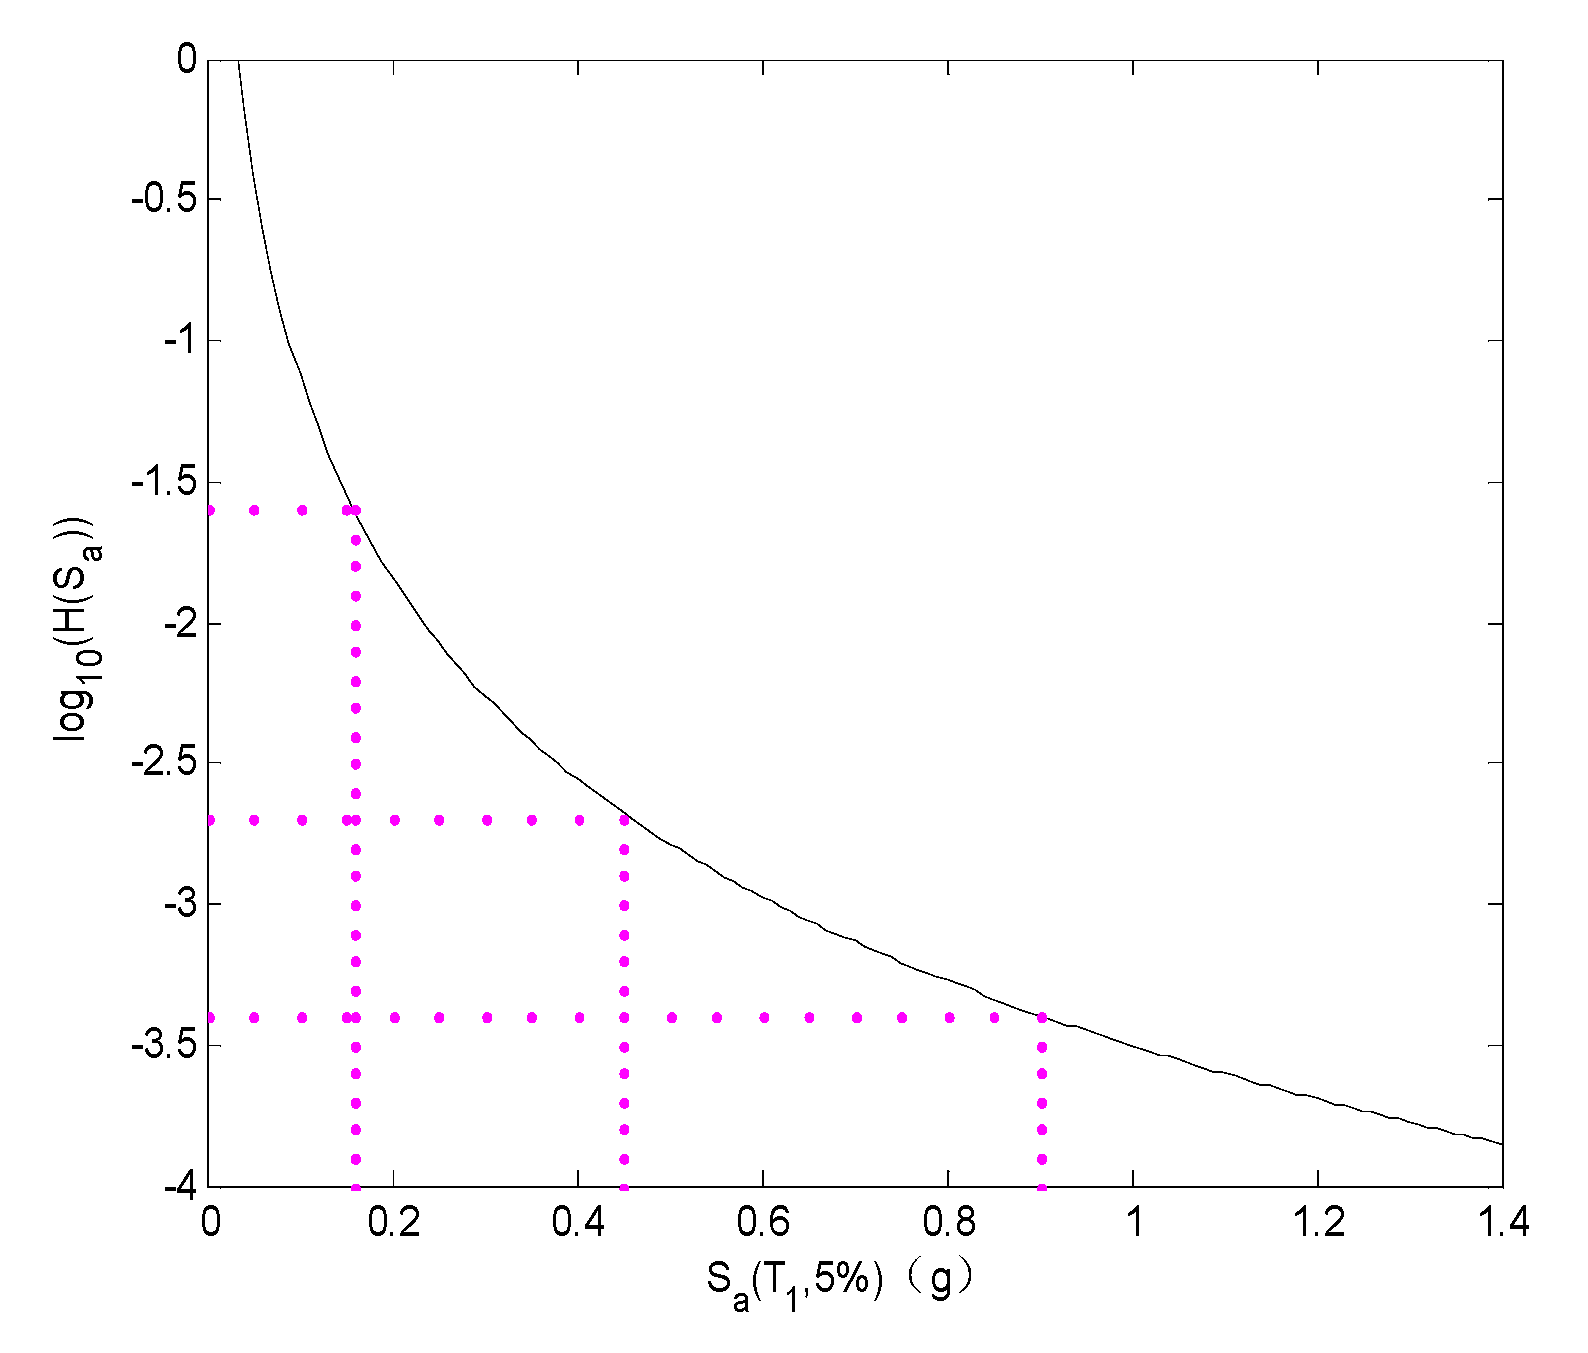
The research object of this paper was an office building. The seismic fortification intensity of the project area was a degree of 8, the design essential seismic acceleration value was 0.2 g, the equivalent shear wave velocity of the soil layer was 287.9 m/s, the site category was Class II, and the design earthquake group was Group III. According to the site characteristics of the structure, the basic natural vibration period, and the existing specifications, the interpolation analysis of the above two formulas obtained the seismic hazard curve of the site, as shown in Figure 8.

5.2. Estimated Average Annual Economic Loss

On the basis of the full probability theorem formula proposed by Cornell and Krawinkler [45], the annual average economic loss of a building can be obtained by integrating the seismic intensity–economic loss curve of the building and the seismic hazard curve of the site [46], as is shown in Equation (27):
E [ L ] = 0 E [ L I M ] d H ( I M )
where E [ L ] is the annual average economic loss of the building; I M is the ground motion parameter (and the spectral acceleration S a is selected as I M in this paper); E [ L I M ] is the normalized loss of the building under the action of a given earthquake intensity (see Figure 5); and H ( I M ) is the earthquake intensity. The annual average probability of surpassing the loss is shown in Figure 7.
The 1D and 2D performance indexes can be calculated by substituting the data into Equation (27), as well as the annual average economic loss of the building being 5.05% and 9.3%, respectively. From the data, the annual average economic loss of buildings under a 2D performance index is close to twice that of buildings under a 1D performance index.
6. Conclusions

In this study, we considered the problem that the current seismic design code does not pay attention to the seismic economic loss of buildings. The current code is mainly composed of the damage of nonstructural components and the internal items of buildings, and is based on a two-dimensional seismic vulnerability analysis that considers the correlation between parameters. In this study, by taking a six-story frame structure as an example, the seismic intensity–economic loss curve corresponding to the two-dimensional seismic vulnerability curve was calculated and compared with a case where only one dimension was considered. From this, we derive the following conclusions:
The economic loss of nonstructural components increases with an increase in seismic intensity. The economic loss of nonstructural components under the action of large earthquakes is close to the economic loss of structural components. When comparing the seismic intensity–economic loss curves of one-dimensional and two-dimensional methods, only a one-dimensional seismic vulnerability curve will lead to a lower seismic performance for the structure than what is expected. This situation is more serious under high-intensity-earthquake and high-performance levels. The annual average economic loss of buildings under a two-dimensional performance index is close to two times that of the buildings considered under a one-dimensional performance index.

Author Contributions

X.L. Conceptualization, Methodology; J.C. Formal analysis, Writing—original draft, Writing—review & editing; H.W. Funding acquisition, Validation; Z.J. Software, Supervision; Z.W. Investigation, Project administration. All authors have read and agreed to the published version of the manuscript.

Funding

The authors disclose a receipt of the following financial support for the research, authorship, and/or publication of this article. The authors gratefully appreciate the support of the Key Research and Development Program (2022SF-199; 2022SF-121; 107-451122005).

Data Availability Statement

Not applicable.

Conflicts of Interest

The author(s) declared no potential conflict of interest with respect to the research, authorship, and/or publication of this article.

Abbreviations

D The median value of the engineering demand parameters.
S a Spectral acceleration.
n The number of selected engineering demand parameters.
R i The structural response parameters (deformation, stress, velocity, etc.).
R = R 1 , R 2 , , R n T The structured random response vector Y = ln R 1 , ln R 2 , , ln R n T .
μ The mean vector of Y = ln R 1 , ln R 2 , , ln R n T .
Σ The covariance matrix of Y = ln R 1 , ln R 2 , , ln R n T .
r lim , i a structural response parameter threshold (corresponding to performance level).
I The disaster intensity level.
Δ A random variable of displacement response.
A A random variable of acceleration response.
D lim The interlayer displacement response threshold.
A lim The acceleration response threshold.
θ The inter-story displacement angle threshold, and the parameters that represent the displacement threshold selected in this paper.
A L S The acceleration threshold variable.
D L S The interlayer displacement threshold variable.
θ L S i , A L S i The inter-story displacement angle and inter-story acceleration threshold under different damage states.
A L S O , D L S O The acceleration and inter-layer displacement fixed threshold.
I M A given seismic intensity of an earthquake.
θ lim The maximum inter-layer displacement angle threshold under a certain performance limit state (LS).
f ( θ , A I M ) The joint probability density function of the maximum interlayer displacement angle and the peak layer acceleration under a given seismic intensity.
m The number of damage states of a given component.
E [ L j D S i ] The economic loss of the component under a given damage state.
E [ L j D S i ] The standardized loss of the component under a given damage state.
P ( D S = d s i E D P j ) The probability that the damage state of the component reaches the given damage level under a given EDP level.
a j The component replacement cost.
E [ L j E D P j ] The standardized loss of the component under a given EDP level.
E [ L S T O R Y E D P k ] The normalized loss of the floor under a given floor EDP (i.e., floor response) level, i.e., the floor response loss function.
s The number of component types in a given floor.
b j The replacement cost of a certain type of component.
P ( D S = d s i I M ) The probability of a given damage state of a structure under the action of a given earthquake intensity.
E [ L k I M ] The normalized loss of the floor under the action of a given earthquake intensity.
k The floor number.
d s i The damage state of the floor.
E [ L k d s i ] The normalized loss of the floor under a given damage state.
P ( D S = d s i I M ) The probability of a floor with a certain damage state under the action of a given earthquake intensity.
E [ L I M ] The normalized loss of the building under the action of a given earthquake intensity.

References

  1. Ye, L.H.; Qu, Z.; Sun, H.L.; Gong, T. Earthquake loss evaluation of medical facility seismically retrofitted by different seismic damage control methods. J. Build. Struct. 2020, 41, 15–26. [Google Scholar]
  2. Aslani, H.; Miranda, E. Probabilistic Earthquake Loss Estimation and Loss Disaggregation in Buildings; Stanford University: Stanford, CA, USA, 2005. [Google Scholar]
  3. Kustu, O.; Miller, D.D.; Brokken, S.T. Development of Damage Functions for High-Rise Building Components; URS/John A. Blume & Associates, Inc.: San Francisco, CA, USA, 1982. [Google Scholar]
  4. Scholl, R.E. Seismic Damage Assessment for High-Rise Building: Annual Technical Report; URS/John A. Blume & Associates, Inc.: San Francisco, CA, USA, 1979. [Google Scholar]
  5. Vision 2000. Conceptual Frame Work for Performance Based Seismic Engineering of Buildings; Structural Engineers Association of California: Sacramento, CA, USA, 1995. [Google Scholar]
  6. Singhal, A.; Kiremidjian, A.S. A Method for Earthquake Motion-Damage Relationships with Application to Reinforced Concrete Frames (Report No. 119); John A. Blume Earthquake Engineering Center, Department of Civil Engineering, Stanford University: Stanford, CA, USA, 1996. [Google Scholar]
  7. Porter, K.A.; Kiremidjian, A.S. Assembly-Based Vulnerability of Buildings and Its Uses in Seismic Performance Evaluation and Risk Management Decision-Making (Report No. 309); John A. Blume Earthquake Engineering Center, Department of Civil Engineering, Stanford University: Stanford, CA, USA, 2001. [Google Scholar]
  8. Zareian, F.; Krawinkler, H. Simplified Performance-Based Earthquake Engineering (Report No. 169); John A. Blume Earthquake Engineering Center, Department of Civil Engineering, Stanford University: Stanford, CA, USA, 2009. [Google Scholar]
  9. Ramirez, C.M.; Miranda, E. Building-Specific Loss Estimation Methods & Tools for Simplified Performance-Based Earthquake Engineering (Report No. 171). Available online: https://www.researchgate.net/publication/265411359_Building-Specific_Loss_Estimation_Methods_Tools_for_Simplified_Performance-Based_Earthquake_Engineering (accessed on 20 May 2023).
  10. Goulet, C.A.; Haselton, C.B.; Mitrani-Reiser, J.; Beck, J.L.; Deierlein, G.G.; Porter, K.A.; Stewart, J.P. Evaluation of the seismic performance of a code-conforming reinforced-concrete frame building—From seismic hazard to collapse safety and economic losses. Earthq. Eng. Struct. Dyn. 2007, 36, 1973–1997. [Google Scholar] [CrossRef]
  11. Gentile, R.; Galasso, C. Simplified seismic loss assessment for optimal structural retrofit of RC buildings. Earthq. Spectra 2021, 37, 346–365. [Google Scholar] [CrossRef]
  12. Wang, S.H.; Li, X.M.; Zhang, J.B. Seismic loss risk assessment of RC frame structures designed according to Chinese code. Earthq. Struct. 2021, 20, 571–581. [Google Scholar]
  13. Kassem, M.M.; Nazri, F.M.; Farsangi, E.N.; Ozturk, B.S. Improved Vulnerability Index Methodology to Quantify Seismic Risk and Loss Assessment in Reinforced Concrete Buildings. J. Earthq. Eng. 2022, 26, 6172–6207. [Google Scholar] [CrossRef]
  14. Di, L.M.; De, M.G.; Prota, A.; Manfredi, G.; Dolce, M. Relationships between empirical damage and direct/indirect costs for the assessment of seismic loss scenarios. Bull. Earthq. Eng. 2022, 20, 229–254. [Google Scholar]
  15. You, T.; Wang, W.; Zhang, Y.; Fang, C. Multi-level breakage-triggered radio frequency identification-based deformation sensor for rapid post-earthquake loss assessment of buildings: Concept, development, and application. Struct. Control. Health Monit. 2022, 29, e2947. [Google Scholar] [CrossRef]
  16. Laguardia, R.; D’Amato, M.; Coltellacci, M.; Di Trocchio, G.; Gigliotti, R. Fragility Curves and Economic Loss Assessment of RC Buildings after L’Aquila 2009 Earthquake. J. Earthq. Eng. 2022, 27, 1126–1150. [Google Scholar] [CrossRef]
  17. Kang, C.Y.; Kwon, O.S.; Song, J. Quantifying uncertainties and correlations of engineering demand parameters of building structures for regional seismic loss assessment. Earthq. Eng. Struct. Dyn. 2022, 51, 1751–1769. [Google Scholar] [CrossRef]
  18. Sousa, R.; Silva, V.; Rodrigues, H. The importance of indirect losses in the seismic risk assessment of industrial buildings—An application to precast RC buildings in Portugal. Int. J. Disaster Risk Reduct. 2022, 74, 102949. [Google Scholar] [CrossRef]
  19. Perez, D.M.; Morillas, L.; Balmori, R.J.A.; Escolano-Margarit, D. GIS Framework for Rapid Seismic Loss Assessment: Case Study of Granada Metropolitan Area. J. Earthq. Eng. 2022, 27, 1665–1689. [Google Scholar] [CrossRef]
  20. Bianchi, S.; Ciurlanti, J.; Overend, M.; Pampanin, S. A probabilistic-based framework for the integrated assessment of seismic and energy economic losses of buildings. Eng. Struct. 2022, 269, 114852. [Google Scholar] [CrossRef]
  21. You, T.; Wang, W.; Chen, Y.Y. Gaussian random field based correlation model of building seismic performance for regional loss assessment. Soil Dyn. Earthq. Eng. 2022, 162, 107501. [Google Scholar] [CrossRef]
  22. Foraboschi, P. Optimal design of seismic resistant RC columns. Materials 2020, 13, 1919. [Google Scholar] [CrossRef] [PubMed] [Green Version]
  23. Foraboschi, P. Strengthening of Reinforced Concrete Beams Subjected to Concentrated Loads Using Externally Bonded Fiber Composite Materials. Materials 2022, 15, 2328. [Google Scholar] [CrossRef]
  24. Aloisio, A.; Contento, A.; Alaggio, R.; Briseghella, B.; Fragiacomo, M. Probabilistic assessment of a light-timber frame shear wall with variable pinching under repeated earthquakes. J. Struct. Eng. 2022, 148, 04022178. [Google Scholar] [CrossRef]
  25. Gioiella, L.; Morici, M.; Dall’Asta, A. Empirical predictive model for seismic damage and economic losses of Italian school building heritage. Int. J. Disaster Risk Reduct. 2023, 91, 103631. [Google Scholar] [CrossRef]
  26. Zeng, Z.H.; Fan, J.; Yu, Q.Q. Performance-based probabilistic seismic demand analysis of bridge structures. Eng. Mech. 2005, 38, 38–43. [Google Scholar]
  27. Ma, H.W.; Lu, X.L.; Chen, X.B. Direct economic loss estimation method for building structures under earthquake. J. Civ. Eng. 2005, 38, 38–43. [Google Scholar]
  28. Yang, T. Performance-Based Direct Economic Loss Estimation of Buildings in High Seismic Risk Area of China. Ph.D. Thesis, Chongqing University, Chongqing, China, 2010. [Google Scholar]
  29. Bi, K.W.; Chen, J.Y. Fragility Analysis and Rapid Assessment of Seismic Loss of Group Buildings; Dalian University of Technology: Dalian, China, 2009. [Google Scholar]
  30. Zhou, Z. Vulnerability Analysis and Seismic Risk Study of Reinforced Concrete Structures. Ph.D. Thesis, Xi’an University of Architecture and Technology, Xi’an, China, 2010. [Google Scholar]
  31. Liu, D.; Lv, D.G. RC Frame Structure Seismic Loss Risk Assessment and Collapse Resistance Robust Design Method; Harbin Institute of Technology: Harbin, China, 2012. [Google Scholar]
  32. Cornell, C.A.; Jalayer, F.; Hamburger, R.O.; Foutch, D.A. A probabilistic basis for 2000 SAC Federal Emergency Management Agency steel moment frame guidelines. J. Struct. Eng. 2002, 124, 526–533. [Google Scholar] [CrossRef] [Green Version]
  33. Sun, H.B.; Wu, Z.Y.; Liu, X.X. Multidimensional performance limit states for structural fragility estimation. Eng. Mech. 2013, 30, 147–152. [Google Scholar]
  34. Mitrani-Reiser, J.; Beck, J. An Ounce of Prevention: Probabilistic Loss Estimation for Performance-based Earthquake Engineering; Department of Civil Engineering and Applied Mechanics, California Institute of Technology: Pasadena, CA, USA, 2007. [Google Scholar]
  35. ATC58-2; Seismic Performance Assessment of Buildings, Volume 2—Implementation Guide. FEMA: Washington, DC, USA, 2006.
  36. GJD 101-95; National Unified Construction Engineering Foundation Quota (Civil Engineering). Construction Industry Press: Beijing, China, 1995.
  37. Cimellaro, G.P.; Reinhorn, A.M. Multidimensional performance limit state for hazard fragility functions. J. Eng. Mech. 2010, 137, 47–60. [Google Scholar] [CrossRef]
  38. ATC58-1; Seismic Performance Assessment of Buildings, Volume 1—Methodology. FEMA: Washington, DC, USA, 2006.
  39. Robertson, I.N.; Kawai, T.; Lee, J.; Enomoto, B. Cyclic testing of slab-column connections with shear reinforcement. ACI Struct. J. 2002, 99, 605–613. [Google Scholar]
  40. Brown, P.C.; Lowes, L.N. Fragility Functions for Modern Reinforced concrete Beam-Column Joints. Earthq. Spectra 2007, 23, 263–289. [Google Scholar] [CrossRef]
  41. Lv, D.G.; Wang, D. Seismic Vulnerability and Probabilistic Risk Analysis of Steel Frame Structures; School of Civil Engineering, Harbin Institute of Technology: Harbin, China, 2006. [Google Scholar]
  42. Cornell, C.A. Engineering seismic risk analysis. Bull. Seismol. Soc. Am. 1968, 58, 1583–1606. [Google Scholar] [CrossRef]
  43. Wu, Q.Y.; Zhu, H.Q. Performance-Based Seismic Performance Evaluation of Reinforced Concrete Frame Structures; Huazhong University of Science and Technology: Wuhan, China, 2011. [Google Scholar]
  44. GB 50011-2010; Code for Seismic Design of Buildings. China Construction Industry Press: Beijing, China, 2010.
  45. Cornell, C.A.; Krawinkler, H. Progress and challenges in seismic performance assessment. PEER Center News 2000, 3, 1–3. [Google Scholar]
  46. Dhakal, R.P.; Mander, J.B. Financial risk assessment methodology for natural hazards. Bull. N. Z. Soc. Earthq. Eng. 2006, 39, 91–105. [Google Scholar] [CrossRef] [Green Version]
Figure 1. Finite element model of the frame structure.
Buildings 13 01719 g001
Figure 2. Vulnerability curve and comparison. (a) Overall seismic vulnerability curve of the structure (2D). (b) Comparison of the 1D and 2D fragility curves.
Buildings 13 01719 g002
Figure 3. Response loss functions of various components. (a) IDR is the EDP. (b) PFA is the EDP.
Buildings 13 01719 g003
Figure 4. Response loss function of each floor. (a) The structural response is the maximum story drift angle. (b) The structural response is the peak layer acceleration.
Buildings 13 01719 g004
Figure 5. Earthquake intensity-economic loss curve of floors. (a) One-dimensional performance index. (b) Two-dimensional performance indicators.
Buildings 13 01719 g005
Figure 6. Seismic intensity–economic loss curve of buildings.
Buildings 13 01719 g006
Figure 7. Decomposition of the earthquake intensity–economic loss curve of buildings. (a) One-dimensional performance index. (b) Two-dimensional performance indicators.
Buildings 13 01719 g007
Figure 8. Earthquake hazard curve.
Buildings 13 01719 g008
Table 1. Threshold value of the overall performance level of the structure [35].
Structural ElementNonstructural ComponentStructural Integrity θ A
Immediate occupancy (S1)Fully functional (NA)Normal operation (S1 + NA,NO) θ L S 1 A L S 1
Life safety (S3)Use immediately (NB)Immediate occupancy (S1 + NB,IO) θ L S 2 A L S 2
Collapse prevention (S5)Life safety (NC)Life safety (S3 + NC,LS) θ L S 3 A L S 3
Damage control (S2)Risk reduction (ND)Collapse prevention (S5 + NE,CP) θ L S 4 A L S 4
Limited safety (S4)Not considered (NE)
Table 2. Threshold values corresponding to performance limit state (G takes 9.8 m/s2) [4,36,37].
Performance LevelNormal Use (NO)Available (IO)Life Safety (LS)Collapse Prevention (CP)
Interlayer displacement angle valve value (%)0.20.51.52.5
Floor acceleration threshold (m/s2)0.4 g0.6 g0.8 g1.1 g
Table 3. Response vulnerability function and loss function of various components [2,35,38,39].
Component PartDamage StateEngineering Requirement ParametersTwo Parameters of Response Vulnerability FunctionLoss Function
Mid-ValueLogarithmic Standard Deviation
Beam–column structural membersDS1IDR0.00700.450.14
DS20.01700.500.47
DS30.03900.300.71
DS40.06000.222.25
Column structure componentDS1IDR0.00400.390.10
DS20.01000.250.40
DS30.09000.242.75
Partition memberDS1IDR0.00210.610.10
DS20.00690.400.60
DS30.01270.451.20
DS3-like partition wall componentsDS1IDR0.01270.451.20
Window componentDS1IDR0.01600.290.10
DS20.03200.290.60
DS30.03600.271.20
General drift componentDS1IDR0.00550.600.03
DS20.01000.500.10
DS30.02200.400.60
DS40.03500.351.20
Ceiling componentDS1PFA0.30 g0.400.12
DS20.65 g0.500.36
DS31.28 g0.551.20
General acceleration componentDS1PFA0.70 g0.500.02
DS21.00 g0.500.12
DS32.20 g0.400.36
DS43.50 g0.351.20
Table 4. Ratio of the replacement cost of a certain type of component to the replacement cost of the floor where the component is located [39,40].
Component PartEngineering Requirement ParametersRatio of Component Replacement Cost to Floor Replacement Cost
First FloorIndex BedTop Floor
Beam–column structural membersIDR0.070.0720.060
Column structure componentIDR0.0310.0310.026
Partition memberIDR0.1660.1650.132
DS3-like partition wall componentsIDR0.1230.1230.108
Window componentIDR0.0720.0620.064
General drift componentIDR0.0770.0730.079
Ceiling componentPFA0.0460.0510.024
General acceleration componentPFA0.2720.2810.344
Table 5. Standardized loss of each floor when the structure is damaged (IDR is the EDP).
Damage StateStandardized Loss of Each Floor
First FloorIndex BedTop Floor
Basically intact ( 0 θ < 0.002 )0.00270.00270.0021
Slight damage ( 0.002 θ < 0.005 )0.02200.02180.0178
Medium damage ( 0.005 θ < 0.015 )0.17900.17820.1486
Serious damage ( 0.015 θ < 0.025 )0.37420.37120.3165
Collapse ( θ 0.025 )0.77000.76000.6700
Table 6. Standardized loss of each floor when the structure is damaged (PFA is the EDP).
Damage StateStandardized Loss of Each Floor
First FloorIndex BedTop Floor
Basically intact ( 0 Z < 0.4   g )0.00220.00240.0014
Slight damage ( 0.4   g Z < 0.6   g )0.01370.01490.0099
Medium damage ( 0.6   g Z < 0.8   g )0.02620.02840.0206
Serious damage ( 0.8   g Z < 1.1   g )0.04300.04640.0356
Collapse ( Z 1.1   g )0.38000.40000.4400
Table 7. Standardized loss of each floor when the structure is damaged (IDR and PFA are the EDPs).
Damage StateStandardized Loss of Each Floor
First FloorIndex BedTop Floor
Basically intact ( 0 θ < 0.002 , 0 Z < 0.4   g )0.00490.00510.0035
Slight damage ( 0.002 θ < 0.005 , 0.4   g Z < 0.6   g )0.03570.03670.0277
Medium damage ( 0.005 θ < 0.015 , 0.6   g Z < 0.8   g )0.20520.20660.1692
Serious damage ( 0.015 θ < 0.025 , 0.8   g Z < 1.1   g )0.41720.41760.3521
Collapse ( θ 0.025 , Z 1.1   g )111
Disclaimer/Publisher’s Note: The statements, opinions and data contained in all publications are solely those of the individual author(s) and contributor(s) and not of MDPI and/or the editor(s). MDPI and/or the editor(s) disclaim responsibility for any injury to people or property resulting from any ideas, methods, instructions or products referred to in the content.